
PROCTER & GAMBLE Co 8-K, filed Oct 18, 2024
PROCTER & GAMBLE Co (PG)
8-K
2024-10-18
For: 2024-10-18
View Original
Added on
April 02, 2026
About this 8-K
PROCTER & GAMBLE Co filed this 8-K on October 18, 2024.
Items reported
- Item 7.01: Regulation FD disclosure
- Item 9.01: Financial statements and exhibits
UNITED STATES
SECURITIES AND EXCHANGE COMMISSION
Washington, D.C. 20549
FORM 8-K
CURRENT REPORT
Pursuant to Section 13 or 15(d) of the
Securities Exchange Act of 1934
Date of Report (Date of Earliest Event Reported): October 18, 2024

(Exact Name of Registrant as Specified in Its Charter)
|
|
|
|||
|
(State or Other Jurisdiction of Incorporation)
|
(Commission File Number) |
(I.R.S. Employer Identification No.)
|
(Address of principal executive offices, including zip code)
(Registrant’s telephone number, including area code)
(Former name or former address, if changed since last
report)
Check the appropriate box below if the Form 8-K filing is intended to simultaneously satisfy the filing obligation of the registrant under any of the following provisions:
|
|
Written communications pursuant to Rule 425 under the Securities Act (17 CFR 230.425)
|
|
|
Soliciting material pursuant to Rule 14a-12 under the Exchange Act (17 CFR 240.14a-12)
|
|
|
Pre-commencement communications pursuant to Rule 14d-2(b) under the Exchange Act (17 CFR 240.14d-2(b))
|
|
|
Pre-commencement communications pursuant to Rule 13e-4(c) under the Exchange Act (17 CFR 240.13e-4(c))
|
Securities registered pursuant to Section 12(b) of the Act:
|
Title of each class
|
Trading
Symbol(s)
|
Name of each exchange on which registered
|
||
|
|
Indicate by check mark whether the registrant is an emerging growth company as defined in Rule 405 of the Securities Act of 1933 (§230.405 of this chapter) or Rule 12b-2 of the Securities Exchange Act of 1934
(§240.12b-2 of this chapter).
|
||
|
|
|
Emerging growth company
|
|
| If an emerging growth company, indicate by check mark if the registrant has elected not to use the extended tramsition period for complying with any new or revised financial accounting standards provided pursuant to Section 13(a) of the Exchange Act. | ☐ |
||
ITEM 7.01 REGULATION FD DISCLOSURE
On October 18, 2024, The Procter & Gamble Company (the "Company") issued a
press release announcing its first quarter results and hosted a conference call related to those results. The Company is furnishing on Form 8-K a series of slides referenced in the conference call, which are also posted on the Company's
website.
This 8-K is being furnished pursuant to Item 7.01, "Regulation FD Disclosure."
|
ITEM 9.01 FINANCIAL STATEMENTS AND EXHIBITS
|
(d) Exhibits
|
Exhibit Number
|
|
Description
|
|
99.1
|
|
Informational Slides Provided by The Procter & Gamble Company dated October 18, 2024.
|
| 104 | Cover Page Interactive Data File (embedded within the Inline XBRL document) |
|
SIGNATURE
Pursuant to the requirements of the Securities
Exchange Act of 1934, the Registrant has duly caused this Report to be signed on its behalf by the undersigned hereunto duly authorized.
|
THE PROCTER & GAMBLE COMPANY
BY: /s/ Sandra T. Lane
Sandra T. Lane
Assistant Secretary
October 18, 2024
INDEX TO EXHIBIT(S)
|
Exhibit Number
|
|
Description
|
|


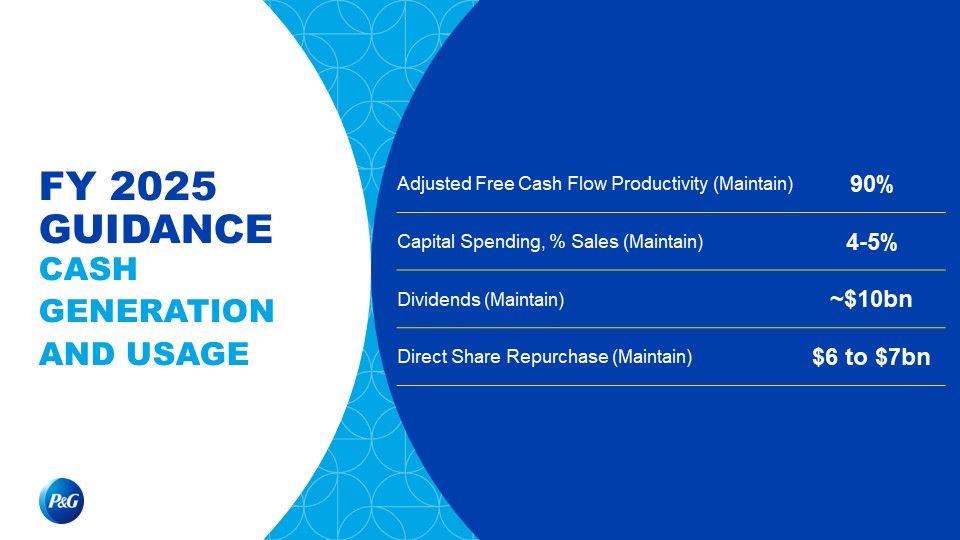
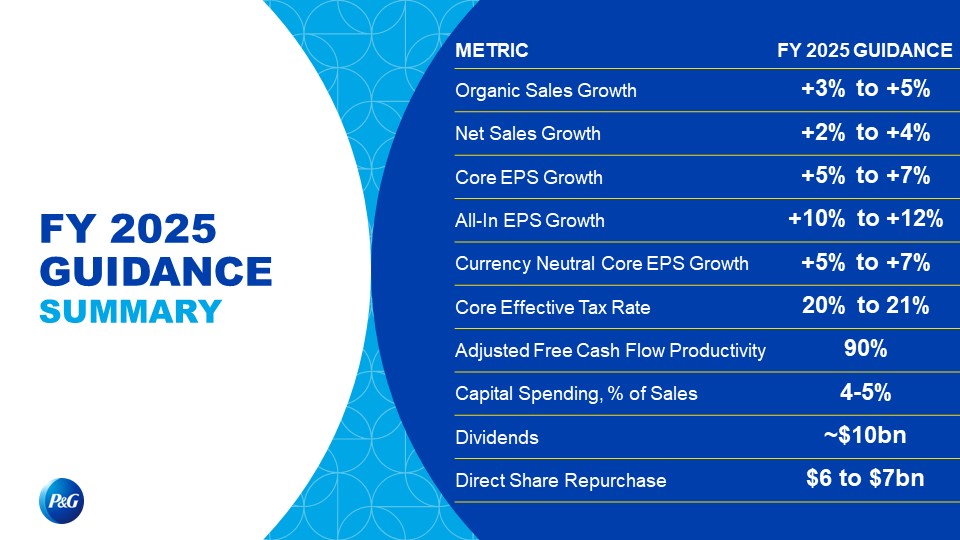
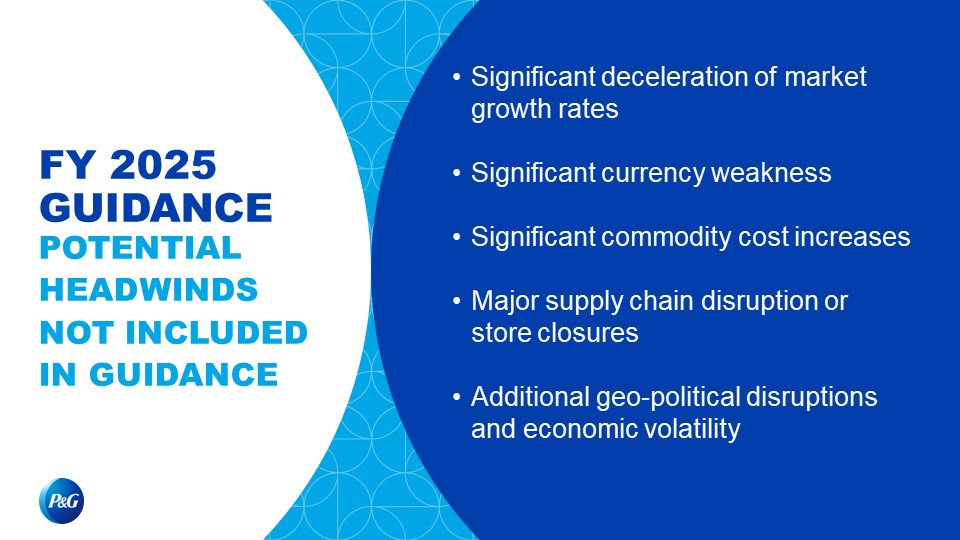
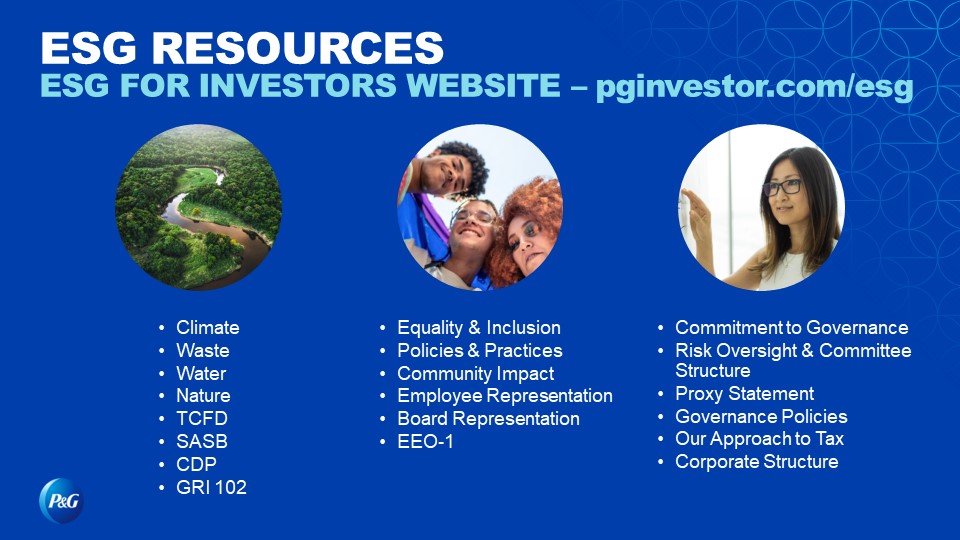

The Procter & Gamble Company Regulation G Reconciliation of Non-GAAP Measures
The following provides definitions of the non-GAAP measures used in Procter & Gamble's October 18, 2024 earnings call, associated
slides and other materials and the reconciliation to the most closely related GAAP measure. We believe that these non-GAAP measures provide useful perspective on underlying business trends (i.e., trends excluding non-recurring or unusual items) and
results and provide a supplemental measure of year-on-year results.
The non-GAAP measures described below are used by Management in making operating decisions, allocating financial resources and for business
strategy purposes. These measures may be useful to investors, as they provide supplemental information about business performance and provide investors a view of our business results through the eyes of Management. Certain of these measures are also
used to evaluate senior management and are a factor in determining their at-risk compensation.
These non-GAAP measures are not intended to be considered by the user in place of the related GAAP measure, but rather as supplemental
information to our business results. These non-GAAP measures may not be the same as similar measures used by other companies due to possible differences in method and in the items or events being adjusted.
The Company is not able to reconcile its forward-looking non-GAAP cash flow and effective tax rate measures because the Company cannot
predict the timing and amounts of discrete items such as acquisition and divestitures, which could significantly impact GAAP results. Note that certain columns and rows may not add due to rounding.
The following measures are provided:
|
1.
|
Organic sales growth — page 2
|
|
2.
|
Core EPS and Currency-neutral Core EPS — page 3
|
|
3.
|
Core gross margin and Currency-neutral Core gross margin — page 3
|
|
4.
|
Core operating margin and Currency-neutral Core operating margin — page 4
|
|
5.
|
Adjusted free cash flow and Adjusted free cash flow productivity — page 4
|
The Core earnings measures included in the following reconciliation tables refer to the equivalent GAAP measures adjusted as applicable for
the following items:
|
•
|
Incremental restructuring: The Company has historically had an ongoing level of restructuring activities of approximately $250 - $500 million before tax. In the fiscal year ended June 30, 2024, the Company started a limited market portfolio
restructuring of its business operations, primarily in certain Enterprise Markets, including Argentina and Nigeria, to address challenging macroeconomic and fiscal conditions. During the period ended September 30, 2024, the Company
completed this limited market portfolio restructuring with the substantial liquidation of its operations in Argentina. The adjustment to Core earnings includes the restructuring charges that exceed the normal, recurring level of
restructuring charges.
|
|
•
|
Intangible asset impairment: In the fiscal year ended June 30, 2024, the Company recognized a non-cash, after-tax impairment charge of $1.0 billion ($1.3 billion before tax) to adjust the carrying value of the Gillette intangible asset
acquired as part of the Company's 2005 acquisition of The Gillette Company.
|
We do not view the above items to be part of our sustainable results, and their exclusion from core earnings measures provides a more
comparable measure of year-on-year results. These items are also excluded when evaluating senior management in determining their at-risk compensation.
Organic sales growth: Organic sales growth is a non-GAAP measure of sales growth excluding the impacts of acquisitions and divestitures and foreign exchange from year-over-year comparisons. We believe this measure provides investors with a supplemental
understanding of underlying sales trends by providing sales growth on a consistent basis. This measure is also used in assessing the achievement of management goals for at-risk compensation.
Core EPS and currency-neutral Core EPS: Core net earnings per share, or Core EPS, is a measure of diluted net earnings per common share (diluted EPS) adjusted for items as indicated. Currency-neutral EPS is a measure of the Company's Core EPS excluding the
incremental current year impact of foreign exchange. We view these non-GAAP measures as useful supplemental measures of Company performance over time.
Core gross margin and currency-neutral Core gross margin: Core gross margin is a measure of the Company's gross margin adjusted for items as indicated. Currency-neutral Core gross margin is a measure of the Company's Core gross margin excluding the incremental current year impact
of foreign exchange. We believe these non-GAAP measures provide a supplemental perspective to the Company’s operating efficiency over time.
Core operating margin and currency-neutral Core operating
margin: Core operating margin is a measure of the Company's operating margin adjusted for items as indicated. Currency-neutral Core operating margin is a measure of the Company’s Core operating margin
excluding the incremental current year impact of foreign exchange. We believe these non-GAAP measures provide a supplemental perspective to the Company’s operating efficiency over time.
Adjusted free cash flow: Adjusted free cash flow is defined as operating cash flow less capital spending and excluding payments for the transitional tax resulting from the U.S. Tax Act. Adjusted free cash flow represents the cash that the Company is able to generate
after taking into account planned maintenance and asset expansion. We view adjusted free cash flow as an important measure because it is one factor used in determining the amount of cash available for dividends, share repurchases, acquisitions and
other discretionary investments.
Adjusted free cash flow productivity:
Adjusted free cash flow productivity is defined as the ratio of adjusted free cash flow to net earnings excluding a non-cash charge for accumulated foreign currency translation losses related to the substantial liquidation of operations in Argentina.
We view adjusted free cash flow productivity as a useful measure to help investors understand P&G’s ability to generate cash. This measure is used by management in making operating decisions, allocating financial resources and for budget planning
purposes. This measure is also used in assessing the achievement of management goals for at-risk compensation.
1. Organic sales growth:
|
Three Months Ended
September 30, 2024 |
Net Sales Growth
|
Foreign Exchange Impact
|
Acquisition &
Divestiture Impact/Other* |
Organic Sales Growth
|
|||
|
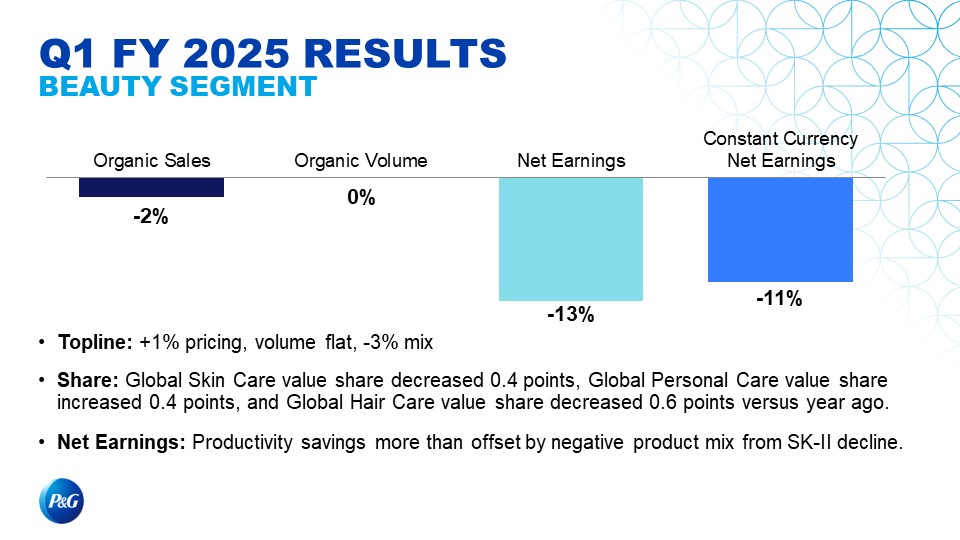
Beauty
|
(5)%
|
1%
|
2%
|
(2)%
|
|||
|
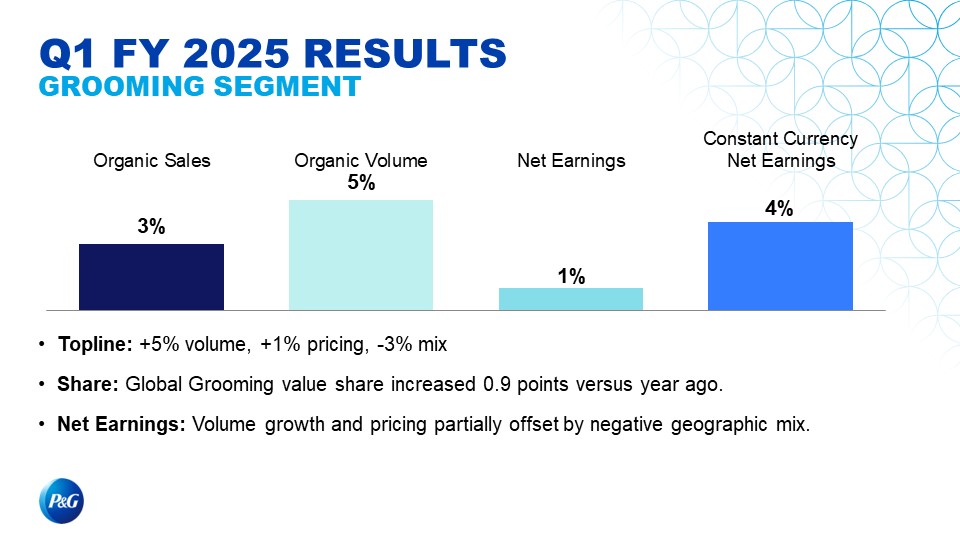
Grooming
|
—%
|
2%
|
1%
|
3%
|
|||
|
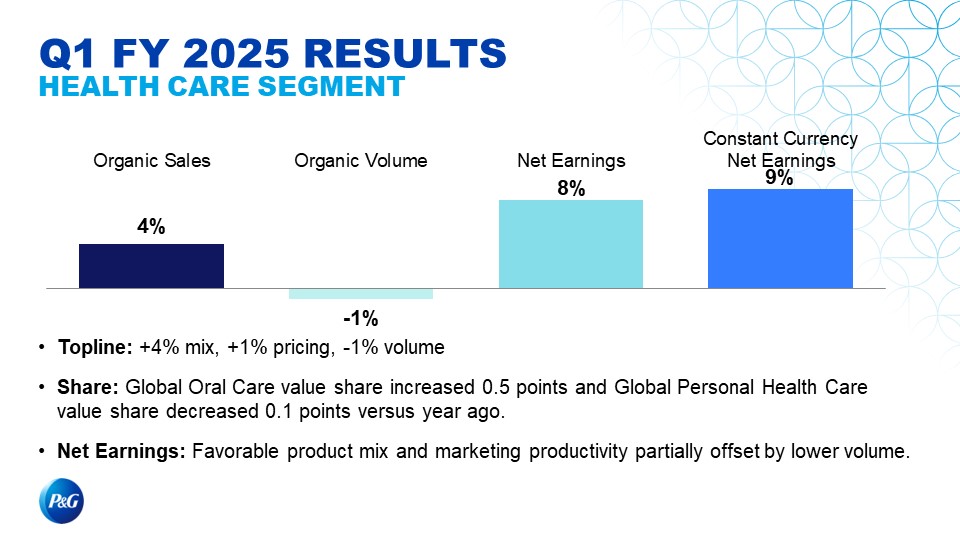
Health Care
|
2%
|
1%
|
1%
|
4%
|
|||
|
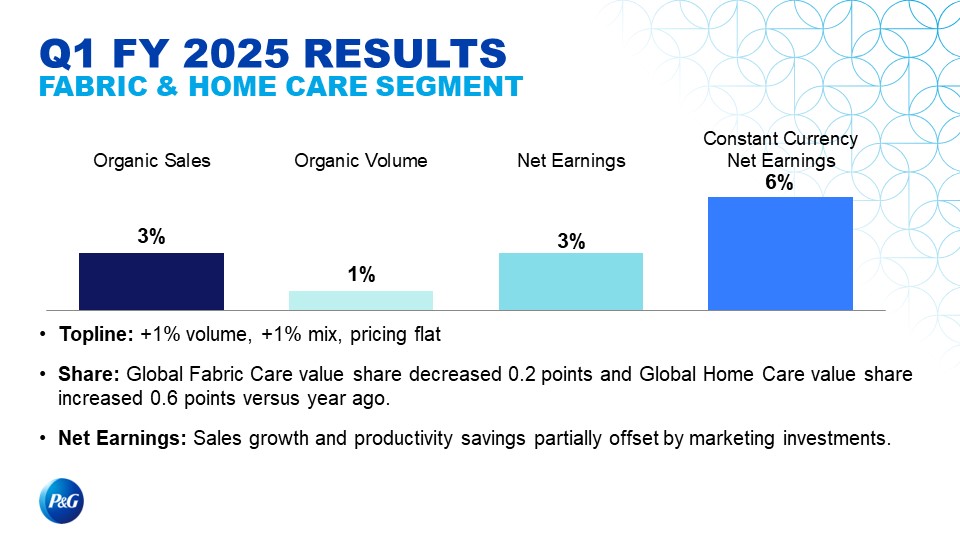
Fabric Care & Home Care
|
1%
|
1%
|
1%
|
3%
|
|||
|
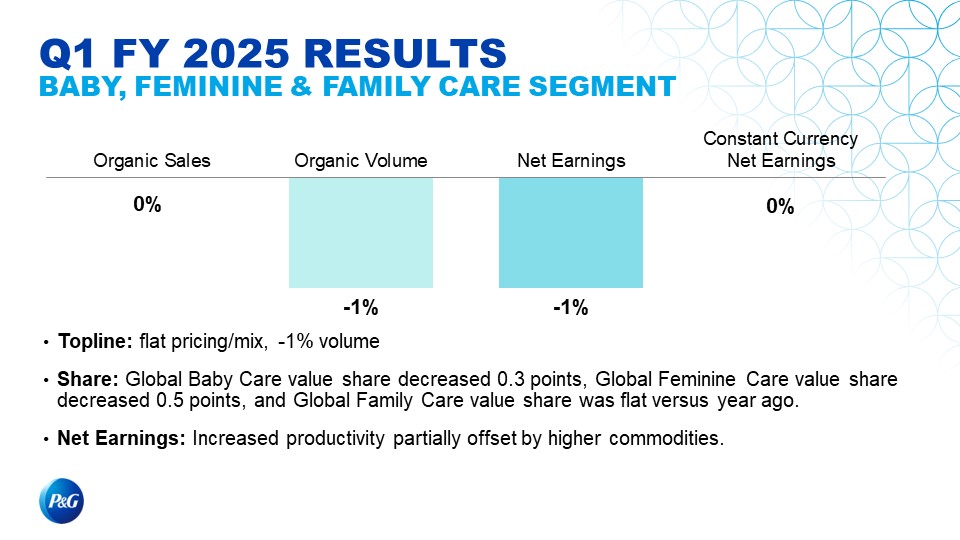
Baby, Feminine & Family Care
|
(2)%
|
1%
|
1%
|
—%
|
|||
|
Total Company
|
(1)%
|
1%
|
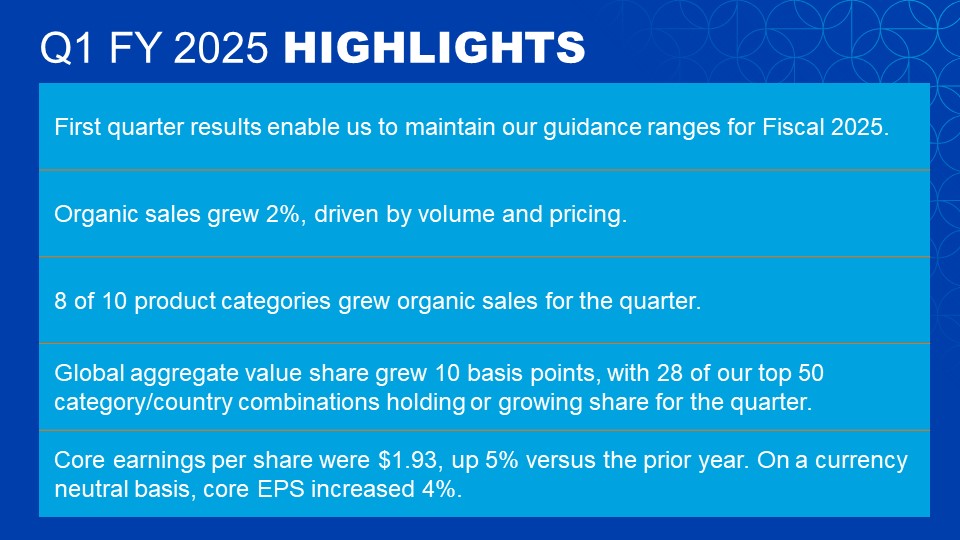
2%
|
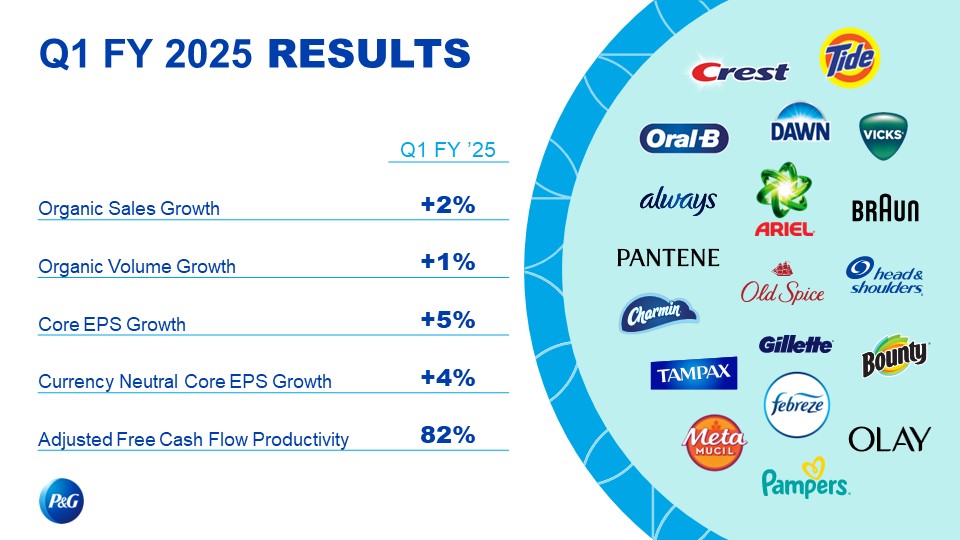
2%
|
* Acquisition & Divestiture Impact/Other includes the volume and mix impact of acquisitions and divestitures and rounding impacts necessary to reconcile net
sales to organic sales.
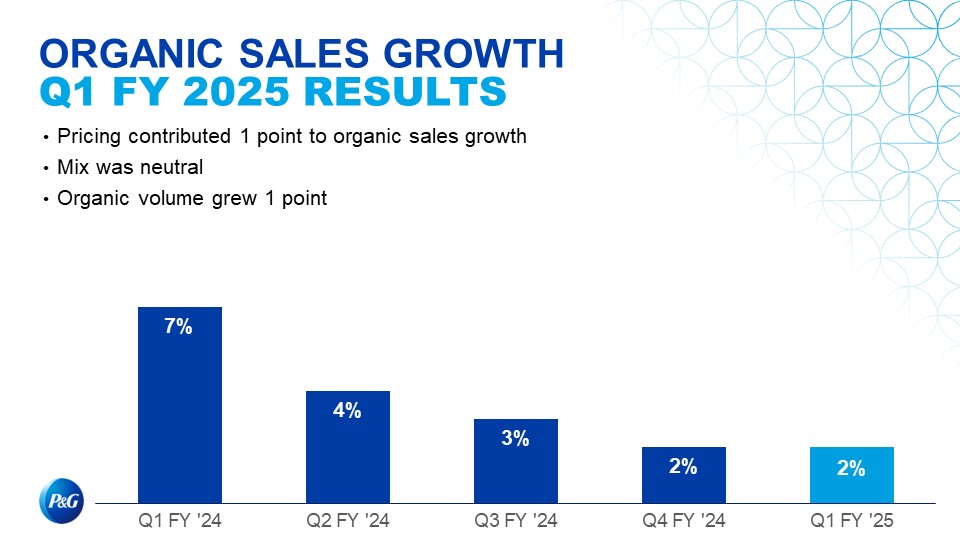
Organic Sales Growth
Prior Quarters
|
Total Company
|
Net Sales Growth
|
Foreign Exchange Impact
|
Acquisition/ Divestiture
Impact/Other*
|
Organic Sales Growth
|
|||
|
Q1 FY 2024
|
6%
|
1%
|
—%
|
7%
|
|||
|
Q2 FY 2024
|
3%
|
1%
|
—%
|
4%
|
|||
|
Q3 FY 2024
|
1%
|
2%
|
—%
|
3%
|
|||
|
Q4 FY 2024
|
—%
|
2%
|
—%
|
2%
|
* Acquisition & Divestiture Impact/Other includes the volume and mix impact of acquisitions and divestitures and rounding impacts necessary to reconcile net
sales to organic sales.
Organic Sales Growth
Guidance
|
Total Company
|
Net Sales Growth
|
Combined Foreign Exchange &
Acquisition/Divestiture Impact/Other*
|
Organic Sales Growth
|
|||
|
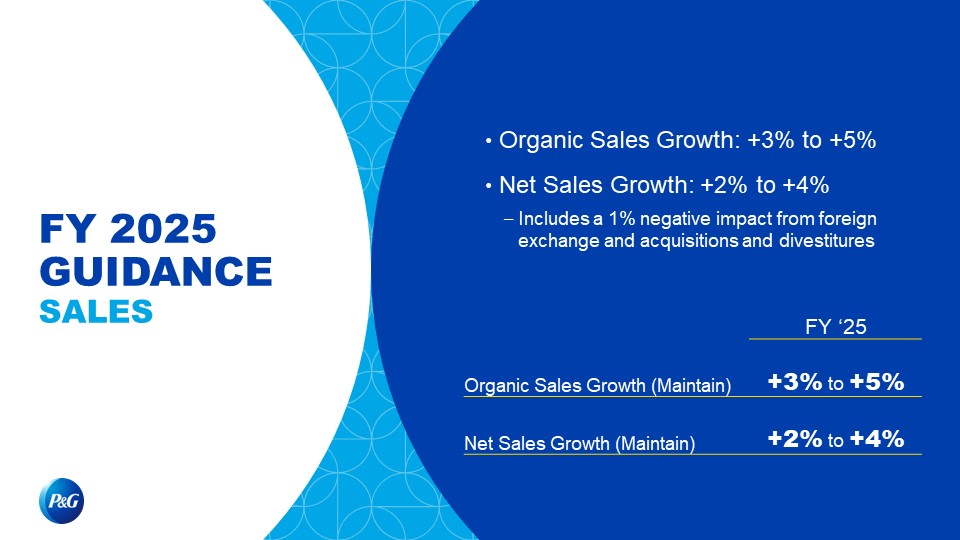
FY 2025 (Estimate)
|
+2% to +4%
|
+1%
|
+3% to +5%
|
* Combined Foreign Exchange & Acquisition/Divestiture Impact/Other includes foreign exchange impacts, the volume and mix impact of acquisitions and
divestitures and rounding impacts necessary to reconcile net sales to organic sales.
2. Core EPS and Currency-neutral Core EPS:
|
Three Months Ended September 30
|
||
|
2024
|
2023
|
|
|
Diluted EPS
|
$1.61
|
$1.83
|
|
Incremental restructuring
|
0.32
|
—
|
|
Core EPS
|
$1.93
|
$1.83
|
|
Percentage change vs. prior period Core EPS
|
5%
|
|
|
Currency impact to earnings
|
(0.02)
|
|
|
Currency-Neutral Core EPS
|
$1.91
|
|
|
Percentage change vs. prior period Core EPS
|
4%
|
|
Prior Quarters
|
Q1
FY24
|
Q1
FY23
|
Q2
FY24
|
Q2
FY23
|
Q3
FY24
|
Q3
FY23
|
Q4
FY24
|
Q4
FY23
|
|
|
Diluted EPS
|
$1.83
|
$1.57
|
$1.40
|
$1.59
|
$1.52
|
$1.37
|
$1.27
|
$1.37
|
|
Incremental restructuring
|
—
|
—
|
0.02
|
—
|
—
|
—
|
0.13
|
—
|
|
Intangible asset impairment
|
—
|
—
|
0.42
|
—
|
—
|
—
|
—
|
—
|
|
Core EPS
|
$1.83
|
$1.57
|
$1.84
|
$1.59
|
$1.52
|
$1.37
|
$1.40
|
$1.37
|
|
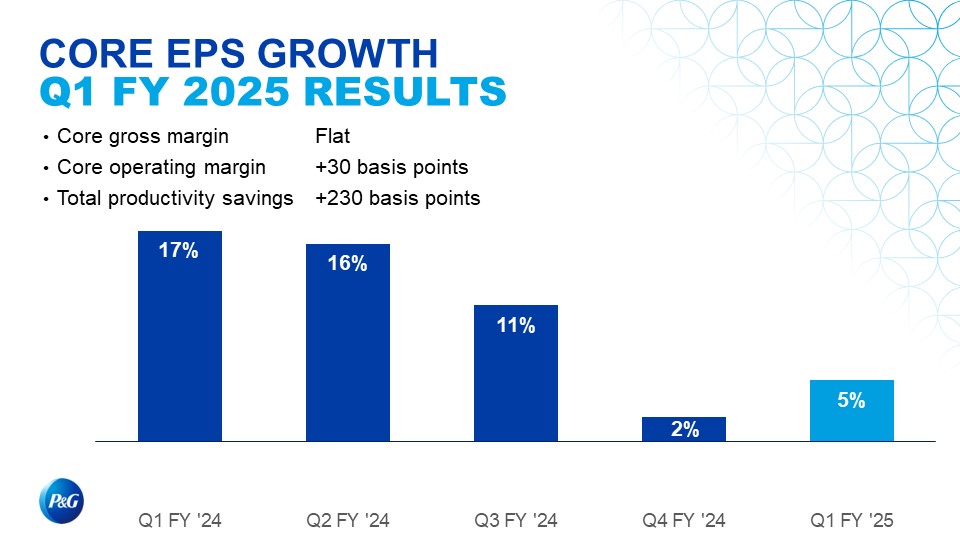
Percentage change vs. prior period Core EPS
|
17%
|
16%
|
11%
|
2%
|
||||
|
Currency Impact to Earnings
|
0.07
|
0.03
|
0.09
|
0.05
|
||||
|
Currency-Neutral Core EPS
|
$1.90
|
$1.87
|
$1.61
|
$1.45
|
||||
|
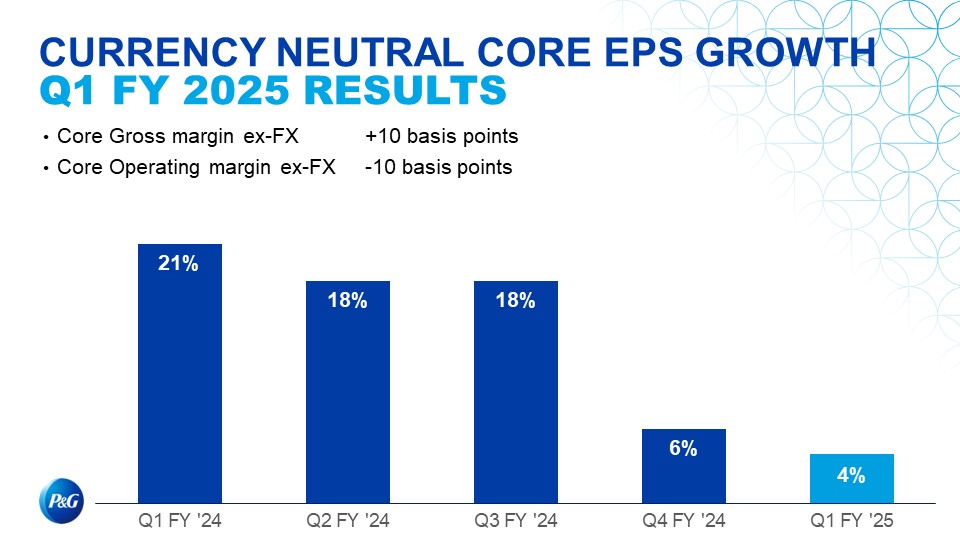
Percentage change vs. prior period Core EPS
|
21%
|
18%
|
18%
|
6%
|
Note – All reconciling items are presented net of tax. Tax effects are calculated consistent with the nature of the underlying transaction.
Core EPS Growth and Currency-neutral EPS
Guidance
|
Total Company
|
Diluted EPS Growth
|
Impact of Incremental Non-Core Items
|
Core EPS Growth
|
Impact of FX
|
Currency-neutral EPS Growth
|
|
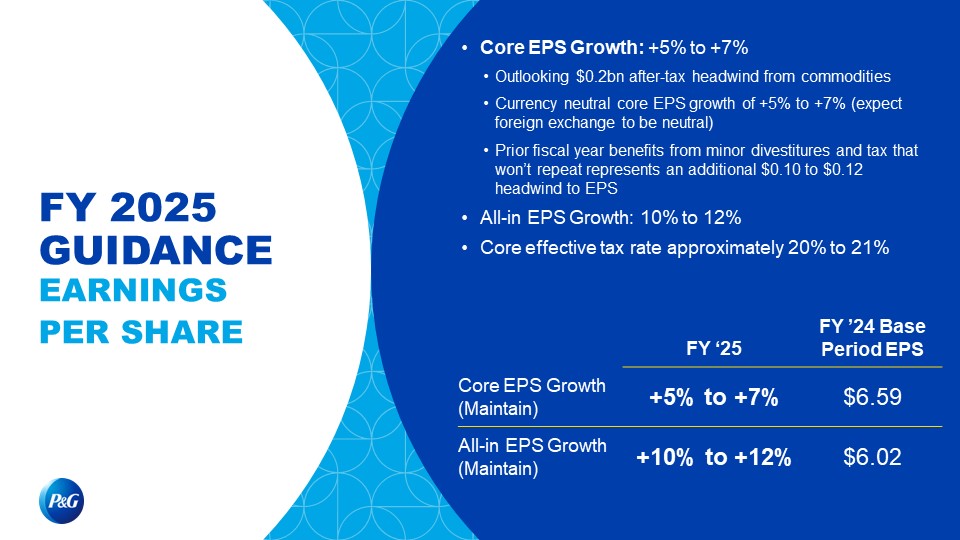
FY 2025
(Estimate)
|
+10% to +12%
|
(5)%
|
+5% to +7%
|
(1)%
|
+4% to +6%
|
3. Core gross margin and Currency-neutral Core gross margin:
|
Three Months Ended September 30
|
||
|
2024
|
2023
|
|
|
Gross Margin
|
52.1%
|
52.0%
|
|
Incremental restructuring
|
(0.1)%
|
—
|
|
Core Gross Margin
|
52.0%
|
52.0%
|
|
Basis point change vs. prior year Core gross margin
|
—
|
|
|
Currency Impact to Margin
|
0.2%
|
|
|
Currency-Neutral Core Gross Margin
|
52.1%
|
|
|
Basis point change vs prior year Core gross margin
|
10
|
|
4. Core operating margin and Currency-neutral Core operating margin:
|
Three Months Ended September 30
|
||
|
2024
|
2023
|
|
|
Operating Margin
|
26.7%
|
26.4%
|
|
Incremental restructuring
|
—
|
—
|
|
Core Operating Margin
|
26.7%
|
26.4%
|
|
Basis point change vs. prior year Core operating margin
|
30
|
|
|
Currency Impact to Margin
|
(0.4)%
|
|
|
Currency-Neutral Core Operating Margin
|
26.3%
|
|
|
Basis point change vs. prior year Core operating margin
|
(10)
|
|
5. Adjusted free cash flow and Adjusted free cash flow productivity (dollar amounts in millions):
|
Three Months Ended September 30, 2024
|
|||||||
|
Operating Cash Flow
|
Capital Spending
|
U.S. Tax Act Payments
|
Adjusted Free Cash Flow
|
Net Earnings
|
Adjustments to Net Earnings(1)
|
Net Earnings
as Adjusted
|
Adjusted Free Cash Flow Productivity
|
|
$4,302
|
$(993)
|
$562
|
$3,871
|
$3,987
|
$752
|
$4,739
|
82%
|
(1) Adjustments to Net earnings relate to a non-cash charge for accumulated foreign currency translation losses due to the substantial liquidation of
operations in Argentina.