CPI Card Group Inc 8-K, filed Nov 3, 2020
CPI Card Group Inc. (PMTS)
About this 8-K
CPI Card Group Inc filed this 8-K on November 3, 2020.
Items reported
- Item 2.02: Financial results
- Item 7.01: Regulation FD disclosure
- Item 9.01: Financial statements and exhibits
UNITED STATES
SECURITIES AND EXCHANGE COMMISSION
Washington, D.C. 20549
FORM 8-K
CURRENT REPORT
Pursuant to Section 13 or 15(d) of
the Securities Exchange Act of 1934
Date of Report (Date of earliest event reported): November 3, 2020
CPI CARD GROUP INC.
(Exact name of registrant as specified in its charter)
Delaware (State or other jurisdiction | 001-37584 (Commission | 26-0344657 (I.R.S. Employer |
| | |
| CPI Card Group Inc. (Address of principal executive offices) | 80127 (Zip Code) |
(720) 681-6304
(Registrant’s telephone number, including area code)
N/A
(Former name or former address, if changed since last report)
Check the appropriate box below if the Form 8-K filing is intended to simultaneously satisfy the filing obligation of the registrant under any of the following provisions:
◻ Written communications pursuant to Rule 425 under the Securities Act (17 CFR 230.425)
◻ Soliciting material pursuant to Rule 14a-12 under the Exchange Act (17 CFR 240.14a-12)
◻ Pre-commencement communications pursuant to Rule 14d-2(b) under the Exchange Act (17 CFR 240.14d-2(b))
◻ Pre-commencement communications pursuant to Rule 13e-4(c) under the Exchange Act (17 CFR 240.13e-4(c))
Securities registered pursuant to Section 12(b) of the Securities Exchange Act of 1934:
Title of each class | Trading Symbol(s) | Name of each exchange on which registered |
Common Stock, $0.001 par value | PMTS | OTC Markets Group Inc. |
Indicate by check mark whether the registrant is an emerging growth company as defined in Rule 405 of the Securities Act of 1933 (§230.405 of this chapter) or Rule 12b-2 of the Securities Exchange Act of 1934 (§240.12b-2 of this chapter).
Emerging growth company ⌧
If an emerging growth company, indicate by check mark if the registrant has elected not to use the extended transition period for complying with any new or revised financial accounting standards provided pursuant to Section 13(a) of the Exchange Act. ⌧
Item 2.02 Results of Operations and Financial Condition.*
On November 3, 2020, CPI Card Group Inc. (the “Company”) issued a press release announcing financial results for its fiscal quarter ended September 30, 2020 (the “Earnings Release”). A copy of the Earnings Release is attached hereto as Exhibit 99.1.
Item 7.01 Regulation FD Disclosure.* |
In connection with the issuance of the Earnings Release, the Company is providing the supplemental investor commentary attached hereto as Exhibit 99.2, which will be included on the investor relations portion of the Company’s website, www.cpicardgroup.com.
Item 9.01 Financial Statements and Exhibits.
(d) Exhibits:
Exhibit Number | Exhibit Description |
99.1* | Press release issued November 3, 2020 announcing the third quarter results |
99.2* | Supplemental Investor Commentary of the Company dated November 3, 2020 |
*The information furnished under Item 2.02 and Item 7.01 of this Current Report on Form 8-K, including Exhibits 99.1 and 99.2, is being furnished and shall not be deemed to be “filed” for the purposes of Section 18 of the Securities Exchange Act of 1934, as amended (the “Exchange Act”), or incorporated by reference in any filing under the Securities Act of 1933, as amended, or the Exchange Act, except as shall be expressly set forth by specific reference in such a filing.
SIGNATURES
Pursuant to the requirements of the Securities Exchange Act of 1934, the registrant has duly caused this report to be signed on its behalf by the undersigned hereunto duly authorized.
| CPI CARD GROUP INC. | |
|
|
|
|
|
|
Dated: November 3, 2020 | By: | /s/ Sarah J. Kilgore |
| Name: | Sarah J. Kilgore |
| Title: | Chief Legal and Compliance Officer |
CPI Card Group Inc. Reports Third Quarter and Year-to-Date 2020 Results
Date: November 3, 2020
Net Sales of $82.7 Million, Up 15% and 11% Year-over-Year in the Third Quarter and First Nine Months
Net Income of $5.8 Million, Up 984% and 425% Year-over-Year in the Third Quarter and First Nine Months
Adjusted EBITDA of $17.5 Million, Up 43% and 39% Year-over-Year in the Third Quarter and First Nine Months
Cash of $50 Million at Quarter End
Littleton, CO. November 3, 2020 -- CPI Card Group Inc. (OTCQX: PMTS; TSX: PMTS) (“CPI” or the “Company”) today reported financial results for the third quarter and nine months ended September 30, 2020.
“As we continue to navigate these unprecedented times, we are pleased with our strong third quarter performance,” said Scott Scheirman, President and Chief Executive Officer of CPI. “Our 15% top-line growth underscores the resilience of the business, our ability to capitalize on the dual interface card demand in the U.S. and the strong market for our innovative and differentiated products, including our eco-focused solutions. Operating margins also expanded significantly in the quarter, driven by operating leverage and ongoing efficiency initiatives. We continue to win new business with our existing customers, add new customers and pursue opportunities.”
Scheirman continued, “We remain steadfast and intensely focused on our strategies of deep customer focus, providing market-leading quality products and customer service, delivering innovative solutions and a market-competitive business model.”
Third Quarter and First Nine Months 2020 Financial Highlights
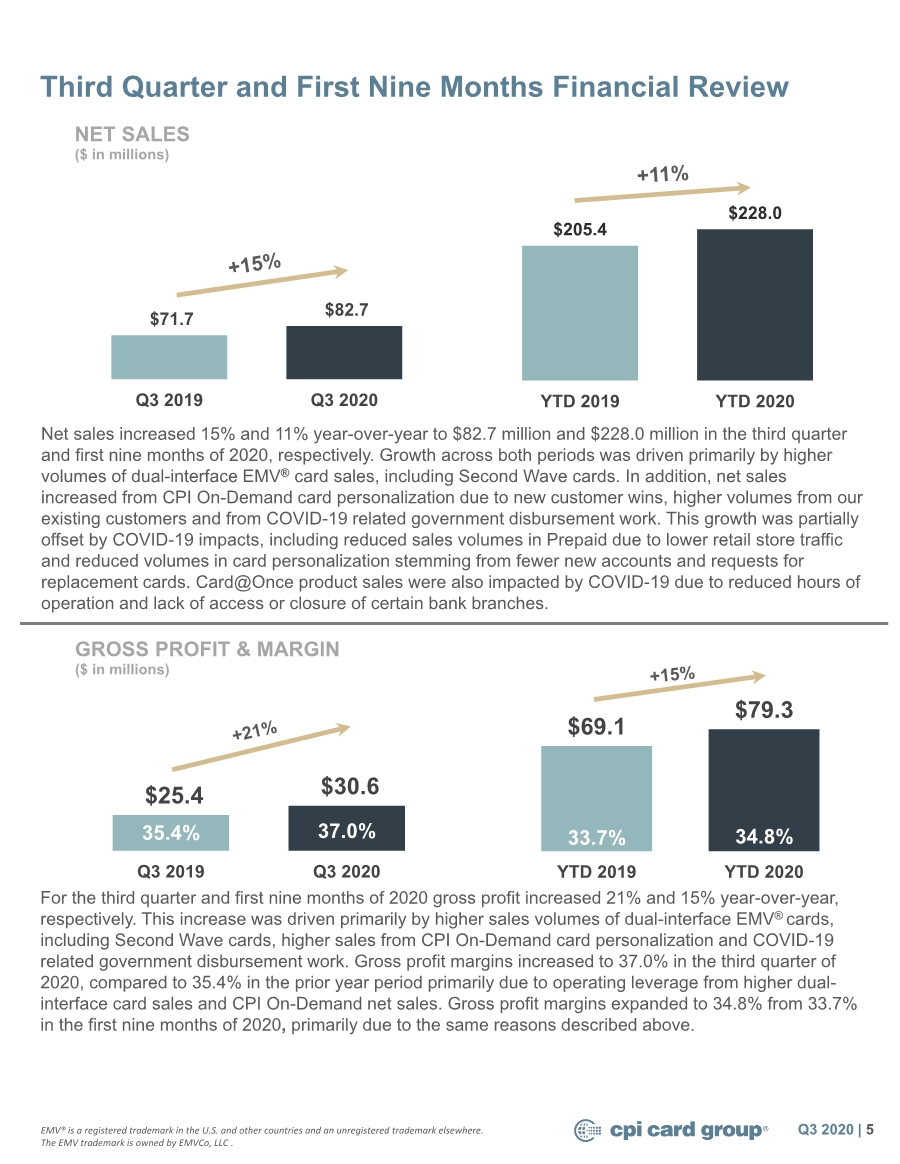
Net sales increased 15% and 11% year-over-year to $82.7 million and $228.0 million in the third quarter and first nine months of 2020, respectively. Gross profit increased 21% and 15% year-over-year in the third quarter and first nine months of 2020, respectively. Gross profit margins increased to 37.0% in the third quarter of 2020, compared to 35.4% in the prior year period, primarily due to higher net sales and operating leverage in the Debit and Credit segment. Gross profit margins increased to 34.8% from 33.7% in the first nine months of 2020 compared to the prior year.
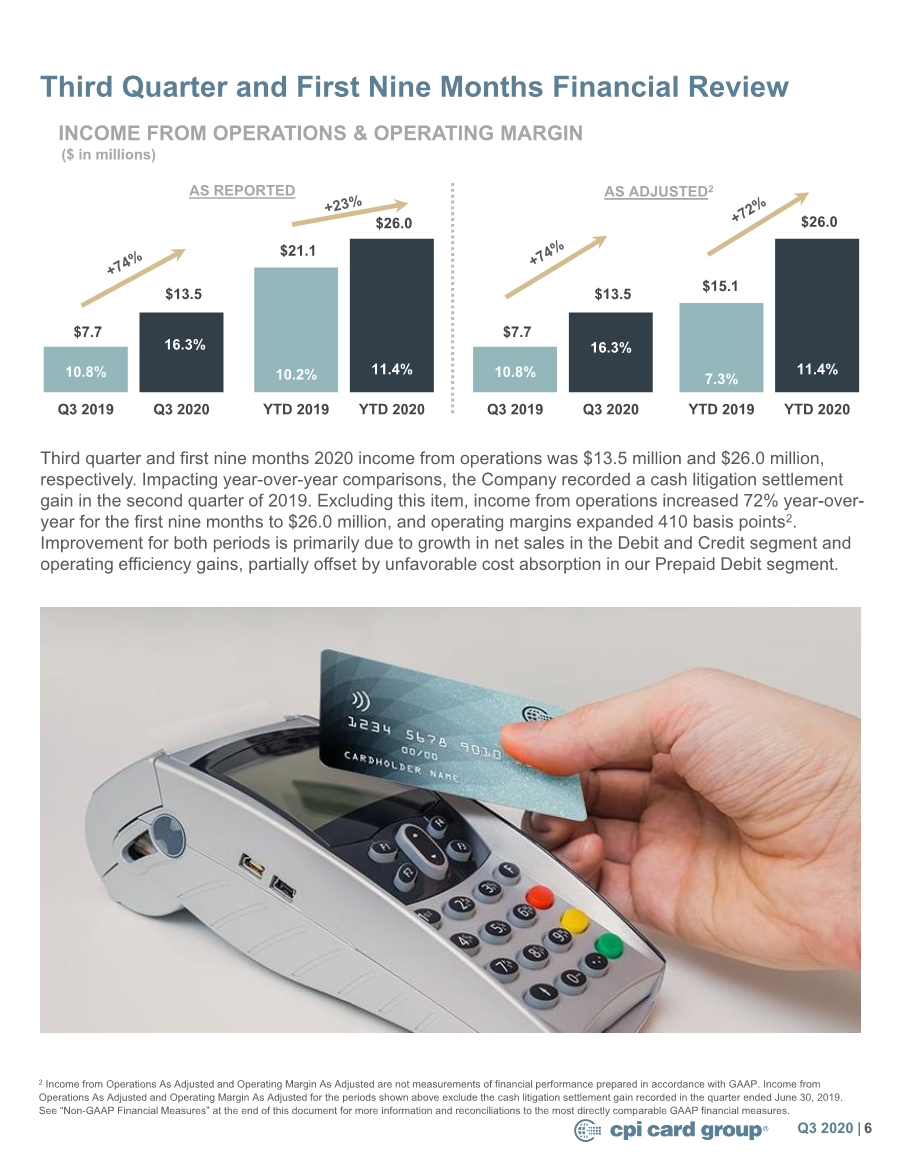
Income from operations was $13.5 million and $26.0 million in the third quarter and first nine months of 2020, respectively, compared with $7.7 million and $21.1 million in the third quarter and first nine months of 2019, respectively. In the first nine months of 2019, the Company recognized a $6.0 million gain related to the cash settlement of litigation, which was included in income from operations.
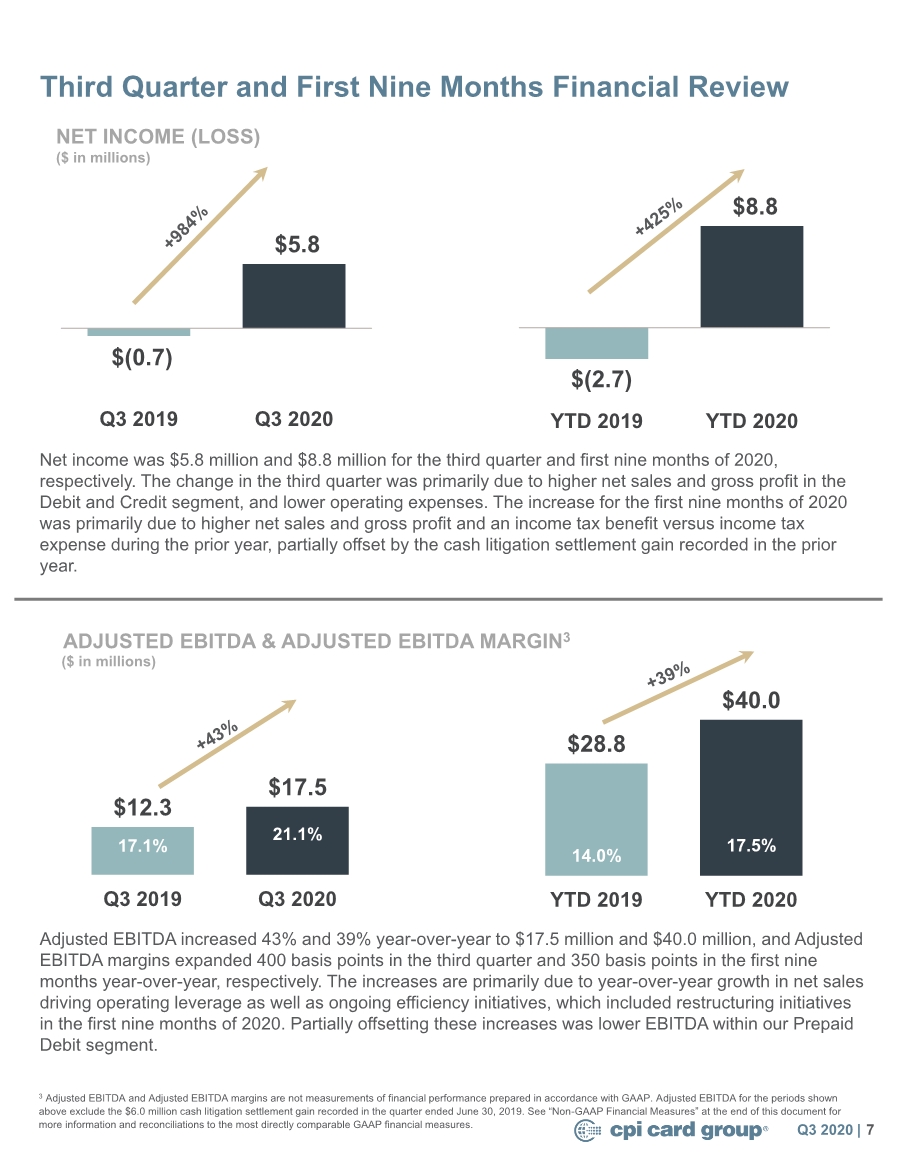
Third quarter 2020 net income was $5.8 million, or $0.52 per diluted share, compared to a net loss of $0.7 million, or a $0.06 loss per diluted share, in the third quarter of 2019. For the first nine
months, net income was $8.8 million, or $0.79 per diluted share, in 2020 compared to a net loss of $2.7 million, or a $0.24 loss per diluted share, in 2019.
Adjusted EBITDA increased 43% and 39% year-over-year to $17.5 million and $40.0 million in the third quarter and first nine months of 2020, respectively.
Third Quarter and First Nine Months 2020 Segment Information
Debit and Credit:
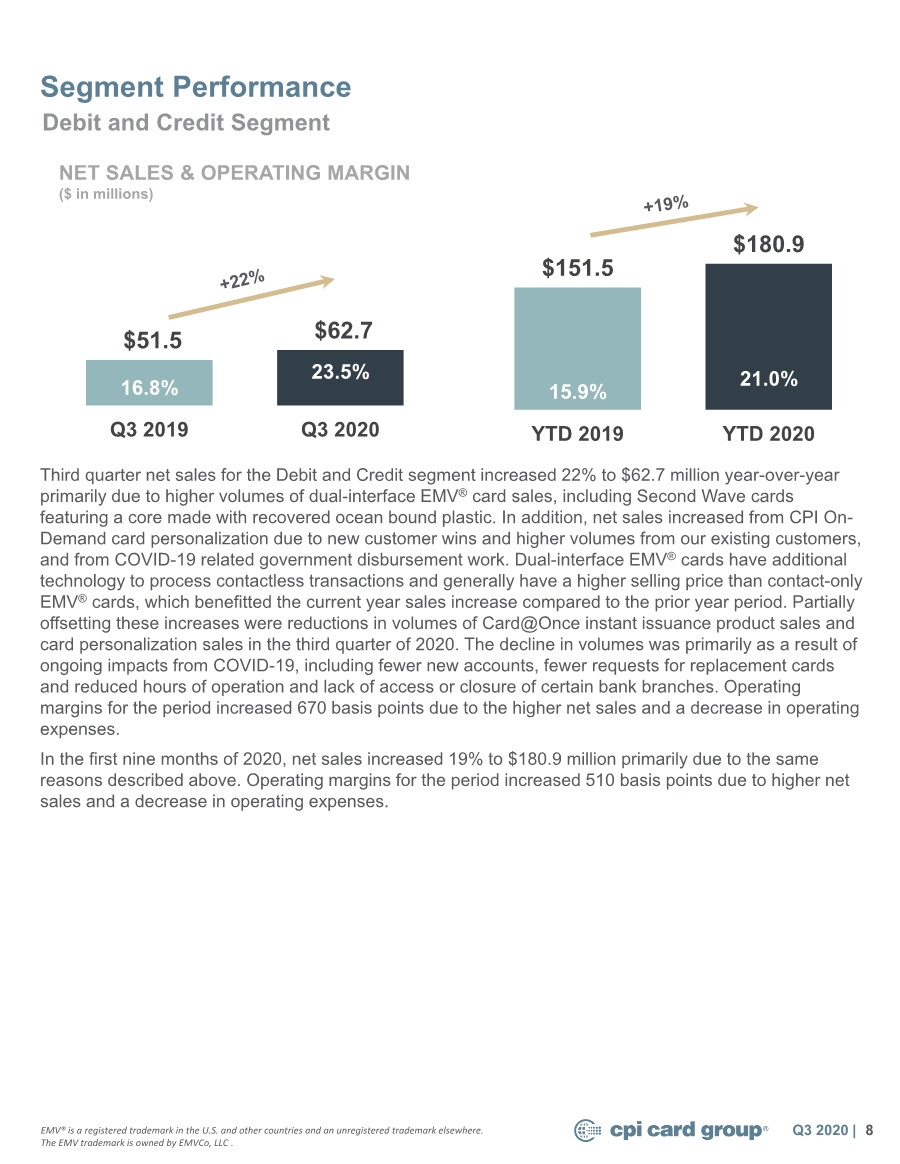
Net sales increased 22% and 19% year-over-year to $62.7 million and $180.9 million in the third quarter and first nine months of 2020, respectively. Growth for the third quarter and first nine months of 2020 was driven primarily by higher volumes of dual-interface EMV® card sales, including Second WaveTM cards featuring a core made with recovered ocean bound plastic. In addition, net sales increased from CPI On-Demand card personalization due to new customer wins and higher volumes from our existing customers, and from COVID-19 related government disbursement work. This growth was partially offset by COVID-19 impacts, including reduced volumes in card personalization stemming from fewer new accounts and requests for replacement cards. Card@Once® product sales were also impacted by COVID-19 due to reduced hours of operation, lack of access or closure of certain bank branches.
Prepaid Debit:
Net sales were up 1% and down 8% year-over-year to $20.6 million and $48.7 million for the third quarter and first nine months of 2020, respectively. Growth for the third quarter was primarily due to timing of certain customer sales, partially offset by reduced sales volumes primarily associated with COVID-19 impacts, including lower retail store traffic, which also impacted the decline in net sales for the first nine months of 2020.
Balance Sheet, Liquidity, and Cash Flow
As of September 30, 2020, cash and cash equivalents was $50.3 million. Cash used in operating activities was $1.8 million and capital expenditures were $1.7 million in the third quarter of 2020, yielding Adjusted Free Cash Flow use of $3.5 million. For the first nine months of 2020, cash provided by operating activities was $10.2 million and capital expenditures were $3.3 million, yielding Adjusted Free Cash Flow of $6.9 million. This compares with the first nine months of 2019 when cash used in operating activities was $3.0 million, or a $9.0 million cash usage when excluding the $6.0 million cash received from a litigation settlement, and capital expenditures were $3.3 million, resulting in Adjusted Free Cash Flow use of $12.3 million. For the first nine months of 2020, cash provided by operating activities and Adjusted Free Cash Flow increased $13.2 million and $19.2 million year-over-year, respectively.
Total long-term debt principal outstanding, comprised of the Company’s $30 million Senior Credit Facility and its $312.5 million First Lien Term Loan, was $342.5 million at September 30, 2020. Net of debt issuance costs and discount, total long-term debt was $335.8 million as of September 30, 2020. The Company’s Senior Credit Facility matures in May 2022 and the First Lien Term Loan matures in August 2022.
John Lowe, Chief Financial Officer, stated, “Top-line net sales growth and our commitment to operating efficiently resulted in strong year-over-year growth in Net Sales, Net Income, and Adjusted EBITDA. We are sharply focused on continuing to execute on our strategy and capitalizing on market opportunities.”
Additional Investor Commentary
The Company has provided additional written commentary regarding its quarterly performance and other business matters. This earnings press release and additional written commentary are available at investor.cpicardgroup.com.
EMV® is a registered trademark in the U.S. and other countries and an unregistered trademark elsewhere. The EMV trademark is owned by EMVCo, LLC.
Non-GAAP Financial Measures
In addition to financial results reported in accordance with U.S. generally accepted accounting principles (“GAAP”), we have provided the following non-GAAP financial measures in this release, all reported on a continuing operations basis: EBITDA, Adjusted EBITDA, Adjusted EBITDA margin, and Adjusted Free Cash Flow. These non-GAAP financial measures are utilized by management in comparing our operating performance on a consistent basis between fiscal periods. We believe that these financial measures are appropriate to enhance an overall understanding of our underlying operating performance trends compared to historical and prospective periods and our peers. Management also believes that these measures are useful to investors in their analysis of our results of operations and provide improved comparability between fiscal periods. Non-GAAP financial measures should not be considered in isolation from, or as a substitute for, financial information calculated in accordance with GAAP. Our non-GAAP measures may be different from similarly titled measures of other companies. Investors are encouraged to review the reconciliation of these historical non-GAAP measures to their most directly comparable GAAP financial measures included in Exhibit E to this press release.
EBITDA
EBITDA represents earnings before interest, taxes, depreciation and amortization, all on a continuing operations basis. EBITDA is presented because it is an important supplemental measure of performance, and it is frequently used by analysts, investors and other interested parties in the evaluation of companies in our industry. EBITDA is also presented and compared by analysts and investors in evaluating our ability to meet debt service obligations. Other companies in our industry may calculate EBITDA differently. EBITDA is not a measurement of financial performance under GAAP and should not be considered as an alternative to cash flow from operating activities or as a measure of liquidity or an alternative to net (loss) income or net (loss) income from continuing operations as indicators of operating performance or any other measures of performance derived in accordance with GAAP. Because EBITDA is calculated before recurring cash charges, including interest expense and taxes, and is not adjusted for capital expenditures or other recurring cash requirements of the business, it should not be considered as a measure of discretionary cash available to invest in the growth of the business.
Adjusted EBITDA
Adjusted EBITDA is presented on a continuing operations basis and is defined as EBITDA adjusted for litigation and related charges incurred in connection with certain patent and shareholder litigation; stock-based compensation expense; estimated sales tax expense (benefit); restructuring and other charges; loss on Revolving Credit Facility termination; foreign currency gain or loss; litigation settlement gain; and other items that are unusual in nature, infrequently occurring or not considered part of our core operations, as set forth in the reconciliation on Exhibit E. Adjusted EBITDA is also a defined computation in our First Lien Term Loan and Senior Credit Facility agreements, which generally conforms to the definition above, and impacts certain credit measures
and covenants, including a covenant requiring the Company to have at least $25 million Adjusted EBITDA (as defined in our Senior Credit Facility) for the previous four consecutive fiscal quarters in total, at the end of each quarterly period ending on or after March 31, 2020. Adjusted EBITDA is intended to show our unleveraged, pre-tax operating results and therefore reflects our financial performance based on operational factors, excluding non-operational, unusual or non-recurring losses or gains. Adjusted EBITDA has important limitations as an analytical tool, and you should not consider it in isolation, or as a substitute for, analysis of our results as reported under GAAP. For example, Adjusted EBITDA does not reflect: (a) our capital expenditures, future requirements for capital expenditures or contractual commitments; (b) changes in, or cash requirements for, our working capital needs; (c) the significant interest expenses or the cash requirements necessary to service interest or principal payments on our debt; (d) tax payments that represent a reduction in cash available to us; (e) any cash requirements for the assets being depreciated and amortized that may have to be replaced in the future; (f) the impact of earnings or charges resulting from matters that we and the lenders under our credit agreement may not consider indicative of our ongoing operations; or (g) the impact of any discontinued operations. In particular, our definition of Adjusted EBITDA allows us to add back certain non-operating, unusual or non-recurring charges that are deducted in calculating net (loss) income, even though these are expenses that may recur, vary greatly and are difficult to predict and can represent the effect of long-term strategies as opposed to short-term results.
In addition, certain of these expenses represent the reduction of cash that could be used for other purposes. Further, although not included in the calculation of Adjusted EBITDA presented in this release, the measure as defined in our credit facilities may at times allow us to add estimated cost savings and operating synergies related to operational changes ranging from acquisitions to dispositions to restructurings and/or exclude one-time transition expenditures that we anticipate we will need to incur to realize cost savings before such savings have occurred. Adjusted EBITDA margin percentage as shown in Exhibit E is computed as Adjusted EBITDA divided by total net sales.
Adjusted Free Cash Flow
We define Adjusted Free Cash Flow as cash flow provided by (used in) operating activities - continuing operations, less capital expenditures from continuing operations, adjusted for cash received from a litigation settlement gain in the second quarter of 2019. We use this metric in analyzing our ability to service and repay our debt. However, this measure does not represent funds available for investment or other discretionary uses since it does not deduct cash used to service our debt, nor does it reflect the cash impacts of our discontinued operations. Adjusted Free Cash Flow should not be considered in isolation, or as a substitute for, cash (used in) provided by operating activities - continuing operations or any other measures of liquidity derived in accordance with GAAP.
About CPI Card Group Inc.
CPI Card Group® is a payment technology company and leading provider of credit, debit and prepaid solutions delivered physically, digitally and on-demand. CPI helps our customers foster connections and build their brands through innovative and reliable solutions, including financial payment cards, personalization, and Software-as-a-Service (SaaS) instant issuance. CPI has more than 20 years of experience in the payments market and is a trusted partner to financial institutions and payments services providers. Serving customers from locations throughout the United States, CPI has a large network of high security facilities, each of which is registered as PCI compliant by one or more of the payment brands: Visa, Mastercard®, American Express® and Discover®. Learn more at www.cpicardgroup.com.
Forward-Looking Statements
Certain statements and information in this earnings release (as well as information included in other written or oral statements we make from time to time) may contain or constitute “forward-looking statements” within the meaning of the Private Securities Litigation Reform Act of 1995, Section 27A of the Securities Act of 1933, as amended and Section 21E of the Securities Exchange Act of 1934, as amended. The words “believe,” “estimate,” “project,” “expect,” “anticipate,” “plan,” “intend,” “foresee,” “should,” “would,” “could,” “guides,” “provides guidance,” “provides outlook,” or other similar expressions are intended to identify forward-looking statements, which are not historical in nature. These forward-looking statements are based on our current expectations and beliefs concerning future developments and their potential effect on us, and other information currently available. Such forward-looking statements, because they relate to future events, are by their very nature subject to many important risks and uncertainties that could cause actual results or other events to differ materially from those contemplated.
These risks and uncertainties include, but are not limited to: the potential effects of COVID-19 on our business, including our supply-chain, customer demand, workforce, operations and ability to comply with certain covenants in our credit facilities; a decline in U.S. and global market and economic conditions and resulting decreases in consumer and business spending; our lack of eligibility to participate in government relief programs related to COVID-19 or inability to realize material benefits from such programs; our substantial indebtedness, including inability to make debt service payments or refinance such indebtedness; costs and impacts to our financial results relating to the obligatory collection of sales tax and claims for uncollected sales tax in states that impose sales tax collection requirements on out-of-state businesses, and challenges to our income tax positions; the restrictive terms of our credit facilities and covenants of future agreements governing indebtedness and the resulting restraints on our ability to pursue our business strategies; our limited ability to raise capital in the future; system security risks, data protection breaches and cyber-attacks; failure to comply with regulations, customer contractual requirements and evolving industry standards regarding consumer privacy and data use and security, including with respect to possible exposure to litigation and/or regulatory penalties under applicable data privacy and other laws for failure to so comply; interruptions in our operations, including our IT systems, or in the operations of the third parties that operate the data centers or computing infrastructure on which we rely; disruptions in production at one or more of our facilities; our inability to adequately protect our trade secrets and intellectual property rights from misappropriation or infringement, claims that our technology is infringing on the intellectual property of others, and risks related to open source software; defects in our software; problems in production quality, materials and process; a disruption or other failure in our supply chain; our failure to retain our existing customers or identify and attract new customers; a loss of market share or a decline in profitability resulting from competition; our inability to recruit, retain and develop qualified personnel, including key personnel; our inability to sell, exit, reconfigure or consolidate businesses or facilities that no longer meet with our strategy; our inability to develop, introduce and commercialize new products; the effect of legal and regulatory proceedings; failure to meet the continued listing standards of the Toronto Stock Exchange or the rules of the OTCQX® Best Market; a continued decrease in the value of our common stock combined with our common stock no longer being traded on a United States national securities exchange, which may prevent investors or potential investors from investing or achieving a meaningful degree of liquidity; developing technologies that make our existing technology solutions and products obsolete or less relevant or a failure to introduce new products and services in a timely manner; quarterly variation in our operating results; our inability to realize the full value of our long-lived assets; our failure to operate our business in accordance with the Payment Card Industry (“PCI”) Security Standards Council security standards or other industry standards; costs relating to product defects and any related product liability and/or warranty claims; maintenance and further imposition of tariffs and/or trade restrictions on, or slow-downs or interruptions in our ability
to obtain, goods imported into the United States; our dependence on licensing arrangements; risks associated with international operations; non-compliance with, and changes in, laws in the United States and in foreign jurisdictions in which we operate and sell our products; our ability to comply with a wide variety of environmental, health and safety laws and regulations and the exposure to liability for any failure to comply; risks associated with the controlling stockholders’ ownership of our stock; potential conflicts of interest that may arise due to our board of directors being comprised in part of directors who are principals of our largest stockholder; and other risks that are described in Part I, Item 1A – Risk Factors of our Annual Report on Form 10-K for the year ended December 31, 2019 and filed with the Securities and Exchange Commission (the “SEC”) on March 6, 2020, Part II, Item 1A – Risk Factors of our Quarterly Report on Form 10-Q for the quarter ended September 30, 2020, and filed with the SEC on November 3, 2020, and our other reports filed from time to time with the SEC.
We caution and advise readers not to place undue reliance on forward-looking statements, which speak only as of the date hereof. These statements are based on assumptions that may not be realized and involve risks and uncertainties that could cause actual results to differ materially from the expectations and beliefs contained herein. We undertake no obligation to publicly update or revise any forward-looking statements after the date they are made, whether as a result of new information, future events or otherwise.
####
For more information:
CPI encourages investors to use its investor relations website as a way of easily finding information about the company. CPI promptly makes available on this website, free of charge, the reports that the company files or furnishes with the SEC, corporate governance information and press releases. CPI uses its investor relations site (http://investor.cpicardgroup.com) as a means of disclosing material information and for complying with its disclosure obligations under Regulation FD.
CPI Card Group Inc. Investor Relations:
(877) 369-9016
InvestorRelations@cpicardgroup.com
CPI Card Group Inc. Media Relations:
Media@cpicardgroup.com
CPI Card Group Inc. Earnings Release Supplemental Financial Information
Exhibit A | Condensed Consolidated Statements of Operations and Comprehensive Income (Loss) - Unaudited for the three and nine months ended September 30, 2020 and 2019 |
| |
Exhibit B | Condensed Consolidated Balance Sheets – Unaudited as of September 30, 2020 and December 31, 2019 |
| |
Exhibit C | Condensed Consolidated Statements of Cash Flows - Unaudited for the nine months ended September 30, 2020 and 2019 |
| |
Exhibit D | Segment Summary Information – Unaudited for the three and nine months ended September 30, 2020 and 2019 |
| |
Exhibit E | Supplemental GAAP to Non-GAAP Reconciliations - Unaudited for the three and nine months ended September 30, 2020 and 2019 |
| |

| | | | | | | | | | EXHIBIT A | ||
CPI Card Group Inc. and Subsidiaries | ||||||||||||
Condensed Consolidated Statements of Operations and Comprehensive Income (Loss) | ||||||||||||
(Amounts in Thousands, Except Share and Per Share Amounts) | ||||||||||||
(Unaudited) | ||||||||||||
| | Three Months Ended September 30, | | Nine Months Ended September 30, | ||||||||
| | 2020 |
| 2019 |
| 2020 |
| 2019 | ||||
Net sales: | | | | | | | | | | | | |
Products | | $ | 43,462 | | $ | 33,963 | | $ | 125,040 | | $ | 99,845 |
Services | | | 39,240 | | | 37,718 | | | 103,009 | | | 105,603 |
Total net sales | | | 82,702 | | | 71,681 | | | 228,049 | | | 205,448 |
Cost of sales: | | | | | | | | | | | | |
Products (exclusive of depreciation and amortization shown below) | | | 27,490 | | | 22,182 | | | 79,780 | | | 65,769 |
Services (exclusive of depreciation and amortization shown below) | | | 22,133 | | | 21,329 | | | 60,986 | | | 62,142 |
Depreciation and amortization | | | 2,472 | | | 2,813 | | | 7,938 | | | 8,403 |
Total cost of sales | | | 52,095 | | | 46,324 | | | 148,704 | | | 136,314 |
Gross profit | | | 30,607 | | | 25,357 | | | 79,345 | | | 69,134 |
Operating expenses, net: | | | | | | | | | | | | |
Selling, general and administrative (exclusive of depreciation and amortization shown below) | | | 15,617 | | | 16,104 | | | 48,893 | | | 49,541 |
Depreciation and amortization | | | 1,508 | | | 1,513 | | | 4,498 | | | 4,539 |
Litigation settlement gain | | | — | | | — | | | — | | | (6,000) |
Total operating expenses, net | | | 17,125 | | | 17,617 | | | 53,391 | | | 48,080 |
Income from operations | | | 13,482 | | | 7,740 | | | 25,954 | | | 21,054 |
Other expense, net: | | | | | | | | | | | | |
Interest, net | | | (6,298) | | | (6,085) | | | (19,158) | | | (18,847) |
Foreign currency gain (loss) | | | 23 | | | (40) | | | (10) | | | (1,320) |
Other income (expense), net | | | 4 | | | 14 | | | (90) | | | 25 |
Total other expense, net | | | (6,271) | | | (6,111) | | | (19,258) | | | (20,142) |
Income from continuing operations before income taxes | | | 7,211 | | | 1,629 | | | 6,696 | | | 912 |
Income tax (expense) benefit | | | (1,402) | | | (2,258) | | | 2,178 | | | (3,618) |
Net income (loss) from continuing operations | | | 5,809 | | | (629) | | | 8,874 | | | (2,706) |
Net (loss) income from discontinued operation, net of tax | | | — | | | (28) | | | (30) | | | (16) |
Net income (loss) | | $ | 5,809 | | $ | (657) | | $ | 8,844 | | $ | (2,722) |
| | | | | | | | | | | | |
| | | | | | | | | | | | |
Basic and Diluted net income (loss) per share from continuing operations: | | $ | 0.52 | | $ | (0.06) | | $ | 0.79 | | $ | (0.24) |
| | | | | | | | | | | | |
Basic and Diluted net income (loss) per share: | | $ | 0.52 | | $ | (0.06) | | $ | 0.79 | | $ | (0.24) |
| | | | | | | | | | | | |
Basic weighted-average shares outstanding: | | | 11,230,028 | | | 11,223,715 | | | 11,228,116 | | | 11,187,550 |
Diluted weighted-average shares outstanding: | | | 11,231,821 | | | 11,223,715 | | | 11,235,098 | | | 11,187,550 |
| | | | | | | | | | | | |
Comprehensive income (loss): | | | | | | | | | | | | |
Net income (loss) | | $ | 5,809 | | $ | (657) | | $ | 8,844 | | $ | (2,722) |
Currency translation adjustment | | | — | | | — | | | — | | | 31 |
Reclassification adjustment to foreign currency loss | | | — | | | — | | | — | | | 1,329 |
Total comprehensive income (loss) | | $ | 5,809 | | $ | (657) | | $ | 8,844 | | $ | (1,362) |
| | | | | | | | | | | | |
Note: The Company revised its prior period financial statements to adjust immaterial items, primarily due to estimated sales tax expense relating to 2017 to 2020. Refer to Note 1 of the Form 10-Q for the quarter ended September 30, 2020 for an explanation of the immaterial prior period adjustments. | ||||||||||||
| | | | | EXHIBIT B | |
CPI Card Group Inc. and Subsidiaries | ||||||
Condensed Consolidated Balance Sheets | ||||||
(Amounts in Thousands, Except Share and Per Share Amounts) | ||||||
(Unaudited) | ||||||
| | September 30, | | December 31, | ||
| | 2020 | | 2019 | ||
| | | | | | |
Assets | | | | | | |
Current assets: | | | | | | |
Cash and cash equivalents | | $ | 50,349 | | $ | 18,682 |
Accounts receivable, net of allowances of $291 and $395, respectively | | | 59,093 | | | 42,832 |
Inventories | | | 20,166 | | | 20,192 |
Prepaid expenses and other current assets | | | 4,267 | | | 6,345 |
Income taxes receivable | | | 7,795 | | | 4,164 |
Total current assets | | | 141,670 | | | 92,215 |
Plant, equipment, leasehold improvements and operating lease right-of-use assets, net | | | 35,473 | | | 41,612 |
Intangible assets, net | | | 27,355 | | | 30,802 |
Goodwill | | | 47,150 | | | 47,150 |
Other assets | | | 2,040 | | | 1,232 |
Total assets | | $ | 253,688 | | $ | 213,011 |
Liabilities and stockholders’ deficit | | | | | | |
Current liabilities: | | | | | | |
Accounts payable | | $ | 17,223 | | $ | 16,482 |
Accrued expenses | | | 29,527 | | | 24,735 |
Deferred revenue and customer deposits | | | 885 | | | 468 |
Total current liabilities | | | 47,635 | | | 41,685 |
Long-term debt | | | 335,759 | | | 307,778 |
Deferred income taxes | | | 6,656 | | | 6,366 |
Other long-term liabilities | | | 9,012 | | | 11,478 |
Total liabilities | | | 399,062 | | | 367,307 |
Commitments and contingencies | | | | | | |
Series A Preferred Stock; $0.001 par value—100,000 shares authorized; 0 shares issued and outstanding at September 30, 2020 and December 31, 2019 | | | - | | | - |
Stockholders’ deficit: | | | | | | |
Common stock; $0.001 par value—100,000,000 shares authorized; 11,230,482 and 11,224,191 shares issued and outstanding at September 30, 2020 and December 31, 2019, respectively | | | 11 | | | 11 |
Capital deficiency | | | (111,910) | | | (111,988) |
Accumulated loss | | | (33,475) | | | (42,319) |
Total stockholders’ deficit | | | (145,374) | | | (154,296) |
Total liabilities and stockholders’ deficit |
| $ | 253,688 | | $ | 213,011 |
EXHIBIT C | ||||||
CPI Card Group Inc. and Subsidiaries | ||||||
Condensed Consolidated Statements of Cash Flows | ||||||
(Amounts in Thousands) | ||||||
(Unaudited) | ||||||
| | | | | | |
| | Nine Months Ended September 30, | ||||
|
| 2020 |
| 2019 | ||
Operating activities | | | | | | |
Net income (loss) |
| $ | 8,844 | | $ | (2,722) |
Adjustments to reconcile net income (loss) to net cash provided by (used in) operating activities: | | | | | | |
Loss from discontinued operations | | | 30 | | | 16 |
Depreciation and amortization expense | | | 12,436 | | | 12,942 |
Stock-based compensation expense | | | 84 | | | 316 |
Amortization of debt issuance costs and debt discount | | | 2,503 | | | 1,469 |
Deferred income taxes | | | 290 | | | 2,531 |
Reclassification adjustment to foreign currency loss | | | — | | | 1,329 |
Other, net | | | 1,345 | | | (6) |
Changes in operating assets and liabilities: | | | | | | |
Accounts receivable | | | (16,165) | | | (2,605) |
Inventories | | | (1,109) | | | (12,279) |
Prepaid expenses and other assets | | | 49 | | | 1,659 |
Income taxes receivable, net | | | (3,630) | | | 331 |
Accounts payable | | | 921 | | | (358) |
Accrued expenses | | | 4,112 | | | (5,167) |
Deferred revenue and customer deposits | | | 417 | | | (472) |
Other liabilities | | | 81 | | | 17 |
Cash provided by (used in) operating activities - continuing operations | | | 10,208 | | | (2,999) |
Cash used in operating activities - discontinued operations | | | (30) | | | (16) |
Investing activities | | | | | | |
Acquisitions of plant, equipment and leasehold improvements | | | (3,320) | | | (3,298) |
Cash received for sale of Canadian subsidiary | | | — | | | 1,451 |
Cash used in investing activities - continuing operations | | | (3,320) | | | (1,847) |
Financing activities | | | | | | |
Proceeds from Senior Credit Facility, net of discount | | | 29,100 | | | — |
Debt issuance costs | | | (2,507) | | | — |
Proceeds from Revolving Credit Facility | | | — | | | 11,500 |
Payments on Revolving Credit Facility | | | — | | | (11,500) |
Payments on finance lease obligations | | | (1,782) | | | (1,175) |
Cash provided by (used in) financing activities | | | 24,811 | | | (1,175) |
Effect of exchange rates on cash | | | (2) | | | 36 |
Net increase (decrease) in cash and cash equivalents | | | 31,667 | | | (6,001) |
Cash and cash equivalents, beginning of period | | | 18,682 | | | 20,291 |
Cash and cash equivalents, end of period |
| $ | 50,349 | | $ | 14,290 |
Supplemental disclosures of cash flow information | | | | | | |
Cash paid during the period for: | | | | | | |
Interest |
| $ | 17,454 | | $ | 17,315 |
Income taxes |
| $ | 946 | | $ | 675 |
Right-to-use assets obtained in exchange for lease obligations: | | | | | | |
Operating leases | | $ | 141 | | $ | 8,533 |
Financing leases | | $ | 1,618 | | $ | 5,196 |
Accounts payable, and accrued expenses for acquisitions of plant, equipment and leasehold improvements | | $ | 127 | | $ | 159 |
| | | | | | | | | | | | | | | EXHIBIT D |
CPI Card Group Inc. and Subsidiaries | |||||||||||||||
Segment Summary Information | |||||||||||||||
For the Three and Nine Months Ended September 30, 2020 and 2019 | |||||||||||||||
(Dollars in Thousands) | |||||||||||||||
(Unaudited) | |||||||||||||||
Net Sales | | | | | | | | | | | | |
| | Three Months Ended September 30, | ||||||||||
|
| 2020 |
| 2019 |
| $ Change |
| % Change | | |||
Net sales by segment: | | | | | | | | | | | | |
Debit and Credit | | $ | 62,710 | | $ | 51,502 | | $ | 11,208 | | 21.8 | % |
Prepaid Debit | | | 20,604 | | | 20,452 | | | 152 | | 0.7 | % |
Eliminations | | | (612) | | | (273) | | | (339) | | * | % |
Total | | $ | 82,702 | | $ | 71,681 | | $ | 11,021 | | 15.4 | % |
* Calculation not meaningful
| | Nine Months Ended September 30, | ||||||||||
|
| 2020 |
| 2019 |
| $ Change |
| % Change | ||||
Net sales by segment: | | | | | | | | | | | | |
Debit and Credit | | $ | 180,855 | | $ | 151,517 | | $ | 29,338 | | 19.4 | % |
Prepaid Debit | | | 48,680 | | | 53,162 | | | (4,482) | | (8.4) | % |
Other | | | — | | | 1,679 | | | (1,679) | | (100.0) | % |
Eliminations | | | (1,486) | | | (910) | | | (576) | | * | % |
Total | | $ | 228,049 | | $ | 205,448 | | $ | 22,601 | | 11.0 | % |
* Calculation not meaningful
Gross Profit | | | | | | | | | | | | | | | | | |
| | Three Months Ended September 30, | | ||||||||||||||
|
| 2020 |
| | % of Net |
| 2019 |
| % of Net |
| $ Change |
| % Change |
| |||
Gross profit by segment: | | | | | | | | | | | | | | | | | |
Debit and Credit | | $ | 21,720 | | | 34.6 | % | $ | 16,441 | | 31.9 | % | $ | 5,279 | | 32.1 | % |
Prepaid Debit | | | 8,887 | | | 43.1 | % | | 8,916 | | 43.6 | % | | (29) | | (0.3) | % |
Total | | $ | 30,607 | | | 37.0 | % | $ | 25,357 | | 35.4 | % | $ | 5,250 | | 20.7 | % |
* Calculation not meaningful
| | Nine Months Ended September 30, | | ||||||||||||||
|
| 2020 |
| | % of Net |
| 2019 |
| % of Net |
| $ Change |
| % Change |
| |||
Gross profit by segment: | | | | | | | | | | | | | | | | | |
Debit and Credit | | $ | 60,681 | | | 33.6 | % | $ | 47,460 | | 31.3 | % | $ | 13,221 | | 27.9 | % |
Prepaid Debit | | | 18,664 | | | 38.3 | % | | 21,771 | | 41.0 | % | | (3,107) | | (14.3) | % |
Other | | | — | | | - | % | | (97) | | * | % | | 97 | | * | % |
Total | | $ | 79,345 | | | 34.8 | % | $ | 69,134 | | 33.7 | % | $ | 10,211 | | 14.8 | % |
* Calculation not meaningful
Income from Operations | | | | | | | | | | | | | | | | | |
| | | Three Months Ended September 30, | | |||||||||||||
|
| | 2020 |
| | % of Net |
| | 2019 |
| % of Net |
| | $ Change |
| % Change |
|
Income (loss) from operations by segment: | | | | | | | | | | | | | | | | | |
Debit and Credit | | $ | 14,734 | | | 23.5 | % | $ | 8,628 | | 16.8 | % | $ | 6,106 | | 70.8 | % |
Prepaid Debit | | | 7,829 | | | 38.0 | % | | 7,815 | | 38.2 | % | | 14 | | 0.2 | % |
Other | | | (9,081) | | | * | % | | (8,703) | | * | % | | (378) | | (4.3) | % |
Total | | $ | 13,482 | | | 16.3 | % | $ | 7,740 | | 10.8 | % | $ | 5,742 | | 74.2 | % |
* Calculation not meaningful
| | | Nine Months Ended September 30, | | |||||||||||||
|
| | 2020 |
| | % of Net |
| | 2019 |
| % of Net |
| | $ Change |
| % Change |
|
Income (loss) from operations by segment: | | | | | | | | | | | | | | | | | |
Debit and Credit | | $ | 37,914 | | | 21.0 | % | $ | 24,037 | | 15.9 | % | $ | 13,877 | | 57.7 | % |
Prepaid Debit | | | 15,379 | | | 31.6 | % | | 18,505 | | 34.8 | % | | (3,126) | | (16.9) | % |
Other | | | (27,339) | | | * | % | | (21,488) | | * | % | | (5,851) | | (27.2) | % |
Total | | $ | 25,954 | | | 11.4 | % | $ | 21,054 | | 10.2 | % | $ | 4,900 | | 23.3 | % |
* Calculation not meaningful | | | | | | | | | | | | | | | | | |
EBITDA | | Three Months Ended September 30, | | ||||||||||||||
|
| 2020 |
| | % of Net |
| 2019 |
| % of Net |
| $ Change |
| % Change |
| |||
EBITDA by segment: | | | | | | | | | | | | | | | | | |
Debit and Credit | | $ | 16,993 | | | 27.1 | % | $ | 11,249 | | 21.8 | % | $ | 5,744 | | 51.1 | % |
Prepaid Debit | | | 8,332 | | | 40.4 | % | | 8,342 | | 40.8 | % | | (10) | | (0.1) | % |
Other | | | (7,836) | | | * | % | | (7,551) | | * | % | | (285) | | (3.8) | % |
Total | | $ | 17,489 | | | 21.1 | % | $ | 12,040 | | 16.8 | % | $ | 5,449 | | 45.3 | % |
* Calculation not meaningful
| | Nine Months Ended September 30, | | ||||||||||||||
|
| 2020 |
| | % of Net |
| 2019 |
| % of Net |
| $ Change |
| % Change |
| |||
EBITDA by segment: | | | | | | | | | | | | | | | | | |
Debit and Credit | | $ | 45,073 | | | 24.9 | % | $ | 31,992 | | 21.1 | % | $ | 13,081 | | 40.9 | % |
Prepaid Debit | | | 16,974 | | | 34.9 | % | | 20,001 | | 37.6 | % | | (3,027) | | (15.1) | % |
Other | | | (23,757) | | | * | % | | (19,292) | | * | % | | (4,465) | | (23.1) | % |
Total | | $ | 38,290 | | | 16.8 | % | $ | 32,701 | | 15.9 | % | $ | 5,589 | | 17.1 | % |
* Calculation not meaningful | | | | | | | | | | | | | | | | | |
Reconciliation of Income (loss) from | | | | | | | | | | | | |
Operations by Segment to EBITDA by Segment | | | | | | | | | | | | |
| | Three Months Ended September 30, 2020 | ||||||||||
| | Debit and Credit | | Prepaid Debit | | Other | | Total | ||||
EBITDA by segment: | | | | | | | | | | | | |
Income (loss) from operations | | $ | 14,734 | | $ | 7,829 | | $ | (9,081) | | $ | 13,482 |
Depreciation and amortization | | | 2,261 | | | 502 | | | 1,217 | | | 3,980 |
Other (expenses) income | | | (2) | | | 1 | | | 28 | | | 27 |
EBITDA | | $ | 16,993 | | $ | 8,332 | | $ | (7,836) | | $ | 17,489 |
| | | | | | | | | | | | |
| | | | | | | | | | | | |
| | Three Months Ended September 30, 2019 | ||||||||||
| | Debit and Credit | | Prepaid Debit | | Other | | Total | ||||
EBITDA by segment: | | | | | | | | | | | | |
Income (loss) from operations | | $ | 8,628 | | $ | 7,815 | | $ | (8,703) | | $ | 7,740 |
Depreciation and amortization | | | 2,625 | | | 527 | | | 1,174 | | | 4,326 |
Other (expenses) income | | | (4) | | | — | | | (22) | | | (26) |
EBITDA | | $ | 11,249 | | $ | 8,342 | | $ | (7,551) | | $ | 12,040 |
| | | | | | | | | | | | |
| | | | | | | | | | | | |
| | Nine Months Ended September 30, 2020 | ||||||||||
| | Debit and Credit | | Prepaid Debit | | Other | | Total | ||||
EBITDA by segment: | | | | | | | | | | | | |
Income (loss) from operations | | $ | 37,914 | | $ | 15,379 | | $ | (27,339) | | $ | 25,954 |
Depreciation and amortization | | | 7,207 | | | 1,599 | | | 3,630 | | | 12,436 |
Other (expenses) income | | | (48) | | | (4) | | | (48) | | | (100) |
EBITDA | | $ | 45,073 | | $ | 16,974 | | $ | (23,757) | | $ | 38,290 |
| | | | | | | | | | | | |
| | | | | | | | | | | | |
| | Nine Months Ended September 30, 2019 | ||||||||||
| | Debit and Credit | | Prepaid Debit | | Other | | Total | ||||
EBITDA by segment: | | | | | | | | | | | | |
Income (loss) from operations | | $ | 24,037 | | | 18,505 | | | (21,488) | | | 21,054 |
Depreciation and amortization | | | 7,966 | | | 1,515 | | | 3,461 | | | 12,942 |
Other (expenses) income | | | (11) | | | (19) | | | (1,265) | | | (1,295) |
EBITDA | | $ | 31,992 | | $ | 20,001 | | $ | (19,292) | | $ | 32,701 |
EXHIBIT E | | ||||||||||||
CPI Card Group Inc. and Subsidiaries | | ||||||||||||
Supplemental GAAP to Non-GAAP Reconciliations | | ||||||||||||
(Dollars in Thousands) | | ||||||||||||
(Unaudited) | | ||||||||||||
| | | | | | | | | | | | | |
| | Three Months Ended September 30, | | Nine Months Ended September 30, | | ||||||||
|
| 2020 |
| 2019 |
| 2020 |
| 2019 | | ||||
Reconciliation of net income (loss) from continuing operations (GAAP) to EBITDA and Adjusted EBITDA: | | | | | | | | | | | | | |
Net income (loss) from continuing operations | | $ | 5,809 | | $ | (629) | | $ | 8,874 | | $ | (2,706) | |
Interest expense, net | | | 6,298 | | | 6,085 | | | 19,158 | | | 18,847 | |
Income tax expense (benefit) | | | 1,402 | | | 2,258 | | | (2,178) | | | 3,618 | |
Depreciation and amortization (2) | | | 3,980 | | | 4,326 | | | 12,436 | | | 12,942 | |
EBITDA | | $ | 17,489 | | $ | 12,040 | | $ | 38,290 | | $ | 32,701 | |
| | | | | | | | | | | | | |
Adjustments to EBITDA: | | | | | | | | | | | | | |
Stock-based compensation expense | | | 25 | | | 9 | | | 84 | | | 316 | |
Litigation and related charges (1) | | | — | | | — | | | — | | | 28 | |
Sales tax expense (2) | | | — | | | 168 | | | 293 | | | 396 | |
Restructuring and other charges (3) | | | — | | | — | | | 1,229 | | | — | |
Loss on Revolving Credit Facility termination (4) | | | — | | | — | | | 92 | | | — | |
Litigation settlement gain (5) | | | — | | | — | | | — | | | (6,000) | |
Foreign currency (gain) loss (6) | | | (23) | | | 40 | | | 10 | | | 1,320 | |
Subtotal of adjustments to EBITDA | | | 2 | | | 217 | | | 1,708 | | | (3,940) | |
Adjusted EBITDA | | $ | 17,491 | | $ | 12,257 | | $ | 39,998 | | $ | 28,761 | |
Adjusted EBITDA margin (% of net sales) | | | 21.1 | % | | 17.1 | % | | 17.5 | % | | 14.0 | % |
Adjusted EBITDA growth (% Change 2020 vs. 2019) | | | 42.7 | % | | | | | 39.1 | % | | | |
Net income (% Change 2020 vs. 2019) | | | 984.2 | % | | | | | 424.9 | % | | | |
| | | | | | | | | | | | | |
| | Three Months Ended September 30, | | Nine Months Ended September 30, | | ||||||||
| | 2020 | | 2019 | | | 2020 | | 2019 | | |||
Reconciliation of cash (used in) provided by operating activities - continuing operations (GAAP) to Adjusted Free Cash Flow: | | | | | | | | | | | | | |
Cash (used in) provided by operating activities - continuing operations | | $ | (1,838) | | $ | (2,042) | | $ | 10,208 | | $ | (2,999) | |
Acquisitions of plant, equipment and leasehold improvements | | | (1,676) | | | (612) | | | (3,320) | | | (3,298) | |
Cash received from litigation settlement (5) | | | — | | | — | | | — | | | (6,000) | |
Adjusted free cash flow (use) - continuing operations | | $ | (3,514) | | $ | (2,654) | | $ | 6,888 | | $ | (12,297) | |
Note that tables in this exhibit are presented on a continuing operations basis.
| (1) | Represents net legal costs incurred with certain patent and shareholder litigation. |
| (2) | The Company revised its prior period financial statements to adjust immaterial items, primarily due to estimated sales tax expense relating to 2017 to 2020. Refer to Note 1 of the Form 10-Q for the quarter ended September 30, 2020 for an explanation of the immaterial prior period adjustments. |
| (3) | Represents restructuring severance charges in 2020. |
| (4) | The Company terminated the Revolving Credit Facility during the first quarter of 2020 and expensed the remaining unamortized deferred financing costs. |
| (5) | During the second quarter of 2019, the Company recognized in operating income a $6.0 million gain related to the cash settlement of litigation. |
| (6) | Foreign currency loss includes the release of the cumulative translation adjustment from the balance sheet to the statement of operations, done in connection with the disposition of the Company’s Canadian subsidiary during the first nine months of 2019. |
Exhibit 99.2
| Investor Commentary Third Quarter and First Nine Months 2020 November 3, 2020 |

| Table of Contents COVID-19 Update 2 Vision and Strategic Priorities 3 Strategic Update 4 Third Quarter and First Nine Months Financial Review 5 Segment Performance 8 Balance Sheet, Liquidity and Cash Flow 10 Summary 12 Appendix Cautionary Statement on Forward-Looking Statements 13 Reconciliations of Non-GAAP Financial Measures 14 1 Q3 2020 | The commentary that follows is issued in conjunction with the earnings release dated November 3, 2020. Certain statements and information in this document (as well as information included in other written or oral statements we make from time to time) may contain or constitute “forward-looking statements” within the meaning of the Private Securities Litigation Reform Act of 1995, Section 27A of the Securities Act of 1933, as amended, and Section 21E of the Securities Exchange Act of 1934, as amended. Please see the Cautionary Statement on Forward Looking Statements at the end of this document. |
| Third Quarter and First Nine Months 2020 2 As we continue to navigate these unprecedented times, we remain committed to supporting our employees, customers and the communities in which we operate. Before updating you on our third quarter and first nine months results, we would like to provide an update regarding our response to this evolving situation. COVID-19 Update CPI Card Group Inc. (“CPI” or the “Company”), like many other businesses, closely monitors information available regarding the COVID-19 pandemic and the broader economic implications to understand and address the impact on our employees, customers, partners and the community. We established and follow response protocols across our business that are based on the recommendations of the Centers for Disease Control and Prevention and state and local government health orders and guidelines. Throughout the pandemic, all of our facilities have remained operational and continue to provide essential services to our customers. Our operations provide direct and critical support to the financial services sector, including the production and fulfillment of debit and credit, payroll, government benefit, and health savings account cards, as well as payment cards used by the unbanked to pay for daily expenses and bills. These products enable people to access fundamental financial services. We continue to extend gratitude to our employees for their dedication and commitment to safety and serving our customers through these unprecedented times. Q3 2020 | |

| Vision and Strategic Priorities 3 We strive to be the trusted partner in payments and exceed expectations through high quality, collaboration and innovative products. We are committed to continually raising the bar on delivering high quality products and exceptional service while making it easy to do business with CPI. We drive efficiency and productivity throughout our business with ongoing process improvements, operational automation, technology and equipment advancement. We collaborate with our customers to deliver unique and differentiated products and solutions that elevate their customers’ experience and enhance their brands. Our vision is to be the partner of choice by providing market-leading quality products and customer service with a market-competitive business model. Q3 2020 | Deep Customer Focus Market-Leading Quality Products and Customer Service Continuous Innovation Market-Competitive Business Model |
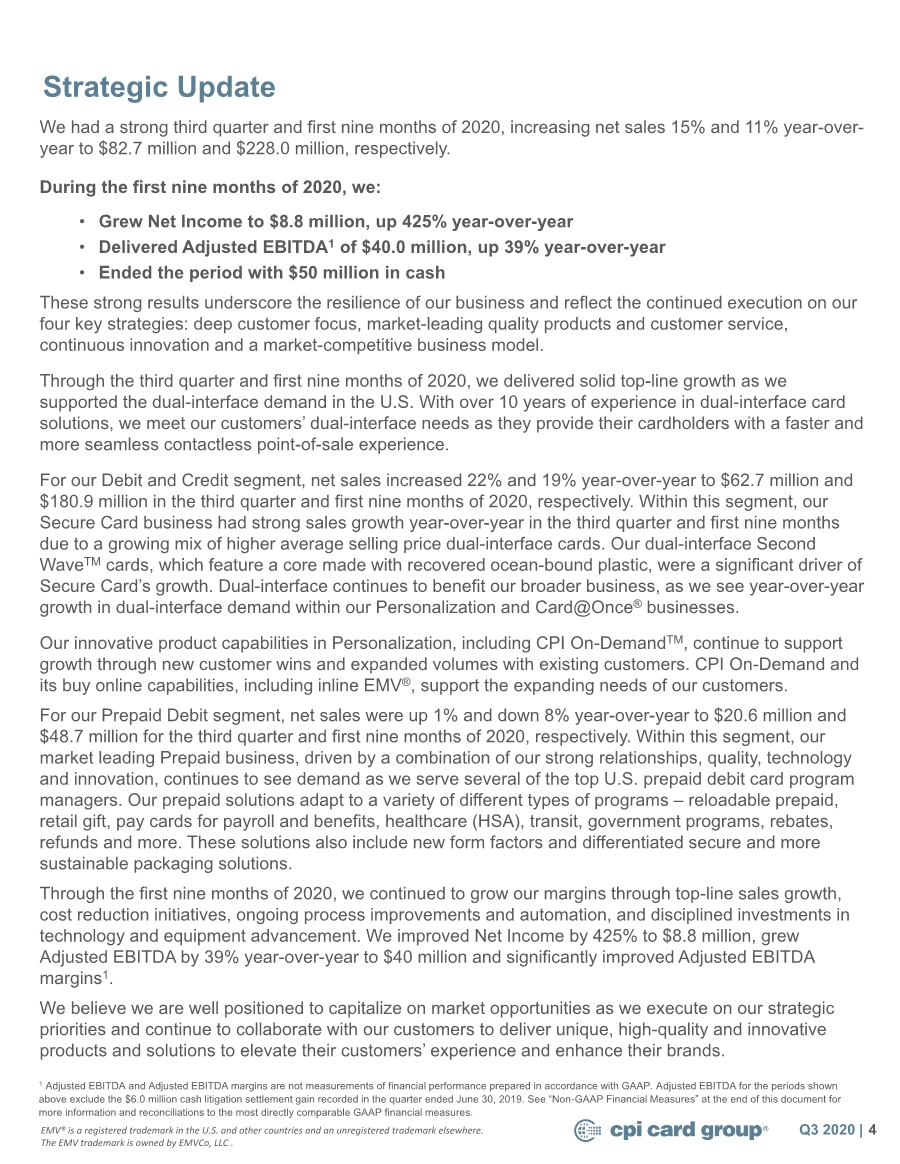
| Strategic Update 4 We had a strong third quarter and first nine months of 2020, increasing net sales 15% and 11% year-over- year to $82.7 million and $228.0 million, respectively. During the first nine months of 2020, we: • Grew Net Income to $8.8 million, up 425% year-over-year • Delivered Adjusted EBITDA1 of $40.0 million, up 39% year-over-year • Ended the period with $50 million in cash These strong results underscore the resilience of our business and reflect the continued execution on our four key strategies: deep customer focus, market-leading quality products and customer service, continuous innovation and a market-competitive business model. Through the third quarter and first nine months of 2020, we delivered solid top-line growth as we supported the dual-interface demand in the U.S. With over 10 years of experience in dual-interface card solutions, we meet our customers’ dual-interface needs as they provide their cardholders with a faster and more seamless contactless point-of-sale experience. For our Debit and Credit segment, net sales increased 22% and 19% year-over-year to $62.7 million and $180.9 million in the third quarter and first nine months of 2020, respectively. Within this segment, our Secure Card business had strong sales growth year-over-year in the third quarter and first nine months due to a growing mix of higher average selling price dual-interface cards. Our dual-interface Second WaveTM cards, which feature a core made with recovered ocean-bound plastic, were a significant driver of Secure Card’s growth. Dual-interface continues to benefit our broader business, as we see year-over-year growth in dual-interface demand within our Personalization and Card@Once® businesses. Our innovative product capabilities in Personalization, including CPI On-DemandTM, continue to support growth through new customer wins and expanded volumes with existing customers. CPI On-Demand and its buy online capabilities, including inline EMV®, support the expanding needs of our customers. For our Prepaid Debit segment, net sales were up 1% and down 8% year-over-year to $20.6 million and $48.7 million for the third quarter and first nine months of 2020, respectively. Within this segment, our market leading Prepaid business, driven by a combination of our strong relationships, quality, technology and innovation, continues to see demand as we serve several of the top U.S. prepaid debit card program managers. Our prepaid solutions adapt to a variety of different types of programs – reloadable prepaid, retail gift, pay cards for payroll and benefits, healthcare (HSA), transit, government programs, rebates, refunds and more. These solutions also include new form factors and differentiated secure and more sustainable packaging solutions. Through the first nine months of 2020, we continued to grow our margins through top-line sales growth, cost reduction initiatives, ongoing process improvements and automation, and disciplined investments in technology and equipment advancement. We improved Net Income by 425% to $8.8 million, grew Adjusted EBITDA by 39% year-over-year to $40 million and significantly improved Adjusted EBITDA margins1. We believe we are well positioned to capitalize on market opportunities as we execute on our strategic priorities and continue to collaborate with our customers to deliver unique, high-quality and innovative products and solutions to elevate their customers’ experience and enhance their brands. Q3 2020 | EMV® is a registered trademark in the U.S. and other countries and an unregistered trademark elsewhere. The EMV trademark is owned by EMVCo, LLC . 1 Adjusted EBITDA and Adjusted EBITDA margins are not measurements of financial performance prepared in accordance with GAAP. Adjusted EBITDA for the periods shown above exclude the $6.0 million cash litigation settlement gain recorded in the quarter ended June 30, 2019. See “Non-GAAP Financial Measures” at the end of this document for more information and reconciliations to the most directly comparable GAAP financial measures. |
| $205.4 $228.0 YTD 2019 YTD 2020 $71.7 $82.7 Q3 2019 Q3 2020 NET SALES ($ in millions) Third Quarter and First Nine Months Financial Review Net sales increased 15% and 11% year-over-year to $82.7 million and $228.0 million in the third quarter and first nine months of 2020, respectively. Growth across both periods was driven primarily by higher volumes of dual-interface EMV® card sales, including Second Wave cards. In addition, net sales increased from CPI On-Demand card personalization due to new customer wins, higher volumes from our existing customers and from COVID-19 related government disbursement work. This growth was partially offset by COVID-19 impacts, including reduced sales volumes in Prepaid due to lower retail store traffic and reduced volumes in card personalization stemming from fewer new accounts and requests for replacement cards. Card@Once product sales were also impacted by COVID-19 due to reduced hours of operation and lack of access or closure of certain bank branches. 5 Q3 2020 | $25.4 $30.6 35.4% 37.0% Q3 2019 Q3 2020 GROSS PROFIT & MARGIN ($ in millions) For the third quarter and first nine months of 2020 gross profit increased 21% and 15% year-over-year, respectively. This increase was driven primarily by higher sales volumes of dual-interface EMV® cards, including Second Wave cards, higher sales from CPI On-Demand card personalization and COVID-19 related government disbursement work. Gross profit margins increased to 37.0% in the third quarter of 2020, compared to 35.4% in the prior year period primarily due to operating leverage from higher dual- interface card sales and CPI On-Demand net sales. Gross profit margins expanded to 34.8% from 33.7% in the first nine months of 2020, primarily due to the same reasons described above. $69.1 $79.3 33.7% 34.8% YTD 2019 YTD 2020 EMV® is a registered trademark in the U.S. and other countries and an unregistered trademark elsewhere. The EMV trademark is owned by EMVCo, LLC . |
| Q3 2020 | 6 Third Quarter and First Nine Months Financial Review $7.7 $13.5 10.8% 16.3% Q3 2019 Q3 2020 INCOME FROM OPERATIONS & OPERATING MARGIN ($ in millions) $21.1 $26.0 10.2% 11.4% YTD 2019 YTD 2020 Third quarter and first nine months 2020 income from operations was $13.5 million and $26.0 million, respectively. Impacting year-over-year comparisons, the Company recorded a cash litigation settlement gain in the second quarter of 2019. Excluding this item, income from operations increased 72% year-over- year for the first nine months to $26.0 million, and operating margins expanded 410 basis points2. Improvement for both periods is primarily due to growth in net sales in the Debit and Credit segment and operating efficiency gains, partially offset by unfavorable cost absorption in our Prepaid Debit segment. $7.7 $13.5 10.8% 16.3% Q3 2019 Q3 2020 $15.1 $26.0 7.3% 11.4% YTD 2019 YTD 2020 AS REPORTED AS ADJUSTED2 2 Income from Operations As Adjusted and Operating Margin As Adjusted are not measurements of financial performance prepared in accordance with GAAP. Income from Operations As Adjusted and Operating Margin As Adjusted for the periods shown above exclude the cash litigation settlement gain recorded in the quarter ended June 30, 2019. See “Non-GAAP Financial Measures” at the end of this document for more information and reconciliations to the most directly comparable GAAP financial measures. |
| $(0.7) $5.8 Q3 2019 Q3 2020 Third Quarter and First Nine Months Financial Review Net income was $5.8 million and $8.8 million for the third quarter and first nine months of 2020, respectively. The change in the third quarter was primarily due to higher net sales and gross profit in the Debit and Credit segment, and lower operating expenses. The increase for the first nine months of 2020 was primarily due to higher net sales and gross profit and an income tax benefit versus income tax expense during the prior year, partially offset by the cash litigation settlement gain recorded in the prior year. 7 NET INCOME (LOSS) ($ in millions) $(2.7) $8.8 YTD 2019 YTD 2020 Q3 2020 | $12.3 $17.5 17.1% 21.1% Q3 2019 Q3 2020 ADJUSTED EBITDA & ADJUSTED EBITDA MARGIN3 ($ in millions) $28.8 $40.0 14.0% 17.5% YTD 2019 YTD 2020 Adjusted EBITDA increased 43% and 39% year-over-year to $17.5 million and $40.0 million, and Adjusted EBITDA margins expanded 400 basis points in the third quarter and 350 basis points in the first nine months year-over-year, respectively. The increases are primarily due to year-over-year growth in net sales driving operating leverage as well as ongoing efficiency initiatives, which included restructuring initiatives in the first nine months of 2020. Partially offsetting these increases was lower EBITDA within our Prepaid Debit segment. 3 Adjusted EBITDA and Adjusted EBITDA margins are not measurements of financial performance prepared in accordance with GAAP. Adjusted EBITDA for the periods shown above exclude the $6.0 million cash litigation settlement gain recorded in the quarter ended June 30, 2019. See “Non-GAAP Financial Measures” at the end of this document for more information and reconciliations to the most directly comparable GAAP financial measures. |
| Debit and Credit Segment Segment Performance 8 Third quarter net sales for the Debit and Credit segment increased 22% to $62.7 million year-over-year primarily due to higher volumes of dual-interface EMV® card sales, including Second Wave cards featuring a core made with recovered ocean bound plastic. In addition, net sales increased from CPI On- Demand card personalization due to new customer wins and higher volumes from our existing customers, and from COVID-19 related government disbursement work. Dual-interface EMV® cards have additional technology to process contactless transactions and generally have a higher selling price than contact-only EMV® cards, which benefitted the current year sales increase compared to the prior year period. Partially offsetting these increases were reductions in volumes of Card@Once instant issuance product sales and card personalization sales in the third quarter of 2020. The decline in volumes was primarily as a result of ongoing impacts from COVID-19, including fewer new accounts, fewer requests for replacement cards and reduced hours of operation and lack of access or closure of certain bank branches. Operating margins for the period increased 670 basis points due to the higher net sales and a decrease in operating expenses. In the first nine months of 2020, net sales increased 19% to $180.9 million primarily due to the same reasons described above. Operating margins for the period increased 510 basis points due to higher net sales and a decrease in operating expenses. Q3 2020 | $151.5 $180.9 15.9% 21.0% YTD 2019 YTD 2020 $51.5 $62.7 16.8% 23.5% Q3 2019 Q3 2020 EMV® is a registered trademark in the U.S. and other countries and an unregistered trademark elsewhere. The EMV trademark is owned by EMVCo, LLC . NET SALES & OPERATING MARGIN ($ in millions) |
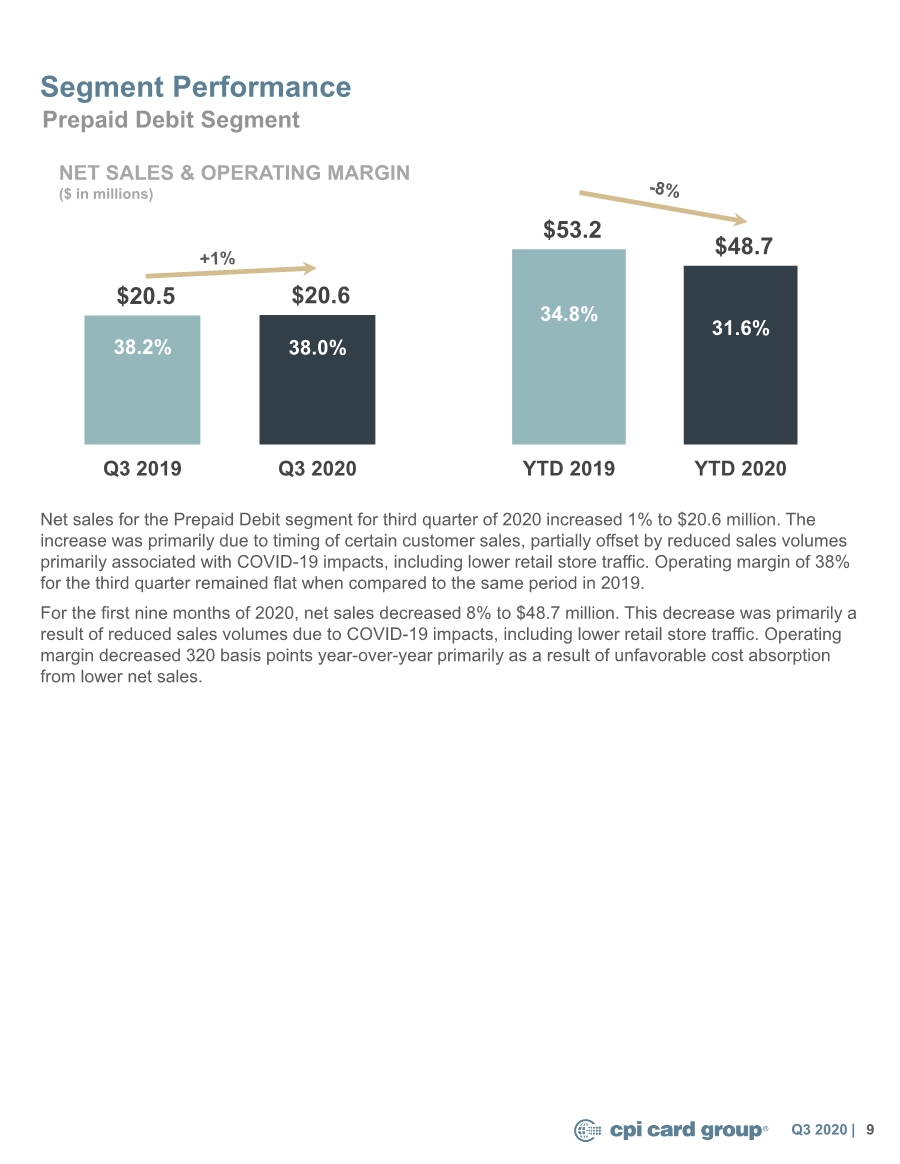
| Prepaid Debit Segment Segment Performance Net sales for the Prepaid Debit segment for third quarter of 2020 increased 1% to $20.6 million. The increase was primarily due to timing of certain customer sales, partially offset by reduced sales volumes primarily associated with COVID-19 impacts, including lower retail store traffic. Operating margin of 38% for the third quarter remained flat when compared to the same period in 2019. For the first nine months of 2020, net sales decreased 8% to $48.7 million. This decrease was primarily a result of reduced sales volumes due to COVID-19 impacts, including lower retail store traffic. Operating margin decreased 320 basis points year-over-year primarily as a result of unfavorable cost absorption from lower net sales. 9 Q3 2020 | $20.5 $20.6 38.2% 38.0% Q3 2019 Q3 2020 $53.2 $48.7 34.8% 31.6% YTD 2019 YTD 2020 NET SALES & OPERATING MARGIN ($ in millions) |
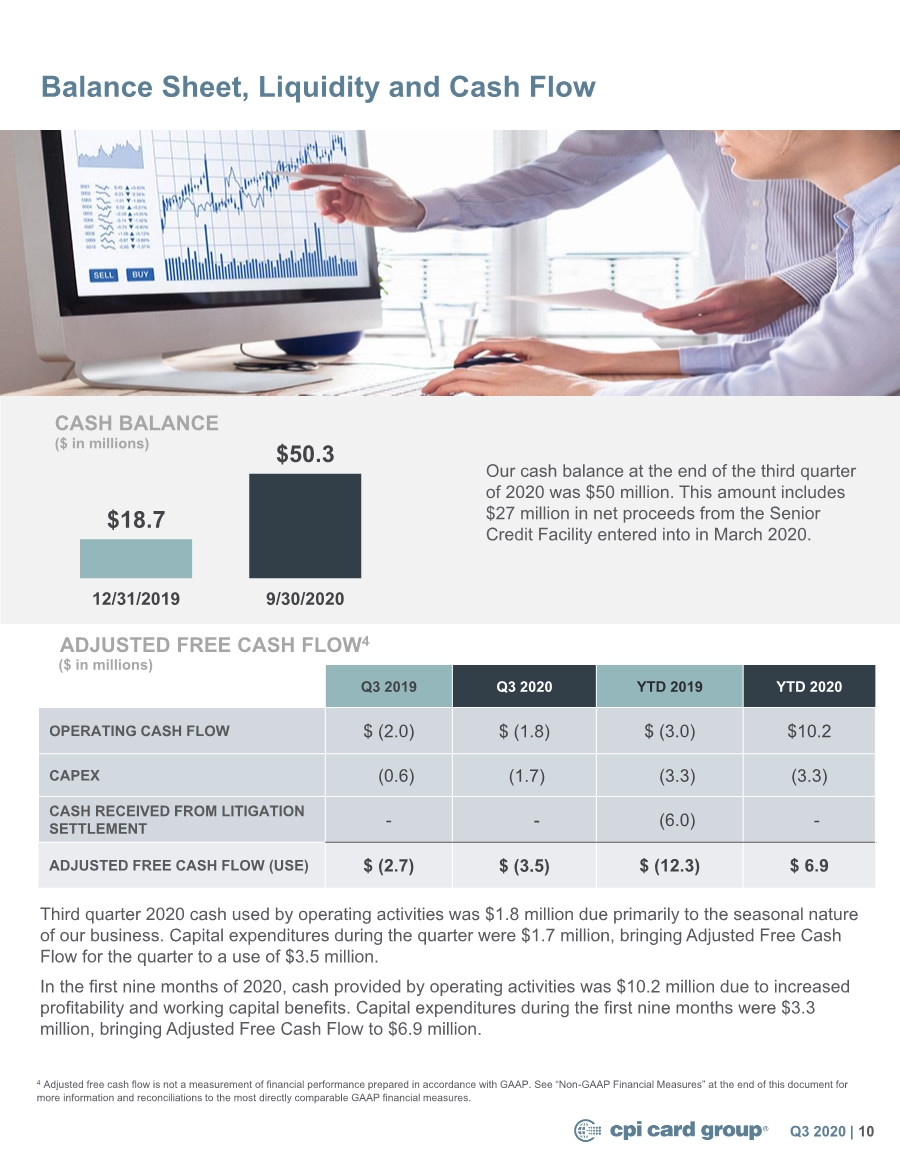
| Balance Sheet, Liquidity and Cash Flow 10 Our cash balance at the end of the third quarter of 2020 was $50 million. This amount includes $27 million in net proceeds from the Senior Credit Facility entered into in March 2020. $18.7 $50.3 12/31/2019 9/30/2020 CASH BALANCE ($ in millions) Q3 2019 Q3 2020 YTD 2019 YTD 2020 OPERATING CASH FLOW $ (2.0) $ (1.8) $ (3.0) $10.2 CAPEX (0.6) (1.7) (3.3) (3.3) CASH RECEIVED FROM LITIGATION SETTLEMENT --(6.0) - ADJUSTED FREE CASH FLOW (USE) $ (2.7) $ (3.5) $ (12.3) $ 6.9 ADJUSTED FREE CASH FLOW4 Third quarter 2020 cash used by operating activities was $1.8 million due primarily to the seasonal nature of our business. Capital expenditures during the quarter were $1.7 million, bringing Adjusted Free Cash Flow for the quarter to a use of $3.5 million. In the first nine months of 2020, cash provided by operating activities was $10.2 million due to increased profitability and working capital benefits. Capital expenditures during the first nine months were $3.3 million, bringing Adjusted Free Cash Flow to $6.9 million. ($ in millions) 4 Adjusted free cash flow is not a measurement of financial performance prepared in accordance with GAAP. See “Non-GAAP Financial Measures” at the end of this document for more information and reconciliations to the most directly comparable GAAP financial measures. Q3 2020 | |
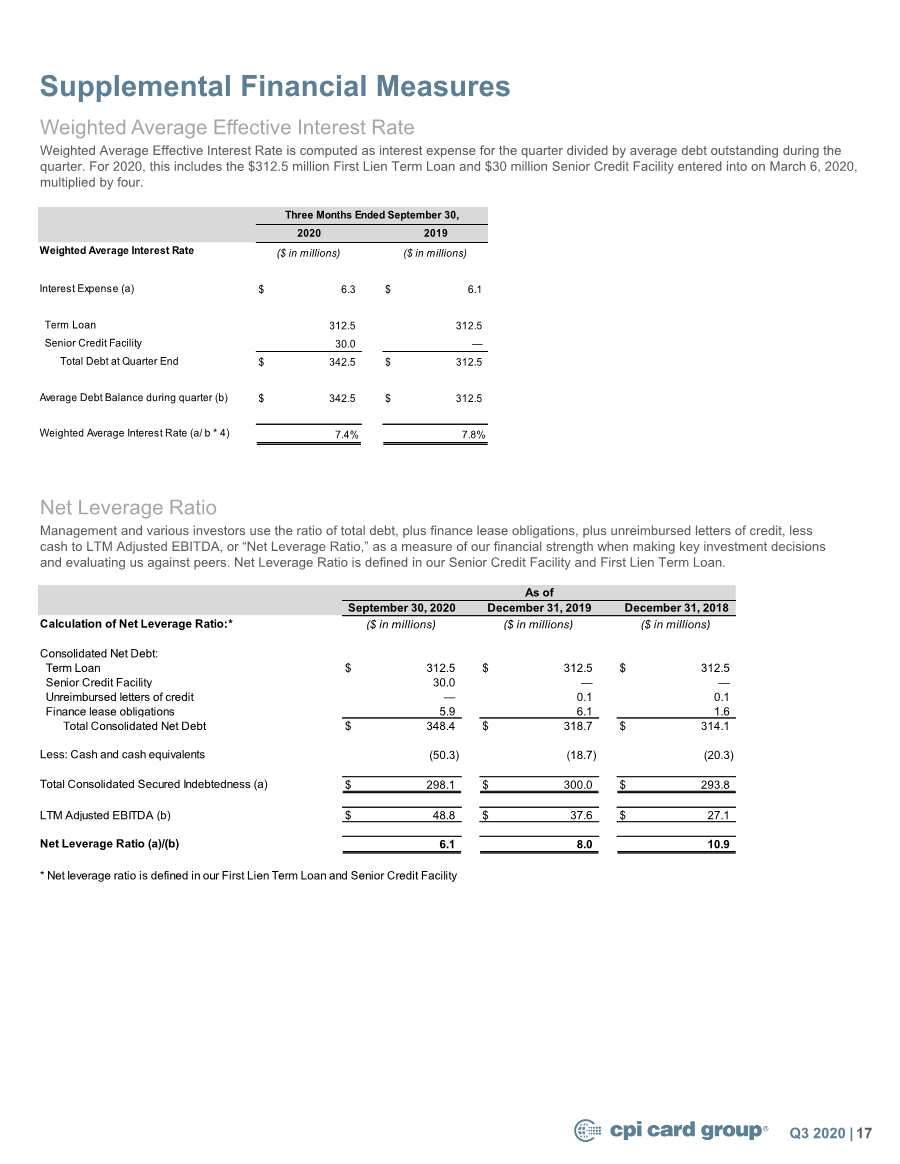
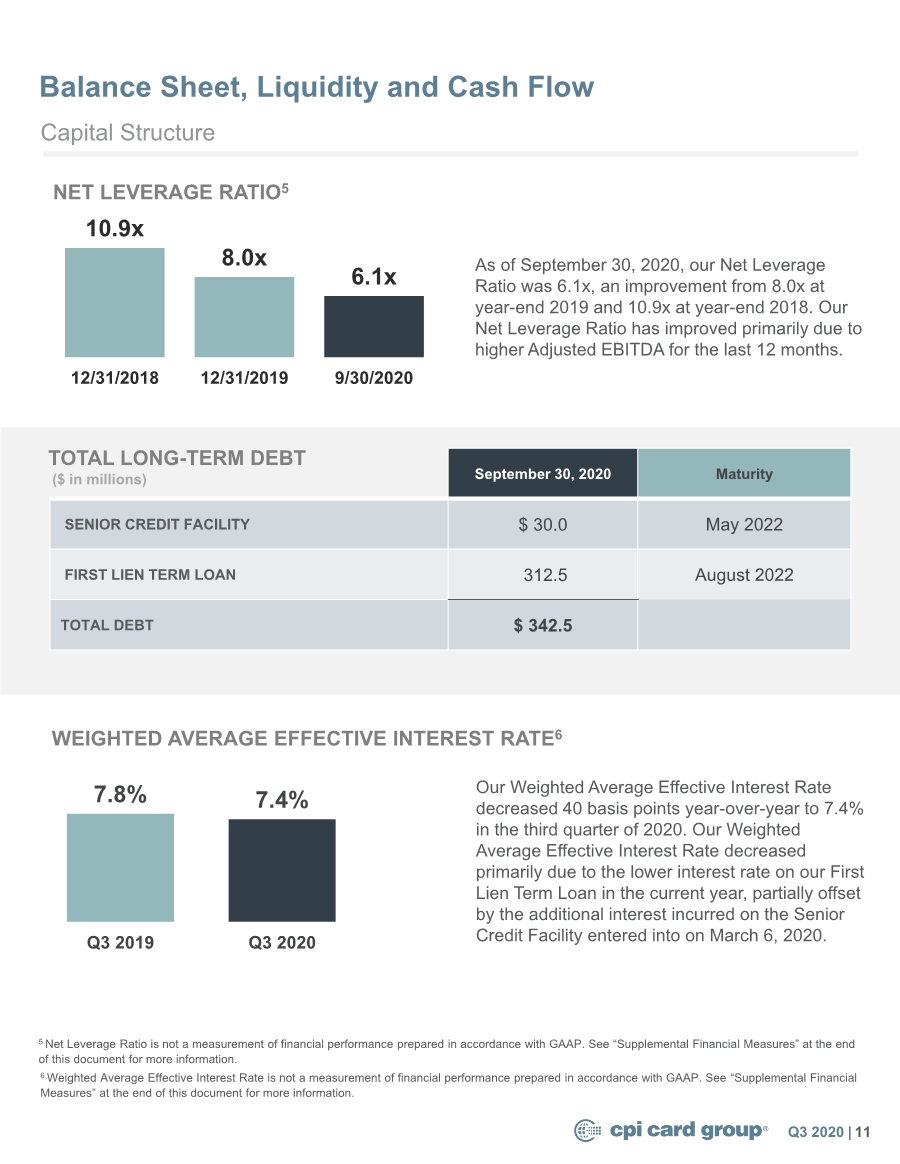
| Balance Sheet, Liquidity and Cash Flow 11 September 30, 2020 Maturity SENIOR CREDIT FACILITY $ 30.0 May 2022 FIRST LIEN TERM LOAN 312.5 August 2022 TOTAL DEBT $ 342.5 TOTAL LONG-TERM DEBT 10.9x 8.0x 6.1x 12/31/2018 12/31/2019 9/30/2020 NET LEVERAGE RATIO5 5 Net Leverage Ratio is not a measurement of financial performance prepared in accordance with GAAP. See “Supplemental Financial Measures” at the end of this document for more information. As of September 30, 2020, our Net Leverage Ratio was 6.1x, an improvement from 8.0x at year-end 2019 and 10.9x at year-end 2018. Our Net Leverage Ratio has improved primarily due to higher Adjusted EBITDA for the last 12 months. WEIGHTED AVERAGE EFFECTIVE INTEREST RATE6 Our Weighted Average Effective Interest Rate decreased 40 basis points year-over-year to 7.4% in the third quarter of 2020. Our Weighted Average Effective Interest Rate decreased primarily due to the lower interest rate on our First Lien Term Loan in the current year, partially offset by the additional interest incurred on the Senior Credit Facility entered into on March 6, 2020. Capital Structure ($ in millions) Q3 2020 | 6 Weighted Average Effective Interest Rate is not a measurement of financial performance prepared in accordance with GAAP. See “Supplemental Financial Measures” at the end of this document for more information. 7.8% 7.4% Q3 2019 Q3 2020 |
| 12 Summary We are proud of the way our organization has demonstrated an unwavering commitment to the health and safety of our employees while exhibiting extraordinary agility to continue to support our customers. We aim to scale our solutions, diversify our offerings and expand our customer base through continued execution of our strategies. Our goals remain focused on leveraging and building upon the market- leading and innovative solutions CPI is known for, including dual-interface secure cards, more eco- focused solutions, SaaS-based instant issuance, personalization and prepaid solutions. As we enter the final months of 2020 and look ahead to next year, we aim to capitalize on the successes we’ve had, scaling and growing through continued focus on our four strategic priorities and continued innovation. We believe we are well-equipped to continue this next stage of growth as we build upon our position as a partner of choice. We look forward to updating you on our progress. Q3 2020 | |

| Certain statements and information in this document (as well as information included in our other written or oral statements we make from time to time) may contain or constitute “forward-looking statements” within the meaning of the Private Securities Litigation Reform Act of 1995, Section 27A of the Securities Act of 1933, as amended and Section 21E of the Securities Exchange Act of 1934, as amended. The words “believe,” “estimate,” “project,” “expect,” “anticipate,” “plan,” “intend,” “foresee,” “should,” “would,” “could,” “guides,” “provides guidance,” “provides outlook,” or other similar expressions are intended to identify forward-looking statements, which are not historical in nature. These forward-looking statements are based on our current expectations and beliefs concerning future developments and their potential effect on us, and other information currently available. Such forward-looking statements, because they relate to future events, are by their very nature subject to many important risks and uncertainties that could cause actual results or other events to differ materially from those contemplated. These risks and uncertainties include, but are not limited to: the potential effects of COVID-19 on our business, including our supply-chain, customer demand, workforce, operations and ability to comply with certain covenants in our credit facilities; a decline in U.S. and global market and economic conditions and resulting decreases in consumer and business spending; our lack of eligibility to participate in government relief programs related to COVID-19 or inability to realize material benefits from such programs; our substantial indebtedness, including inability to make debt service payments or refinance such indebtedness; costs and impacts to our financial results relating to the obligatory collection of sales tax and claims for uncollected sales tax in states that impose sales tax collection requirements on out-of-state businesses, and challenges to our income tax positions; the restrictive terms of our credit facilities and covenants of future agreements governing indebtedness and the resulting restraints on our ability to pursue our business strategies; our limited ability to raise capital in the future; system security risks, data protection breaches and cyber-attacks; failure to comply with regulations, customer contractual requirements and evolving industry standards regarding consumer privacy and data use and security, including with respect to possible exposure to litigation and/or regulatory penalties under applicable data privacy and other laws for failure to so comply; interruptions in our operations, including our IT systems, or in the operations of the third parties that operate the data centers or computing infrastructure on which we rely; disruptions in production at one or more of our facilities; our inability to adequately protect our trade secrets and intellectual property rights from misappropriation or infringement, claims that our technology is infringing on the intellectual property of others, and risks related to open source software; defects in our software; problems in production quality, materials and process; a disruption or other failure in our supply chain; our failure to retain our existing customers or identify and attract new customers; a loss of market share or a decline in profitability resulting from competition; our inability to recruit, retain and develop qualified personnel, including key personnel; our inability to sell, exit, reconfigure or consolidate businesses or facilities that no longer meet with our strategy; our inability to develop, introduce and commercialize new products; the effect of legal and regulatory proceedings; failure to meet the continued listing standards of the Toronto Stock Exchange or the rules of the OTCQX® Best Market; a continued decrease in the value of our common stock combined with our common stock no longer being traded on a United States national securities exchange, which may prevent investors or potential investors from investing or achieving a meaningful degree of liquidity; developing technologies that make our existing technology solutions and products obsolete or less relevant or a failure to introduce new products and services in a timely manner; quarterly variation in our operating results; our inability to realize the full value of our long-lived assets; our failure to operate our business in accordance with the Payment Card Industry (“PCI”) Security Standards Council security standards or other industry standards; costs relating to product defects and any related product liability and/or warranty claims; maintenance and further imposition of tariffs and/or trade restrictions on, or slow-downs or interruptions in our ability to obtain, goods imported into the United States; our dependence on licensing arrangements; risks associated with international operations; non-compliance with, and changes in, laws in the United States and in foreign jurisdictions in which we operate and sell our products; our ability to comply with a wide variety of environmental, health and safety laws and regulations and the exposure to liability for any failure to comply; risks associated with the controlling stockholders’ ownership of our stock; potential conflicts of interest that may arise due to our board of directors being comprised in part of directors who are principals of our largest stockholder; and other risks that are described in Part I, Item 1A – Risk Factors in our Annual Report on Form 10-K for the year ended December 31, 2019 filed with the Securities and Exchange Commission (the “SEC”) on March 6, 2020, Part II, Item 1A – Risk Factors in our Quarterly Report on Form 10-Q for the quarter ended September 30, 2020, and our other reports filed from time to time with the SEC. We caution and advise readers not to place undue reliance on forward-looking statements, which speak only as of the date hereof. These statements are based on assumptions that may not be realized and involve risks and uncertainties that could cause actual results to differ materially from the expectations and beliefs contained herein. We undertake no obligation to publicly update or revise any forward-looking statements after the date they are made, whether as a result of new information, future events or otherwise. Cautionary Statement on Forward-Looking Statements 13 Non-GAAP Financial Measures In addition to financial results reported in accordance with U.S. generally accepted accounting principles (“GAAP”), we have provided the following non-GAAP financial measures in this commentary, all reported on a continuing operations basis: EBITDA, Adjusted EBITDA, Adjusted EBITDA Margin, LTM Adjusted EBITDA, Net Leverage Ratio, Adjusted Free Cash Flow, Weighted Average Effective Interest Rate, Income from Operations excluding litigation settlement gain, and operating margin excluding litigation settlement gain. These non-GAAP financial measures are utilized by management in comparing our operating performance on a consistent basis between fiscal periods. We believe that these financial measures are appropriate to enhance an overall understanding of our underlying operating performance trends compared to historical and prospective periods and our peers. Management also believes that these measures are useful to investors in their analysis of our results of operations and provide improved comparability between fiscal periods. Non-GAAP financial measures should not be considered in isolation from, or as a substitute for, financial information calculated in accordance with GAAP. Our non-GAAP measures may be different from similarly titled measures of other companies. Investors are encouraged to review the reconciliation of these historical non-GAAP measures to their most directly comparable GAAP financial measures included herein. Additional information relating to certain financial measures, including our non-GAAP financial measures, is available in our most recent earnings release and on our website at http://investor.cpicardgroup.com. Q3 2020 | |
| Reconciliations of Non-GAAP Financial Measures 14 Adjusted EBITDA and Adjusted EBITDA Margin Adjusted EBITDA is presented on a continuing operations basis and is defined as EBITDA adjusted for litigation and related charges incurred in connection with certain patent and shareholder litigation; stock-based compensation expense; estimated sales tax expense, restructuring and other charges; loss on Revolving Credit Facility termination; foreign currency gain or loss; litigation settlement gain; and other items that are unusual in nature, infrequently occurring or not considered part of our core operations. Adjusted EBITDA is also a defined computation in our First Lien Term Loan and Senior Credit Facility agreements, which generally conforms to the definition above, and impacts certain credit measures and covenants, including a covenant requiring the Company to have at least $25 million Adjusted EBITDA (as defined in our Senior Credit Facility) for the previous four consecutive fiscal quarters in total at the end of each quarterly period ending on or after March 31, 2020. Adjusted EBITDA is intended to show our unleveraged, pre-tax operating results and therefore reflects our financial performance based on operational factors, excluding non-operational, unusual or non-recurring losses or gains. Adjusted EBITDA has important limitations as an analytical tool, and you should not consider it in isolation, or as a substitute for, analysis of our results as reported under GAAP. For example, Adjusted EBITDA does not reflect: (a) our capital expenditures, future requirements for capital expenditures or contractual commitments; (b) changes in, or cash requirements for, our working capital needs; (c) the significant interest expenses or the cash requirements necessary to service interest or principal payments on our debt; (d) tax payments that represent a reduction in cash available to us; (e) any cash requirements for the assets being depreciated and amortized that may have to be replaced in the future; (f) the impact of earnings or charges resulting from matters that we and the lenders under our credit agreement may not consider indicative of our ongoing operations; or (g) the impact of any discontinued operations. In particular, our definition of Adjusted EBITDA allows us to add back certain non-operating, unusual or non-recurring charges that are deducted in calculating net (loss) income, even though these are expenses that may recur, vary greatly and are difficult to predict and can represent the effect of long-term strategies as opposed to short-term results. In addition, certain of these expenses represent the reduction of cash that could be used for other purposes. Further, although not included in the calculation of Adjusted EBITDA presented in this commentary, the measure as defined in our credit facilities may at times allow us to add estimated cost savings and operating synergies related to operational changes ranging from acquisitions to dispositions to restructurings and/or exclude one- time transition expenditures that we anticipate we will need to incur to realize cost savings before such savings have occurred. EBITDA EBITDA represents earnings before interest, taxes, depreciation and amortization, all on a continuing operations basis. EBITDA is presented because it is an important supplemental measure of performance, and it is frequently used by analysts, investors and other interested parties in the evaluation of companies in our industry. EBITDA is also presented and compared by analysts and investors in evaluating our ability to meet debt service obligations. Other companies in our industry may calculate EBITDA differently. EBITDA is not a measurement of financial performance under GAAP and should not be considered as an alternative to cash flow from operating activities or as a measure of liquidity or an alternative to net (loss) income or net (loss) income from continuing operations as indicators of operating performance or any other measures of performance derived in accordance with GAAP. Because EBITDA is calculated before recurring cash charges, including interest expense and taxes, and is not adjusted for capital expenditures or other recurring cash requirements of the business, it should not be considered as a measure of discretionary cash available to invest in the growth of the business. Q3 2020 | Reconciliation of net income (loss) from continuing operations to EBITDA and Adjusted EBITDA: Net income (loss) from continuing operations $ 5.8 $ (0.6) $ 8.9 $ (2.7) Interest expense, net 6.3 6.1 19.2 18.8 Income tax expense (benefit) 1.4 2.3 (2.2) 3.6 Depreciation and amortization (2) 4.0 4.3 12.4 12.9 EBITDA $ 17.5 $ 12.0 $ 38.3 $ 32.7 Adjustments to EBITDA: Litigation and related charges (1) — — — — Stock-based compensation expense — — 0.1 0.3 Sales tax expense (2) — 0.2 0.3 0.4 Restructuring and other charges (3) — — 1.2 — Loss on Revolving Credit Facility termination (4) — — 0.1 — Litigation settlement gain (5) — — — (6.0) Foreign currency loss (6) — 0.1 — 1.3 Subtotal of adjustments to EBITDA $ — $ 0.3 $ 1.7 $ (3.9) Adjusted EBITDA - continuing operations $ 17.5 $ 12.3 $ 40.0 $ 28.8 Adjusted EBITDA margin (% of net sales) 21.1% 17.1% 17.5% 14.0% Adjusted EBITDA growth (% change 2020 vs 2019) 42.7% 39.1% Net income (loss) (% change 2020 vs 2019) 424.9% 984.2% Three Months Ended September 30, 2020 2019 ($ in millions) Nine Months Ended September 30, 2020 2019 ($ in millions) |
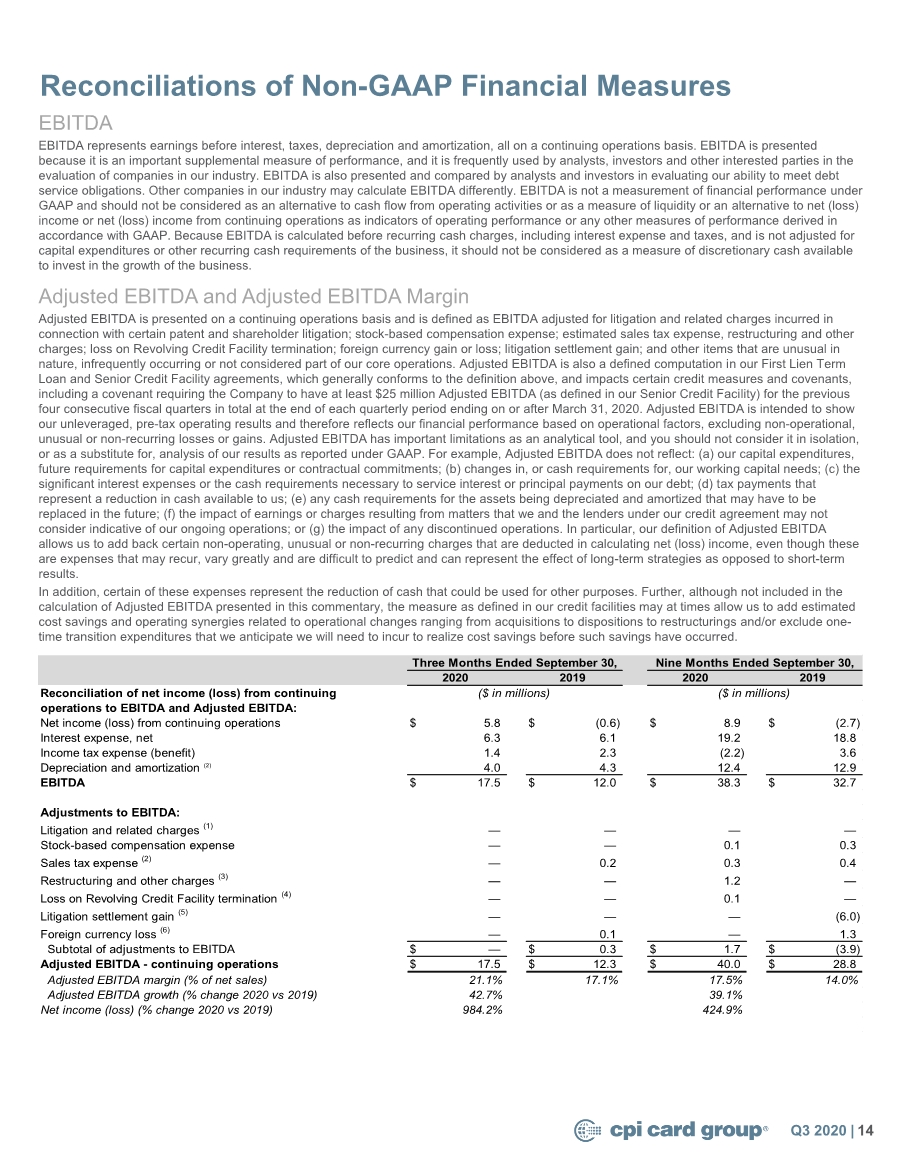
| 15 Reconciliations of Non-GAAP Financial Measures LTM Adjusted EBITDA We define LTM Adjusted EBITDA as Adjusted EBITDA (defined previously) for the last twelve months. Q3 2020 | Adjusted Free Cash Flow We define Adjusted Free Cash Flow as cash flow from continuing operations less capital expenditures from continuing operations, adjusted for cash received from a litigation settlement gain in the second quarter of 2019. We use this metric in analyzing our ability to service and repay our debt. However, this measure does not represent funds available for investment or other discretionary uses since it does not deduct cash used to service our debt, nor does it reflect the cash impacts of our discontinued operations. Reconciliation of cash provided by (used in) operating activities - continuing operations (GAAP) to Adjusted Free Cash Flow: Cash provided by (used in) operating activities - continuing operations $ (1.8) $ (2.0) $ 10.2 $ (3.0) Acquisitions of plant, equipment and leasehold improvements (1.7) (0.6) (3.3) (3.3) Cash received from litigation settlement gain (5) — — — (6.0) Adjusted Free Cash Flow (use) - continuing operations $ (3.5) $ (2.7) $ 6.9 $ (12.3) Three Months Ended September 30, 2020 2019 ($ in millions) Nine Months Ended September 30, 2020 2019 ($ in millions) Reconciliation of net income from continuing operations to LTM EBITDA and Adjusted EBITDA Net income/(loss) from continuing operations $ 7.1 $ (5.0) $ (15.5) Interest expense, net 25.2 24.9 23.4 Income tax expense/(benefit) (2.8) 3.5 (4.5) Depreciation and amortization (2) 16.7 17.3 18.6 EBITDA $ 46.2 $ 40.6 $ 22.0 Adjustments to EBITDA: Litigation and related charges (1) $ — $ — $ 1.0 Stock-based compensation expense — 0.3 1.0 Sales tax expense (2) 0.5 0.6 0.7 Restructuring and other charges (3) 1.9 0.7 2.1 Loss on Revolving Credit Facility termination (4) 0.1 — — Litigation settlement gain (5) — (6.0) — Foreign currency loss (6) — 1.3 0.3 Subtotal of adjustments to EBITDA $ 2.6 $ (3.1) $ 5.0 LTM Adjusted EBITDA - continuing operations $ 48.8 $ 37.6 $ 27.1 Twelve Months Ended September 30, 2020 December 31, 2019 December 31, 2018 ($ in millions) ($ in millions) ($ in millions) |
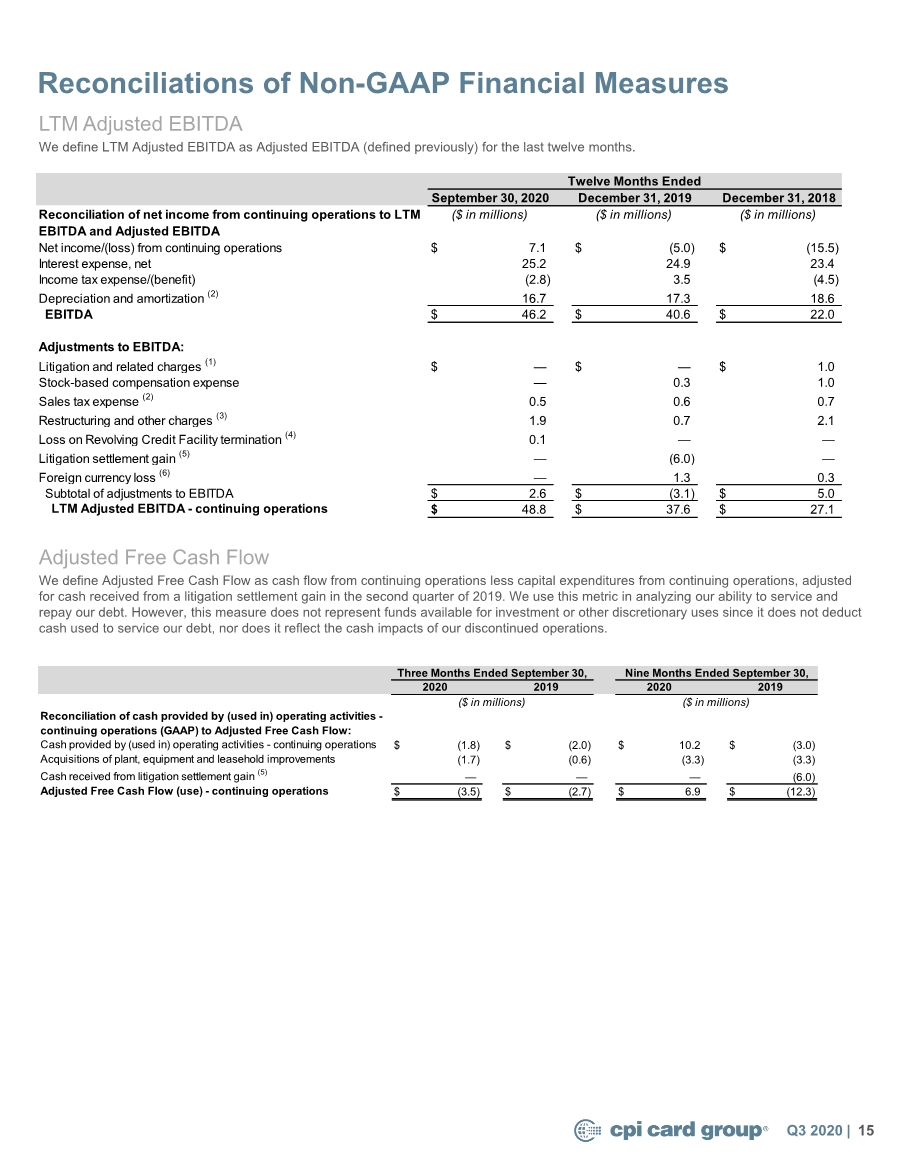
| Reconciliations of Non-GAAP Financial Measures 16 Q3 2020 | Footnotes to Non-GAAP Financial Measures Tables: (1) Represents net legal costs incurred with certain patent and shareholder litigation. (2) The Company revised its prior period financial statements to adjust immaterial items, primarily due to estimated sales tax expense relating to 2017 to 2020. Refer to Note 1 of the Form 10-Q for the quarter ended September 30, 2020 for an explanation of the immaterial prior period adjustments. (3) Represents restructuring severance charges in 2020. (4) The Company terminated the Revolving Credit Facility during the first quarter of 2020 and expensed the remaining unamortized deferred financing costs. (5) During the second quarter of 2019, the Company recognized in operating income a $6.0 million gain related to the cash settlement of litigation. (6) Foreign currency loss includes the release of the cumulative translation adjustment from the balance sheet to the statement of operations, done in connection with the disposition of the Company’s Canadian subsidiary during the first nine months of 2019. Income from Operations and Operating Margin Excluding $6.0 Million Cash Litigation Settlement Gain Income from Operations and Operating Margin excluding the $6.0 million cash litigation settlement gain are not non-GAAP financial measures utilized by management in comparing our operating performance on a consistent basis between fiscal periods. We believe that this financial measure is appropriate to enhance an overall understanding of our underlying operating performance trends compared to historical and prospective periods and our peers. Reconciliation of Income from Operations excluding litigation settlement gain: Income from operations $ 13.5 $ 7.7 $ 26.0 $ 21.1 Less: Litigation settlement gain (5) — — — (6.0) Income from Operations excluding litigation settlement gain $ 13.5 $ 7.7 $ 26.0 $ 15.1 Net sales $ 82.7 $ 71.7 $ 228.0 $ 205.4 Operating margin excluding litigation settlement gain (% of net sales) 16.3% 10.8% 11.4% 7.3% Operating margin excluding litigation settlement gain (% change 2020 vs 2019) 74% 72% ($ in millions) ($ in millions) ($ in millions) ($ in millions) Three Months Ended September 30, Nine Months Ended September 30, 2020 2019 2020 2019 |
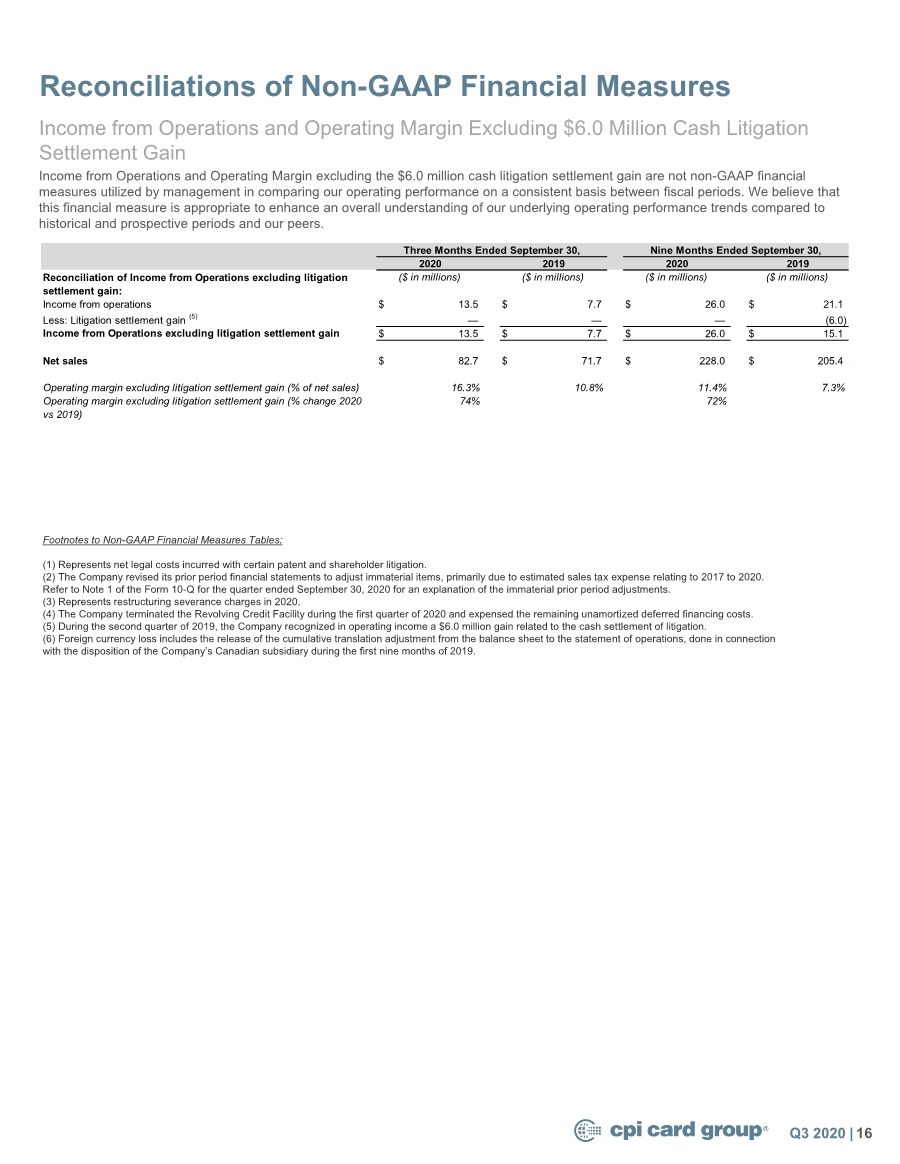
| Supplemental Financial Measures 17 Weighted Average Effective Interest Rate Weighted Average Effective Interest Rate is computed as interest expense for the quarter divided by average debt outstanding during the quarter. For 2020, this includes the $312.5 million First Lien Term Loan and $30 million Senior Credit Facility entered into on March 6, 2020, multiplied by four. Q3 2020 | Net Leverage Ratio Management and various investors use the ratio of total debt, plus finance lease obligations, plus unreimbursed letters of credit, less cash to LTM Adjusted EBITDA, or “Net Leverage Ratio,” as a measure of our financial strength when making key investment decisions and evaluating us against peers. Net Leverage Ratio is defined in our Senior Credit Facility and First Lien Term Loan. Weighted Average Interest Rate Interest Expense (a) $ 6.3 $ 6.1 Term Loan 312.5 312.5 Senior Credit Facility 30.0 — Total Debt at Quarter End $ 342.5 $ 312.5 Average Debt Balance during quarter (b) $ 342.5 $ 312.5 Weighted Average Interest Rate (a/ b * 4) 7.4% 7.8% Three Months Ended September 30, ($ in millions) ($ in millions) 2020 2019 Calculation of Net Leverage Ratio:* Consolidated Net Debt: Term Loan $ 312.5 $ 312.5 $ 312.5 Senior Credit Facility 30.0 — — Unreimbursed letters of credit — 0.1 0.1 Finance lease obligations 5.9 6.1 1.6 Total Consolidated Net Debt $ 348.4 $ 318.7 $ 314.1 Less: Cash and cash equivalents (50.3) (18.7) (20.3) Total Consolidated Secured Indebtedness (a) $ 298.1 $ 300.0 $ 293.8 LTM Adjusted EBITDA (b) $ 48.8 $ 37.6 $ 27.1 Net Leverage Ratio (a)/(b) 6.1 8.0 10.9 * Net leverage ratio is defined in our First Lien Term Loan and Senior Credit Facility December 31, 2018 ($ in millions) September 30, 2020 ($ in millions) As of December 31, 2019 ($ in millions) |