
PNC 8-K
Pnc Financial Services Group, Inc. (PNC)
8-K
2020-04-15
For: 2020-04-15
View Original
Added on
April 11, 2026
UNITED STATES
SECURITIES AND EXCHANGE COMMISSION
Washington, D.C. 20549
FORM 8-K
CURRENT REPORT
Pursuant to Section 13 OR 15(d) of The Securities Exchange Act of 1934
Date of Report (Date of earliest event reported)
THE PNC FINANCIAL SERVICES GROUP, INC.
(Exact name of registrant as specified in its charter)
Commission File Number 001-09718
(State or other jurisdiction of | (I.R.S. Employer |
incorporation) | Identification No.) |
The Tower at PNC Plaza
(Address of principal executive offices, including zip code)
(888 ) 762-2265
(Registrant’s telephone number, including area code)
Not Applicable
(Former name or former address, if changed since last report)
Check the appropriate box below if the Form 8-K filing is intended to simultaneously satisfy the filing obligation of the registrant under any of the following provisions:
Written communications pursuant to Rule 425 under the Securities Act (17 CFR 230.425) | |
Soliciting material pursuant to Rule 14a-12 under the Exchange Act (17 CFR 240.14a-12) | |
Pre-commencement communications pursuant to Rule 14d-2(b) under the Exchange Act (17 CFR 240.14d-2(b)) | |
Pre-commencement communications pursuant to Rule 13e-4(c) under the Exchange Act (17 CFR 240.13e-4(c)) | |
Securities registered pursuant to 12(b) of the Act:
Title of Each Class | Trading Symbol(s) | Name of Each Exchange on Which Registered |
Floating Rate Non-Cumulative Perpetual Preferred Stock, Series P | ||
Non-Cumulative Perpetual Preferred Stock, Series Q | ||
Indicate by check mark whether the registrant is an emerging growth company as defined in Rule 405 of the Securities Act of 1933 (§230.405 of this chapter) or Rule 12b-2 of the Securities Exchange Act of 1934 (§240.12b-2 of this chapter). Emerging growth company ☐
If an emerging growth company, indicate by check mark if the registrant has elected not to use the extended transition period for complying with any new or revised financial accounting standards provided pursuant to Section 13(a) of the Exchange Act. ☐
Item 2.02 Results of Operations and Financial Condition.
On April 15, 2020 , The PNC Financial Services Group, Inc. (“the Corporation”) issued a press release regarding the Corporation’s earnings and business results for the first quarter of 2020. In connection therewith, the Corporation provided supplementary financial information on its web site. A copy of the Corporation’s supplementary financial information is included in this Report as Exhibit 99.1 and is furnished herewith.
Item 8.01 Other Events
On April 15, 2020 , the Corporation held a conference call for investors regarding the Corporation’s earnings and business results for the first quarter of 2020. The Corporation provided electronic presentation slides on its web site used in connection with the related investor conference call. Copies of the electronic presentation slides are included in this Report as Exhibit 99.2 and are furnished herewith.
Item 9.01 Financial Statements and Exhibits.
(d) Exhibits.
Number | Description | Method of Filing |
99.1 | Furnished herewith | |
99.2 | Furnished herewith | |
104 | The cover page of this Current Report on Form 8-K, formatted in Inline XBRL. | |
- 2 -
SIGNATURE
Pursuant to the requirements of the Securities Exchange Act of 1934, the registrant has duly caused this report to be signed on its behalf by the undersigned hereunto duly authorized.
THE PNC FINANCIAL SERVICES GROUP, INC. (Registrant) | |||
Date: | April 15, 2020 | By: | /s/ Gregory H. Kozich |
Gregory H. Kozich | |||
Senior Vice President and Controller | |||
- 3 -
Exhibit 99.1

THE PNC FINANCIAL SERVICES GROUP, INC.
FINANCIAL SUPPLEMENT
FIRST QUARTER 2020
(Unaudited)
THE PNC FINANCIAL SERVICES GROUP, INC.
FINANCIAL SUPPLEMENT
FIRST QUARTER 2020
(UNAUDITED)
The information contained in this Financial Supplement is preliminary, unaudited and based on data available on April 15, 2020. We have reclassified certain prior period amounts to be consistent with the current period presentation, which we believe is more meaningful to readers of our consolidated financial statements. This information speaks only as of the particular date or dates included in the schedules. We do not undertake any obligation to, and disclaim any duty to, correct or update any of the information provided in this Financial Supplement. Our future financial performance is subject to risks and uncertainties as described in our United States Securities and Exchange Commission (SEC) filings.
BUSINESS
PNC is one of the largest diversified financial services companies in the United States and is headquartered in Pittsburgh, Pennsylvania. PNC has businesses engaged in retail banking, including residential mortgage, corporate and institutional banking and asset management, providing many of its products and services nationally. PNC's retail branch network is located primarily in markets across the Mid-Atlantic, Midwest and Southeast. PNC also has strategic international offices in four countries outside the U.S.
THE PNC FINANCIAL SERVICES GROUP, INC. | Page 1 | |
Table 1: Consolidated Income Statement (Unaudited)
Three months ended | |||||||||||||||||||
March 31 | December 31 | September 30 | June 30 | March 31 | |||||||||||||||
In millions, except per share data | 2020 | 2019 | 2019 | 2019 | 2019 | ||||||||||||||
Interest Income | |||||||||||||||||||
Loans | $ | 2,480 | $ | 2,573 | $ | 2,678 | $ | 2,672 | $ | 2,602 | |||||||||
Investment securities | 582 | 560 | 617 | 629 | 620 | ||||||||||||||
Other | 138 | 201 | 208 | 196 | 206 | ||||||||||||||
Total interest income | 3,200 | 3,334 | 3,503 | 3,497 | 3,428 | ||||||||||||||
Interest Expense | |||||||||||||||||||
Deposits | 375 | 468 | 531 | 515 | 472 | ||||||||||||||
Borrowed funds | 314 | 378 | 468 | 484 | 481 | ||||||||||||||
Total interest expense | 689 | 846 | 999 | 999 | 953 | ||||||||||||||
Net interest income | 2,511 | 2,488 | 2,504 | 2,498 | 2,475 | ||||||||||||||
Noninterest Income | |||||||||||||||||||
Asset management | 382 | 504 | 464 | 445 | 437 | ||||||||||||||
Consumer services | 377 | 390 | 402 | 392 | 371 | ||||||||||||||
Corporate services | 526 | 499 | 469 | 484 | 462 | ||||||||||||||
Residential mortgage | 210 | 87 | 134 | 82 | 65 | ||||||||||||||
Service charges on deposits | 168 | 185 | 178 | 171 | 168 | ||||||||||||||
Other (a) | 343 | 456 | 342 | 367 | 308 | ||||||||||||||
Total noninterest income | 2,006 | 2,121 | 1,989 | 1,941 | 1,811 | ||||||||||||||
Total revenue | 4,517 | 4,609 | 4,493 | 4,439 | 4,286 | ||||||||||||||
Provision For Credit Losses | 914 | 221 | 183 | 180 | 189 | ||||||||||||||
Noninterest Expense | |||||||||||||||||||
Personnel | 1,369 | 1,468 | 1,400 | 1,365 | 1,414 | ||||||||||||||
Occupancy | 207 | 201 | 206 | 212 | 215 | ||||||||||||||
Equipment | 287 | 348 | 291 | 298 | 273 | ||||||||||||||
Marketing | 58 | 77 | 76 | 83 | 65 | ||||||||||||||
Other | 622 | 668 | 650 | 653 | 611 | ||||||||||||||
Total noninterest expense | 2,543 | 2,762 | 2,623 | 2,611 | 2,578 | ||||||||||||||
Income before income taxes and noncontrolling interests | 1,060 | 1,626 | 1,687 | 1,648 | 1,519 | ||||||||||||||
Income taxes | 145 | 245 | 295 | 274 | 248 | ||||||||||||||
Net income | 915 | 1,381 | 1,392 | 1,374 | 1,271 | ||||||||||||||
Less: Net income attributable to noncontrolling interests | 7 | 14 | 13 | 12 | 10 | ||||||||||||||
Preferred stock dividends (b) | 63 | 55 | 63 | 55 | 63 | ||||||||||||||
Preferred stock discount accretion and redemptions | 1 | 1 | 1 | 1 | 1 | ||||||||||||||
Net income attributable to common shareholders | $ | 844 | $ | 1,311 | $ | 1,315 | $ | 1,306 | $ | 1,197 | |||||||||
Earnings Per Common Share | |||||||||||||||||||
Basic | $ | 1.96 | $ | 2.98 | $ | 2.95 | $ | 2.89 | $ | 2.62 | |||||||||
Diluted | $ | 1.95 | $ | 2.97 | $ | 2.94 | $ | 2.88 | $ | 2.61 | |||||||||
Average Common Shares Outstanding | |||||||||||||||||||
Basic | 429 | 437 | 444 | 451 | 455 | ||||||||||||||
Diluted | 430 | 438 | 445 | 452 | 456 | ||||||||||||||
Efficiency | 56 | % | 60 | % | 58 | % | 59 | % | 60 | % | |||||||||
Noninterest income to total revenue | 44 | % | 46 | % | 44 | % | 44 | % | 42 | % | |||||||||
Effective tax rate (c) | 13.7 | % | 15.1 | % | 17.5 | % | 16.6 | % | 16.3 | % | |||||||||
(a) | Includes net gains on sales of securities of $182 million, $12 million, $3 million, $20 million, and $13 million for the quarters ended March 31, 2020, December 31, 2019, September 30, 2019, June 30, 2019 and March 31, 2019, respectively. |
(b) | Dividends are payable quarterly other than Series O, Series R and Series S preferred stock, which are payable semiannually, with the Series O payable in different quarters than the Series R and Series S preferred stock. |
(c) | The effective income tax rates are generally lower than the statutory rate due to the relationship of pretax income to tax credits and earnings that are not subject to tax. |
THE PNC FINANCIAL SERVICES GROUP, INC. | Page 2 | |
Table 2: Consolidated Balance Sheet (Unaudited)
March 31 | December 31 | September 30 | June 30 | March 31 | |||||||||||||||
In millions, except par value | 2020 | 2019 | 2019 | 2019 | 2019 | ||||||||||||||
Assets | |||||||||||||||||||
Cash and due from banks | $ | 7,493 | $ | 5,061 | $ | 5,671 | $ | 5,416 | $ | 5,062 | |||||||||
Interest-earning deposits with banks (a) | 19,986 | 23,413 | 19,036 | 18,362 | 15,261 | ||||||||||||||
Loans held for sale (b) | 1,693 | 1,083 | 1,872 | 1,144 | 686 | ||||||||||||||
Investment securities – available for sale | 89,077 | 69,163 | 69,057 | 69,355 | 65,051 | ||||||||||||||
Investment securities – held to maturity (c) | 1,469 | 17,661 | 18,826 | 18,948 | 18,818 | ||||||||||||||
Loans (b) | 264,643 | 239,843 | 237,377 | 237,215 | 232,293 | ||||||||||||||
Allowance for credit losses - loans and leases (d) | (3,944 | ) | |||||||||||||||||
Allowance for loan and lease losses | (2,742 | ) | (2,738 | ) | (2,721 | ) | (2,692 | ) | |||||||||||
Net loans | 260,699 | 237,101 | 234,639 | 234,494 | 229,601 | ||||||||||||||
Equity investments (e) | 13,205 | 13,734 | 13,325 | 13,001 | 12,567 | ||||||||||||||
Mortgage servicing rights | 1,082 | 1,644 | 1,483 | 1,627 | 1,812 | ||||||||||||||
Goodwill | 9,233 | 9,233 | 9,233 | 9,221 | 9,218 | ||||||||||||||
Other (b) (c) | 41,556 | 32,202 | 35,774 | 34,193 | 34,761 | ||||||||||||||
Total assets | $ | 445,493 | $ | 410,295 | $ | 408,916 | $ | 405,761 | $ | 392,837 | |||||||||
Liabilities | |||||||||||||||||||
Deposits | |||||||||||||||||||
Noninterest-bearing | $ | 81,614 | $ | 72,779 | $ | 74,077 | $ | 69,867 | $ | 71,606 | |||||||||
Interest-bearing | 223,590 | 215,761 | 211,506 | 203,393 | 199,615 | ||||||||||||||
Total deposits | 305,204 | 288,540 | 285,583 | 273,260 | 271,221 | ||||||||||||||
Borrowed funds | |||||||||||||||||||
Federal Home Loan Bank borrowings | 23,491 | 16,341 | 21,901 | 29,376 | 20,501 | ||||||||||||||
Bank notes and senior debt | 31,438 | 29,010 | 27,148 | 27,694 | 25,598 | ||||||||||||||
Subordinated debt | 6,475 | 6,134 | 5,473 | 5,406 | 5,977 | ||||||||||||||
Other (b) | 11,995 | 8,778 | 6,832 | 6,549 | 7,784 | ||||||||||||||
Total borrowed funds | 73,399 | 60,263 | 61,354 | 69,025 | 59,860 | ||||||||||||||
Allowance for credit losses - off-balance sheet credit exposures (d) | 450 | ||||||||||||||||||
Allowance for unfunded loan commitments and letters of credit | 318 | 304 | 291 | 279 | |||||||||||||||
Accrued expenses and other liabilities | 17,150 | 11,831 | 12,220 | 13,804 | 12,902 | ||||||||||||||
Total liabilities | 396,203 | 360,952 | 359,461 | 356,380 | 344,262 | ||||||||||||||
Equity | |||||||||||||||||||
Preferred stock (f) | |||||||||||||||||||
Common stock - $5 par value | |||||||||||||||||||
Authorized 800 shares, issued 542 shares | 2,712 | 2,712 | 2,711 | 2,711 | 2,711 | ||||||||||||||
Capital surplus | 16,288 | 16,369 | 16,297 | 16,248 | 16,173 | ||||||||||||||
Retained earnings | 41,885 | 42,215 | 41,413 | 40,616 | 39,742 | ||||||||||||||
Accumulated other comprehensive income | 2,518 | 799 | 837 | 631 | (5 | ) | |||||||||||||
Common stock held in treasury at cost:118, 109, 103, 95 and 90 shares | (14,140 | ) | (12,781 | ) | (11,838 | ) | (10,866 | ) | (10,085 | ) | |||||||||
Total shareholders’ equity | 49,263 | 49,314 | 49,420 | 49,340 | 48,536 | ||||||||||||||
Noncontrolling interests | 27 | 29 | 35 | 41 | 39 | ||||||||||||||
Total equity | 49,290 | 49,343 | 49,455 | 49,381 | 48,575 | ||||||||||||||
Total liabilities and equity | $ | 445,493 | $ | 410,295 | $ | 408,916 | $ | 405,761 | $ | 392,837 | |||||||||
(a) | Amounts include balances held with the Federal Reserve Bank of Cleveland of $19.6 billion, $23.2 billion, $18.8 billion, $18.1 billion and $15.0 billion as of March 31, 2020, December 31, 2019, September 30, 2019, June 30, 2019 and March 31, 2019, respectively. |
(b) | Amounts include assets and liabilities for which PNC has elected the fair value option. Our 2019 Form 10-K included, and our first quarter 2020 Form 10-Q will include, additional information regarding these items. |
(c) | Amount as of March 31, 2020 is net of the related Allowances for Credit Losses recorded in accordance with the adoption of Accounting Standards Update 2016-13, Financial Instruments - Credit Losses. Our 2019 Form 10-K included, and our first quarter 2020 Form 10-Q will include, additional information related to our adoption of this standard, which is commonly referred to as the Current Expected Credit Losses (CECL) standard. |
(d) | Reflects the impact of adopting the CECL standard and our transition from an incurred loss model for these reserves to an expected credit loss methodology. Our 2019 Form 10-K included, and our first quarter 2020 Form 10-Q will include, additional information related to our adoption of this standard. |
(e) | Amounts include our equity investment in BlackRock. |
(f) | Par value less than $.5 million at each date. |
THE PNC FINANCIAL SERVICES GROUP, INC. | Page 3 | |
Table 3: Average Consolidated Balance Sheet (Unaudited) (a) | |||||||||||||||||||
Three months ended | |||||||||||||||||||
March 31 | December 31 | September 30 | June 30 | March 31 | |||||||||||||||
In millions | 2020 | 2019 | 2019 | 2019 | 2019 | ||||||||||||||
Assets | |||||||||||||||||||
Interest-earning assets: | |||||||||||||||||||
Investment securities | |||||||||||||||||||
Securities available for sale | |||||||||||||||||||
Residential mortgage-backed | |||||||||||||||||||
Agency | $ | 49,636 | $ | 33,937 | $ | 32,926 | $ | 30,169 | $ | 29,002 | |||||||||
Non-agency | 1,617 | 1,582 | 1,716 | 1,801 | 1,890 | ||||||||||||||
Commercial mortgage-backed | 6,734 | 6,054 | 5,728 | 5,545 | 5,368 | ||||||||||||||
Asset-backed | 5,003 | 5,059 | 5,208 | 5,395 | 5,136 | ||||||||||||||
U.S. Treasury and government agencies | 15,938 | 15,966 | 17,573 | 18,815 | 18,240 | ||||||||||||||
Other | 4,024 | 2,849 | 3,053 | 3,237 | 3,671 | ||||||||||||||
Total securities available for sale | 82,952 | 65,447 | 66,204 | 64,962 | 63,307 | ||||||||||||||
Securities held to maturity | |||||||||||||||||||
Residential mortgage-backed | — | 14,943 | 15,768 | 15,350 | 15,627 | ||||||||||||||
Commercial mortgage-backed | — | 498 | 544 | 570 | 600 | ||||||||||||||
Asset-backed | 51 | 54 | 79 | 172 | 177 | ||||||||||||||
U.S. Treasury and government agencies | 779 | 774 | 769 | 765 | 760 | ||||||||||||||
Other | 640 | 1,794 | 1,802 | 1,822 | 1,847 | ||||||||||||||
Total securities held to maturity | 1,470 | 18,063 | 18,962 | 18,679 | 19,011 | ||||||||||||||
Total investment securities | 84,422 | 83,510 | 85,166 | 83,641 | 82,318 | ||||||||||||||
Loans | |||||||||||||||||||
Commercial | 128,723 | 124,876 | 125,356 | 124,441 | 119,345 | ||||||||||||||
Commercial real estate | 28,275 | 28,670 | 28,855 | 28,423 | 28,147 | ||||||||||||||
Equipment lease financing | 7,066 | 7,199 | 7,272 | 7,283 | 7,263 | ||||||||||||||
Consumer | 57,680 | 56,765 | 55,702 | 55,202 | 54,996 | ||||||||||||||
Residential real estate | 21,828 | 21,341 | 20,497 | 19,496 | 18,794 | ||||||||||||||
Total loans | 243,572 | 238,851 | 237,682 | 234,845 | 228,545 | ||||||||||||||
Interest-earning deposits with banks (b) | 17,569 | 23,316 | 15,632 | 13,469 | 15,017 | ||||||||||||||
Other interest-earning assets | 9,468 | 11,371 | 14,094 | 13,145 | 11,068 | ||||||||||||||
Total interest-earning assets | 355,031 | 357,048 | 352,574 | 345,100 | 336,948 | ||||||||||||||
Noninterest-earning assets | 57,405 | 54,371 | 54,135 | 51,862 | 48,950 | ||||||||||||||
Total assets | $ | 412,436 | $ | 411,419 | $ | 406,709 | $ | 396,962 | $ | 385,898 | |||||||||
Liabilities and Equity | |||||||||||||||||||
Interest-bearing liabilities: | |||||||||||||||||||
Interest-bearing deposits | |||||||||||||||||||
Money market | $ | 53,287 | $ | 56,209 | $ | 56,271 | $ | 54,814 | $ | 54,702 | |||||||||
Demand | 70,931 | 69,496 | 65,444 | 64,431 | 63,480 | ||||||||||||||
Savings | 69,977 | 66,827 | 64,054 | 61,949 | 58,821 | ||||||||||||||
Time deposits | 21,141 | 21,600 | 21,173 | 20,040 | 18,813 | ||||||||||||||
Total interest-bearing deposits | 215,336 | 214,132 | 206,942 | 201,234 | 195,816 | ||||||||||||||
Borrowed funds | |||||||||||||||||||
Federal Home Loan Bank borrowings | 13,440 | 18,944 | 25,883 | 22,681 | 21,491 | ||||||||||||||
Bank notes and senior debt | 29,988 | 27,403 | 27,409 | 26,865 | 25,418 | ||||||||||||||
Subordinated debt | 5,934 | 5,760 | 5,189 | 5,526 | 5,883 | ||||||||||||||
Other | 7,826 | 7,926 | 5,452 | 7,263 | 6,991 | ||||||||||||||
Total borrowed funds | 57,188 | 60,033 | 63,933 | 62,335 | 59,783 | ||||||||||||||
Total interest-bearing liabilities | 272,524 | 274,165 | 270,875 | 263,569 | 255,599 | ||||||||||||||
Noninterest-bearing liabilities and equity: | |||||||||||||||||||
Noninterest-bearing deposits | 74,396 | 73,626 | 72,149 | 71,648 | 71,402 | ||||||||||||||
Accrued expenses and other liabilities | 16,437 | 14,541 | 14,529 | 13,122 | 11,242 | ||||||||||||||
Equity | 49,079 | 49,087 | 49,156 | 48,623 | 47,655 | ||||||||||||||
Total liabilities and equity | $ | 412,436 | $ | 411,419 | $ | 406,709 | $ | 396,962 | $ | 385,898 | |||||||||
(a) | Calculated using average daily balances. |
(b) | Amounts include average balances held with the Federal Reserve Bank of Cleveland of $17.3 billion, $23.0 billion, $15.3 billion, $13.2 billion and $14.7 billion for the three months ended March 31, 2020, December 31, 2019, September 30, 2019, June 30, 2019 and March 31, 2019, respectively. |
THE PNC FINANCIAL SERVICES GROUP, INC. | Page 4 | |
Table 4: Details of Net Interest Margin (Unaudited) | ||||||||||||||
Three months ended | ||||||||||||||
March 31 | December 31 | September 30 | June 30 | March 31 | ||||||||||
2020 | 2019 | 2019 | 2019 | 2019 | ||||||||||
Average yields/rates (a) | ||||||||||||||
Yield on interest-earning assets | ||||||||||||||
Investment securities | ||||||||||||||
Securities available for sale | ||||||||||||||
Residential mortgage-backed | ||||||||||||||
Agency | 2.63 | % | 2.48 | % | 2.70 | % | 2.93 | % | 2.94 | % | ||||
Non-agency | 7.87 | % | 8.09 | % | 8.89 | % | 7.99 | % | 7.31 | % | ||||
Commercial mortgage-backed | 2.95 | % | 2.30 | % | 2.97 | % | 3.06 | % | 3.13 | % | ||||
Asset-backed | 3.05 | % | 3.26 | % | 3.31 | % | 3.34 | % | 3.35 | % | ||||
U.S. Treasury and government agencies | 2.29 | % | 2.31 | % | 2.44 | % | 2.48 | % | 2.49 | % | ||||
Other | 3.69 | % | 3.36 | % | 3.41 | % | 3.33 | % | 3.34 | % | ||||
Total securities available for sale | 2.77 | % | 2.65 | % | 2.90 | % | 3.01 | % | 3.01 | % | ||||
Securities held to maturity | ||||||||||||||
Residential mortgage-backed | — | 2.63 | % | 2.78 | % | 2.93 | % | 3.01 | % | |||||
Commercial mortgage-backed | — | 4.44 | % | 3.68 | % | 3.57 | % | 3.53 | % | |||||
Asset-backed | 2.77 | % | 3.02 | % | 5.48 | % | 3.92 | % | 3.83 | % | ||||
U.S. Treasury and government agencies | 2.84 | % | 2.86 | % | 2.86 | % | 2.84 | % | 2.81 | % | ||||
Other | 4.48 | % | 4.47 | % | 4.40 | % | 4.44 | % | 4.40 | % | ||||
Total securities held to maturity | 3.56 | % | 2.87 | % | 2.98 | % | 3.10 | % | 3.16 | % | ||||
Total investment securities | 2.78 | % | 2.70 | % | 2.91 | % | 3.03 | % | 3.05 | % | ||||
Loans | ||||||||||||||
Commercial | 3.62 | % | 3.88 | % | 4.06 | % | 4.22 | % | 4.33 | % | ||||
Commercial real estate | 3.64 | % | 3.89 | % | 4.40 | % | 4.43 | % | 4.37 | % | ||||
Equipment lease financing | 3.93 | % | 3.87 | % | 3.82 | % | 4.06 | % | 3.93 | % | ||||
Consumer | 5.38 | % | 5.45 | % | 5.61 | % | 5.56 | % | 5.54 | % | ||||
Residential real estate | 3.96 | % | 4.10 | % | 4.21 | % | 4.27 | % | 4.29 | % | ||||
Total loans | 4.08 | % | 4.27 | % | 4.47 | % | 4.56 | % | 4.61 | % | ||||
Interest-earning deposits with banks | 1.27 | % | 1.66 | % | 2.17 | % | 2.38 | % | 2.43 | % | ||||
Other interest-earning assets | 3.51 | % | 3.65 | % | 3.49 | % | 3.55 | % | 4.14 | % | ||||
Total yield on interest-earning assets | 3.62 | % | 3.71 | % | 3.95 | % | 4.06 | % | 4.11 | % | ||||
Rate on interest-bearing liabilities | ||||||||||||||
Interest-bearing deposits | ||||||||||||||
Money market | .72 | % | .93 | % | 1.14 | % | 1.17 | % | 1.15 | % | ||||
Demand | .41 | % | .51 | % | .58 | % | .55 | % | .52 | % | ||||
Savings | .79 | % | .97 | % | 1.14 | % | 1.19 | % | 1.13 | % | ||||
Time deposits | 1.34 | % | 1.52 | % | 1.66 | % | 1.67 | % | 1.55 | % | ||||
Total interest-bearing deposits | .70 | % | .87 | % | 1.02 | % | 1.03 | % | .98 | % | ||||
Borrowed funds | ||||||||||||||
Federal Home Loan Bank borrowings | 1.69 | % | 2.11 | % | 2.48 | % | 2.69 | % | 2.77 | % | ||||
Bank notes and senior debt | 2.41 | % | 2.77 | % | 3.21 | % | 3.36 | % | 3.50 | % | ||||
Subordinated debt | 2.73 | % | 3.06 | % | 3.53 | % | 4.17 | % | 4.50 | % | ||||
Other | 1.69 | % | 1.89 | % | 2.43 | % | 2.44 | % | 2.44 | % | ||||
Total borrowed funds | 2.18 | % | 2.47 | % | 2.87 | % | 3.08 | % | 3.21 | % | ||||
Total rate on interest-bearing liabilities | 1.00 | % | 1.21 | % | 1.45 | % | 1.51 | % | 1.50 | % | ||||
Interest rate spread | 2.62 | % | 2.50 | % | 2.50 | % | 2.55 | % | 2.61 | % | ||||
Benefit from use of noninterest bearing sources (b) | .22 | .28 | .34 | .36 | .37 | |||||||||
Net interest margin | 2.84 | % | 2.78 | % | 2.84 | % | 2.91 | % | 2.98 | % | ||||
(a) | Yields and rates are calculated using the applicable annualized interest income or interest expense divided by the applicable average earning assets or interest-bearing liabilities. Net interest margin is the total yield on interest-earning assets minus the total rate on interest-bearing liabilities and includes the benefit from use of noninterest-bearing sources. To provide more meaningful comparisons of net interest margins, we use net interest income on a taxable-equivalent basis in calculating average yields used in the calculation of net interest margin by increasing the interest income earned on tax-exempt assets to make it fully equivalent to interest income earned on taxable investments. This adjustment is not permitted under generally accepted accounting principles (GAAP) in the Consolidated Income Statement. The taxable-equivalent adjustments to net interest income for the three months ended March 31, 2020, December 31, 2019, September 30, 2019, June 30, 2019 and March 31, 2019 were $22 million, $23 million, $25 million, $27 million and $27 million, respectively. |
(b) | Represents the positive effects of investing noninterest-bearing sources in interest-earning assets. |
THE PNC FINANCIAL SERVICES GROUP, INC. | Page 5 | |
Table 5: Per Share Related Information (Unaudited) | |||||||||||||||||||
Three months ended | |||||||||||||||||||
March 31 | December 31 | September 30 | June 30 | March 31 | |||||||||||||||
In millions, except per share data | 2020 | 2019 | 2019 | 2019 | 2019 | ||||||||||||||
Basic | |||||||||||||||||||
Net income | $ | 915 | $ | 1,381 | $ | 1,392 | $ | 1,374 | $ | 1,271 | |||||||||
Less: | |||||||||||||||||||
Net income attributable to noncontrolling interests | 7 | 14 | 13 | 12 | 10 | ||||||||||||||
Preferred stock dividends (a) | 63 | 55 | 63 | 55 | 63 | ||||||||||||||
Preferred stock discount accretion and redemptions | 1 | 1 | 1 | 1 | 1 | ||||||||||||||
Net income attributable to common shareholders | 844 | 1,311 | 1,315 | 1,306 | 1,197 | ||||||||||||||
Less: Dividends and undistributed earnings allocated to nonvested restricted shares | 4 | 6 | 6 | 4 | 5 | ||||||||||||||
Net income attributable to basic common shares | $ | 840 | $ | 1,305 | $ | 1,309 | $ | 1,302 | $ | 1,192 | |||||||||
Basic weighted-average common shares outstanding | 429 | 437 | 444 | 451 | 455 | ||||||||||||||
Basic earnings per common share | $ | 1.96 | $ | 2.98 | $ | 2.95 | $ | 2.89 | $ | 2.62 | |||||||||
Diluted | |||||||||||||||||||
Net income attributable to basic common shares | $ | 840 | $ | 1,305 | $ | 1,309 | $ | 1,302 | $ | 1,192 | |||||||||
Less: Impact of BlackRock earnings per share dilution | 1 | 3 | 2 | 2 | 3 | ||||||||||||||
Net income attributable to diluted common shares | $ | 839 | $ | 1,302 | $ | 1,307 | $ | 1,300 | $ | 1,189 | |||||||||
Basic weighted-average common shares outstanding | 429 | 437 | 444 | 451 | 455 | ||||||||||||||
Dilutive potential common shares | 1 | 1 | 1 | 1 | 1 | ||||||||||||||
Diluted weighted-average common shares outstanding | 430 | 438 | 445 | 452 | 456 | ||||||||||||||
Diluted earnings per common share | $ | 1.95 | $ | 2.97 | $ | 2.94 | $ | 2.88 | $ | 2.61 | |||||||||
(a) | Dividends are payable quarterly other than the Series O, Series R and Series S preferred stock, which are payable semiannually, with the Series O payable in different quarters than the Series R and Series S preferred stock. |
Table 6: Details of Loans (Unaudited)
March 31 | December 31 | September 30 | June 30 | March 31 | ||||||||||||||||
In millions | 2020 | 2019 | 2019 | 2019 | 2019 | |||||||||||||||
Commercial lending | ||||||||||||||||||||
Commercial | ||||||||||||||||||||
Manufacturing | $ | 27,225 | $ | 21,540 | $ | 21,846 | $ | 22,191 | $ | 22,575 | ||||||||||
Retail/wholesale trade | 24,408 | 21,565 | 21,761 | 22,280 | 21,655 | |||||||||||||||
Service providers | 19,411 | 16,112 | 16,189 | 15,387 | 15,266 | |||||||||||||||
Real estate related (a) | 14,843 | 12,346 | 12,294 | 12,264 | 12,287 | |||||||||||||||
Financial services | 13,473 | 11,318 | 10,437 | 11,916 | 10,475 | |||||||||||||||
Health care | 9,238 | 8,035 | 8,137 | 8,594 | 8,731 | |||||||||||||||
Transportation and warehousing | 8,160 | 7,474 | 7,216 | 6,588 | 6,744 | |||||||||||||||
Other industries | 32,373 | 26,947 | 26,134 | 26,404 | 25,260 | |||||||||||||||
Total commercial | 149,131 | 125,337 | 124,014 | 125,624 | 122,993 | |||||||||||||||
Commercial real estate | 28,544 | 28,110 | 28,884 | 28,570 | 28,101 | |||||||||||||||
Equipment lease financing | 7,061 | 7,155 | 7,290 | 7,409 | 7,348 | |||||||||||||||
Total commercial lending | 184,736 | 160,602 | 160,188 | 161,603 | 158,442 | |||||||||||||||
Consumer lending | ||||||||||||||||||||
Home equity | 25,081 | 25,085 | 24,971 | 25,132 | 25,500 | |||||||||||||||
Residential real estate | 22,250 | 21,821 | 21,082 | 20,092 | 19,107 | |||||||||||||||
Automobile | 17,194 | 16,754 | 16,004 | 15,612 | 14,707 | |||||||||||||||
Credit card | 7,132 | 7,308 | 6,815 | 6,511 | 6,267 | |||||||||||||||
Education | 3,247 | 3,336 | 3,461 | 3,555 | 3,707 | |||||||||||||||
Other consumer | 5,003 | 4,937 | 4,856 | 4,710 | 4,563 | |||||||||||||||
Total consumer lending | 79,907 | 79,241 | 77,189 | 75,612 | 73,851 | |||||||||||||||
Total loans | $ | 264,643 | $ | 239,843 | $ | 237,377 | $ | 237,215 | $ | 232,293 | ||||||||||
(a) Includes loans to customers in the real estate and construction industries.
THE PNC FINANCIAL SERVICES GROUP, INC. | Page 6 | |
Allowance for Credit Losses and Allowance for Loan and Lease Losses (Unaudited)
Table 7: Change in Allowance for Credit Losses and Allowance for Loan and Lease Losses
ACL | ALLL | |||||||||||||||||||
March 31 | December 31 | September 30 | June 30 | March 31 | ||||||||||||||||
Three months ended - dollars in millions | 2020 | 2019 | 2019 | 2019 | 2019 | |||||||||||||||
Allowance for Credit Losses (ACL) and Allowance for Loan and Lease Losses (ALLL) | ||||||||||||||||||||
Beginning balance | $ | 2,742 | $ | 2,738 | $ | 2,721 | $ | 2,692 | $ | 2,629 | ||||||||||
Adoption of ASU 2016-03 (a) | 463 | |||||||||||||||||||
Gross charge-offs: | ||||||||||||||||||||
Commercial | (78 | ) | (67 | ) | (41 | ) | (50 | ) | (25 | ) | ||||||||||
Commercial real estate | (2 | ) | (11 | ) | (2 | ) | (3 | ) | ||||||||||||
Equipment lease financing | (5 | ) | (9 | ) | (2 | ) | (1 | ) | (3 | ) | ||||||||||
Home equity | (11 | ) | (16 | ) | (11 | ) | (18 | ) | (23 | ) | ||||||||||
Residential real estate | (2 | ) | (4 | ) | (1 | ) | (2 | ) | (2 | ) | ||||||||||
Automobile | (84 | ) | (78 | ) | (71 | ) | (54 | ) | (58 | ) | ||||||||||
Credit card | (78 | ) | (70 | ) | (61 | ) | (65 | ) | (67 | ) | ||||||||||
Education | (6 | ) | (6 | ) | (7 | ) | (7 | ) | (6 | ) | ||||||||||
Other consumer | (40 | ) | (39 | ) | (36 | ) | (28 | ) | (28 | ) | ||||||||||
Total gross charge-offs | (304 | ) | (291 | ) | (241 | ) | (227 | ) | (215 | ) | ||||||||||
Recoveries: | ||||||||||||||||||||
Commercial | 18 | 14 | 14 | 17 | 14 | |||||||||||||||
Commercial real estate | 4 | 3 | 3 | 2 | 3 | |||||||||||||||
Equipment lease financing | 2 | 2 | 2 | 2 | 2 | |||||||||||||||
Home equity | 14 | 18 | 20 | 18 | 18 | |||||||||||||||
Residential real estate | 4 | 3 | 4 | 4 | 3 | |||||||||||||||
Automobile | 35 | 29 | 30 | 29 | 26 | |||||||||||||||
Credit card | 8 | 6 | 7 | 7 | 7 | |||||||||||||||
Education | 2 | 2 | 2 | 2 | 2 | |||||||||||||||
Other consumer | 5 | 5 | 4 | 4 | 4 | |||||||||||||||
Total recoveries | 92 | 82 | 86 | 85 | 79 | |||||||||||||||
Net (charge-offs) / recoveries: | ||||||||||||||||||||
Commercial | (60 | ) | (53 | ) | (27 | ) | (33 | ) | (11 | ) | ||||||||||
Commercial real estate | 4 | 1 | (8 | ) | ||||||||||||||||
Equipment lease financing | (3 | ) | (7 | ) | 1 | (1 | ) | |||||||||||||
Home equity | 3 | 2 | 9 | (5 | ) | |||||||||||||||
Residential real estate | 2 | (1 | ) | 3 | 2 | 1 | ||||||||||||||
Automobile | (49 | ) | (49 | ) | (41 | ) | (25 | ) | (32 | ) | ||||||||||
Credit card | (70 | ) | (64 | ) | (54 | ) | (58 | ) | (60 | ) | ||||||||||
Education | (4 | ) | (4 | ) | (5 | ) | (5 | ) | (4 | ) | ||||||||||
Other consumer | (35 | ) | (34 | ) | (32 | ) | (24 | ) | (24 | ) | ||||||||||
Total net (charge-offs) | (212 | ) | (209 | ) | (155 | ) | (142 | ) | (136 | ) | ||||||||||
Provision for credit losses (b) | 952 | 221 | 183 | 180 | 189 | |||||||||||||||
Net (increase) / decrease in allowance for unfunded loan commitments and letters of credit | (14 | ) | (13 | ) | (12 | ) | 6 | |||||||||||||
Other | (1 | ) | 6 | 2 | 3 | 4 | ||||||||||||||
Ending balance | $ | 3,944 | $ | 2,742 | $ | 2,738 | $ | 2,721 | $ | 2,692 | ||||||||||
Allowance for credit losses - Off-balance sheet credit exposures | ||||||||||||||||||||
Beginning balance | $ | 318 | ||||||||||||||||||
Adoption of ASU 2016-03 (a) | 179 | |||||||||||||||||||
Provision for (recapture of) credit losses (b) | (47 | ) | ||||||||||||||||||
Ending balance | $ | 450 | ||||||||||||||||||
Allowance for credit losses - Loans, leases and off-balance sheet credit exposures | 4,394 | |||||||||||||||||||
Supplemental Information | ||||||||||||||||||||
Allowance for loans and leases to total loans | 1.49 | % | 1.14 | % | 1.15 | % | 1.15 | % | 1.16 | % | ||||||||||
Allowance for credit losses for loans, leases and off-balance sheet credit exposures to total loans | 1.66 | % | ||||||||||||||||||
THE PNC FINANCIAL SERVICES GROUP, INC. | Page 7 | |
Allowance for Credit Losses and Allowance for Loan and Lease Losses (Unaudited) (Continued)
March 31 | December 31 | September 30 | June 30 | March 31 | ||||||||||||||||
Three months ended - dollars in millions | 2020 | 2019 | 2019 | 2019 | 2019 | |||||||||||||||
Supplemental Information (continued) | ||||||||||||||||||||
Net charge-offs - Loans and leases | ||||||||||||||||||||
Commercial lending net charge-offs | $ | (59 | ) | $ | (59 | ) | $ | (35 | ) | $ | (32 | ) | $ | (12 | ) | |||||
Consumer lending net charge-offs | (153 | ) | (150 | ) | (120 | ) | (110 | ) | (124 | ) | ||||||||||
Total net charge-offs - loans and leases | $ | (212 | ) | $ | (209 | ) | $ | (155 | ) | $ | (142 | ) | $ | (136 | ) | |||||
Net charge-offs to average loans (annualized) | .35 | % | .35 | % | .26 | % | .24 | % | .24 | % | ||||||||||
Commercial lending | .14 | % | .15 | % | .09 | % | .08 | % | .03 | % | ||||||||||
Consumer lending | .77 | % | .76 | % | .62 | % | .59 | % | .68 | % | ||||||||||
(a) Represents the impact of adopting ASU 2016-13, Financial Instruments - Credit Losses on January 1, 2020, and our transition from an incurred loss model for our reserves to an expected credit loss methodology. Our 2019 Form 10-K included and our first quarter 2020 Form 10-Q will include additional information related to our adoption of the CECL standard.
(b) See Table 8 for details on the components of the Provision for credit losses on the Consolidated Income Statement for the three months ended March 31, 2020.
Table 8: Components of the Provision For Credit Losses Under CECL
March 31 | ||||
In millions | 2020 | |||
Provision for credit losses | ||||
Loans and leases | $ | 952 | ||
Off-balance sheet credit exposures | (47 | ) | ||
Loans, leases and off-balance sheet credit exposures | 905 | |||
Other (other assets and securities) | 9 | |||
Total provision for credit losses | $ | 914 | ||
THE PNC FINANCIAL SERVICES GROUP, INC. | Page 8 | |
Details of Nonperforming Assets (Unaudited)
Table 9: Nonperforming Assets by Type
March 31 | December 31 | September 30 | June 30 | March 31 | ||||||||||||||||
Dollars in millions | 2020 | 2019 | 2019 | 2019 | 2019 | |||||||||||||||
Nonperforming loans, including TDRs | ||||||||||||||||||||
Commercial lending | ||||||||||||||||||||
Commercial | ||||||||||||||||||||
Retail/wholesale trade | $ | 121 | $ | 74 | $ | 61 | $ | 42 | $ | 35 | ||||||||||
Manufacturing | 79 | 102 | 109 | 88 | 88 | |||||||||||||||
Service providers | 63 | 53 | 55 | 53 | 52 | |||||||||||||||
Real estate related (a) | 25 | 24 | 33 | 19 | 16 | |||||||||||||||
Health care | 14 | 17 | 17 | 15 | 19 | |||||||||||||||
Transportation and warehousing | 23 | 18 | 13 | 21 | 8 | |||||||||||||||
Other industries | 169 | 137 | 203 | 203 | 151 | |||||||||||||||
Total commercial | 494 | 425 | 491 | 441 | 369 | |||||||||||||||
Commercial real estate | 42 | 44 | 75 | 93 | 54 | |||||||||||||||
Equipment lease financing | 30 | 32 | 10 | 6 | 7 | |||||||||||||||
Total commercial lending | 566 | 501 | 576 | 540 | 430 | |||||||||||||||
Consumer lending (b) | ||||||||||||||||||||
Home equity | 617 | 669 | 685 | 712 | 763 | |||||||||||||||
Residential real estate | 292 | 315 | 325 | 339 | 339 | |||||||||||||||
Automobile | 154 | 135 | 128 | 118 | 107 | |||||||||||||||
Credit card | 10 | 11 | 9 | 8 | 7 | |||||||||||||||
Other consumer | 5 | 4 | 5 | 7 | 7 | |||||||||||||||
Total consumer lending | 1,078 | 1,134 | 1,152 | 1,184 | 1,223 | |||||||||||||||
Total nonperforming loans (c) (d) | 1,644 | 1,635 | 1,728 | 1,724 | 1,653 | |||||||||||||||
OREO and foreclosed assets | 111 | 117 | 119 | 126 | 132 | |||||||||||||||
Total nonperforming assets | $ | 1,755 | $ | 1,752 | $ | 1,847 | $ | 1,850 | $ | 1,785 | ||||||||||
Nonperforming loans to total loans | .62 | % | .68 | % | .73 | % | .73 | % | .71 | % | ||||||||||
Nonperforming assets to total loans, OREO and foreclosed assets | .66 | % | .73 | % | .78 | % | .78 | % | .77 | % | ||||||||||
Nonperforming assets to total assets | .39 | % | .43 | % | .45 | % | .46 | % | .45 | % | ||||||||||
Allowance for loans and leases to nonperforming loans (e) | 240 | % | 168 | % | 158 | % | 158 | % | 163 | % | ||||||||||
(a) | Includes loans related to customers in the real estate and construction industries. |
(b) | Excludes most unsecured consumer loans and lines of credit, which are charged off after 120 to 180 days past due and are not placed on nonperforming status. |
(c) | Nonperforming loans exclude certain government insured or guaranteed loans, loans held for sale and loans accounted for under the fair value option. Prior periods also excluded purchased impaired loans. |
(d) | In connection with the adoption of the CECL standard, nonperforming loans as of March 31, 2020 include purchased credit deteriorated loans. Our 2019 Form 10-K included and our first quarter 2020 Form 10-Q will include additional information related to our adoption of the CECL standard. |
(e) | Ratio at March 31, 2020 reflects the transition impact on our allowance for loans and leases from the adoption of the CECL standard along with the increases in reserves during the first quarter of 2020 due to the significant economic impact of COVID-19 and loan growth. |
THE PNC FINANCIAL SERVICES GROUP, INC. | Page 9 | |
Details of Nonperforming Assets (Unaudited) (Continued)
Table 10: Change in Nonperforming Assets
January 1, 2020 | October 1, 2019 | July 1, 2019 | April 1, 2019 | January 1, 2019 | ||||||||||||||||
In millions | March 31, 2020 | December 31, 2019 | September 30, 2019 | June 30, 2019 | March 31, 2019 | |||||||||||||||
Beginning balance | $ | 1,752 | $ | 1,847 | $ | 1,850 | $ | 1,785 | $ | 1,808 | ||||||||||
New nonperforming assets | 391 | 357 | 290 | 408 | 287 | |||||||||||||||
Charge-offs and valuation adjustments | (145 | ) | (218 | ) | (112 | ) | (170 | ) | (164 | ) | ||||||||||
Principal activity, including paydowns and payoffs | (158 | ) | (157 | ) | (122 | ) | (101 | ) | (92 | ) | ||||||||||
Asset sales and transfers to loans held for sale | (20 | ) | (21 | ) | (34 | ) | (27 | ) | (13 | ) | ||||||||||
Returned to performing status | (65 | ) | (56 | ) | (25 | ) | (45 | ) | (41 | ) | ||||||||||
Ending balance | $ | 1,755 | $ | 1,752 | $ | 1,847 | $ | 1,850 | $ | 1,785 | ||||||||||
Table 11: Largest Individual Nonperforming Assets (a)
March 31, 2020 - Dollars in millions | |||||||
Ranking | Outstandings | Industry | |||||
1 | $ | 41 | Mining, Quarrying, and Oil and Gas Extraction | ||||
2 | 33 | Wholesale Trade | |||||
3 | 29 | Retail Trade | |||||
4 | 27 | Mining, Quarrying, and Oil and Gas Extraction | |||||
5 | 21 | Mining, Quarrying, and Oil and Gas Extraction | |||||
6 | 19 | Manufacturing | |||||
7 | 15 | Service Providers | |||||
8 | 13 | Service Providers | |||||
9 | 12 | Mining, Quarrying, and Oil and Gas Extraction | |||||
10 | 11 | Manufacturing | |||||
Total | $ | 221 | |||||
As a percent of total nonperforming assets | 13% | ||||||
(a) Amounts shown are not net of related allowance for credit losses, if applicable.
THE PNC FINANCIAL SERVICES GROUP, INC. | Page 10 | |
Accruing Loans Past Due (Unaudited)
Table 12: Accruing Loans Past Due 30 to 59 Days (a) (b)
Amount | Percent of Total Outstandings | ||||||||||||||||||||||||||||||||||
Mar. 31 | Dec. 31 | Sept. 30 | Jun. 30 | Mar. 31 | Mar. 31 | Dec. 31 | Sept. 30 | Jun. 30 | Mar. 31 | ||||||||||||||||||||||||||
Dollars in millions | 2020 | 2019 | 2019 | 2019 | 2019 | 2020 | 2019 | 2019 | 2019 | 2019 | |||||||||||||||||||||||||
Commercial | $ | 97 | $ | 102 | $ | 82 | $ | 105 | $ | 80 | .07 | % | .08 | % | .07 | % | .08 | % | .07 | % | |||||||||||||||
Commercial real estate | 6 | 4 | 3 | 9 | 43 | .02 | % | .01 | % | .01 | % | .03 | % | .15 | % | ||||||||||||||||||||
Equipment lease financing | 42 | 49 | 6 | 7 | 84 | .59 | % | .68 | % | .08 | % | .09 | % | 1.14 | % | ||||||||||||||||||||
Home equity | 65 | 58 | 53 | 56 | 59 | .26 | % | .23 | % | .21 | % | .22 | % | .23 | % | ||||||||||||||||||||
Residential real estate | |||||||||||||||||||||||||||||||||||
Non government insured | 121 | 90 | 76 | 80 | 91 | .54 | % | .41 | % | .36 | % | .40 | % | .48 | % | ||||||||||||||||||||
Government insured | 52 | 50 | 53 | 54 | 62 | .23 | % | .23 | % | .25 | % | .27 | % | .32 | % | ||||||||||||||||||||
Automobile | 177 | 178 | 145 | 119 | 97 | 1.03 | % | 1.06 | % | .91 | % | .76 | % | .66 | % | ||||||||||||||||||||
Credit card | 59 | 60 | 56 | 47 | 45 | .83 | % | .82 | % | .82 | % | .72 | % | .72 | % | ||||||||||||||||||||
Education | |||||||||||||||||||||||||||||||||||
Non government insured | 7 | 7 | 8 | 7 | 9 | .22 | % | .21 | % | .23 | % | .20 | % | .24 | % | ||||||||||||||||||||
Government insured | 45 | 48 | 48 | 53 | 54 | 1.39 | % | 1.44 | % | 1.39 | % | 1.49 | % | 1.46 | % | ||||||||||||||||||||
Other consumer | 17 | 15 | 17 | 13 | 10 | .34 | % | .30 | % | .35 | % | .28 | % | .22 | % | ||||||||||||||||||||
Total | $ | 688 | $ | 661 | $ | 547 | $ | 550 | $ | 634 | .26 | % | .28 | % | .23 | % | .23 | % | .27 | % | |||||||||||||||
Table 13: Accruing Loans Past Due 60 to 89 Days (a) (b)
Amount | Percent of Total Outstandings | ||||||||||||||||||||||||||||||||||
Mar. 31 | Dec. 31 | Sept. 30 | Jun. 30 | Mar. 31 | Mar. 31 | Dec. 31 | Sept. 30 | Jun. 30 | Mar. 31 | ||||||||||||||||||||||||||
Dollars in millions | 2020 | 2019 | 2019 | 2019 | 2019 | 2020 | 2019 | 2019 | 2019 | 2019 | |||||||||||||||||||||||||
Commercial | $ | 22 | $ | 30 | $ | 49 | $ | 33 | $ | 25 | .01 | % | .02 | % | .04 | % | .03 | % | .02 | % | |||||||||||||||
Commercial real estate | 1 | 1 | 3 | 1 | 1 | .00 | % | .00 | % | .01 | % | .00 | % | .00 | % | ||||||||||||||||||||
Equipment lease financing | 2 | 5 | 4 | 3 | 5 | .03 | % | .07 | % | .05 | % | .04 | % | .07 | % | ||||||||||||||||||||
Home equity | 28 | 24 | 24 | 20 | 21 | .11 | % | .10 | % | .10 | % | .08 | % | .08 | % | ||||||||||||||||||||
Residential real estate | |||||||||||||||||||||||||||||||||||
Non government insured | 30 | 16 | 20 | 20 | 13 | .13 | % | .07 | % | .09 | % | .10 | % | .07 | % | ||||||||||||||||||||
Government insured | 52 | 53 | 57 | 55 | 49 | .23 | % | .24 | % | .27 | % | .27 | % | .26 | % | ||||||||||||||||||||
Automobile | 49 | 47 | 36 | 29 | 26 | .28 | % | .28 | % | .22 | % | .19 | % | .18 | % | ||||||||||||||||||||
Credit card | 37 | 37 | 33 | 29 | 28 | .52 | % | .51 | % | .48 | % | .45 | % | .45 | % | ||||||||||||||||||||
Education | |||||||||||||||||||||||||||||||||||
Non government insured | 4 | 3 | 5 | 4 | 5 | .12 | % | .09 | % | .14 | % | .11 | % | .13 | % | ||||||||||||||||||||
Government insured | 26 | 31 | 30 | 32 | 33 | .80 | % | .93 | % | .87 | % | .90 | % | .89 | % | ||||||||||||||||||||
Other consumer | 10 | 11 | 8 | 9 | 6 | .20 | % | .22 | % | .16 | % | .19 | % | .13 | % | ||||||||||||||||||||
Total | $ | 261 | $ | 258 | $ | 269 | $ | 235 | $ | 212 | .10 | % | .11 | % | .11 | % | .10 | % | .09 | % | |||||||||||||||
Table 14: Accruing Loans Past Due 90 Days or More (a) (b)
Amount | Percent of Total Outstandings | ||||||||||||||||||||||||||||||||||
Mar. 31 | Dec. 31 | Sept. 30 | Jun. 30 | Mar. 31 | Mar. 31 | Dec. 31 | Sept. 30 | Jun. 30 | Mar. 31 | ||||||||||||||||||||||||||
Dollars in millions | 2020 | 2019 | 2019 | 2019 | 2019 | 2020 | 2019 | 2019 | 2019 | 2019 | |||||||||||||||||||||||||
Commercial | $ | 51 | $ | 85 | $ | 64 | $ | 59 | $ | 71 | .03 | % | .07 | % | .05 | % | .05 | % | .06 | % | |||||||||||||||
Residential real estate | |||||||||||||||||||||||||||||||||||
Non government insured | 18 | 14 | 15 | 13 | 18 | .08 | % | .06 | % | .07 | % | .06 | % | .09 | % | ||||||||||||||||||||
Government insured | 282 | 301 | 287 | 293 | 305 | 1.27 | % | 1.38 | % | 1.36 | % | 1.46 | % | 1.60 | % | ||||||||||||||||||||
Automobile | 19 | 18 | 11 | 8 | 10 | .11 | % | .11 | % | .07 | % | .05 | % | .07 | % | ||||||||||||||||||||
Credit card | 70 | 67 | 57 | 48 | 53 | .98 | % | .92 | % | .84 | % | .74 | % | .85 | % | ||||||||||||||||||||
Education | |||||||||||||||||||||||||||||||||||
Non government insured | 2 | 2 | 3 | 3 | 3 | .06 | % | .06 | % | .09 | % | .08 | % | .08 | % | ||||||||||||||||||||
Government insured | 82 | 89 | 87 | 92 | 123 | 2.53 | % | 2.67 | % | 2.51 | % | 2.59 | % | 3.32 | % | ||||||||||||||||||||
Other consumer | 10 | 9 | 8 | 8 | 7 | .20 | % | .18 | % | .16 | % | .17 | % | .15 | % | ||||||||||||||||||||
Total | $ | 534 | $ | 585 | $ | 532 | $ | 524 | $ | 590 | .20 | % | .24 | % | .22 | % | .22 | % | .25 | % | |||||||||||||||
(a) Excludes loans held for sale, prior periods also excluded purchased impaired loans.
(b) In connection with the adoption of the CECL standard, accruing loans past due as of March 31, 2020 include purchased credit deteriorated loans. Home equity past due amounts include purchased credit deteriorated loans totaling $11 million and $4 million for 30 to 59 and 60 to 89 days past due, respectively. Residential real estate - Non government insured past due amounts include purchased credit deteriorated loans totaling $36 million, $15 million and $6 million for 30 to 59, 60 to 89 and 90 days or more past due, respectively. Our 2019 Form 10-K included and our first quarter 2020 Form 10-Q will include additional information related to our adoption of the CECL standard.
THE PNC FINANCIAL SERVICES GROUP, INC. | Page 11 | |
Business Segment Descriptions (Unaudited)
Retail Banking provides deposit, lending, brokerage, insurance services, investment management and cash management products and services to consumer and small business customers. Our customers are serviced through our branch network, ATMs, call centers, online banking and mobile channels. The branch network is located primarily in markets across the Mid-Atlantic, Midwest and Southeast. In 2018, Retail Banking launched its national expansion strategy designed to grow customers with digitally-led banking and an ultra-thin branch network in markets outside of our existing retail branch network. Deposit products include checking, savings and money market accounts and certificates of deposit. Lending products include residential mortgages, home equity loans and lines of credit, auto loans, credit cards, education loans and personal and small business loans and lines of credit. The residential mortgage loans are directly originated within our branch network and nationwide, and are typically underwritten to government agency and/or third-party standards, and either sold, servicing retained, or held on our balance sheet. Brokerage, investment management and cash management products and services include managed, education, retirement and trust accounts.
Corporate & Institutional Banking provides lending, treasury management, and capital markets-related products and services to mid-sized and large corporations, and government and not-for-profit entities. Lending products include secured and unsecured loans, letters of credit and equipment leases. The Treasury Management business provides payables, recievables, deposit and account services, liquidity and investments, and online and mobile banking products and services to our clients.Capital markets-related products and services include foreign exchange, derivatives, securities underwriting, loan syndications, mergers and acquisitions advisory and equity capital markets advisory related services. We also provide commercial loan servicing and technology solutions for the commercial real estate finance industry. Products and services are provided nationally.
Asset Management Group provides personal wealth management for high net worth and ultra high net worth clients and institutional asset management. The Asset Management group is comprised of three distinct operating units:
• | Wealth management provides products and services to individuals and their families including investment and retirement planning, customized investment management, private banking, and trust management and administration for individuals and their families. |
• | Our Hawthorn unit provides multi-generational family planning including estate, financial, tax planning, fiduciary, investment management and consulting, private banking, personal administrative services, asset custody and customized performance reporting to ultra high net worth clients. |
• | Institutional asset management provides outsourced chief investment officer, custody, private real estate, cash and fixed income client solutions, and fiduciary retirement advisory services to institutional clients including corporations, healthcare systems, insurance companies, unions, municipalities and non-profits. |
BlackRock, in which we hold an equity investment, is a leading publicly-traded investment management firm providing a broad range of investment and technology services to institutional and retail clients worldwide. Using a diverse platform of alpha-seeking active, index and cash management investment strategies across asset classes, BlackRock tailors investment outcomes and asset allocation solutions for clients. Product offerings include single- and multi-asset class portfolios investing in equities, fixed income, alternatives and money market instruments. BlackRock also offers technology services, including an investment and risk management technology platform, as well as advisory services and solutions to a broad base of institutional and wealth management clients. Our equity investment in BlackRock provides us with an additional source of noninterest income and increases our overall revenue diversification. BlackRock is a publicly-traded company, and additional information regarding its business is available in its filings with the Securities and Exchange Commission (SEC). At March 31, 2020, our economic interest in BlackRock was 22%.
Table 15: Period End Employees
March 31 | December 31 | September 30 | June 30 | March 31 | ||||||||||
2020 | 2019 | 2019 | 2019 | 2019 | ||||||||||
Full-time employees | ||||||||||||||
Retail Banking | 28,737 | 28,270 | 28,279 | 28,671 | 28,992 | |||||||||
Other full-time employees | 21,776 | 21,747 | 21,701 | 21,571 | 21,652 | |||||||||
Total full-time employees | 50,513 | 50,017 | 49,980 | 50,242 | 50,644 | |||||||||
Part-time employees | ||||||||||||||
Retail Banking | 1,780 | 1,759 | 1,823 | 2,037 | 1,887 | |||||||||
Other part-time employees | 129 | 142 | 153 | 518 | 180 | |||||||||
Total part-time employees | 1,909 | 1,901 | 1,976 | 2,555 | 2,067 | |||||||||
Total | 52,422 | 51,918 | 51,956 | 52,797 | 52,711 | |||||||||
THE PNC FINANCIAL SERVICES GROUP, INC. | Page 12 | |
Table 16: Summary of Business Segment Income and Revenue (Unaudited) (a)
Three months ended | |||||||||||||||||||
March 31 | December 31 | September 30 | June 30 | March 31 | |||||||||||||||
In millions | 2020 | 2019 | 2019 | 2019 | 2019 | ||||||||||||||
Income | |||||||||||||||||||
Retail Banking | $ | 201 | $ | 277 | $ | 347 | $ | 325 | $ | 264 | |||||||||
Corporate & Institutional Banking | 370 | 649 | 645 | 602 | 552 | ||||||||||||||
Asset Management Group | 54 | 91 | 46 | 80 | 45 | ||||||||||||||
Other, including BlackRock (b) | 290 | 364 | 354 | 367 | 410 | ||||||||||||||
Net income | $ | 915 | $ | 1,381 | $ | 1,392 | $ | 1,374 | $ | 1,271 | |||||||||
Revenue | |||||||||||||||||||
Retail Banking | $ | 2,244 | $ | 2,054 | $ | 2,137 | $ | 2,033 | $ | 1,944 | |||||||||
Corporate & Institutional Banking | 1,660 | 1,615 | 1,584 | 1,578 | 1,474 | ||||||||||||||
Asset Management Group | 292 | 352 | 286 | 354 | 287 | ||||||||||||||
Other, including BlackRock (b) | 321 | 588 | 486 | 474 | 581 | ||||||||||||||
Total revenue | $ | 4,517 | $ | 4,609 | $ | 4,493 | $ | 4,439 | $ | 4,286 | |||||||||
(a) | Our business information is presented based on our internal management reporting practices. Net interest income in business segment results reflects PNC’s internal funds transfer pricing methodology. Assets receive a funding charge and liabilities and capital receive a funding credit based on a transfer pricing methodology that incorporates product repricing characteristics, tenor and other factors. |
(b) | Includes earnings and gains or losses related to PNC's equity investment in BlackRock and residual activities that do not meet the criteria for disclosure as a separate reportable business. We provide additional information on these activities in our Form 10-K and Form 10-Q filings with the SEC. |
THE PNC FINANCIAL SERVICES GROUP, INC. | Page 13 | |
Table 17: Retail Banking (Unaudited) (a)
Three months ended | |||||||||||||||||||
March 31 | December 31 | September 30 | June 30 | March 31 | |||||||||||||||
Dollars in millions | 2020 | 2019 | 2019 | 2019 | 2019 | ||||||||||||||
Income Statement | |||||||||||||||||||
Net interest income | $ | 1,456 | $ | 1,402 | $ | 1,393 | $ | 1,376 | $ | 1,349 | |||||||||
Noninterest income | 788 | 652 | 744 | 657 | 595 | ||||||||||||||
Total revenue | 2,244 | 2,054 | 2,137 | 2,033 | 1,944 | ||||||||||||||
Provision for credit losses | 445 | 161 | 147 | 81 | 128 | ||||||||||||||
Noninterest expense | 1,536 | 1,530 | 1,536 | 1,527 | 1,468 | ||||||||||||||
Pretax earnings | 263 | 363 | 454 | 425 | 348 | ||||||||||||||
Income taxes | 62 | 86 | 107 | 100 | 84 | ||||||||||||||
Earnings | $ | 201 | $ | 277 | $ | 347 | $ | 325 | $ | 264 | |||||||||
Average Balance Sheet | |||||||||||||||||||
Loans held for sale | $ | 779 | $ | 747 | $ | 760 | $ | 554 | $ | 441 | |||||||||
Loans | |||||||||||||||||||
Consumer | |||||||||||||||||||
Home equity | $ | 22,736 | $ | 22,590 | $ | 22,434 | $ | 22,620 | $ | 22,990 | |||||||||
Automobile | 17,096 | 16,427 | 15,761 | 15,222 | 14,608 | ||||||||||||||
Education | 3,343 | 3,428 | 3,538 | 3,665 | 3,816 | ||||||||||||||
Credit cards | 7,207 | 6,985 | 6,624 | 6,376 | 6,204 | ||||||||||||||
Other | 2,533 | 2,418 | 2,309 | 2,179 | 2,068 | ||||||||||||||
Total consumer | 52,915 | 51,848 | 50,666 | 50,062 | 49,686 | ||||||||||||||
Commercial and commercial real estate | 10,524 | 10,323 | 10,379 | 10,481 | 10,461 | ||||||||||||||
Residential mortgage | 17,964 | 17,352 | 16,630 | 15,737 | 15,034 | ||||||||||||||
Total loans | $ | 81,403 | $ | 79,523 | $ | 77,675 | $ | 76,280 | $ | 75,181 | |||||||||
Total assets | $ | 97,062 | $ | 94,967 | $ | 93,222 | $ | 92,350 | $ | 91,255 | |||||||||
Deposits | |||||||||||||||||||
Noninterest-bearing demand | $ | 32,225 | $ | 32,674 | $ | 32,092 | $ | 31,516 | $ | 30,389 | |||||||||
Interest-bearing demand | 42,865 | 41,689 | 41,420 | 42,735 | 42,477 | ||||||||||||||
Money market | 22,866 | 23,927 | 24,807 | 25,799 | 26,773 | ||||||||||||||
Savings | 62,781 | 59,877 | 57,752 | 56,075 | 53,100 | ||||||||||||||
Certificates of deposit | 12,233 | 12,598 | 12,766 | 12,704 | 12,381 | ||||||||||||||
Total deposits | $ | 172,970 | $ | 170,765 | $ | 168,837 | $ | 168,829 | $ | 165,120 | |||||||||
Performance Ratios | |||||||||||||||||||
Return on average assets | .84 | % | 1.16 | % | 1.48 | % | 1.41 | % | 1.17 | % | |||||||||
Noninterest income to total revenue | 35 | % | 32 | % | 35 | % | 32 | % | 31 | % | |||||||||
Efficiency | 68 | % | 74 | % | 72 | % | 75 | % | 76 | % | |||||||||
(a) | See note (a) on page 12. |
THE PNC FINANCIAL SERVICES GROUP, INC. | Page 14 | |
Retail Banking (Unaudited) (Continued)
Three months ended | |||||||||||||||||||
March 31 | December 31 | September 30 | June 30 | March 31 | |||||||||||||||
Dollars in millions, except as noted | 2020 | 2019 | 2019 | 2019 | 2019 | ||||||||||||||
Supplemental Noninterest Income Information | |||||||||||||||||||
Consumer services | $ | 279 | $ | 293 | $ | 305 | $ | 299 | $ | 277 | |||||||||
Brokerage | $ | 93 | $ | 89 | $ | 92 | $ | 86 | $ | 89 | |||||||||
Residential mortgage | $ | 210 | $ | 87 | $ | 134 | $ | 82 | $ | 65 | |||||||||
Service charges on deposits | $ | 166 | $ | 183 | $ | 178 | $ | 164 | $ | 162 | |||||||||
Residential Mortgage Information | |||||||||||||||||||
Residential mortgage servicing statistics (in billions, except as noted) (a) | |||||||||||||||||||
Serviced portfolio balance (b) | $ | 118 | $ | 120 | $ | 123 | $ | 124 | $ | 123 | |||||||||
Serviced portfolio acquisitions | $ | 2 | $ | 3 | $ | 3 | $ | 5 | $ | 1 | |||||||||
MSR asset value (b) | $ | 0.6 | $ | 1.0 | $ | 0.9 | $ | 1.0 | $ | 1.1 | |||||||||
MSR capitalization value (in basis points) (b) | 51 | 83 | 72 | 80 | 92 | ||||||||||||||
Servicing income: (in millions) | |||||||||||||||||||
Servicing fees, net (c) | $ | 44 | $ | 39 | $ | 44 | $ | 42 | $ | 53 | |||||||||
Mortgage servicing rights valuation, net of economic hedge | $ | 101 | $ | 9 | $ | 40 | $ | 7 | $ | (9 | ) | ||||||||
Residential mortgage loan statistics | |||||||||||||||||||
Loan origination volume (in billions) | $ | 3.2 | $ | 3.5 | $ | 3.4 | $ | 2.9 | $ | 1.7 | |||||||||
Loan sale margin percentage | 3.16 | % | 2.42 | % | 2.59 | % | 2.24 | % | 2.35 | % | |||||||||
Percentage of originations represented by: | |||||||||||||||||||
Purchase volume (d) | 36 | % | 40 | % | 44 | % | 54 | % | 56 | % | |||||||||
Refinance volume | 64 | % | 60 | % | 56 | % | 46 | % | 44 | % | |||||||||
Other Information (b) | |||||||||||||||||||
Customer-related statistics (average) | |||||||||||||||||||
Non-teller deposit transactions (e) | 59 | % | 58 | % | 58 | % | 56 | % | 57 | % | |||||||||
Digital consumer customers (f) | 71 | % | 71 | % | 70 | % | 69 | % | 68 | % | |||||||||
Credit-related statistics | |||||||||||||||||||
Nonperforming assets | $ | 1,011 | $ | 1,046 | $ | 1,056 | $ | 1,074 | $ | 1,109 | |||||||||
Net charge-offs - loans and leases | $ | 166 | $ | 154 | $ | 128 | $ | 120 | $ | 132 | |||||||||
Other statistics | |||||||||||||||||||
ATMs | 9,048 | 9,091 | 9,102 | 9,072 | 9,112 | ||||||||||||||
Branches (g) | 2,277 | 2,296 | 2,310 | 2,321 | 2,347 | ||||||||||||||
Brokerage account client assets (in billions) (h) | $ | 49 | $ | 54 | $ | 52 | $ | 52 | $ | 51 | |||||||||
(a) | Represents mortgage loan servicing balances for third parties and the related income. |
(b) | Presented as of period end, except for customer-related statistics, which are quarterly averages, and net charge-offs, which are for the three months ended. |
(c) | Servicing fees net of impact of decrease in MSR value due to passage of time, including the impact from both regularly scheduled loan payments, prepayments, and loans that were paid down or paid off during the period. |
(d) | Mortgages with borrowers as part of residential real estate purchase transactions. |
(e) | Percentage of total consumer and business banking deposit transactions processed at an ATM or through our mobile banking application. |
(f) | Represents consumer checking relationships that process the majority of their transactions through non-teller channels. |
(g) | Excludes stand-alone mortgage offices and satellite offices (e.g., drive-ups, electronic branches and retirement centers) that provide limited products and/or services. |
(h) | Includes cash and money market balances. |
THE PNC FINANCIAL SERVICES GROUP, INC. | Page 15 | |
Table 18: Corporate & Institutional Banking (Unaudited) (a)
Three months ended | |||||||||||||||||||
March 31 | December 31 | September 30 | June 30 | March 31 | |||||||||||||||
Dollars in millions | 2020 | 2019 | 2019 | 2019 | 2019 | ||||||||||||||
Income Statement | |||||||||||||||||||
Net interest income | $ | 966 | $ | 969 | $ | 930 | $ | 917 | $ | 898 | |||||||||
Noninterest income | 694 | 646 | 654 | 661 | 576 | ||||||||||||||
Total revenue | 1,660 | 1,615 | 1,584 | 1,578 | 1,474 | ||||||||||||||
Provision for credit losses (benefit) | 458 | 65 | 48 | 100 | 71 | ||||||||||||||
Noninterest expense | 722 | 726 | 703 | 698 | 686 | ||||||||||||||
Pretax earnings | 480 | 824 | 833 | 780 | 717 | ||||||||||||||
Income taxes | 110 | 175 | 188 | 178 | 165 | ||||||||||||||
Earnings | $ | 370 | $ | 649 | $ | 645 | $ | 602 | $ | 552 | |||||||||
Average Balance Sheet | |||||||||||||||||||
Loans held for sale | $ | 395 | $ | 616 | $ | 720 | $ | 330 | $ | 347 | |||||||||
Loans | |||||||||||||||||||
Commercial | $ | 117,288 | $ | 114,113 | $ | 114,701 | $ | 113,702 | $ | 108,641 | |||||||||
Commercial real estate | 26,589 | 26,586 | 26,570 | 26,224 | 25,971 | ||||||||||||||
Equipment lease financing | 7,066 | 7,200 | 7,272 | 7,284 | 7,264 | ||||||||||||||
Total commercial lending | 150,943 | 147,899 | 148,543 | 147,210 | 141,876 | ||||||||||||||
Consumer | 9 | 11 | 13 | 16 | 20 | ||||||||||||||
Total loans | $ | 150,952 | $ | 147,910 | $ | 148,556 | $ | 147,226 | $ | 141,896 | |||||||||
Total assets | $ | 172,502 | $ | 167,555 | $ | 168,193 | $ | 163,897 | $ | 157,169 | |||||||||
Deposits | |||||||||||||||||||
Noninterest-bearing demand | $ | 40,651 | $ | 39,513 | $ | 38,740 | $ | 38,765 | $ | 39,551 | |||||||||
Interest-bearing demand | 21,101 | 20,851 | 20,523 | 18,702 | 17,827 | ||||||||||||||
Money market | 28,468 | 30,264 | 29,456 | 26,948 | 25,630 | ||||||||||||||
Other | 7,868 | 7,916 | 7,100 | 6,109 | 5,547 | ||||||||||||||
Total deposits | $ | 98,088 | $ | 98,544 | $ | 95,819 | $ | 90,524 | $ | 88,555 | |||||||||
Performance Ratios | |||||||||||||||||||
Return on average assets | .87 | % | 1.54 | % | 1.52 | % | 1.47 | % | 1.42 | % | |||||||||
Noninterest income to total revenue | 42 | % | 40 | % | 41 | % | 42 | % | 39 | % | |||||||||
Efficiency | 43 | % | 45 | % | 44 | % | 44 | % | 47 | % | |||||||||
Other Information | |||||||||||||||||||
Consolidated revenue from: | |||||||||||||||||||
Treasury Management (b) | $ | 491 | $ | 494 | $ | 460 | $ | 467 | $ | 445 | |||||||||
Capital Markets (b) | $ | 344 | $ | 291 | $ | 290 | $ | 313 | $ | 246 | |||||||||
Commercial mortgage banking activities | |||||||||||||||||||
Commercial mortgage loans held for sale (c) | $ | 29 | $ | 24 | $ | 38 | $ | 20 | $ | 15 | |||||||||
Commercial mortgage loan servicing income (d) | 69 | 71 | 71 | 65 | 54 | ||||||||||||||
Commercial mortgage servicing rights valuation, net of economic hedge (e) | 20 | 2 | 1 | 11 | 5 | ||||||||||||||
Total | $ | 118 | $ | 97 | $ | 110 | $ | 96 | $ | 74 | |||||||||
MSR asset value (f) | $ | 477 | $ | 649 | $ | 595 | $ | 630 | $ | 681 | |||||||||
Average Loans by C&IB business | |||||||||||||||||||
Corporate Banking | $ | 78,057 | $ | 75,665 | $ | 74,883 | $ | 74,366 | $ | 71,089 | |||||||||
Real Estate | 37,368 | 36,908 | 38,172 | 37,143 | 36,357 | ||||||||||||||
Business Credit | 23,251 | 22,900 | 22,824 | 22,877 | 21,728 | ||||||||||||||
Commercial Banking | 7,784 | 7,793 | 7,947 | 8,080 | 8,118 | ||||||||||||||
Other | 4,492 | 4,644 | 4,730 | 4,760 | 4,604 | ||||||||||||||
Total average loans | $ | 150,952 | $ | 147,910 | $ | 148,556 | $ | 147,226 | $ | 141,896 | |||||||||
Credit-related statistics | |||||||||||||||||||
Nonperforming assets (f) | $ | 508 | $ | 444 | $ | 526 | $ | 497 | $ | 388 | |||||||||
Net charge-offs - loans and leases | $ | 50 | $ | 47 | $ | 30 | $ | 23 | $ | 5 | |||||||||
(a) | See note (a) on page 12. |
(b) | Amounts reported in net interest income and noninterest income. |
(c) | Represents other noninterest income for valuations on commercial mortgage loans held for sale and related commitments, derivative valuations, originations fees, gains on sale of loans held for sale and net interest income on loans held for sale. |
(d) | Represents net interest income and noninterest income (primarily in corporate service fees) from loan servicing net of reduction in commercial mortgage servicing rights due to amortization expense and payoffs. Commercial mortgage servicing rights valuation, net of economic hedge is shown separately. |
(e) | Amounts are reported in corporate service fees. |
(f) | Presented as of period end. |
THE PNC FINANCIAL SERVICES GROUP, INC. | Page 16 | |
Table 19: Asset Management Group (Unaudited) (a)
Three months ended | |||||||||||||||||||
March 31 | December 31 | September 30 | June 30 | March 31 | |||||||||||||||
Dollars in millions, except as noted | 2020 | 2019 | 2019 | 2019 | 2019 | ||||||||||||||
Income Statement | |||||||||||||||||||
Net interest income | $ | 88 | $ | 80 | $ | 70 | $ | 68 | $ | 70 | |||||||||
Noninterest income | 204 | 272 | 216 | 286 | 217 | ||||||||||||||
Total revenue | 292 | 352 | 286 | 354 | 287 | ||||||||||||||
Provision for credit losses (benefit) | 3 | 1 | (1 | ) | — | (1 | ) | ||||||||||||
Noninterest expense | 219 | 232 | 228 | 249 | 230 | ||||||||||||||
Pretax earnings | 70 | 119 | 59 | 105 | 58 | ||||||||||||||
Income taxes | 16 | 28 | 13 | 25 | 13 | ||||||||||||||
Earnings | $ | 54 | $ | 91 | $ | 46 | $ | 80 | $ | 45 | |||||||||
Average Balance Sheet | |||||||||||||||||||
Loans | |||||||||||||||||||
Consumer | $ | 4,052 | $ | 4,145 | $ | 4,207 | $ | 4,216 | $ | 4,362 | |||||||||
Commercial and commercial real estate | 856 | 793 | 758 | 731 | 752 | ||||||||||||||
Residential mortgage | 2,385 | 2,193 | 1,980 | 1,792 | 1,723 | ||||||||||||||
Total loans | $ | 7,293 | $ | 7,131 | $ | 6,945 | $ | 6,739 | $ | 6,837 | |||||||||
Total assets | $ | 7,801 | $ | 7,697 | $ | 7,331 | $ | 7,150 | $ | 7,259 | |||||||||
Deposits | |||||||||||||||||||
Noninterest-bearing demand | $ | 1,468 | $ | 1,407 | $ | 1,299 | $ | 1,347 | $ | 1,388 | |||||||||
Interest-bearing demand | 6,850 | 6,846 | 3,393 | 2,891 | 3,076 | ||||||||||||||
Money market | 1,709 | 1,773 | 1,740 | 1,785 | 2,036 | ||||||||||||||
Savings | 7,197 | 6,950 | 6,302 | 5,875 | 5,723 | ||||||||||||||
Other | 847 | 898 | 893 | 797 | 697 | ||||||||||||||
Total deposits | $ | 18,071 | $ | 17,874 | $ | 13,627 | $ | 12,695 | $ | 12,920 | |||||||||
Performance Ratios | |||||||||||||||||||
Return on average assets | 2.81 | % | 4.69 | % | 2.49 | % | 4.49 | % | 2.51 | % | |||||||||
Noninterest income to total revenue | 70 | % | 77 | % | 76 | % | 81 | % | 76 | % | |||||||||
Efficiency | 75 | % | 66 | % | 80 | % | 70 | % | 80 | % | |||||||||
Other Information | |||||||||||||||||||
Nonperforming assets (b) | $ | 34 | $ | 39 | $ | 42 | $ | 45 | $ | 48 | |||||||||
Net charge-offs - loans and leases | $ | (1 | ) | $ | 4 | — | — | $ | 1 | ||||||||||
Client Assets Under Administration (in billions) (b) (c) | |||||||||||||||||||
Discretionary client assets under management | $ | 136 | $ | 154 | $ | 163 | $ | 162 | $ | 158 | |||||||||
Nondiscretionary client assets under administration | 128 | 143 | 135 | 132 | 130 | ||||||||||||||
Total | $ | 264 | $ | 297 | $ | 298 | $ | 294 | $ | 288 | |||||||||
Discretionary client assets under management | |||||||||||||||||||
Personal | $ | 84 | $ | 99 | $ | 98 | $ | 99 | $ | 95 | |||||||||
Institutional | 52 | 55 | 65 | 63 | 63 | ||||||||||||||
Total | $ | 136 | $ | 154 | $ | 163 | $ | 162 | $ | 158 | |||||||||
(a) | See note (a) on page 12. |
(b) | As of period end. |
(c) | Excludes brokerage account client assets. |
THE PNC FINANCIAL SERVICES GROUP, INC. | Page 17 | |
Glossary of Terms
Allowance for credit losses (ACL) - A valuation account that is deducted from or added to the amortized cost basis of the related financial assets to present the net carrying value at the amount expected to be collected on the financial asset.
Amortized cost basis - Amount at which a financial asset is originated or acquired, adjusted for applicable accretion or amortization of premiums, discounts and net deferred fees or costs, collection of cash, charge-offs, foreign exchange and fair value hedge accounting adjustments.
Adjusted average total assets - Primarily consisted of total average quarterly (or annual) assets plus/less unrealized losses (gains) on investment securities, less goodwill and certain other intangible assets (net of eligible deferred taxes).
Basel III common equity Tier 1 capital - Common stock plus related surplus, net of treasury stock, plus retained earnings, plus accumulated other comprehensive income for securities currently, and those transferred from, available for sale and pension and other postretirement benefit plans, subject to phase-in limits, less goodwill, net of associated deferred tax liabilities, less other disallowed intangibles, net of deferred tax liabilities and plus/less other adjustments. Significant common stock investments in unconsolidated financial institutions, as well as mortgage servicing rights and deferred tax assets, must then be deducted to the extent such items individually exceed 10%, or in the aggregate exceed 15%, of our adjusted Basel III common equity Tier 1 capital.
Basel III common equity Tier 1 capital (Tailoring Rules) - Common stock plus related surplus, net of treasury stock, plus retained earnings, less goodwill, net of associated deferred tax liabilities, less other disallowed intangibles, net of deferred tax liabilities and plus/less other adjustments. Investments in unconsolidated financial institutions, as well as mortgage servicing rights and deferred tax assets, must then be deducted to the extent such items individually exceed 25% of our adjusted Basel III common equity Tier 1 capital.
Basel III common equity Tier 1 capital ratio - Common equity Tier 1 capital divided by period-end risk-weighted assets (as applicable).
Basel III Tier 1 capital - Common equity Tier 1 capital, plus qualifying preferred stock, plus certain trust preferred capital securities, plus certain noncontrolling interests that are held by others and plus/less other adjustments.
Basel III Tier 1 capital ratio - Tier 1 capital divided by period-end risk-weighted assets (as applicable).
Basel III Total capital - Tier 1 capital plus qualifying subordinated debt, plus certain trust preferred securities, plus, under the Basel III transitional rules and the standardized approach, the allowance for loan and lease losses included in Tier 2 capital and other.
Basel III Total capital ratio - Basel III Total capital divided by period-end risk-weighted assets (as applicable).
Charge-off - Process of removing a loan or portion of a loan from our balance sheet because it is considered uncollectible. We also record a charge-off when a loan is transferred from portfolio holdings to held for sale by reducing the loan carrying amount to the fair value of the loan, if fair value is less than carrying amount.
Current Expected Credit Loss (CECL) - Methodology for estimating the allowance for credit losses on in-scope financial assets held at amortized cost and off-balance sheet credit exposures, which uses a combination of expected losses over a reasonable and supportable forecast period, a reversion period and long run average credit losses for their estimated contractual term.
Combined loan-to-value ratio (CLTV) - This is the aggregate principal balance(s) of the mortgages on a property divided by its appraised value or purchase price.
Common shareholders’ equity - Total shareholders' equity less the liquidation value of preferred stock.
Credit valuation adjustment - Represents an adjustment to the fair value of our derivatives for our own and counterparties’ non-performance risk.
Criticized commercial loans - Loans with potential or identified weaknesses based upon internal risk ratings that comply with the regulatory classification definitions of “Special Mention,” “Substandard” or “Doubtful.”
Discretionary client assets under management - Assets over which we have sole or shared investment authority for our customers/clients. We do not include these assets on our Consolidated Balance Sheet.
THE PNC FINANCIAL SERVICES GROUP, INC. | Page 18 | |
Duration of equity - An estimate of the rate sensitivity of our economic value of equity. A negative duration of equity is associated with asset sensitivity (i.e., positioned for rising interest rates), while a positive value implies liability sensitivity (i.e., positioned for declining interest rates). For example, if the duration of equity is -1.5 years, the economic value of equity increases by 1.5% for each 100 basis point increase in interest rates.
Earning assets - Assets that generate income, which include: interest-earning deposits with banks; loans held for sale; loans; investment securities; and certain other assets.
Effective duration - A measurement, expressed in years, that, when multiplied by a change in interest rates, would approximate the percentage change in value of on- and off- balance sheet positions.
Efficiency - Noninterest expense divided by total revenue.
Fair value - The price that would be received to sell an asset or paid to transfer a liability in an orderly transaction between market participants at the measurement date.
Fee income - Refers to the following categories within Noninterest income: Asset management; Consumer services; Corporate services; Residential mortgage; and Service charges on deposits.
FICO score - A credit bureau-based industry standard score created by Fair Isaac Co. which predicts the likelihood of borrower default. We use FICO scores both in underwriting and assessing credit risk in our consumer lending portfolio. Lower FICO scores indicate likely higher risk of default, while higher FICO scores indicate likely lower risk of default. FICO scores are updated on a periodic basis.
Futures and forward contracts - Contracts in which the buyer agrees to purchase and the seller agrees to deliver a specific financial instrument at a predetermined price or yield. May be settled either in cash or by delivery of the underlying financial instrument.
GAAP - Accounting principles generally accepted in the United States of America.
Impaired loans - Loans are determined to be impaired when, based on current information and events, it is probable that all contractually required payments will not be collected. Impaired loans include commercial nonperforming loans and consumer and commercial TDRs, regardless of nonperforming status. Excluded from impaired loans are nonperforming leases, loans held for sale, loans accounted for under the fair value option, smaller balance homogenous type loans and purchased impaired loans.
Leverage ratio - Basel III Tier 1 capital divided by average quarterly adjusted total assets.
LIBOR - Acronym for London InterBank Offered Rate. LIBOR is the average interest rate charged when banks in the London wholesale money market (or interbank market) borrow unsecured funds from each other. LIBOR rates are used as a benchmark for interest rates on a global basis. Our product set includes loans priced using LIBOR as a benchmark.
Loan-to-value ratio (LTV) - A calculation of a loan's collateral coverage that is used both in underwriting and assessing credit risk in our lending portfolio. LTV is the sum total of loan obligations secured by collateral divided by the market value of that same collateral. Market values of the collateral is based on an independent valuation of the collateral. For example, a LTV of less than 90% is better secured and has less credit risk than a LTV of greater than or equal to 90%.
Loss given default (LGD) - Assuming a credit obligor enters default status, an estimate of loss, based on collateral type, collateral value, loan exposure, and other factors. LGD is net of recovery, through any means, including but not limited to the liquidation of collateral or deficiency judgments rendered from foreclosure or bankruptcy proceedings.
Nonaccrual loans - Loans for which we do not accrue interest income. Nonaccrual loans include nonperforming loans, in addition to loans accounted for under fair value option and loans accounted for as held for sale for which full collection of contractual principal and/or interest is not probable.
Nondiscretionary client assets under administration - Assets we hold for our customers/clients in a nondiscretionary, custodial capacity. We do not include these assets on our Consolidated Balance Sheet.
Nonperforming assets - Nonperforming assets include nonperforming loans, OREO and foreclosed asserts. We do not accrue interest income on assets classified as nonperforming.
THE PNC FINANCIAL SERVICES GROUP, INC. | Page 19 | |
Nonperforming loans - Loans accounted for at amortized cost whose credit quality has deteriorated to the extent that full collection of contractual principal and interest is not probable, including TDRs which have not returned to performing status. Interest income is not recognized on nonperforming loans. Nonperforming loans exclude certain government insured or guaranteed loans for which we expect to collect substantially all principal and interest, loans held for sale and loans accounted for under the fair value option.
Notional amount - A number of currency units, shares, or other units specified in a derivative contract.
Off-balance sheet credit exposures - Standby letters of credit, financial guarantees, commitments to extend credit and similar unfunded obligations that are not unilaterally, unconditionally, cancelable at PNC’s option.
Operating leverage - The period to period dollar or percentage change in total revenue less the dollar or percentage change in noninterest expense. A positive variance indicates that revenue growth exceeded expense growth (i.e., positive operating leverage) while a negative variance implies expense growth exceeded revenue growth (i.e., negative operating leverage).
Options - Contracts that grant the purchaser, for a premium payment, the right, but not the obligation, to either purchase or sell the associated financial instrument at a set price during a specified period or at a specified date in the future.
Other real estate owned (OREO) and foreclosed assets - Assets taken in settlement of troubled loans primarily through deed-in-lieu of foreclosure or foreclosure. Foreclosed assets include real and personal property. Certain assets that have a government-guarantee which are classified as other receivables are excluded.
Probability of default (PD) - An estimate of the likelihood that a credit obligor will enter into default status.
Purchased credit deteriorated assets - Acquired loans or debt securities that, at acquisition, are determined to have experienced a more-than-insignificant deterioration in credit quality since origination or issuance.
Recovery - Cash proceeds received on a loan that we had previously charged off. We credit the amount received to the allowance for loan and lease losses.
Reasonable and supportable forecast period (RSFP) - In context of CECL, the period for which forecasts and projections of macroeconomic variables have been determined to be reasonable and supportable, and are used as inputs for ACL measurement.
Risk-weighted assets - Computed by the assignment of specific risk-weights (as defined by the Board of Governors of the Federal Reserve System) to assets and off-balance sheet instruments.
Servicing rights - An intangible asset or liability created by an obligation to service assets for others. Typical servicing rights include the right to receive a fee for collecting and forwarding payments on loans and related taxes and insurance premiums held in escrow.
Supplementary leverage ratio - Basel III Tier 1 capital divided by Supplementary leverage exposure.
Taxable-equivalent interest income - The interest income earned on certain assets that is completely or partially exempt from federal income tax. These tax-exempt instruments typically yield lower returns than taxable investments. To provide more meaningful comparisons of yields and margins for all interest-earning assets, we use interest income on a taxable-equivalent basis in calculating average yields and net interest margins by increasing the interest income earned on tax-exempt assets to make it fully equivalent to interest income earned on other taxable investments. This adjustment is not permitted under GAAP on the Consolidated Income Statement.
Troubled debt restructuring (TDR) - A loan whose terms have been restructured in a manner that grants a concession to a borrower experiencing financial difficulties.
Yield curve - A graph showing the relationship between the yields on financial instruments or market indices of the same credit quality with different maturities. For example, a “normal” or “positive” yield curve exists when long-term bonds have higher yields than short-term bonds. A “flat” yield curve exists when yields are the same for short-term and long-term bonds. A “steep” yield curve exists when yields on long-term bonds are significantly higher than on short-term bonds. An “inverted” or “negative” yield curve exists when short-term bonds have higher yields than long-term bonds.
Exhibit 99.2 First Quarter 2020 Earnings Conference Call April 15, 2020 The PNC Financial Services Group
Cautionary Statement Regarding Forward-Looking and Non-GAAP Financial Information Our earnings conference call presentation is not intended as a full business or financial review and should be viewed in the context of all of the information made available by PNC in its SEC filings and on our corporate website. The presentation contains forward-looking statements regarding our outlook for earnings, revenues, expenses, tax rates, capital and liquidity levels and ratios, asset levels, asset quality, financial position, and other matters regarding or affecting PNC and its future business and operations. Forward-looking statements are necessarily subject to numerous assumptions, risks and uncertainties, which change over time. The forward-looking statements in this presentation are qualified by the factors affecting forward-looking statements identified in the more detailed Cautionary Statement included in the Appendix. We provide greater detail regarding these as well as other factors in our 2019 Form 10-K and in our subsequent SEC filings. In particular, our forward-looking statements are subject to risks and uncertainties related to the COVID-19 pandemic and the resulting governmental and societal responses. Our forward-looking statements may also be subject to risks and uncertainties including those we may discuss in this presentation or in our SEC filings. Future events or circumstances may change our outlook and may also affect the nature of the assumptions, risks and uncertainties to which our forward-looking statements are subject. Forward-looking statements in this presentation speak only as of the date of this presentation. We do not assume any duty and do not undertake to update those statements. Actual results or future events could differ, possibly materially, from those anticipated in forward- looking statements, as well as from historical performance. As a result, we caution against placing undue reliance on any forward-looking statements. We include non-GAAP financial information in this presentation. Non-GAAP financial information includes financial metrics such as fee income, tangible book value, pretax, pre-provision earnings and return on tangible common equity. Reconciliations for such financial information may be found in our presentation, in these slides, including the Appendix, in other materials on our corporate website, and in our SEC filings. This information supplements our results as reported in accordance with GAAP and should not be viewed in isolation from, or as a substitute for, our GAAP results. We believe that this information and the related reconciliations may be useful to investors, analysts, regulators and others to help understand and evaluate our financial results, and with respect to adjusted metrics, because we believe they better reflect the ongoing financial results and trends of our businesses and increase comparability of period-to- period results. We may also use annualized, pro forma, estimated or third party numbers for illustrative or comparative purposes only. These may not reflect actual results. References to our corporate website are to www.pnc.com under “About Us - Investor Relations.” Our SEC filings are available both on our corporate website and on the SEC’s website at www.sec.gov. We include web addresses here as inactive textual references only. Information on these websites is not part of this presentation. 2
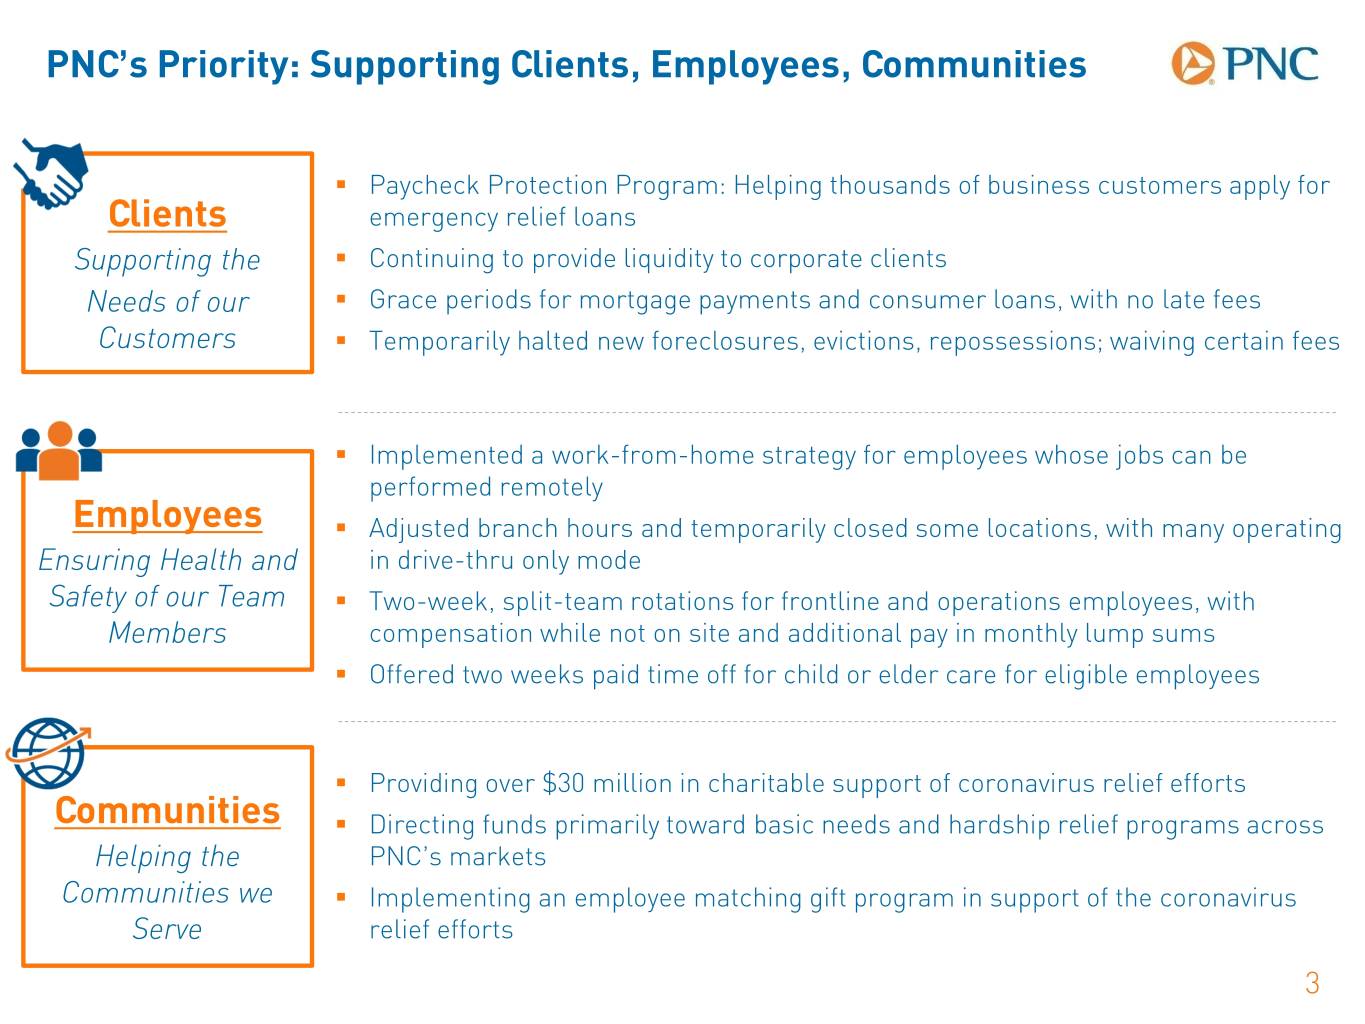
PNC’s Priority: Supporting Clients, Employees, Communities . Paycheck Protection Program: Helping thousands of business customers apply for Clients emergency relief loans Supporting the . Continuing to provide liquidity to corporate clients Needs of our . Grace periods for mortgage payments and consumer loans, with no late fees Customers . Temporarily halted new foreclosures, evictions, repossessions; waiving certain fees . Implemented a work-from-home strategy for employees whose jobs can be performed remotely Employees . Adjusted branch hours and temporarily closed some locations, with many operating Ensuring Health and in drive-thru only mode Safety of our Team . Two-week, split-team rotations for frontline and operations employees, with Members compensation while not on site and additional pay in monthly lump sums . Offered two weeks paid time off for child or elder care for eligible employees . Providing over $30 million in charitable support of coronavirus relief efforts Communities . Directing funds primarily toward basic needs and hardship relief programs across Helping the PNC’s markets Communities we . Implementing an employee matching gift program in support of the coronavirus Serve relief efforts 3
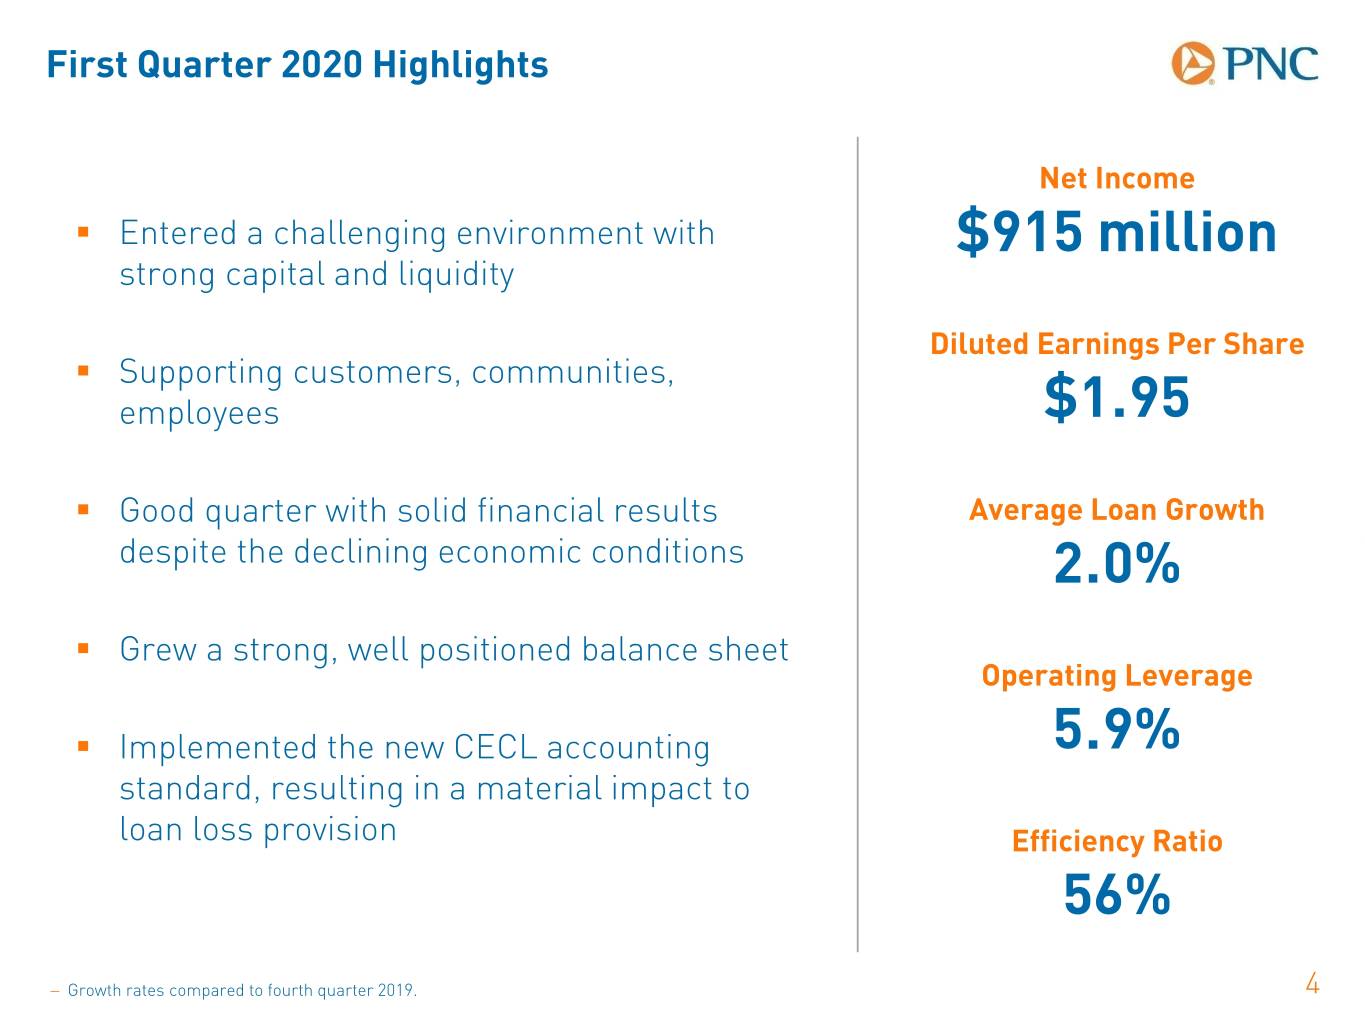
First Quarter 2020 Highlights Net Income . Entered a challenging environment with $915 million strong capital and liquidity Diluted Earnings Per Share . Supporting customers, communities, employees $1.95 . Good quarter with solid financial results Average Loan Growth despite the declining economic conditions 2.0% . Grew a strong, well positioned balance sheet Operating Leverage . Implemented the new CECL accounting 5.9% standard, resulting in a material impact to loan loss provision Efficiency Ratio 56% − Growth rates compared to fourth quarter 2019. 4
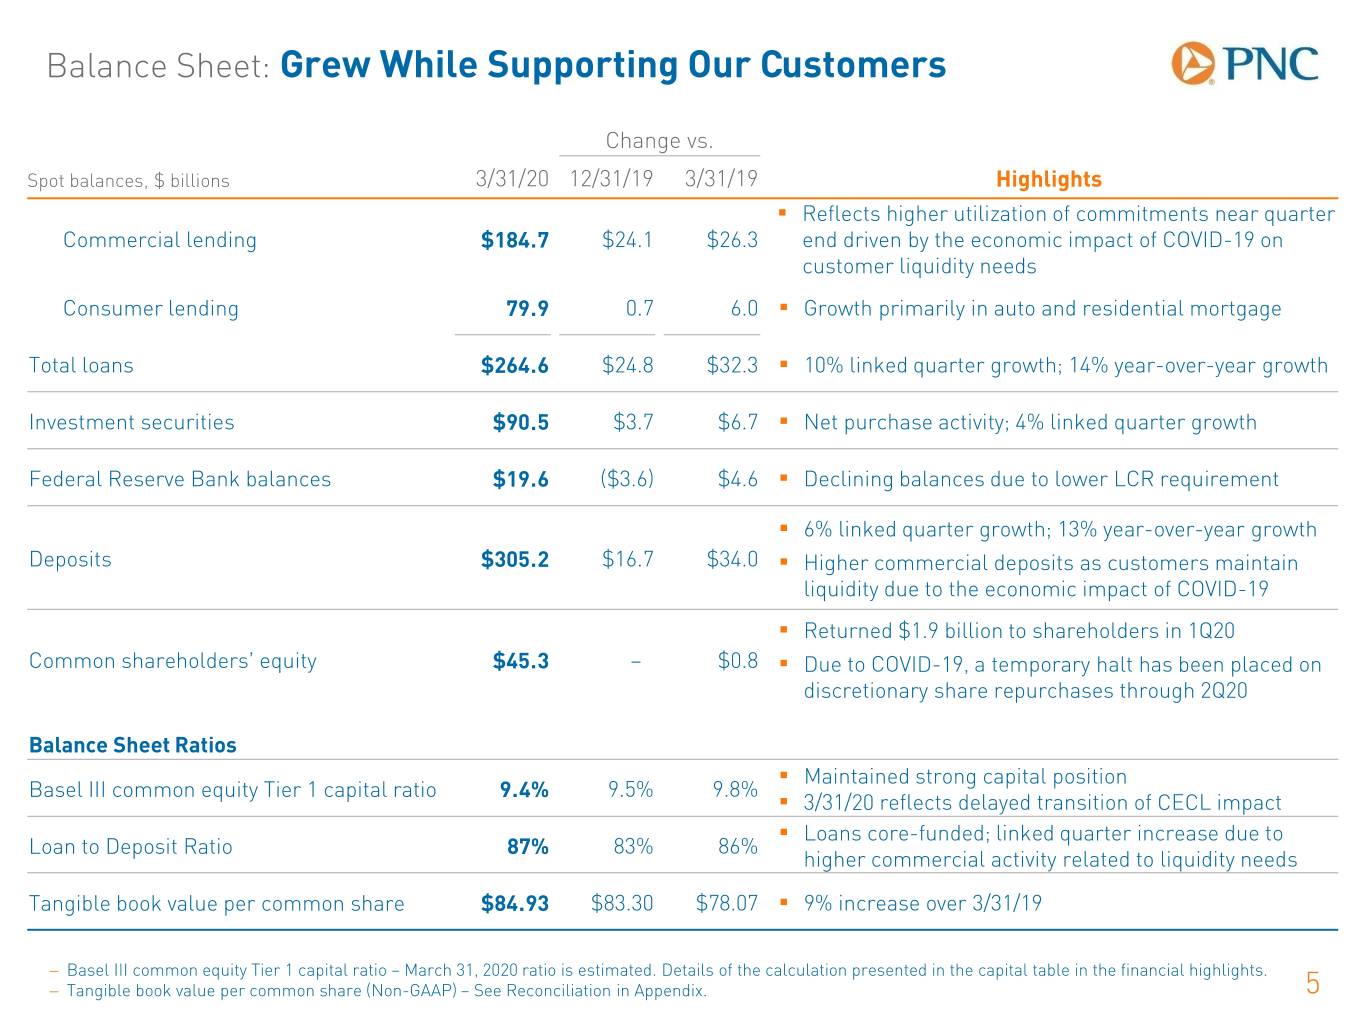
Balance Sheet: Grew While Supporting Our Customers Change vs. Spot balances, $ billions 3/31/20 12/31/19 3/31/19 Highlights . Reflects higher utilization of commitments near quarter Commercial lending $184.7 $24.1 $26.3 end driven by the economic impact of COVID-19 on customer liquidity needs Consumer lending 79.9 0.7 6.0 . Growth primarily in auto and residential mortgage Total loans $264.6 $24.8 $32.3 . 10% linked quarter growth; 14% year-over-year growth Investment securities $90.5 $3.7 $6.7 . Net purchase activity; 4% linked quarter growth Federal Reserve Bank balances $19.6 ($3.6) $4.6 . Declining balances due to lower LCR requirement . 6% linked quarter growth; 13% year-over-year growth Deposits $305.2 $16.7 $34.0 . Higher commercial deposits as customers maintain liquidity due to the economic impact of COVID-19 . Returned $1.9 billion to shareholders in 1Q20 Common shareholders’ equity $45.3 – $0.8 . Due to COVID-19, a temporary halt has been placed on discretionary share repurchases through 2Q20 Balance Sheet Ratios . Maintained strong capital position Basel III common equity Tier 1 capital ratio 9.4% 9.5% 9.8% . 3/31/20 reflects delayed transition of CECL impact . Loans core-funded; linked quarter increase due to Loan to Deposit Ratio 87% 83% 86% higher commercial activity related to liquidity needs Tangible book value per common share $84.93 $83.30 $78.07 . 9% increase over 3/31/19 − Basel III common equity Tier 1 capital ratio – March 31, 2020 ratio is estimated. Details of the calculation presented in the capital table in the financial highlights. − Tangible book value per common share (Non-GAAP) – See Reconciliation in Appendix. 5
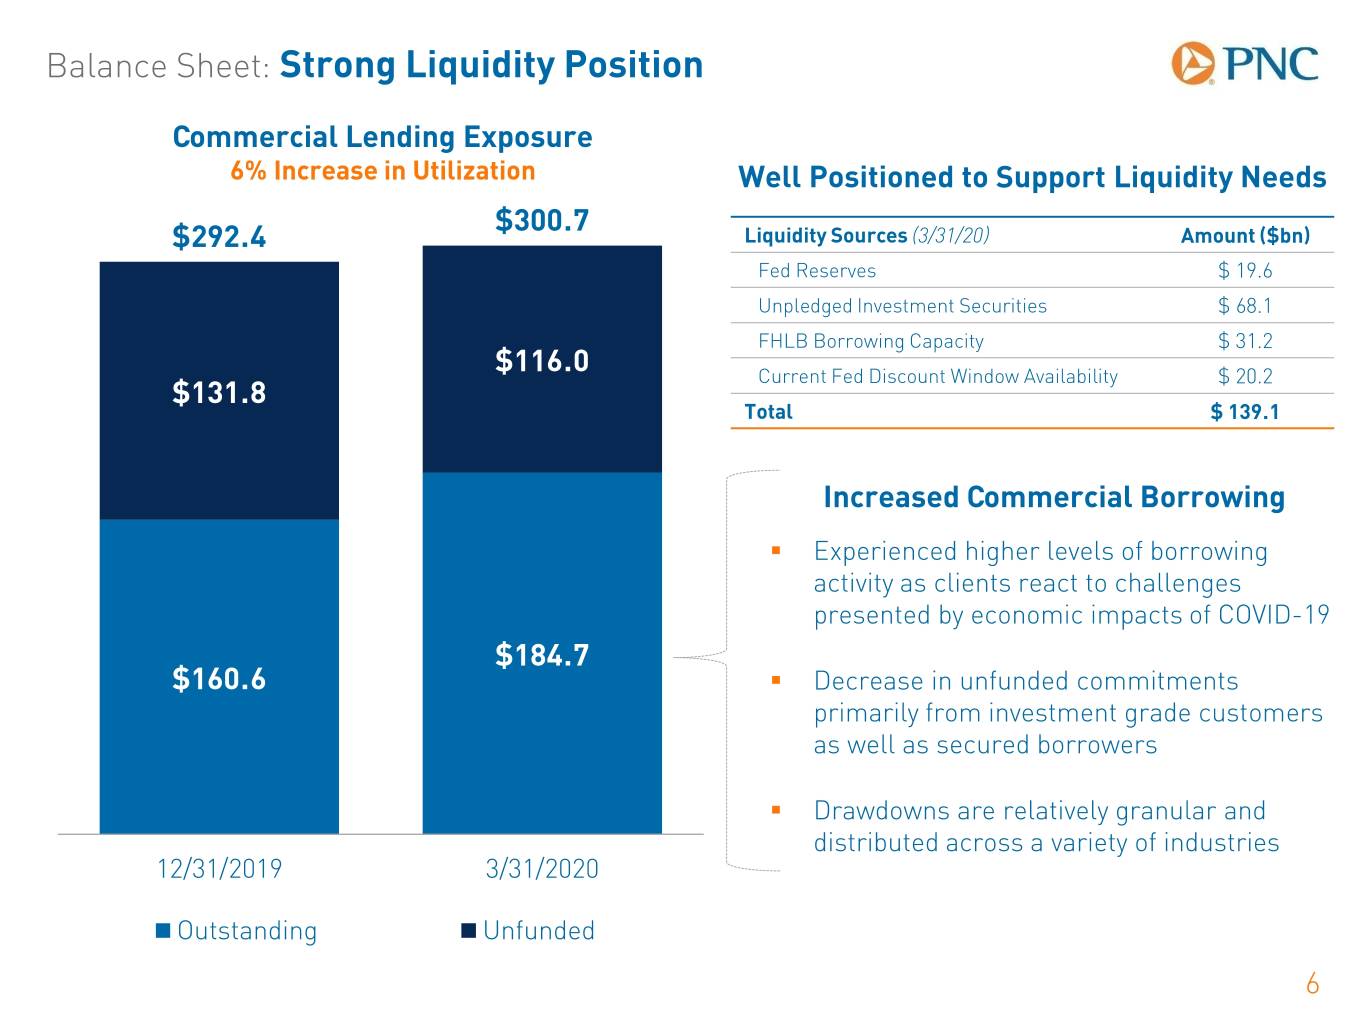
Balance Sheet: Strong Liquidity Position Commercial Lending Exposure 6% Increase in Utilization Well Positioned to Support Liquidity Needs $300.7 $292.4 Liquidity Sources (3/31/20) Amount ($bn) Fed Reserves $ 19.6 Unpledged Investment Securities $ 68.1 FHLB Borrowing Capacity $ 31.2 $116.0 Current Fed Discount Window Availability $ 20.2 $131.8 Total $ 139.1 Increased Commercial Borrowing . Experienced higher levels of borrowing activity as clients react to challenges presented by economic impacts of COVID-19 $184.7 $160.6 . Decrease in unfunded commitments primarily from investment grade customers as well as secured borrowers . Drawdowns are relatively granular and distributed across a variety of industries 12/31/2019 3/31/2020 Outstanding Unfunded 6
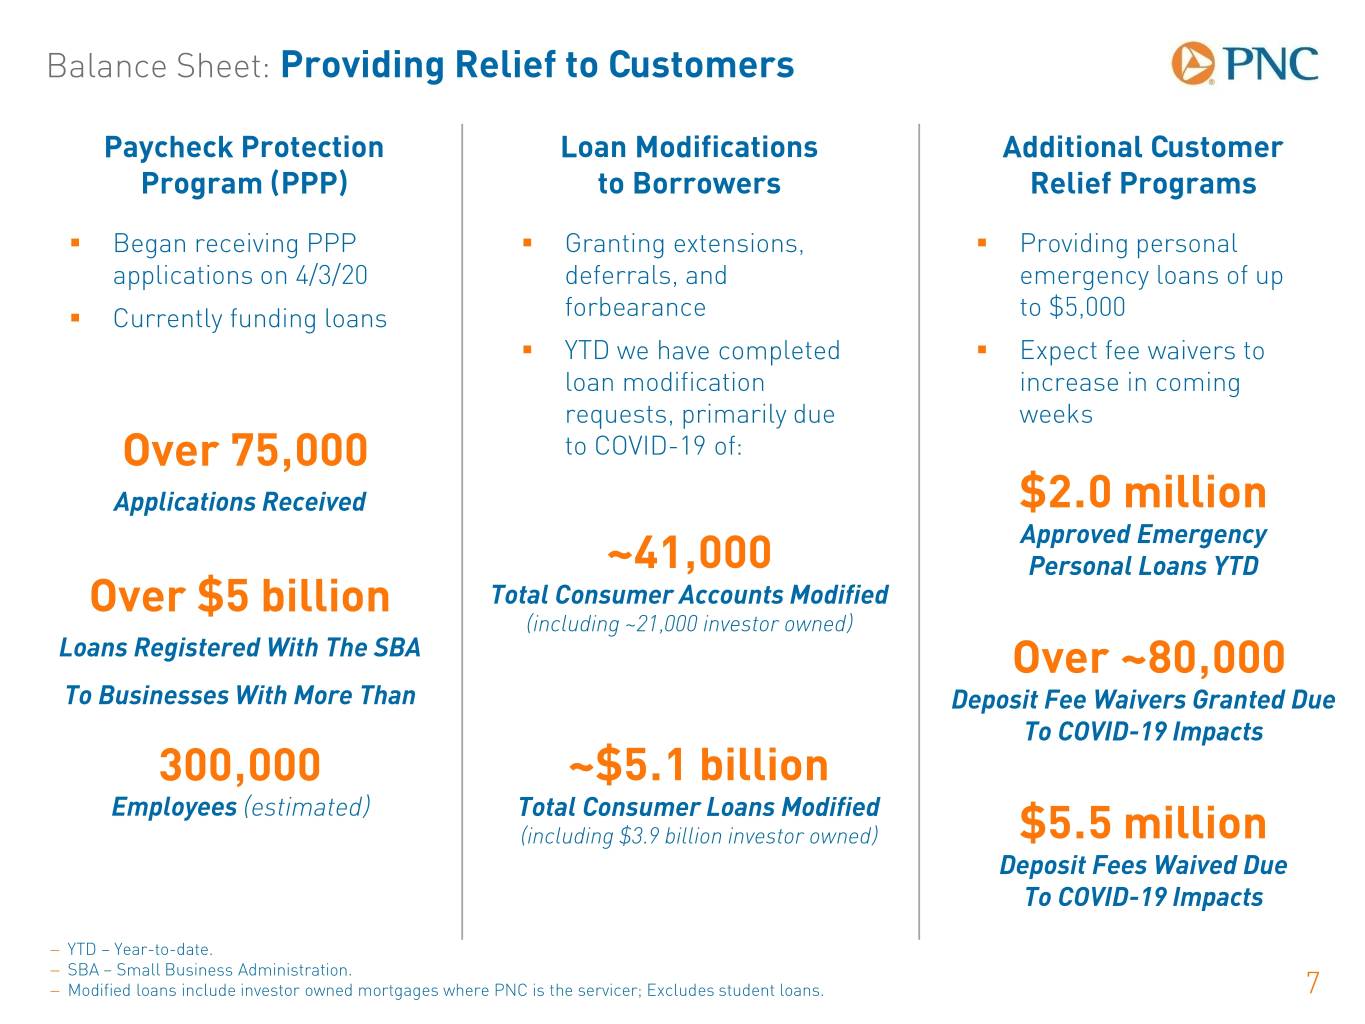
Balance Sheet: Providing Relief to Customers Paycheck Protection Loan Modifications Additional Customer Program (PPP) to Borrowers Relief Programs . Began receiving PPP . Granting extensions, . Providing personal applications on 4/3/20 deferrals, and emergency loans of up . Currently funding loans forbearance to $5,000 . YTD we have completed . Expect fee waivers to loan modification increase in coming requests, primarily due weeks Over 75,000 to COVID-19 of: Applications Received $2.0 million Approved Emergency ~41,000 Personal Loans YTD Over $5 billion Total Consumer Accounts Modified (including ~21,000 investor owned) Loans Registered With The SBA Over ~80,000 To Businesses With More Than Deposit Fee Waivers Granted Due To COVID-19 Impacts 300,000 ~$5.1 billion Employees (estimated) Total Consumer Loans Modified (including $3.9 billion investor owned) $5.5 million Deposit Fees Waived Due To COVID-19 Impacts − YTD – Year-to-date. − SBA – Small Business Administration. − Modified loans include investor owned mortgages where PNC is the servicer; Excludes student loans. 7
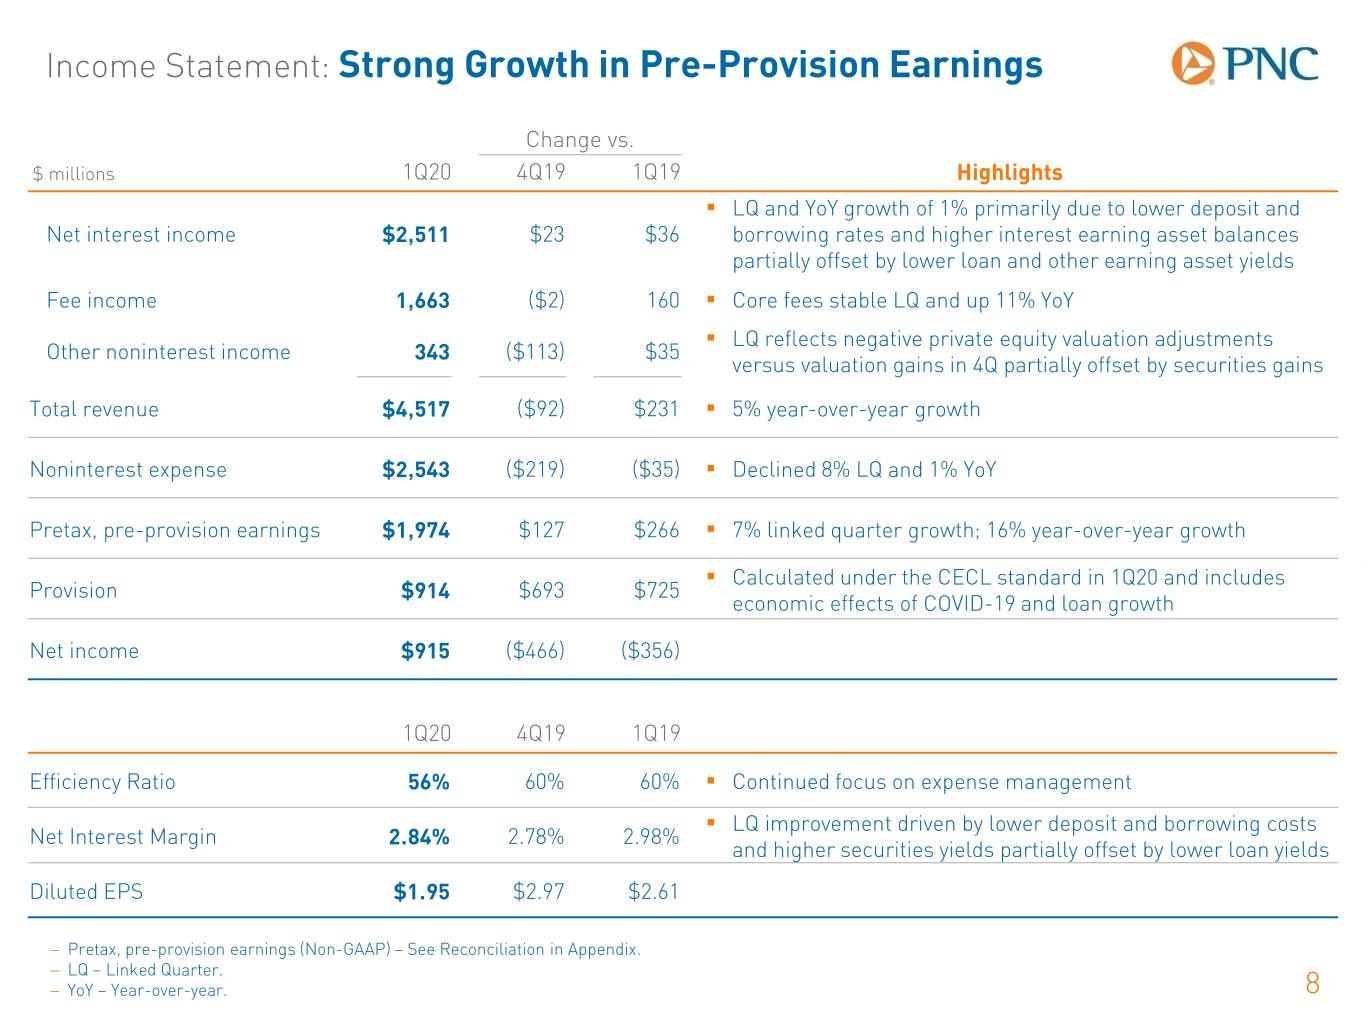
Income Statement: Strong Growth in Pre-Provision Earnings Change vs. $ millions 1Q20 4Q19 1Q19 Highlights . LQ and YoY growth of 1% primarily due to lower deposit and Net interest income $2,511 $23 $36 borrowing rates and higher interest earning asset balances partially offset by lower loan and other earning asset yields Fee income 1,663 ($2) 160 . Core fees stable LQ and up 11% YoY . LQ reflects negative private equity valuation adjustments Other noninterest income 343 ($113) $35 versus valuation gains in 4Q partially offset by securities gains Total revenue $4,517 ($92) $231 . 5% year-over-year growth Noninterest expense $2,543 ($219) ($35) . Declined 8% LQ and 1% YoY Pretax, pre-provision earnings $1,974 $127 $266 . 7% linked quarter growth; 16% year-over-year growth . Calculated under the CECL standard in 1Q20 and includes Provision $914 $693 $725 economic effects of COVID-19 and loan growth Net income $915 ($466) ($356) 1Q20 4Q19 1Q19 Efficiency Ratio 56% 60% 60% . Continued focus on expense management . LQ improvement driven by lower deposit and borrowing costs Net Interest Margin 2.84% 2.78% 2.98% and higher securities yields partially offset by lower loan yields Diluted EPS $1.95 $2.97 $2.61 − Pretax, pre-provision earnings (Non-GAAP) – See Reconciliation in Appendix. − LQ – Linked Quarter. − YoY – Year-over-year. 8
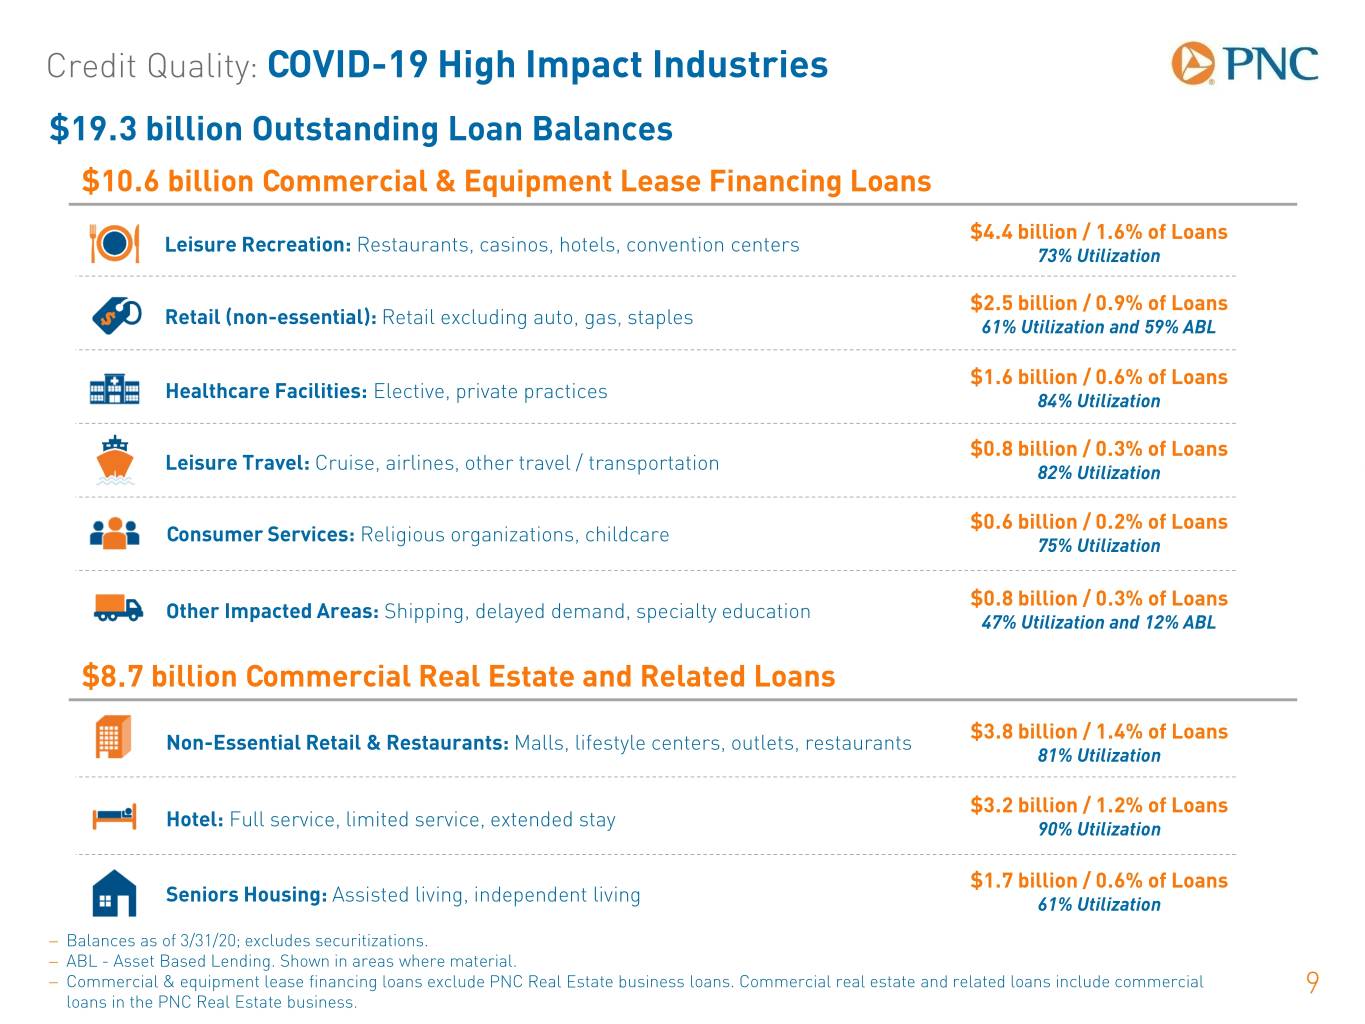
Credit Quality: COVID-19 High Impact Industries $19.3 billion Outstanding Loan Balances $10.6 billion Commercial & Equipment Lease Financing Loans $4.4 billion / 1.6% of Loans Leisure Recreation: Restaurants, casinos, hotels, convention centers 73% Utilization $2.5 billion / 0.9% of Loans Retail (non-essential): Retail excluding auto, gas, staples 61% Utilization and 59% ABL $1.6 billion / 0.6% of Loans Healthcare Facilities: Elective, private practices 84% Utilization $0.8 billion / 0.3% of Loans Leisure Travel: Cruise, airlines, other travel / transportation 82% Utilization $0.6 billion / 0.2% of Loans Consumer Services: Religious organizations, childcare 75% Utilization $0.8 billion / 0.3% of Loans Other Impacted Areas: Shipping, delayed demand, specialty education 47% Utilization and 12% ABL $8.7 billion Commercial Real Estate and Related Loans $3.8 billion / 1.4% of Loans Non-Essential Retail & Restaurants: Malls, lifestyle centers, outlets, restaurants 81% Utilization $3.2 billion / 1.2% of Loans Hotel: Full service, limited service, extended stay 90% Utilization $1.7 billion / 0.6% of Loans Seniors Housing: Assisted living, independent living 61% Utilization − Balances as of 3/31/20; excludes securitizations. − ABL - Asset Based Lending. Shown in areas where material. − Commercial & equipment lease financing loans exclude PNC Real Estate business loans. Commercial real estate and related loans include commercial 9 loans in the PNC Real Estate business.
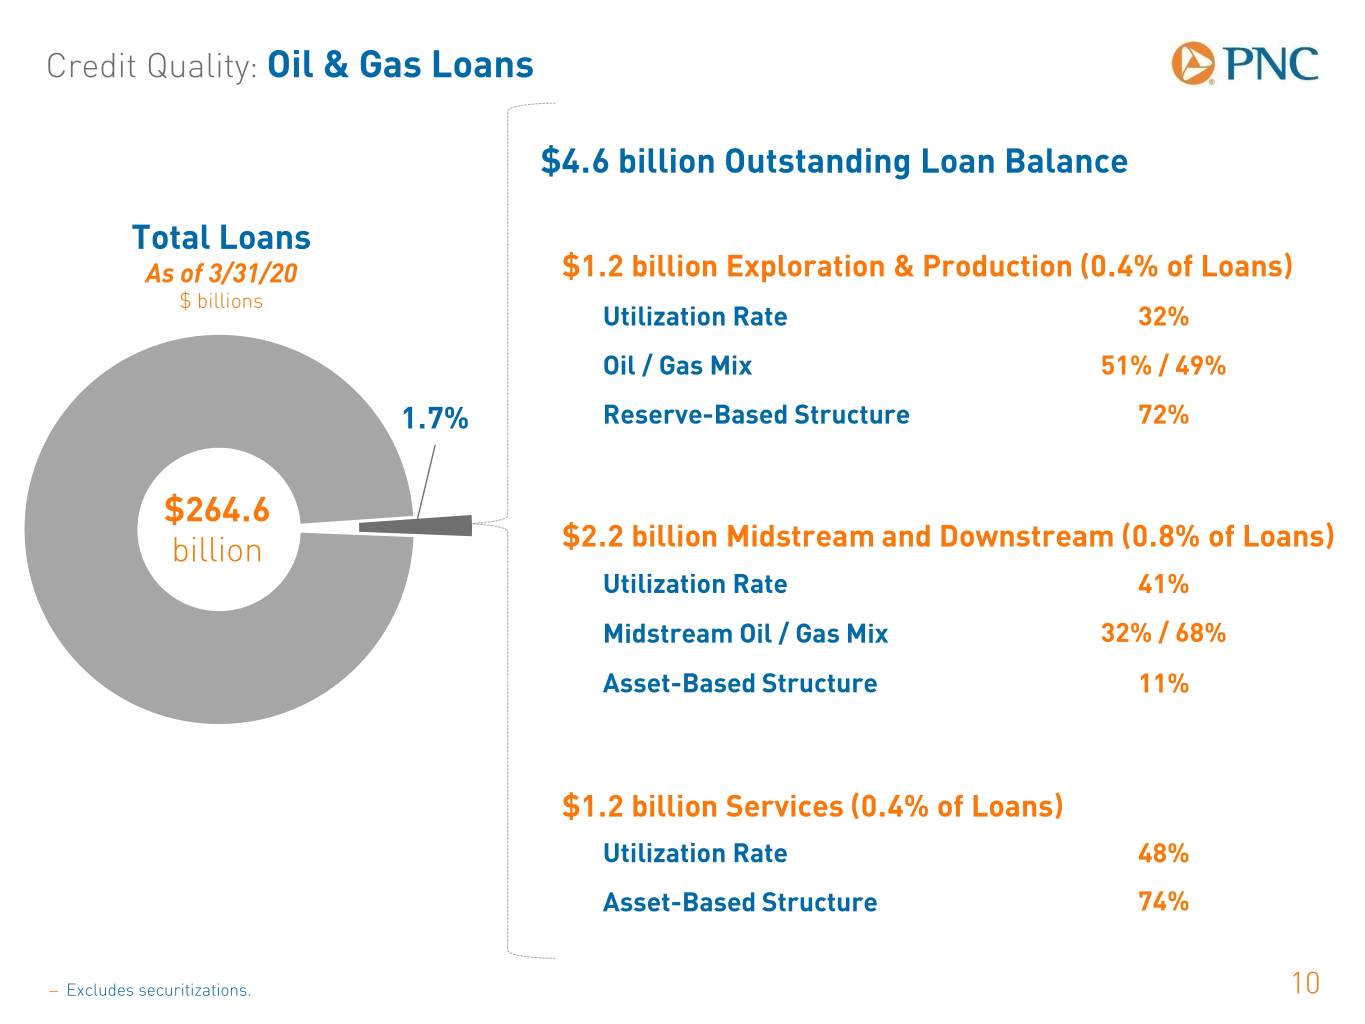
Credit Quality: Oil & Gas Loans $4.6 billion Outstanding Loan Balance Total Loans As of 3/31/20 $1.2 billion Exploration & Production (0.4% of Loans) $ billions Utilization Rate 32% Oil / Gas Mix 51% / 49% 1.7% Reserve-Based Structure 72% $264.6 billion $2.2 billion Midstream and Downstream (0.8% of Loans) Utilization Rate 41% Midstream Oil / Gas Mix 32% / 68% Asset-Based Structure 11% $1.2 billion Services (0.4% of Loans) Utilization Rate 48% Asset-Based Structure 74% − Excludes securitizations. 10
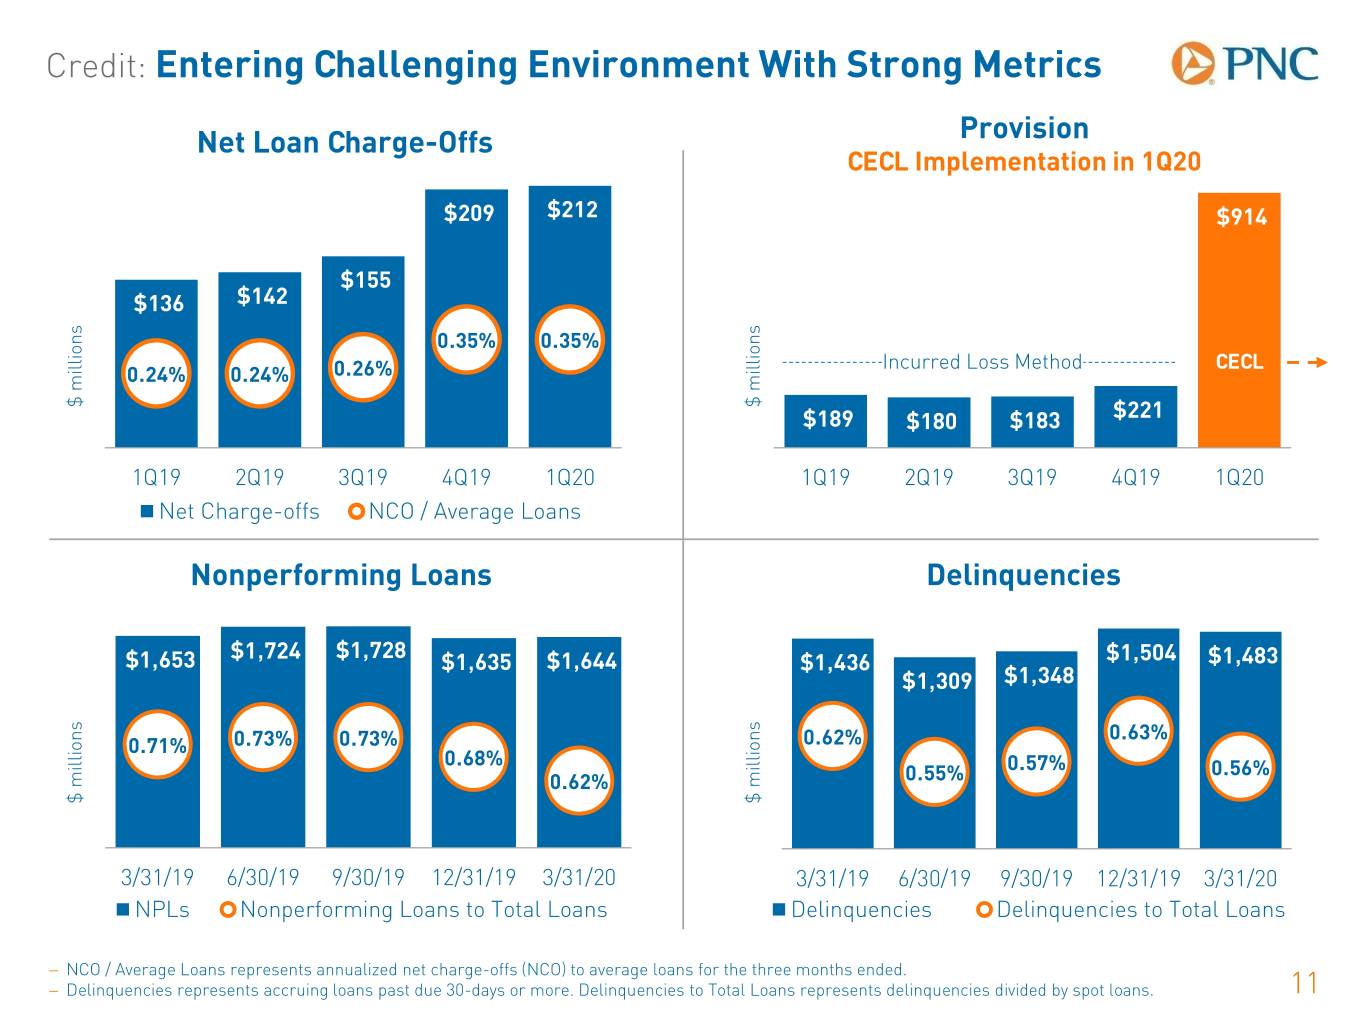
Credit: Entering Challenging Environment With Strong Metrics Net Loan Charge-Offs 1.00% Provision CECL Implementation in 1Q20 0.80% $209 $212 $914 0.60% $155 $136 $142 0.40% 0.35% 0.35% 0.26% Incurred Loss Method CECL 0.24% 0.24% 0.20% $ millions $ millions $221 $189 $180 $183 0.00% 1Q19 2Q19 3Q19 4Q19 1Q20 1Q19 2Q19 3Q19 4Q19 1Q20 Net Charge-offs NCO / Average Loans Nonperforming Loans Delinquencies 0.90% $1,600 $1,400 0.80% $1,653 $1,724 $1,728 $1,504 $1,483 $1,635 $1,644 $1,200 $1,436 $1,309 $1,348 0.70% $1,000 $800 0.63% 0.71% 0.73% 0.73% 0.62% 0.60% 0.68% $600 0.55% 0.57% 0.56% 0.62% $400 0.50% $ millions $ millions $200 $- 0.40% 3/31/19 6/30/19 9/30/19 12/31/19 3/31/20 3/31/19 6/30/19 9/30/19 12/31/19 3/31/20 NPLs Nonperforming Loans to Total Loans Delinquencies Delinquencies to Total Loans − NCO / Average Loans represents annualized net charge-offs (NCO) to average loans for the three months ended. − Delinquencies represents accruing loans past due 30-days or more. Delinquencies to Total Loans represents delinquencies divided by spot loans. 11
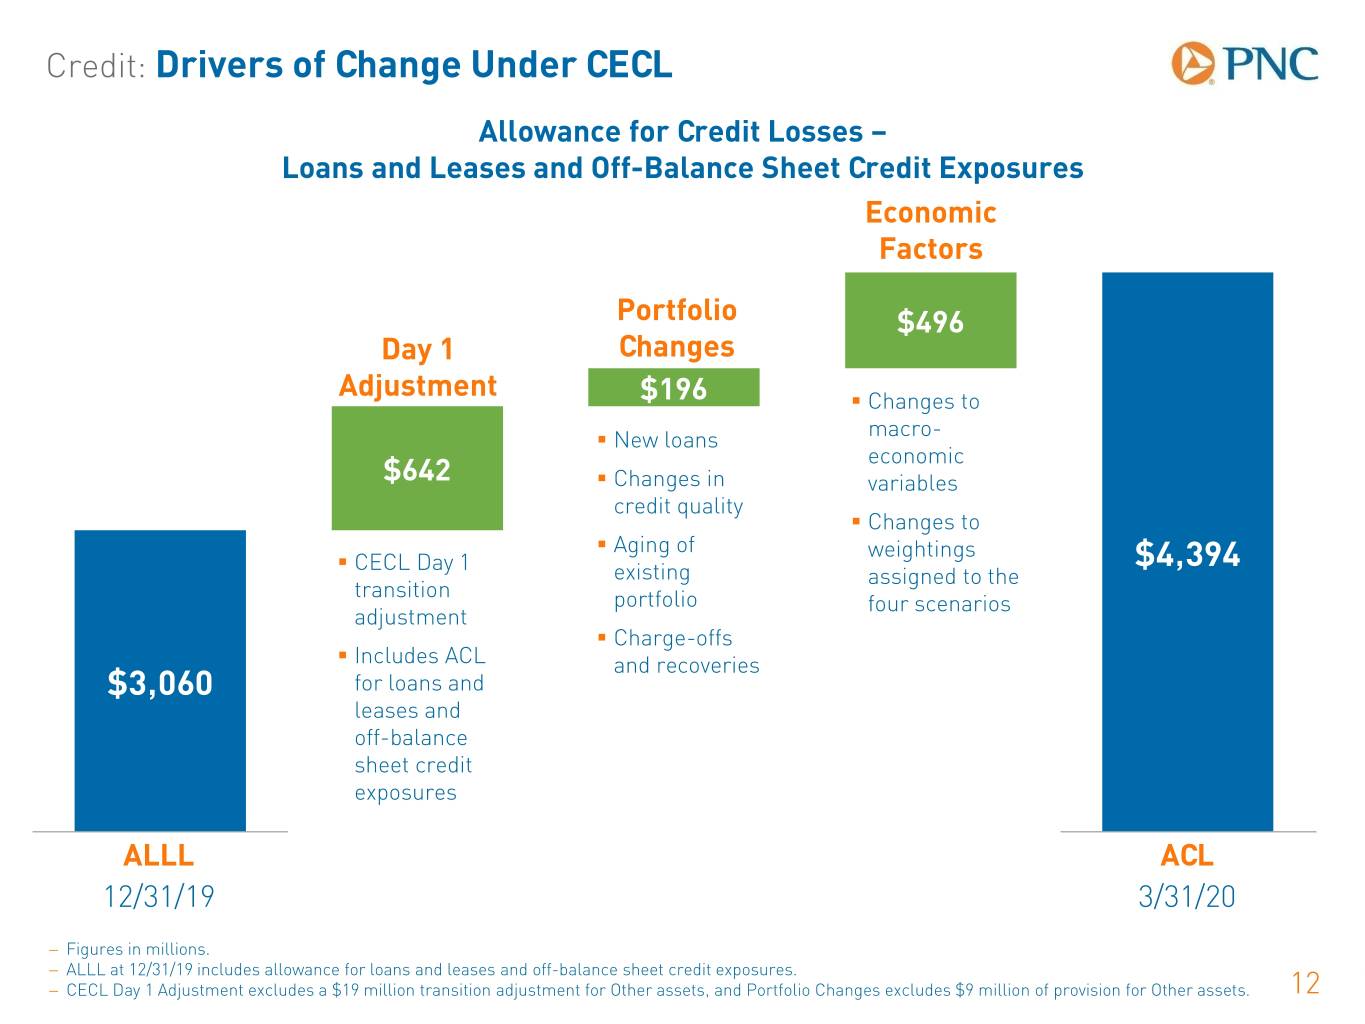
Credit: Drivers of Change Under CECL Allowance for Credit Losses – Loans and Leases and Off-Balance Sheet Credit Exposures Economic Factors Portfolio $496 Day 1 Changes Adjustment $196 . Changes to macro- . New loans economic $642 . Changes in variables credit quality . Changes to . Aging of weightings . CECL Day 1 $4,394 existing assigned to the transition portfolio four scenarios adjustment . Charge-offs . Includes ACL and recoveries $3,060 for loans and leases and off-balance sheet credit exposures 1 2 3 4 5 ALLL ACL 12/31/19 3/31/20 − Figures in millions. − ALLL at 12/31/19 includes allowance for loans and leases and off-balance sheet credit exposures. − CECL Day 1 Adjustment excludes a $19 million transition adjustment for Other assets, and Portfolio Changes excludes $9 million of provision for Other assets. 12
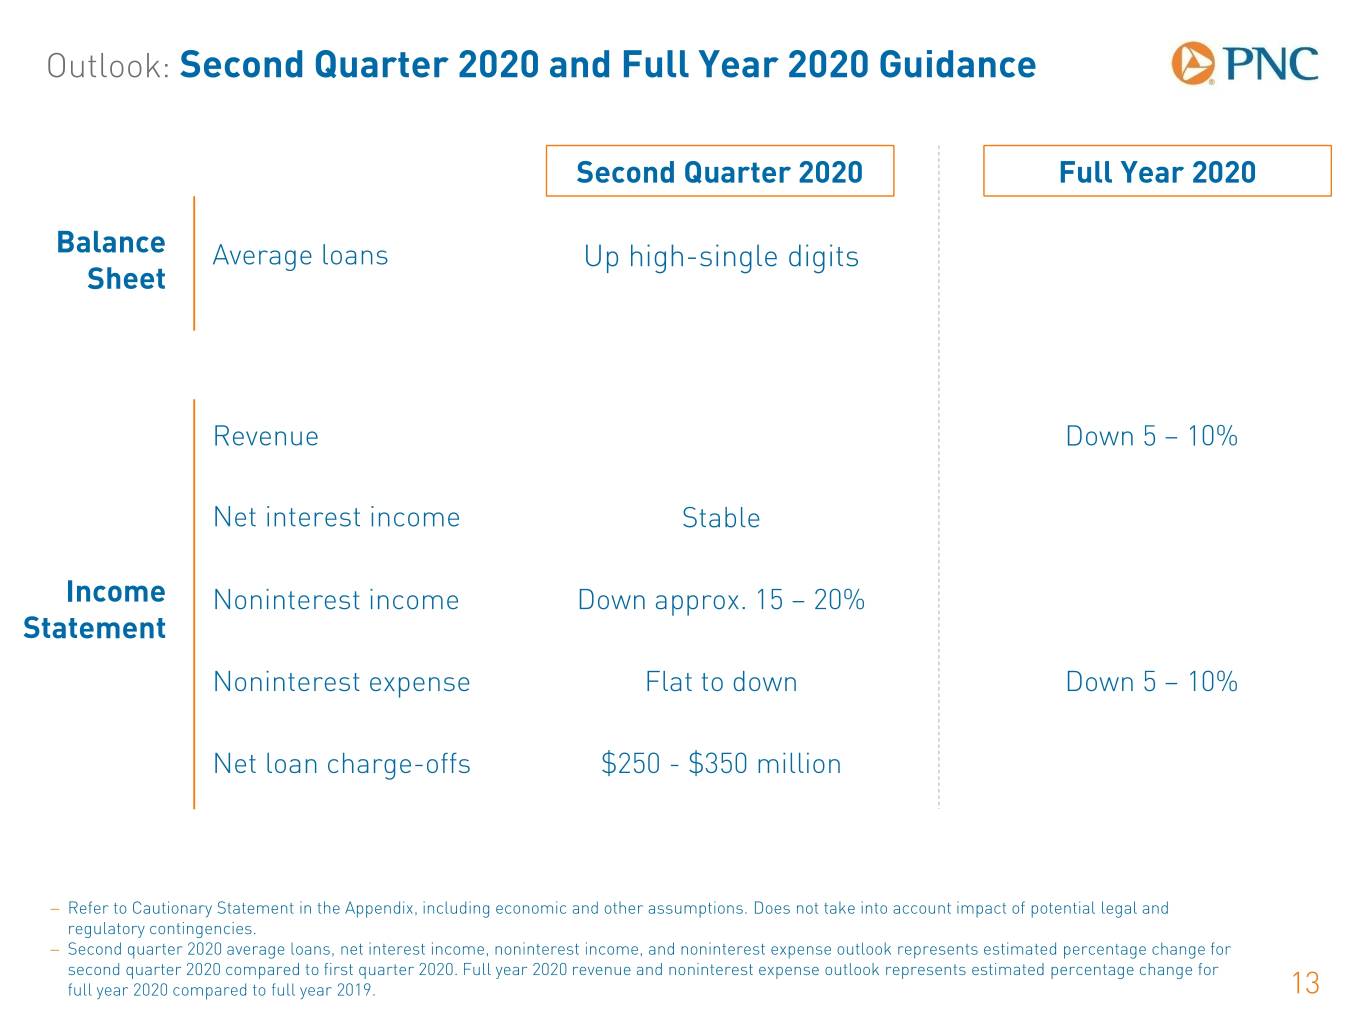
Outlook: Second Quarter 2020 and Full Year 2020 Guidance Second Quarter 2020 Full Year 2020 Balance Average loans Up high-single digits Sheet Revenue Down 5 – 10% Net interest income Stable Income Noninterest income Down approx. 15 – 20% Statement Noninterest expense Flat to down Down 5 – 10% Net loan charge-offs $250 - $350 million − Refer to Cautionary Statement in the Appendix, including economic and other assumptions. Does not take into account impact of potential legal and regulatory contingencies. − Second quarter 2020 average loans, net interest income, noninterest income, and noninterest expense outlook represents estimated percentage change for second quarter 2020 compared to first quarter 2020. Full year 2020 revenue and noninterest expense outlook represents estimated percentage change for full year 2020 compared to full year 2019. 13
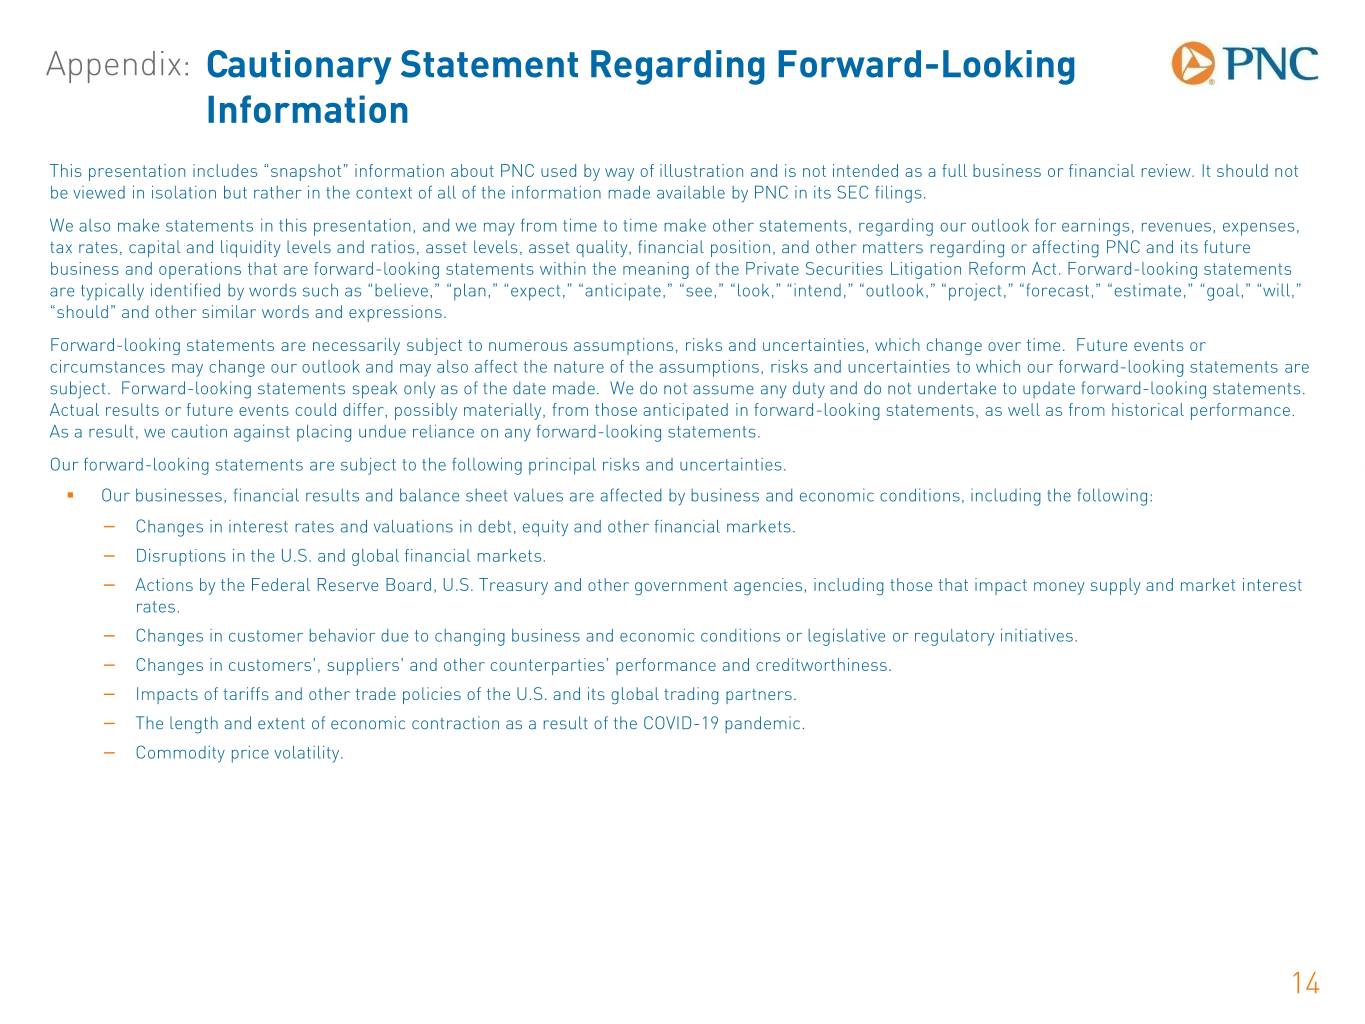
Appendix: Cautionary Statement Regarding Forward-Looking Information This presentation includes “snapshot” information about PNC used by way of illustration and is not intended as a full business or financial review. It should not be viewed in isolation but rather in the context of all of the information made available by PNC in its SEC filings. We also make statements in this presentation, and we may from time to time make other statements, regarding our outlook for earnings, revenues, expenses, tax rates, capital and liquidity levels and ratios, asset levels, asset quality, financial position, and other matters regarding or affecting PNC and its future business and operations that are forward-looking statements within the meaning of the Private Securities Litigation Reform Act. Forward-looking statements are typically identified by words such as “believe,” “plan,” “expect,” “anticipate,” “see,” “look,” “intend,” “outlook,” “project,” “forecast,” “estimate,” “goal,” “will,” “should” and other similar words and expressions. Forward-looking statements are necessarily subject to numerous assumptions, risks and uncertainties, which change over time. Future events or circumstances may change our outlook and may also affect the nature of the assumptions, risks and uncertainties to which our forward-looking statements are subject. Forward-looking statements speak only as of the date made. We do not assume any duty and do not undertake to update forward-looking statements. Actual results or future events could differ, possibly materially, from those anticipated in forward-looking statements, as well as from historical performance. As a result, we caution against placing undue reliance on any forward-looking statements. Our forward-looking statements are subject to the following principal risks and uncertainties. . Our businesses, financial results and balance sheet values are affected by business and economic conditions, including the following: − Changes in interest rates and valuations in debt, equity and other financial markets. − Disruptions in the U.S. and global financial markets. − Actions by the Federal Reserve Board, U.S. Treasury and other government agencies, including those that impact money supply and market interest rates. − Changes in customer behavior due to changing business and economic conditions or legislative or regulatory initiatives. − Changes in customers’, suppliers’ and other counterparties’ performance and creditworthiness. − Impacts of tariffs and other trade policies of the U.S. and its global trading partners. − The length and extent of economic contraction as a result of the COVID-19 pandemic. − Commodity price volatility. 14
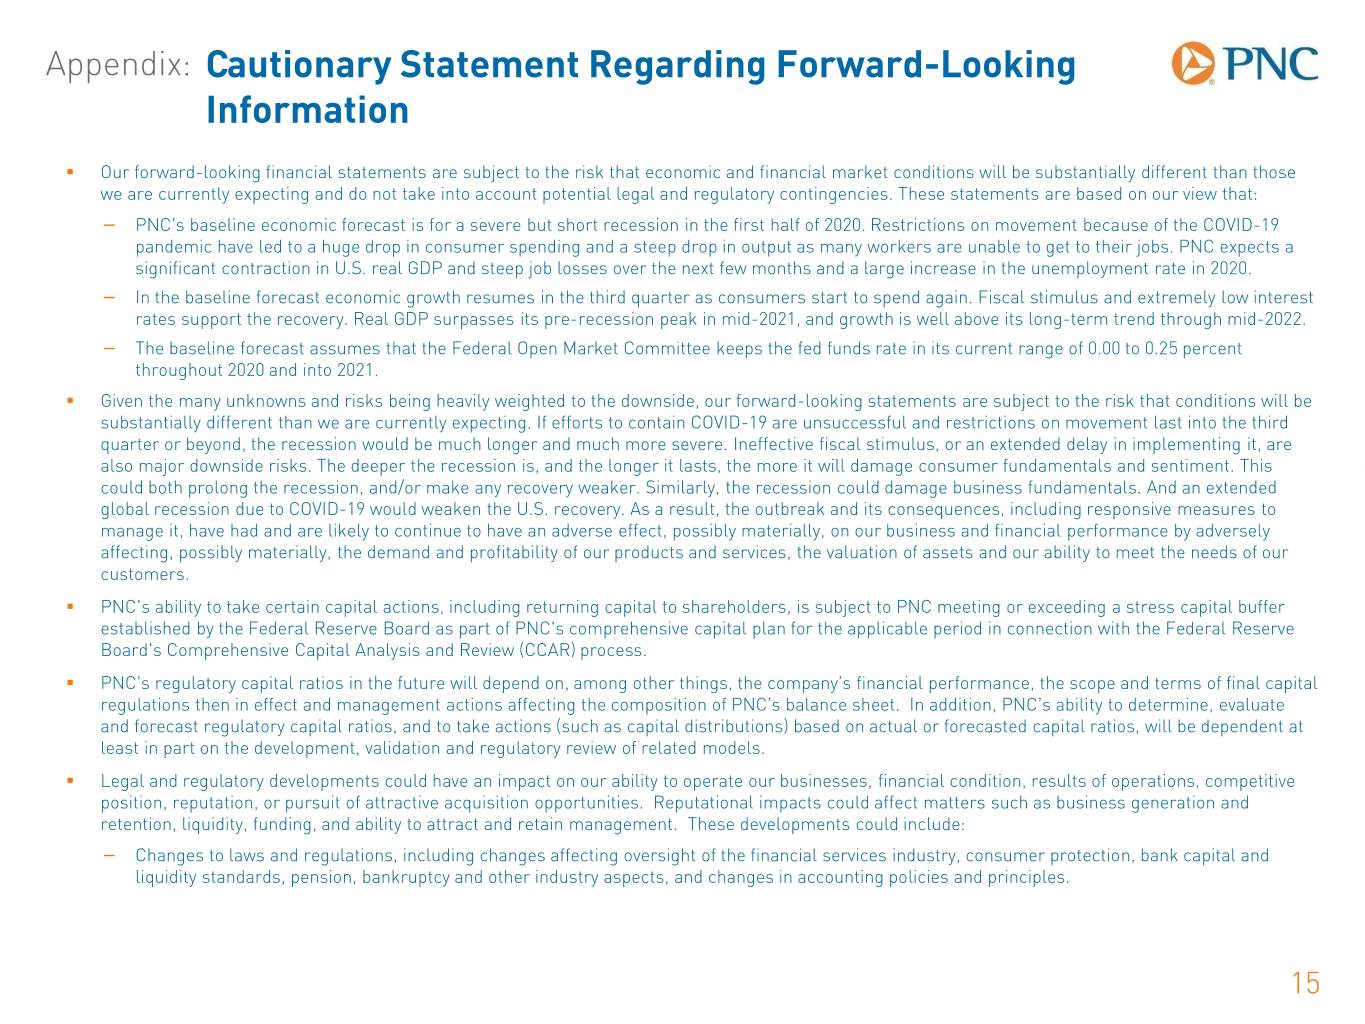
Appendix: Cautionary Statement Regarding Forward-Looking Information . Our forward-looking financial statements are subject to the risk that economic and financial market conditions will be substantially different than those we are currently expecting and do not take into account potential legal and regulatory contingencies. These statements are based on our view that: − PNC’s baseline economic forecast is for a severe but short recession in the first half of 2020. Restrictions on movement because of the COVID-19 pandemic have led to a huge drop in consumer spending and a steep drop in output as many workers are unable to get to their jobs. PNC expects a significant contraction in U.S. real GDP and steep job losses over the next few months and a large increase in the unemployment rate in 2020. − In the baseline forecast economic growth resumes in the third quarter as consumers start to spend again. Fiscal stimulus and extremely low interest rates support the recovery. Real GDP surpasses its pre-recession peak in mid-2021, and growth is well above its long-term trend through mid-2022. − The baseline forecast assumes that the Federal Open Market Committee keeps the fed funds rate in its current range of 0.00 to 0.25 percent throughout 2020 and into 2021. . Given the many unknowns and risks being heavily weighted to the downside, our forward-looking statements are subject to the risk that conditions will be substantially different than we are currently expecting. If efforts to contain COVID-19 are unsuccessful and restrictions on movement last into the third quarter or beyond, the recession would be much longer and much more severe. Ineffective fiscal stimulus, or an extended delay in implementing it, are also major downside risks. The deeper the recession is, and the longer it lasts, the more it will damage consumer fundamentals and sentiment. This could both prolong the recession, and/or make any recovery weaker. Similarly, the recession could damage business fundamentals. And an extended global recession due to COVID-19 would weaken the U.S. recovery. As a result, the outbreak and its consequences, including responsive measures to manage it, have had and are likely to continue to have an adverse effect, possibly materially, on our business and financial performance by adversely affecting, possibly materially, the demand and profitability of our products and services, the valuation of assets and our ability to meet the needs of our customers. . PNC's ability to take certain capital actions, including returning capital to shareholders, is subject to PNC meeting or exceeding a stress capital buffer established by the Federal Reserve Board as part of PNC's comprehensive capital plan for the applicable period in connection with the Federal Reserve Board's Comprehensive Capital Analysis and Review (CCAR) process. . PNC’s regulatory capital ratios in the future will depend on, among other things, the company’s financial performance, the scope and terms of final capital regulations then in effect and management actions affecting the composition of PNC’s balance sheet. In addition, PNC’s ability to determine, evaluate and forecast regulatory capital ratios, and to take actions (such as capital distributions) based on actual or forecasted capital ratios, will be dependent at least in part on the development, validation and regulatory review of related models. . Legal and regulatory developments could have an impact on our ability to operate our businesses, financial condition, results of operations, competitive position, reputation, or pursuit of attractive acquisition opportunities. Reputational impacts could affect matters such as business generation and retention, liquidity, funding, and ability to attract and retain management. These developments could include: − Changes to laws and regulations, including changes affecting oversight of the financial services industry, consumer protection, bank capital and liquidity standards, pension, bankruptcy and other industry aspects, and changes in accounting policies and principles. 15
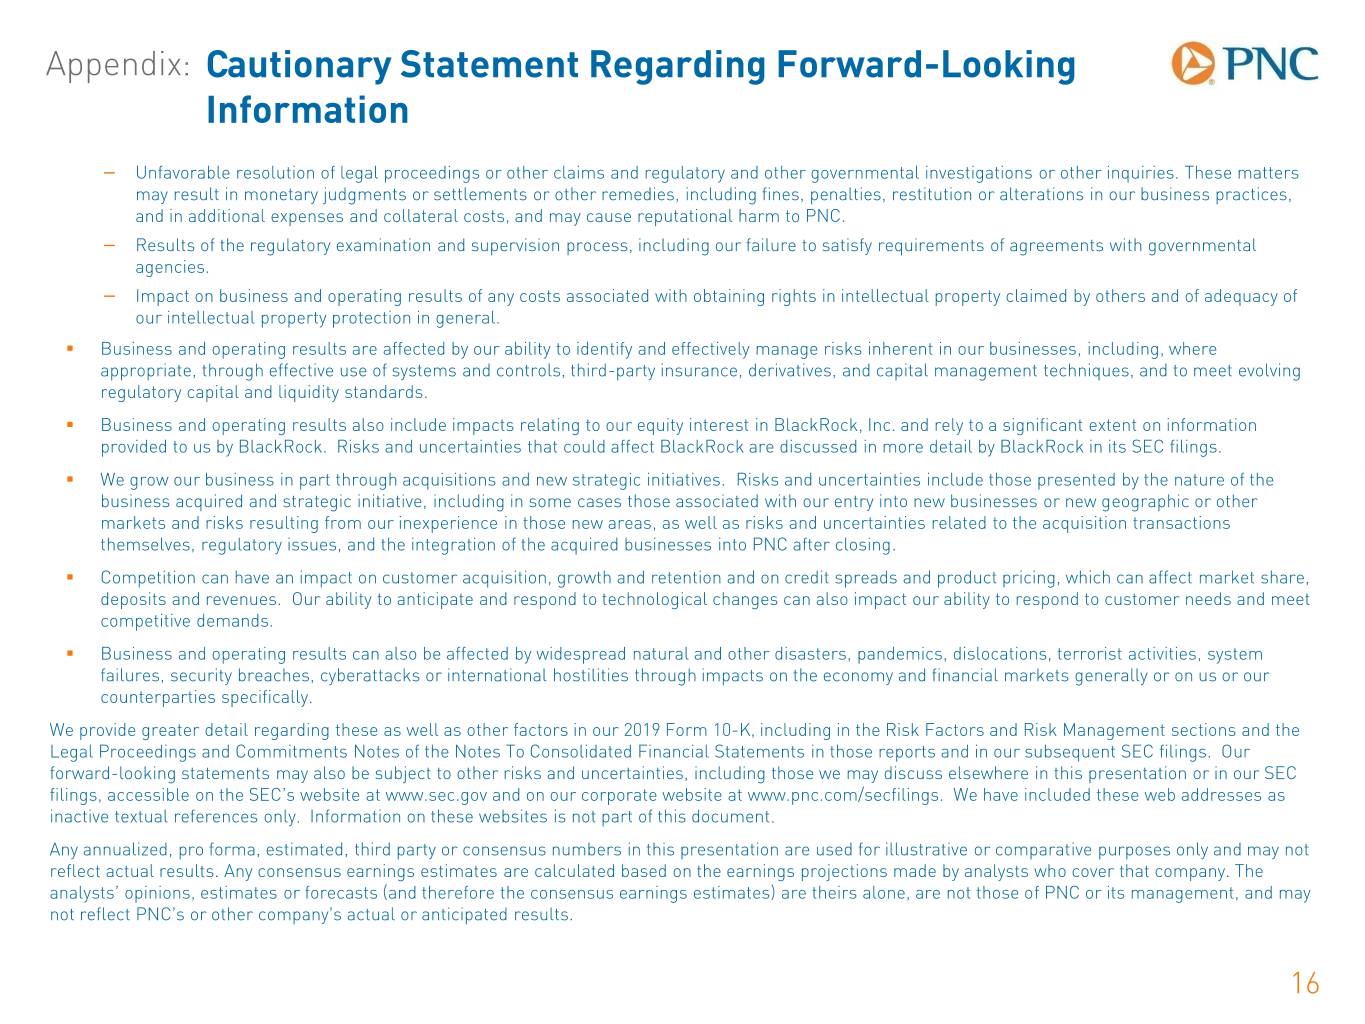
Appendix: Cautionary Statement Regarding Forward-Looking Information − Unfavorable resolution of legal proceedings or other claims and regulatory and other governmental investigations or other inquiries. These matters may result in monetary judgments or settlements or other remedies, including fines, penalties, restitution or alterations in our business practices, and in additional expenses and collateral costs, and may cause reputational harm to PNC. − Results of the regulatory examination and supervision process, including our failure to satisfy requirements of agreements with governmental agencies. − Impact on business and operating results of any costs associated with obtaining rights in intellectual property claimed by others and of adequacy of our intellectual property protection in general. . Business and operating results are affected by our ability to identify and effectively manage risks inherent in our businesses, including, where appropriate, through effective use of systems and controls, third-party insurance, derivatives, and capital management techniques, and to meet evolving regulatory capital and liquidity standards. . Business and operating results also include impacts relating to our equity interest in BlackRock, Inc. and rely to a significant extent on information provided to us by BlackRock. Risks and uncertainties that could affect BlackRock are discussed in more detail by BlackRock in its SEC filings. . We grow our business in part through acquisitions and new strategic initiatives. Risks and uncertainties include those presented by the nature of the business acquired and strategic initiative, including in some cases those associated with our entry into new businesses or new geographic or other markets and risks resulting from our inexperience in those new areas, as well as risks and uncertainties related to the acquisition transactions themselves, regulatory issues, and the integration of the acquired businesses into PNC after closing. . Competition can have an impact on customer acquisition, growth and retention and on credit spreads and product pricing, which can affect market share, deposits and revenues. Our ability to anticipate and respond to technological changes can also impact our ability to respond to customer needs and meet competitive demands. . Business and operating results can also be affected by widespread natural and other disasters, pandemics, dislocations, terrorist activities, system failures, security breaches, cyberattacks or international hostilities through impacts on the economy and financial markets generally or on us or our counterparties specifically. We provide greater detail regarding these as well as other factors in our 2019 Form 10-K, including in the Risk Factors and Risk Management sections and the Legal Proceedings and Commitments Notes of the Notes To Consolidated Financial Statements in those reports and in our subsequent SEC filings. Our forward-looking statements may also be subject to other risks and uncertainties, including those we may discuss elsewhere in this presentation or in our SEC filings, accessible on the SEC’s website at www.sec.gov and on our corporate website at www.pnc.com/secfilings. We have included these web addresses as inactive textual references only. Information on these websites is not part of this document. Any annualized, pro forma, estimated, third party or consensus numbers in this presentation are used for illustrative or comparative purposes only and may not reflect actual results. Any consensus earnings estimates are calculated based on the earnings projections made by analysts who cover that company. The analysts’ opinions, estimates or forecasts (and therefore the consensus earnings estimates) are theirs alone, are not those of PNC or its management, and may not reflect PNC’s or other company’s actual or anticipated results. 16
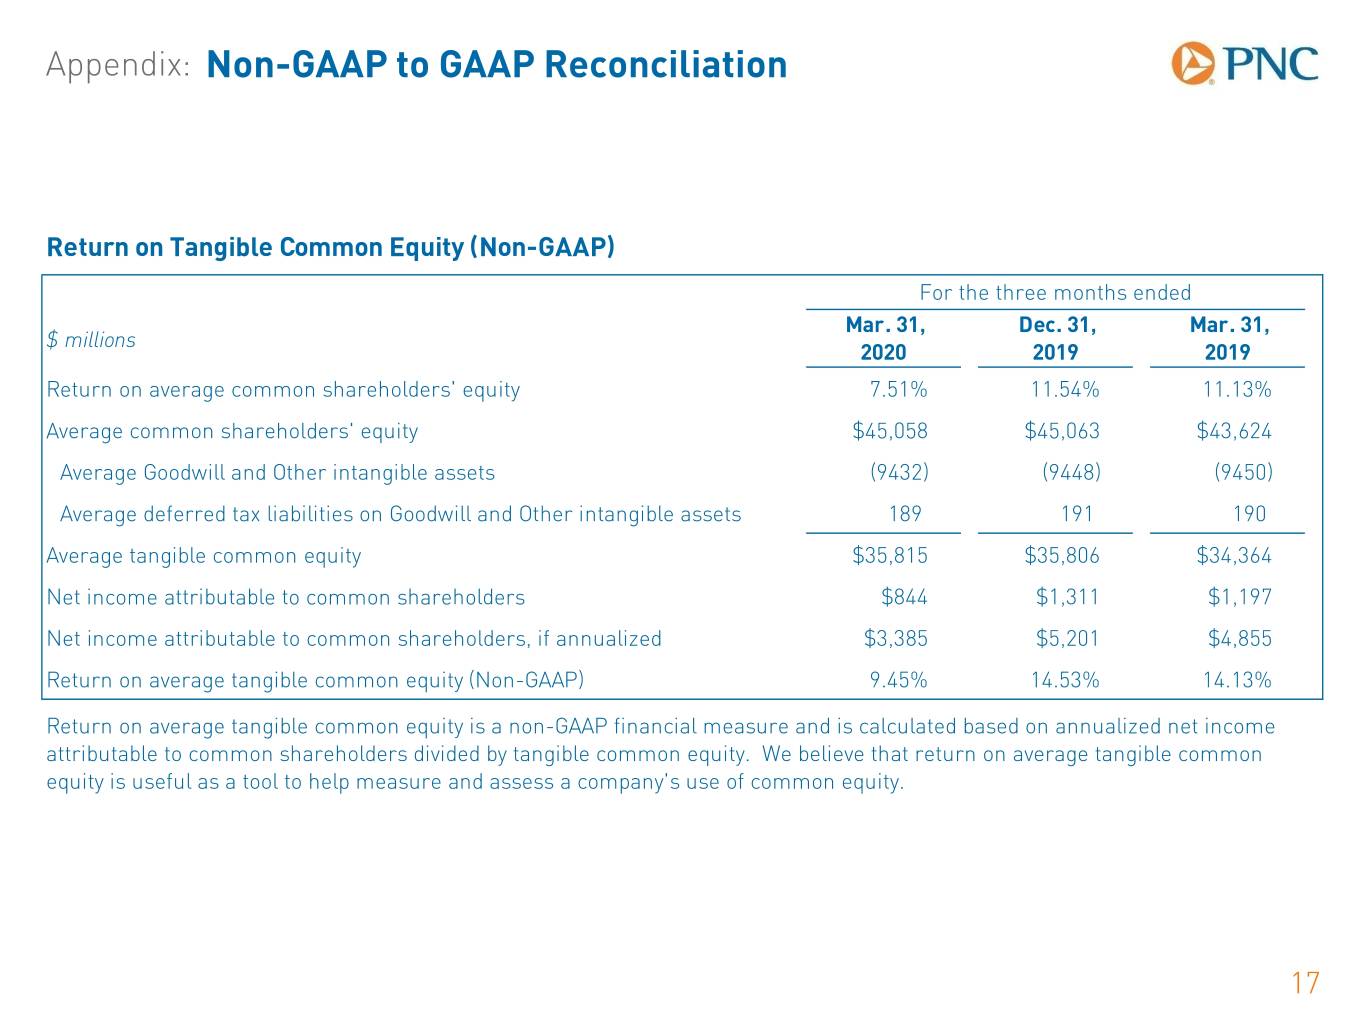
Appendix: Non-GAAP to GAAP Reconciliation Return on Tangible Common Equity (Non-GAAP) For the three months ended Mar. 31, Dec. 31, Mar. 31, $ millions 2020 2019 2019 Return on average common shareholders' equity 7.51% 11.54% 11.13% Average common shareholders' equity $45,058 $45,063 $43,624 Average Goodwill and Other intangible assets (9432) (9448) (9450) Average deferred tax liabilities on Goodwill and Other intangible assets 189 191 190 Average tangible common equity $35,815 $35,806 $34,364 Net income attributable to common shareholders $844 $1,311 $1,197 Net income attributable to common shareholders, if annualized $3,385 $5,201 $4,855 Return on average tangible common equity (Non-GAAP) 9.45% 14.53% 14.13% Return on average tangible common equity is a non-GAAP financial measure and is calculated based on annualized net income attributable to common shareholders divided by tangible common equity. We believe that return on average tangible common equity is useful as a tool to help measure and assess a company's use of common equity. 17
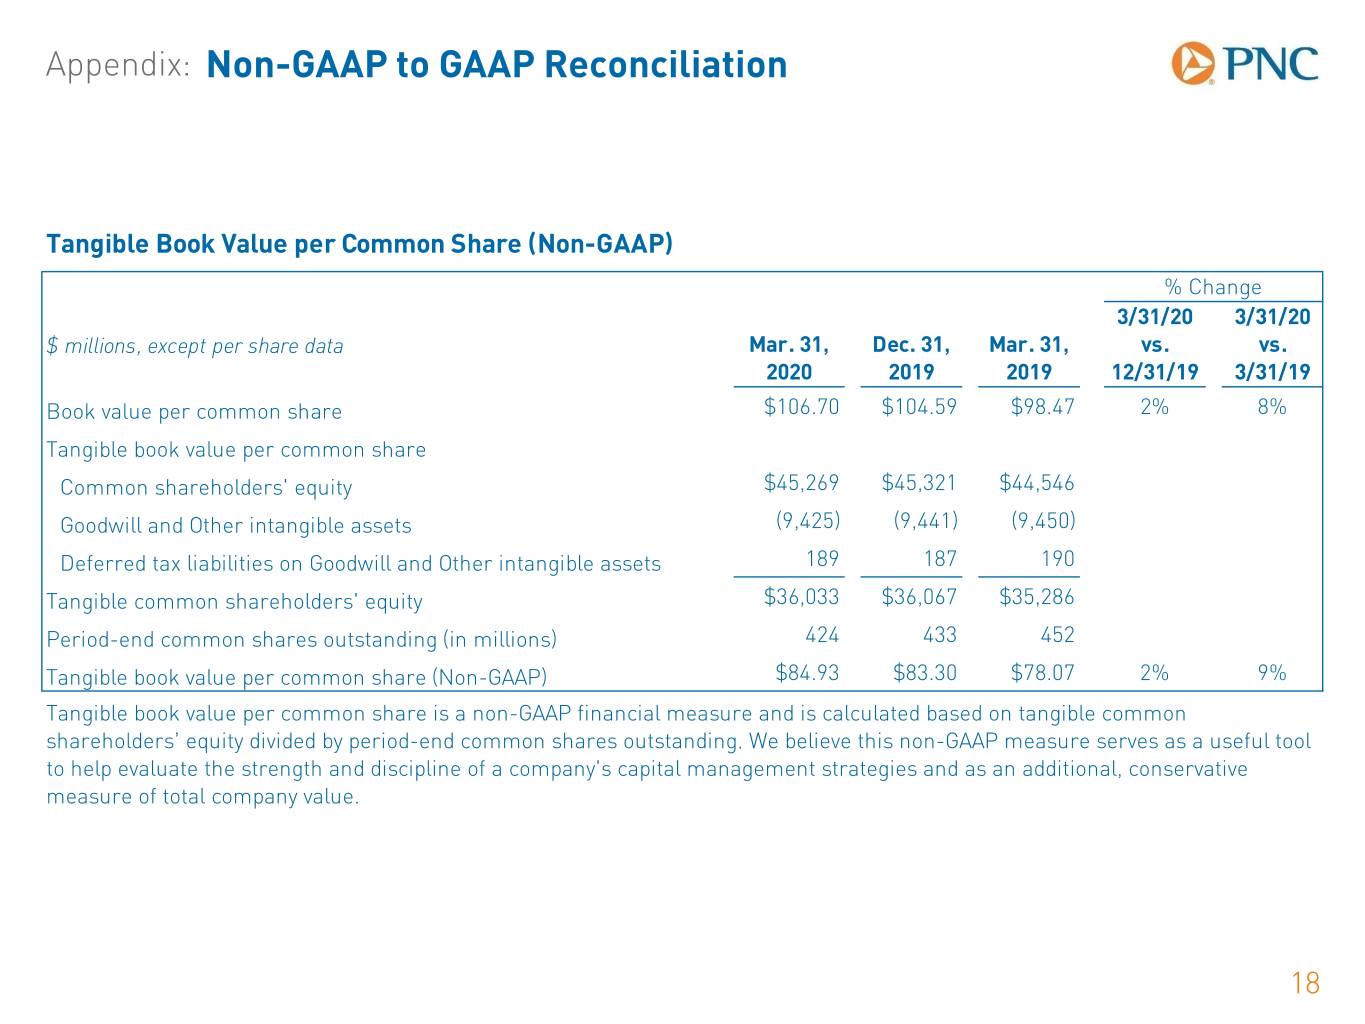
Appendix: Non-GAAP to GAAP Reconciliation Tangible Book Value per Common Share (Non-GAAP) % Change 3/31/20 3/31/20 $ millions, except per share data Mar. 31, Dec. 31, Mar. 31, vs. vs. 2020 2019 2019 12/31/19 3/31/19 Book value per common share $106.70 $104.59 $98.47 2% 8% Tangible book value per common share Common shareholders' equity $45,269 $45,321 $44,546 Goodwill and Other intangible assets (9,425) (9,441) (9,450) Deferred tax liabilities on Goodwill and Other intangible assets 189 187 190 Tangible common shareholders' equity $36,033 $36,067 $35,286 Period-end common shares outstanding (in millions) 424 433 452 Tangible book value per common share (Non-GAAP) $84.93 $83.30 $78.07 2% 9% Tangible book value per common share is a non-GAAP financial measure and is calculated based on tangible common shareholders’ equity divided by period-end common shares outstanding. We believe this non-GAAP measure serves as a useful tool to help evaluate the strength and discipline of a company's capital management strategies and as an additional, conservative measure of total company value. 18
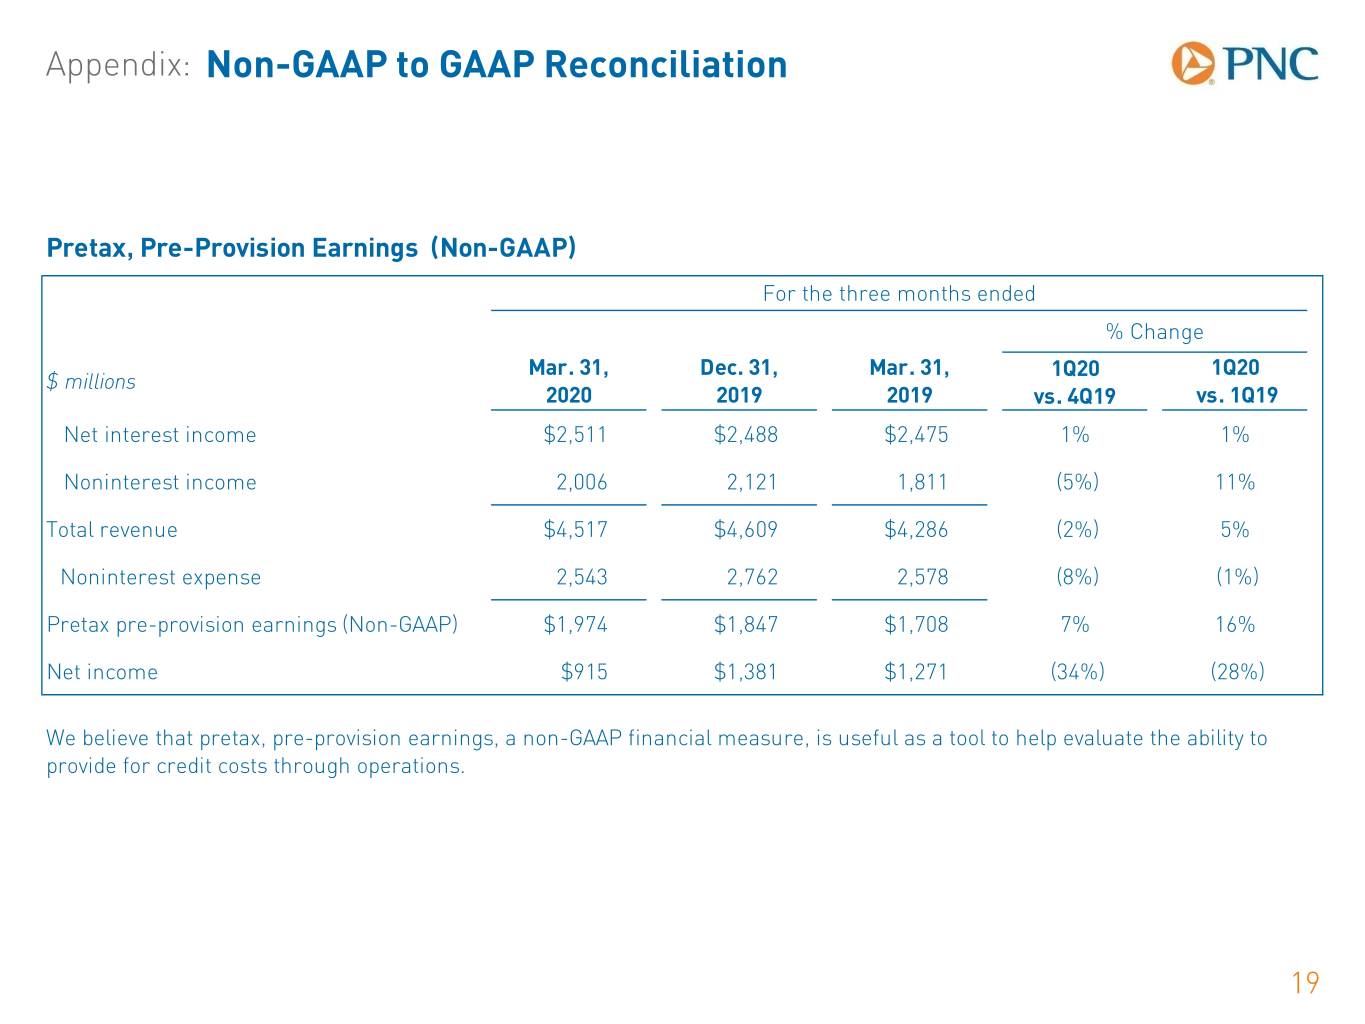
Appendix: Non-GAAP to GAAP Reconciliation Pretax, Pre-Provision Earnings (Non-GAAP) For the three months ended % Change Mar. 31, Dec. 31, Mar. 31, 1Q20 1Q20 $ millions 2020 2019 2019 vs. 4Q19 vs. 1Q19 Net interest income $2,511 $2,488 $2,475 1% 1% Noninterest income 2,006 2,121 1,811 (5%) 11% Total revenue $4,517 $4,609 $4,286 (2%) 5% Noninterest expense 2,543 2,762 2,578 (8%) (1%) Pretax pre-provision earnings (Non-GAAP) $1,974 $1,847 $1,708 7% 16% Net income $915 $1,381 $1,271 (34%) (28%) We believe that pretax, pre-provision earnings, a non-GAAP financial measure, is useful as a tool to help evaluate the ability to provide for credit costs through operations. 19