
RPAY 8-K
Repay Holdings Corp (RPAY)
;
UNITED STATES
SECURITIES AND EXCHANGE COMMISSION
WASHINGTON, D.C. 20549
FORM 8-K
CURRENT REPORT
Pursuant to Section 13 or 15(d) of the Securities Exchange Act of 1934
Date of Report (Date of earliest event reported): |
(Exact name of Registrant as Specified in Its Charter)
(State or Other Jurisdiction |
(Commission File Number) |
(IRS Employer |
||
|
|
|
|
|
|
||||
|
||||
(Address of Principal Executive Offices) |
|
(Zip Code) |
||
Registrant’s Telephone Number, Including Area Code: |
|
(Former Name or Former Address, if Changed Since Last Report)
Check the appropriate box below if the Form 8-K filing is intended to simultaneously satisfy the filing obligation of the registrant under any of the following provisions:
Securities registered pursuant to Section 12(b) of the Act:
|
|
Trading |
|
|
|
|
Indicate by check mark whether the registrant is an emerging growth company as defined in Rule 405 of the Securities Act of 1933 (§ 230.405 of this chapter) or Rule 12b-2 of the Securities Exchange Act of 1934 (§ 240.12b-2 of this chapter).
Emerging growth company
If an emerging growth company, indicate by check mark if the registrant has elected not to use the extended transition period for complying with any new or revised financial accounting standards provided pursuant to Section 13(a) of the Exchange Act. ☐
Item 2.02. Results of Operations and Financial Condition.
On August 11, 2025, Repay Holdings Corporation (the “Company”) issued a press release announcing the results of the Company’s operations for the quarter ended June 30, 2025.
A copy of the Company’s earnings press release is attached hereto as Exhibit 99.1 and is hereby incorporated by reference in this Item 2.02. As provided in General Instruction B.2 of Form 8-K, the information and exhibits contained in this Item 2.02 shall not be deemed to be “filed” for purposes of Section 18 of the Securities Exchange Act of 1934, as amended (the “Exchange Act”), nor shall they be deemed to be incorporated by reference in any filing under the Securities Act of 1933, as amended, except as shall be expressly set forth by specific reference in such a filing.
Item 5.02. Departure of Directors or Certain Officers; Election of Directors; Appointment of Certain Officers; Compensatory Arrangements of Certain Officers.
Appointment of Robert S. Houser as Chief Financial Officer
On August 7, 2025, the board of directors (the “Board”) of Repay Holdings Corporation (the “Company”) appointed Robert S. Houser, age 50, to serve as the Chief Financial Officer of the Company, effective as of September 8, 2025 (the “Effective Date”). Upon the Effective Date, Thomas E. Sullivan will cease to serve as the Company’s Interim Chief Financial Officer and will return to his full-time role as the Company’s Chief Accounting Officer.
Mr. Houser will join the Company from Conduent Incorporated (Nasdaq: CNDT) (“Conduent”), a business process services company that provides digital platforms and solutions to commercial and government clients, which he joined in July 2021. Most recently, he has served as Group CFO for Conduent’s Public Sector business and Advisor to CEO since January 2025, and he previously served as Conduent’s Global Head of Strategy, Corporate Development and Advisor to CEO from July 2021 to January 2025. Prior to Conduent, Mr. Houser held several senior positions at Fiserv Inc. (NYSE: FI) (“Fiserv”), a global fintech and payments company, from September 2014 to July 2021, including as Senior Vice President and General Manager of Fiserv’s Bill Pay Solutions business unit and as Vice President and Chief Financial Officer of Fiserv’s Biller and Payments group. Prior to Fiserv, he was the Global Head of FP&A and Investor Relations at Integra Lifesciences, Inc. (Nasdaq: IART). He previously held various finance, accounting, and strategy roles at Firmenich, Inc, Bristol-Myers Squibb Co. (NYSE: NMY), and Merck & Co Inc. (NYSE:MRK). Mr. Houser began his career as an auditor for KPMG LLP, and he earned his MBA and bachelor’s degree in accounting from Rider University.
There are no family relationships between Mr. Houser and any director or executive officer of the Company, and no related party transactions are required to be reported under Item 404(a) of Regulation S-K.
Employment Agreement with Robert S. Houser
In connection with Mr. Houser’s employment, on August 7, 2025, the Company entered into an Employment Agreement (the “Employment Agreement”) with Mr. Houser pursuant to which Mr. Houser will serve as Chief Financial Officer of the Company. The term of the Employment Agreement will commence on the Effective Date and will continue until Mr. Houser’s employment relationship is terminated under the terms of the Employment Agreement or as otherwise agreed by the Company and Mr. Houser.
Under the Employment Agreement, Mr. Houser will receive an annual base salary of at least $400,000 and will be eligible for an annual performance-based cash bonus with a target amount of 60% of his base salary for the applicable bonus period based on the achievement of certain performance objectives established by the compensation committee (the “Compensation Committee”) of the Board. Mr. Houser will also have the opportunity to participate in the Company’s other employee benefit plans. Beginning in 2026, Mr. Houser will be eligible to participate in the Company’s equity incentive plan on such basis as the Compensation Committee may determine.
Mr. Houser will receive a one-time cash signing bonus of $150,000 within 30 days after the Effective Date and an additional one-time cash bonus of $100,000 by no later than March 15, 2026. If, within 24 months after the Effective Date, Mr. Houser resigns from his employment with the Company other than for “good reason” (as defined in the Employment Agreement) or his employment is terminated by the Company for “cause” (as defined in the Employment Agreement), then Mr. Houser will be required to repay a pro rata portion of these one-time cash bonuses. Additionally, Mr. Houser will receive a one-time new hire restricted stock award with a grant date value of $700,000, which will be subject to time-based vesting in equal annual installments over a four-year period.
Pursuant to the terms of the Employment Agreement, in the event of a termination of Mr. Houser’s employment by the Company without “cause” or by Mr. Houser for “good reason,” Mr. Houser will be entitled to receive the following payments and benefits:
The “severance period” is 18 months; provided that in the event such termination is on or within 24 months following a change in control or prior to and in anticipation of a change in control, the “severance period” is 30 months. Such severance payments and benefits are subject to execution and non-revocation of a release of claims.
Pursuant to the terms of the Employment Agreement, in the event of a termination due to death or incapacity, Mr. Houser will be entitled to the annual bonus that would have been paid had he remained employed until the end of the applicable bonus period.
Mr. Houser will be prohibited, pursuant to the Employment Agreements, from soliciting the Company’s clients or vendors, or recruiting the Company’s employees, for a period of 24 months following the separation date. In addition, Mr. Houser has agreed to not compete directly with the Company within the “restricted territory” (as defined in the Employment Agreement) for a period of 24 months. Pursuant to the Employment Agreement, Mr. Houser will also be prohibited from divulging or making use of any “confidential information” or “trade secrets” (each as defined in the Employment Agreement) during his employment and following cessation of employment with the Company for any reason.
Throughout the foregoing summary of the Employment Agreement, unless otherwise noted or unless the context otherwise requires, the term “Company” refers to Repay Holdings Corporation and/or one or more of its consolidated subsidiaries.
The foregoing summary of the Employment Agreement does not purport to be complete and is qualified in its entirety by reference to the Employment Agreement, a copy of which is filed as Exhibit 10.1 to this Current Report on Form 8-K and is incorporated herein by reference.
Item 7.01. Regulation FD Disclosure.
On August 11, 2025, the Company provided supplemental information regarding its business and operations in an earnings supplement and investor presentation that will be made available on the investor relations section of the Company’s website. In addition, on August 11, 2025, the Company issued a press release announcing the appointment of Robert S. Houser as the Company’s Chief Financial Officer.
Copies of the earnings supplement, the investor presentation and the Chief Financial Officer press release are attached hereto as Exhibits 99.2, 99.3 and 99.4, respectively, and are hereby incorporated by reference in this Item 7.01. As provided in General Instruction B.2 of Form 8-K, the information and exhibits contained in this Item 7.01 shall not be deemed to be “filed” for purposes of Section 18 of the Exchange Act, nor shall they be deemed to be incorporated by reference in any filing under the Securities Act, except as shall be expressly set forth by specific reference in such a filing.
Item 9.01. Financial Statements and Exhibits.
(d) Exhibits
Exhibit No. |
|
Description |
||
10.1# |
|
|||
99.1 |
|
Press release issued August 11, 2025 by Repay Holdings Corporation |
||
99.2 |
|
|||
99.3 |
|
|||
99.4 |
|
Press Release issued August 11, 2025 by Repay Holdings Corporation |
||
104 |
|
Cover Page Interactive Data File (embedded within the Inline XBRL document) |
||
|
|
|
||
|
# |
Certain portions of this exhibit, marked by “[***]”, have been redacted pursuant to Item 601(b)(10) of Regulation S-K. Such redacted information (i) is not material and (ii) is the type of information that the Company treats as private or confidential. An unredacted copy of this exhibit will be provided to the SEC upon its request. |
||
SIGNATURES
Pursuant to the requirements of the Securities Exchange Act of 1934, the Registrant has duly caused this report to be signed on its behalf by the undersigned hereunto duly authorized.
|
Repay Holdings Corporation |
|
|
|
|
Dated: August 11, 2025 |
By: |
/s/ Thomas E. Sullivan |
|
|
Thomas E. Sullivan |
|
|
Interim Chief Financial Officer |
Exhibit 10.1
CERTAIN PORTIONS OF THIS EXHBIT, MARKED BY “[***]”, HAVE BEEN REDACTED PURSUANT TO ITEM 601(B)(10) OF REGULATION S-K. SUCH REDACTED INFORMATION (I) IS NOT MATERIAL AND (II) IS THE TYPE OF INFORMATION THAT THE COMPANY TREATS AS PRIVATE OR CONFIDENTIAL
EMPLOYMENT AGREEMENT
THIS EMPLOYMENT AGREEMENT (this “Agreement”) is made and entered into as of August 7, 2025, by and between Repay Management Services LLC, a Delaware limited liability company (the “Company”), and Robert S. Houser, a resident of the Commonwealth of Pennsylvania (“Executive”).
RECITALS:
WHEREAS, the Company is an indirect subsidiary of Repay Holdings Corporation, a Delaware corporation (“Parent;” as used herein, the “Incentive Plan” means Parent’s Omnibus Incentive Plan or any successor plan); and
WHEREAS, the Company desires to employ Executive, and Executive desires to be employed by the Company, all in accordance with the terms and subject to the conditions provided herein.
NOW, THEREFORE, in consideration of the foregoing and of the respective covenants and agreements of the parties herein contained, the parties hereto, intending to be legally bound hereby, agree as follows:
2
3
4
5
provided, that (A) “Good Reason” shall cease to exist for an event on the ninetieth (90th) day following the later of its occurrence or Executive’s knowledge thereof, unless Executive has given the Company written notice thereof prior to such date; (B) the Company shall have thirty (30) days after receipt of such written notice to cure such breach or event; and (C) Executive must terminate
6
his employment no later than sixty (60) days after the expiration of the period for curing such breach or event without the Company having cured the same.
7
In addition to the foregoing, in the event Executive voluntarily terminates Executive’s employment hereunder for Good Reason or Executive’s employment is terminated by the Company without Cause, (1) Executive shall be vested with respect to that number of Executive’s outstanding unvested options, restricted stock and other equity-based awards that would have vested based solely on the continued employment of Executive through the Severance Period, effective as of the date the Release becomes effective and irrevocable, (2) Executive’s outstanding unvested options, restricted stock and other equity-based awards that were eligible to vest based on the achievement of certain specified performance objectives and the continued employment of Executive shall remain outstanding and eligible to vest in accordance with the terms of such options, restricted stock and other equity-based awards (notwithstanding the termination of Executive’s employment) through the Severance Period, effective as of the date the Release becomes effective and irrevocable, and (3) all of Executive’s outstanding stock options shall remain outstanding until the earlier of (I) the expiration of the Severance Period or (II) the original expiration date of the options (disregarding any earlier expiration date provided for in any other agreement, including without limitation any related grant agreement, based solely on the termination of Executive’s employment).
8
Unless the context otherwise requires, the term “Company” shall mean the Company and its affiliated companies, successors and predecessors for purposes of this Section 5.
9
An individual shall not be held criminally or civilly liable under any federal or state trade secret law for the disclosure of a trade secret that (i) is made (A) in confidence to a federal, state, or local government official, either directly or indirectly, or to an attorney; and (B) solely for the purpose of reporting or investigating a suspected violation of law; or (ii) is made in a complaint or other document filed in a lawsuit or other proceeding, if such filing is made under seal. An individual who files a lawsuit for retaliation by an employer for reporting a suspected violation of law may disclose the trade secret to the attorney of the individual and use the trade secret information in the court proceeding, if the individual (1) files any document containing the trade secret under seal; and (2) does not disclose the trade secret, except pursuant to court order.
10
11
Notwithstanding any other provision of this Agreement, the parties hereto acknowledge and agree that nothing in this Agreement shall prohibit Executive from reporting possible violations of Federal, State or other law or regulation to, or filing a charge or other complaint with, any governmental agency or entity, including but not limited to the Department of Justice, the Equal Employment Opportunity Commission, the National Labor Relations Board, the Occupational Safety and Health Administration, the Securities and Exchange Commission, Congress, and any Inspector General, or making any other disclosures that are protected under any whistleblower provisions of Federal, State or other law or regulation or assisting in any investigation or proceeding. The parties hereto further acknowledge that nothing herein limits Executive’s ability to communicate with any such governmental agency or entity or otherwise participate in any such investigation or proceeding that may be conducted by any such governmental agency or entity, including providing documents or other information, without notice to the Company. Executive does not need the prior authorization of the Company to make any such reports or disclosures, and Executive is not required to notify the Company that Executive made any such reports or disclosures or is assisting in any such investigation. Additionally, Executive (a) does not waive any rights to any individual monetary recovery or other awards in
12
connection with reporting any such information to any such governmental agency or entity, (b) does not breach any confidentiality or other provision hereunder in connection with any such reporting or disclosures, and (c) will not be prohibited from receiving any amounts hereunder as a result of making any such reports or disclosures or assisting with any such investigation or proceeding.
13
If to the Company:
3060 Peachtree Road, Suite 1100
14
Atlanta, Georgia 30305
Attention: John A. Morris, CEO
E-mail: [email protected]
If to Executive:
[***]
[***]
Email: [***]
or to such other address as either party may have furnished to the other in writing in accordance herewith, except that notices of change of address shall be effective only upon receipt.
15
[Signature page follows]
IN WITNESS WHEREOF, the parties have signed this Agreement on the date and year first above written.
THE COMPANY:
REPAY MANAGEMENT SERVICES LLC
By: /s/ John A. Morris
John A. Morris
Chief Executive Officer
EXECUTIVE:
/s/ Robert S. Houser
Robert S. Houser
[Signature Page to Employment Agreement]
REPAY Reports Second Quarter 2025 Financial Results
Sequential Improvement in Growth and Strong Free Cash Flow Conversion in Q2
Reiterates 2025 Outlook for Accelerating Growth in Q4
Repurchased 4.8 million shares for $22.6 million during Q2
ATLANTA, August 11, 2025 -- Repay Holdings Corporation (NASDAQ: RPAY) (“REPAY” or the “Company”), a leading provider of vertically-integrated payment solutions, today reported financial results for its second quarter ended June 30, 2025.
Second Quarter 2025 Financial Highlights
($ in millions) |
|
Q2 2024 |
|
|
Q3 2024 |
|
|
Q4 2024 |
|
|
Q1 2025 |
|
|
Q2 2025 |
|
|||||
Revenue |
|
$ |
74.9 |
|
|
$ |
79.1 |
|
|
$ |
78.3 |
|
|
$ |
77.3 |
|
|
$ |
75.6 |
|
Gross profit (1) |
|
|
58.6 |
|
|
|
61.6 |
|
|
|
59.7 |
|
|
|
58.7 |
|
|
|
57.2 |
|
Net (loss) income (2) |
|
|
(4.2 |
) |
|
|
3.2 |
|
|
|
(4.0 |
) |
|
|
(8.2 |
) |
|
|
(108.0 |
) |
Adjusted EBITDA (3) |
|
|
33.7 |
|
|
|
35.1 |
|
|
|
36.5 |
|
|
|
33.2 |
|
|
|
31.8 |
|
Net cash provided by operating activities |
|
|
31.0 |
|
|
|
60.1 |
|
|
|
34.3 |
|
|
|
2.5 |
|
|
|
33.1 |
|
Free Cash Flow (3) |
|
|
19.3 |
|
|
|
48.8 |
|
|
|
23.5 |
|
|
|
(8.0 |
) |
|
|
22.6 |
|
Free Cash Flow Conversion (3) |
|
|
57 |
% |
|
|
139 |
% |
|
|
64 |
% |
|
|
(24 |
%) |
|
|
71 |
% |
“During the second quarter, REPAY executed on our path to reaccelerating growth during 2025, while making great progress to improve on our go-to-market, implementation pipelines, and operational excellence,” said John Morris, Chief Executive Officer of REPAY. “We began to deploy incremental strategic investments into our growth opportunities, while sequentially improving Free Cash Flow Conversion to over 71%. REPAY used the second quarter as a prime opportunity to buy back approximately 5% of REPAY’s outstanding shares and we have used a total of $38 million in 2025 to repurchase shares through August 11th. Looking forward, REPAY is building momentum from our strategic initiatives to accelerate growth exiting the year.”
Second Quarter 2025 Business Highlights
The Company's achievements in the quarter, including those highlighted below, reinforce management's belief in the ability of the Company to drive durable and long-term growth across REPAY's diversified business model.
1 Normalized gross profit growth is a non-GAAP financial measure that accounts for cyclical political media spending contributions. See “Non-GAAP Financial Measures” and the reconciliation to their most comparable GAAP measure provided below for additional information.
2025 Outlook
REPAY reiterates its previously provided outlook for fiscal year 2025, as shown below:
REPAY does not provide quantitative reconciliation of forward-looking, non-GAAP financial measures, such as forecasted normalized gross profit growth and Free Cash Flow Conversion, to the most directly comparable GAAP financial measure, because it is difficult to reliably predict or estimate the relevant components without unreasonable effort due to future uncertainties that may potentially have a significant impact on such calculations, and providing them may imply a degree of precision that would be confusing or potentially misleading.
Segments
The Company reports its financial results based on two reportable segments.
Consumer Payments – The Consumer Payments segment provides payment processing solutions (including debit and credit card processing, Automated Clearing House (“ACH”) processing and other electronic payment acceptance solutions, as well as REPAY’s loan disbursement product) that enable REPAY’s clients to collect payments from and disburse funds to consumers and includes its clearing and settlement solutions (“RCS”). RCS is REPAY’s proprietary clearing and settlement platform through which it markets customizable payment processing programs to other ISOs and payment facilitators. The strategic vertical markets served by the Consumer Payments segment primarily include personal loans, automotive loans, receivables management, credit unions, mortgage servicing, consumer healthcare and diversified retail.
Business Payments – The Business Payments segment provides payment processing solutions (including accounts payable automation, debit and credit card processing, virtual credit card processing, ACH processing and other electronic payment acceptance solutions) that
enable REPAY’s clients to collect payments from or send payments to other businesses. The strategic vertical markets served within the Business Payments segment primarily include retail automotive, education, field services, governments and municipalities, healthcare, media, homeowner association management and hospitality.
Segment Revenue, Gross Profit, and Gross Profit Margin
|
|
Three Months Ended June 30, |
|
|
|
|
Six Months Ended June 30, |
|
|
|
||||||||||
($ in thousands) |
|
2025 |
|
|
2024 |
|
|
% Change |
|
2025 |
|
|
2024 |
|
|
% Change |
||||
Revenue |
|
|
|
|
|
|
|
|
|
|
|
|
|
|
|
|
||||
Consumer Payments |
|
$ |
70,474 |
|
|
$ |
69,292 |
|
|
2% |
|
$ |
142,417 |
|
|
$ |
145,428 |
|
|
(2%) |
Business Payments |
|
|
10,945 |
|
|
|
10,592 |
|
|
3% |
|
|
21,933 |
|
|
|
20,269 |
|
|
8% |
Elimination of intersegment revenues |
|
|
(5,793 |
) |
|
|
(4,978 |
) |
|
|
|
|
(11,399 |
) |
|
|
(10,071 |
) |
|
|
Total revenue |
|
$ |
75,626 |
|
|
$ |
74,906 |
|
|
1% |
|
$ |
152,951 |
|
|
$ |
155,626 |
|
|
(2%) |
Gross profit (1) |
|
|
|
|
|
|
|
|
|
|
|
|
|
|
|
|
||||
Consumer Payments |
|
$ |
55,429 |
|
|
$ |
55,546 |
|
|
(0%) |
|
$ |
112,139 |
|
|
$ |
115,136 |
|
|
(3%) |
Business Payments |
|
|
7,586 |
|
|
|
8,017 |
|
|
(5%) |
|
|
15,143 |
|
|
|
15,065 |
|
|
1% |
Elimination of intersegment revenues |
|
|
(5,793 |
) |
|
|
(4,978 |
) |
|
|
|
|
(11,399 |
) |
|
|
(10,071 |
) |
|
|
Total gross profit |
|
$ |
57,222 |
|
|
$ |
58,585 |
|
|
(2%) |
|
$ |
115,883 |
|
|
$ |
120,130 |
|
|
(4%) |
|
|
|
|
|
|
|
|
|
|
|
|
|
|
|
|
|
||||
Total gross profit margin (2) |
|
76% |
|
|
78% |
|
|
|
|
76% |
|
|
77% |
|
|
|
||||
Conference Call
REPAY will host a conference call to discuss second quarter financial results today, August 11, 2025 at 5:00 pm ET. Hosting the call will be John Morris, CEO, and Thomas Sullivan, interim CFO. The call will be webcast live from REPAY’s investor relations website at https://investors.repay.com/investor-relations. The conference call can also be accessed live over the phone by dialing (877) 407-3982, or for international callers (201) 493-6780. A replay will be available one hour after the call and can be accessed by dialing (844) 512-2921 or (412) 317-6671 for international callers; the conference ID is 13754298. The replay will be available at https://investors.repay.com/investor-relations.
Non-GAAP Financial Measures
This report includes certain non-GAAP financial measures that management uses to evaluate the Company’s operating business, measure performance, and make strategic decisions. Adjusted EBITDA is a non-GAAP financial measure that represents net income prior to interest expense, tax expense, depreciation and amortization, as adjusted to add back certain charges deemed to not be part of normal operating expenses, non-cash charges and/or non-recurring charges, such as non-cash impairment loss, non-cash change in fair value of assets and liabilities, share-based compensation charges, transaction expenses, restructuring and other strategic initiative costs, gain on extinguishment of debt and other non-recurring charges. Adjusted Net Income is a non-GAAP financial measure that represents net income prior to amortization of acquisition-related intangibles, as adjusted to add back certain charges deemed to not be part of normal operating expenses, such as non-cash impairment loss, non-cash change in fair value of assets and liabilities, share-based compensation expense, transaction expenses, restructuring and other
strategic initiative costs, other non-recurring charges, non-cash interest expense and net of tax effect associated with these adjustments. Adjusted Net Income is adjusted to exclude amortization of all acquisition-related intangibles as such amounts are inconsistent in amount and frequency and are significantly impacted by the timing and/or size of acquisitions. Management believes that the adjustment of acquisition-related intangible amortization supplements GAAP financial measures because it allows for greater comparability of operating performance. Although REPAY excludes amortization from acquisition-related intangibles from its non-GAAP expenses, management believes that it is important for investors to understand that such intangibles were recorded as part of purchase accounting and contribute to revenue generation. Adjusted Net Income per share is a non-GAAP financial measure that represents Adjusted Net Income divided by the weighted average number of shares of Class A common stock outstanding (on an as-converted basis assuming conversion of the outstanding units exchangeable for shares of Class A common stock) for the three and six months ended June 30, 2025 and 2024 (excluding shares subject to forfeiture). Free Cash Flow is a non-GAAP financial measure that represents net cash flow provided by operating activities less total capital expenditures. Free Cash Flow Conversion represents Free Cash Flow divided by Adjusted EBITDA. Normalized gross profit growth represents year-over-year gross profit growth that excludes incremental gross profit attributable to political media spending associated with the 2024 election cycle in our media payments business. REPAY believes that Adjusted EBITDA, Adjusted Net Income, Adjusted Net Income per share, Free Cash Flow, Free Cash Flow Conversion and Normalized gross profit growth provide useful information to investors and others in understanding and evaluating its operating results in the same manner as management. However, these non-GAAP financial measures are not financial measures calculated in accordance with GAAP and should not be considered as a substitute for net income, operating profit, net cash provided by operating activities, or any other operating performance measure calculated in accordance with GAAP. Using these non-GAAP financial measures to analyze REPAY’s business has material limitations because the calculations are based on the subjective determination of management regarding the nature and classification of events and circumstances that investors may find significant. In addition, although other companies in REPAY’s industry may report measures titled as the same or similar measures, such non-GAAP financial measures may be calculated differently from how REPAY calculates its non-GAAP financial measures, which reduces their overall usefulness as comparative measures. Because of these limitations, you should consider REPAY’s non-GAAP financial measures alongside other financial performance measures, including net income, net cash provided by operating activities and REPAY’s other financial results presented in accordance with GAAP.
Forward-Looking Statements
This communication contains “forward-looking statements” within the meaning of the Private Securities Litigation Reform Act of 1995. Such statements include, but are not limited to, statements about future financial and operating results, including 2025 outlook, REPAY’s plans, objectives, expectations and intentions with respect to future operations, products and services; and other statements identified by words such as “guidance,” “will likely result,” “are expected to,” “will continue,” “should,” “is anticipated,” “estimated,” “believe,” “intend,” “plan,” “projection,” “outlook” or words of similar meaning. These forward-looking statements include, but are not limited to, statements regarding the strategic review process, REPAY’s market and growth opportunities, REPAY’s business strategy and the plans and objectives of management for future operations and the allocation of capital. Such forward-looking statements are based upon the current beliefs and expectations of REPAY’s management and are inherently subject to significant
business, economic and competitive uncertainties and contingencies, many of which are difficult to predict and generally beyond REPAY’s control.
In addition to factors disclosed in REPAY’s reports filed with the U.S. Securities and Exchange Commission, including its Annual Report on Form 10-K for the year ended December 31, 2024 and those identified elsewhere in this communication, the following factors, among others, could cause actual results and the timing of events to differ materially from the anticipated results or other expectations expressed in the forward-looking statements: risks or uncertainties relating to the outcome or timing of REPAY’s strategic review process, exposure to economic conditions and political risk affecting the consumer loan market, the receivables management industry and consumer and commercial spending, including bank failures or other adverse events affecting financial institutions, inflationary pressures, evolving U.S. trade policies, general economic slowdown or recession; changes in the payment processing market in which REPAY competes, including with respect to its competitive landscape, technology evolution or regulatory changes; changes in the vertical markets that REPAY targets, including the regulatory environment applicable to REPAY’s clients; the ability to retain, develop and hire key personnel; risks relating to REPAY’s relationships within the payment ecosystem; risk that REPAY may not be able to execute its growth strategies, including identifying and executing acquisitions; risks relating to data security; changes in accounting policies applicable to REPAY; and the risk that REPAY may not be able to maintain effective internal controls.
Actual results, performance or achievements may differ materially, and potentially adversely, from any projections and forward-looking statements and the assumptions on which those forward-looking statements are based. There can be no assurance that the data contained herein is reflective of future performance to any degree. You are cautioned not to place undue reliance on forward-looking statements as a predictor of future performance. All information set forth herein speaks only as of the date hereof in the case of information about REPAY or the date of such information in the case of information from persons other than REPAY, and REPAY disclaims any intention or obligation to update any forward-looking statements as a result of developments occurring after the date of this communication. Forecasts and estimates regarding REPAY’s industry and end markets are based on sources it believes to be reliable, however there can be no assurance these forecasts and estimates will prove accurate in whole or in part. Pro forma, projected and estimated numbers are used for illustrative purpose only, are not forecasts and may not reflect actual results.
About REPAY
REPAY provides integrated payment processing solutions to verticals that have specific transaction processing needs. REPAY’s proprietary, integrated payment technology platform reduces the complexity of electronic payments for clients, while enhancing the overall experience for consumers and businesses.
Contacts
Investor Relations Contact for REPAY:
Media Relations Contact for REPAY:
Kristen Hoyman
(404) 637-1665
Consolidated Statement of Operations
|
|
Three Months Ended June 30, |
|
|
Six Months Ended June 30, |
|
||||||||||
($ in thousands, except per share data) |
|
2025 |
|
|
2024 |
|
|
2025 |
|
|
2024 |
|
||||
Revenue |
|
$ |
75,626 |
|
|
$ |
74,906 |
|
|
$ |
152,951 |
|
|
$ |
155,626 |
|
Operating expenses |
|
|
|
|
|
|
|
|
|
|
|
|
||||
Costs of services (exclusive of depreciation and amortization shown separately below) |
|
|
18,404 |
|
|
|
16,321 |
|
|
|
37,068 |
|
|
|
35,496 |
|
Selling, general and administrative |
|
|
32,864 |
|
|
|
35,235 |
|
|
|
69,851 |
|
|
|
72,256 |
|
Depreciation and amortization |
|
|
25,481 |
|
|
|
26,771 |
|
|
|
50,775 |
|
|
|
53,799 |
|
Impairment loss |
|
|
103,781 |
|
|
|
— |
|
|
|
103,781 |
|
|
|
— |
|
Total operating expenses |
|
|
180,530 |
|
|
|
78,327 |
|
|
|
261,475 |
|
|
|
161,551 |
|
Loss from operations |
|
|
(104,904 |
) |
|
|
(3,421 |
) |
|
|
(108,524 |
) |
|
|
(5,925 |
) |
Other income (expense) |
|
|
|
|
|
|
|
|
|
|
|
|
||||
Interest income |
|
|
1,197 |
|
|
|
1,463 |
|
|
|
2,553 |
|
|
|
2,755 |
|
Interest expense |
|
|
(3,087 |
) |
|
|
(909 |
) |
|
|
(6,194 |
) |
|
|
(1,821 |
) |
Change in fair value of tax receivable liability |
|
|
(2,509 |
) |
|
|
(3,366 |
) |
|
|
(5,531 |
) |
|
|
(6,279 |
) |
Other income (loss), net |
|
|
(26 |
) |
|
|
21 |
|
|
|
(253 |
) |
|
|
(5 |
) |
Total other income (expense) |
|
|
(4,425 |
) |
|
|
(2,791 |
) |
|
|
(9,425 |
) |
|
|
(5,350 |
) |
Loss before income tax expense |
|
|
(109,329 |
) |
|
|
(6,212 |
) |
|
|
(117,949 |
) |
|
|
(11,275 |
) |
Income tax benefit (expense) |
|
|
1,297 |
|
|
|
1,975 |
|
|
|
1,749 |
|
|
|
1,673 |
|
Net loss |
|
$ |
(108,032 |
) |
|
$ |
(4,237 |
) |
|
$ |
(116,200 |
) |
|
$ |
(9,602 |
) |
Net loss attributable to non-controlling interest |
|
|
(5,781 |
) |
|
|
(166 |
) |
|
|
(6,002 |
) |
|
|
(319 |
) |
Net loss attributable to the Company |
|
$ |
(102,251 |
) |
|
$ |
(4,071 |
) |
|
$ |
(110,198 |
) |
|
$ |
(9,283 |
) |
|
|
|
|
|
|
|
|
|
|
|
|
|
||||
Weighted-average shares of Class A common stock outstanding - basic and diluted |
|
|
88,647,823 |
|
|
|
91,821,369 |
|
|
|
88,825,785 |
|
|
|
91,519,789 |
|
|
|
|
|
|
|
|
|
|
|
|
|
|
||||
Loss per Class A share - basic and diluted |
|
$ |
(1.15 |
) |
|
$ |
(0.04 |
) |
|
$ |
(1.24 |
) |
|
$ |
(0.10 |
) |
Consolidated Balance Sheets
($ in thousands) |
|
June 30, 2025 (Unaudited) |
|
|
December 31, 2024 |
|
||
Assets |
|
|
|
|
|
|
||
Cash and cash equivalents |
|
$ |
162,615 |
|
|
$ |
189,530 |
|
Current restricted cash |
|
|
33,796 |
|
|
|
35,654 |
|
Accounts receivable, net |
|
|
33,379 |
|
|
|
32,950 |
|
Prepaid expenses and other |
|
|
16,282 |
|
|
|
17,114 |
|
Total current assets |
|
|
246,072 |
|
|
|
275,248 |
|
|
|
|
|
|
|
|
||
Property and equipment, net |
|
|
1,550 |
|
|
|
2,383 |
|
Noncurrent restricted cash |
|
|
12,569 |
|
|
|
11,525 |
|
Intangible assets, net |
|
|
359,827 |
|
|
|
389,034 |
|
Goodwill |
|
|
613,012 |
|
|
|
716,793 |
|
Operating lease right-of-use assets, net |
|
|
10,283 |
|
|
|
11,142 |
|
Deferred tax assets |
|
|
165,144 |
|
|
|
163,283 |
|
Other assets |
|
|
4,917 |
|
|
|
2,500 |
|
Total noncurrent assets |
|
|
1,167,302 |
|
|
|
1,296,660 |
|
Total assets |
|
$ |
1,413,374 |
|
|
$ |
1,571,908 |
|
|
|
|
|
|
|
|
||
Liabilities |
|
|
|
|
|
|
||
Accounts payable |
|
$ |
20,936 |
|
|
$ |
28,912 |
|
Accrued expenses |
|
|
47,532 |
|
|
|
55,501 |
|
Current maturities of long-term debt |
|
|
219,389 |
|
|
|
— |
|
Current operating lease liabilities |
|
|
1,485 |
|
|
|
1,230 |
|
Current tax receivable agreement ($0 and $2,413 held for related parties as of June 30, 2025 and December 31, 2024, respectively) |
|
|
— |
|
|
|
16,337 |
|
Other current liabilities |
|
|
548 |
|
|
|
267 |
|
Total current liabilities |
|
|
289,890 |
|
|
|
102,247 |
|
|
|
|
|
|
|
|
||
Long-term debt |
|
|
279,009 |
|
|
|
496,778 |
|
Noncurrent operating lease liabilities |
|
|
9,650 |
|
|
|
10,507 |
|
Tax receivable agreement, net of current portion ($25,854 and $25,134 held for related parties as of June 30, 2025 and December 31, 2024, respectively) |
|
|
192,951 |
|
|
|
187,308 |
|
Other liabilities |
|
|
2,470 |
|
|
|
1,899 |
|
Total noncurrent liabilities |
|
|
484,080 |
|
|
|
696,492 |
|
Total liabilities |
|
$ |
773,970 |
|
|
$ |
798,739 |
|
|
|
|
|
|
|
|
||
Commitments and contingencies |
|
|
|
|
|
|
||
|
|
|
|
|
|
|
||
Stockholders' equity |
|
|
|
|
|
|
||
Class A common stock, $0.0001 par value; 2,000,000,000 shares authorized; 94,866,507 issued and 84,629,308 outstanding as of June 30, 2025; 93,732,227 issued and 88,239,494 outstanding as of December 31, 2024 |
|
|
9 |
|
|
|
9 |
|
Class V common stock, $0.0001 par value; 1,000 shares authorized and 100 shares issued and outstanding as of June 30, 2025 and December 31, 2024 |
|
|
— |
|
|
|
— |
|
Treasury stock, 10,257,199 and 5,492,733 as of June 30, 2025 and December 31, 2024, respectively |
|
|
(76,427 |
) |
|
|
(53,782 |
) |
Additional paid-in capital |
|
|
1,154,141 |
|
|
|
1,148,871 |
|
Accumulated deficit |
|
|
(444,024 |
) |
|
|
(333,826 |
) |
Total Repay stockholders' equity |
|
$ |
633,699 |
|
|
$ |
761,272 |
|
Non-controlling interests |
|
|
5,705 |
|
|
|
11,897 |
|
Total equity |
|
|
639,404 |
|
|
|
773,169 |
|
Total liabilities and equity |
|
$ |
1,413,374 |
|
|
$ |
1,571,908 |
|
|
|
|
|
|
|
|
||
Consolidated Statements of Cash Flows
|
|
Six Months Ended June 30, |
|
|||||
($ in thousands) |
|
2025 |
|
|
2024 |
|
||
Cash flows from operating activities |
|
|
|
|
|
|
||
Net loss |
|
$ |
(116,200 |
) |
|
$ |
(9,602 |
) |
|
|
|
|
|
|
|
||
Adjustments to reconcile net loss to net cash provided by operating activities: |
|
|
|
|
|
|
||
Depreciation and amortization |
|
|
50,775 |
|
|
|
53,799 |
|
Stock based compensation |
|
|
8,393 |
|
|
|
12,028 |
|
Amortization of debt issuance costs |
|
|
1,619 |
|
|
|
1,423 |
|
Other loss |
|
|
268 |
|
|
|
— |
|
Fair value change in tax receivable agreement liability |
|
|
5,531 |
|
|
|
6,279 |
|
Impairment loss |
|
|
103,781 |
|
|
|
— |
|
Deferred tax expense |
|
|
(1,749 |
) |
|
|
(1,673 |
) |
Change in accounts receivable |
|
|
(429 |
) |
|
|
(3,303 |
) |
Change in prepaid expenses and other |
|
|
832 |
|
|
|
(313 |
) |
Change in operating lease ROU assets |
|
|
859 |
|
|
|
2,368 |
|
Change in other assets |
|
|
(2,417 |
) |
|
|
— |
|
Change in accounts payable |
|
|
(7,976 |
) |
|
|
2,325 |
|
Change in accrued expenses and other |
|
|
(7,969 |
) |
|
|
(6,378 |
) |
Change in operating lease liabilities |
|
|
(602 |
) |
|
|
(2,599 |
) |
Change in other liabilities |
|
|
852 |
|
|
|
1,426 |
|
Net cash provided by operating activities |
|
|
35,568 |
|
|
|
55,780 |
|
|
|
|
|
|
|
|
||
Cash flows from investing activities |
|
|
|
|
|
|
||
Purchases of property and equipment |
|
|
(77 |
) |
|
|
(571 |
) |
Capitalized software development costs |
|
|
(20,925 |
) |
|
|
(22,249 |
) |
Net cash used in investing activities |
|
|
(21,002 |
) |
|
|
(22,820 |
) |
|
|
|
|
|
|
|
||
Cash flows from financing activities |
|
|
|
|
|
|
||
Payments for tax withholding related to shares vesting under Incentive Plan and ESPP |
|
|
(3,313 |
) |
|
|
(2,489 |
) |
Treasury shares repurchased |
|
|
(22,645 |
) |
|
|
— |
|
Payment of Tax Receivable Agreement |
|
|
(16,337 |
) |
|
|
(580 |
) |
Net cash used in financing activities |
|
|
(42,295 |
) |
|
|
(3,069 |
) |
|
|
|
|
|
|
|
||
Increase in cash, cash equivalents and restricted cash |
|
|
(27,729 |
) |
|
|
29,891 |
|
Cash, cash equivalents and restricted cash at beginning of period |
|
$ |
236,709 |
|
|
$ |
144,145 |
|
Cash, cash equivalents and restricted cash at end of period |
|
$ |
208,980 |
|
|
$ |
174,036 |
|
|
|
|
|
|
|
|
||
SUPPLEMENTAL DISCLOSURE OF CASH FLOW INFORMATION |
|
|
|
|
|
|
||
Cash paid during the period for: |
|
|
|
|
|
|
||
Interest |
|
$ |
4,740 |
|
|
$ |
397 |
|
Income taxes (net of refunds received) |
|
$ |
1,793 |
|
|
$ |
1,489 |
|
|
|
|
|
|
|
|
||
Reconciliation of GAAP Net Income (Loss) to Non-GAAP Adjusted EBITDA
For the Three Months Ended June 30, 2025 and 2024
(Unaudited)
|
|
|
|
|
|
|
||
|
Three Months Ended June 30, |
|
|
|||||
($ in thousands) |
2025 |
|
|
2024 |
|
|
||
Revenue |
$ |
75,626 |
|
|
$ |
74,906 |
|
|
Operating expenses |
|
|
|
|
|
|
||
Costs of services (exclusive of depreciation and amortization shown separately below) |
$ |
18,404 |
|
|
$ |
16,321 |
|
|
Selling, general and administrative |
|
32,864 |
|
|
|
35,235 |
|
|
Depreciation and amortization |
|
25,481 |
|
|
|
26,771 |
|
|
Impairment loss |
|
103,781 |
|
|
|
— |
|
|
Total operating expenses |
$ |
180,530 |
|
|
$ |
78,327 |
|
|
Loss from operations |
$ |
(104,904 |
) |
|
$ |
(3,421 |
) |
|
Other income (expense) |
|
|
|
|
|
|
||
Interest income |
|
1,197 |
|
|
|
1,463 |
|
|
Interest expense |
|
(3,087 |
) |
|
|
(909 |
) |
|
Change in fair value of tax receivable liability |
|
(2,509 |
) |
|
|
(3,366 |
) |
|
Other income (loss), net |
|
(26 |
) |
|
|
21 |
|
|
Total other income (expense) |
|
(4,425 |
) |
|
|
(2,791 |
) |
|
Loss before income tax expense |
|
(109,329 |
) |
|
|
(6,212 |
) |
|
Income tax benefit (expense) |
|
1,297 |
|
|
|
1,975 |
|
|
Net loss |
$ |
(108,032 |
) |
|
$ |
(4,237 |
) |
|
|
|
|
|
|
|
|
||
Add: |
|
|
|
|
|
|
||
Interest income |
|
(1,197 |
) |
|
|
(1,463 |
) |
|
Interest expense |
|
3,087 |
|
|
|
909 |
|
|
Depreciation and amortization (a) |
|
25,481 |
|
|
|
26,771 |
|
|
Income tax benefit |
|
(1,297 |
) |
|
|
(1,975 |
) |
|
EBITDA |
$ |
(81,958 |
) |
|
$ |
20,005 |
|
|
|
|
|
|
|
|
|
||
Non-cash impairment loss (b) |
|
103,781 |
|
|
|
— |
|
|
Non-cash change in fair value of assets and liabilities (c) |
|
2,509 |
|
|
|
3,366 |
|
|
Share-based compensation expense (d) |
|
3,049 |
|
|
|
5,874 |
|
|
Transaction expenses (e) |
|
394 |
|
|
|
414 |
|
|
Restructuring and other strategic initiative costs (f) |
|
2,724 |
|
|
|
2,584 |
|
|
Other non-recurring charges (g) |
|
1,312 |
|
|
|
1,485 |
|
|
Adjusted EBITDA |
$ |
31,811 |
|
|
$ |
33,728 |
|
|
|
|
|
|
|
|
|
||
Quarterly Reconciliation of GAAP Net Income (Loss) to Non-GAAP Adjusted EBITDA
(Unaudited)
|
Three Months Ended |
|
||||||||||
($ in thousands) |
|
September 30, 2024 |
|
|
December 31, 2024 |
|
|
March 31, 2025 |
|
|||
Net income (loss) |
|
$ |
3,215 |
|
|
$ |
(3,958 |
) |
|
$ |
(8,168 |
) |
|
|
|
|
|
|
|
|
|
|
|||
Add: |
|
|
|
|
|
|
|
|
|
|||
Interest income |
|
$ |
(1,608 |
) |
|
$ |
(1,629 |
) |
|
$ |
(1,356 |
) |
Interest expense |
|
|
2,918 |
|
|
|
3,134 |
|
|
|
3,107 |
|
Depreciation and amortization (a) |
|
|
25,529 |
|
|
|
24,382 |
|
|
|
25,294 |
|
Income tax (benefit) expense |
|
|
1,524 |
|
|
|
(426 |
) |
|
|
(452 |
) |
EBITDA |
|
$ |
31,578 |
|
|
$ |
21,503 |
|
|
$ |
18,425 |
|
|
|
|
|
|
|
|
|
|
|
|||
Gain on extinguishment of debt (l) |
|
|
(13,136 |
) |
|
|
— |
|
|
|
— |
|
Non-cash change in fair value of assets and liabilities (c) |
|
|
6,479 |
|
|
|
1,785 |
|
|
|
3,022 |
|
Share-based compensation expense (d) |
|
|
6,477 |
|
|
|
5,921 |
|
|
|
6,045 |
|
Transaction expenses (e) |
|
|
937 |
|
|
|
297 |
|
|
|
782 |
|
Restructuring and other strategic initiative costs (f) |
|
|
2,202 |
|
|
|
5,524 |
|
|
|
3,511 |
|
Other non-recurring charges (g) |
|
|
562 |
|
|
|
1,440 |
|
|
|
1,390 |
|
Adjusted EBITDA |
|
$ |
35,099 |
|
|
$ |
36,470 |
|
|
$ |
33,175 |
|
Reconciliation of GAAP Net Income (Loss) to Non-GAAP Adjusted EBITDA
For the Six Months Ended June 30, 2025 and 2024
(Unaudited)
|
Six Months Ended June 30, |
|
|
|||||
($ in thousands) |
2025 |
|
|
2024 |
|
|
||
Revenue |
$ |
152,951 |
|
|
$ |
155,626 |
|
|
Operating expenses |
|
|
|
|
|
|
||
Costs of services (exclusive of depreciation and amortization shown separately below) |
$ |
37,068 |
|
|
$ |
35,496 |
|
|
Selling, general and administrative |
|
69,851 |
|
|
|
72,256 |
|
|
Depreciation and amortization |
|
50,775 |
|
|
|
53,799 |
|
|
Impairment loss |
|
103,781 |
|
|
|
— |
|
|
Total operating expenses |
$ |
261,475 |
|
|
$ |
161,551 |
|
|
Loss from operations |
$ |
(108,524 |
) |
|
$ |
(5,925 |
) |
|
Other income (expense) |
|
|
|
|
|
|
||
Interest income |
|
2,553 |
|
|
|
2,755 |
|
|
Interest expense |
|
(6,194 |
) |
|
|
(1,821 |
) |
|
Change in fair value of tax receivable liability |
|
(5,531 |
) |
|
|
(6,279 |
) |
|
Other income (loss), net |
|
(253 |
) |
|
|
(5 |
) |
|
Total other income (expense) |
|
(9,425 |
) |
|
|
(5,350 |
) |
|
Loss before income tax expense |
|
(117,949 |
) |
|
|
(11,275 |
) |
|
Income tax benefit (expense) |
|
1,749 |
|
|
|
1,673 |
|
|
Net loss |
$ |
(116,200 |
) |
|
$ |
(9,602 |
) |
|
|
|
|
|
|
|
|
||
Add: |
|
|
|
|
|
|
||
Interest income |
|
(2,553 |
) |
|
|
(2,755 |
) |
|
Interest expense |
|
6,194 |
|
|
|
1,821 |
|
|
Depreciation and amortization (a) |
|
50,775 |
|
|
|
53,799 |
|
|
Income tax (benefit) expense |
|
(1,749 |
) |
|
|
(1,673 |
) |
|
EBITDA |
$ |
(63,533 |
) |
|
$ |
41,590 |
|
|
|
|
|
|
|
|
|
||
Non-cash impairment loss (b) |
|
103,781 |
|
|
|
— |
|
|
Non-cash change in fair value of assets and liabilities (c) |
|
5,531 |
|
|
|
6,279 |
|
|
Share-based compensation expense (d) |
|
9,094 |
|
|
|
12,797 |
|
|
Transaction expenses (e) |
|
1,176 |
|
|
|
1,091 |
|
|
Restructuring and other strategic initiative costs (f) |
|
6,235 |
|
|
|
4,768 |
|
|
Other non-recurring charges (g) |
|
2,702 |
|
|
|
2,716 |
|
|
Adjusted EBITDA |
$ |
64,986 |
|
|
$ |
69,241 |
|
|
|
|
|
|
|
|
|
||
Reconciliation of GAAP Net Income (Loss) to Non-GAAP Adjusted Net Income
For the Three Months Ended June 30, 2025 and 2024
(Unaudited)
|
Three Months Ended June 30, |
|
|
|||||
($ in thousands) |
2025 |
|
|
2024 |
|
|
||
Revenue |
$ |
75,626 |
|
|
$ |
74,906 |
|
|
Operating expenses |
|
|
|
|
|
|
||
Costs of services (exclusive of depreciation and amortization shown separately below) |
$ |
18,404 |
|
|
$ |
16,321 |
|
|
Selling, general and administrative |
|
32,864 |
|
|
|
35,235 |
|
|
Depreciation and amortization |
|
25,481 |
|
|
|
26,771 |
|
|
Impairment loss |
|
103,781 |
|
|
|
— |
|
|
Total operating expenses |
$ |
180,530 |
|
|
$ |
78,327 |
|
|
Loss from operations |
$ |
(104,904 |
) |
|
$ |
(3,421 |
) |
|
Interest income |
|
1,197 |
|
|
|
1,463 |
|
|
Interest expense |
|
(3,087 |
) |
|
|
(909 |
) |
|
Change in fair value of tax receivable liability |
|
(2,509 |
) |
|
|
(3,366 |
) |
|
Other income (loss), net |
|
(26 |
) |
|
|
21 |
|
|
Total other income (expense) |
|
(4,425 |
) |
|
|
(2,791 |
) |
|
Loss before income tax expense |
|
(109,329 |
) |
|
|
(6,212 |
) |
|
Income tax benefit (expense) |
|
1,297 |
|
|
|
1,975 |
|
|
Net loss |
$ |
(108,032 |
) |
|
$ |
(4,237 |
) |
|
|
|
|
|
|
|
|
||
Add: |
|
|
|
|
|
|
||
Amortization of acquisition-related intangibles (h) |
|
19,506 |
|
|
|
19,702 |
|
|
Non-cash impairment loss (b) |
|
103,781 |
|
|
|
— |
|
|
Non-cash change in fair value of assets and liabilities (c) |
|
2,509 |
|
|
|
3,366 |
|
|
Share-based compensation expense (d) |
|
3,049 |
|
|
|
5,874 |
|
|
Transaction expenses (e) |
|
394 |
|
|
|
414 |
|
|
Restructuring and other strategic initiative costs (f) |
|
2,724 |
|
|
|
2,584 |
|
|
Other non-recurring charges (g) |
|
1,312 |
|
|
|
1,485 |
|
|
Non-cash interest expense (i) |
|
809 |
|
|
|
712 |
|
|
Pro forma taxes at effective rate (j) |
|
(6,969 |
) |
|
|
(8,138 |
) |
|
Adjusted Net Income |
$ |
19,083 |
|
|
$ |
21,762 |
|
|
|
|
|
|
|
|
|
||
Shares of Class A common stock outstanding (on an as-converted basis) (k) |
|
93,937,366 |
|
|
|
97,665,464 |
|
|
Adjusted Net Income per share |
$ |
0.20 |
|
|
$ |
0.22 |
|
|
Reconciliation of GAAP Net Income (Loss) to Non-GAAP Adjusted Net Income
For the Six Months Ended June 30, 2025 and 2024
(Unaudited)
|
Six Months Ended June 30, |
|
|
|||||
($ in thousands) |
2025 |
|
|
2024 |
|
|
||
Revenue |
$ |
152,951 |
|
|
$ |
155,626 |
|
|
Operating expenses |
|
|
|
|
|
|
||
Costs of services (exclusive of depreciation and amortization shown separately below) |
$ |
37,068 |
|
|
$ |
35,496 |
|
|
Selling, general and administrative |
|
69,851 |
|
|
|
72,256 |
|
|
Depreciation and amortization |
|
50,775 |
|
|
|
53,799 |
|
|
Impairment loss |
|
103,781 |
|
|
|
— |
|
|
Total operating expenses |
$ |
261,475 |
|
|
$ |
161,551 |
|
|
Loss from operations |
$ |
(108,524 |
) |
|
$ |
(5,925 |
) |
|
Other expenses |
|
|
|
|
|
|
||
Interest income |
|
2,553 |
|
|
|
2,755 |
|
|
Interest expense |
|
(6,194 |
) |
|
|
(1,821 |
) |
|
Change in fair value of tax receivable liability |
|
(5,531 |
) |
|
|
(6,279 |
) |
|
Other income (loss), net |
|
(253 |
) |
|
|
(5 |
) |
|
Total other income (expense) |
|
(9,425 |
) |
|
|
(5,350 |
) |
|
Loss before income tax expense |
|
(117,949 |
) |
|
|
(11,275 |
) |
|
Income tax benefit (expense) |
|
1,749 |
|
|
|
1,673 |
|
|
Net loss |
$ |
(116,200 |
) |
|
$ |
(9,602 |
) |
|
|
|
|
|
|
|
|
||
Add: |
|
|
|
|
|
|
||
Amortization of acquisition-related intangibles (h) |
|
38,835 |
|
|
|
39,438 |
|
|
Non-cash impairment loss (b) |
|
103,781 |
|
|
|
— |
|
|
Non-cash change in fair value of assets and liabilities (c) |
|
5,531 |
|
|
|
6,279 |
|
|
Share-based compensation expense (d) |
|
9,094 |
|
|
|
12,797 |
|
|
Transaction expenses (e) |
|
1,176 |
|
|
|
1,091 |
|
|
Restructuring and other strategic initiative costs (f) |
|
6,235 |
|
|
|
4,768 |
|
|
Other non-recurring charges (g) |
|
2,702 |
|
|
|
2,716 |
|
|
Non-cash interest expense (i) |
|
1,619 |
|
|
|
1,424 |
|
|
Pro forma taxes at effective rate (j) |
|
(13,411 |
) |
|
|
(14,771 |
) |
|
Adjusted Net Income |
$ |
39,362 |
|
|
$ |
44,140 |
|
|
|
|
|
|
|
|
|
||
Shares of Class A common stock outstanding (on an as-converted basis) (k) |
|
94,146,654 |
|
|
|
97,363,884 |
|
|
Adjusted Net Income per share |
$ |
0.42 |
|
|
$ |
0.45 |
|
|
Reconciliation of Operating Cash Flow to Free Cash Flow
For the Three and Six Months and Ended June 30, 2025 and 2024
(Unaudited)
|
|
Three Months Ended June 30, |
|
|
Six Months Ended June 30, |
|
||||||||||
($ in thousands) |
|
2025 |
|
|
2024 |
|
|
2025 |
|
|
2024 |
|
||||
Net cash provided by operating activities |
|
$ |
33,065 |
|
|
$ |
30,979 |
|
|
$ |
35,568 |
|
|
$ |
55,780 |
|
Capital expenditures |
|
|
|
|
|
|
|
|
|
|
|
|
||||
Cash paid for property and equipment |
|
|
69 |
|
|
|
(484 |
) |
|
|
(77 |
) |
|
|
(571 |
) |
Capitalized software development costs |
|
|
(10,534 |
) |
|
|
(11,207 |
) |
|
|
(20,925 |
) |
|
|
(22,249 |
) |
Total capital expenditures |
|
|
(10,465 |
) |
|
|
(11,691 |
) |
|
|
(21,002 |
) |
|
|
(22,820 |
) |
Free cash flow |
|
$ |
22,600 |
|
|
$ |
19,288 |
|
|
$ |
14,566 |
|
|
$ |
32,960 |
|
|
|
|
|
|
|
|
|
|
|
|
|
|
||||
Free cash flow conversion |
|
|
71 |
% |
|
|
57 |
% |
|
|
22 |
% |
|
|
48 |
% |
Quarterly Reconciliation of Operating Cash Flow to Free Cash Flow
(Unaudited)
|
Three Months Ended |
|
||||||||||
($ in thousands) |
|
September 30, 2024 |
|
|
December 31, 2024 |
|
|
March 31, 2025 |
|
|||
Net cash provided by operating activities |
|
$ |
60,058 |
|
|
$ |
34,252 |
|
|
$ |
2,503 |
|
Capital expenditures |
|
|
|
|
|
|
|
|
|
|||
Cash paid for property and equipment |
|
|
(211 |
) |
|
|
(207 |
) |
|
|
(146 |
) |
Capitalized software development costs |
|
|
(11,029 |
) |
|
|
(10,586 |
) |
|
|
(10,391 |
) |
Total capital expenditures |
|
|
(11,240 |
) |
|
|
(10,793 |
) |
|
|
(10,537 |
) |
Free cash flow |
|
$ |
48,818 |
|
|
$ |
23,459 |
|
|
$ |
(8,034 |
) |
|
|
|
|
|
|
|
|
|
|
|||
Free cash flow conversion |
|
|
139 |
% |
|
|
64 |
% |
|
|
(24 |
%) |
Reconciliation of Gross Profit Growth to Normalized Gross Profit Growth by Segment
For the Year-over-Year Change Between the Three Months Ended June 30, 2025 and 2024
(Unaudited)
|
|
Consumer Payments |
|
|
Business Payments |
|
|
Total |
|
|||
Gross profit growth |
|
|
(0 |
%) |
|
|
(5 |
%) |
|
|
(2 |
%) |
Less: Growth from contributions related to political media |
|
|
— |
|
|
|
(6 |
%) |
|
|
(1 |
%) |
Normalized gross profit growth (m) |
|
|
(0 |
%) |
|
|
1 |
% |
|
|
(1 |
%) |
|
|
Three Months Ended June 30, |
|
|
Six Months Ended June 30, |
|
||||||||||
($ in thousands) |
|
2025 |
|
|
2024 |
|
|
2025 |
|
|
2024 |
|
||||
Acquisition-related intangibles |
|
$ |
19,506 |
|
|
$ |
19,702 |
|
|
$ |
38,835 |
|
|
$ |
39,438 |
|
Software |
|
|
5,815 |
|
|
|
6,856 |
|
|
|
11,297 |
|
|
|
13,569 |
|
Amortization |
|
$ |
25,321 |
|
|
$ |
26,558 |
|
|
$ |
50,132 |
|
|
$ |
53,007 |
|
Depreciation |
|
|
160 |
|
|
|
213 |
|
|
|
643 |
|
|
|
792 |
|
Total Depreciation and amortization (1) |
|
$ |
25,481 |
|
|
$ |
26,771 |
|
|
$ |
50,775 |
|
|
$ |
53,799 |
|
|
|
Three Months Ended |
|
|||||||||
($ in thousands) |
|
September 30, 2024 |
|
|
December 31, 2024 |
|
|
March 31, 2025 |
|
|||
Acquisition-related intangibles |
|
$ |
19,111 |
|
|
$ |
18,595 |
|
|
$ |
19,329 |
|
Software |
|
|
6,008 |
|
|
|
5,249 |
|
|
|
5,482 |
|
Amortization |
|
$ |
25,119 |
|
|
$ |
23,844 |
|
|
$ |
24,811 |
|
Depreciation |
|
|
410 |
|
|
|
538 |
|
|
|
483 |
|
Total Depreciation and amortization (1) |
|
$ |
25,529 |
|
|
$ |
24,382 |
|
|
$ |
25,294 |
|
|
|
Three Months Ended June 30, |
|
Six Months Ended June 30, |
||||
|
|
2025 |
|
2024 |
|
2025 |
|
2024 |
Weighted average shares of Class A common stock outstanding - basic |
|
88,647,823 |
|
91,821,369 |
|
88,825,785 |
|
91,519,789 |
Add: Non-controlling interests |
|
|
|
|
|
|
|
|
Weighted average Post-Merger Repay Units exchangeable for Class A common stock |
|
5,289,543 |
|
5,844,095 |
|
5,320,869 |
|
5,844,095 |
Shares of Class A common stock outstanding (on an as-converted basis) |
|
93,937,366 |
|
97,665,464 |
|
94,146,654 |
|
97,363,884 |

Q2 2025 Earnings Supplement August 2025 Exhibit 99.2
Disclaimer Repay Holdings Corporation (“REPAY” or the “Company”) is required to file annual, quarterly and current reports, proxy statements and other information with the Securities and Exchange Commission (“SEC”) Such filings, which you may obtain for free at the SEC’s website at http://www.sec.gov, discuss some of the important risk factors that may affect REPAY’s business, results of operations and financial condition. Forward-Looking Statements This presentation (the “Presentation”) contains “forward-looking statements” within the meaning of the Private Securities Litigation Reform Act of 1995. Such statements include, but are not limited to, statements about future financial and operating results, REPAY’s plans, objectives, expectations and intentions with respect to future operations, products and services; and other statements identified by words such as “will likely result,” “are expected to,” “will continue,” “is anticipated,” “estimated,” “believe,” “intend,” “plan,” “projection,” “outlook” or words of similar meaning. These forward-looking statements include, but are not limited to, REPAY’s 2025 outlook and other financial guidance, expected demand on REPAY’s product offering, including further implementation of electronic payment options and statements regarding REPAY’s market and growth opportunities, and REPAY’s business strategy and the plans and objectives of management for future operations. Such forward-looking statements are based upon the current beliefs and expectations of REPAY’s management and are inherently subject to significant business, economic and competitive uncertainties and contingencies, many of which are difficult to predict and generally beyond REPAY’s control. In addition to factors previously disclosed in REPAY’s reports filed with the SEC, including its Annual Report on Form 10-K for the year ended December 31, 2024 and subsequent Form 10-Qs, the following factors, among others, could cause actual results and the timing of events to differ materially from the anticipated results or other expectations expressed in the forward-looking statements: exposure to economic conditions and political risk affecting the consumer loan market, the receivables management industry and consumer and commercial spending, including bank failures or other adverse events affecting financial institutions, inflationary pressures, general economic slowdown or recession; changes in the payment processing market in which REPAY competes, including with respect to its competitive landscape, technology evolution or regulatory changes; changes in the vertical markets that REPAY targets, including the regulatory environment applicable to REPAY’s clients; the ability to retain, develop and hire key personnel; risks relating to REPAY’s relationships within the payment ecosystem; risk that REPAY may not be able to execute its capital allocation and growth strategies, including identifying and executing acquisitions; risks relating to data security; changes in accounting policies applicable to REPAY; and the risk that REPAY may not be able to maintain effective internal controls. Actual results, performance or achievements may differ materially, and potentially adversely, from any projections and forward-looking statements and the assumptions on which those forward-looking statements are based. There can be no assurance that the data contained herein is reflective of future performance to any degree. You are cautioned not to place undue reliance on forward-looking statements as a predictor of future performance. All information set forth herein speaks only as of the date hereof in the case of information about REPAY or the date of such information in the case of information from persons other than REPAY, and REPAY disclaims any intention or obligation to update any forward-looking statements as a result of developments occurring after the date of this Presentation. Forecasts and estimates regarding our industry and end markets are based on sources REPAY believes to be reliable, however there can be no assurance these forecasts and estimates will prove accurate in whole or in part. Annualized, pro forma, projected and estimated numbers are used for illustrative purpose only, are not forecasts and may not reflect actual results. Industry and Market Data The information contained herein also includes information provided by third parties, such as market research firms. Neither of REPAY nor its affiliates and any third parties that provide information to REPAY, such as market research firms, guarantee the accuracy, completeness, timeliness or availability of any information. Neither REPAY nor its affiliates and any third parties that provide information to REPAY, such as market research firms, are responsible for any errors or omissions (negligent or otherwise), regardless of the cause, or the results obtained from the use of such content. Neither REPAY nor its affiliates give any express or implied warranties, including, but not limited to, any warranties of merchantability or fitness for a particular purpose or use, and they expressly disclaim any responsibility or liability for direct, indirect, incidental, exemplary, compensatory, punitive, special or consequential damages, costs, expenses, legal fees or losses (including lost income or profits and opportunity costs) in connection with the use of the information herein. Non-GAAP Financial Measures This Presentation includes certain non-GAAP financial measures that REPAY’s management uses to evaluate its operating business, measure its performance and make strategic decisions. Adjusted EBITDA is a non-GAAP financial measure that represents net income prior to interest expense, tax expense, depreciation and amortization, as adjusted to add back certain charges deemed to not be part of normal operating expenses, non-cash and/or non-recurring charges, such as non-cash impairment loss, loss on business disposition, loss on extinguishment of debt, loss on termination of interest rate hedge, non-cash change in fair value of contingent consideration, non-cash change in fair value of assets and liabilities, share-based compensation charges, transaction expenses, restructuring and other strategic initiative costs and other non-recurring charges. Adjusted EBITDA margin is a non-GAAP financial measure that represents Adjusted EBITDA divided by GAAP revenue. Adjusted Net Income is a non-GAAP financial measure that represents net income prior to amortization of acquisition-related intangibles, as adjusted to add back certain charges deemed to not be part of normal operating expenses, non-cash and/or non-recurring charges, such as non-cash impairment loss, loss on business disposition, loss on extinguishment of debt, loss on termination of interest rate hedge, non-cash change in fair value of contingent consideration, non-cash change in fair value of assets and liabilities, share-based compensation expense, transaction expenses, restructuring and strategic initiative costs and other non-recurring charges, non-cash interest expense, net of tax effect associated with these adjustments. Adjusted Net Income is adjusted to exclude amortization of all acquisition-related intangibles as such amounts are inconsistent in amount and frequency and are significantly impacted by the timing and/or size of acquisitions. Management believes that the adjustment of acquisition-related intangible amortization supplements GAAP financial measures because it allows for greater comparability of operating performance. Although management excludes amortization from acquisition-related intangibles from REPAY’s non-GAAP expenses, management believes that it is important for investors to understand that such intangibles were recorded as part of purchase accounting and contribute to revenue generation. Each of “organic revenue growth,” and “organic gross profit (GP) growth” is a non-GAAP financial measure that represents the percentage change in the applicable metric for a fiscal period over the comparable prior fiscal period, exclusive of any incremental amount attributable to acquisitions or divestitures made in the comparable prior fiscal period or any subsequent fiscal period through the applicable current fiscal period. Any financial measure (whether GAAP or non-GAAP) that is modified by “excl. political media” is a non-GAAP financial measure that measures a defined growth rate exclusive of the estimated contribution from political media clients in the prior corresponding period. Free Cash Flow is a non-GAAP financial measure that represents net cash flow provided by operating activities less total capital expenditures. Free Cash Flow Conversion represents Free Cash Flow divided by Adjusted EBITDA. REPAY believes that each of the non-GAAP financial measures referenced in this paragraph provide useful information to investors and others in understanding and evaluating its operating results in the same manner as management. However, these non-GAAP financial measures are not financial measures calculated in accordance with GAAP and should not be considered as a substitute for net income, operating profit, or any other operating performance measure calculated in accordance with GAAP. Using these non-GAAP financial measures to analyze REPAY’s business has material limitations because the calculations are based on the subjective determination of management regarding the nature and classification of events and circumstances that investors may find significant. In addition, although other companies in REPAY’s industry may report measures titled with the same or similar description, such non-GAAP financial measures may be calculated differently from how REPAY calculates its non-GAAP financial measures, which reduces their overall usefulness as comparative measures. Because of these limitations, you should consider each of the non-GAAP financial measures referenced in this paragraph alongside other financial performance measures, including net income and REPAY’s other financial results presented in accordance with GAAP.
1 Financial Update
We are committed to executing towards profitable growth, with a continued focus on optimizing payment flows and enhancing operational efficiency We will continue to take advantage of the many secular trends towards frictionless digital payments that have been, and will continue to be, a tailwind driving our business
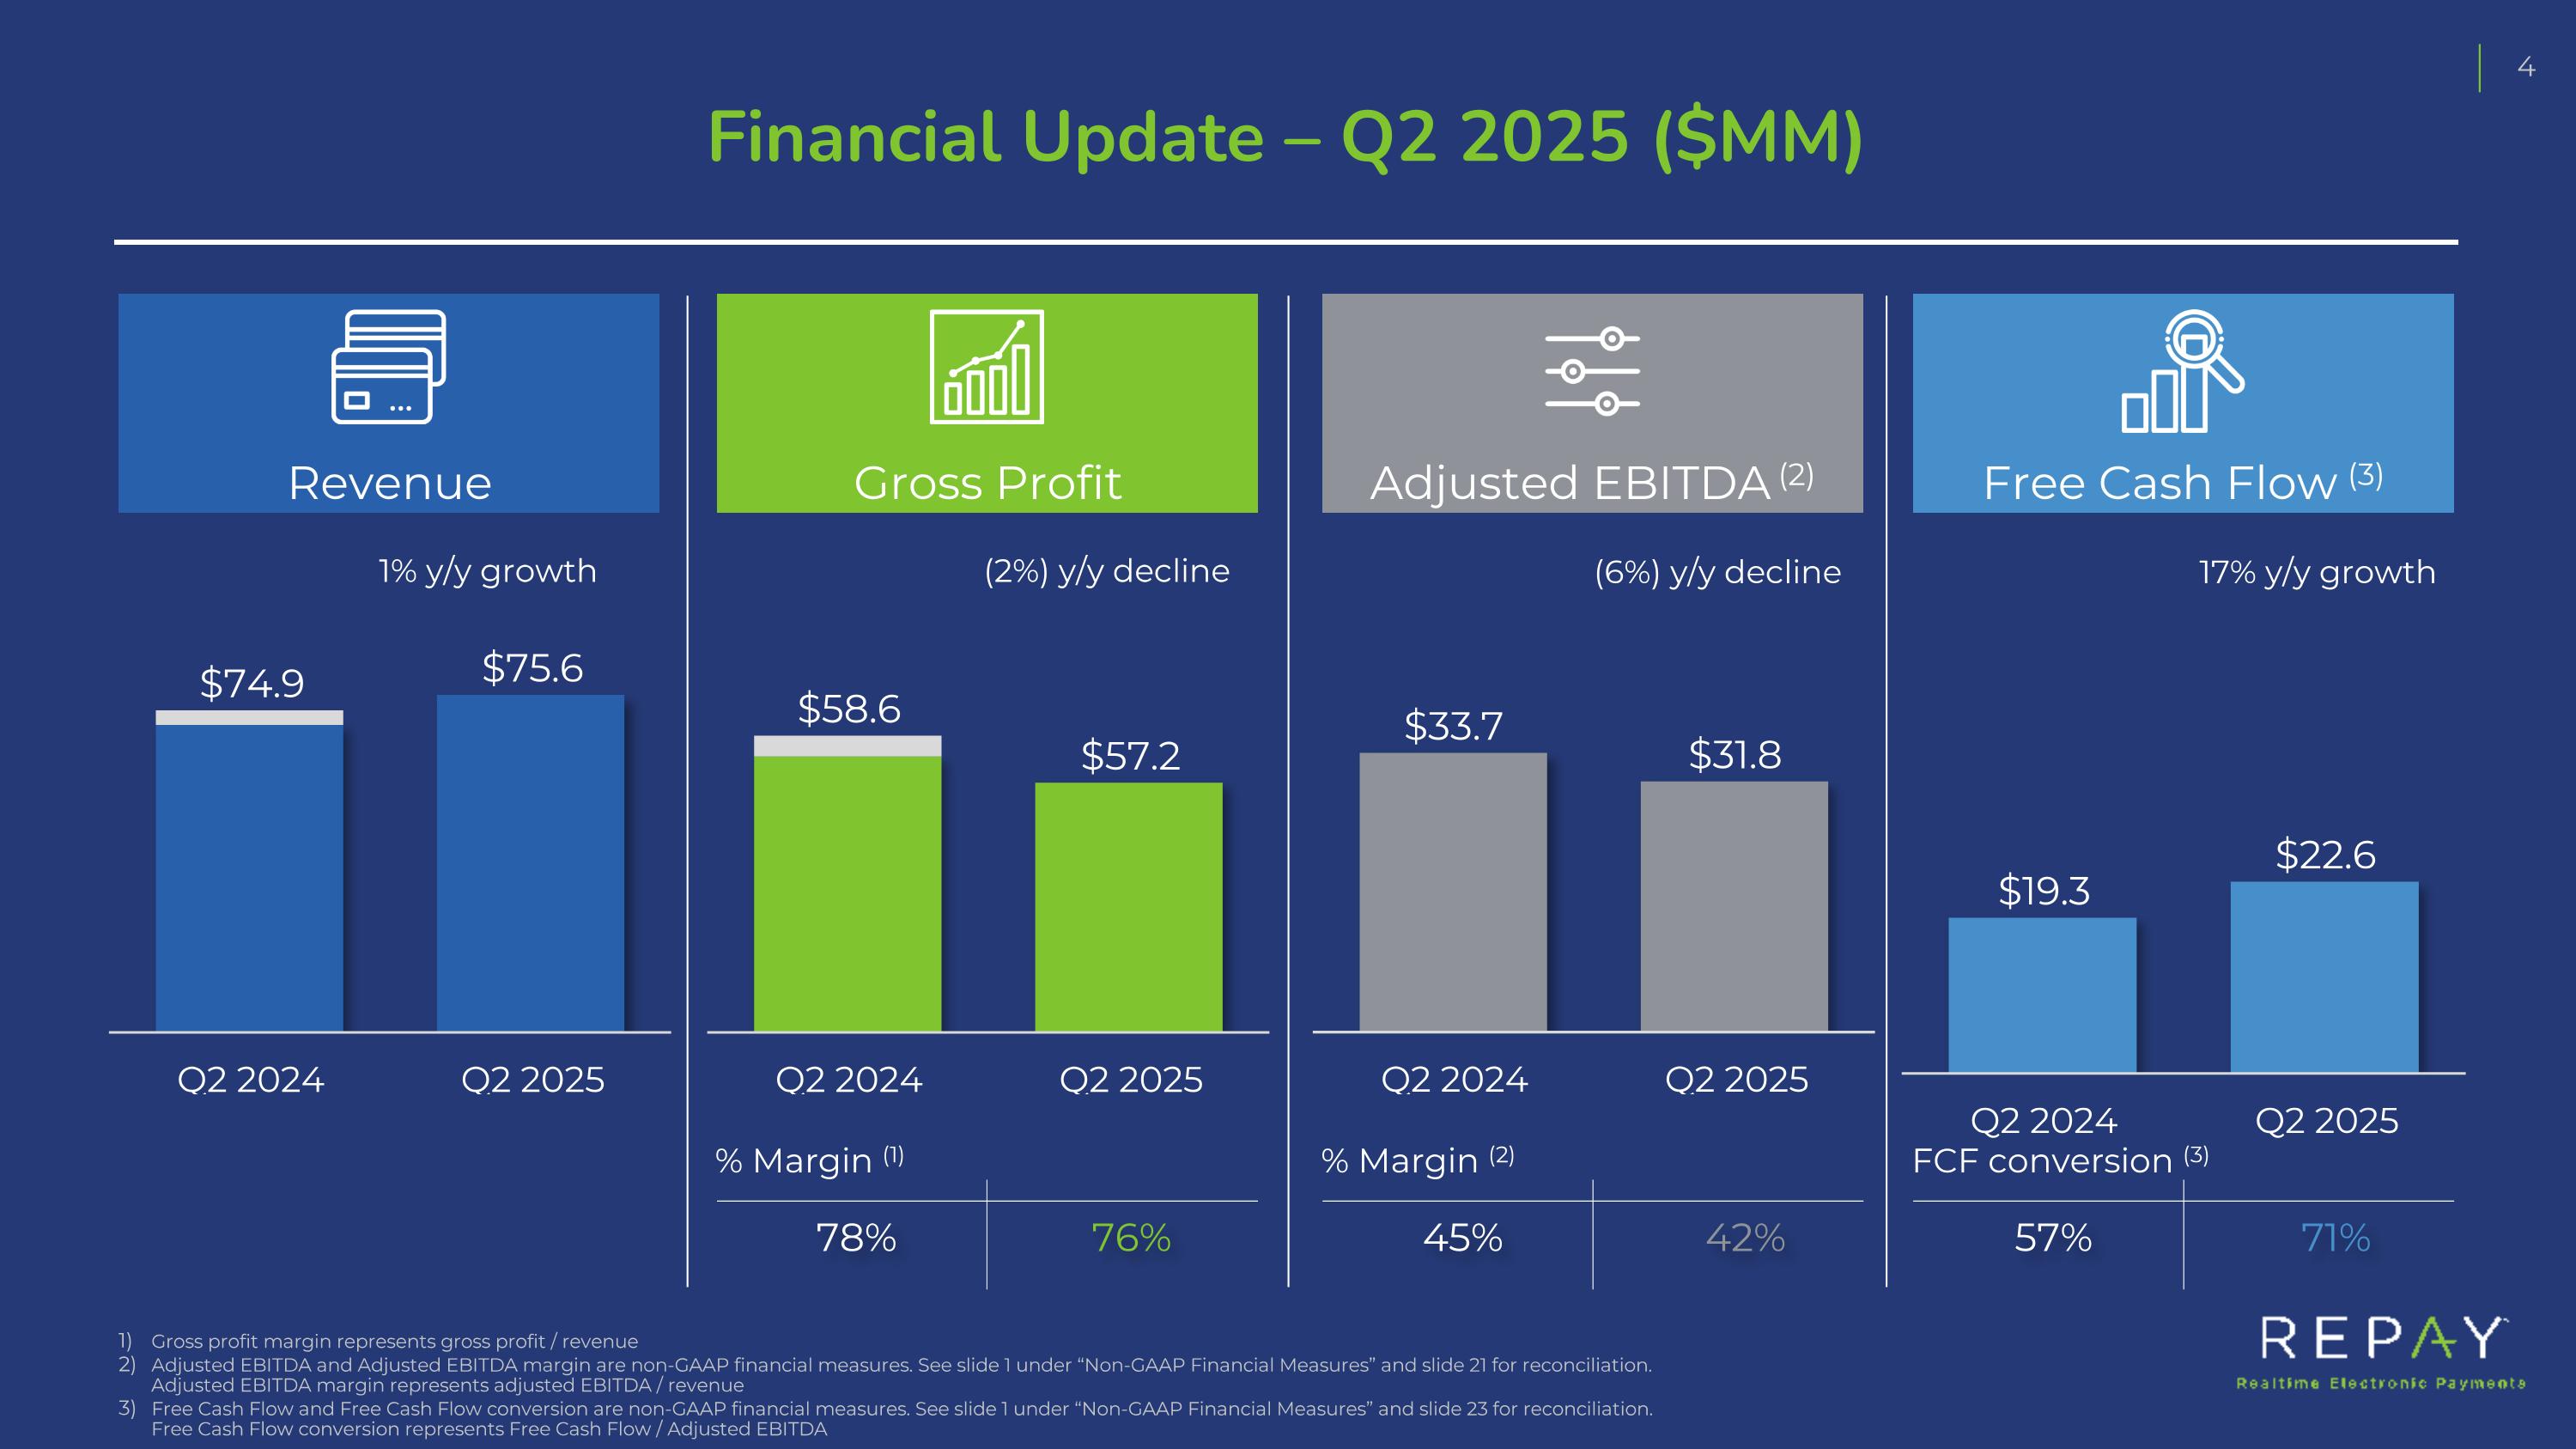
Financial Update – Q2 2025 ($MM) Revenue Gross Profit Adjusted EBITDA (2) Gross profit margin represents gross profit / revenue Adjusted EBITDA and Adjusted EBITDA margin are non-GAAP financial measures. See slide 1 under “Non-GAAP Financial Measures” and slide 21 for reconciliation. Adjusted EBITDA margin represents adjusted EBITDA / revenue Free Cash Flow and Free Cash Flow conversion are non-GAAP financial measures. See slide 1 under “Non-GAAP Financial Measures” and slide 23 for reconciliation. Free Cash Flow conversion represents Free Cash Flow / Adjusted EBITDA 78% 76% % Margin (1) 45% 42% % Margin (2) (2%) y/y decline 1% y/y growth (6%) y/y decline Free Cash Flow (3) 57% 71% FCF conversion (3) 17% y/y growth
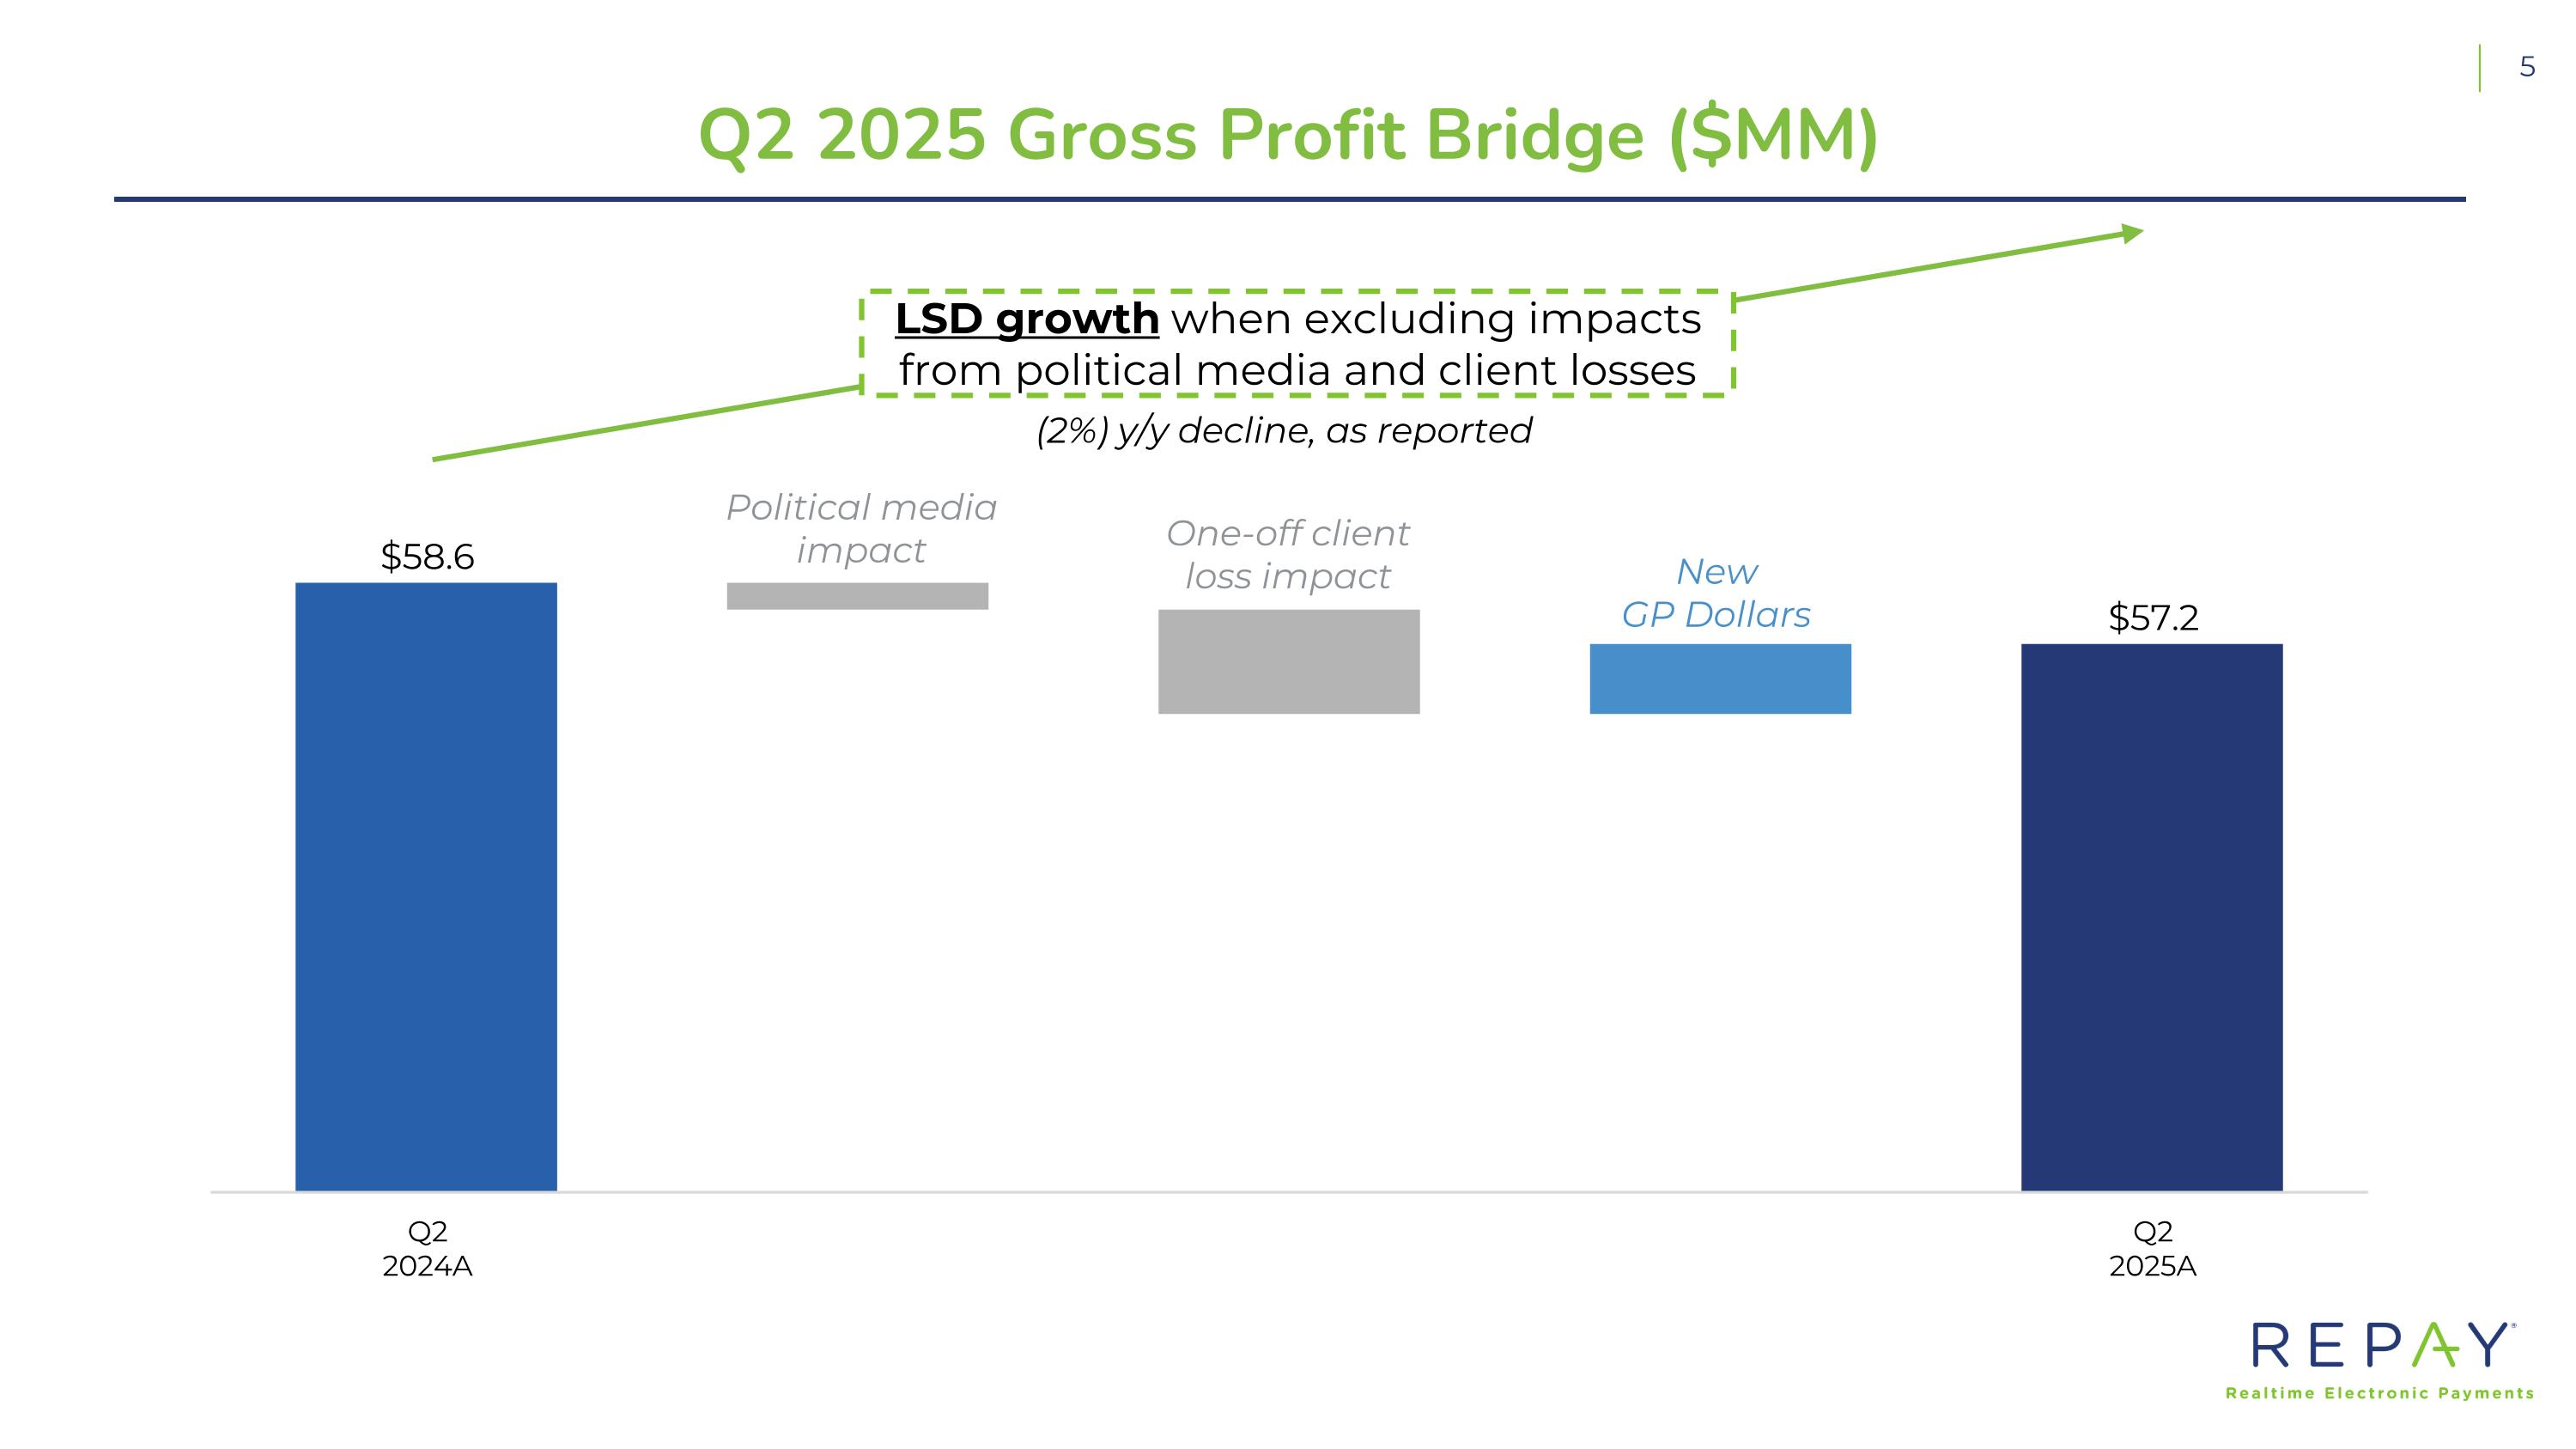
Q2 2025 Gross Profit Bridge ($MM) New GP Dollars Political media impact One-off client loss impact LSD growth when excluding impacts from political media and client losses (2%) y/y decline, as reported
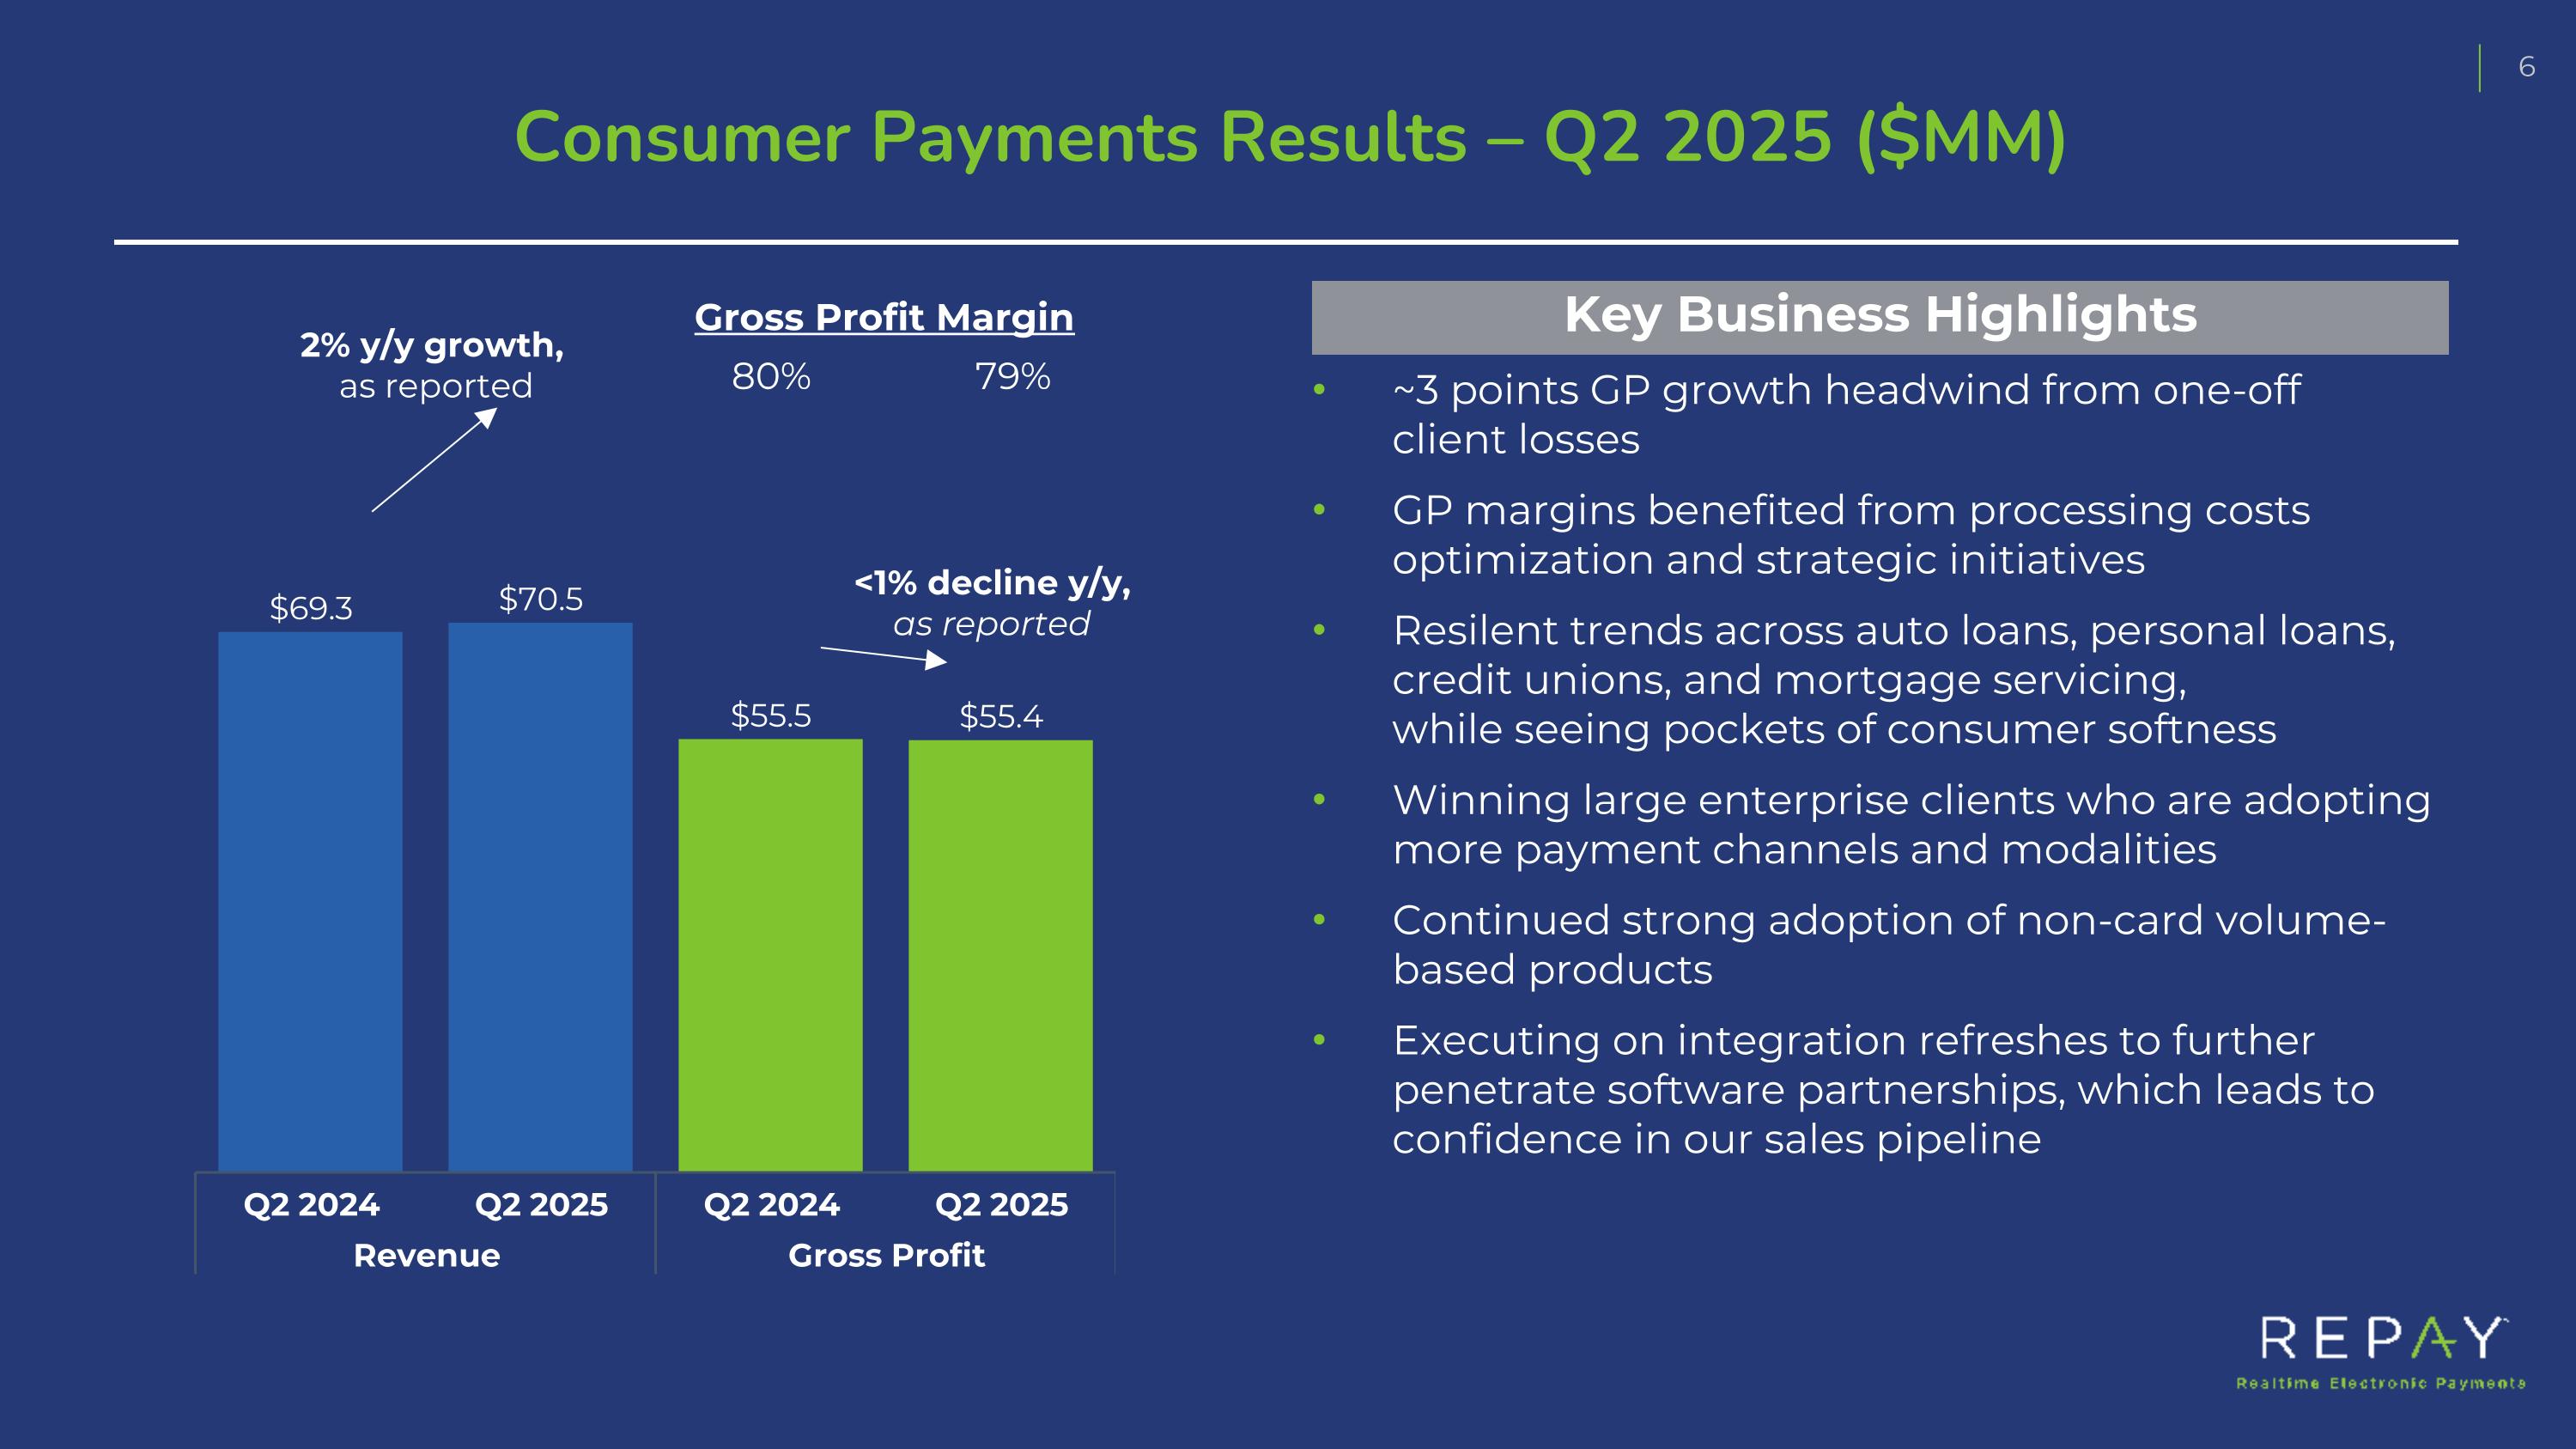
Consumer Payments Results – Q2 2025 ($MM) Key Business Highlights ~3 points GP growth headwind from one-off client losses GP margins benefited from processing costs optimization and strategic initiatives Resilent trends across auto loans, personal loans, credit unions, and mortgage servicing, while seeing pockets of consumer softness Winning large enterprise clients who are adopting more payment channels and modalities Continued strong adoption of non-card volume-based products Executing on integration refreshes to further penetrate software partnerships, which leads to confidence in our sales pipeline Gross Profit Margin 80% 79% 2% y/y growth, as reported <1% decline y/y, as reported
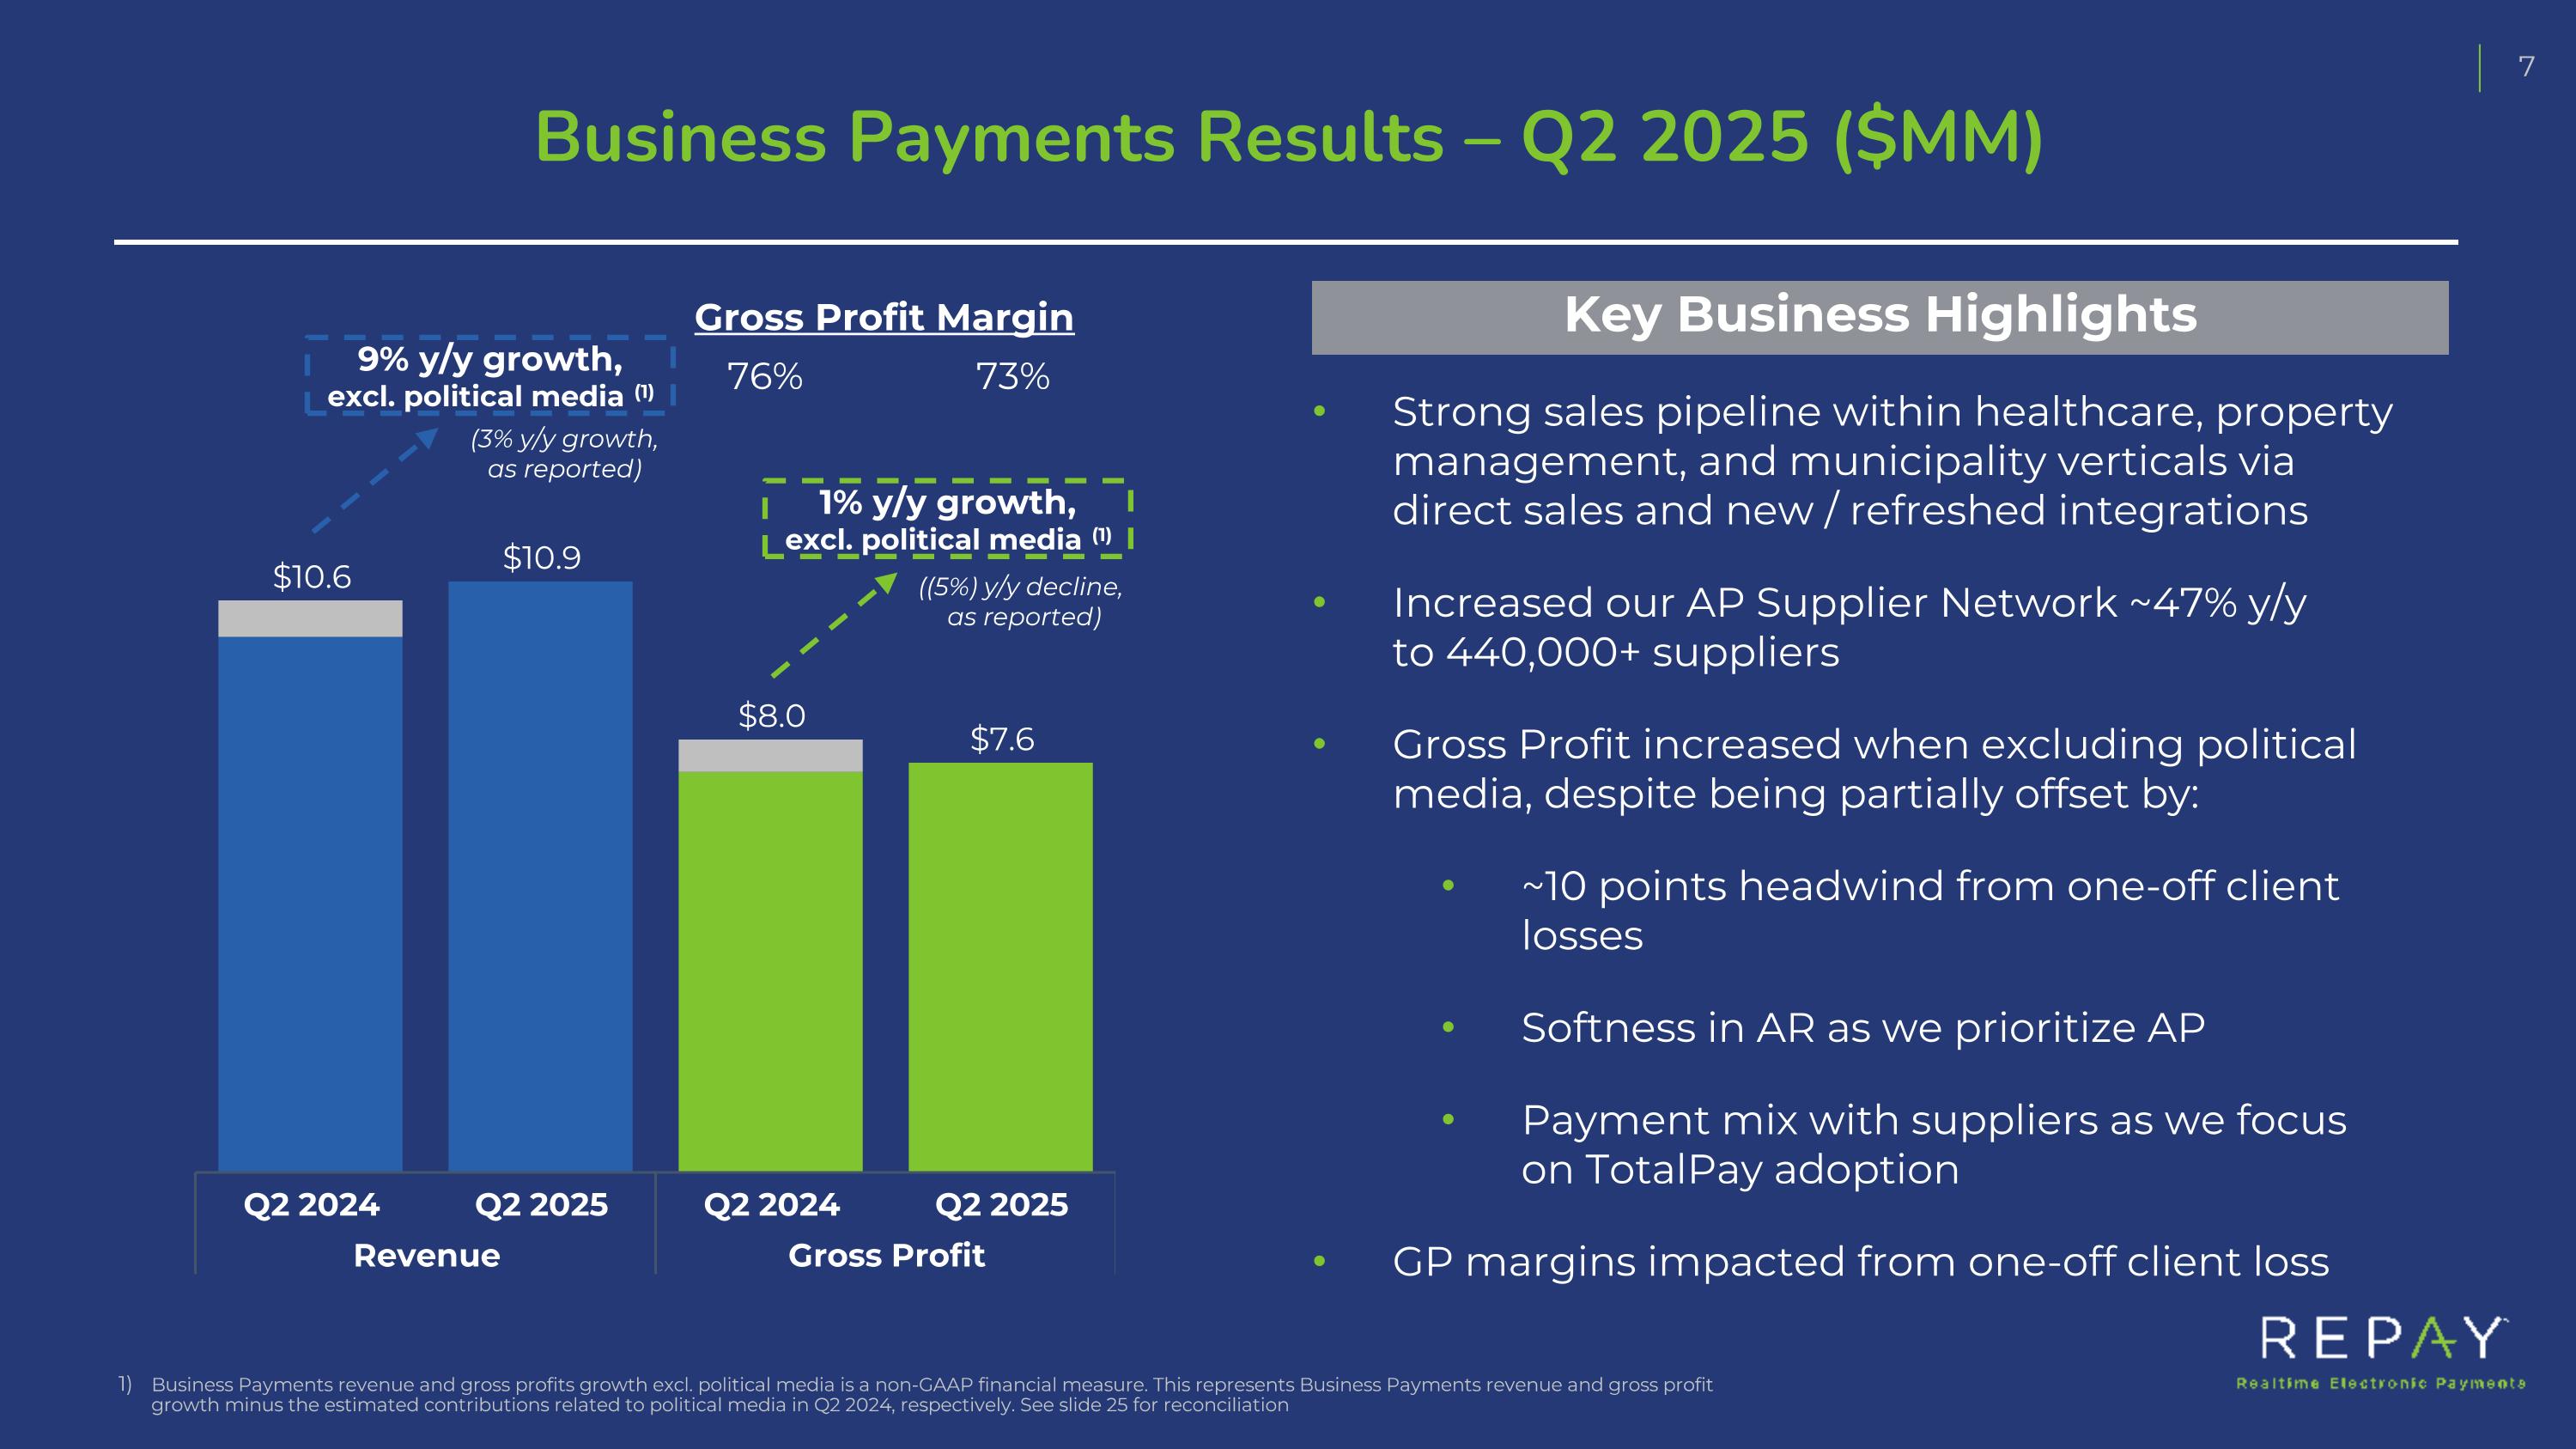
Strong sales pipeline within healthcare, property management, and municipality verticals via direct sales and new / refreshed integrations Increased our AP Supplier Network ~47% y/y to 440,000+ suppliers Gross Profit increased when excluding political media, despite being partially offset by: ~10 points headwind from one-off client losses Softness in AR as we prioritize AP Payment mix with suppliers as we focus on TotalPay adoption GP margins impacted from one-off client loss Business Payments Results – Q2 2025 ($MM) Key Business Highlights Gross Profit Margin 76% 73% 9% y/y growth, excl. political media (1) 1% y/y growth, excl. political media (1) (3% y/y growth, as reported) ((5%) y/y decline, as reported) Business Payments revenue and gross profits growth excl. political media is a non-GAAP financial measure. This represents Business Payments revenue and gross profit growth minus the estimated contributions related to political media in Q2 2024, respectively. See slide 25 for reconciliation
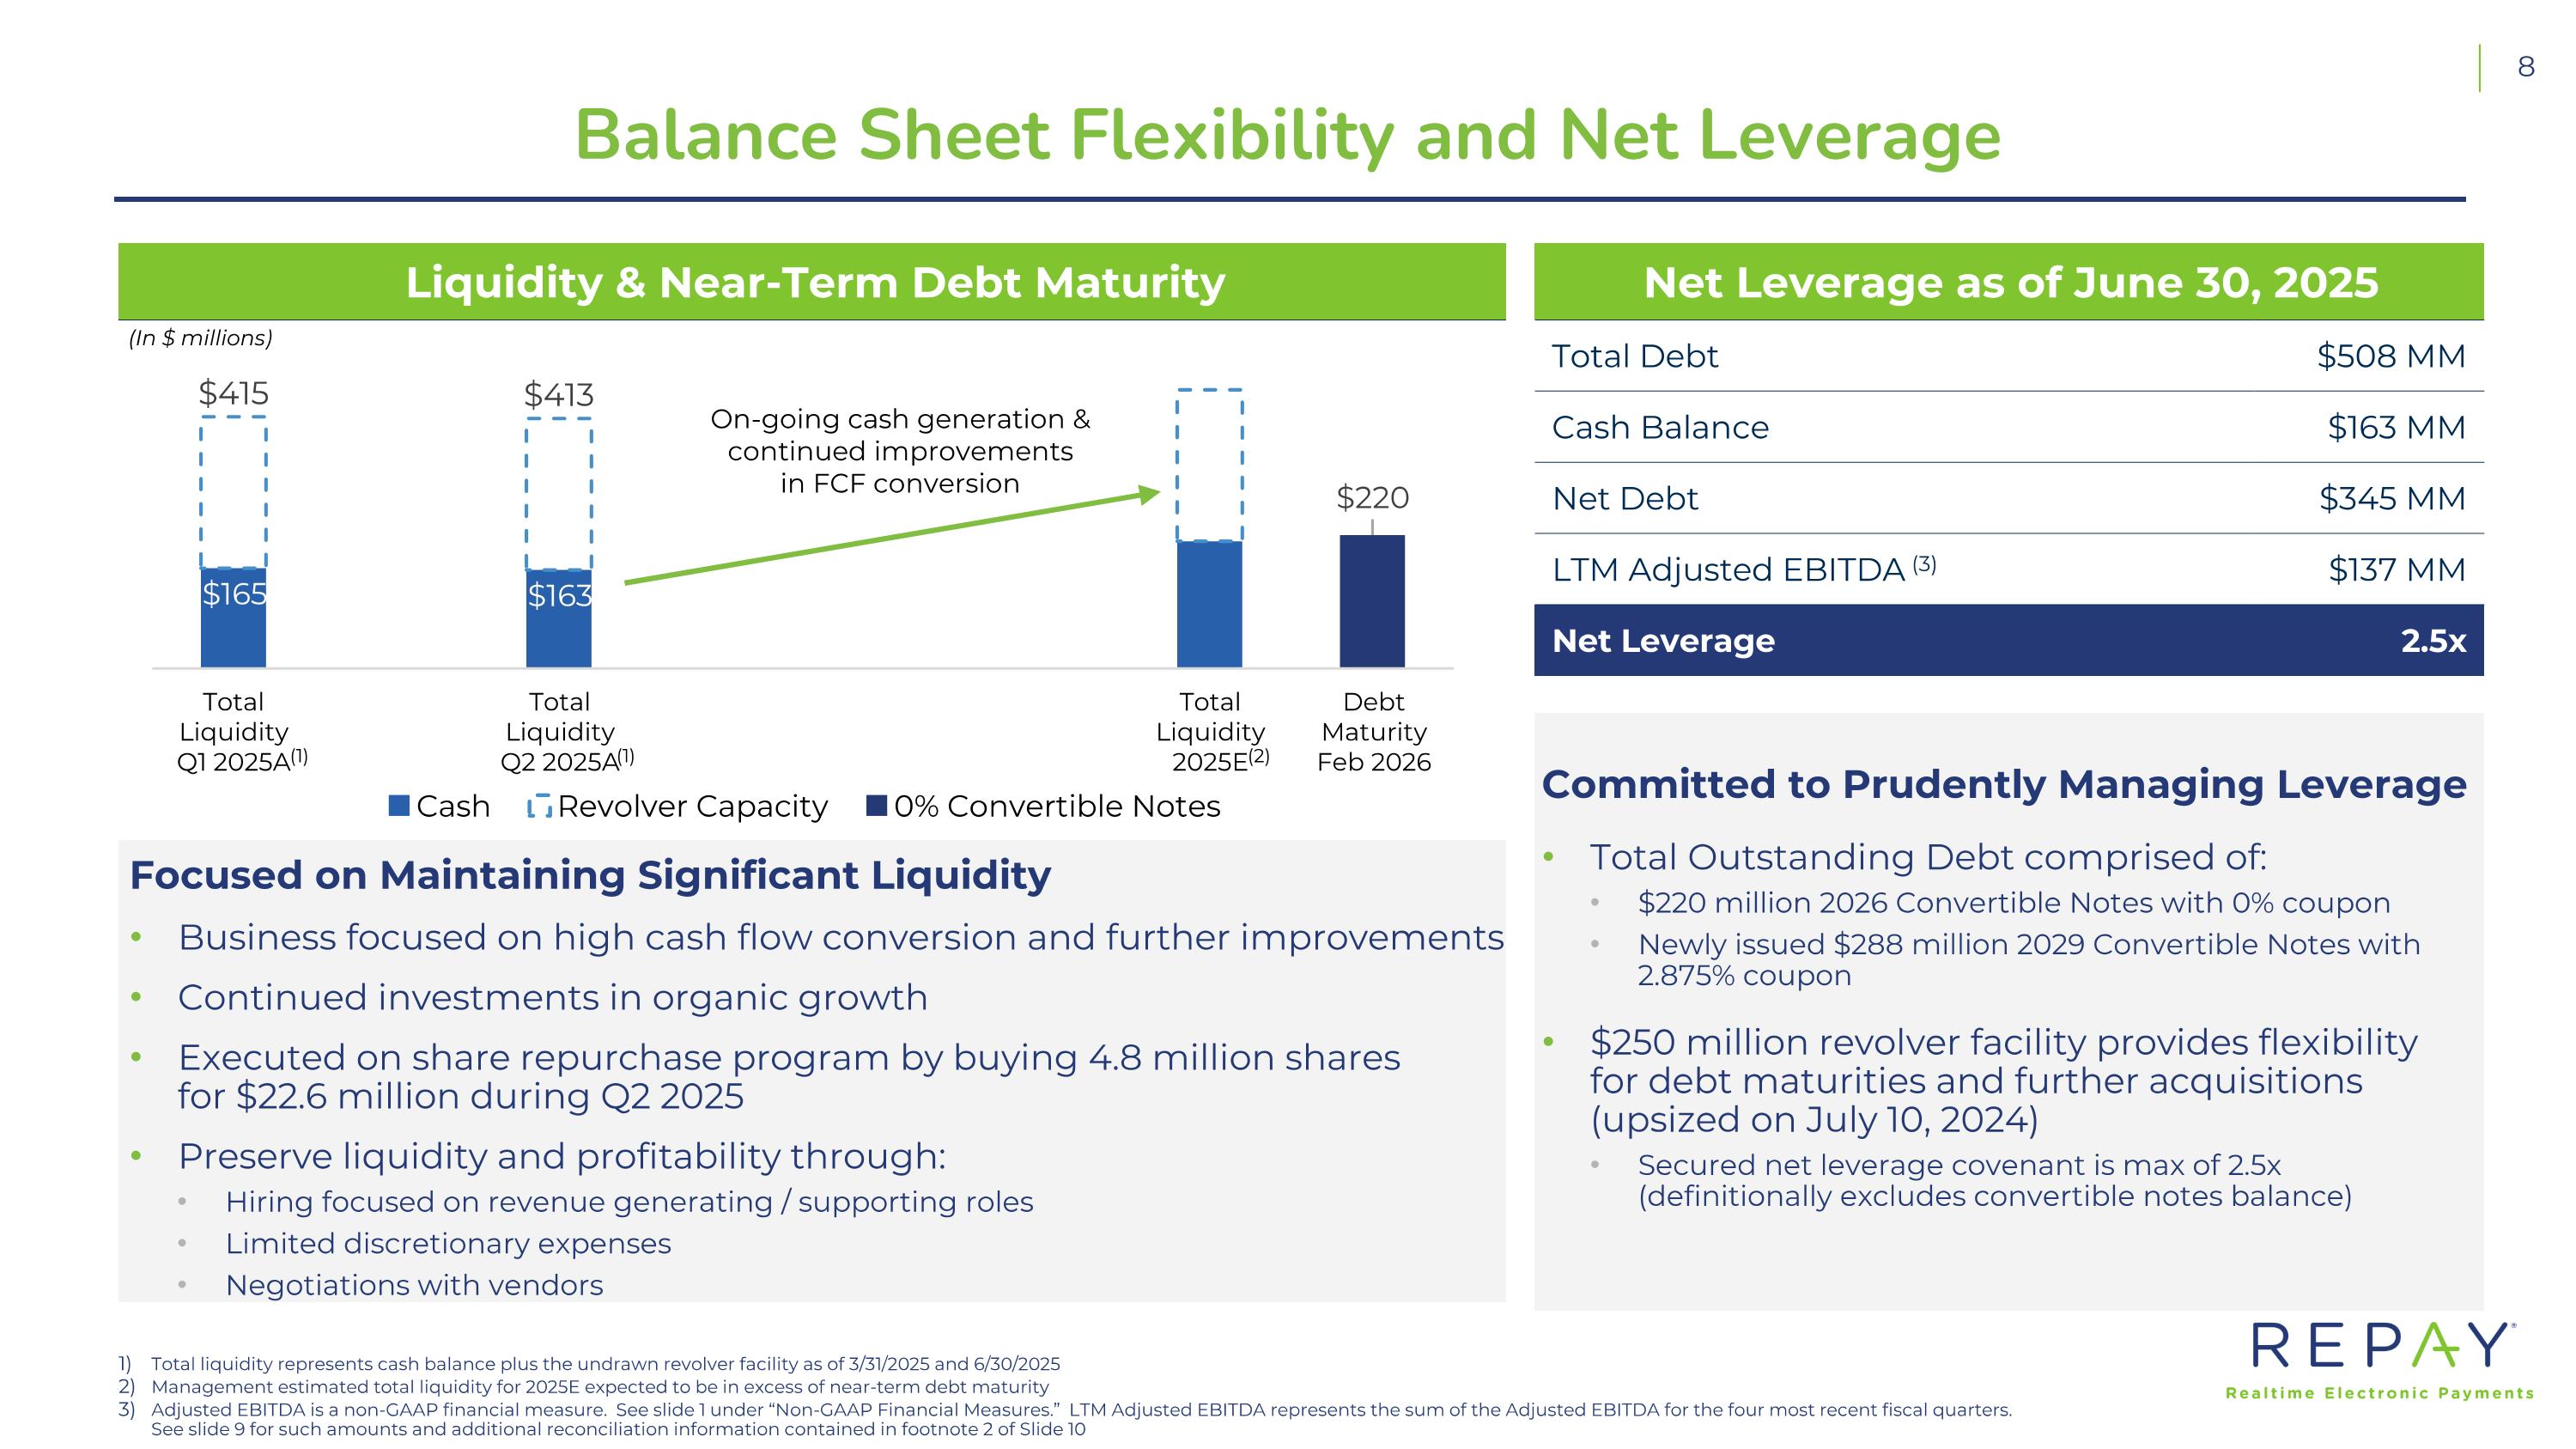
Balance Sheet Flexibility and Net Leverage Total liquidity represents cash balance plus the undrawn revolver facility as of 3/31/2025 and 6/30/2025 Management estimated total liquidity for 2025E expected to be in excess of near-term debt maturity Adjusted EBITDA is a non-GAAP financial measure. See slide 1 under “Non-GAAP Financial Measures.” LTM Adjusted EBITDA represents the sum of the Adjusted EBITDA for the four most recent fiscal quarters. See slide 9 for such amounts and additional reconciliation information contained in footnote 2 of Slide 10 Liquidity & Near-Term Debt Maturity Focused on Maintaining Significant Liquidity Business focused on high cash flow conversion and further improvements Continued investments in organic growth Executed on share repurchase program by buying 4.8 million shares for $22.6 million during Q2 2025 Preserve liquidity and profitability through: Hiring focused on revenue generating / supporting roles Limited discretionary expenses Negotiations with vendors On-going cash generation & continued improvements in FCF conversion (1) (In $ millions) (2) Net Leverage as of June 30, 2025 Total Debt $508 MM Cash Balance $163 MM Net Debt $345 MM LTM Adjusted EBITDA (3) $137 MM Net Leverage 2.5x Committed to Prudently Managing Leverage Total Outstanding Debt comprised of: $220 million 2026 Convertible Notes with 0% coupon Newly issued $288 million 2029 Convertible Notes with 2.875% coupon $250 million revolver facility provides flexibility for debt maturities and further acquisitions (upsized on July 10, 2024) Secured net leverage covenant is max of 2.5x (definitionally excludes convertible notes balance) (1)
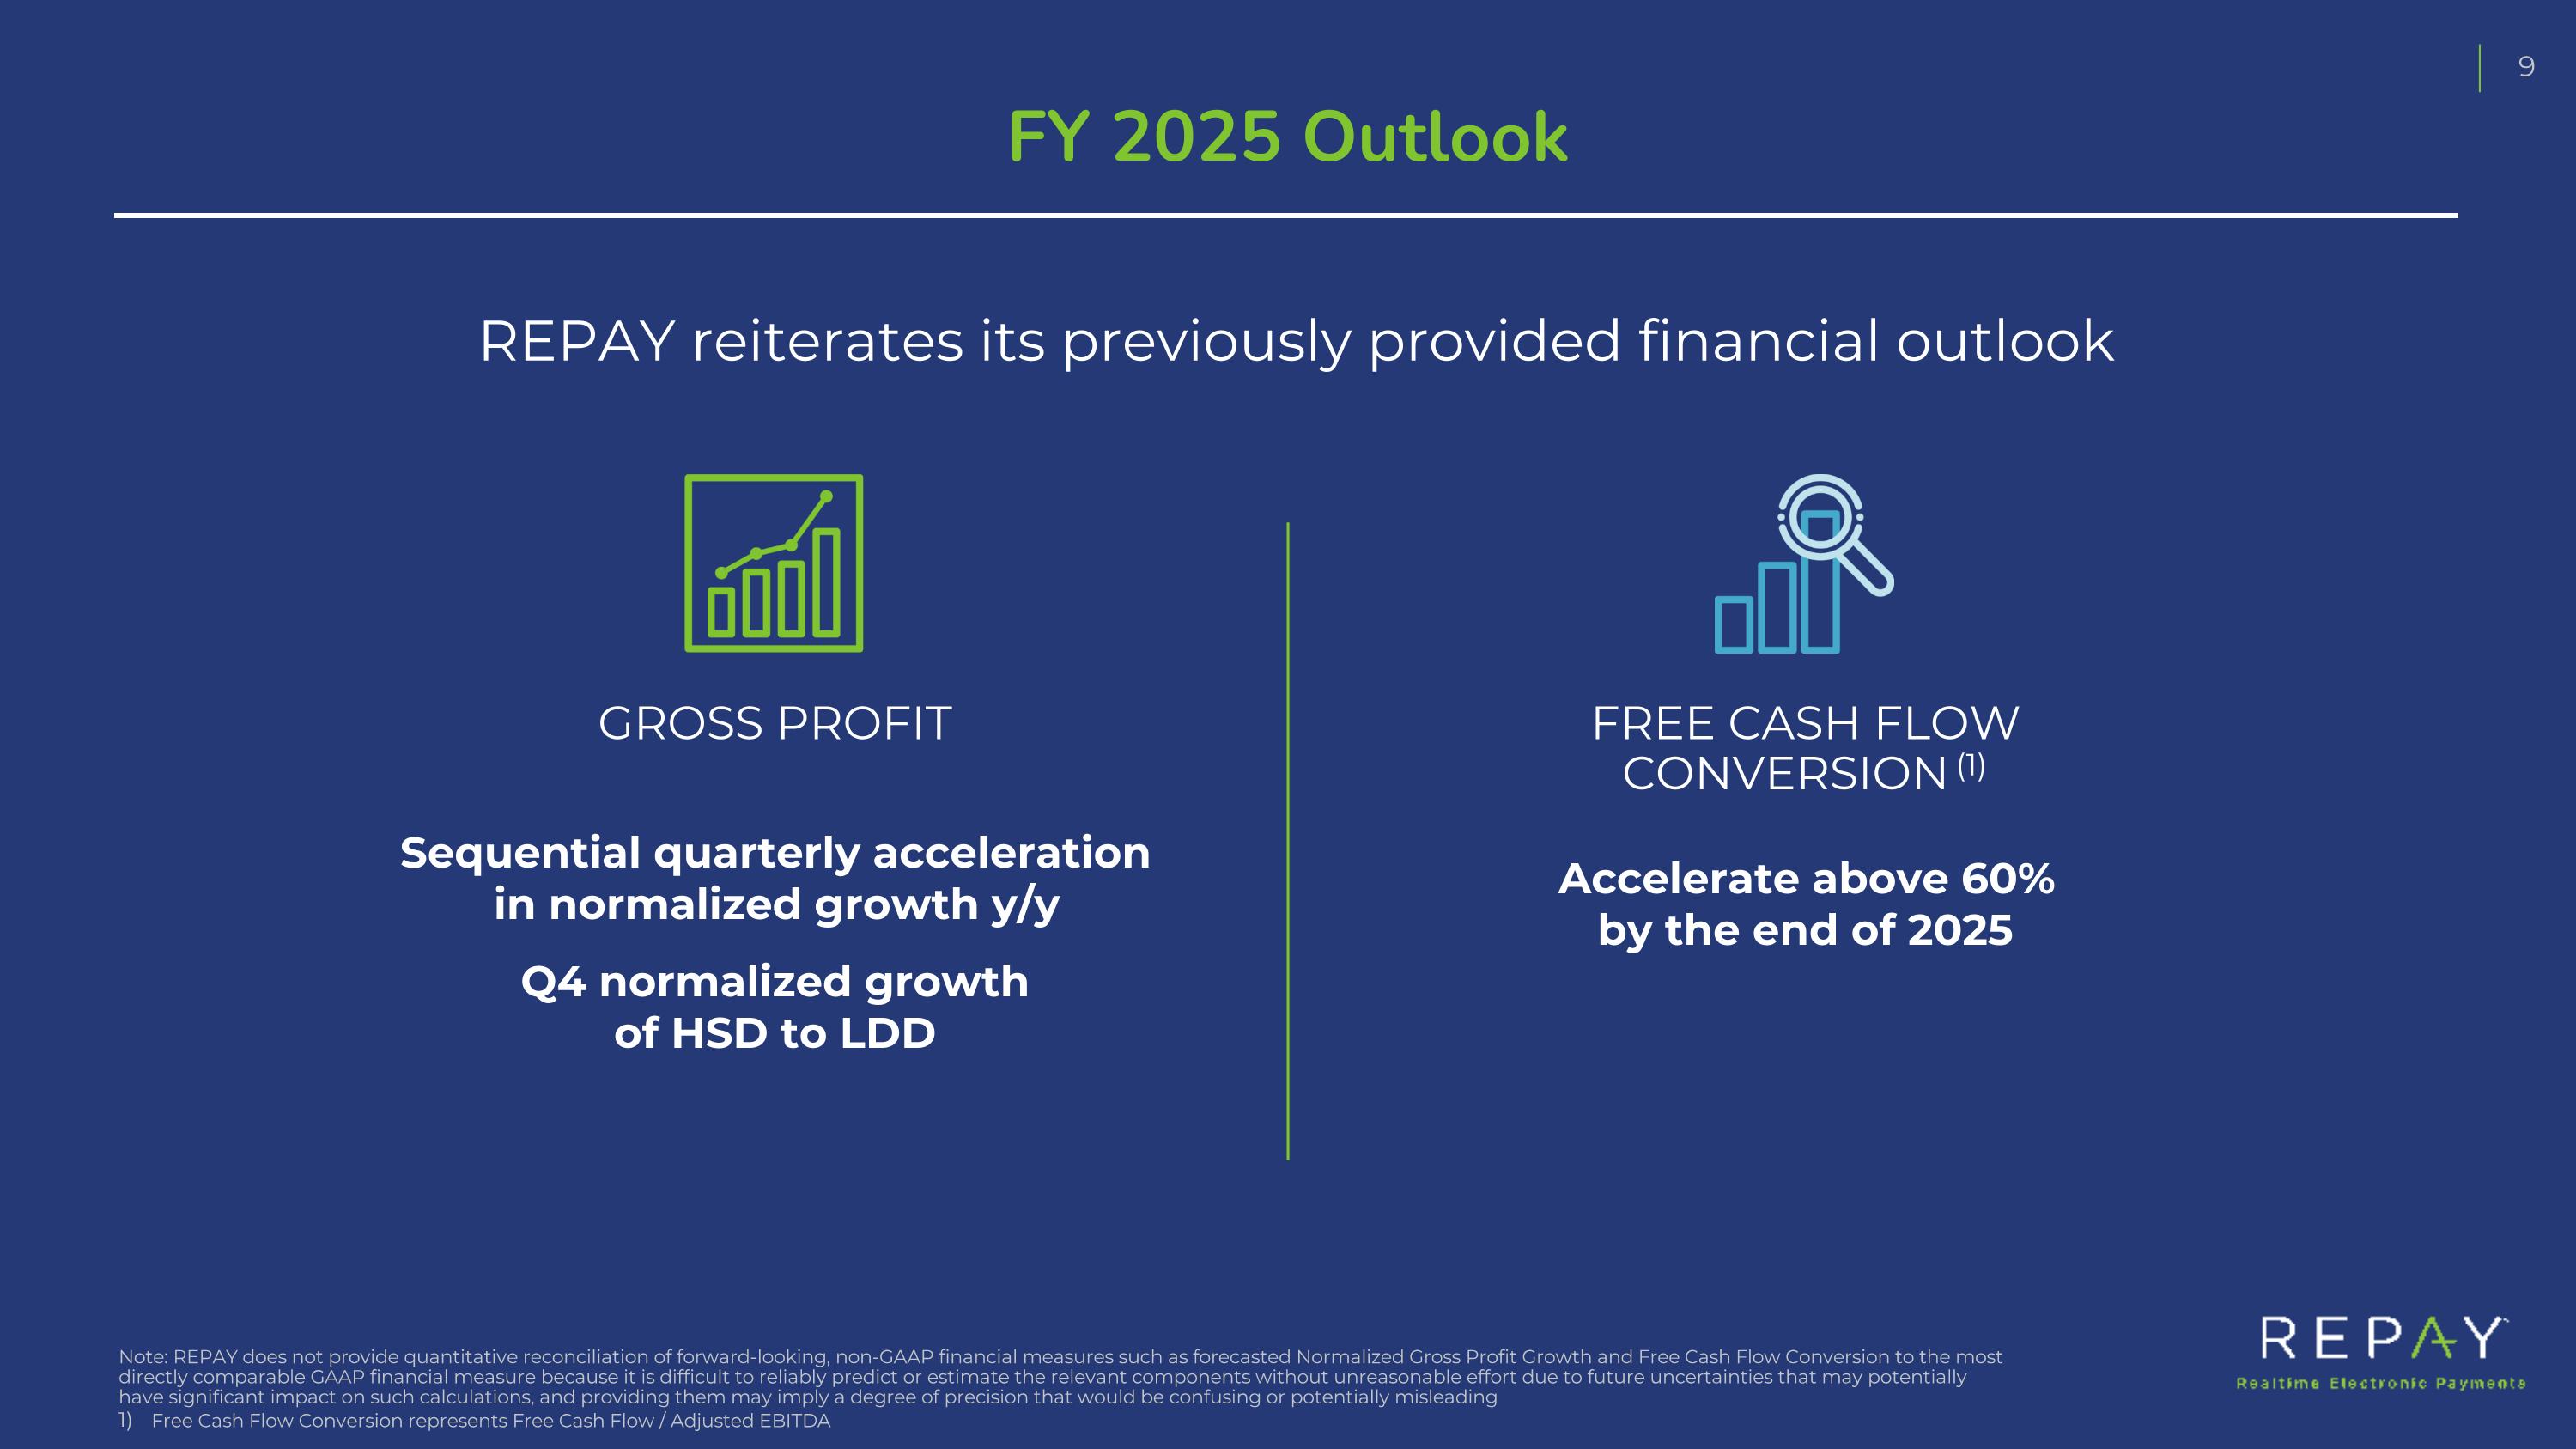
FY 2025 Outlook GROSS PROFIT FREE CASH FLOW CONVERSION (1) Note: REPAY does not provide quantitative reconciliation of forward-looking, non-GAAP financial measures such as forecasted Normalized Gross Profit Growth and Free Cash Flow Conversion to the most directly comparable GAAP financial measure because it is difficult to reliably predict or estimate the relevant components without unreasonable effort due to future uncertainties that may potentially have significant impact on such calculations, and providing them may imply a degree of precision that would be confusing or potentially misleading Free Cash Flow Conversion represents Free Cash Flow / Adjusted EBITDA REPAY reiterates its previously provided financial outlook Sequential quarterly acceleration in normalized growth y/y Q4 normalized growth of HSD to LDD Accelerate above 60% by the end of 2025
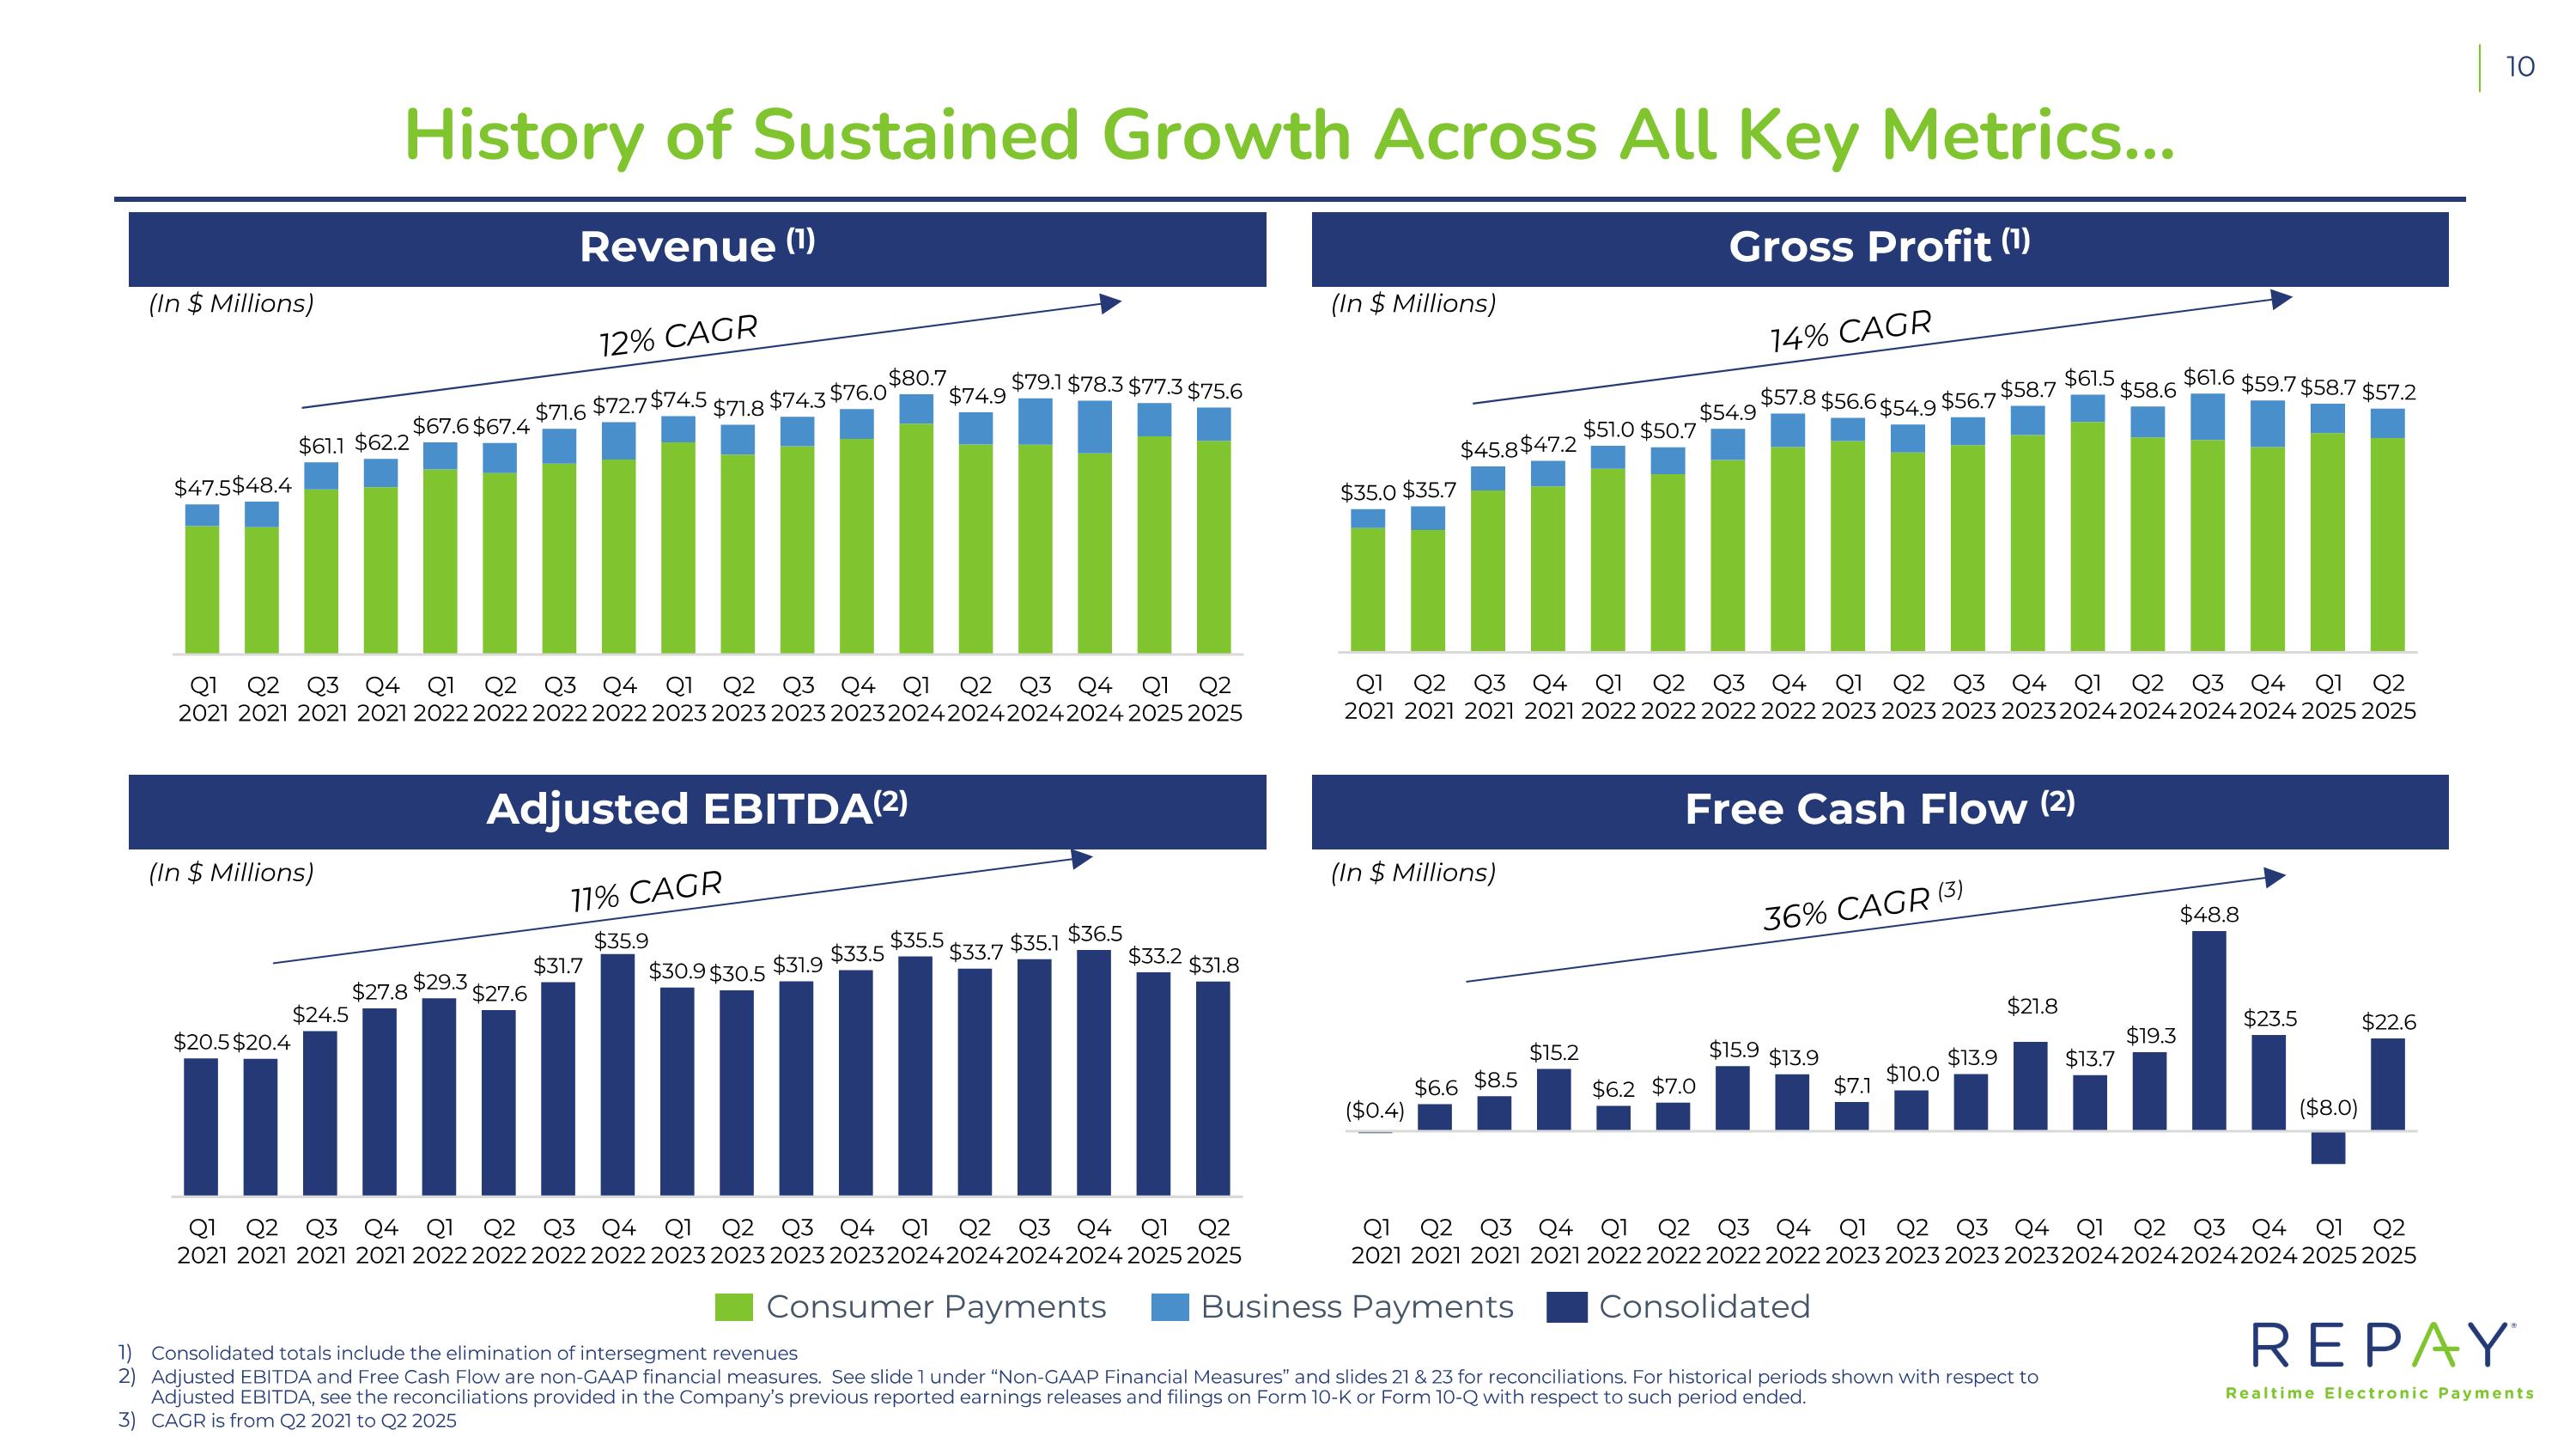
History of Sustained Growth Across All Key Metrics… Gross Profit (1) Revenue (1) Free Cash Flow (2) Adjusted EBITDA(2) (In $ Millions) (In $ Millions) (In $ Millions) (In $ Millions) 12% CAGR Consumer Payments Business Payments Consolidated Consolidated totals include the elimination of intersegment revenues Adjusted EBITDA and Free Cash Flow are non-GAAP financial measures. See slide 1 under “Non-GAAP Financial Measures” and slides 21 & 23 for reconciliations. For historical periods shown with respect to Adjusted EBITDA, see the reconciliations provided in the Company’s previous reported earnings releases and filings on Form 10-K or Form 10-Q with respect to such period ended. CAGR is from Q2 2021 to Q2 2025 14% CAGR 11% CAGR 36% CAGR (3)
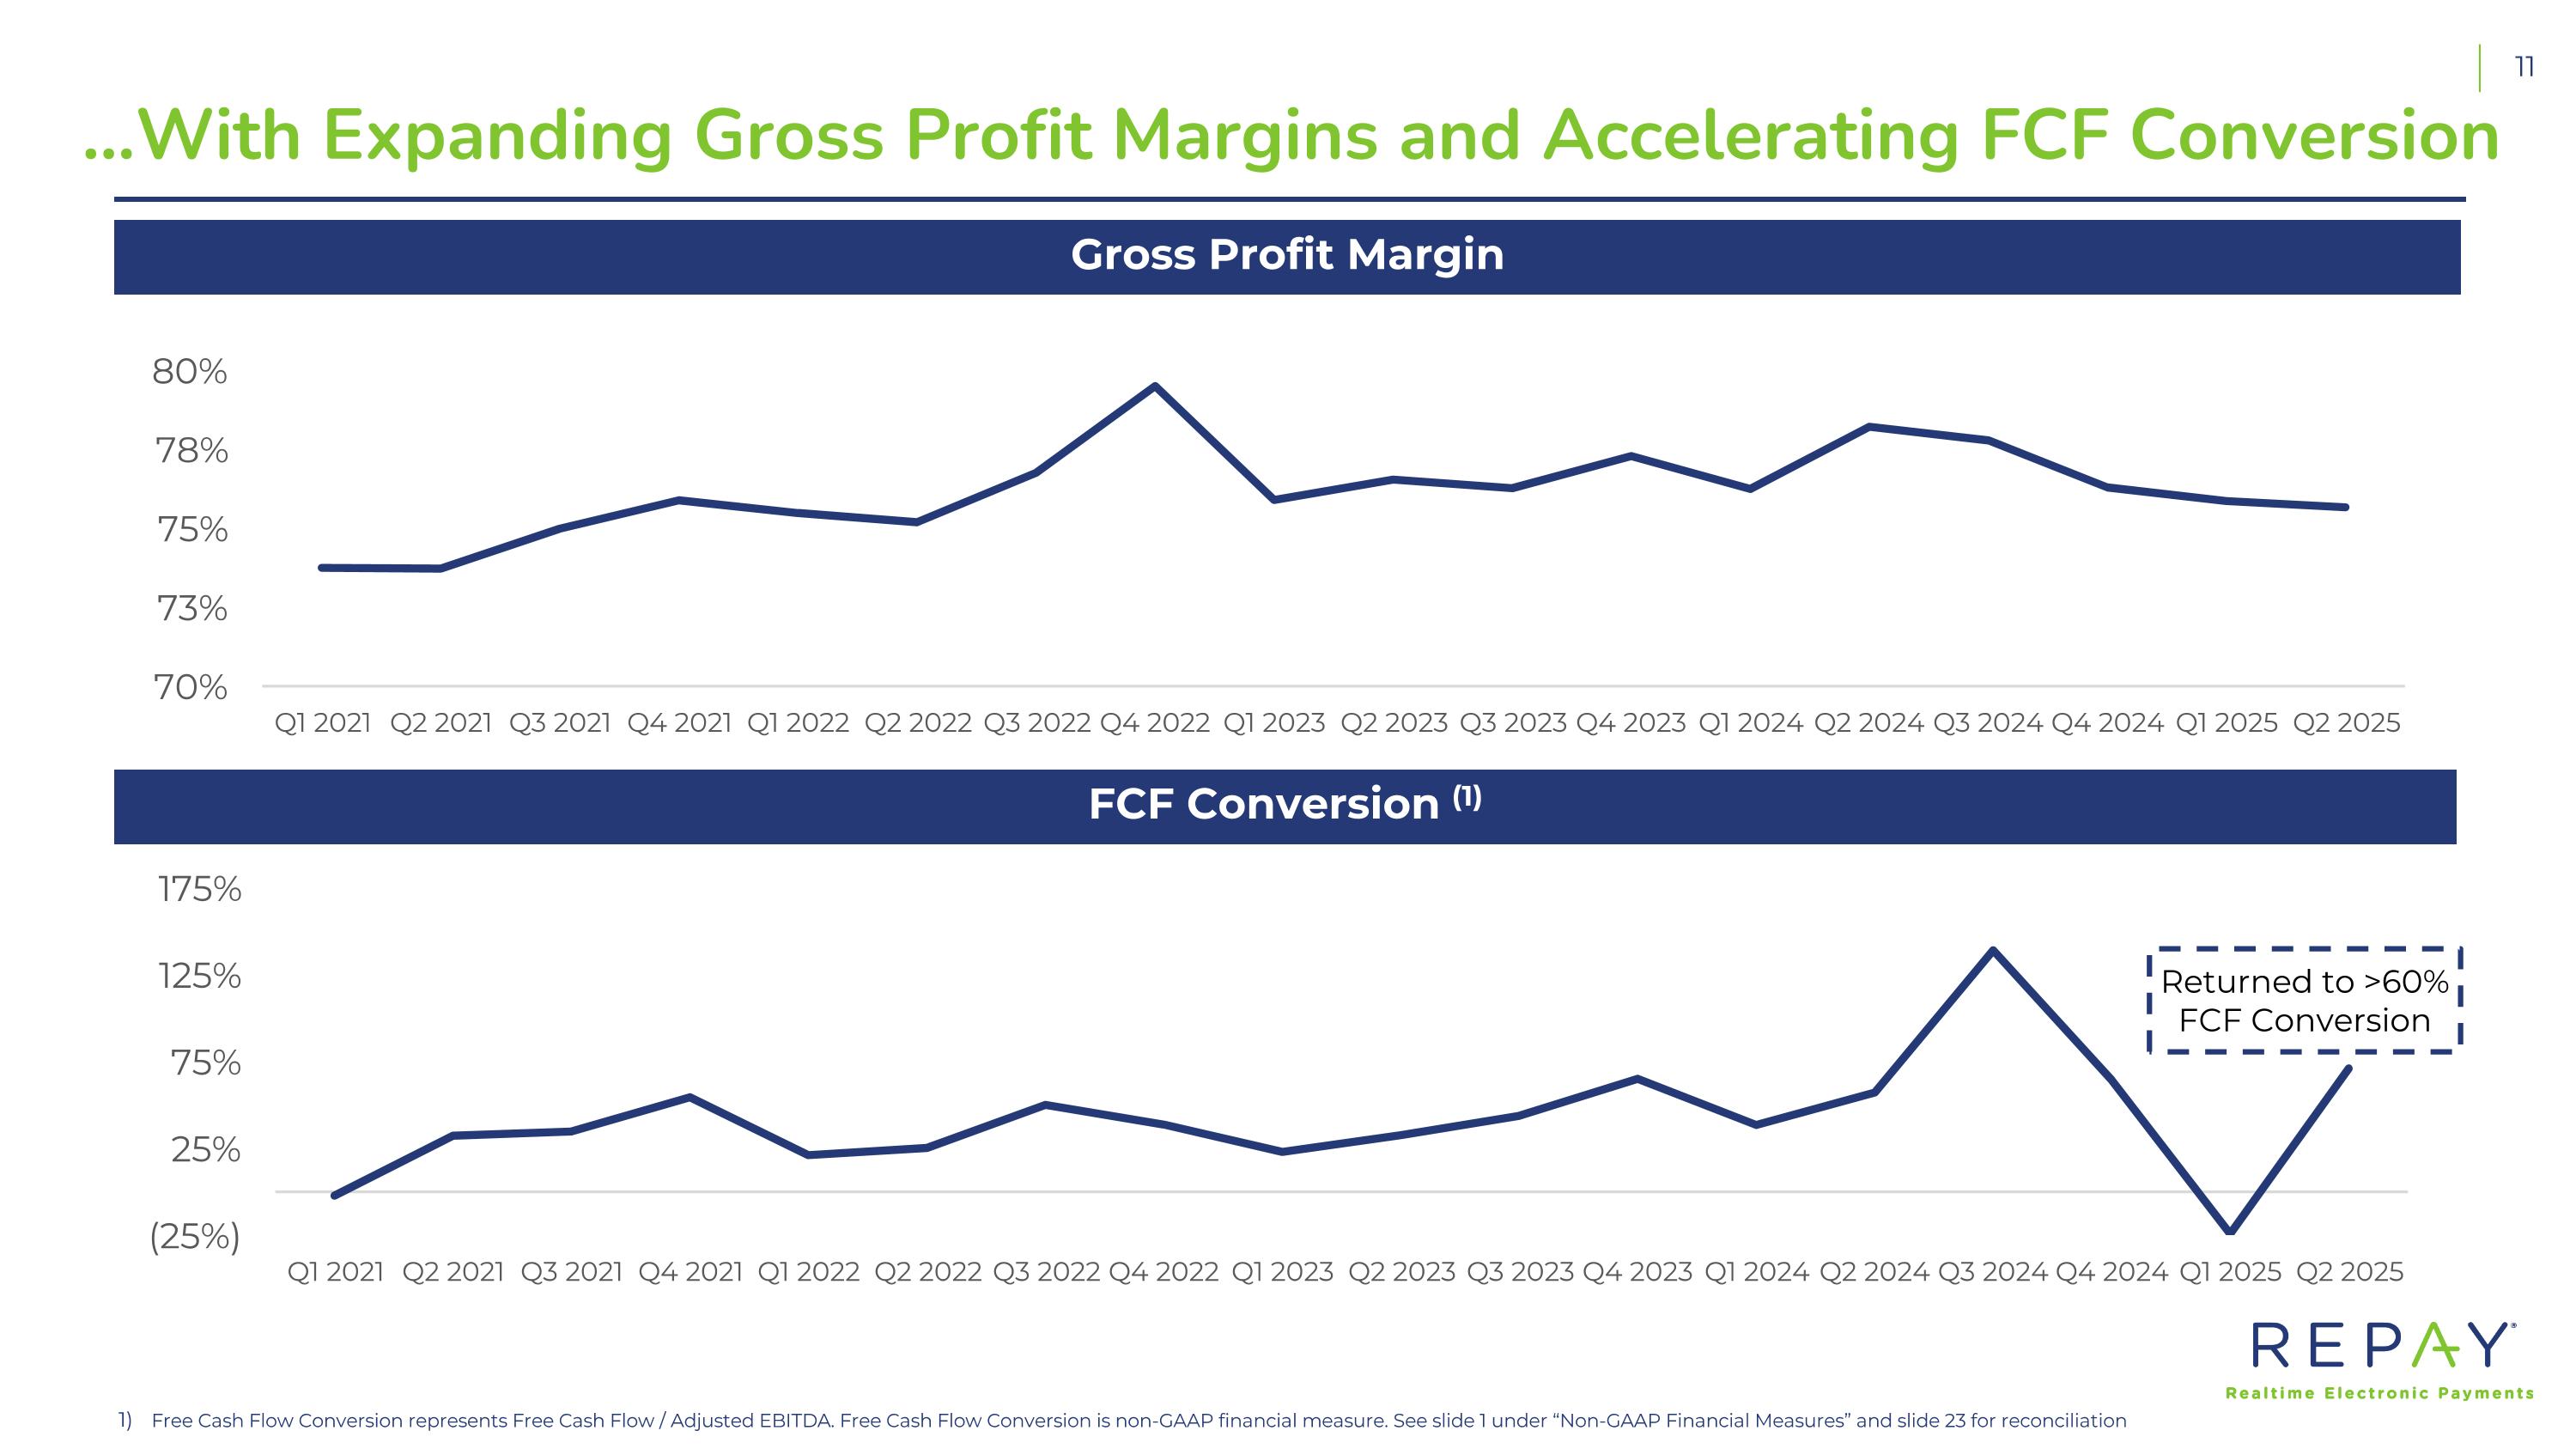
…With Expanding Gross Profit Margins and Accelerating FCF Conversion FCF Conversion (1) Gross Profit Margin Free Cash Flow Conversion represents Free Cash Flow / Adjusted EBITDA. Free Cash Flow Conversion is non-GAAP financial measure. See slide 1 under “Non-GAAP Financial Measures” and slide 23 for reconciliation Returned to >60% FCF Conversion

2 Strategy & Business Updates
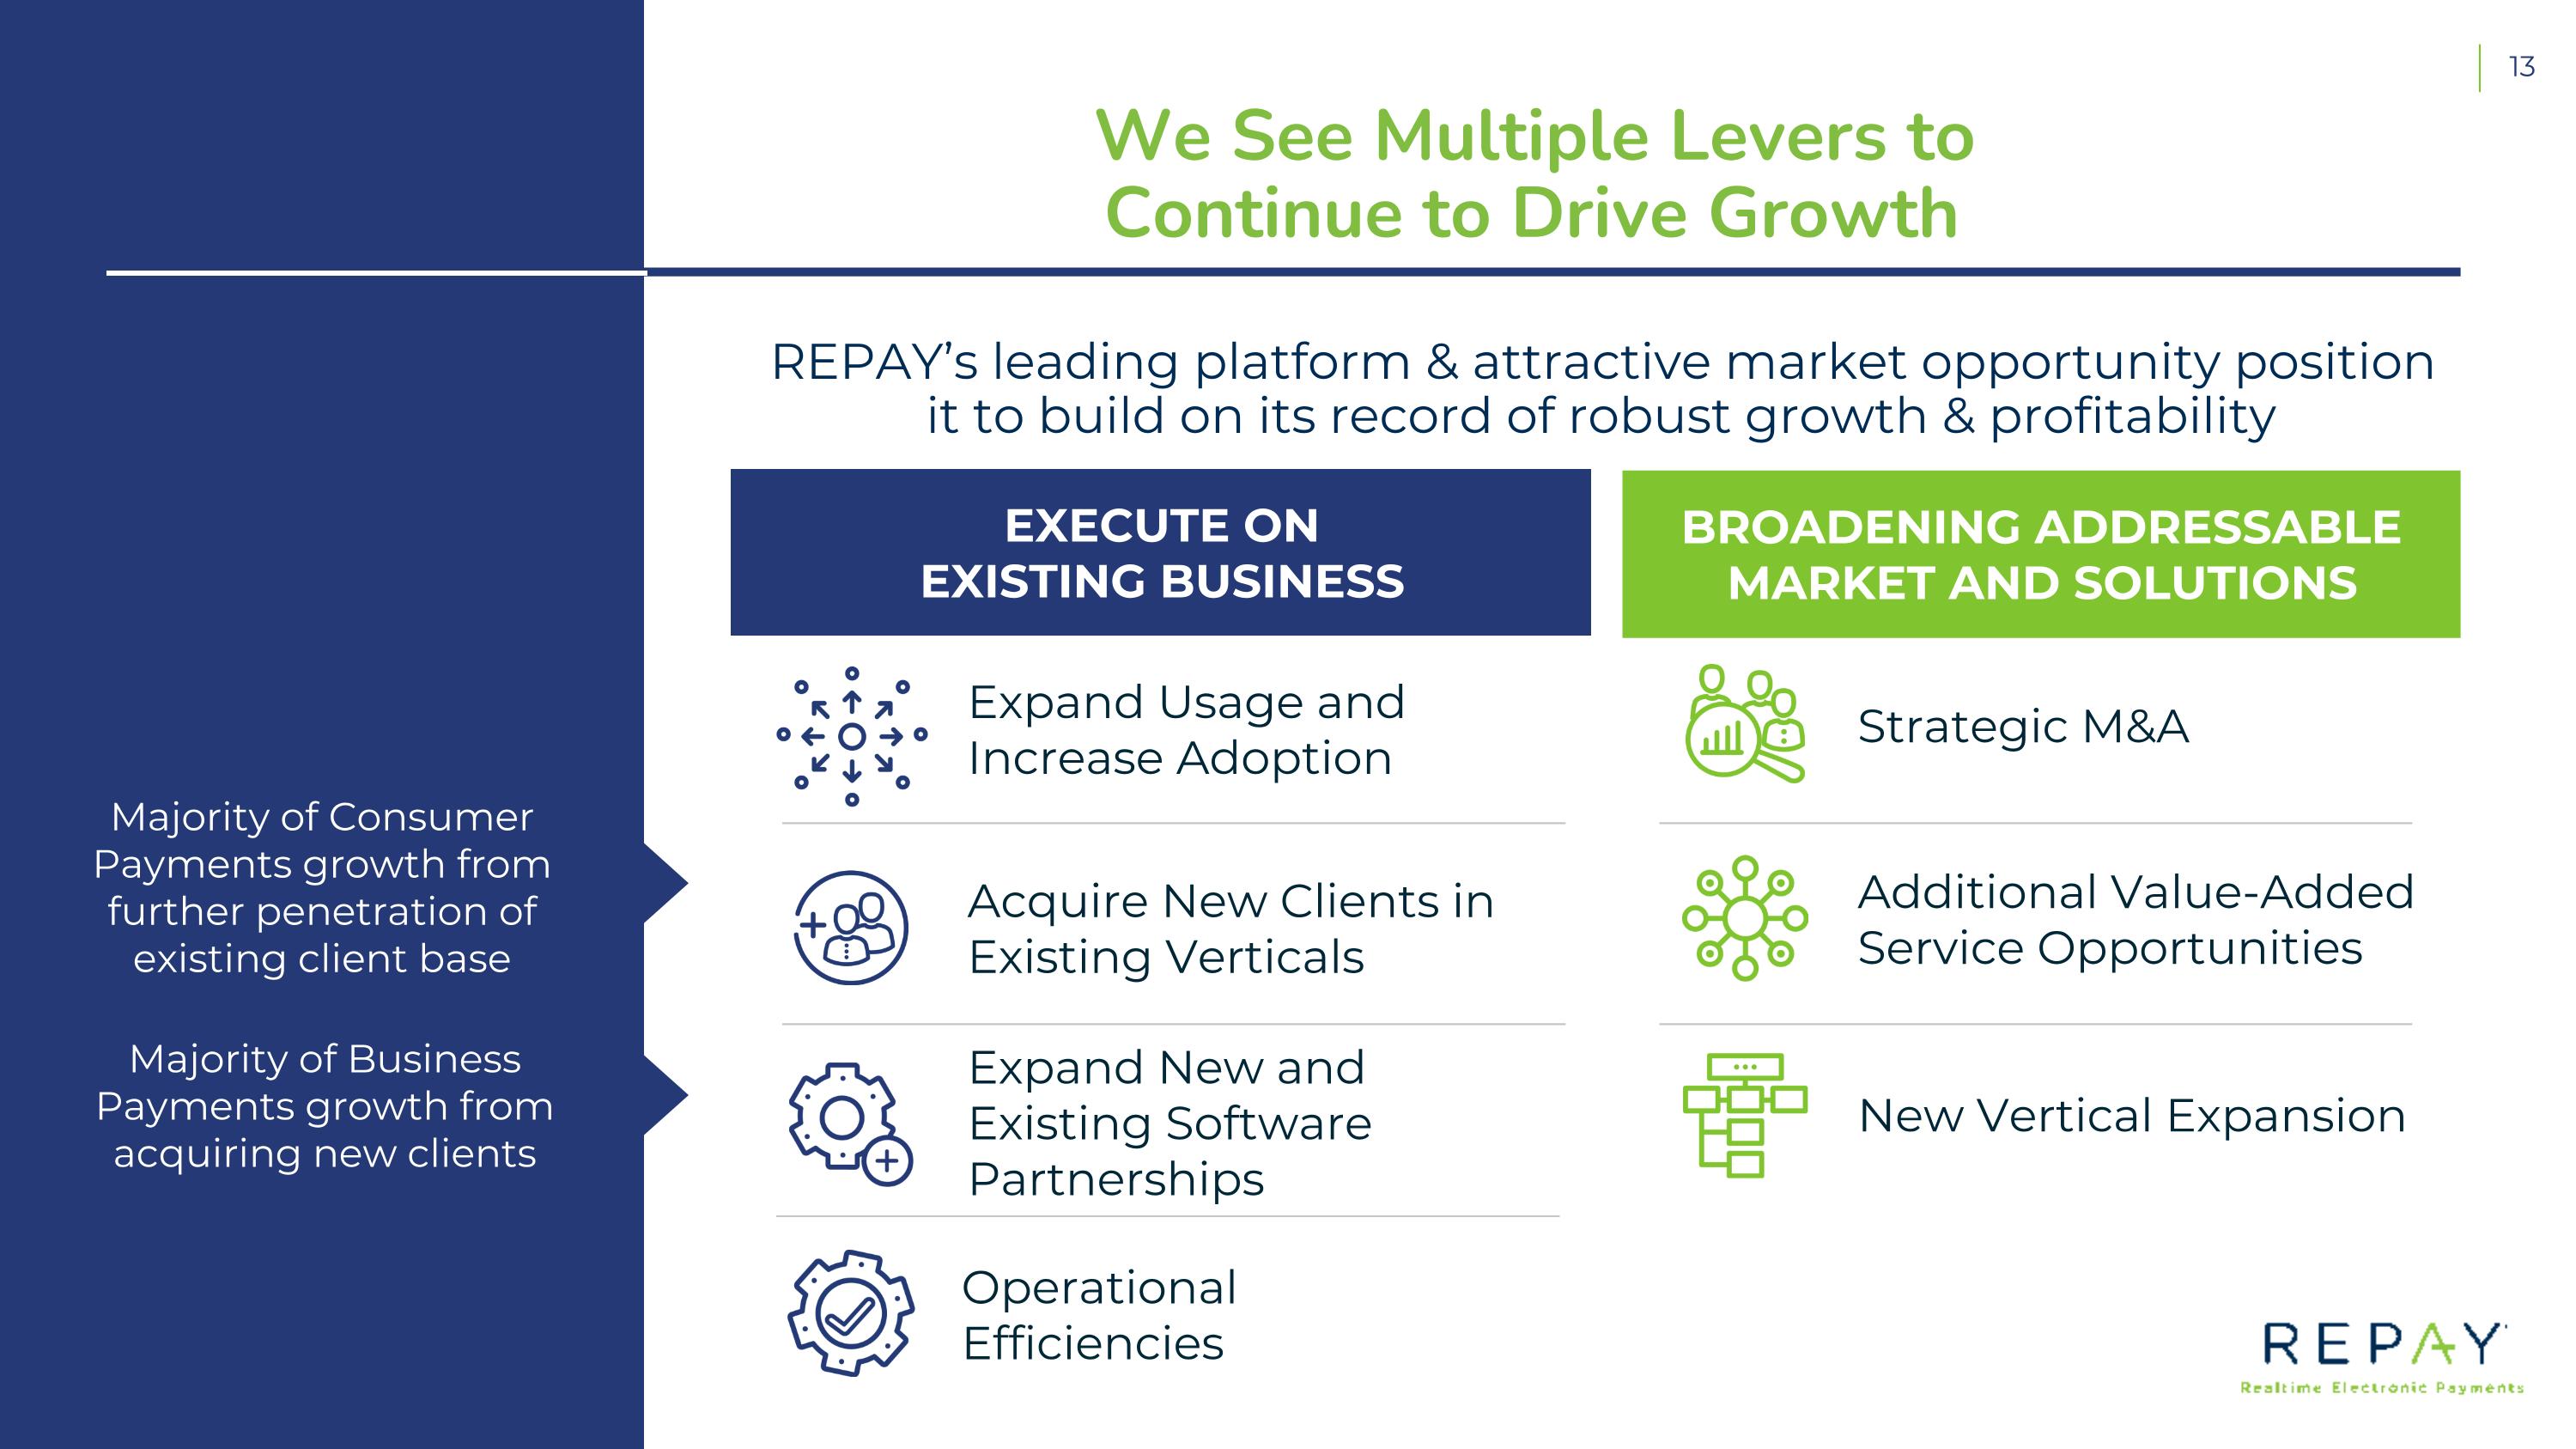
Acquire New Clients in Existing Verticals We See Multiple Levers to Continue to Drive Growth EXECUTE ON EXISTING BUSINESS BROADENING ADDRESSABLE MARKET AND SOLUTIONS REPAY’s leading platform & attractive market opportunity position it to build on its record of robust growth & profitability Expand New and Existing Software Partnerships Expand Usage and Increase Adoption Strategic M&A Additional Value-Added Service Opportunities Majority of Consumer Payments growth from further penetration of existing client base Majority of Business Payments growth from acquiring new clients Operational Efficiencies New Vertical Expansion
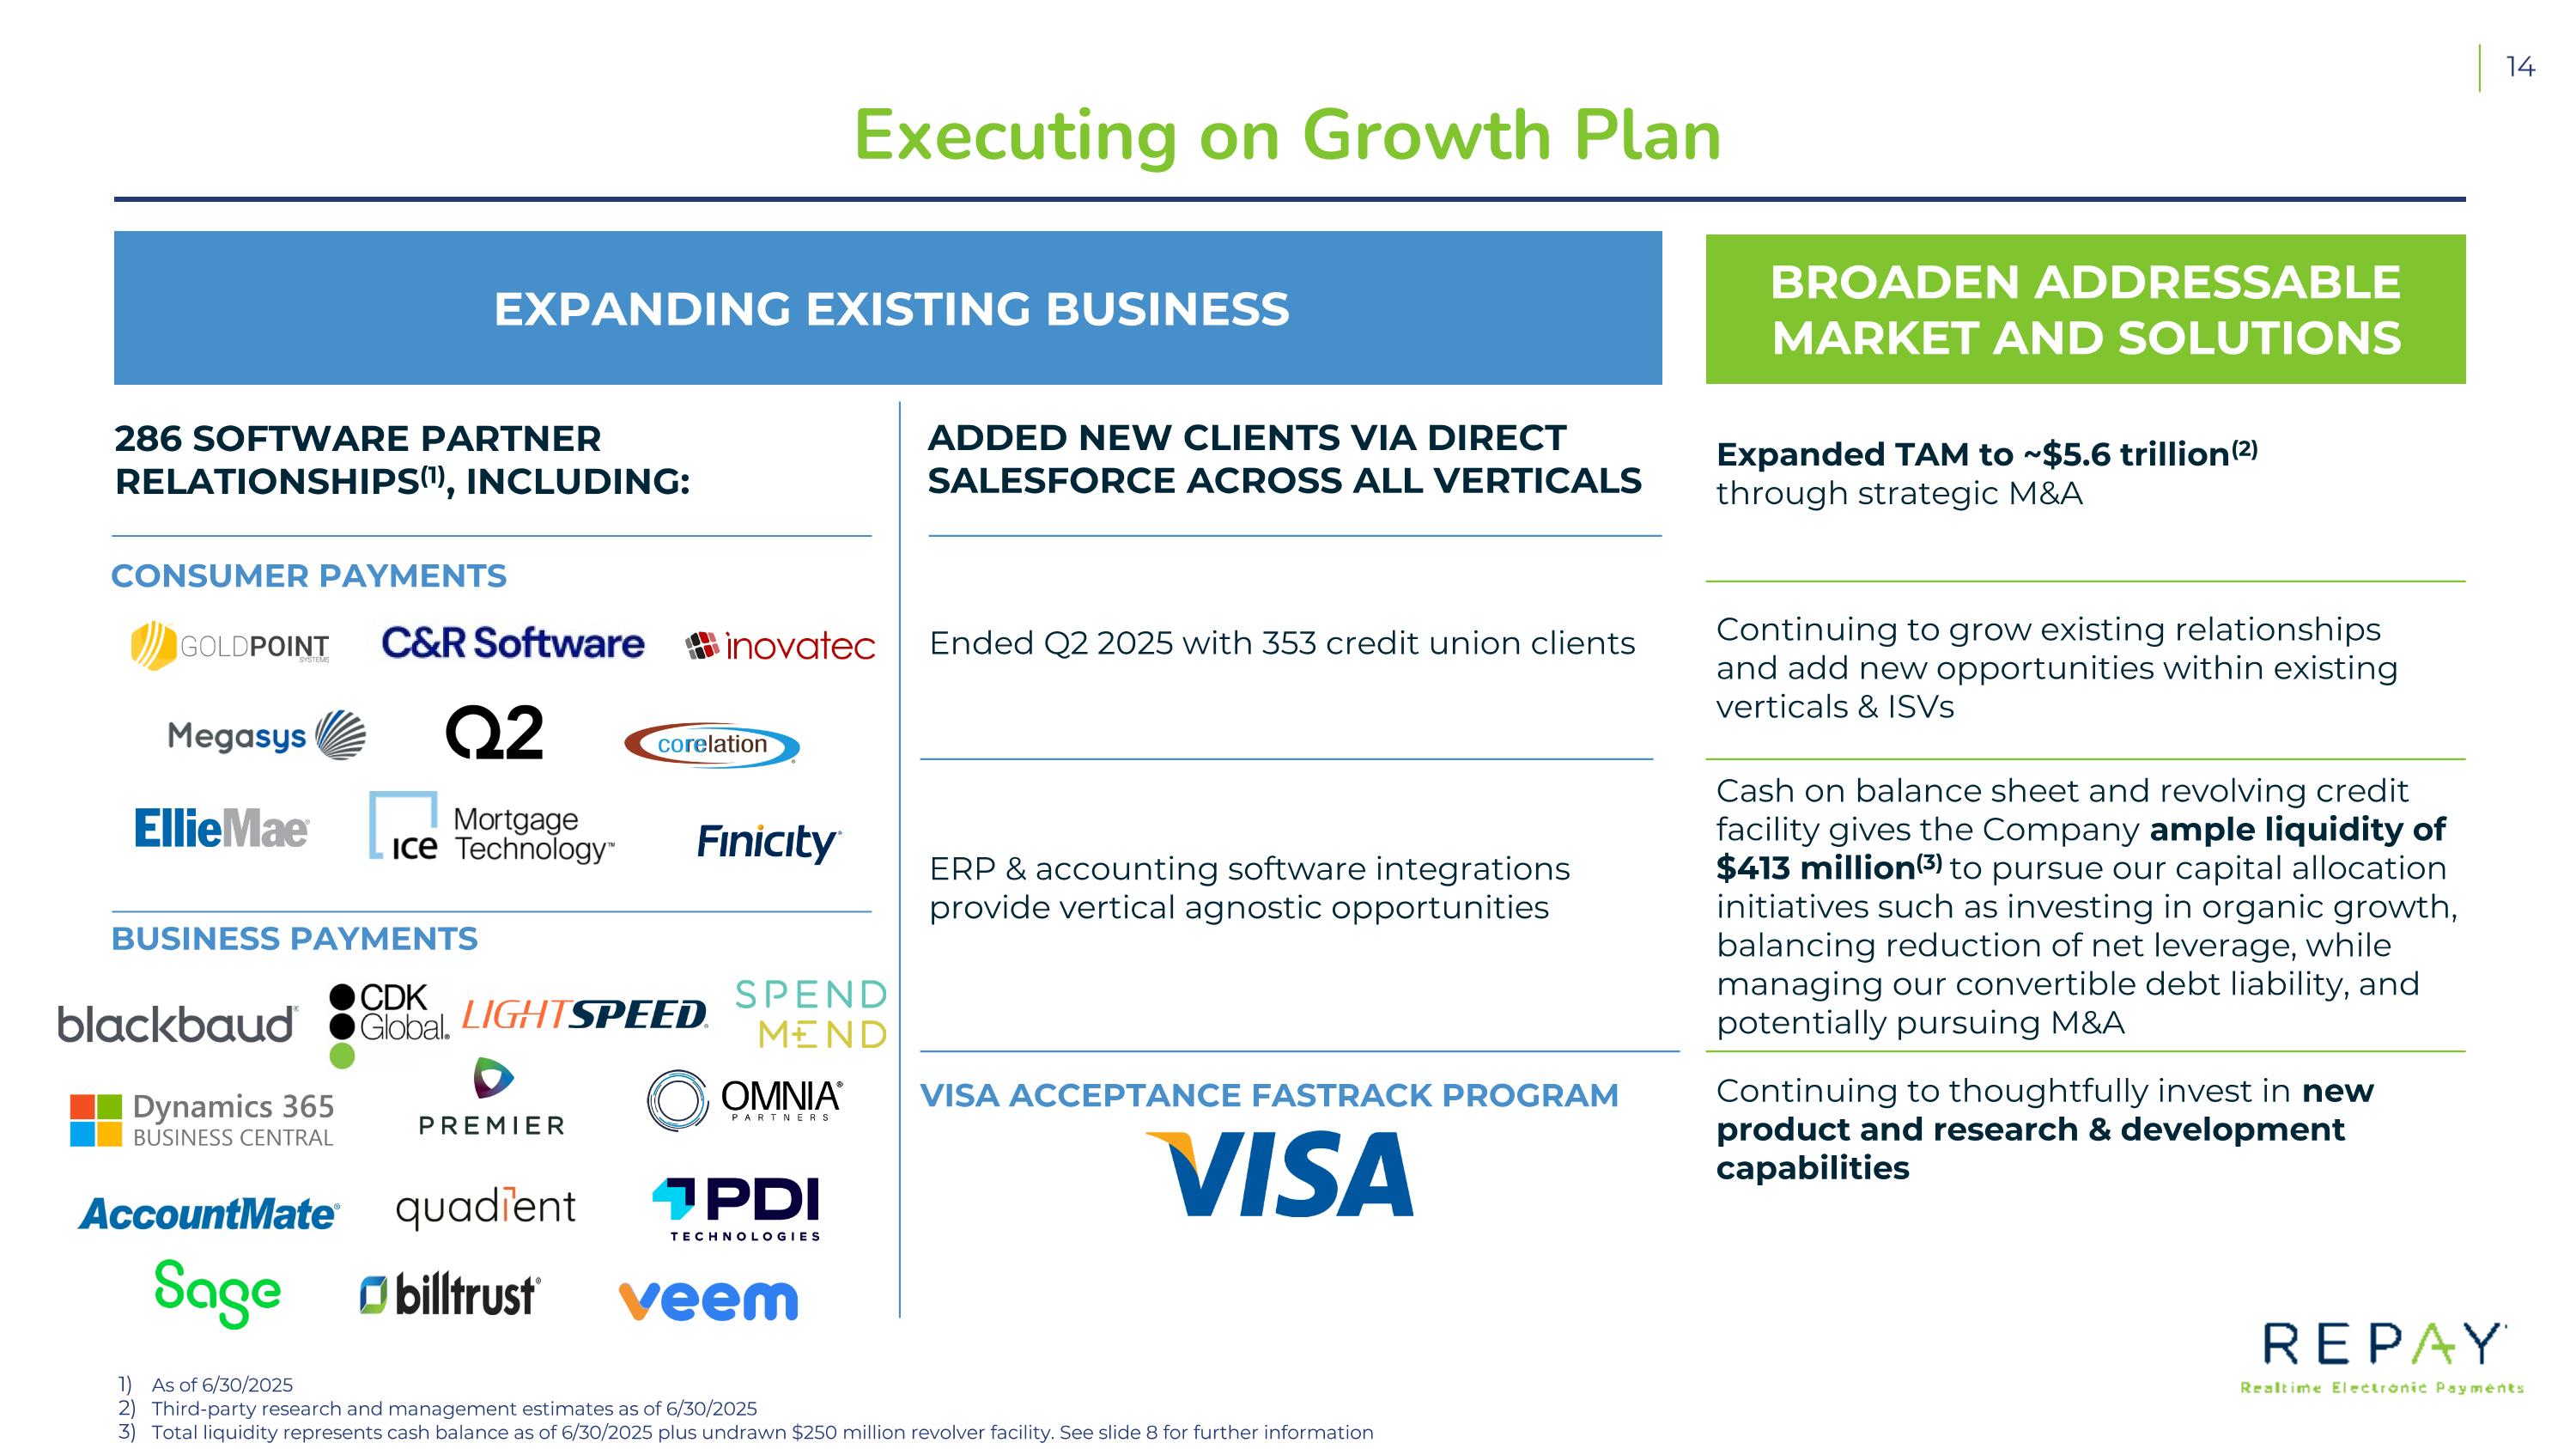
ADDED NEW CLIENTS VIA DIRECT SALESFORCE ACROSS ALL VERTICALS 286 SOFTWARE PARTNER RELATIONSHIPS(1), INCLUDING: As of 6/30/2025 Third-party research and management estimates as of 6/30/2025 Total liquidity represents cash balance as of 6/30/2025 plus undrawn $250 million revolver facility. See slide 8 for further information Executing on Growth Plan BROADEN ADDRESSABLE MARKET AND SOLUTIONS ERP & accounting software integrations provide vertical agnostic opportunities Expanded TAM to ~$5.6 trillion(2) through strategic M&A Continuing to grow existing relationships and add new opportunities within existing verticals & ISVs Cash on balance sheet and revolving credit facility gives the Company ample liquidity of $413 million(3) to pursue our capital allocation initiatives such as investing in organic growth, balancing reduction of net leverage, while managing our convertible debt liability, and potentially pursuing M&A Continuing to thoughtfully invest in new product and research & development capabilities EXPANDING EXISTING BUSINESS CONSUMER PAYMENTS BUSINESS PAYMENTS Ended Q2 2025 with 353 credit union clients VISA ACCEPTANCE FASTRACK PROGRAM
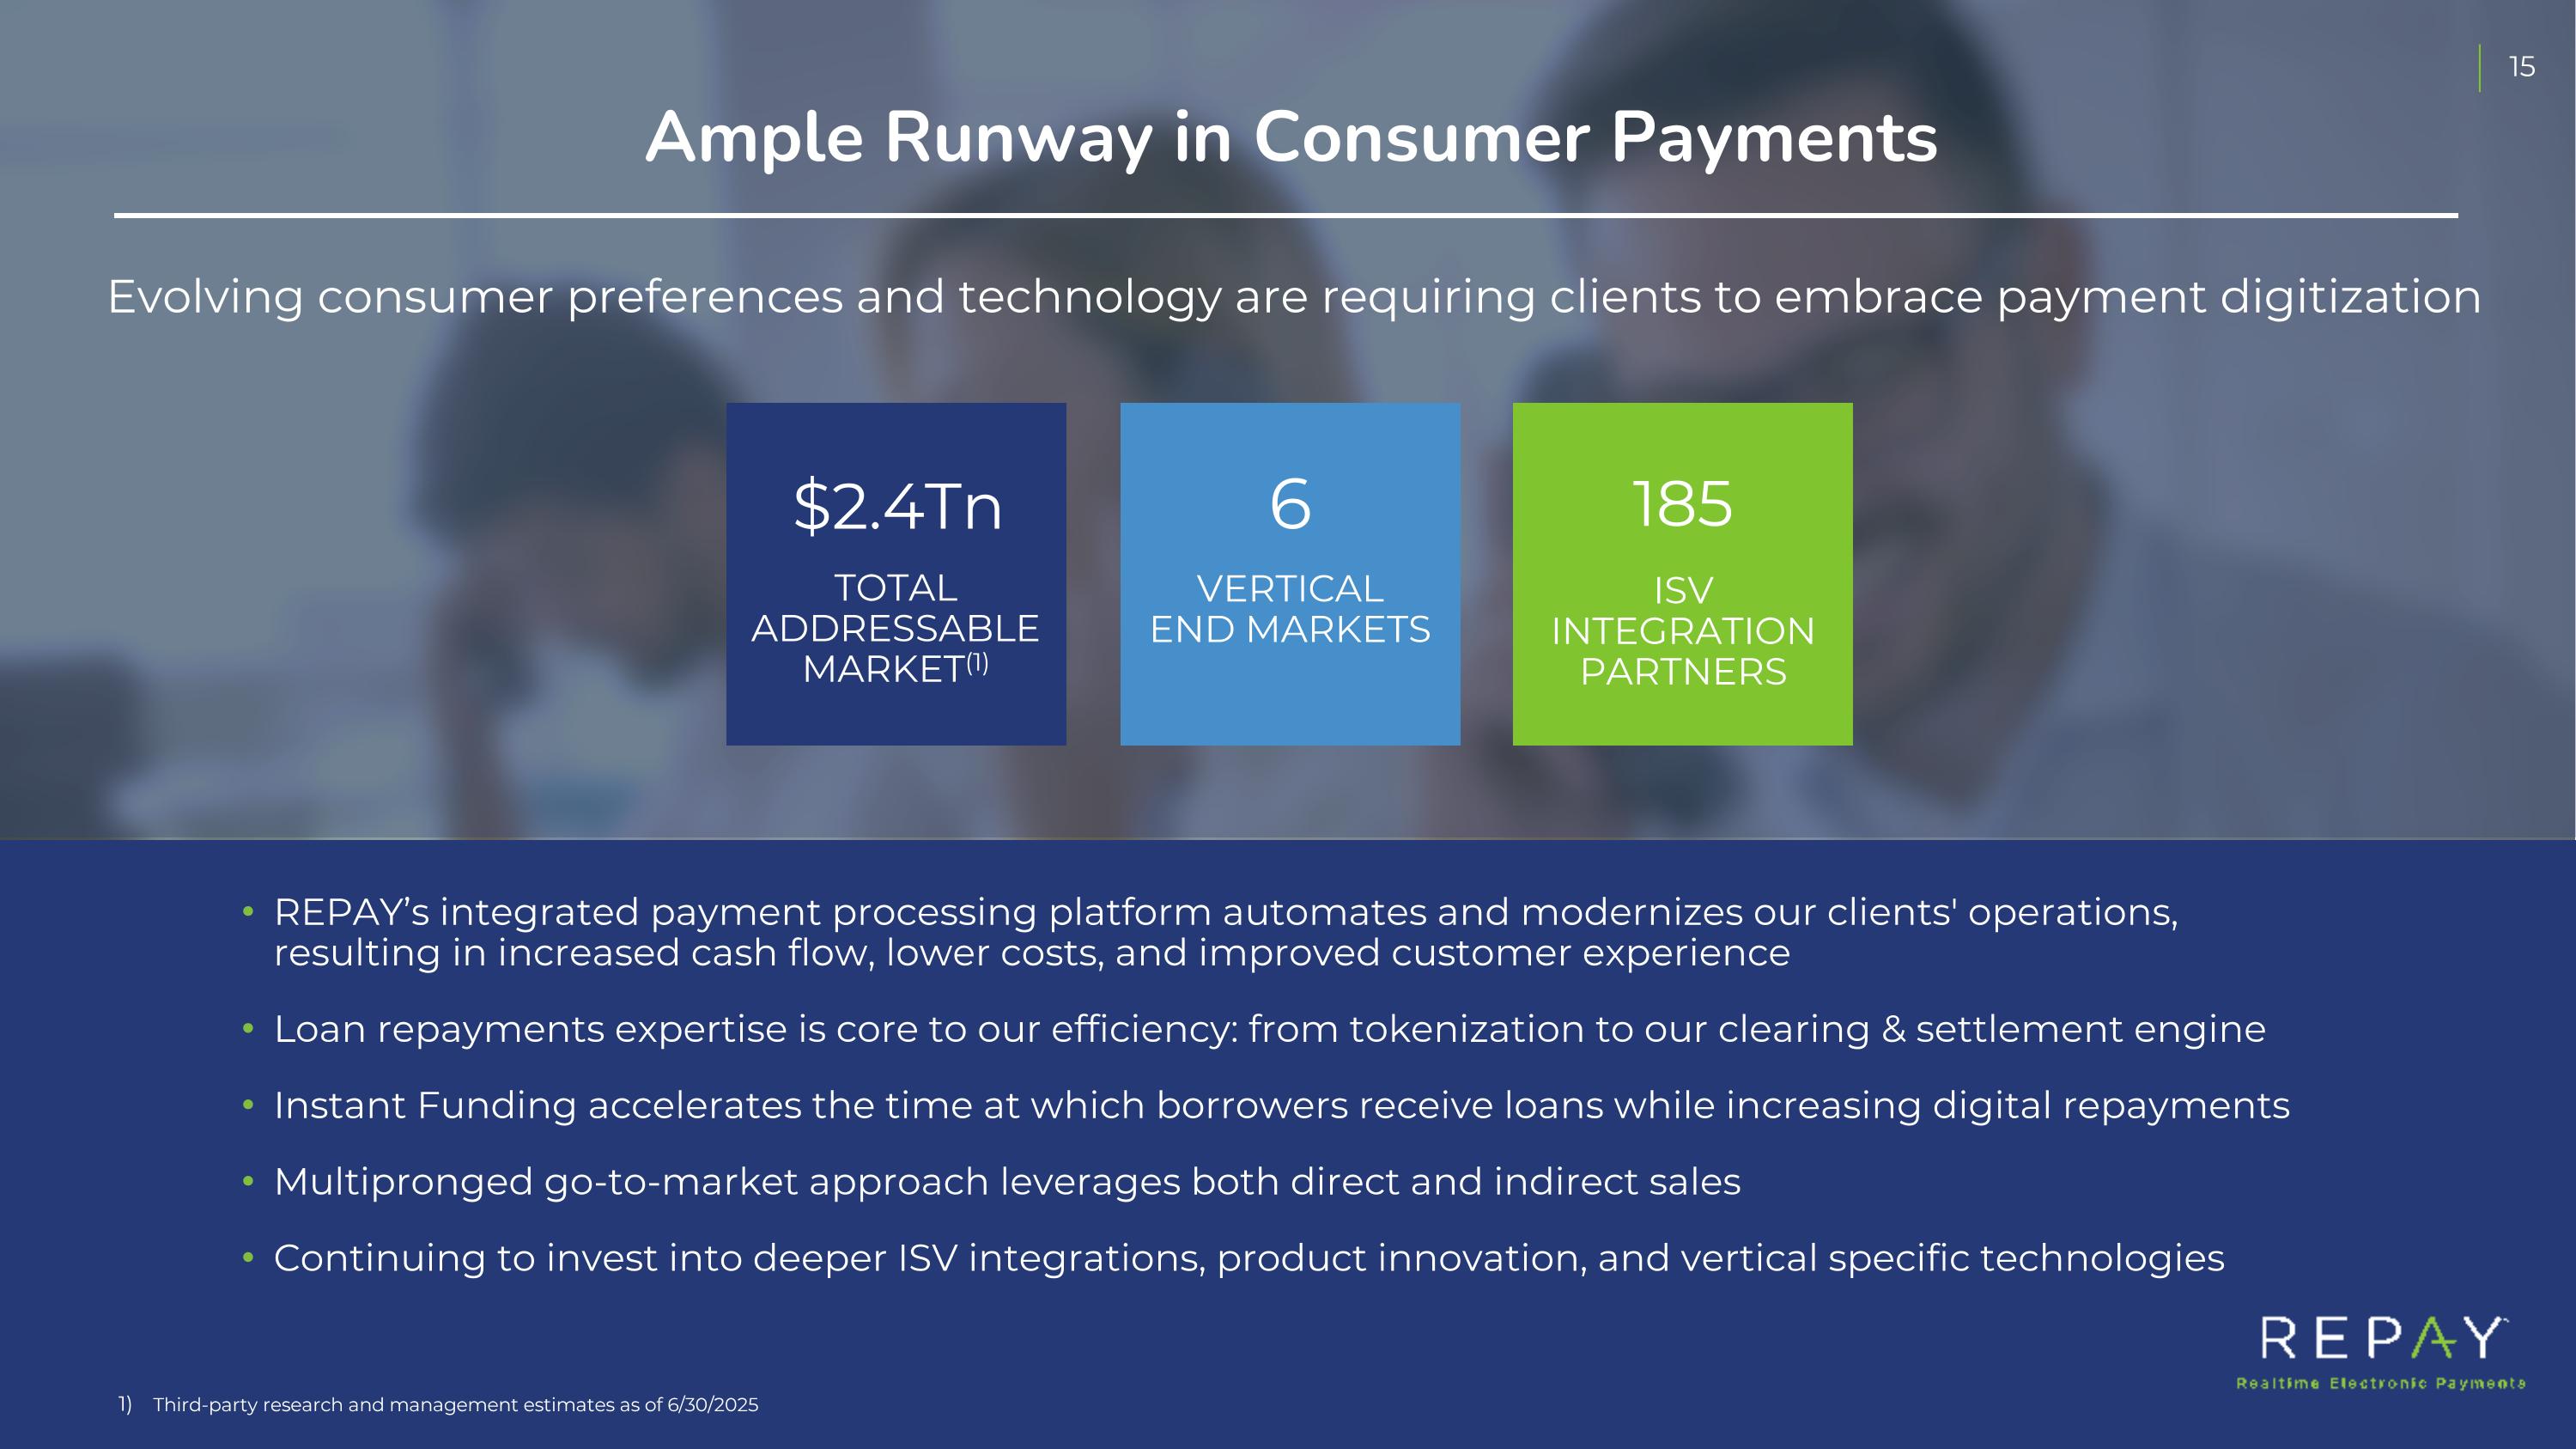
Ample Runway in Consumer Payments Third-party research and management estimates as of 6/30/2025 Evolving consumer preferences and technology are requiring clients to embrace payment digitization TOTAL ADDRESSABLE MARKET(1) $2.4Tn VERTICAL END MARKETS 6 ISV INTEGRATION PARTNERS 185 REPAY’s integrated payment processing platform automates and modernizes our clients' operations, resulting in increased cash flow, lower costs, and improved customer experience Loan repayments expertise is core to our efficiency: from tokenization to our clearing & settlement engine Instant Funding accelerates the time at which borrowers receive loans while increasing digital repayments Multipronged go-to-market approach leverages both direct and indirect sales Continuing to invest into deeper ISV integrations, product innovation, and vertical specific technologies
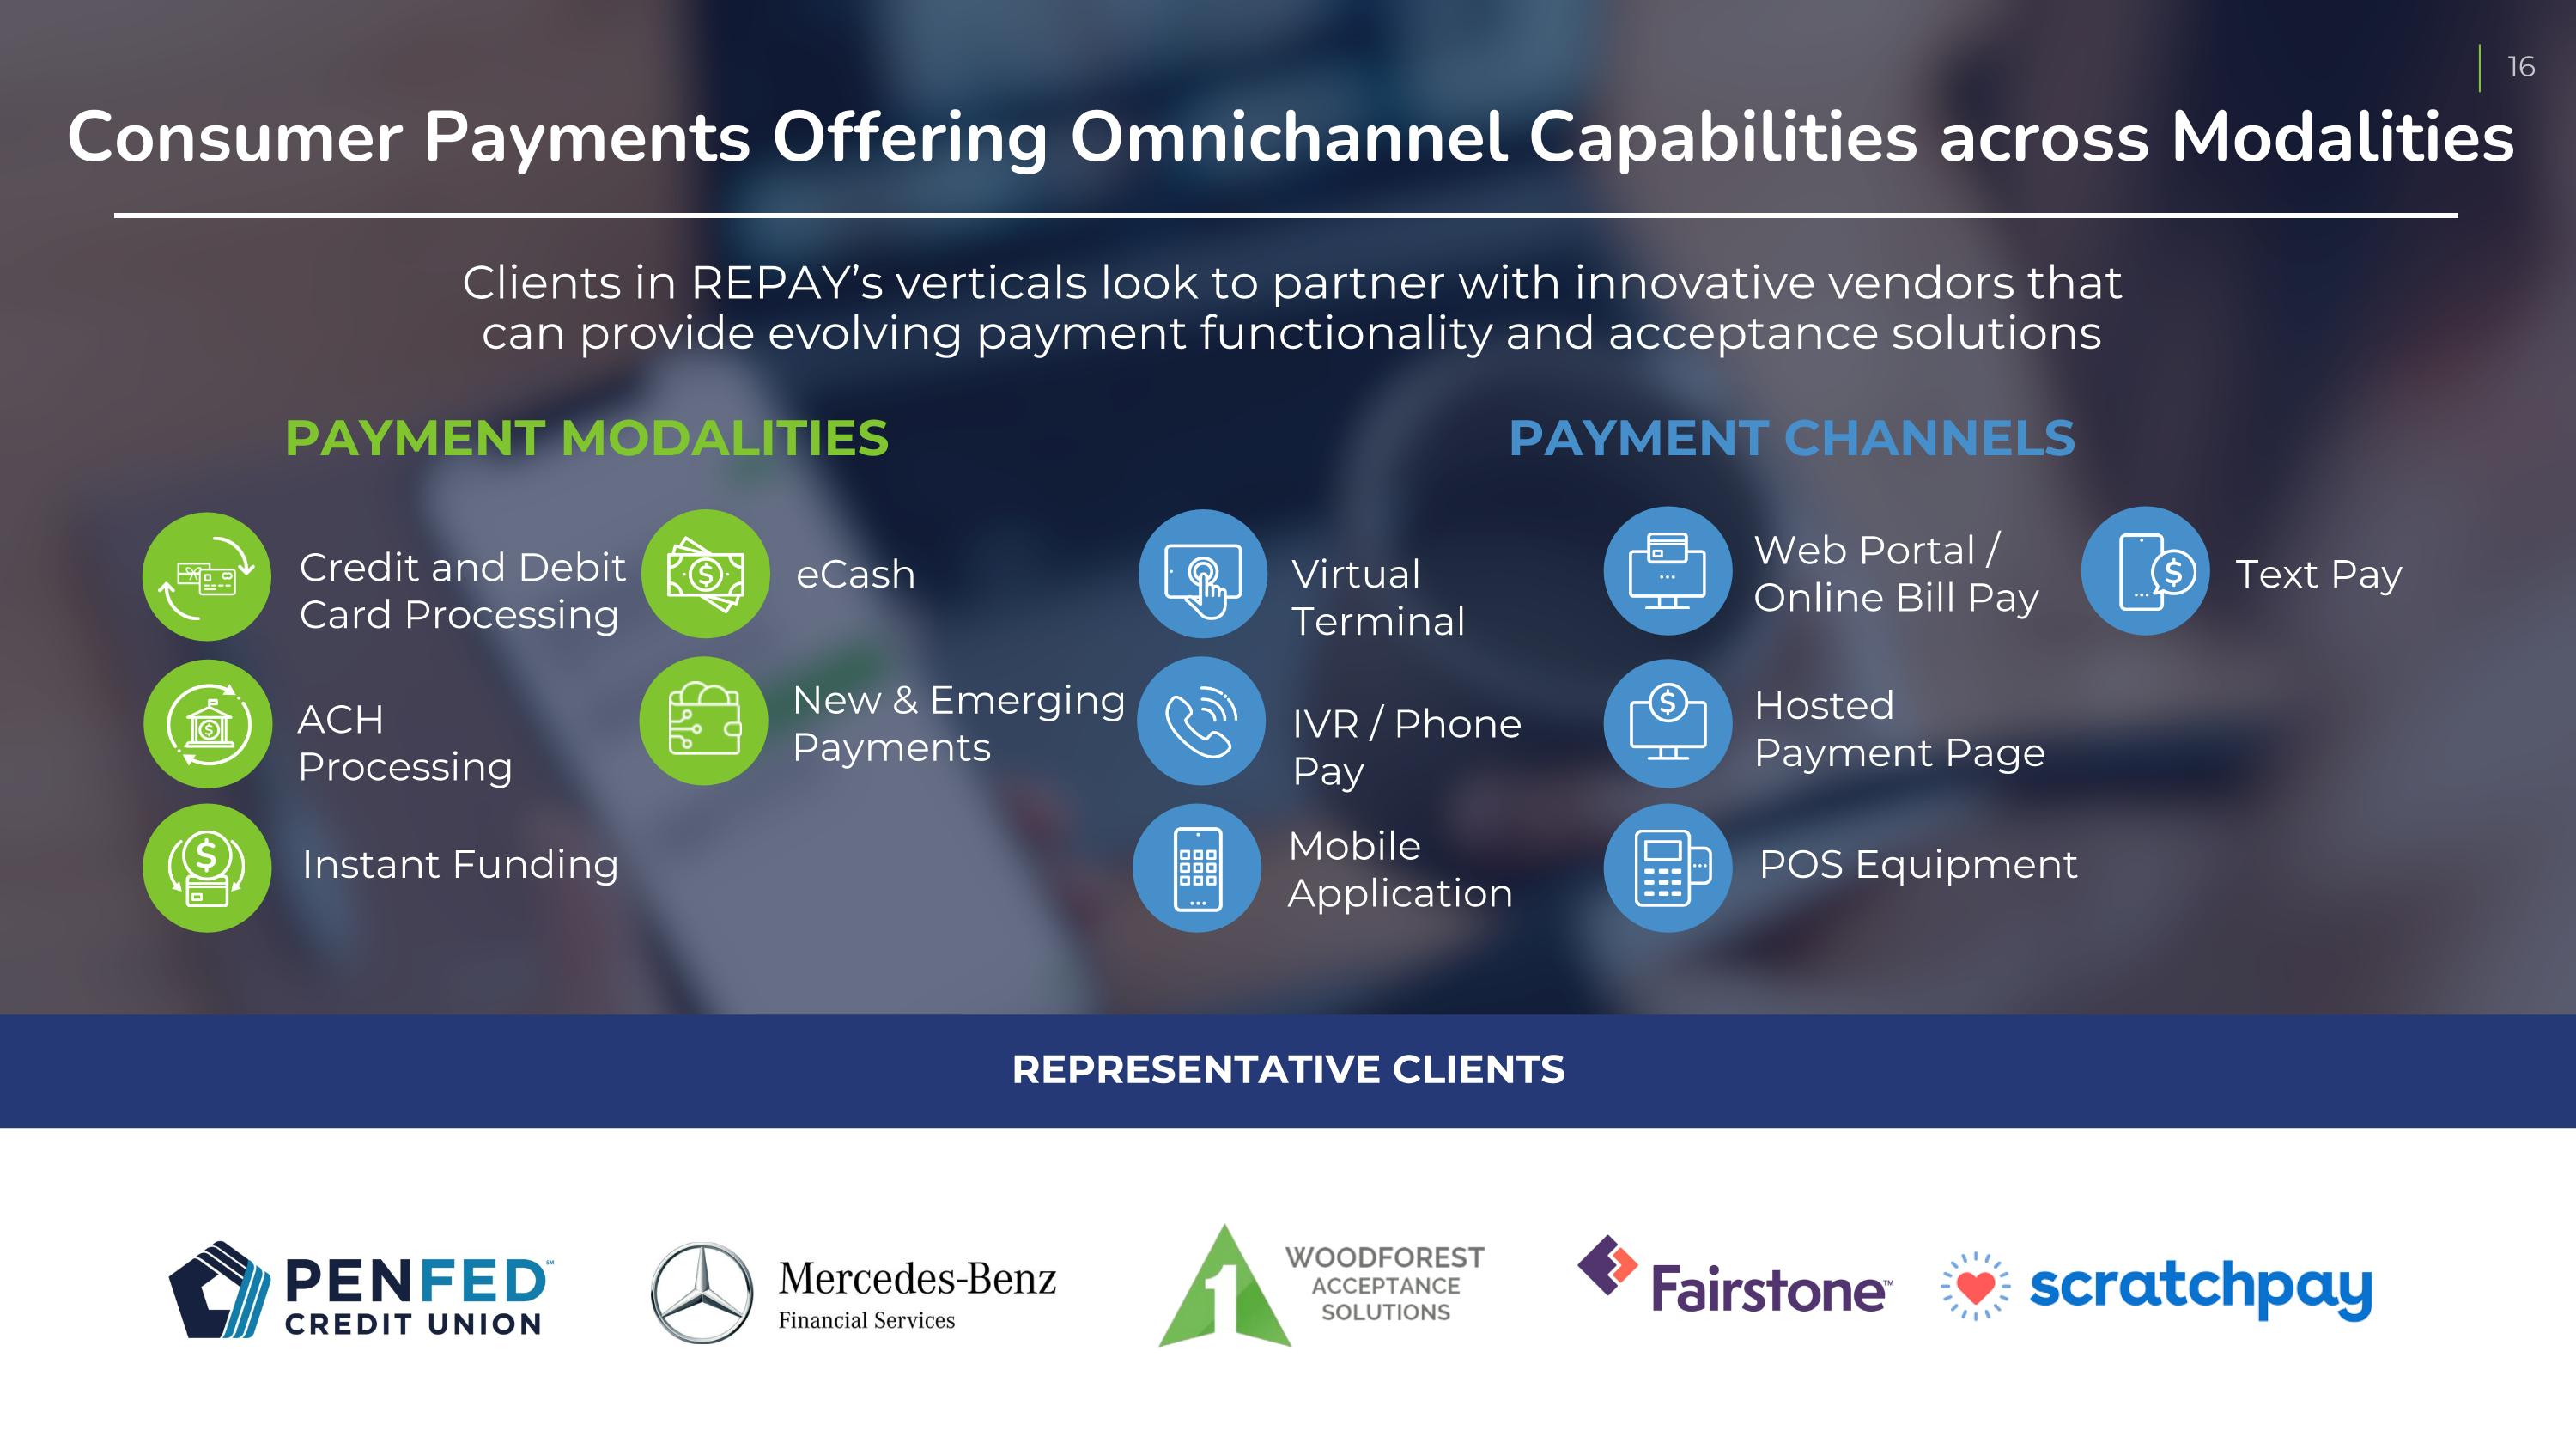
Consumer Payments Offering Omnichannel Capabilities across Modalities Clients in REPAY’s verticals look to partner with innovative vendors that can provide evolving payment functionality and acceptance solutions Credit and Debit Card Processing ACH Processing Instant Funding eCash New & Emerging Payments Virtual Terminal IVR / Phone Pay Mobile Application Web Portal / Online Bill Pay Hosted Payment Page POS Equipment Text Pay PAYMENT MODALITIES PAYMENT CHANNELS REPRESENTATIVE CLIENTS
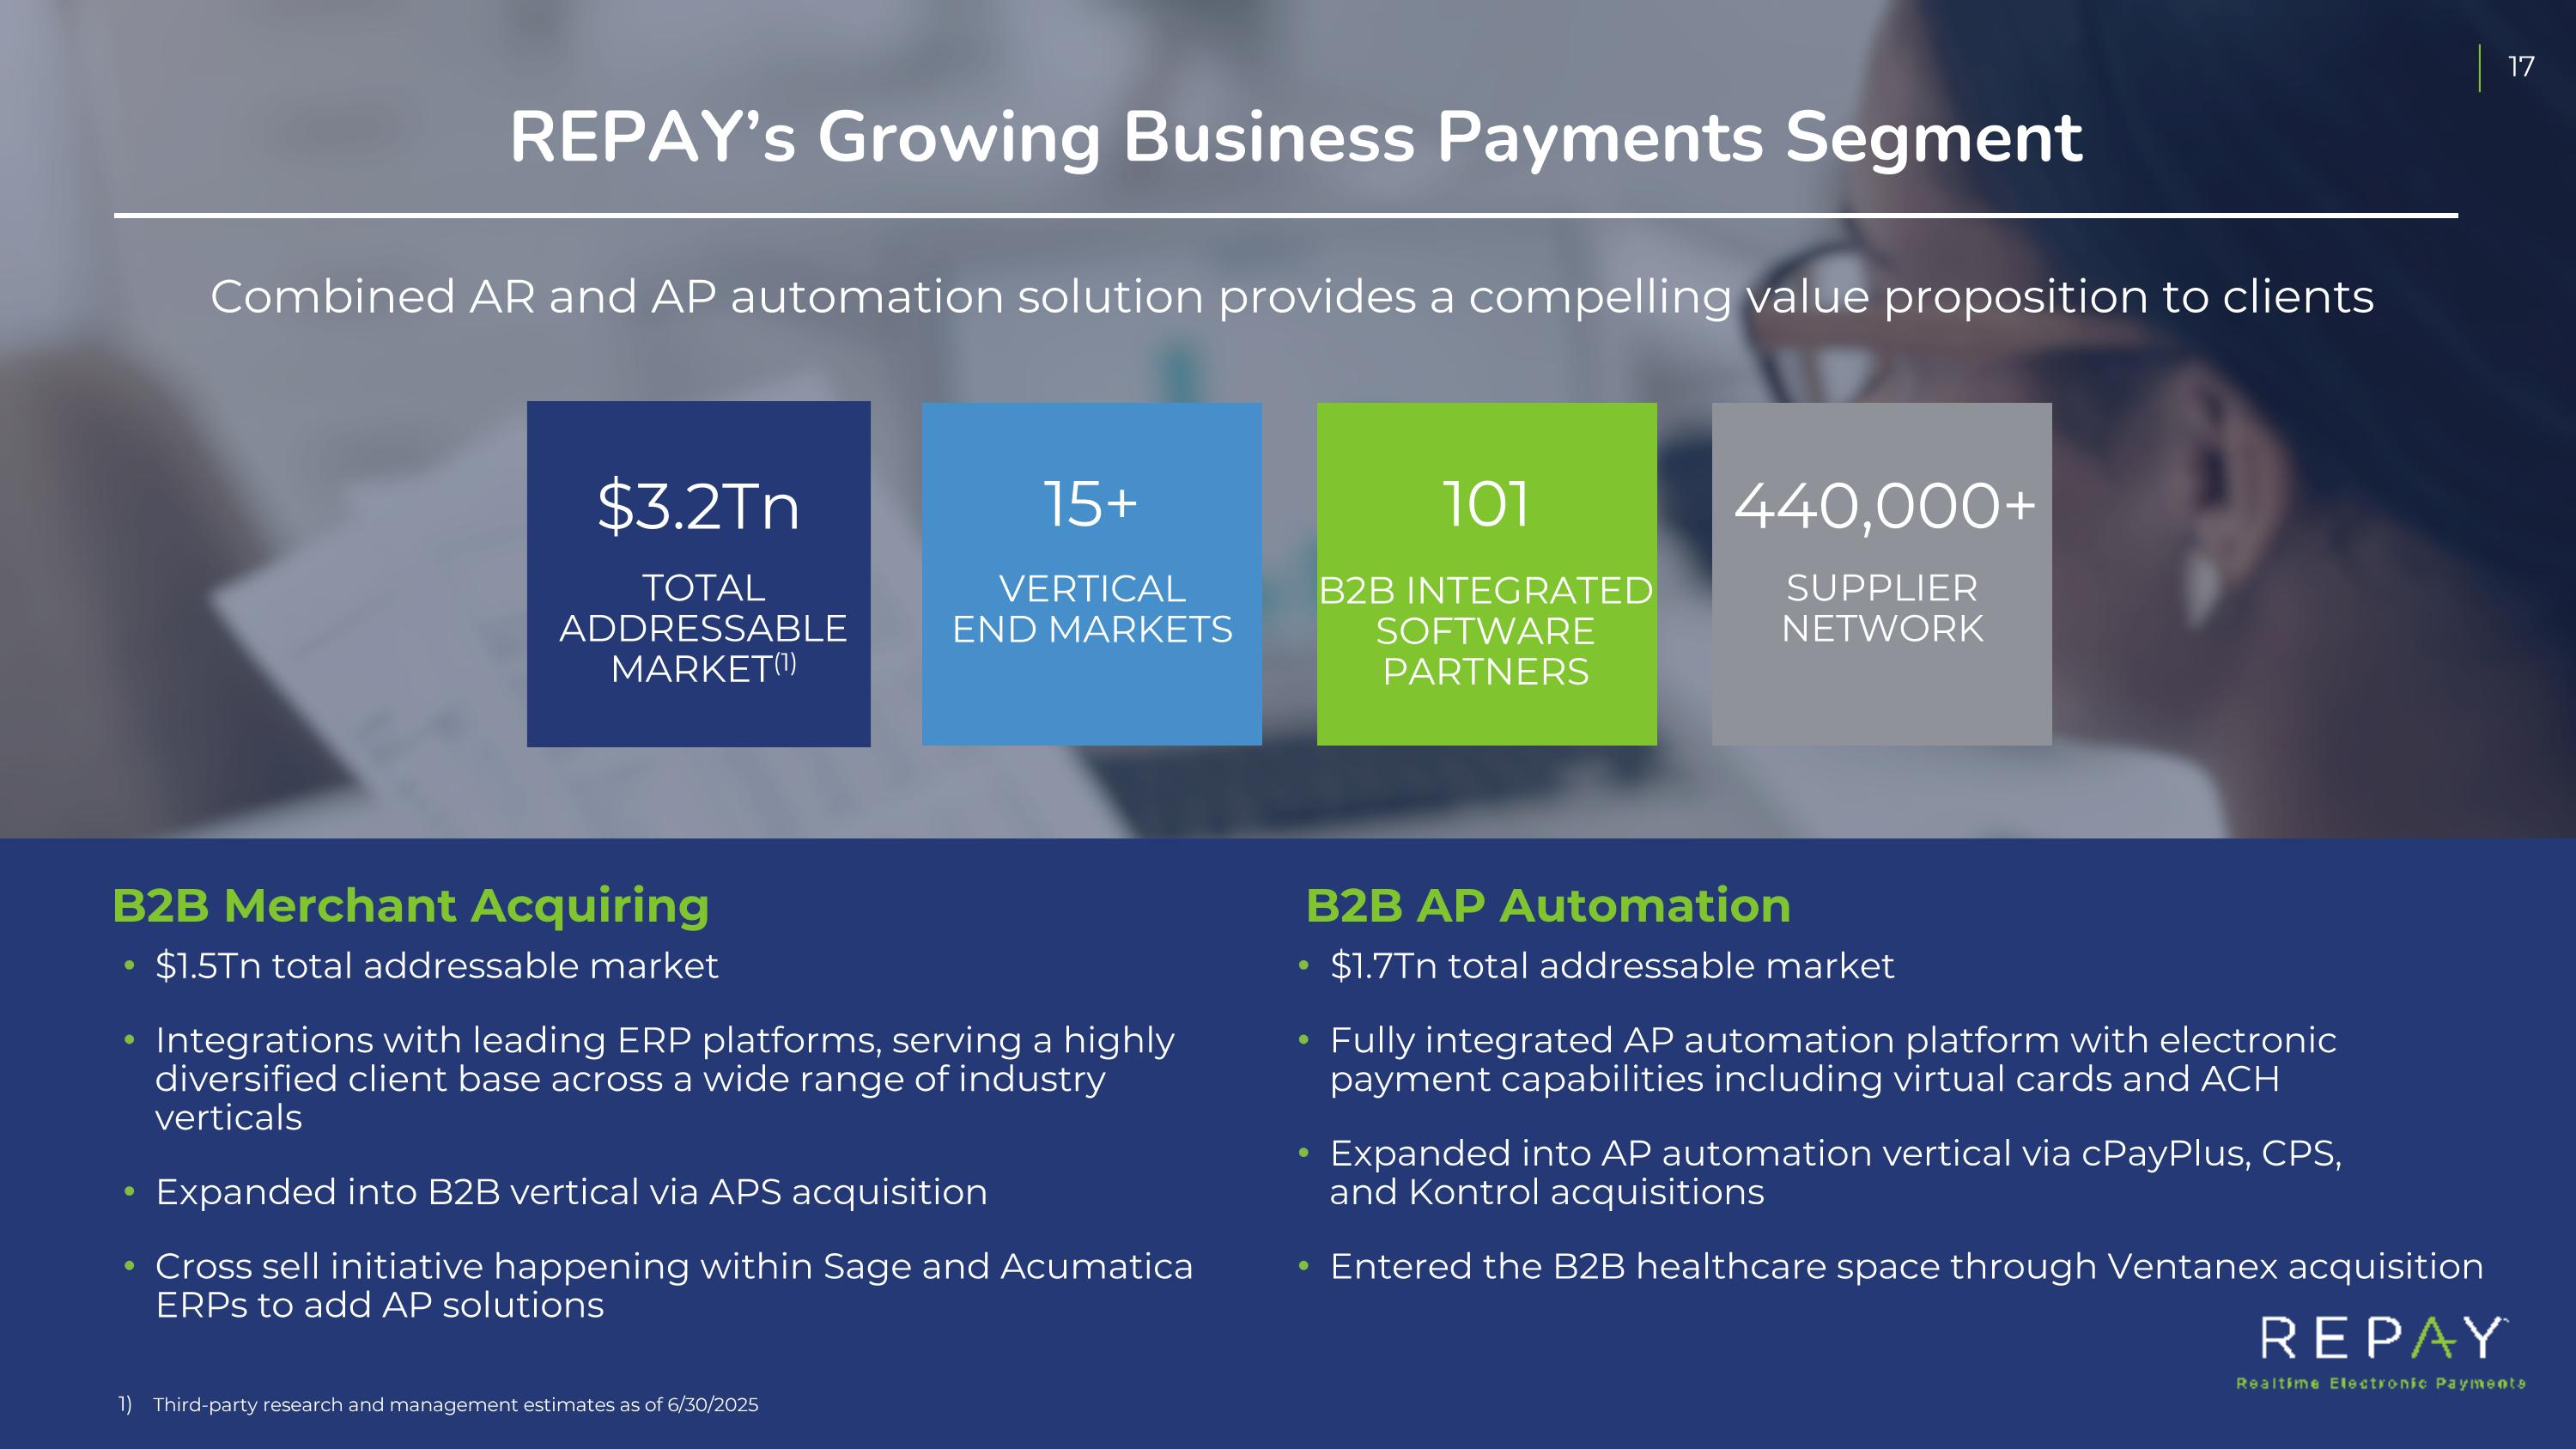
REPAY’s Growing Business Payments Segment Third-party research and management estimates as of 6/30/2025 $1.5Tn total addressable market Integrations with leading ERP platforms, serving a highly diversified client base across a wide range of industry verticals Expanded into B2B vertical via APS acquisition Cross sell initiative happening within Sage and Acumatica ERPs to add AP solutions TOTAL ADDRESSABLE MARKET(1) $3.2Tn VERTICAL END MARKETS 15+ SUPPLIER NETWORK 440,000+ B2B INTEGRATED SOFTWARE PARTNERS 101 Combined AR and AP automation solution provides a compelling value proposition to clients $1.7Tn total addressable market Fully integrated AP automation platform with electronic payment capabilities including virtual cards and ACH Expanded into AP automation vertical via cPayPlus, CPS, and Kontrol acquisitions Entered the B2B healthcare space through Ventanex acquisition B2B Merchant Acquiring B2B AP Automation
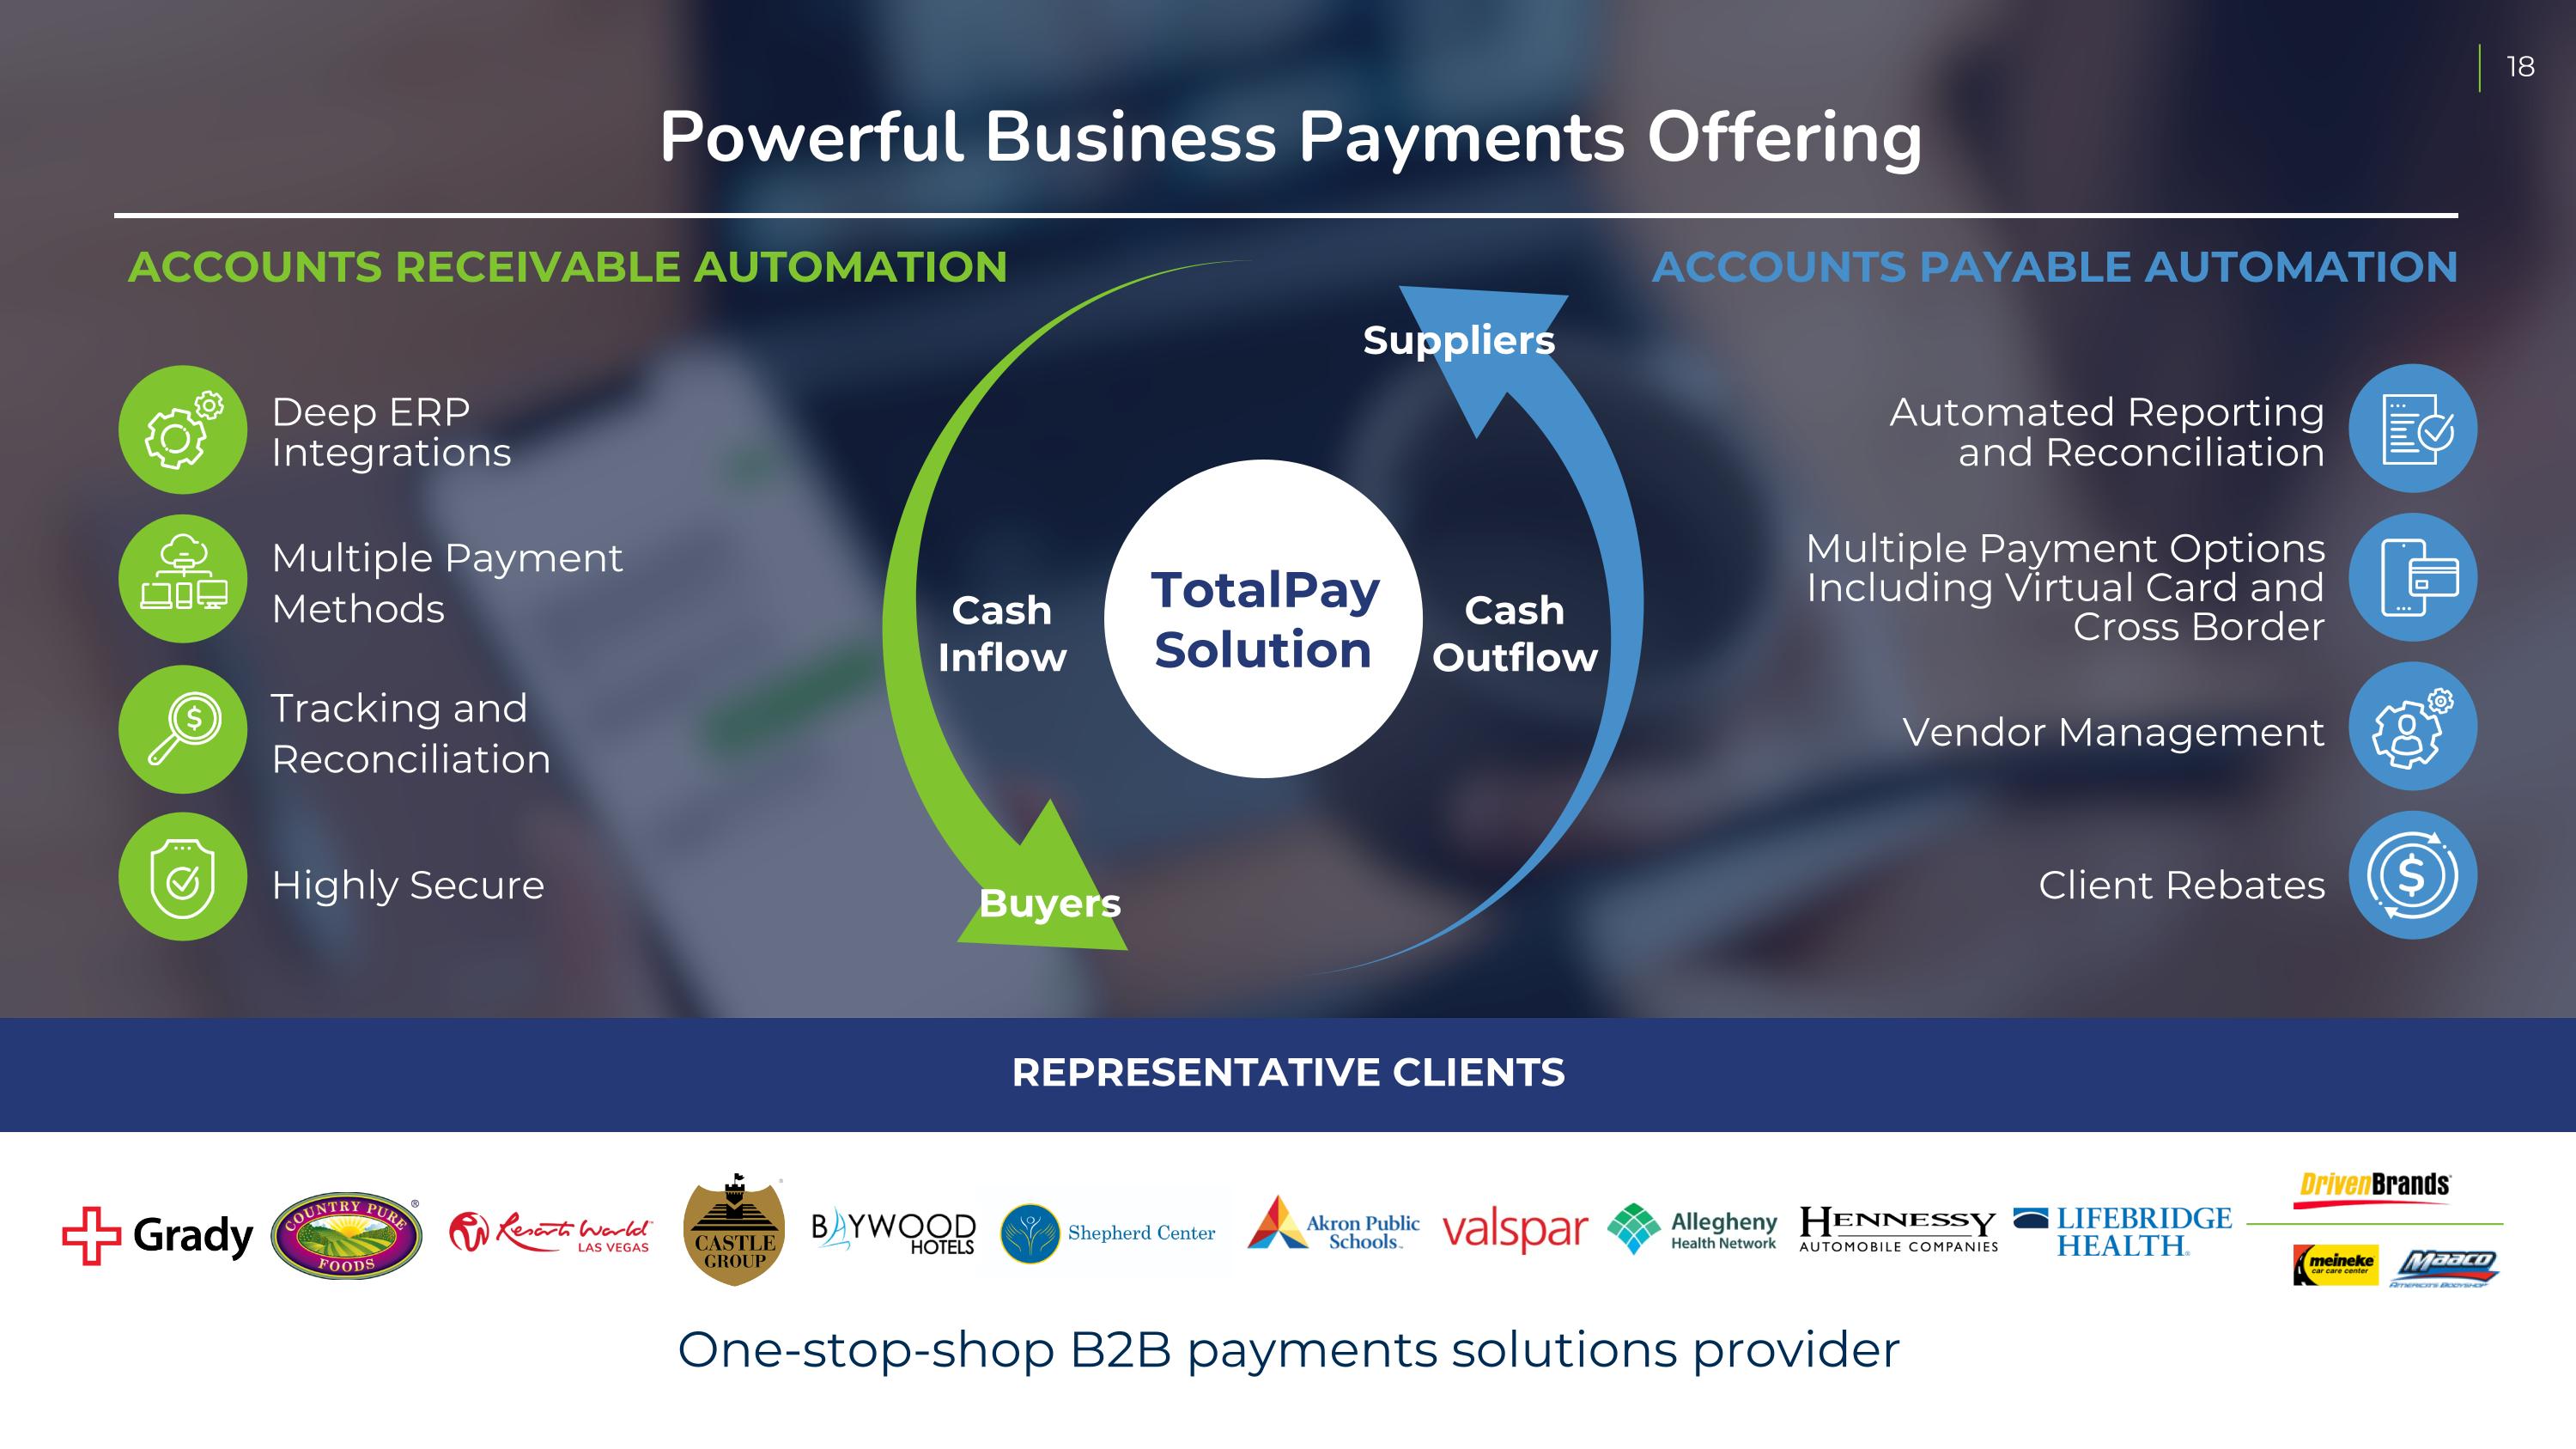
Powerful Business Payments Offering One-stop-shop B2B payments solutions provider REPRESENTATIVE CLIENTS Automated Reporting and Reconciliation Multiple Payment Options Including Virtual Card and Cross Border Vendor Management Client Rebates Deep ERP Integrations Multiple Payment Methods Tracking and Reconciliation Highly Secure ACCOUNTS RECEIVABLE AUTOMATION ACCOUNTS PAYABLE AUTOMATION TotalPay Solution Cash Inflow Cash Outflow Buyers Suppliers

3 Appendix
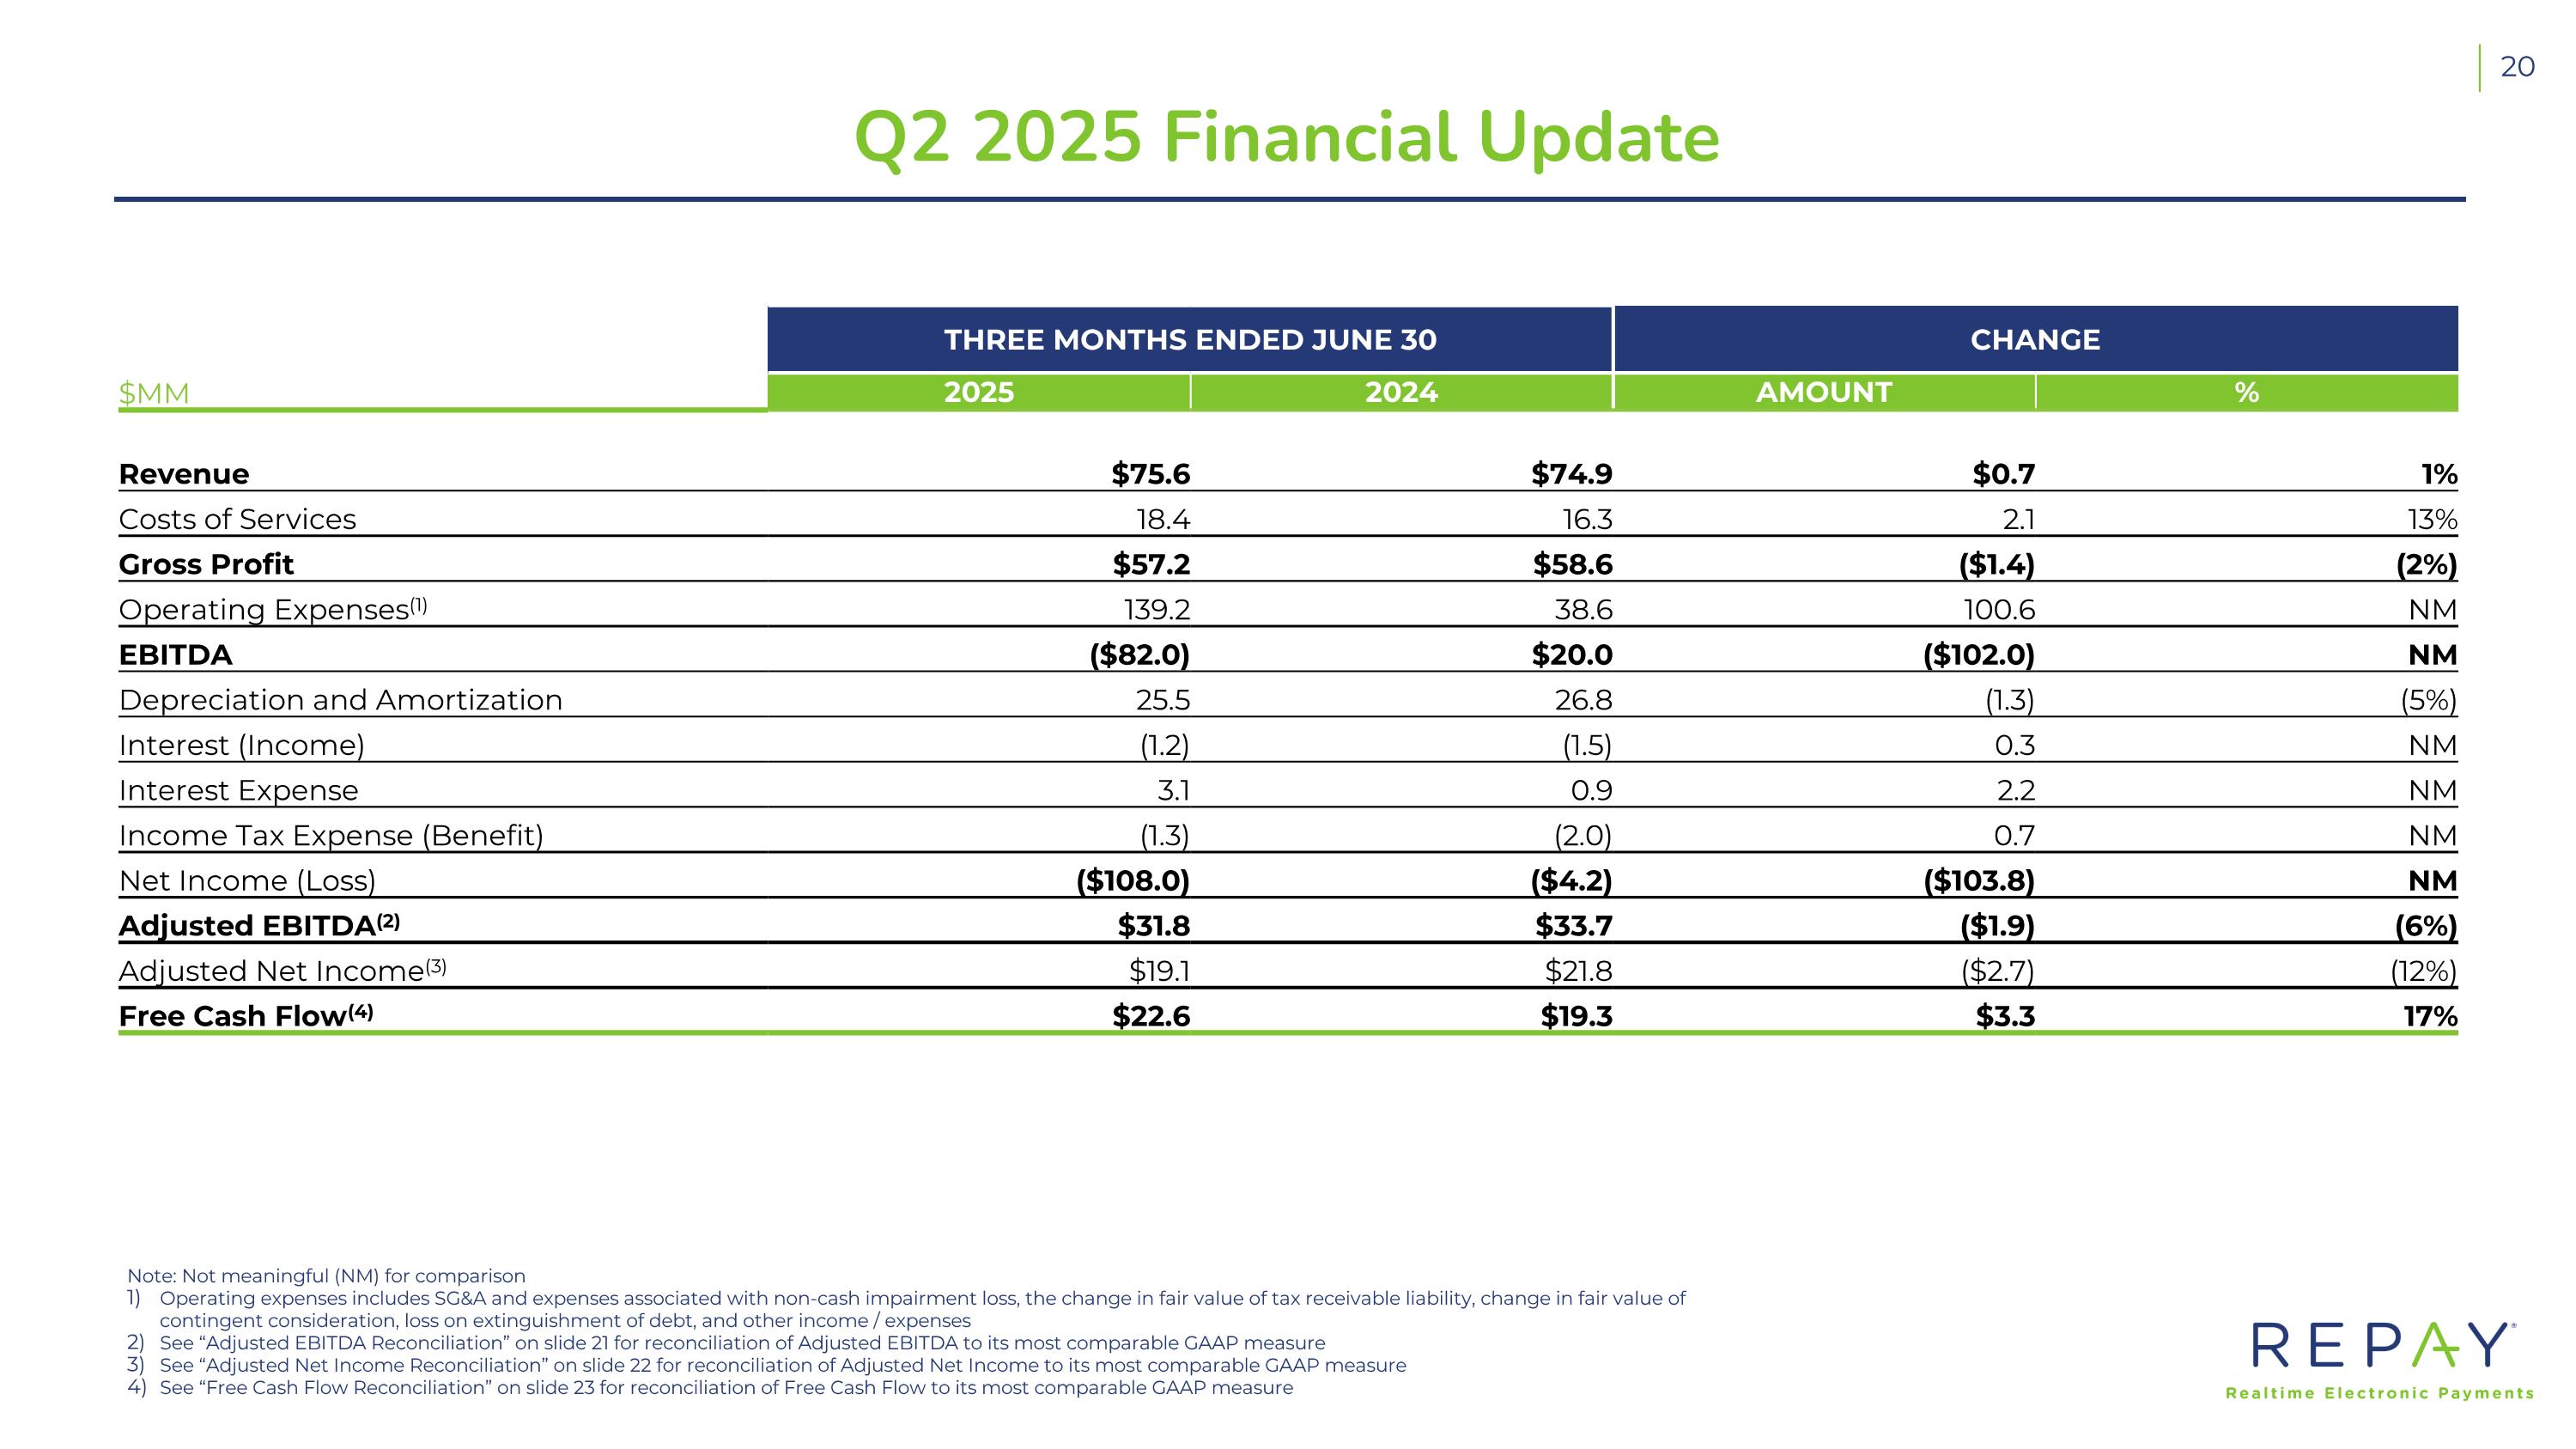
Q2 2025 Financial Update Note: Not meaningful (NM) for comparison Operating expenses includes SG&A and expenses associated with non-cash impairment loss, the change in fair value of tax receivable liability, change in fair value of contingent consideration, loss on extinguishment of debt, and other income / expenses See “Adjusted EBITDA Reconciliation” on slide 21 for reconciliation of Adjusted EBITDA to its most comparable GAAP measure See “Adjusted Net Income Reconciliation” on slide 22 for reconciliation of Adjusted Net Income to its most comparable GAAP measure See “Free Cash Flow Reconciliation” on slide 23 for reconciliation of Free Cash Flow to its most comparable GAAP measure THREE MONTHS ENDED JUNE 30 CHANGE $MM 2025 2024 AMOUNT % Revenue $75.6 $74.9 $0.7 1% Costs of Services 18.4 16.3 2.1 13% Gross Profit $57.2 $58.6 ($1.4) (2%) Operating Expenses(1) 139.2 38.6 100.6 NM EBITDA ($82.0) $20.0 ($102.0) NM Depreciation and Amortization 25.5 26.8 (1.3) (5%) Interest (Income) (1.2) (1.5) 0.3 NM Interest Expense 3.1 0.9 2.2 NM Income Tax Expense (Benefit) (1.3) (2.0) 0.7 NM Net Income (Loss) ($108.0) ($4.2) ($103.8) NM Adjusted EBITDA(2) $31.8 $33.7 ($1.9) (6%) Adjusted Net Income(3) $19.1 $21.8 ($2.7) (12%) Free Cash Flow(4) $22.6 $19.3 $3.3 17%
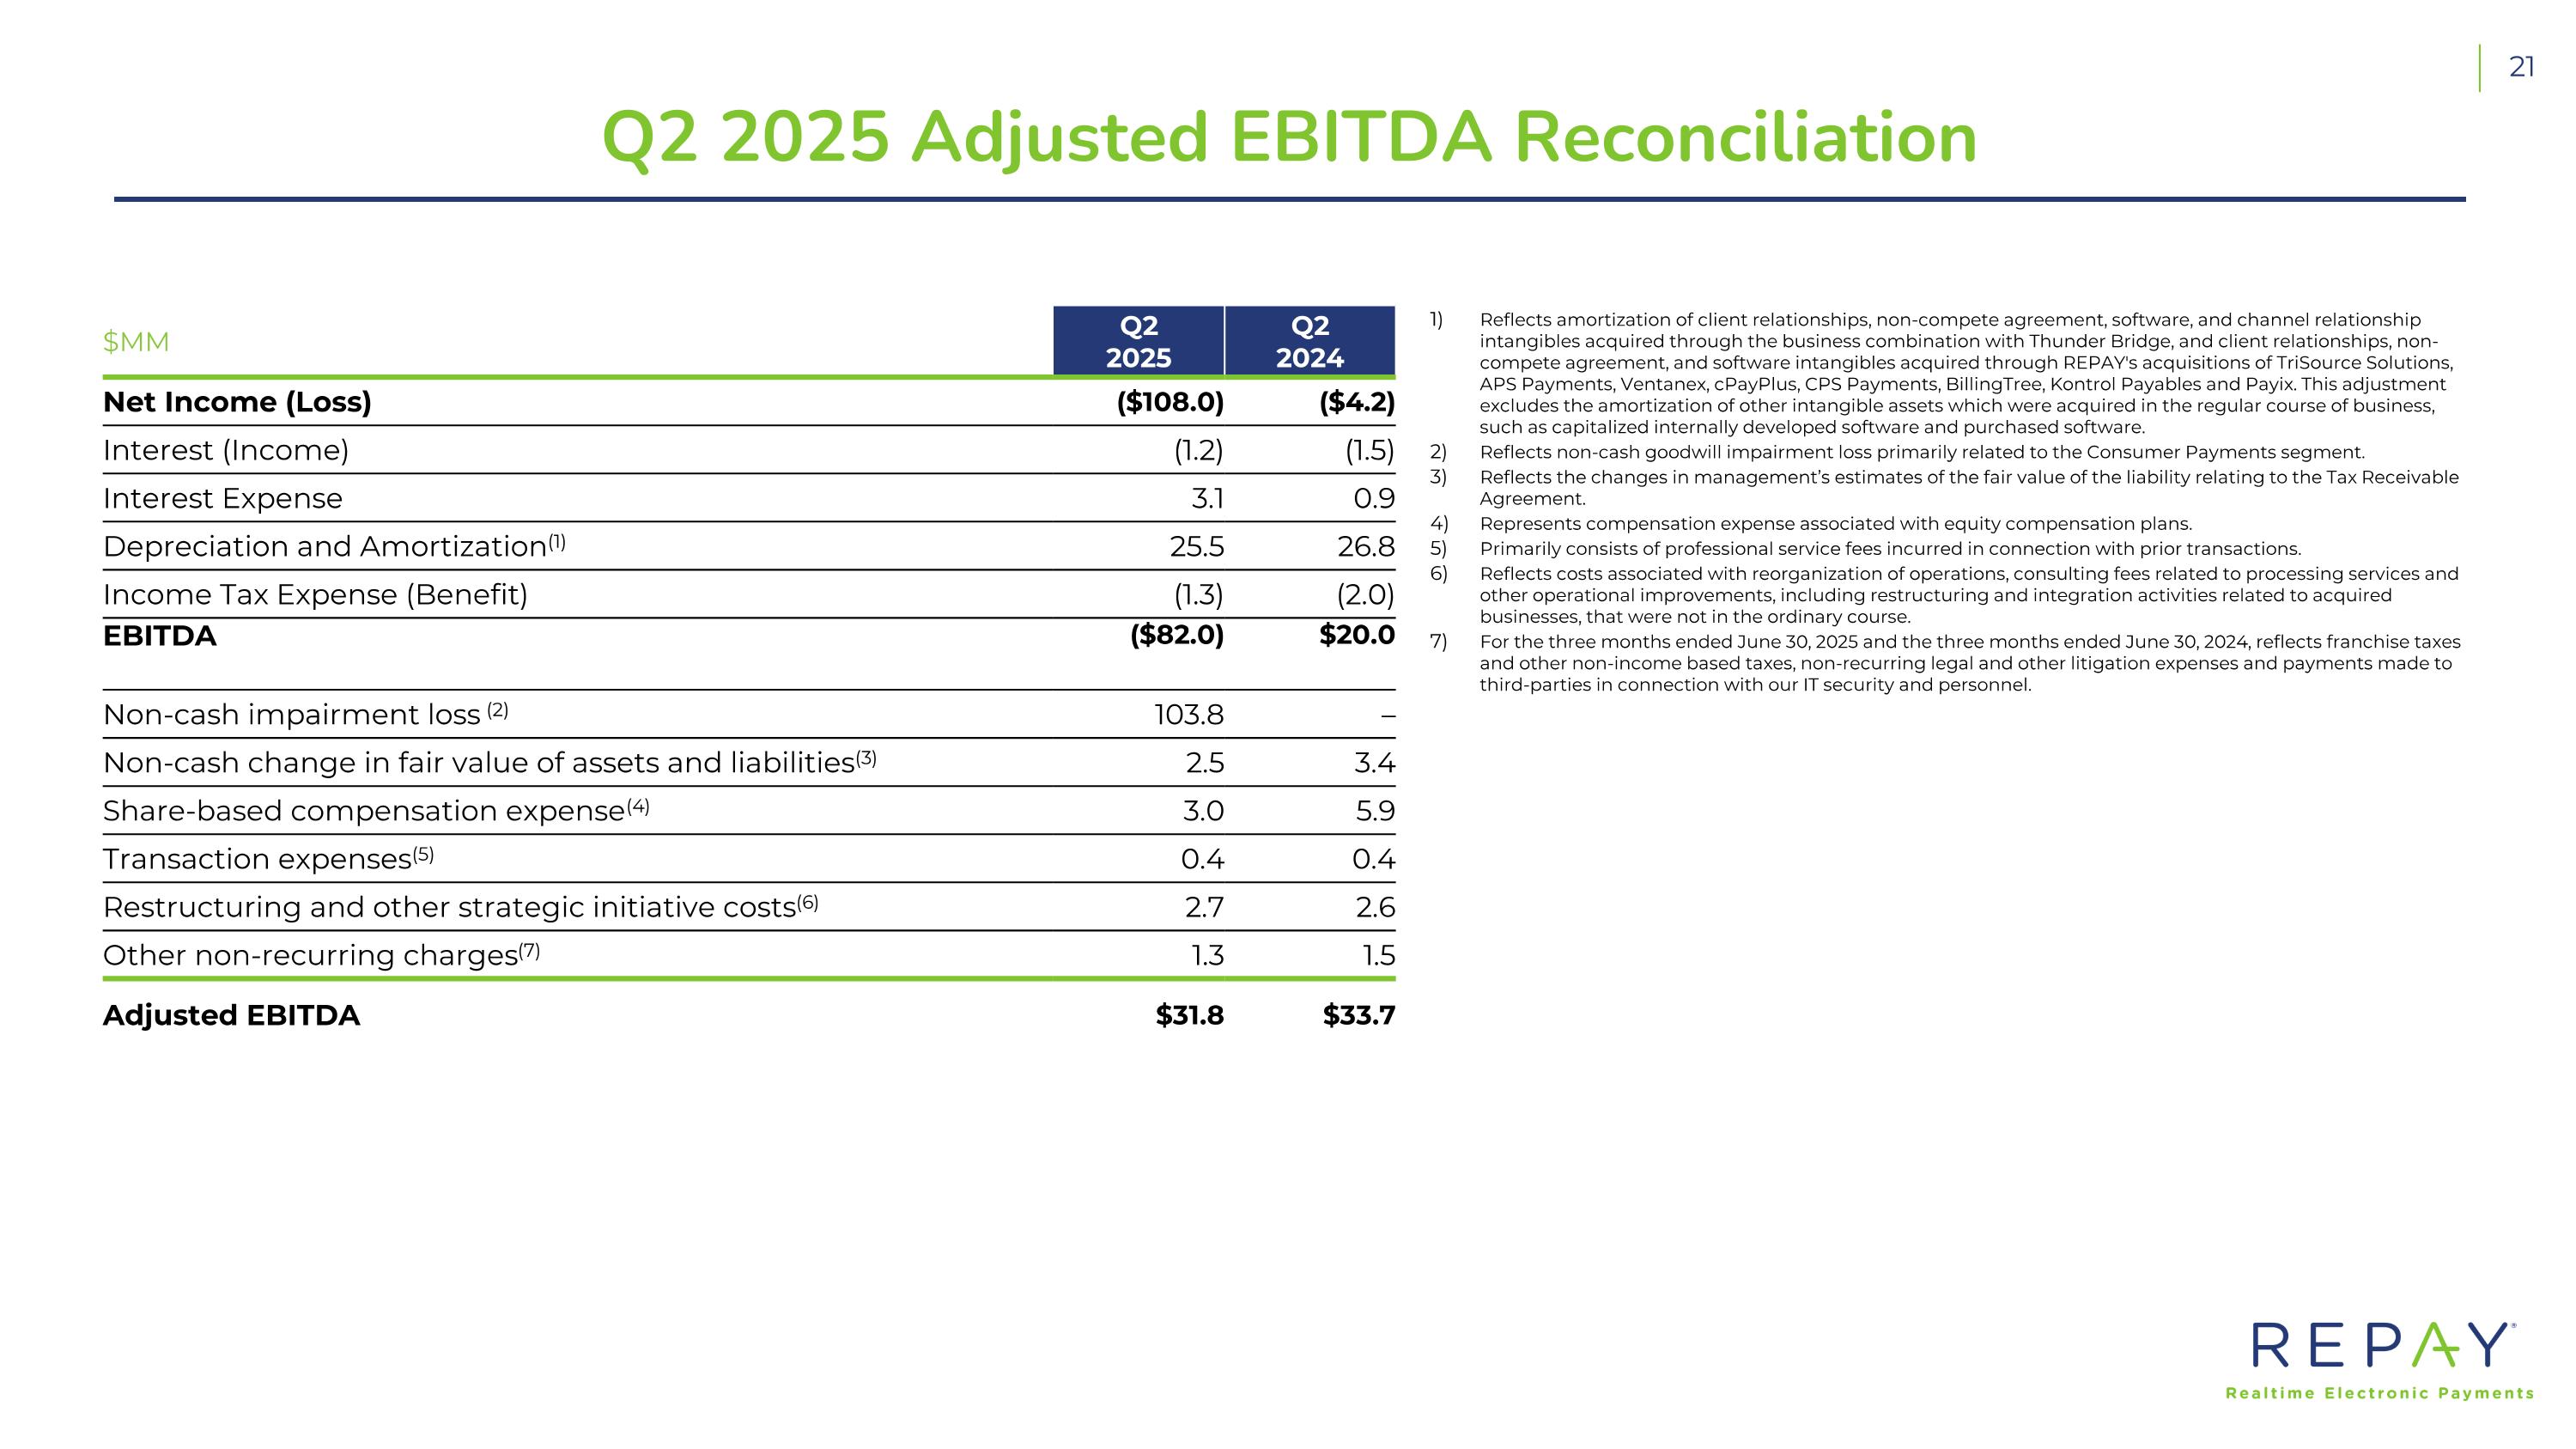
Q2 2025 Adjusted EBITDA Reconciliation Reflects amortization of client relationships, non-compete agreement, software, and channel relationship intangibles acquired through the business combination with Thunder Bridge, and client relationships, non-compete agreement, and software intangibles acquired through REPAY's acquisitions of TriSource Solutions, APS Payments, Ventanex, cPayPlus, CPS Payments, BillingTree, Kontrol Payables and Payix. This adjustment excludes the amortization of other intangible assets which were acquired in the regular course of business, such as capitalized internally developed software and purchased software. Reflects non-cash goodwill impairment loss primarily related to the Consumer Payments segment. Reflects the changes in management’s estimates of the fair value of the liability relating to the Tax Receivable Agreement. Represents compensation expense associated with equity compensation plans. Primarily consists of professional service fees incurred in connection with prior transactions. Reflects costs associated with reorganization of operations, consulting fees related to processing services and other operational improvements, including restructuring and integration activities related to acquired businesses, that were not in the ordinary course. For the three months ended June 30, 2025 and the three months ended June 30, 2024, reflects franchise taxes and other non-income based taxes, non-recurring legal and other litigation expenses and payments made to third-parties in connection with our IT security and personnel. $MM Q2 2025 Q2 2024 Net Income (Loss) ($108.0) ($4.2) Interest (Income) (1.2) (1.5) Interest Expense 3.1 0.9 Depreciation and Amortization(1) 25.5 26.8 Income Tax Expense (Benefit) (1.3) (2.0) EBITDA ($82.0) $20.0 Non-cash impairment loss (2) 103.8 – Non-cash change in fair value of assets and liabilities(3) 2.5 3.4 Share-based compensation expense(4) 3.0 5.9 Transaction expenses(5) 0.4 0.4 Restructuring and other strategic initiative costs(6) 2.7 2.6 Other non-recurring charges(7) 1.3 1.5 Adjusted EBITDA $31.8 $33.7
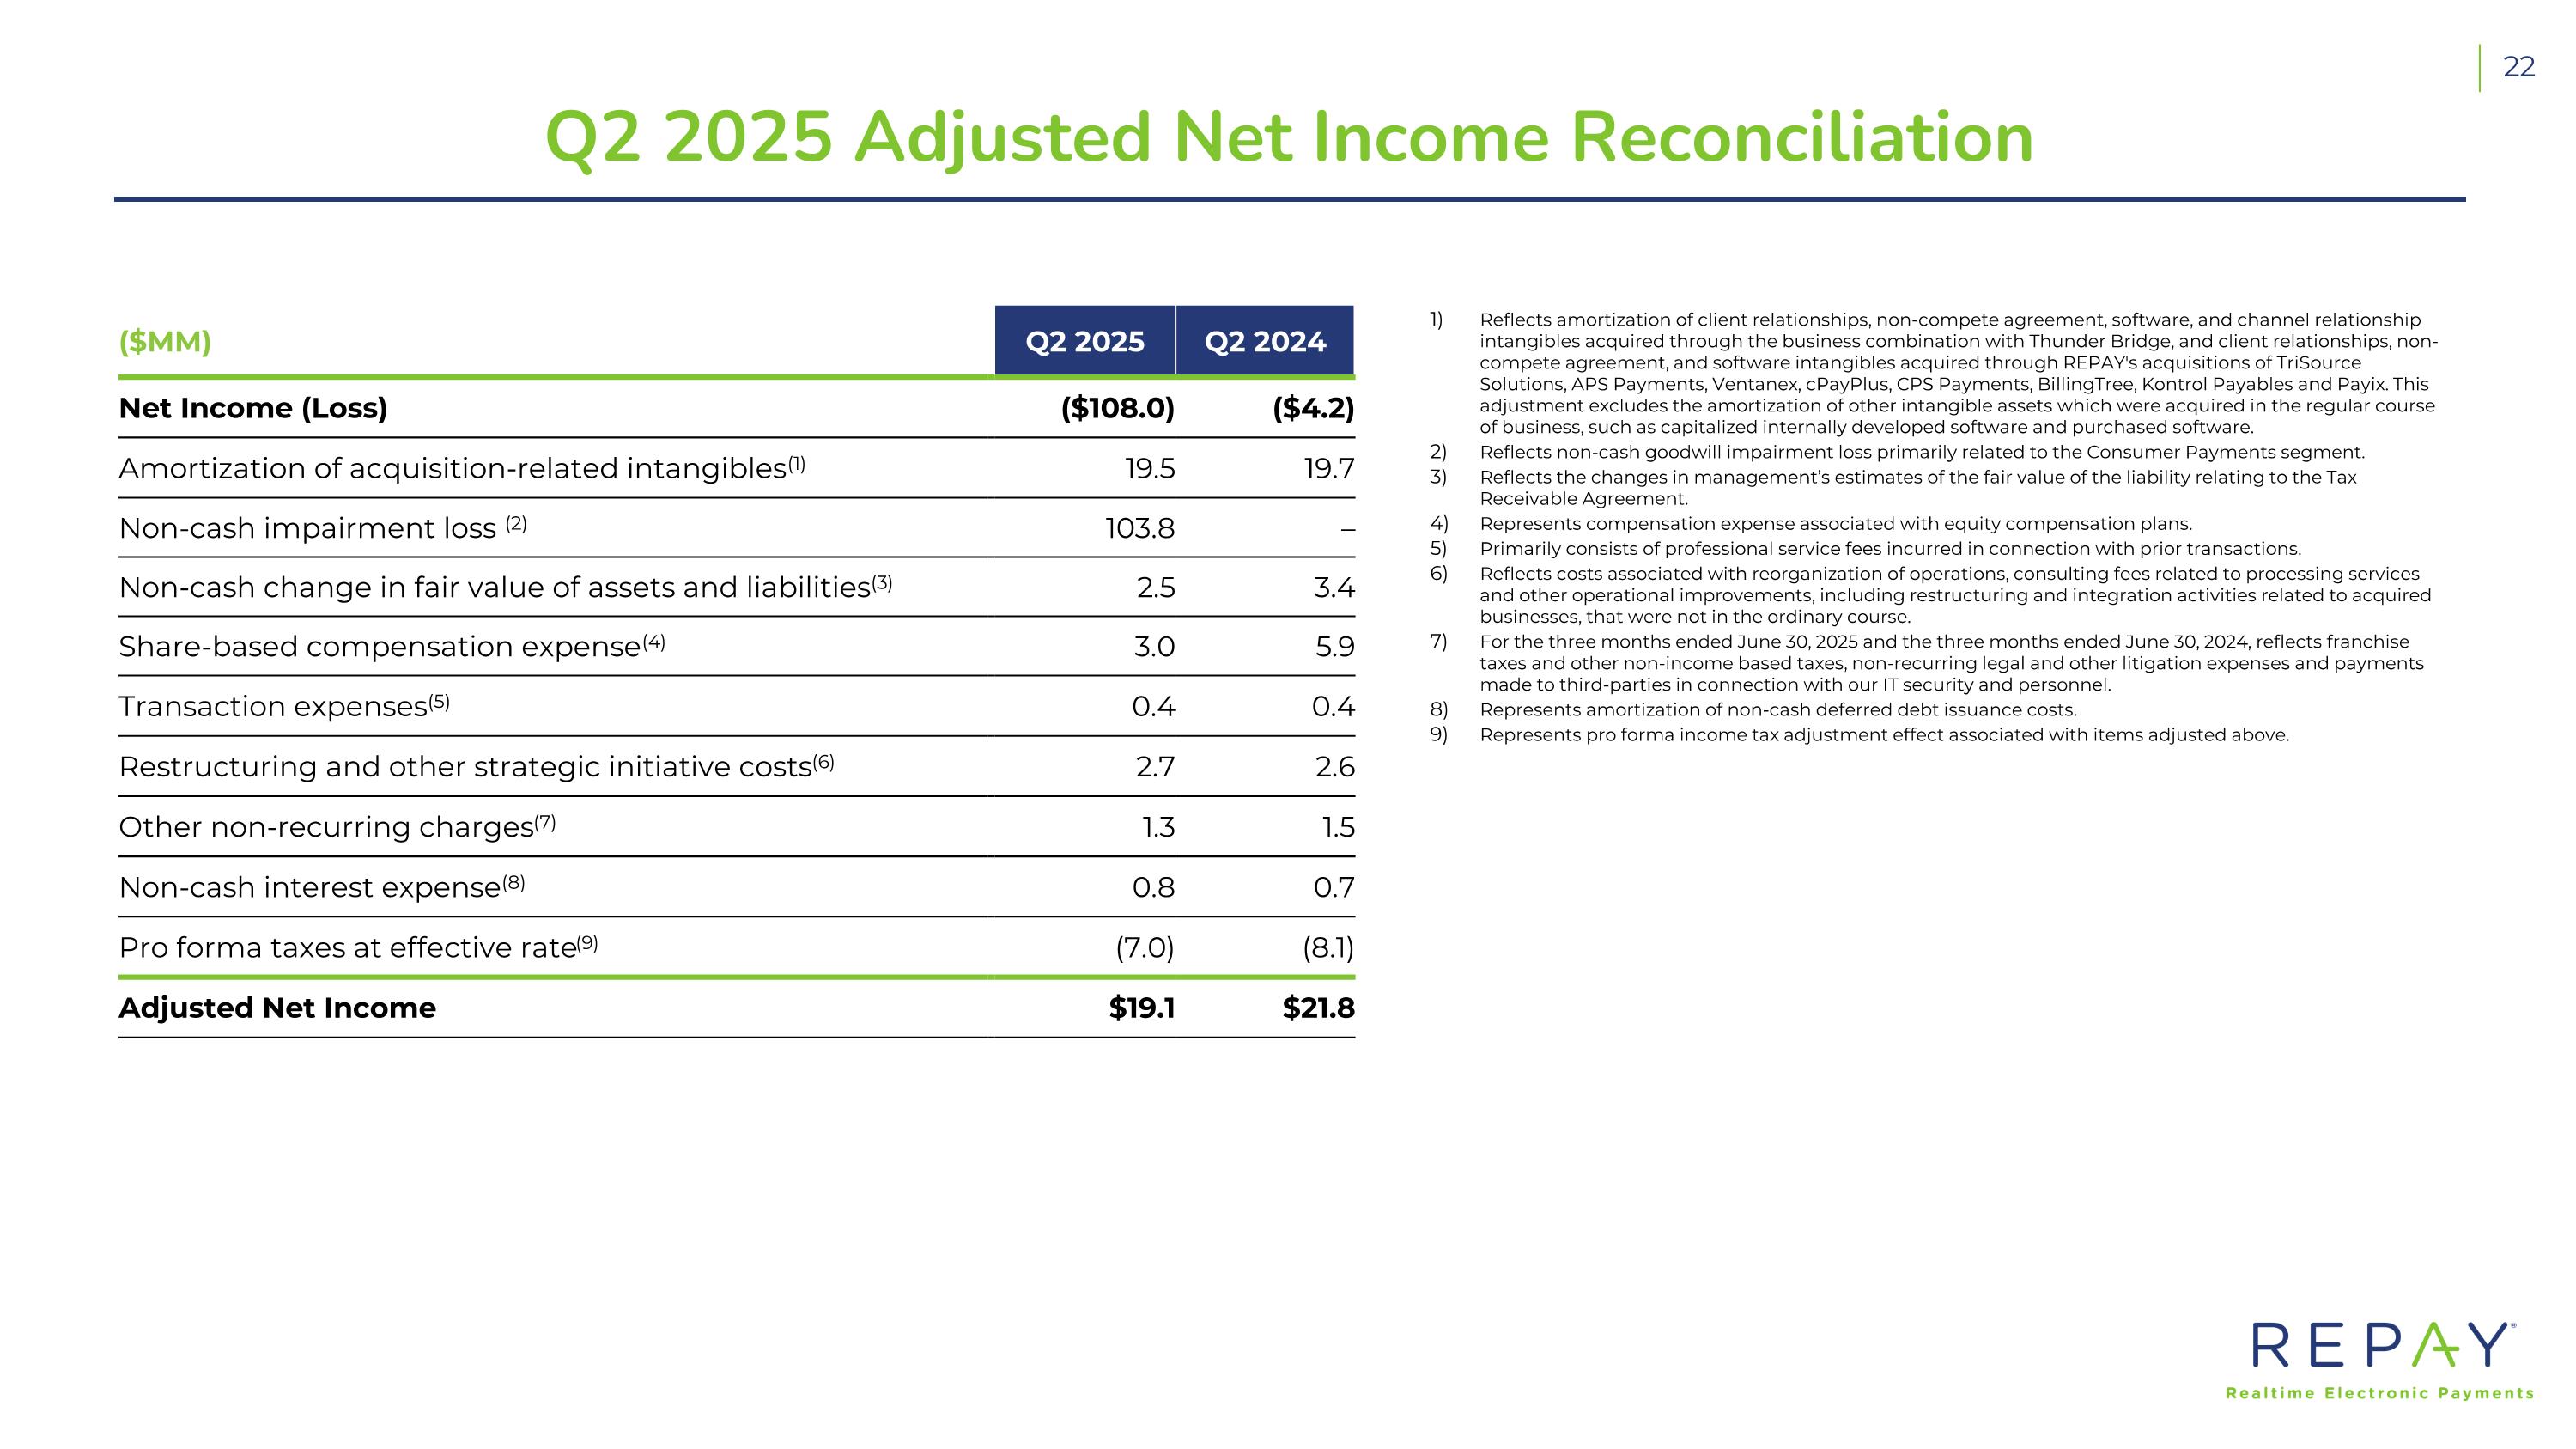
Q2 2025 Adjusted Net Income Reconciliation Reflects amortization of client relationships, non-compete agreement, software, and channel relationship intangibles acquired through the business combination with Thunder Bridge, and client relationships, non-compete agreement, and software intangibles acquired through REPAY's acquisitions of TriSource Solutions, APS Payments, Ventanex, cPayPlus, CPS Payments, BillingTree, Kontrol Payables and Payix. This adjustment excludes the amortization of other intangible assets which were acquired in the regular course of business, such as capitalized internally developed software and purchased software. Reflects non-cash goodwill impairment loss primarily related to the Consumer Payments segment. Reflects the changes in management’s estimates of the fair value of the liability relating to the Tax Receivable Agreement. Represents compensation expense associated with equity compensation plans. Primarily consists of professional service fees incurred in connection with prior transactions. Reflects costs associated with reorganization of operations, consulting fees related to processing services and other operational improvements, including restructuring and integration activities related to acquired businesses, that were not in the ordinary course. For the three months ended June 30, 2025 and the three months ended June 30, 2024, reflects franchise taxes and other non-income based taxes, non-recurring legal and other litigation expenses and payments made to third-parties in connection with our IT security and personnel. Represents amortization of non-cash deferred debt issuance costs. Represents pro forma income tax adjustment effect associated with items adjusted above. ($MM) Q2 2025 Q2 2024 Net Income (Loss) ($108.0) ($4.2) Amortization of acquisition-related intangibles(1) 19.5 19.7 Non-cash impairment loss (2) 103.8 – Non-cash change in fair value of assets and liabilities(3) 2.5 3.4 Share-based compensation expense(4) 3.0 5.9 Transaction expenses(5) 0.4 0.4 Restructuring and other strategic initiative costs(6) 2.7 2.6 Other non-recurring charges(7) 1.3 1.5 Non-cash interest expense(8) 0.8 0.7 Pro forma taxes at effective rate(9) (7.0) (8.1) Adjusted Net Income $19.1 $21.8
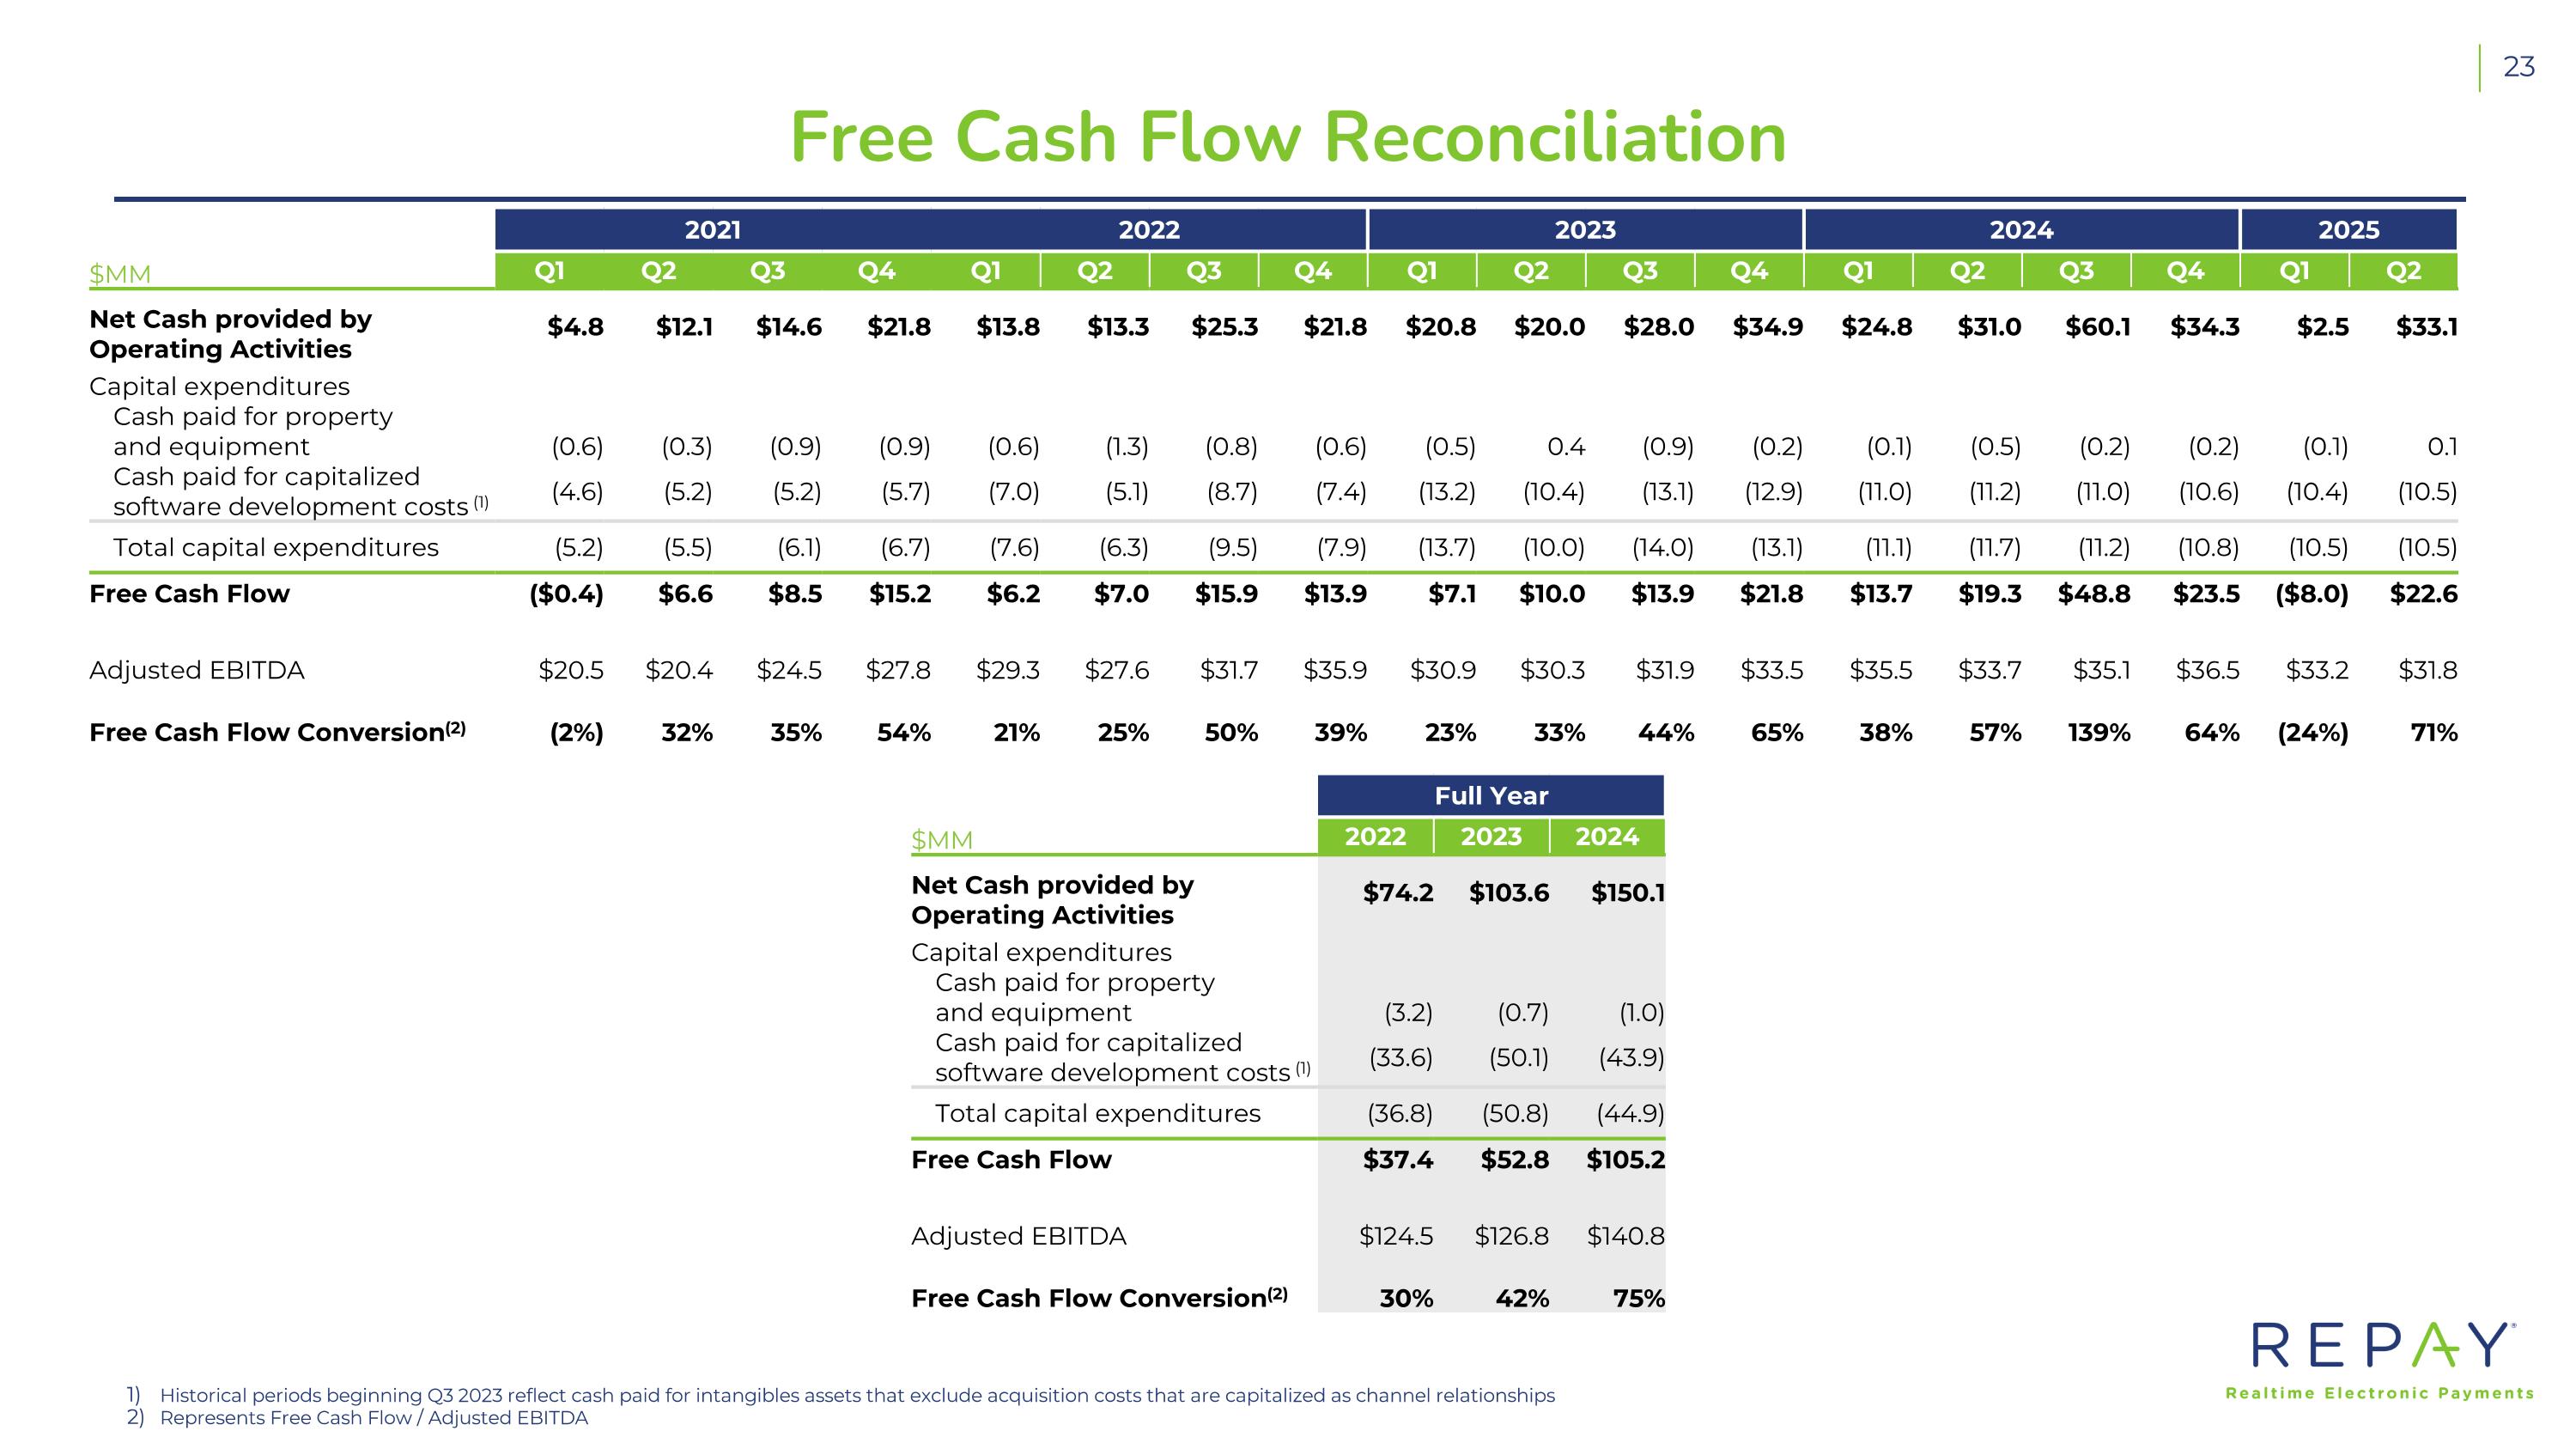
Free Cash Flow Reconciliation 2021 2022 2023 2024 2025 $MM Q1 Q2 Q3 Q4 Q1 Q2 Q3 Q4 Q1 Q2 Q3 Q4 Q1 Q2 Q3 Q4 Q1 Q2 Net Cash provided by Operating Activities $4.8 $12.1 $14.6 $21.8 $13.8 $13.3 $25.3 $21.8 $20.8 $20.0 $28.0 $34.9 $24.8 $31.0 $60.1 $34.3 $2.5 $33.1 Capital expenditures Cash paid for property and equipment (0.6) (0.3) (0.9) (0.9) (0.6) (1.3) (0.8) (0.6) (0.5) 0.4 (0.9) (0.2) (0.1) (0.5) (0.2) (0.2) (0.1) 0.1 Cash paid for capitalized software development costs (1) (4.6) (5.2) (5.2) (5.7) (7.0) (5.1) (8.7) (7.4) (13.2) (10.4) (13.1) (12.9) (11.0) (11.2) (11.0) (10.6) (10.4) (10.5) Total capital expenditures (5.2) (5.5) (6.1) (6.7) (7.6) (6.3) (9.5) (7.9) (13.7) (10.0) (14.0) (13.1) (11.1) (11.7) (11.2) (10.8) (10.5) (10.5) Free Cash Flow ($0.4) $6.6 $8.5 $15.2 $6.2 $7.0 $15.9 $13.9 $7.1 $10.0 $13.9 $21.8 $13.7 $19.3 $48.8 $23.5 ($8.0) $22.6 Adjusted EBITDA $20.5 $20.4 $24.5 $27.8 $29.3 $27.6 $31.7 $35.9 $30.9 $30.3 $31.9 $33.5 $35.5 $33.7 $35.1 $36.5 $33.2 $31.8 Free Cash Flow Conversion(2) (2%) 32% 35% 54% 21% 25% 50% 39% 23% 33% 44% 65% 38% 57% 139% 64% (24%) 71% Historical periods beginning Q3 2023 reflect cash paid for intangibles assets that exclude acquisition costs that are capitalized as channel relationships Represents Free Cash Flow / Adjusted EBITDA Full Year $MM 2022 2023 2024 Net Cash provided by Operating Activities $74.2 $103.6 $150.1 Capital expenditures Cash paid for property and equipment (3.2) (0.7) (1.0) Cash paid for capitalized software development costs (1) (33.6) (50.1) (43.9) Total capital expenditures (36.8) (50.8) (44.9) Free Cash Flow $37.4 $52.8 $105.2 Adjusted EBITDA $124.5 $126.8 $140.8 Free Cash Flow Conversion(2) 30% 42% 75%
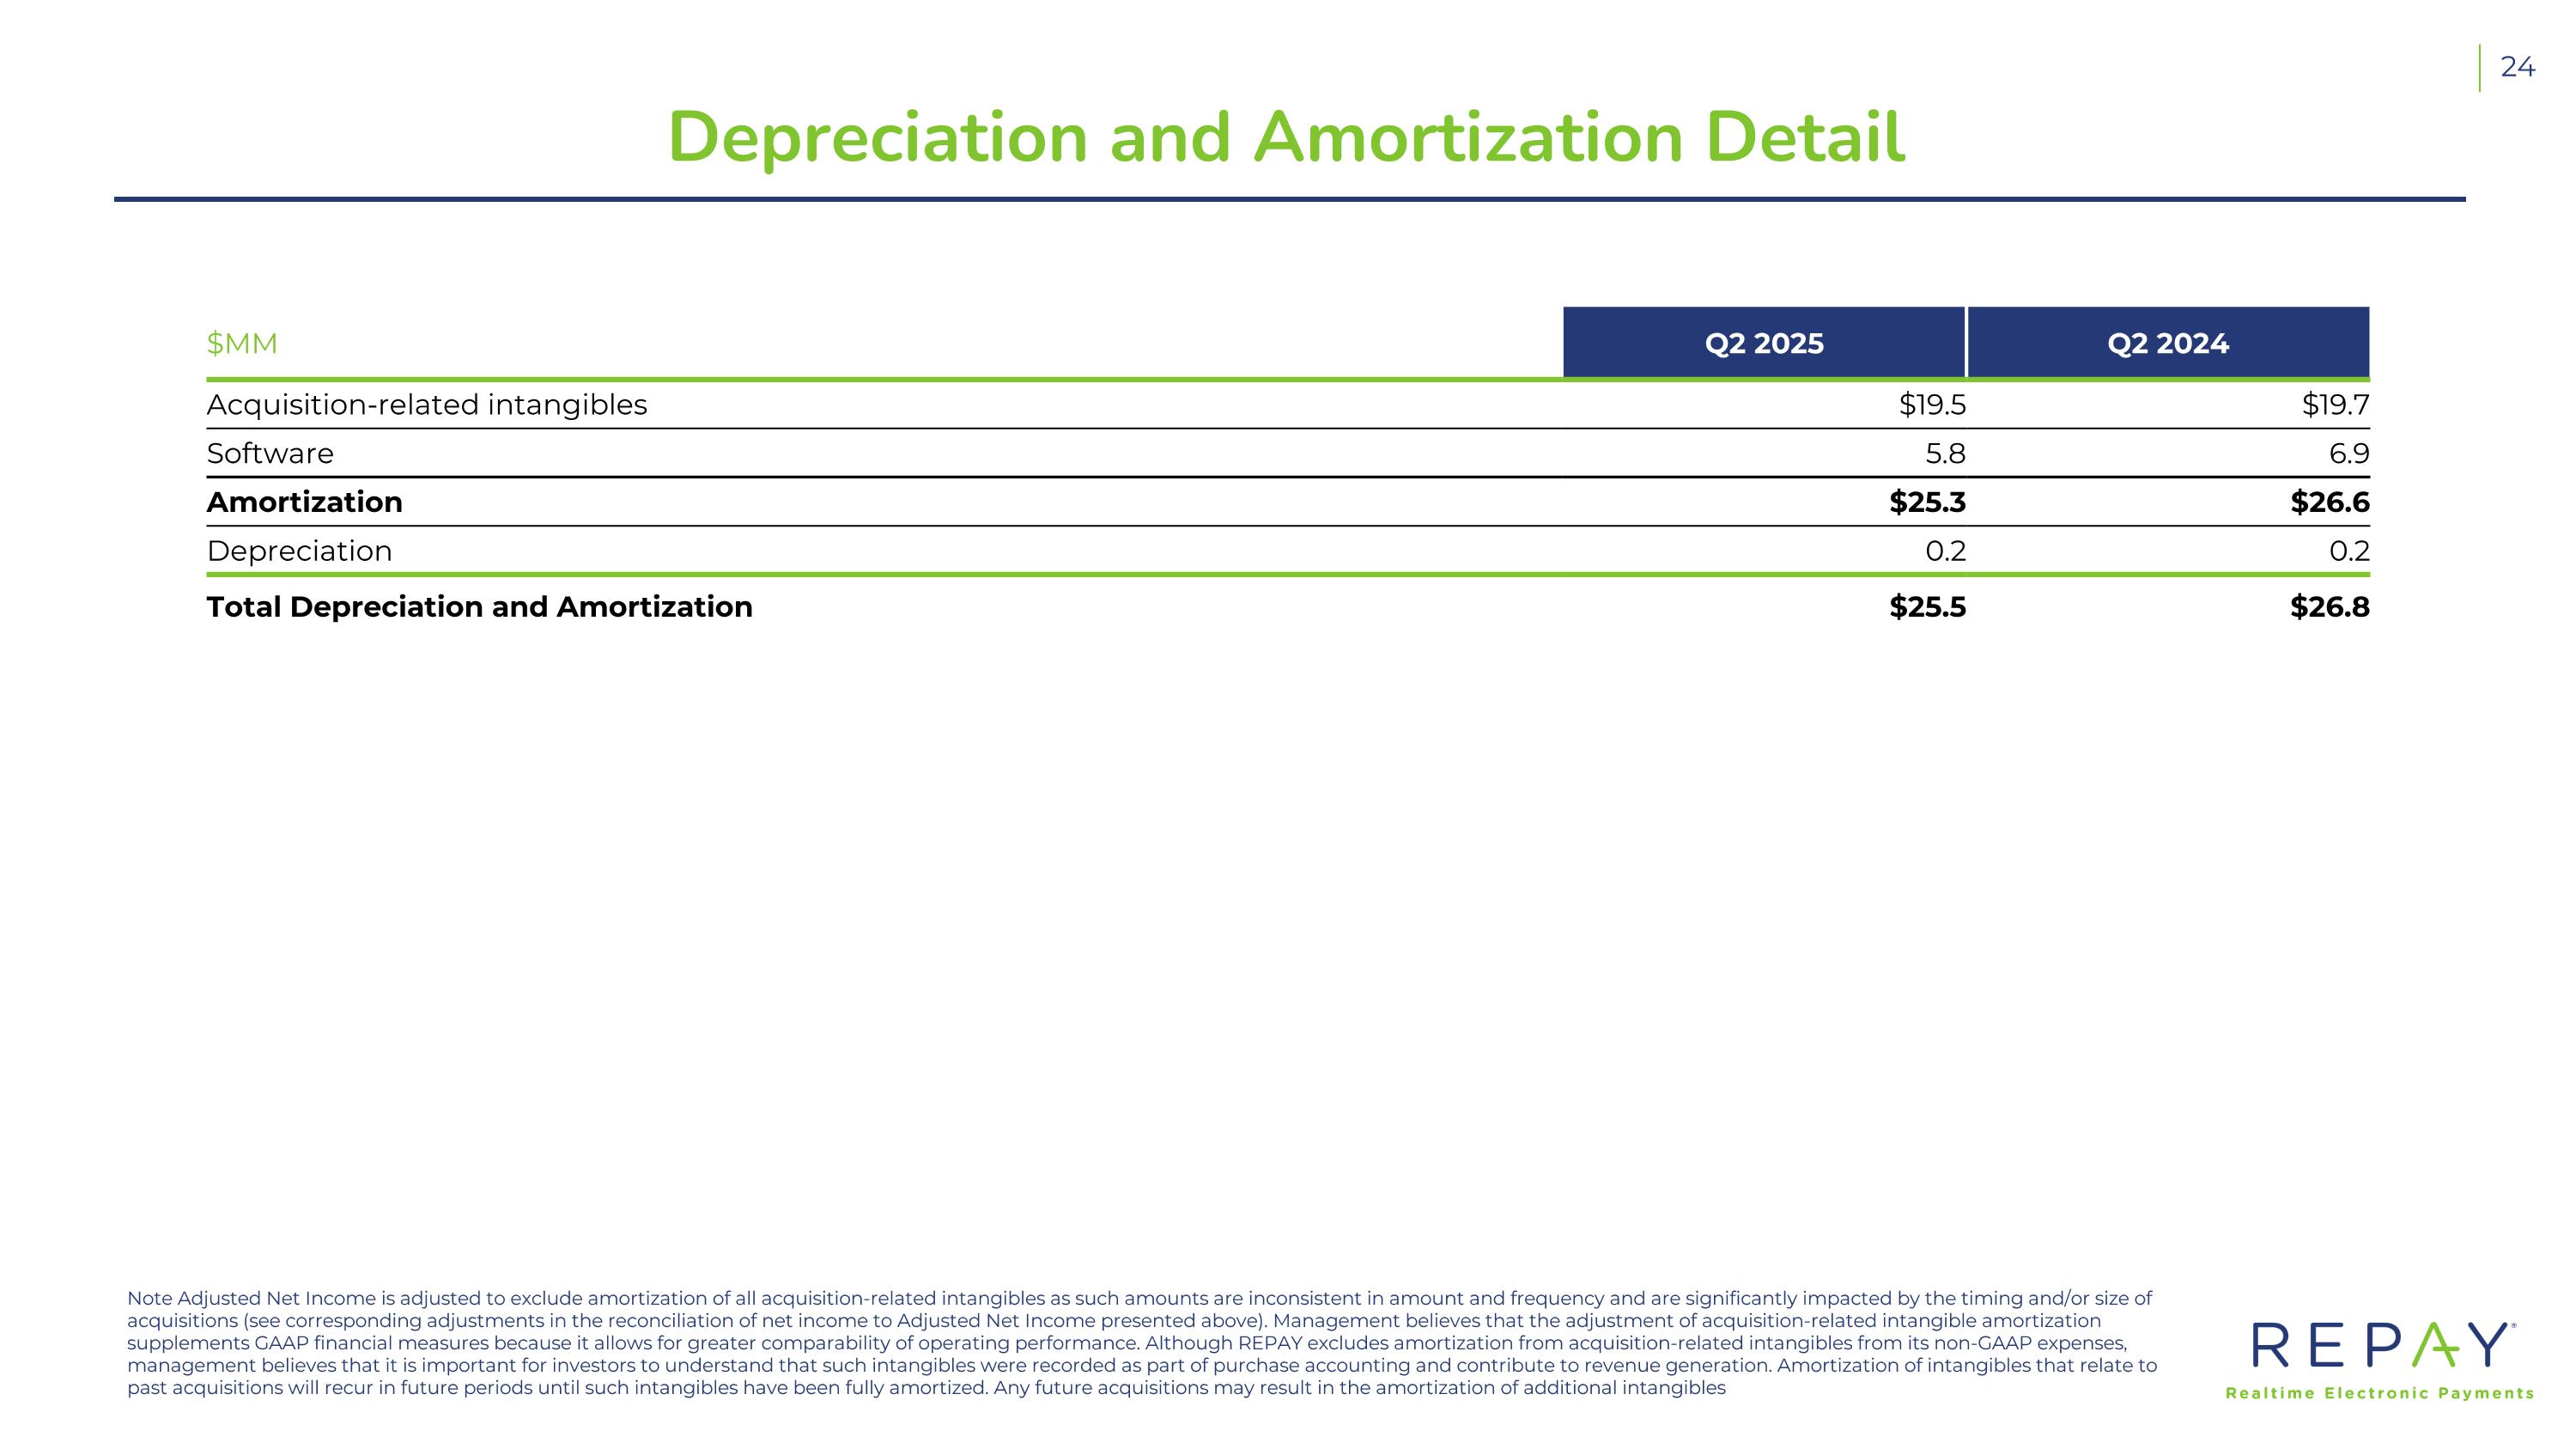
Depreciation and Amortization Detail Note Adjusted Net Income is adjusted to exclude amortization of all acquisition-related intangibles as such amounts are inconsistent in amount and frequency and are significantly impacted by the timing and/or size of acquisitions (see corresponding adjustments in the reconciliation of net income to Adjusted Net Income presented above). Management believes that the adjustment of acquisition-related intangible amortization supplements GAAP financial measures because it allows for greater comparability of operating performance. Although REPAY excludes amortization from acquisition-related intangibles from its non-GAAP expenses, management believes that it is important for investors to understand that such intangibles were recorded as part of purchase accounting and contribute to revenue generation. Amortization of intangibles that relate to past acquisitions will recur in future periods until such intangibles have been fully amortized. Any future acquisitions may result in the amortization of additional intangibles $MM Q2 2025 Q2 2024 Acquisition-related intangibles $19.5 $19.7 Software 5.8 6.9 Amortization $25.3 $26.6 Depreciation 0.2 0.2 Total Depreciation and Amortization $25.5 $26.8
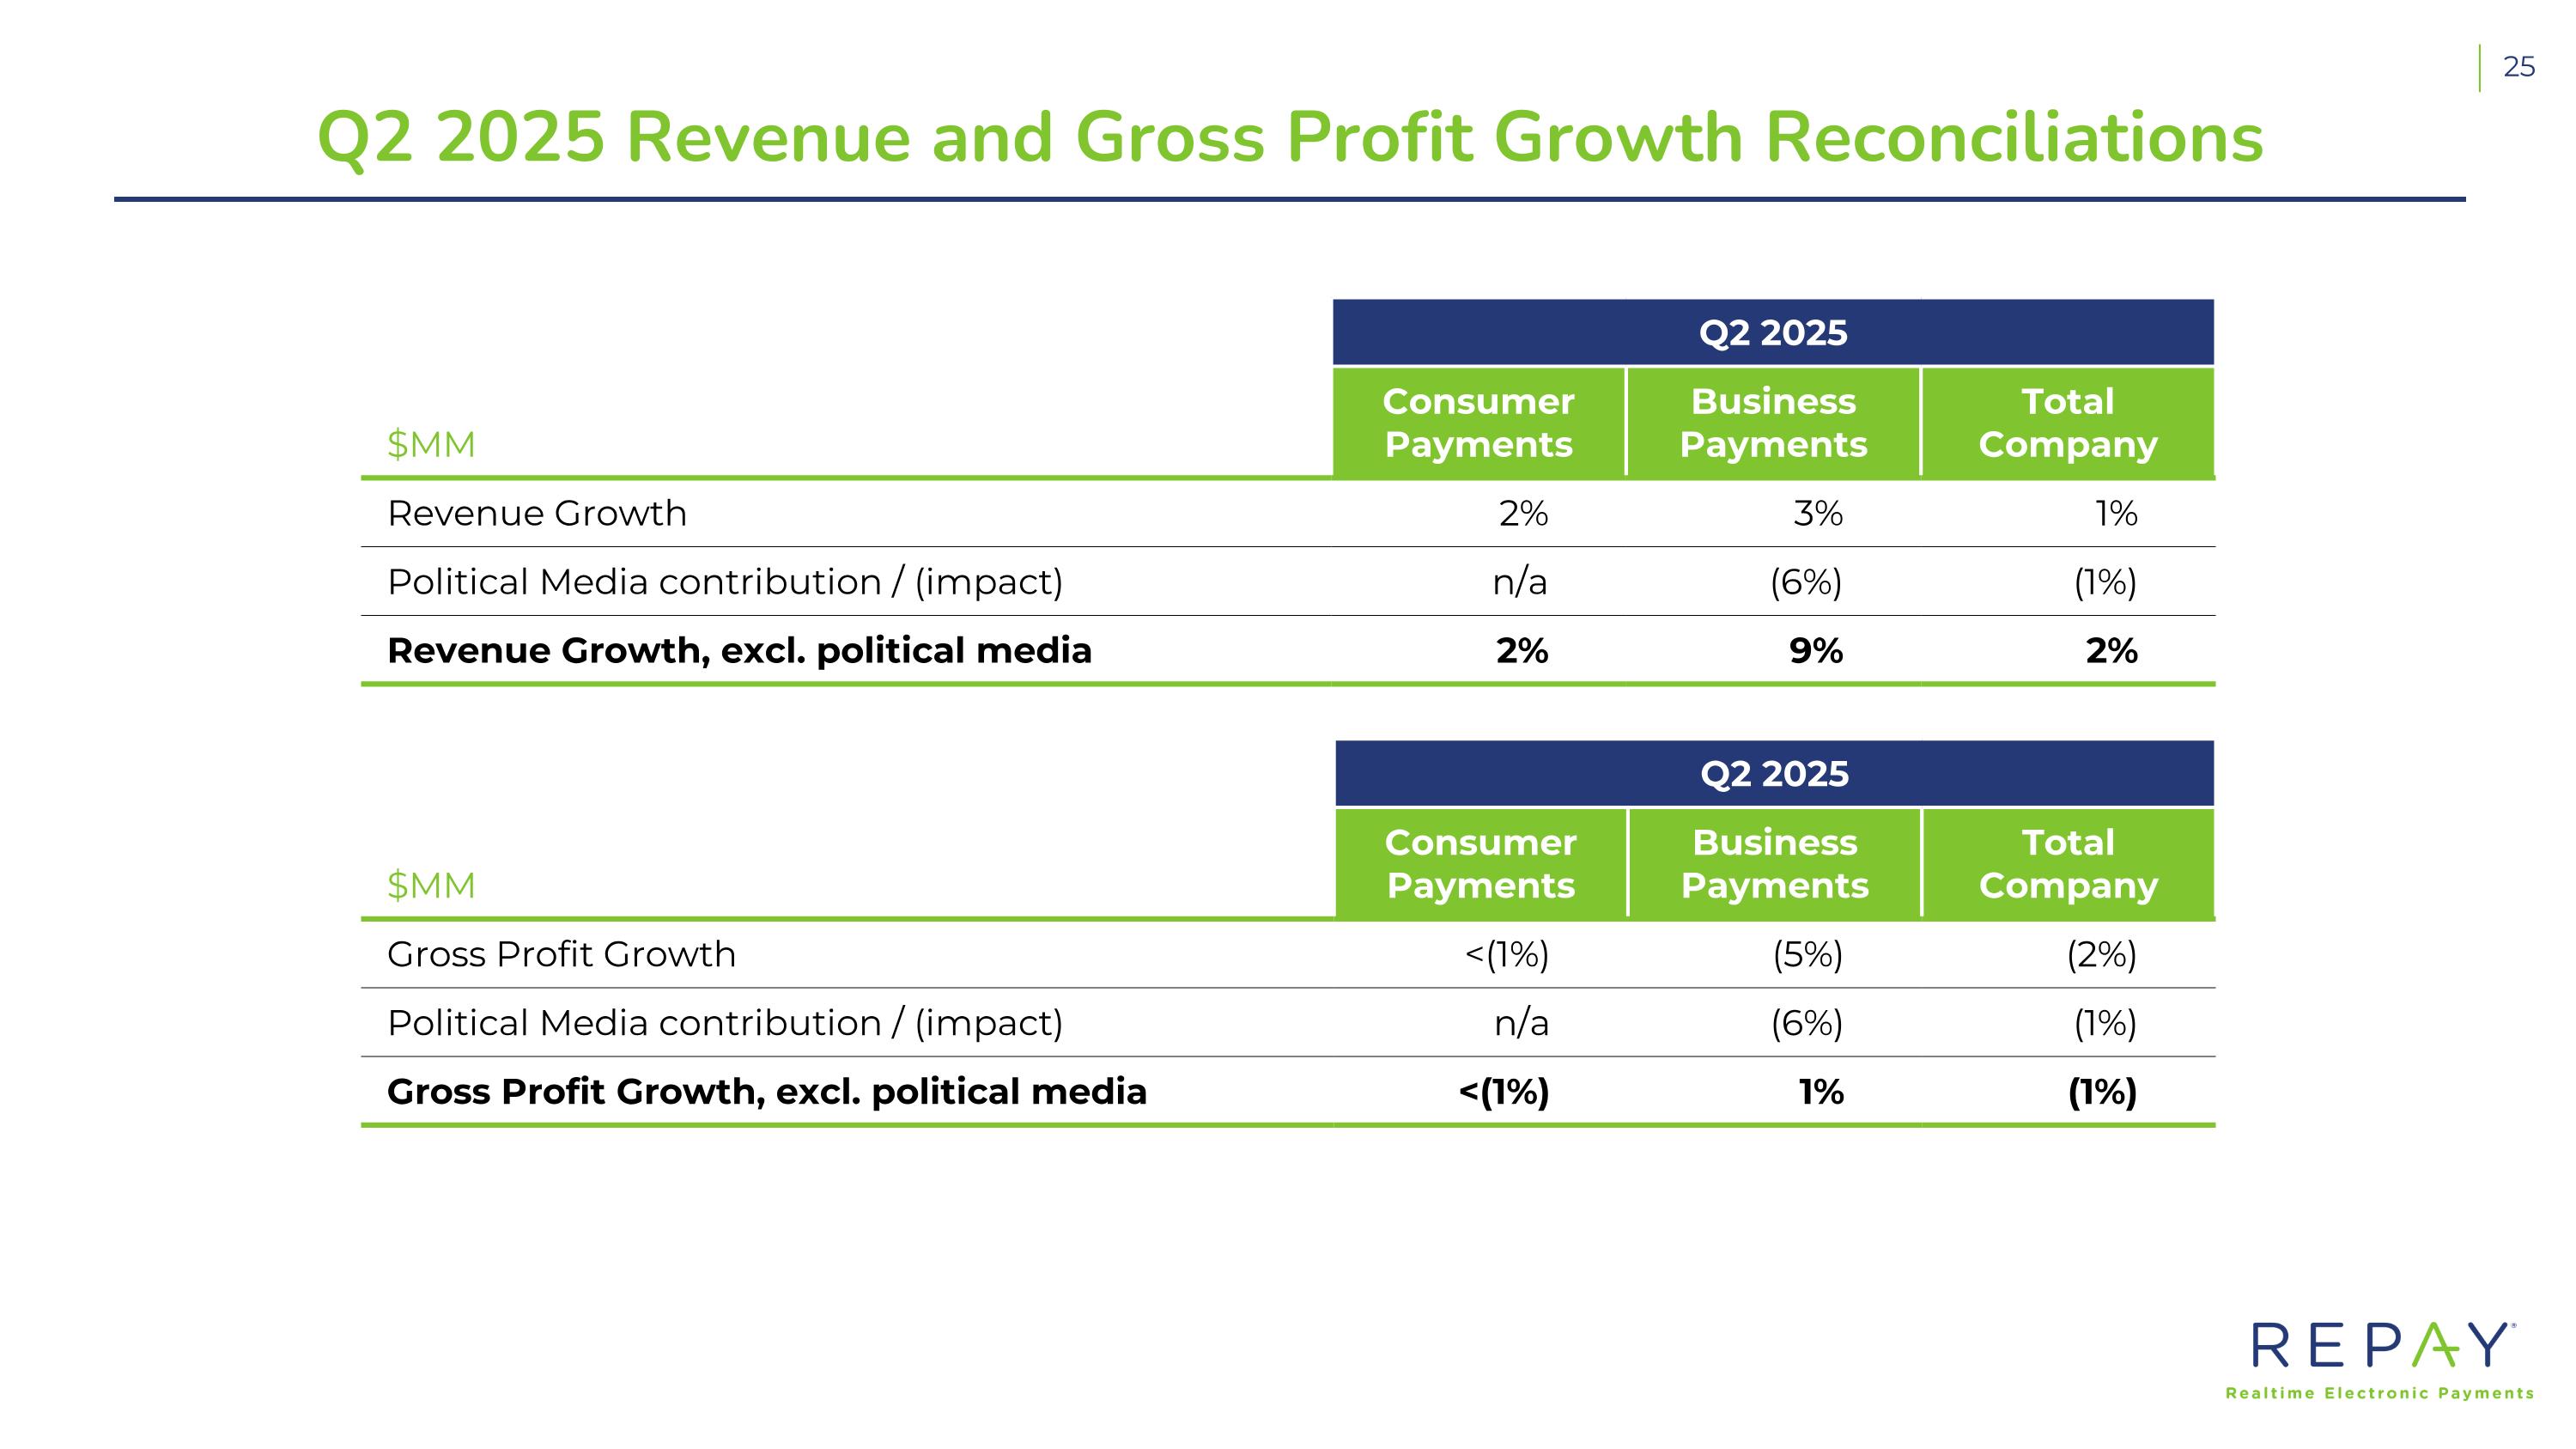
Q2 2025 Revenue and Gross Profit Growth Reconciliations Q2 2025 $MM Consumer Payments Business Payments Total Company Revenue Growth 2% 3% 1% Political Media contribution / (impact) n/a (6%) (1%) Revenue Growth, excl. political media 2% 9% 2% Q2 2025 $MM Consumer Payments Business Payments Total Company Gross Profit Growth <(1%) (5%) (2%) Political Media contribution / (impact) n/a (6%) (1%) Gross Profit Growth, excl. political media <(1%) 1% (1%)
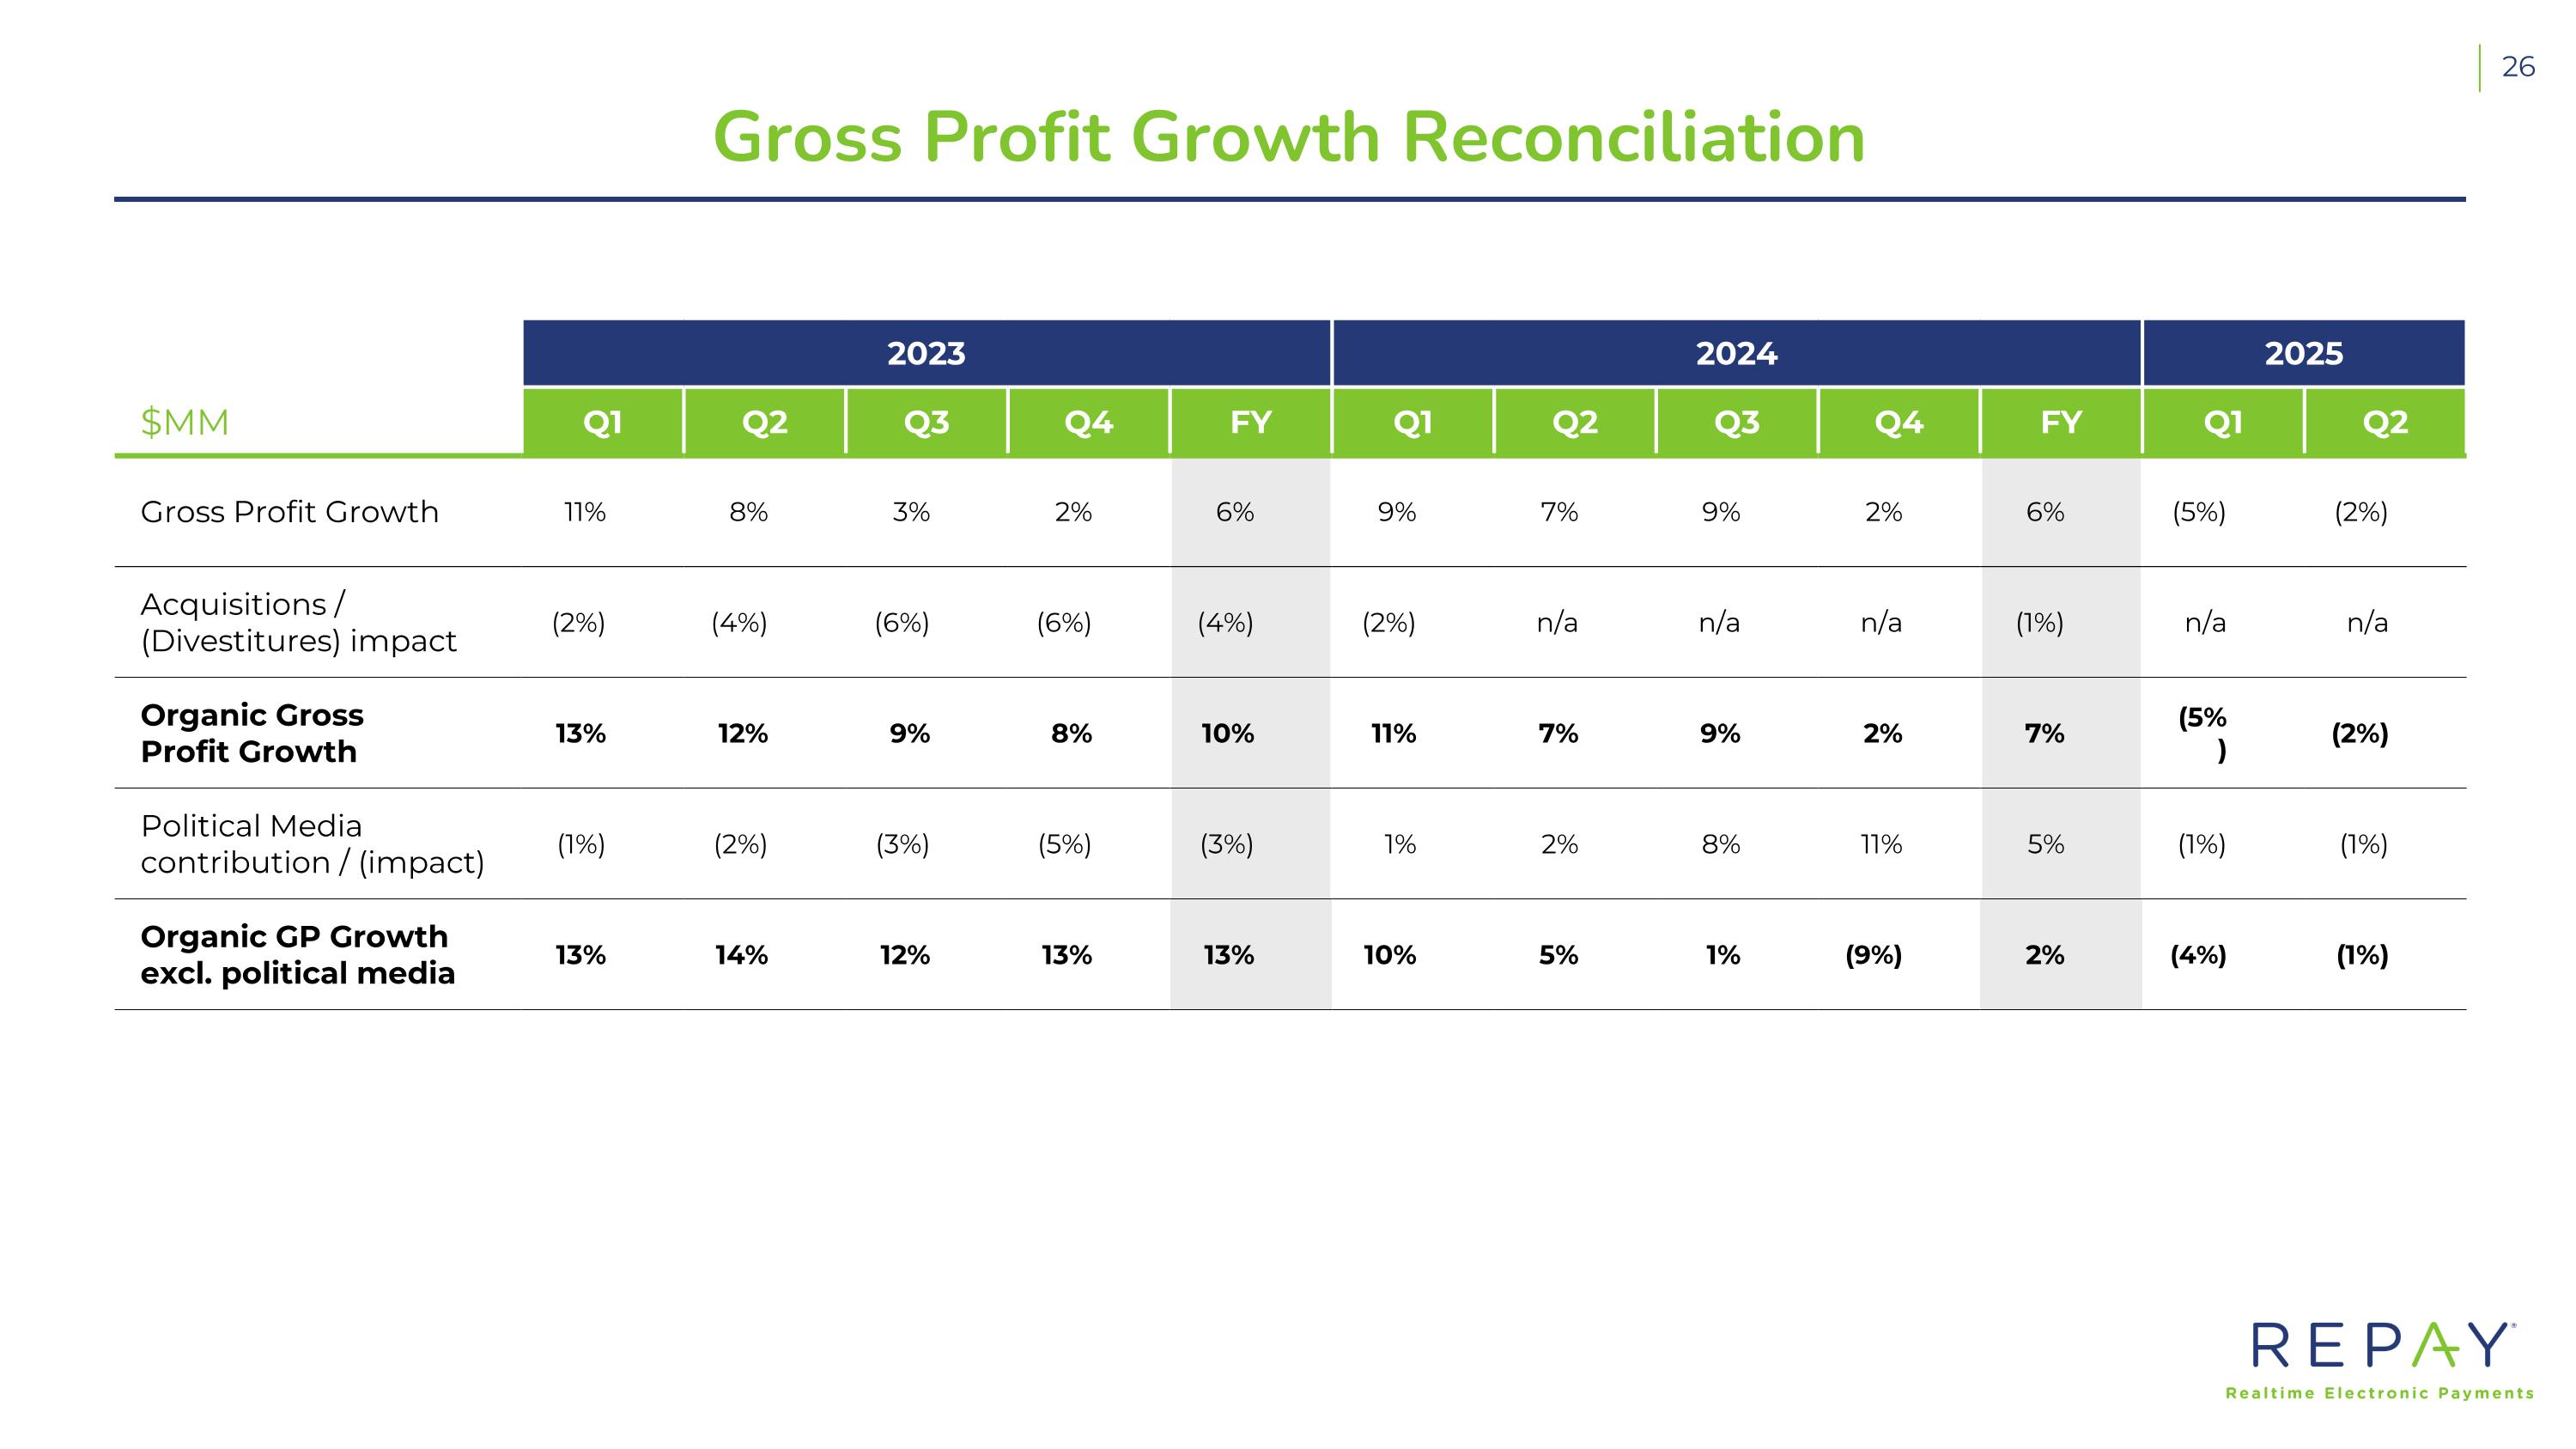
Gross Profit Growth Reconciliation 2023 2024 2025 $MM Q1 Q2 Q3 Q4 FY Q1 Q2 Q3 Q4 FY Q1 Q2 Gross Profit Growth 11% 8% 3% 2% 6% 9% 7% 9% 2% 6% (5%) (2%) Acquisitions / (Divestitures) impact (2%) (4%) (6%) (6%) (4%) (2%) n/a n/a n/a (1%) n/a n/a Organic Gross Profit Growth 13% 12% 9% 8% 10% 11% 7% 9% 2% 7% (5%) (2%) Political Media contribution / (impact) (1%) (2%) (3%) (5%) (3%) 1% 2% 8% 11% 5% (1%) (1%) Organic GP Growth excl. political media 13% 14% 12% 13% 13% 10% 5% 1% (9%) 2% (4%) (1%)
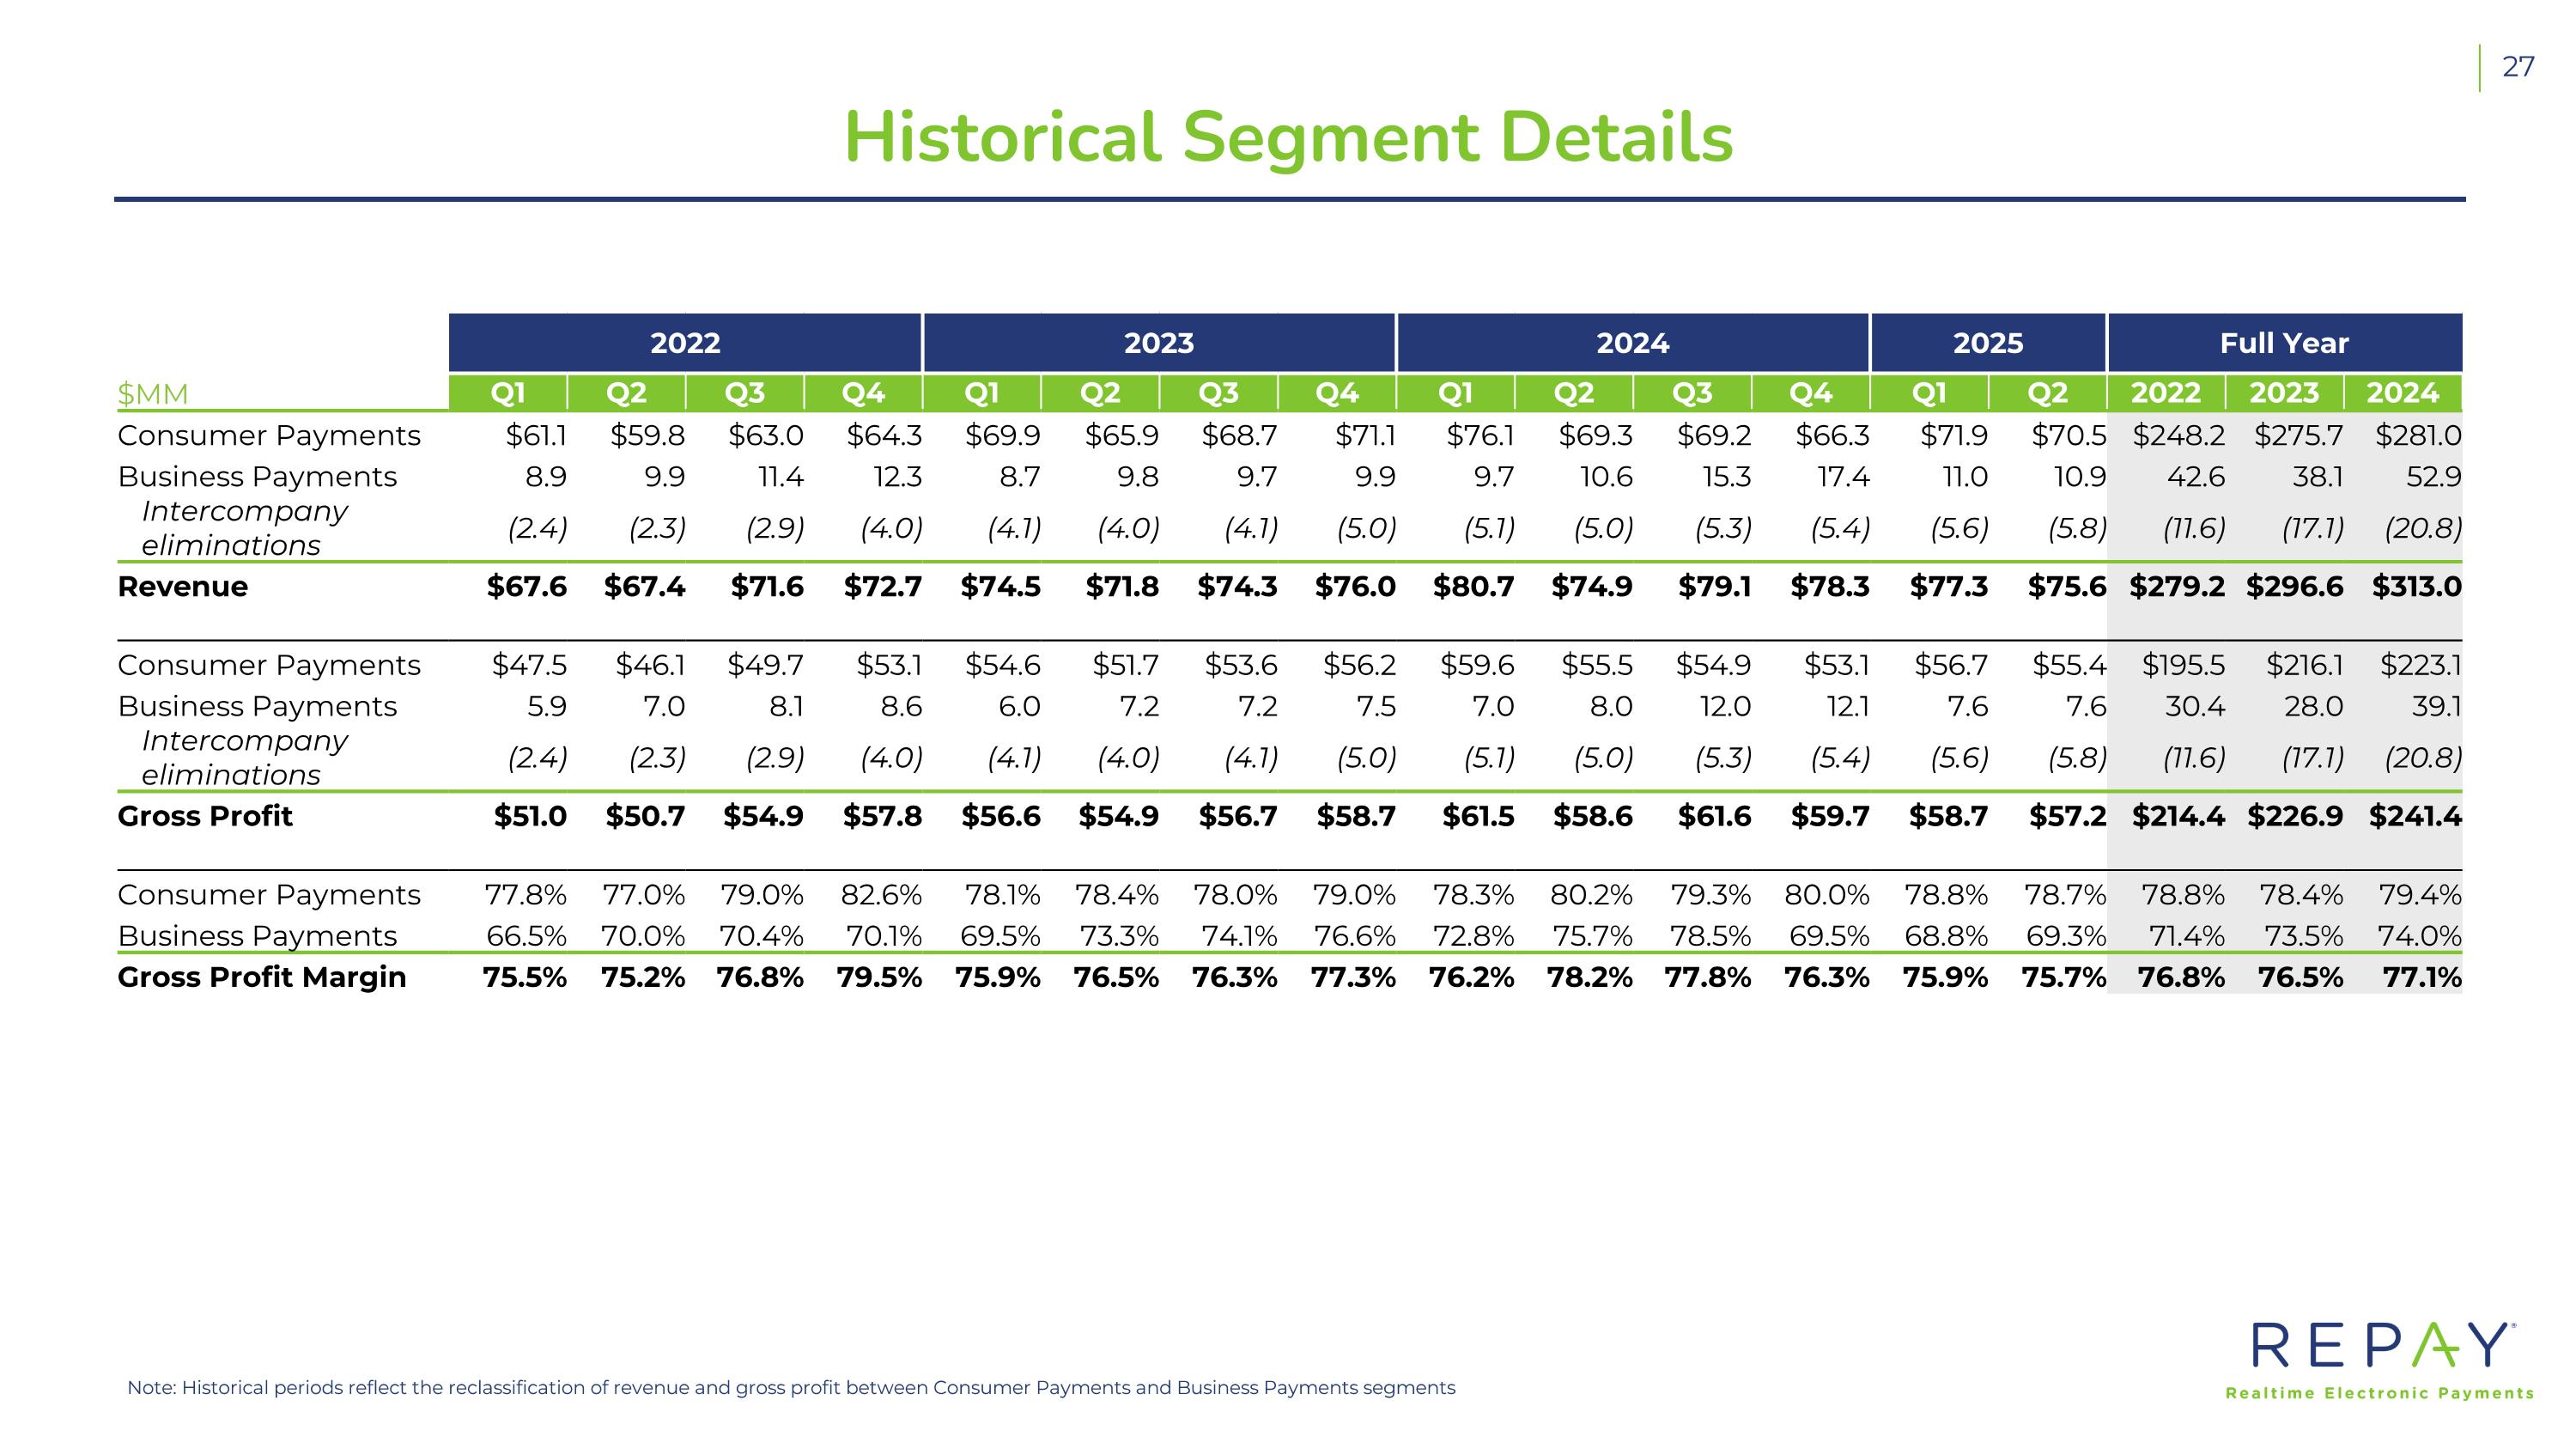
Historical Segment Details Note: Historical periods reflect the reclassification of revenue and gross profit between Consumer Payments and Business Payments segments 2022 2023 2024 2025 Full Year $MM Q1 Q2 Q3 Q4 Q1 Q2 Q3 Q4 Q1 Q2 Q3 Q4 Q1 Q2 2022 2023 2024 Consumer Payments $61.1 $59.8 $63.0 $64.3 $69.9 $65.9 $68.7 $71.1 $76.1 $69.3 $69.2 $66.3 $71.9 $70.5 $248.2 $275.7 $281.0 Business Payments 8.9 9.9 11.4 12.3 8.7 9.8 9.7 9.9 9.7 10.6 15.3 17.4 11.0 10.9 42.6 38.1 52.9 Intercompany eliminations (2.4) (2.3) (2.9) (4.0) (4.1) (4.0) (4.1) (5.0) (5.1) (5.0) (5.3) (5.4) (5.6) (5.8) (11.6) (17.1) (20.8) Revenue $67.6 $67.4 $71.6 $72.7 $74.5 $71.8 $74.3 $76.0 $80.7 $74.9 $79.1 $78.3 $77.3 $75.6 $279.2 $296.6 $313.0 Consumer Payments $47.5 $46.1 $49.7 $53.1 $54.6 $51.7 $53.6 $56.2 $59.6 $55.5 $54.9 $53.1 $56.7 $55.4 $195.5 $216.1 $223.1 Business Payments 5.9 7.0 8.1 8.6 6.0 7.2 7.2 7.5 7.0 8.0 12.0 12.1 7.6 7.6 30.4 28.0 39.1 Intercompany eliminations (2.4) (2.3) (2.9) (4.0) (4.1) (4.0) (4.1) (5.0) (5.1) (5.0) (5.3) (5.4) (5.6) (5.8) (11.6) (17.1) (20.8) Gross Profit $51.0 $50.7 $54.9 $57.8 $56.6 $54.9 $56.7 $58.7 $61.5 $58.6 $61.6 $59.7 $58.7 $57.2 $214.4 $226.9 $241.4 Consumer Payments 77.8% 77.0% 79.0% 82.6% 78.1% 78.4% 78.0% 79.0% 78.3% 80.2% 79.3% 80.0% 78.8% 78.7% 78.8% 78.4% 79.4% Business Payments 66.5% 70.0% 70.4% 70.1% 69.5% 73.3% 74.1% 76.6% 72.8% 75.7% 78.5% 69.5% 68.8% 69.3% 71.4% 73.5% 74.0% Gross Profit Margin 75.5% 75.2% 76.8% 79.5% 75.9% 76.5% 76.3% 77.3% 76.2% 78.2% 77.8% 76.3% 75.9% 75.7% 76.8% 76.5% 77.1%

Investor Presentation Exhibit 99.3 August 2025
Disclaimer On July 11, 2019 (the “Closing Date”), Thunder Bridge Acquisition Ltd. (“Thunder Bridge”) and Hawk Parent Holdings LLC (“Hawk Parent”) completed a business combination (the “Business Combination”) under which Thunder Bridge acquired Hawk Parent, upon which Thunder Bridge changed its name to Repay Holdings Corporation (“REPAY” or the “Company”). The Company’s filings with the Securities and Exchange Commission (“SEC”), which you may obtain for free at the SEC’s website at http://www.sec.gov, discuss some of the important risk factors that may affect REPAY’s business, results of operations and financial condition. Forward-Looking Statements This presentation (the “Presentation”) contains “forward-looking statements” within the meaning of the Private Securities Litigation Reform Act of 1995. Such statements include, but are not limited to, statements about future financial and operating results, REPAY’s plans, objectives, expectations and intentions with respect to future operations, products and services; and other statements identified by words such as “will likely result,” “are expected to,” “will continue,” “is anticipated,” “estimated,” “believe,” “intend,” “plan,” “projection,” “outlook” or words of similar meaning. These forward-looking statements include, but are not limited to, expected demand on REPAY’s product offering, including further implementation of electronic payment options and statements regarding REPAY’s market and growth opportunities, and our business strategy and the plans and objectives of management for future operations. Such forward-looking statements are based upon the current beliefs and expectations of REPAY’s management and are inherently subject to significant business, economic and competitive uncertainties and contingencies, many of which are difficult to predict and generally beyond our control. In addition to factors previously disclosed in REPAY’s reports filed with the SEC, including our Annual Report on Form 10-K for the year ended December 31, 2024 and subsequent Form 10-Qs, the following factors, among others, could cause actual results and the timing of events to differ materially from the anticipated results or other expectations expressed in the forward-looking statements: exposure to economic conditions and political risk affecting the consumer loan market, the receivables management industry and consumer and commercial spending, including bank failures or other adverse events affecting financial institutions, inflationary pressures, general economic slowdown or recession; changes in the payment processing market in which REPAY competes, including with respect to its competitive landscape, technology evolution or regulatory changes; changes in the vertical markets that REPAY targets, including the regulatory environment applicable to REPAY’s clients; the ability to retain, develop and hire key personnel; risks relating to REPAY’s relationships within the payment ecosystem; risk that REPAY may not be able to execute its capital allocation and growth strategies, including identifying and executing acquisitions; risks relating to data security; changes in accounting policies applicable to REPAY; and the risk that REPAY may not be able to maintain effective internal controls. Actual results, performance or achievements may differ materially, and potentially adversely, from any projections and forward-looking statements and the assumptions on which those forward-looking statements are based. There can be no assurance that the data contained herein is reflective of future performance to any degree. You are cautioned not to place undue reliance on forward-looking statements as a predictor of future performance. All information set forth herein speaks only as of the date hereof in the case of information about us or the date of such information in the case of information from persons other than us, and we disclaim any intention or obligation to update any forward-looking statements as a result of developments occurring after the date of this communication. Forecasts and estimates regarding our industry and end markets are based on sources we believe to be reliable, however there can be no assurance these forecasts and estimates will prove accurate in whole or in part. Projected and estimated numbers are used for illustrative purpose only, are not forecasts and may not reflect actual results. Industry and Market Data The information contained herein also includes information provided by third parties, such as market research firms. Neither of REPAY nor its affiliates and any third parties that provide information to REPAY, such as market research firms, guarantee the accuracy, completeness, timeliness or availability of any information. Neither REPAY nor its affiliates and any third parties that provide information to REPAY, such as market research firms, are responsible for any errors or omissions (negligent or otherwise), regardless of the cause, or the results obtained from the use of such content. Neither REPAY nor its affiliates give any express or implied warranties, including, but not limited to, any warranties of merchantability or fitness for a particular purpose or use, and they expressly disclaim any responsibility or liability for direct, indirect, incidental, exemplary, compensatory, punitive, special or consequential damages, costs, expenses, legal fees or losses (including lost income or profits and opportunity costs) in connection with the use of the information herein. Non-GAAP Financial Measures This Presentation includes certain non-GAAP financial measures that REPAY’s management uses to evaluate its operating business, measure its performance and make strategic decisions. Adjusted EBITDA is a non-GAAP financial measure that represents net income prior to interest expense, tax expense, depreciation and amortization, as adjusted to add back certain charges deemed not to be part of normal operating expenses, non-cash and/or non-recurring charges, such as non-cash impairment loss, loss on extinguishment of debt, loss on termination of interest rate hedge, non-cash change in fair value of contingent consideration, non-cash change in fair value of assets and liabilities, non-cash change in fair value of warrant liabilities; share-based compensation charges, transaction expenses, restructuring and other strategic initiative costs and other non-recurring charges. Free Cash Flow is a non-GAAP financial measure that represents net cash flow provided by operating activities less total capital expenditures. Free Cash Flow Conversion represents Free Cash Flow divided by Adjusted EBITDA. REPAY believes that each of the non-GAAP financial measures referenced in this paragraph provide useful information to investors and others in understanding and evaluating its operating results in the same manner as management. However, these non-GAAP financial measures are not financial measures calculated in accordance with GAAP and should not be considered as a substitute for net income, operating profit, or any other operating performance measure calculated in accordance with GAAP. Using these non-GAAP financial measures to analyze REPAY’s business has material limitations because the calculations are based on the subjective determination of management regarding the nature and classification of events and circumstances that investors may find significant. In addition, although other companies in REPAY’s industry may report measures titled with the same or similar descriptions, such non-GAAP financial measures may be calculated differently from how REPAY calculates its non-GAAP financial measures, which reduces their overall usefulness as comparative measures. Because of these limitations, you should consider each of the non-GAAP financial measures referenced in this paragraph alongside other financial performance measures, including net income and REPAY’s other financial results presented in accordance with GAAP.
2 Agenda Introduction to REPAY REPAY Investment Highlights REPAY Financial Overview 1 2 3
1 Introduction to REPAY
REPAY’s proprietary, integrated payment technology platform reduces the complexity of electronic payments for clients, while enhancing the overall experience for consumers and businesses REPAY provides integrated payment processing solutions to verticals that have specific transaction processing needs

AUTO FINANCE PERSONAL FINANCE AR AUTOMATION CREDIT UNIONS HEALTHCARE MORTGAGE ARM AP AUTOMATION Your Industry. Our Expertise. CONSUMER PAYMENTS BUSINESS PAYMENTS
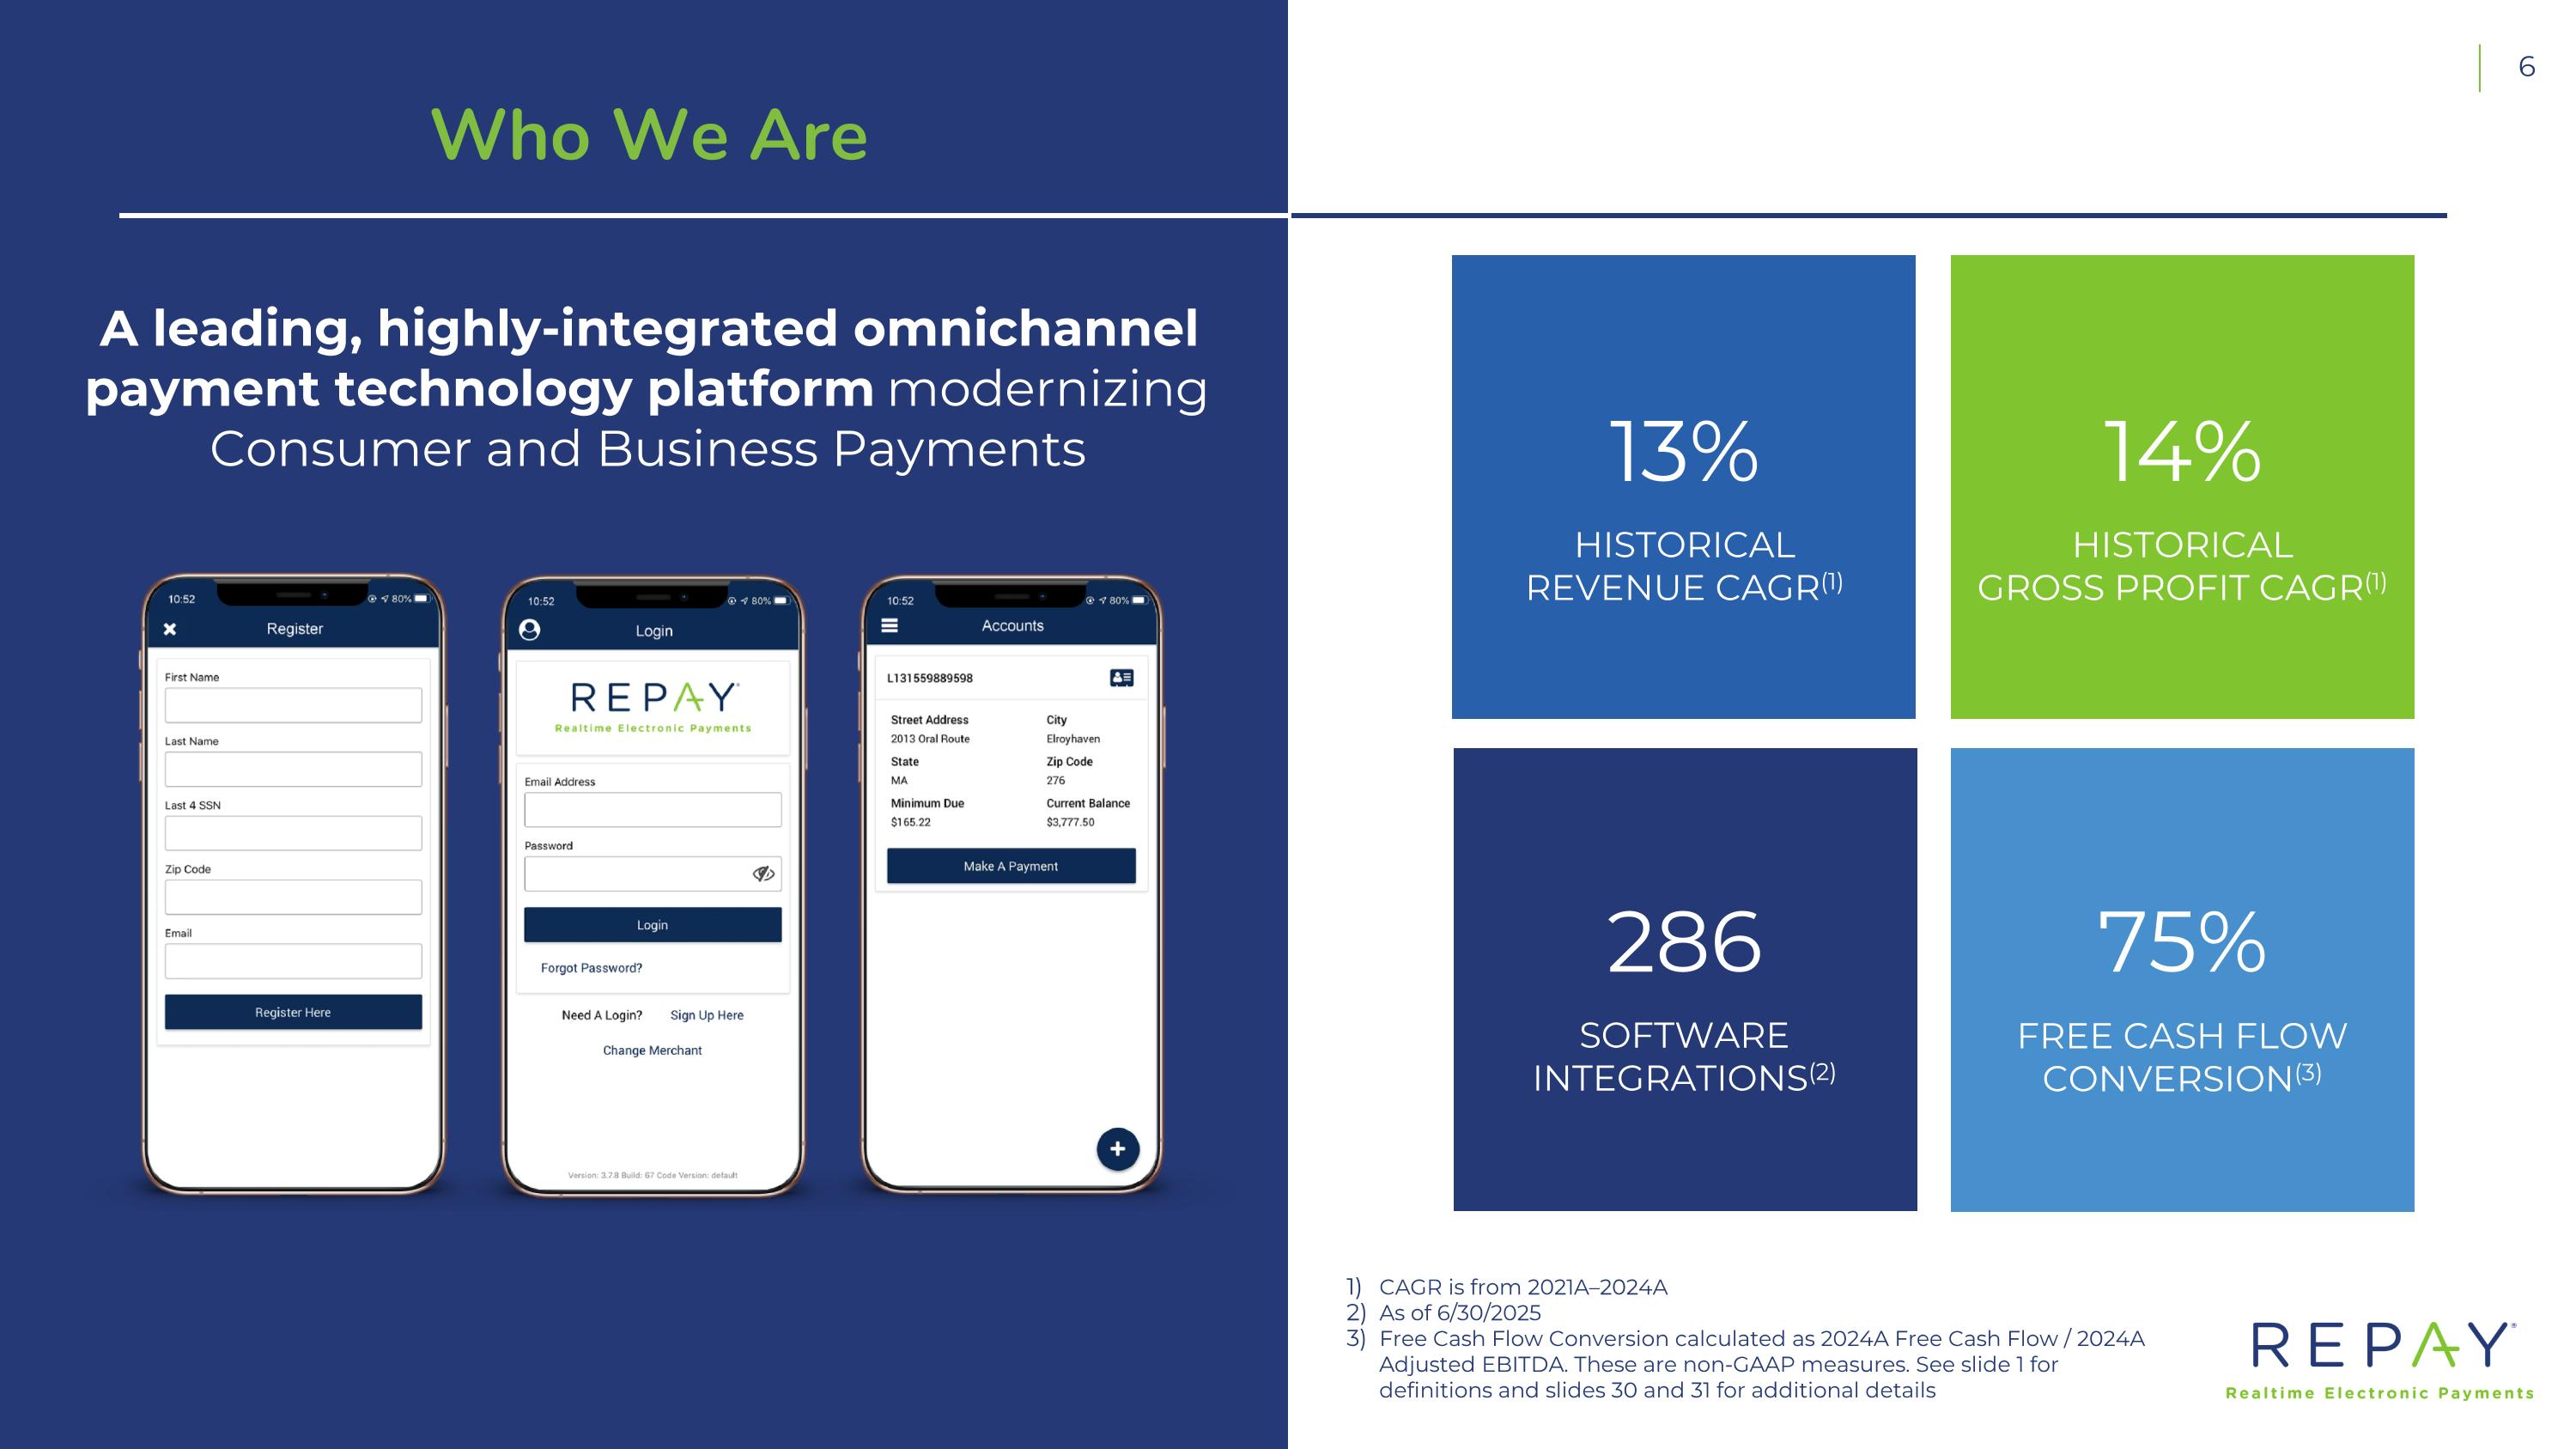
Who We Are A leading, highly-integrated omnichannel payment technology platform modernizing Consumer and Business Payments CAGR is from 2021A–2024A As of 6/30/2025 Free Cash Flow Conversion calculated as 2024A Free Cash Flow / 2024A Adjusted EBITDA. These are non-GAAP measures. See slide 1 for definitions and slides 30 and 31 for additional details HISTORICAL REVENUE CAGR(1) HISTORICAL GROSS PROFIT CAGR(1) SOFTWARE INTEGRATIONS(2) 13% 14% 286 75% FREE CASH FLOW CONVERSION(3)
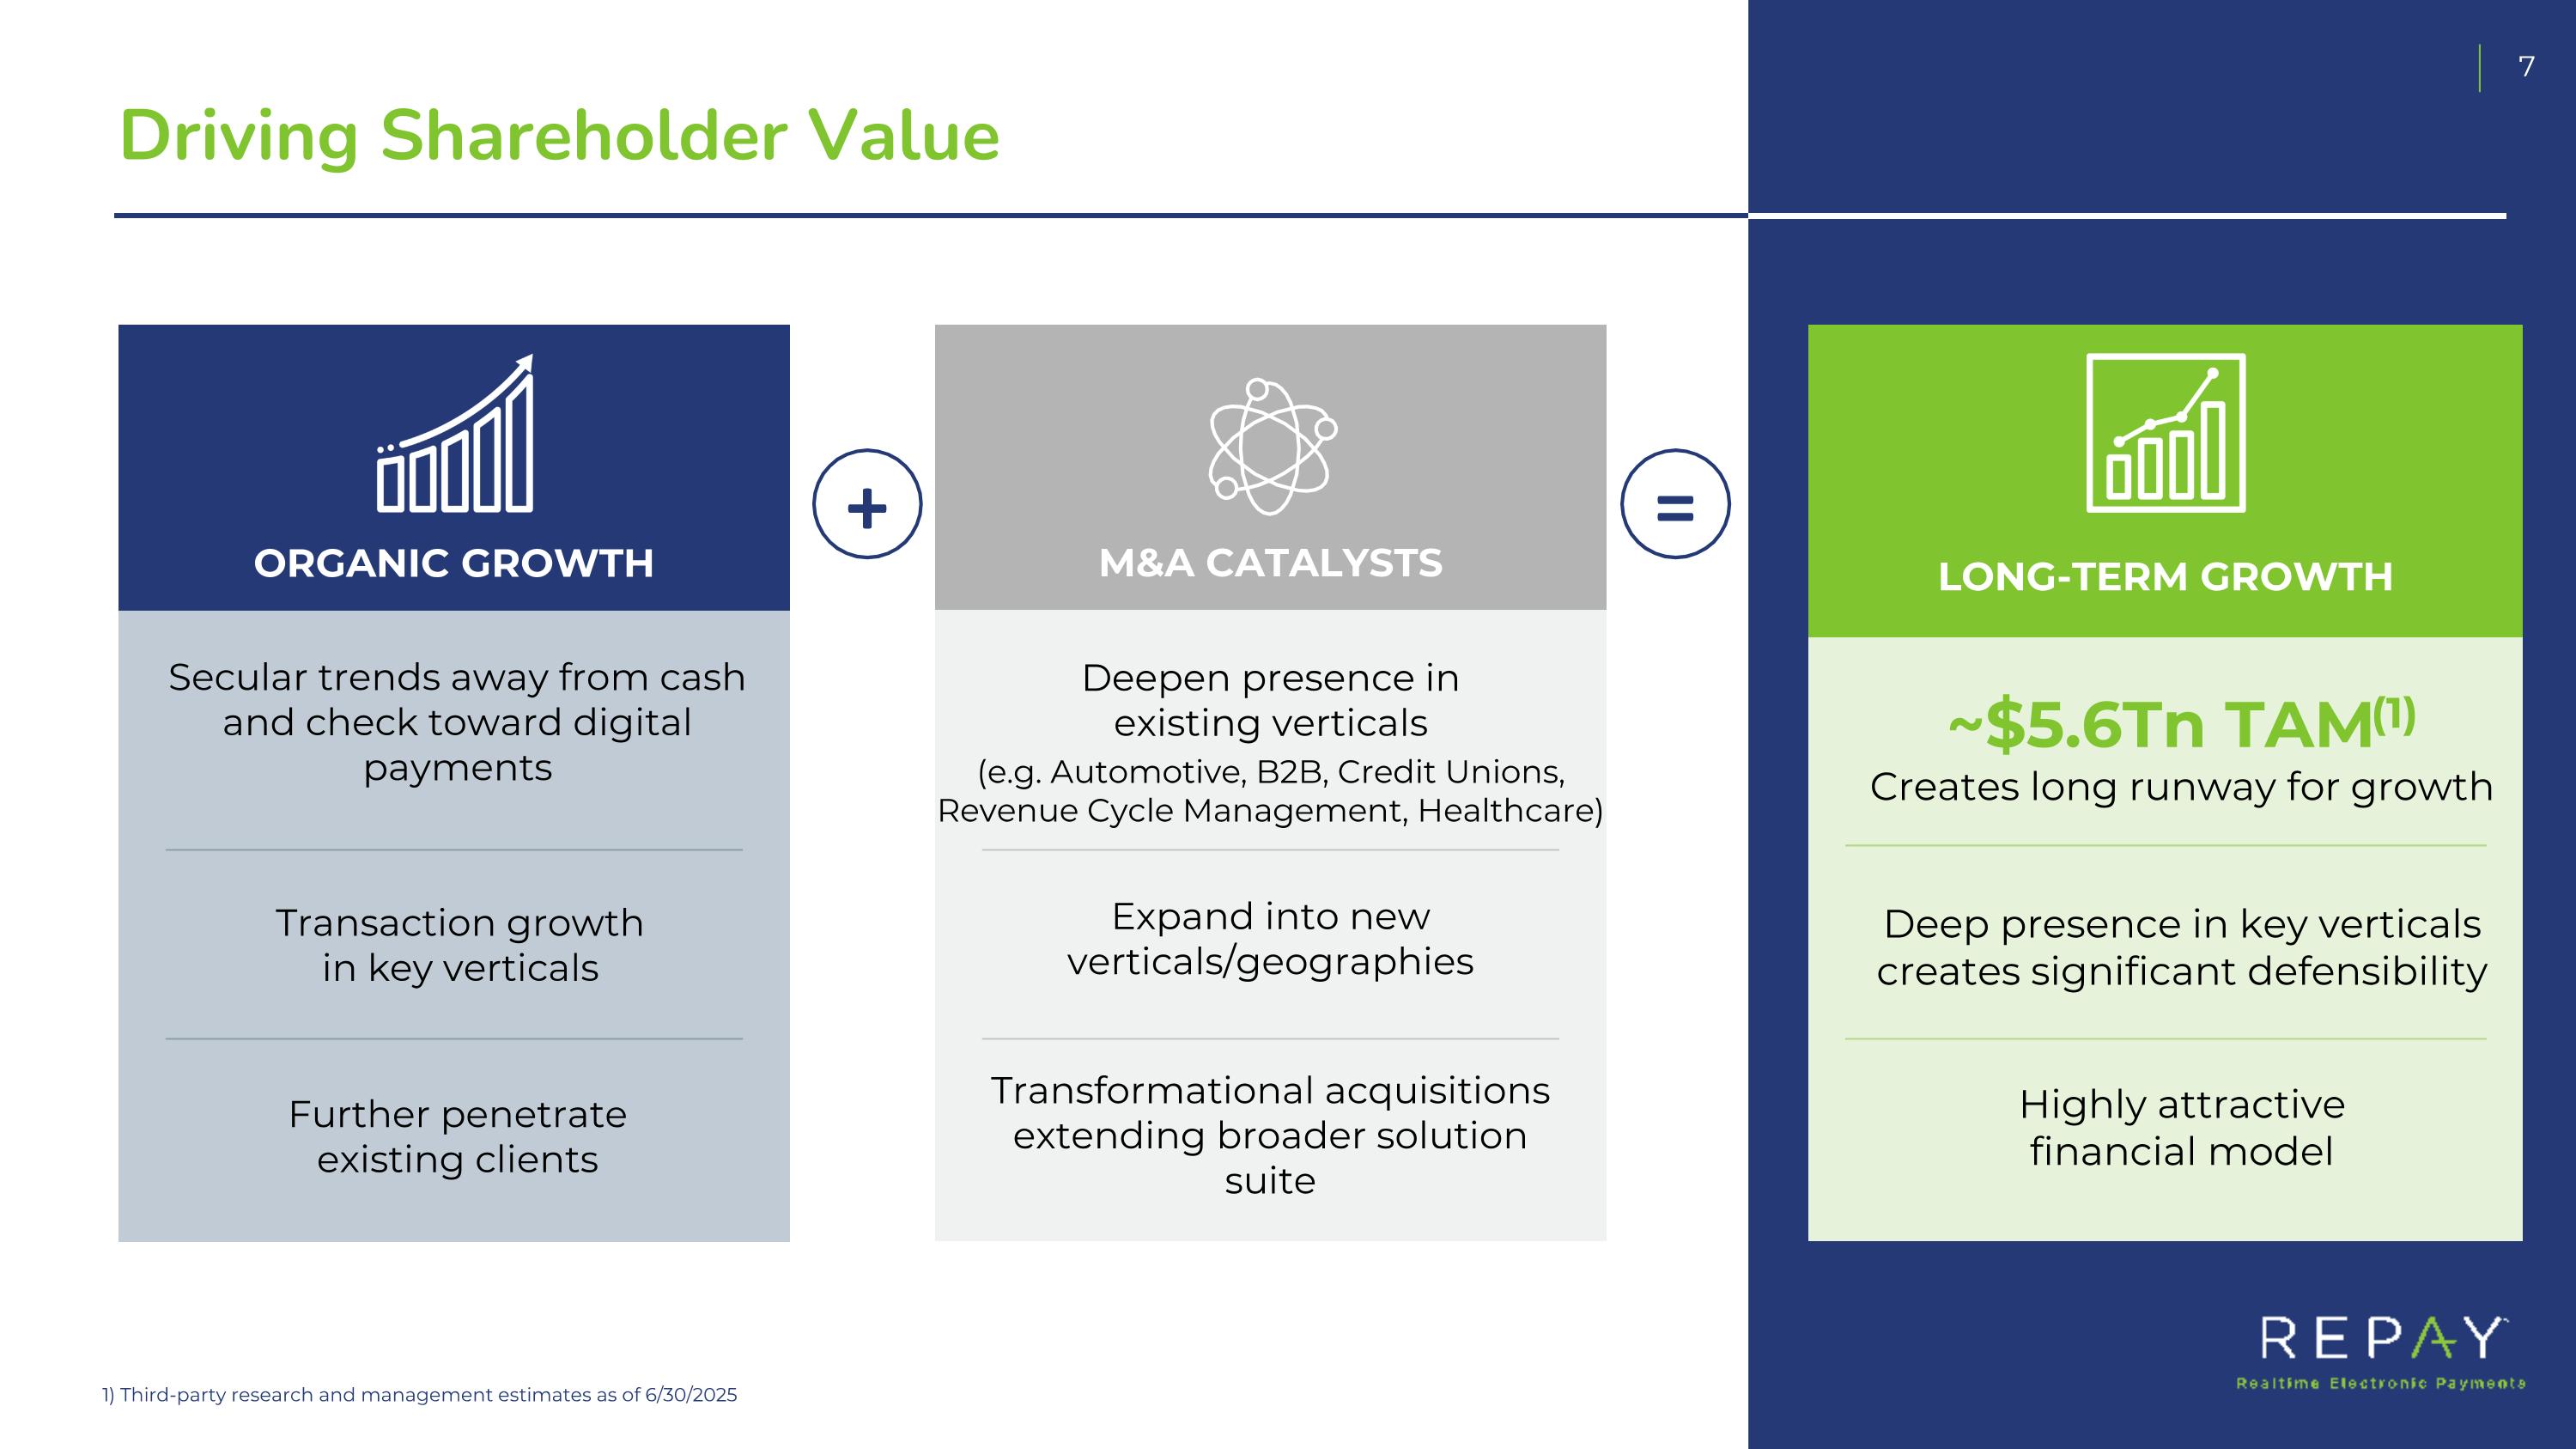
LONG-TERM GROWTH ORGANIC GROWTH M&A CATALYSTS Deepen presence in existing verticals (e.g. Automotive, B2B, Credit Unions, Revenue Cycle Management, Healthcare) Expand into new verticals/geographies Transformational acquisitions extending broader solution suite Driving Shareholder Value 1) Third-party research and management estimates as of 6/30/2025 Secular trends away from cash and check toward digital payments Transaction growth in key verticals Further penetrate existing clients ~$5.6Tn TAM(1) Creates long runway for growth Deep presence in key verticals creates significant defensibility Highly attractive financial model = +
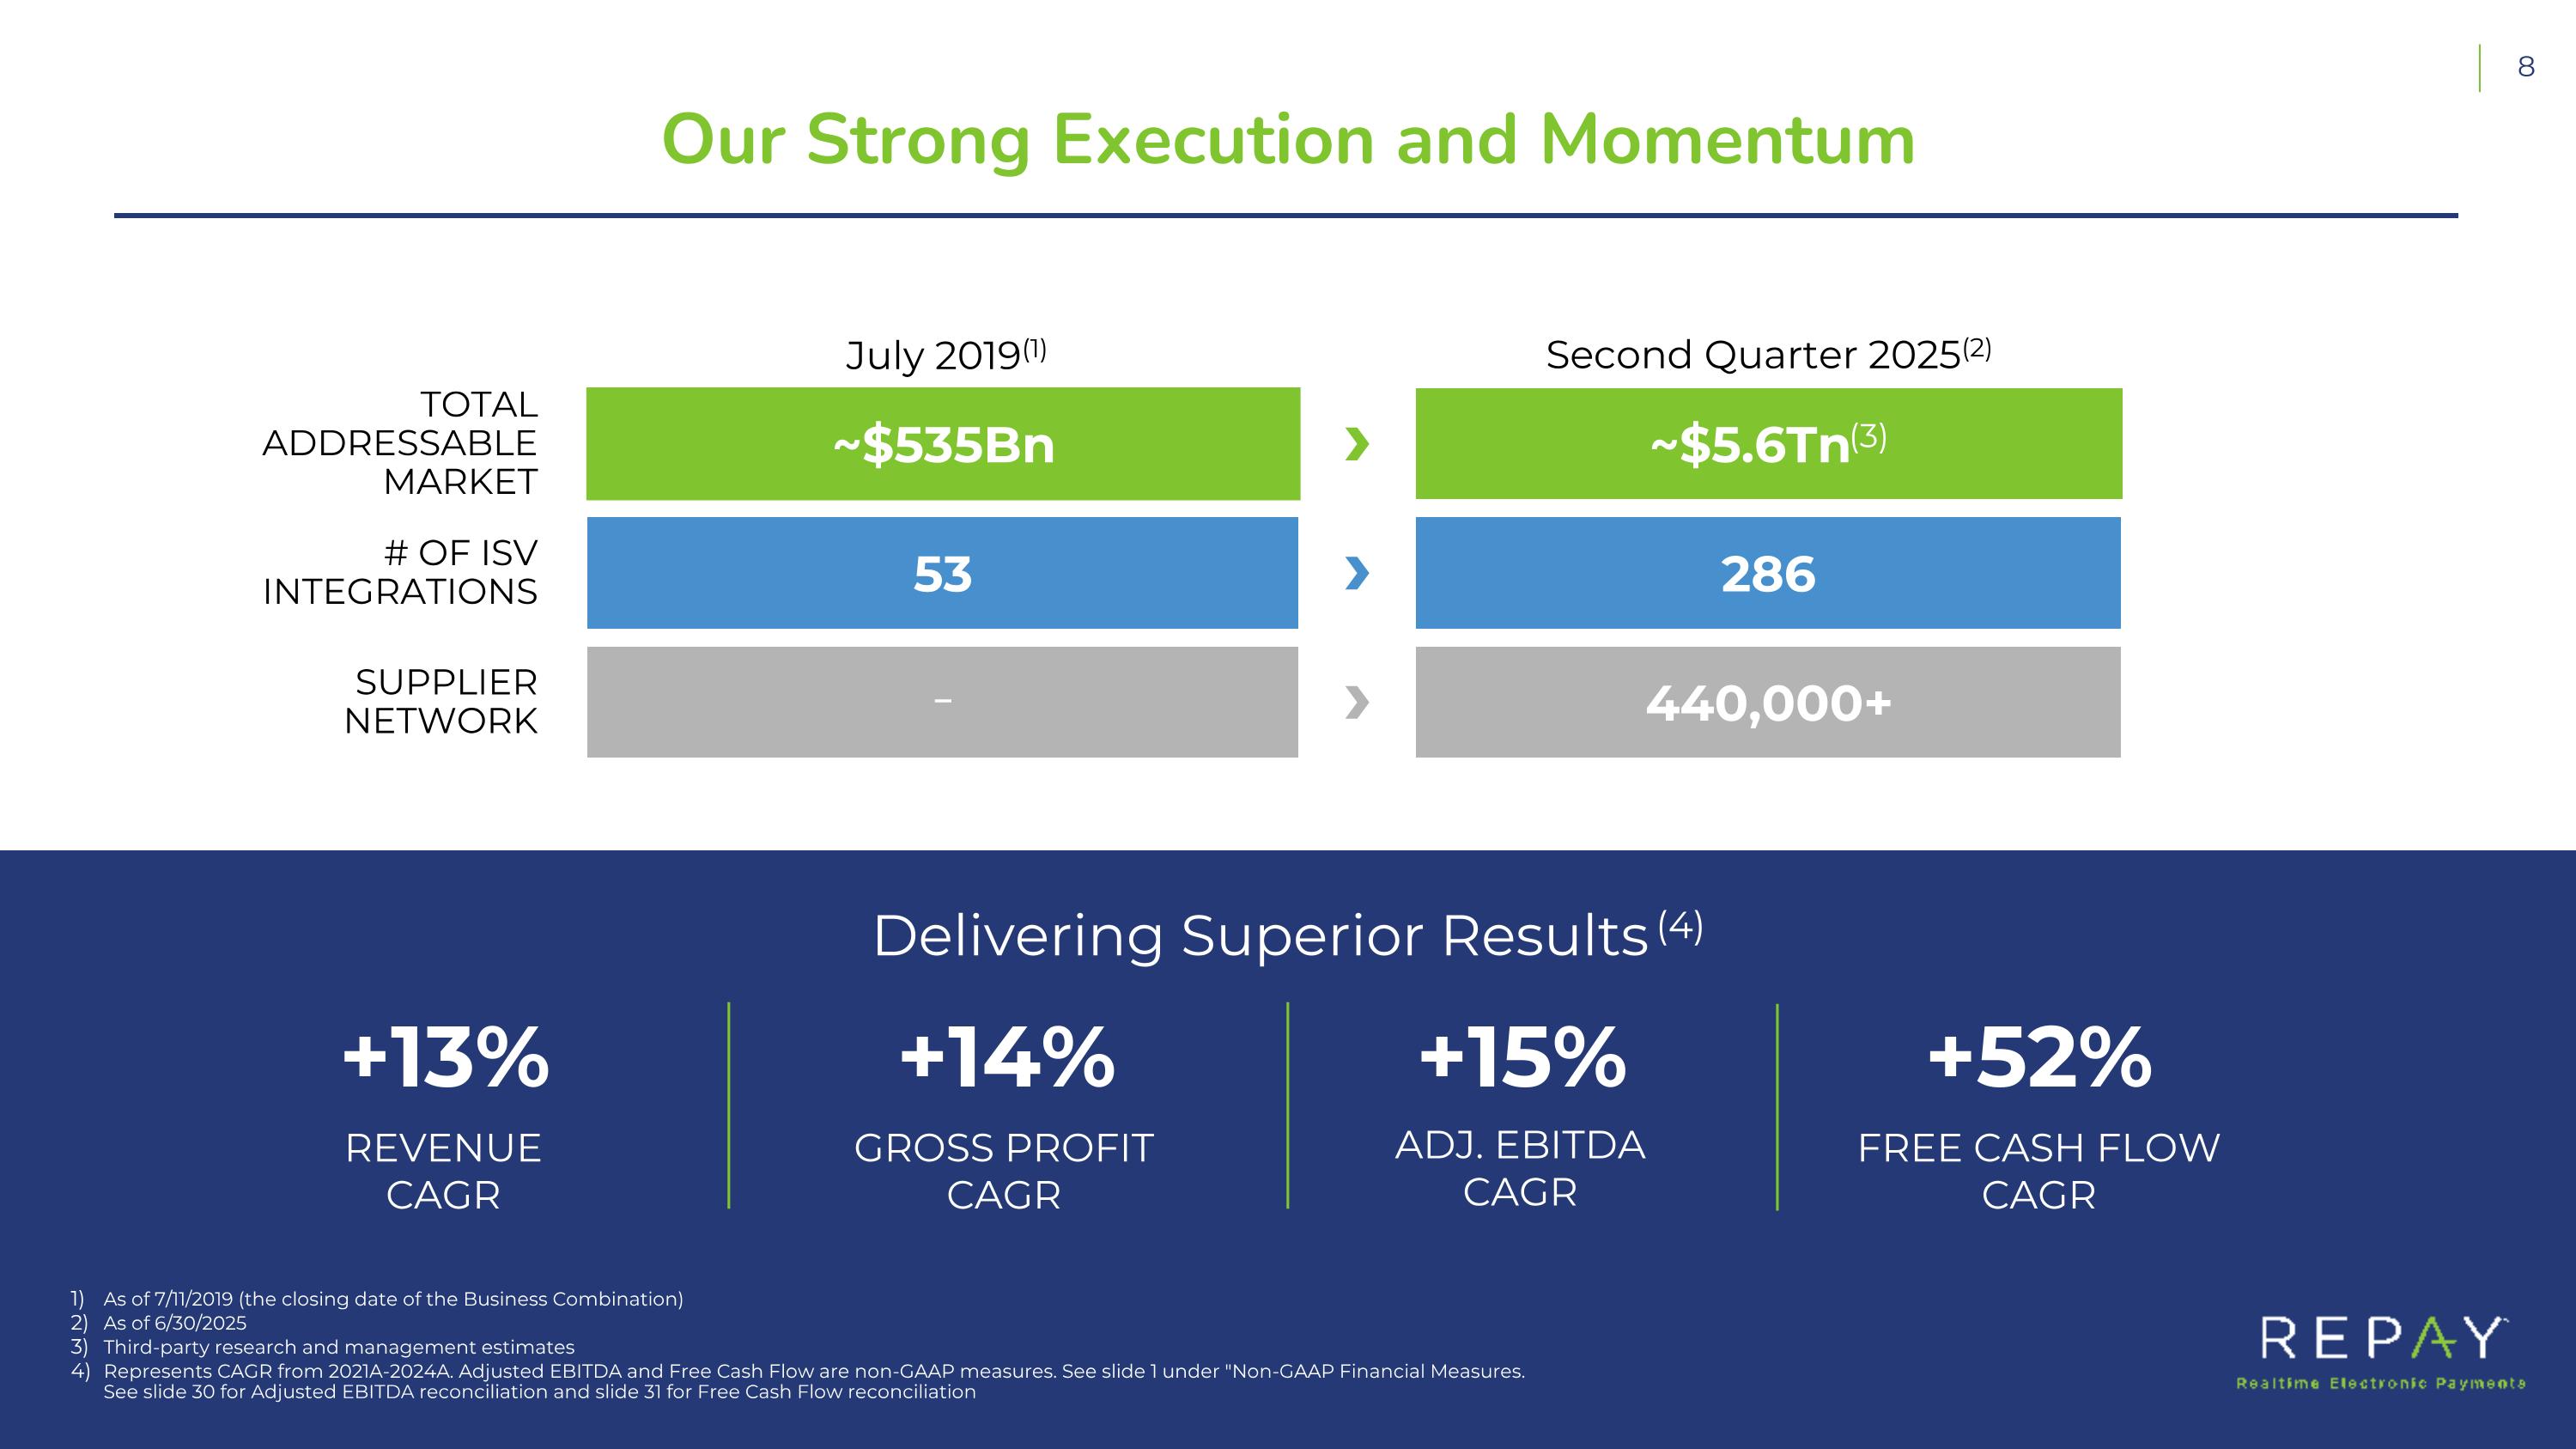
Our Strong Execution and Momentum TOTAL ADDRESSABLE MARKET ~$535Bn ~$5.6Tn(3) SUPPLIER NETWORK _ 440,000+ # OF ISV INTEGRATIONS 53 286 Delivering Superior Results (4) Second Quarter 2025(2) July 2019(1) REVENUE CAGR GROSS PROFIT CAGR ADJ. EBITDA CAGR +13% +14% As of 7/11/2019 (the closing date of the Business Combination) As of 6/30/2025 Third-party research and management estimates Represents CAGR from 2021A-2024A. Adjusted EBITDA and Free Cash Flow are non-GAAP measures. See slide 1 under "Non-GAAP Financial Measures. See slide 30 for Adjusted EBITDA reconciliation and slide 31 for Free Cash Flow reconciliation +15% FREE CASH FLOW CAGR +52%
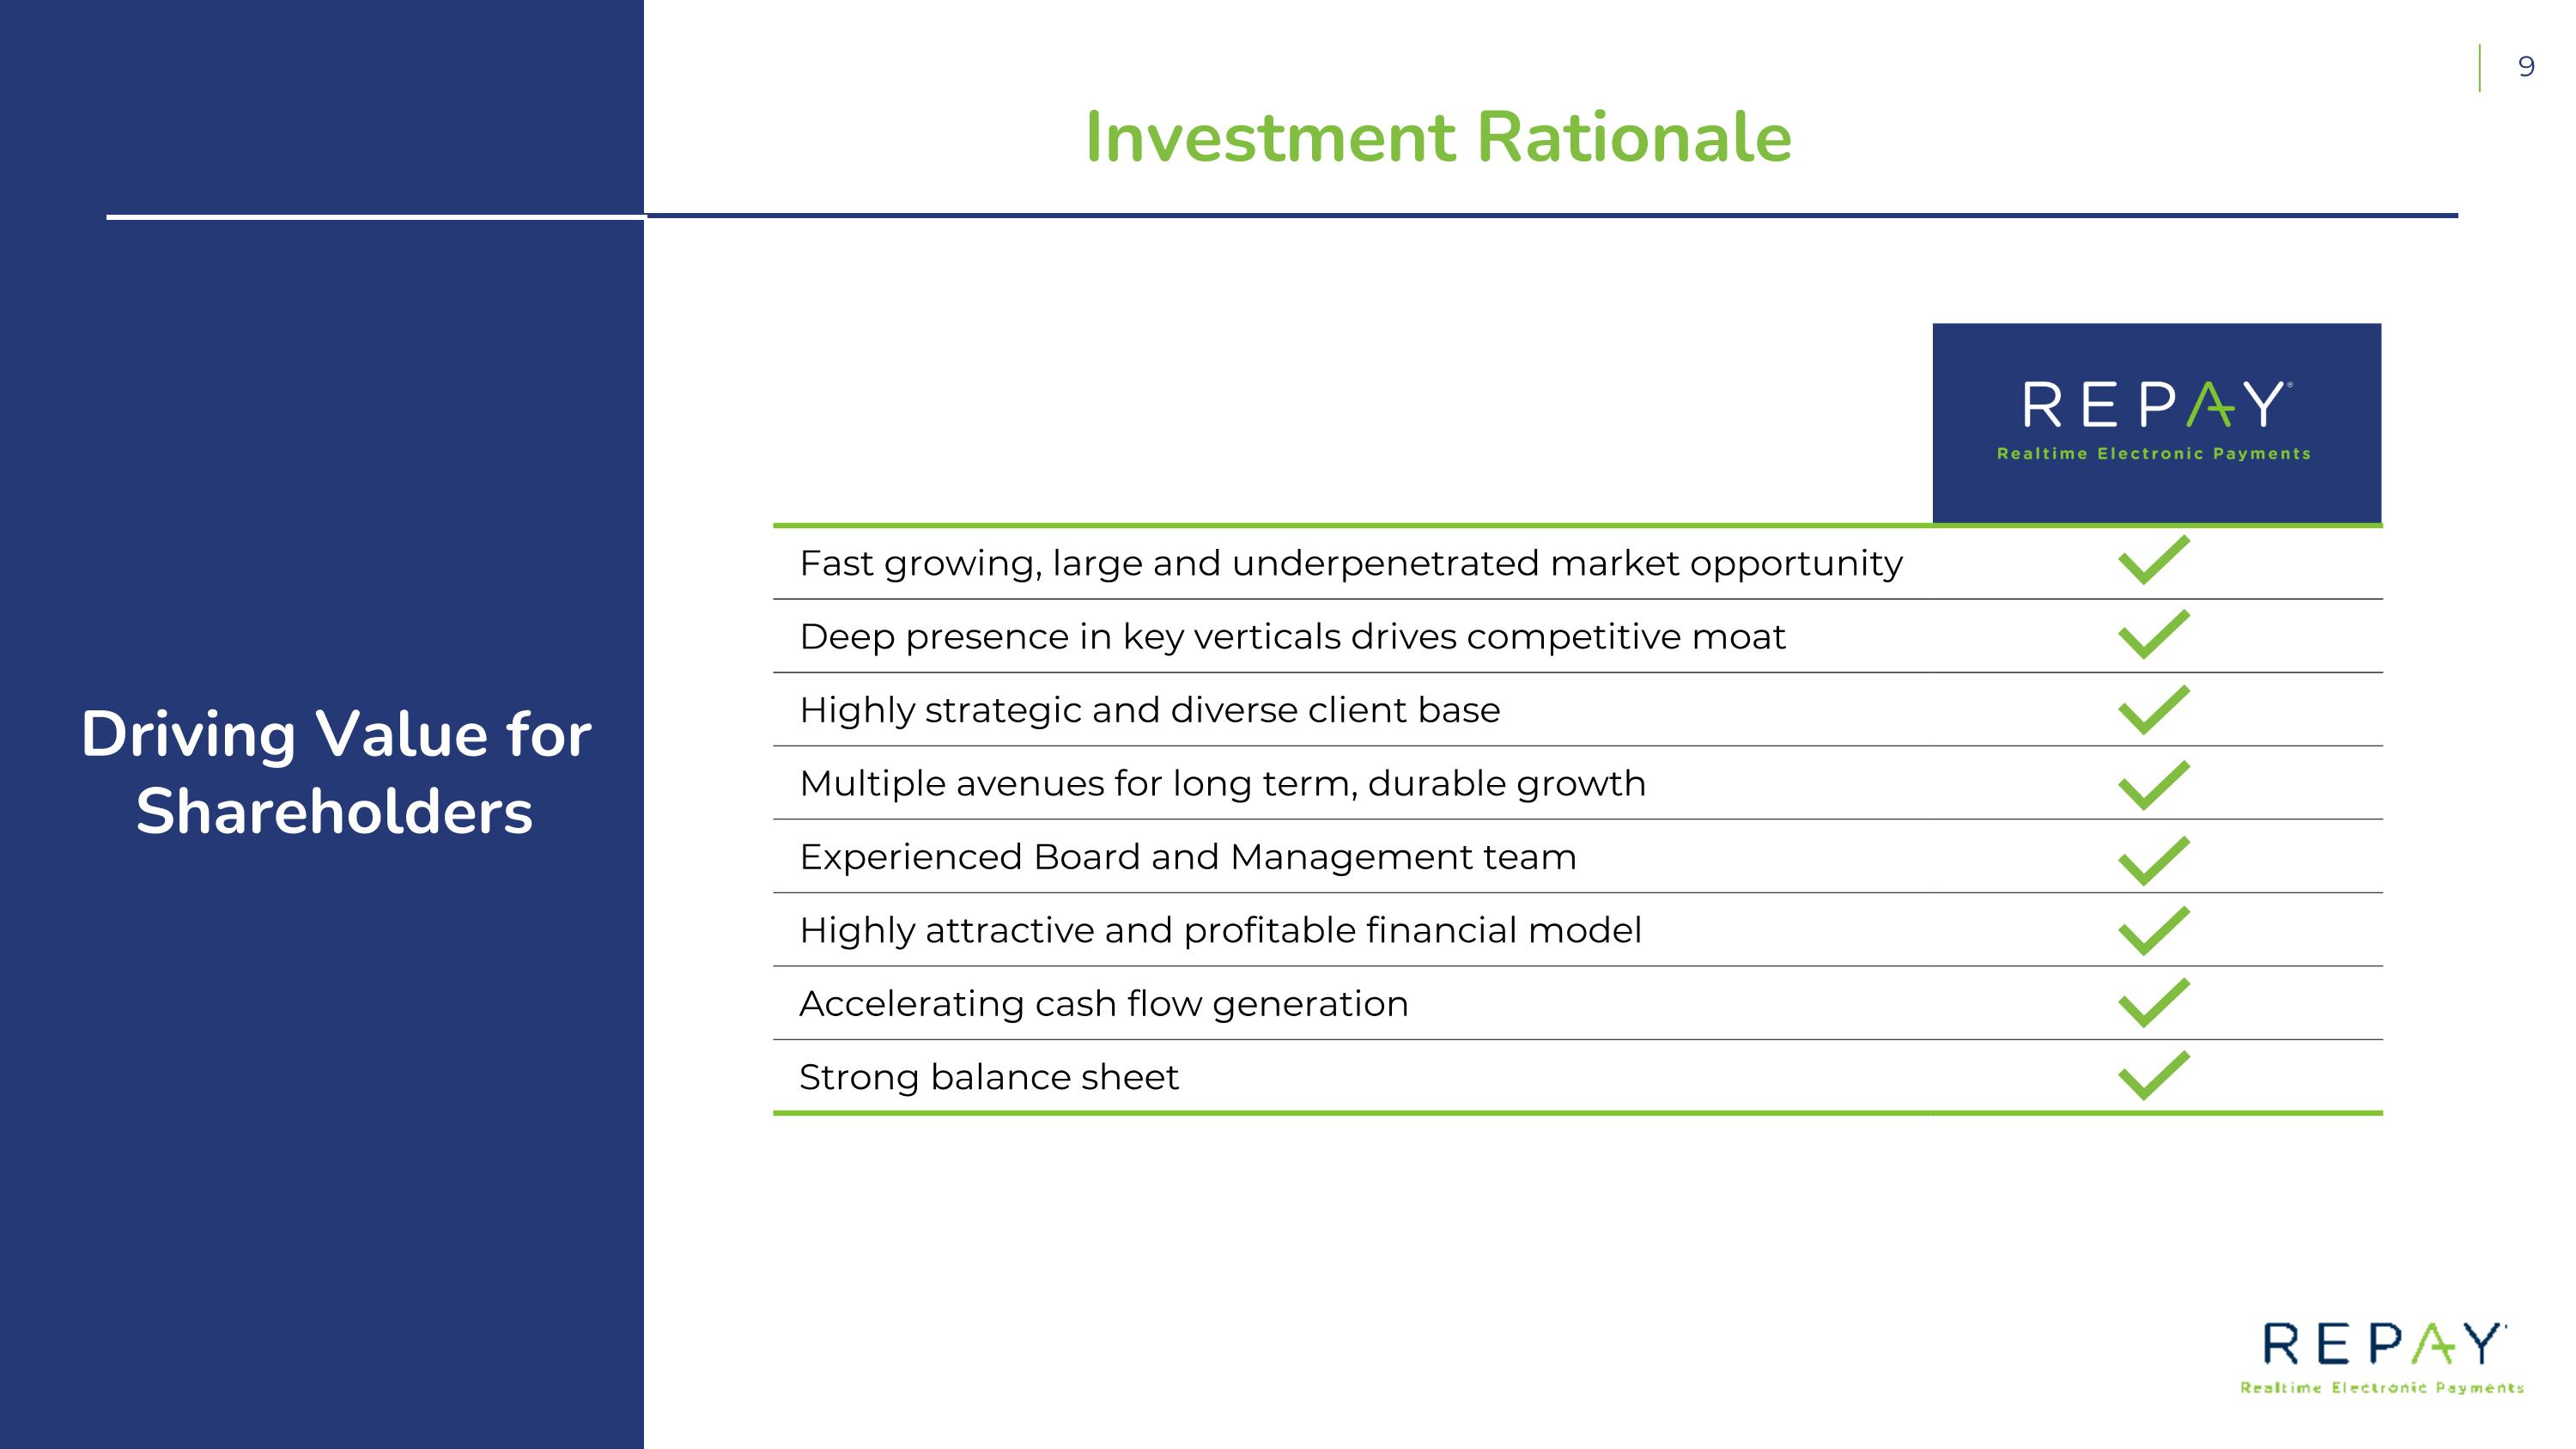
Driving Value for Shareholders Fast growing, large and underpenetrated market opportunity Deep presence in key verticals drives competitive moat Highly strategic and diverse client base Multiple avenues for long term, durable growth Experienced Board and Management team Highly attractive and profitable financial model Accelerating cash flow generation Strong balance sheet Investment Rationale

2 REPAY Investment Highlights
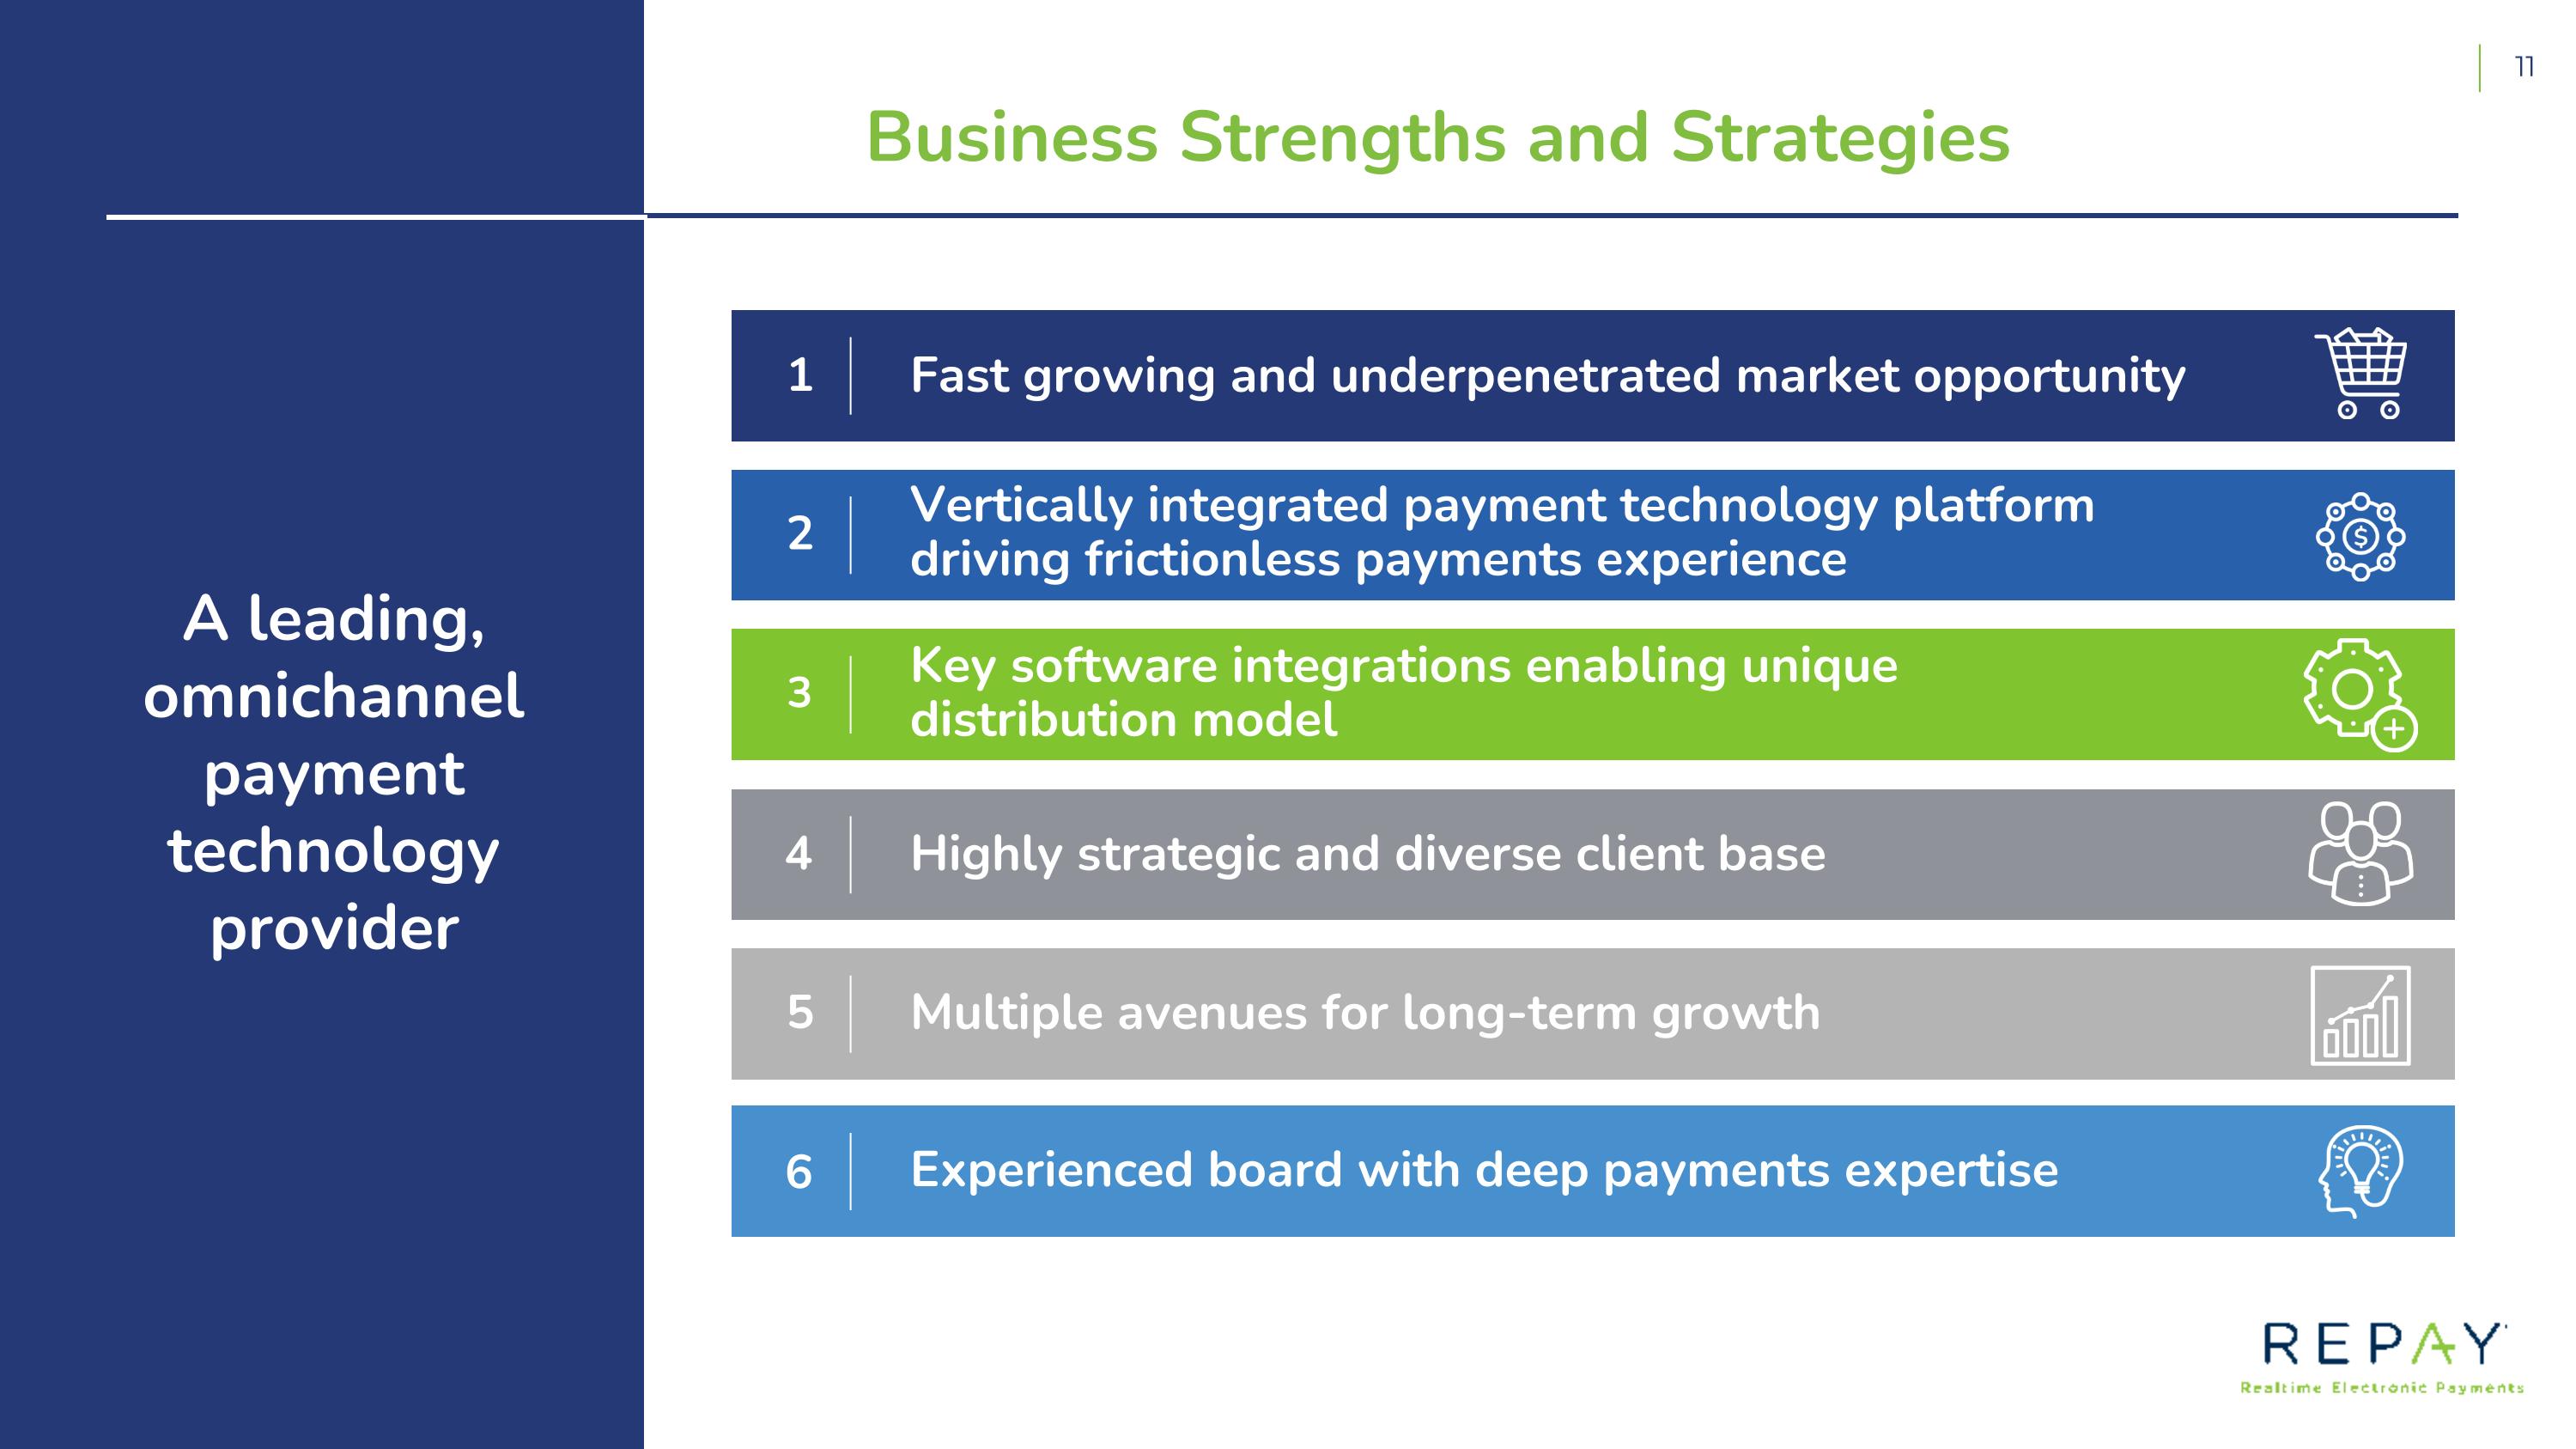
1 A leading, omnichannel payment technology provider Fast growing and underpenetrated market opportunity Vertically integrated payment technology platform driving frictionless payments experience Experienced board with deep payments expertise Multiple avenues for long-term growth Highly strategic and diverse client base 2 3 4 5 6 Key software integrations enabling unique distribution model Business Strengths and Strategies
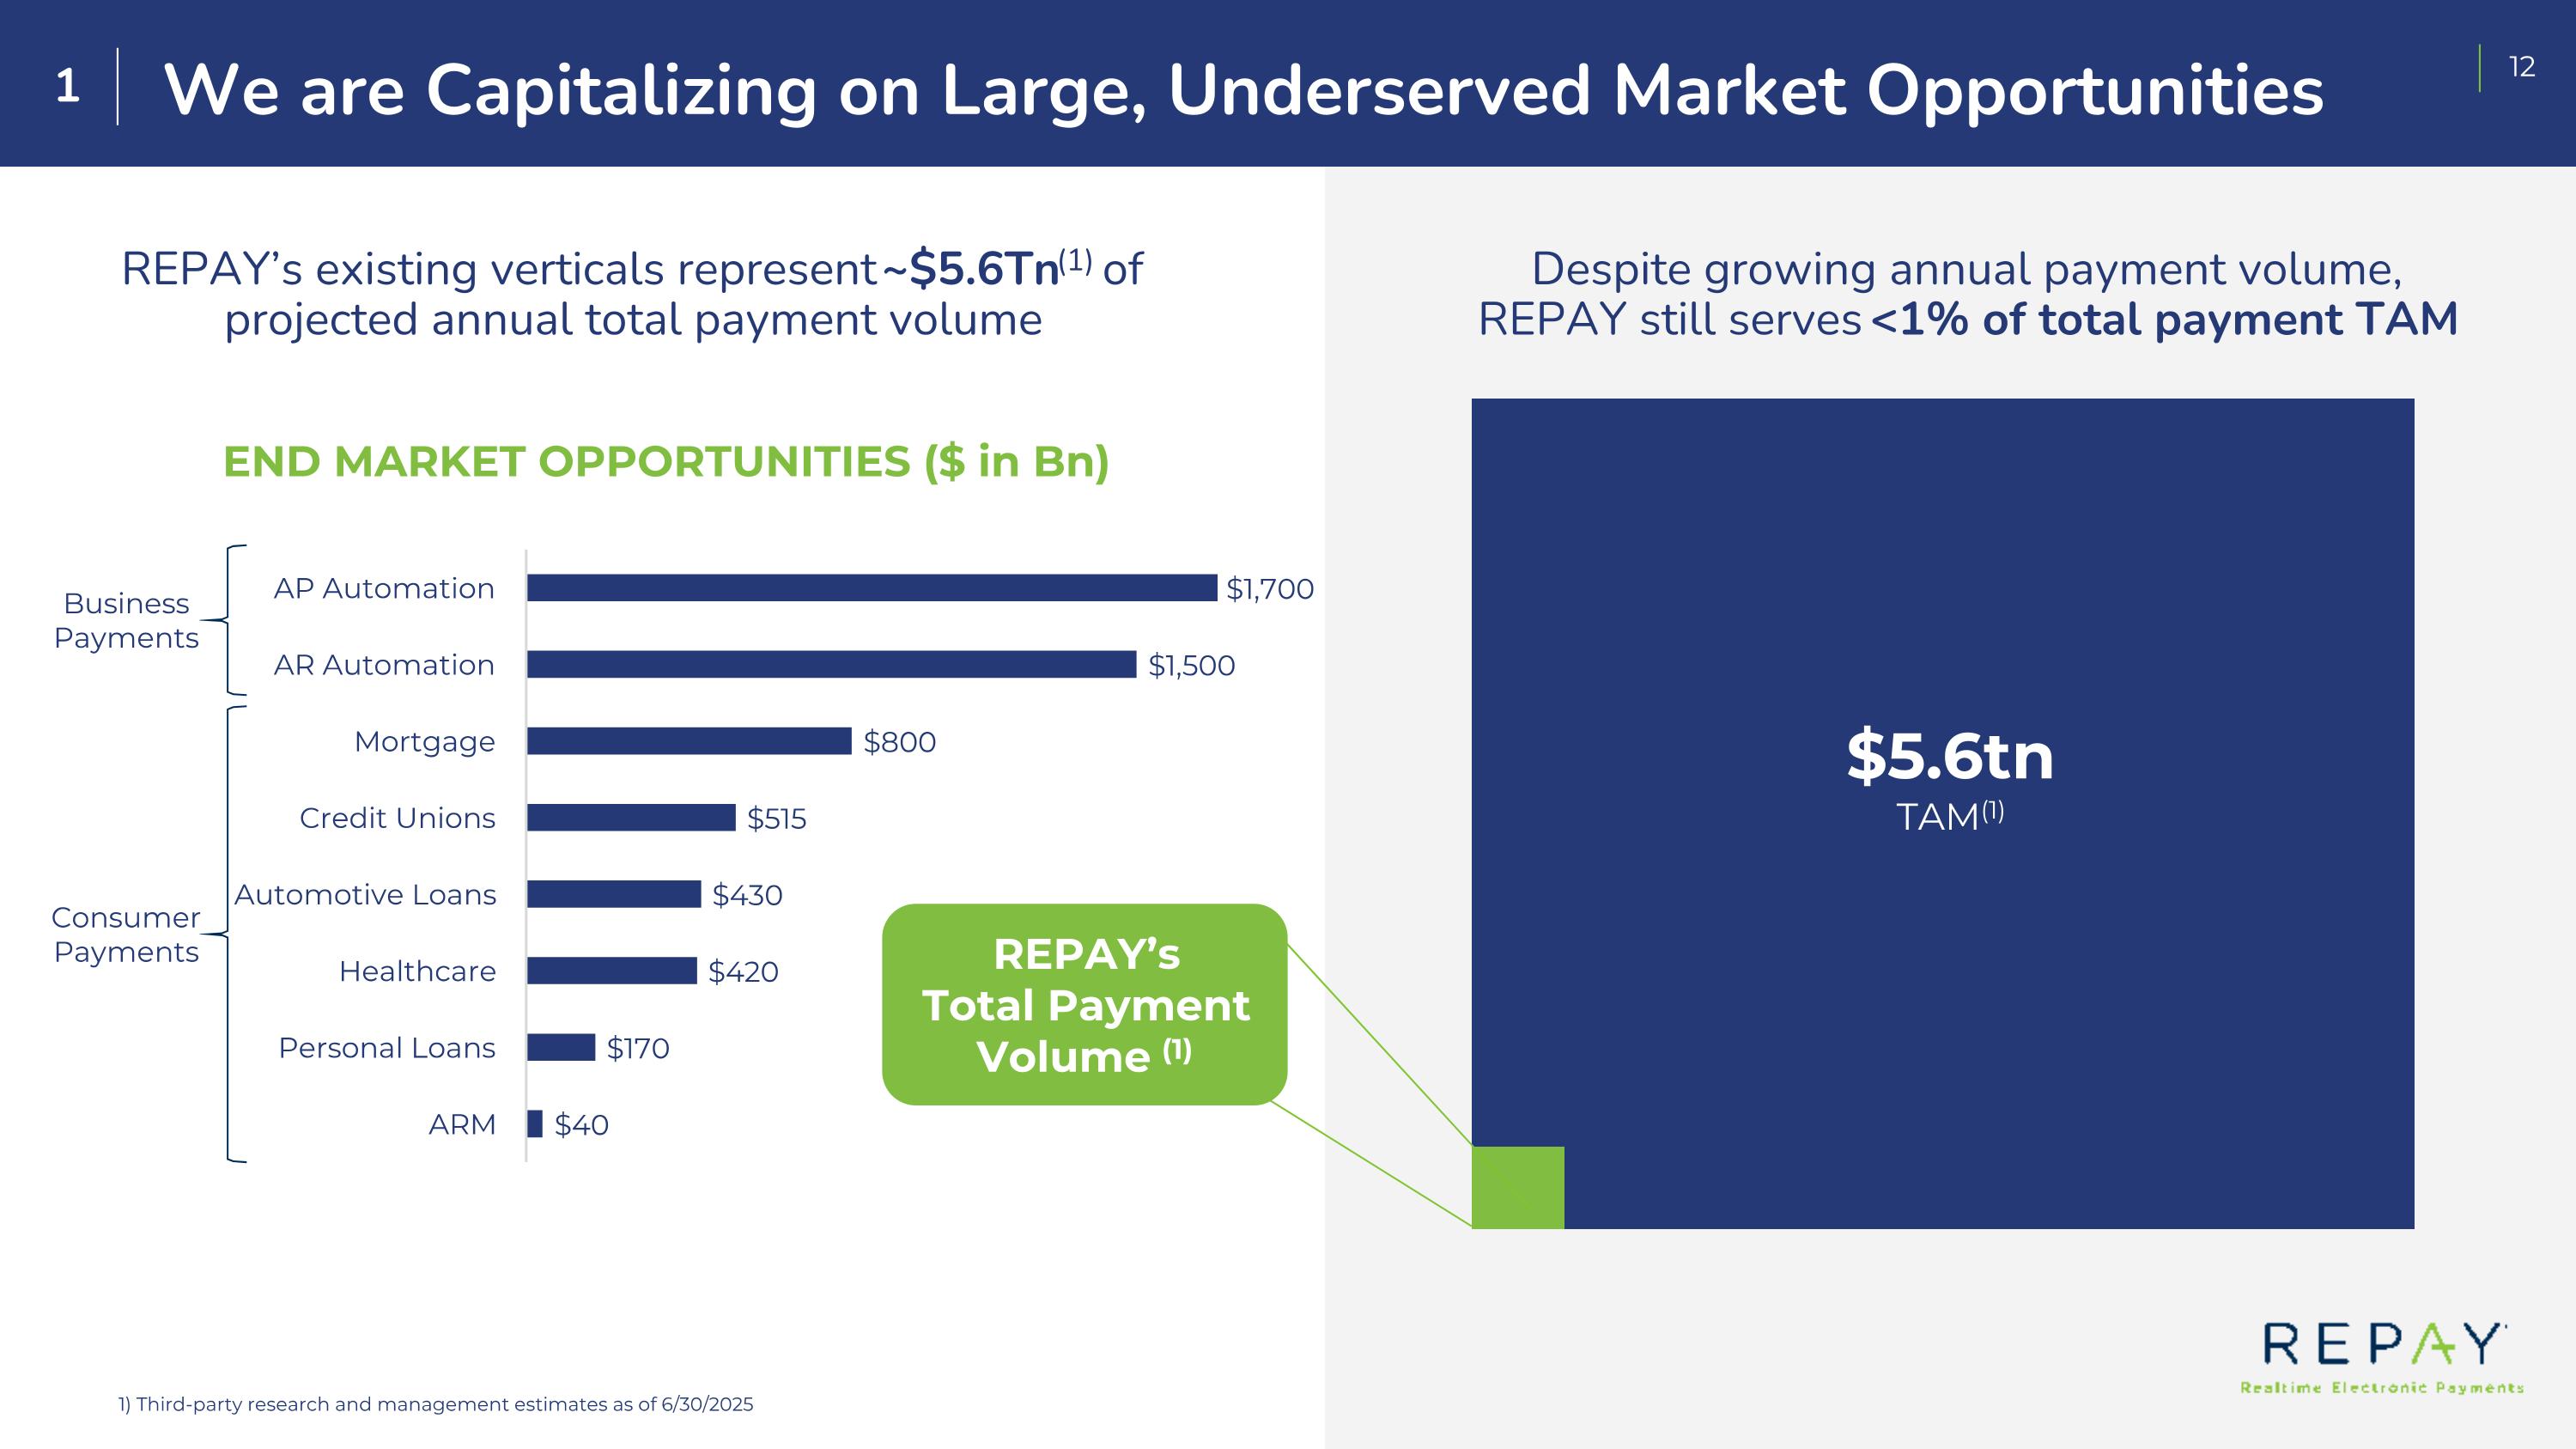
1 We are Capitalizing on Large, Underserved Market Opportunities REPAY’s existing verticals represent ~$5.6Tn(1) of projected annual total payment volume END MARKET OPPORTUNITIES ($ in Bn) 1) Third-party research and management estimates as of 6/30/2025 Business Payments Consumer Payments $5.6tn TAM(1) Despite growing annual payment volume, REPAY still serves <1% of total payment TAM REPAY’s Total Payment Volume (1)
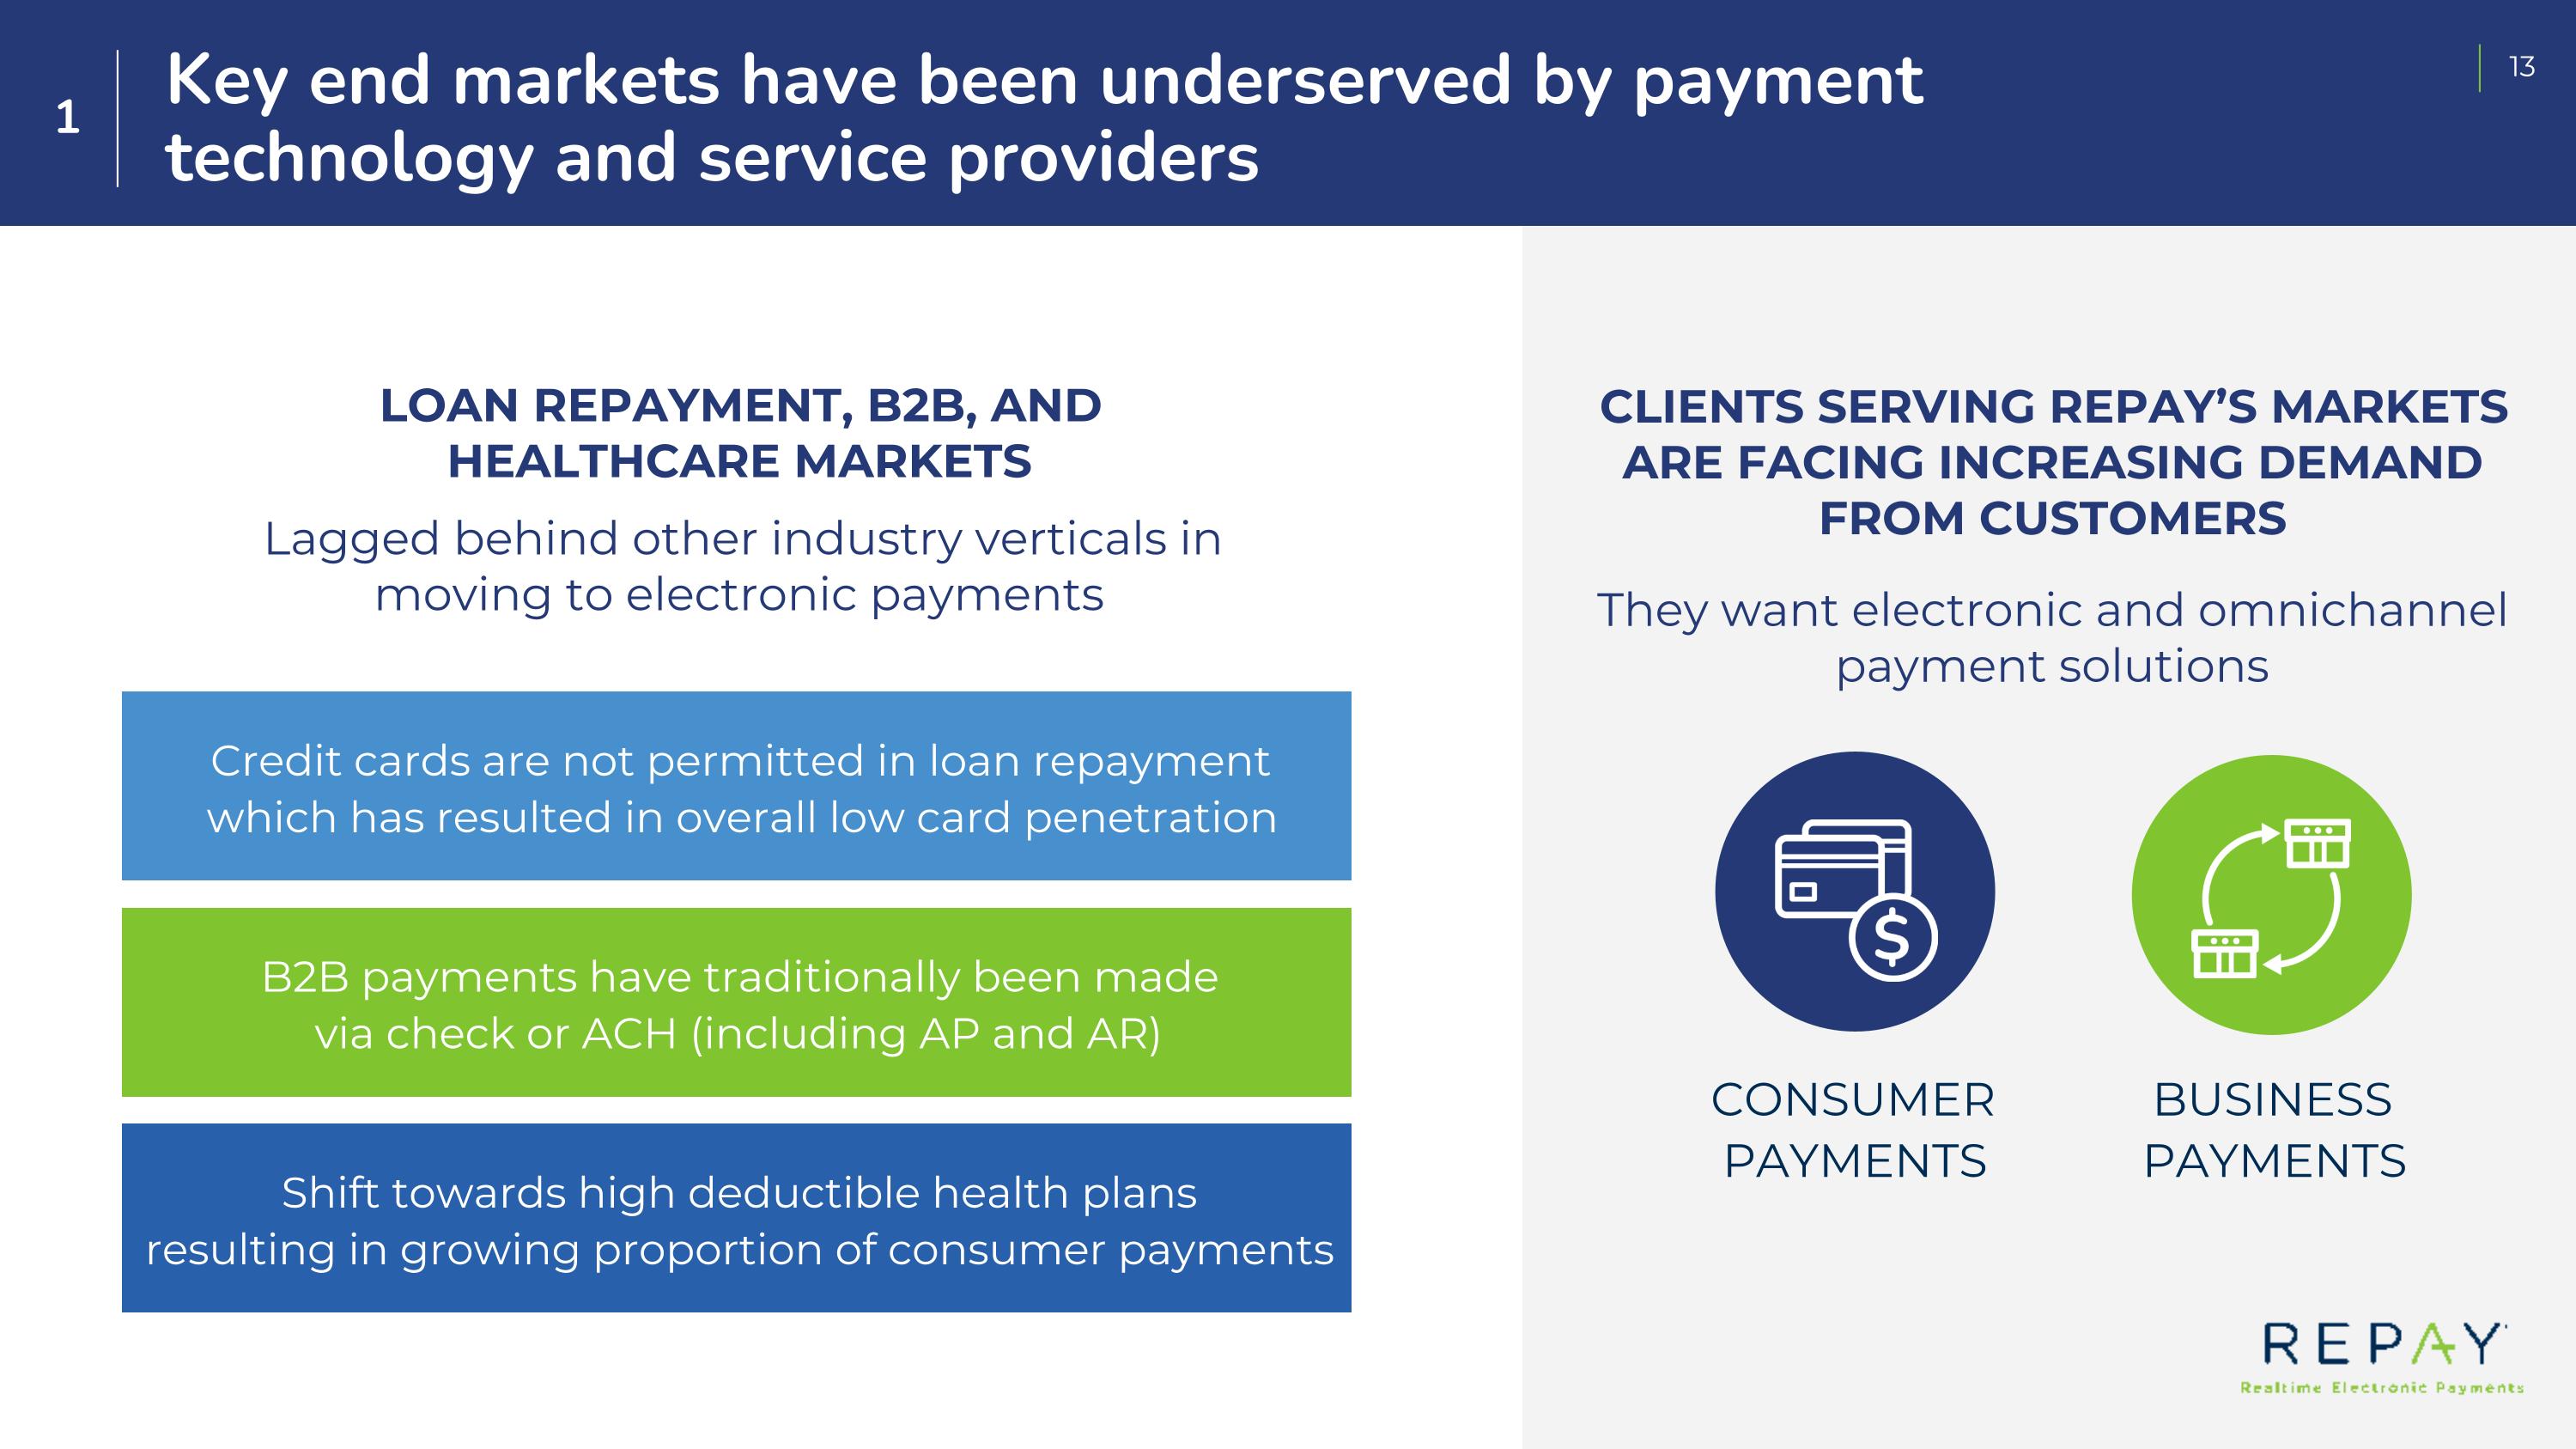
1 Key end markets have been underserved by payment technology and service providers Credit cards are not permitted in loan repayment which has resulted in overall low card penetration CLIENTS SERVING REPAY’S MARKETS ARE FACING INCREASING DEMAND FROM CUSTOMERS They want electronic and omnichannel payment solutions LOAN REPAYMENT, B2B, AND HEALTHCARE MARKETS Lagged behind other industry verticals in moving to electronic payments CONSUMER PAYMENTS BUSINESS PAYMENTS B2B payments have traditionally been made via check or ACH (including AP and AR) Shift towards high deductible health plans resulting in growing proportion of consumer payments
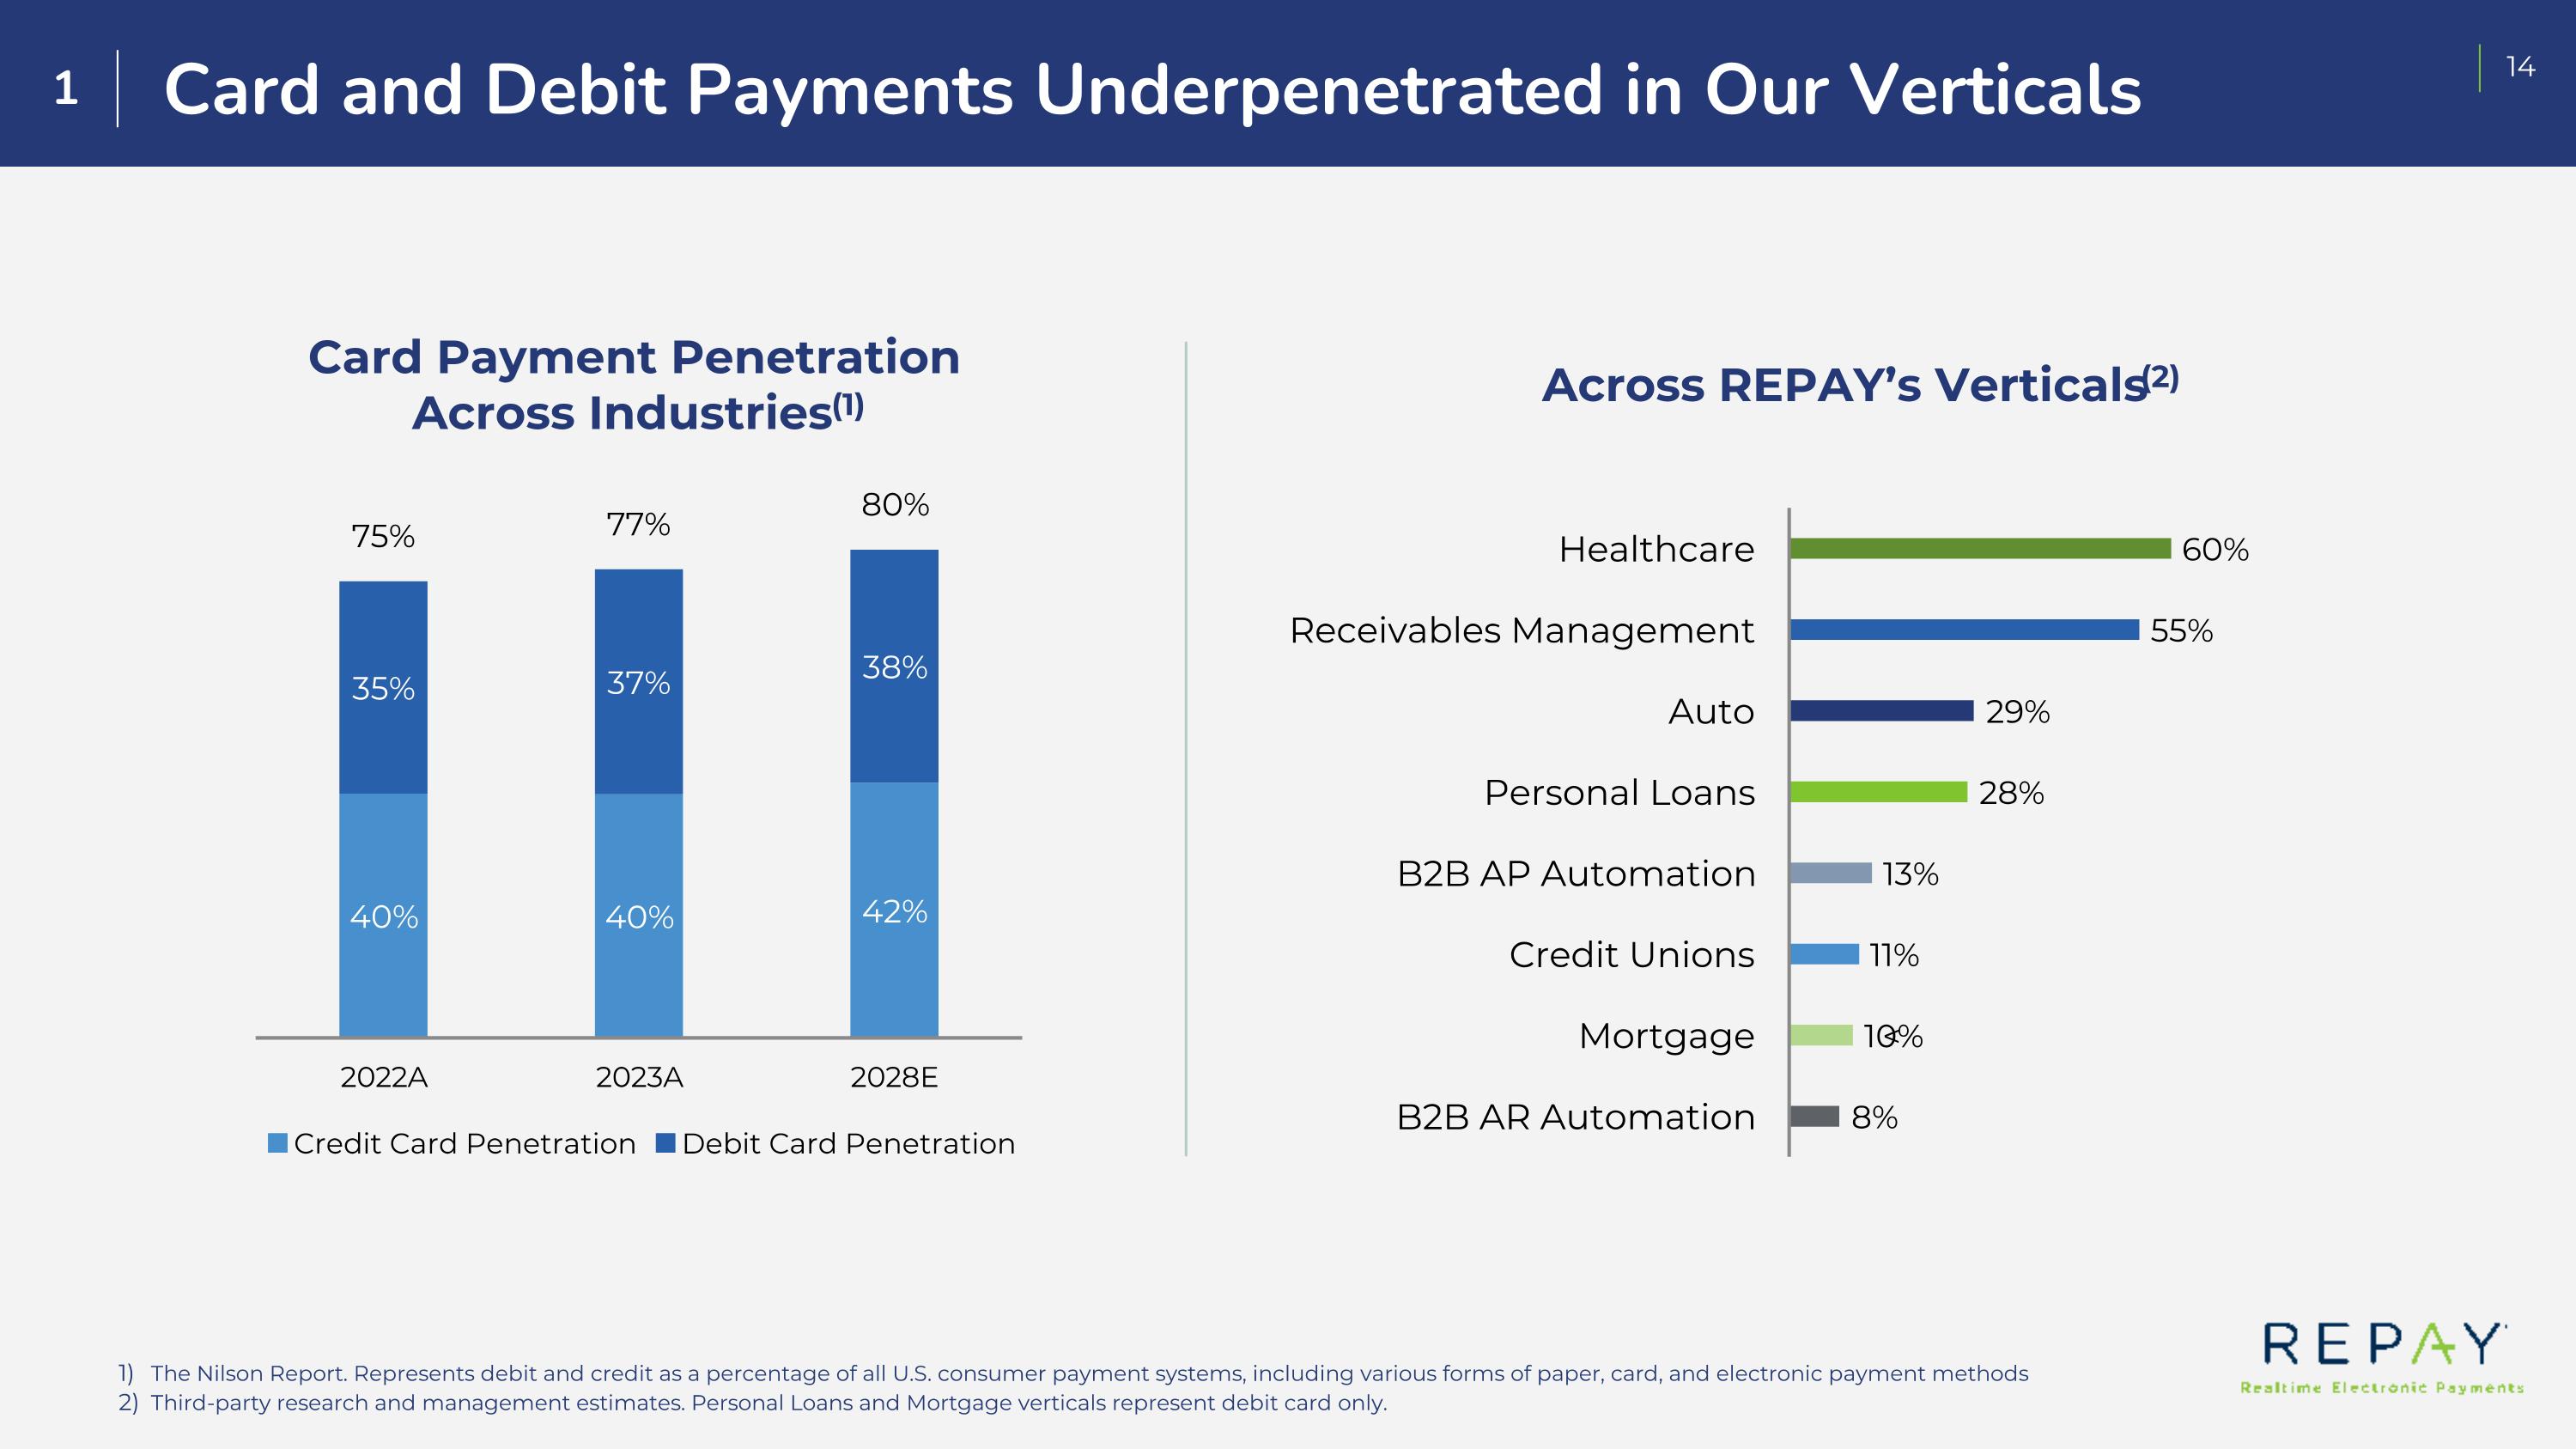
Card and Debit Payments Underpenetrated in Our Verticals The Nilson Report. Represents debit and credit as a percentage of all U.S. consumer payment systems, including various forms of paper, card, and electronic payment methods Third-party research and management estimates. Personal Loans and Mortgage verticals represent debit card only. Across REPAY’s Verticals(2) Card Payment Penetration Across Industries(1) 1 <
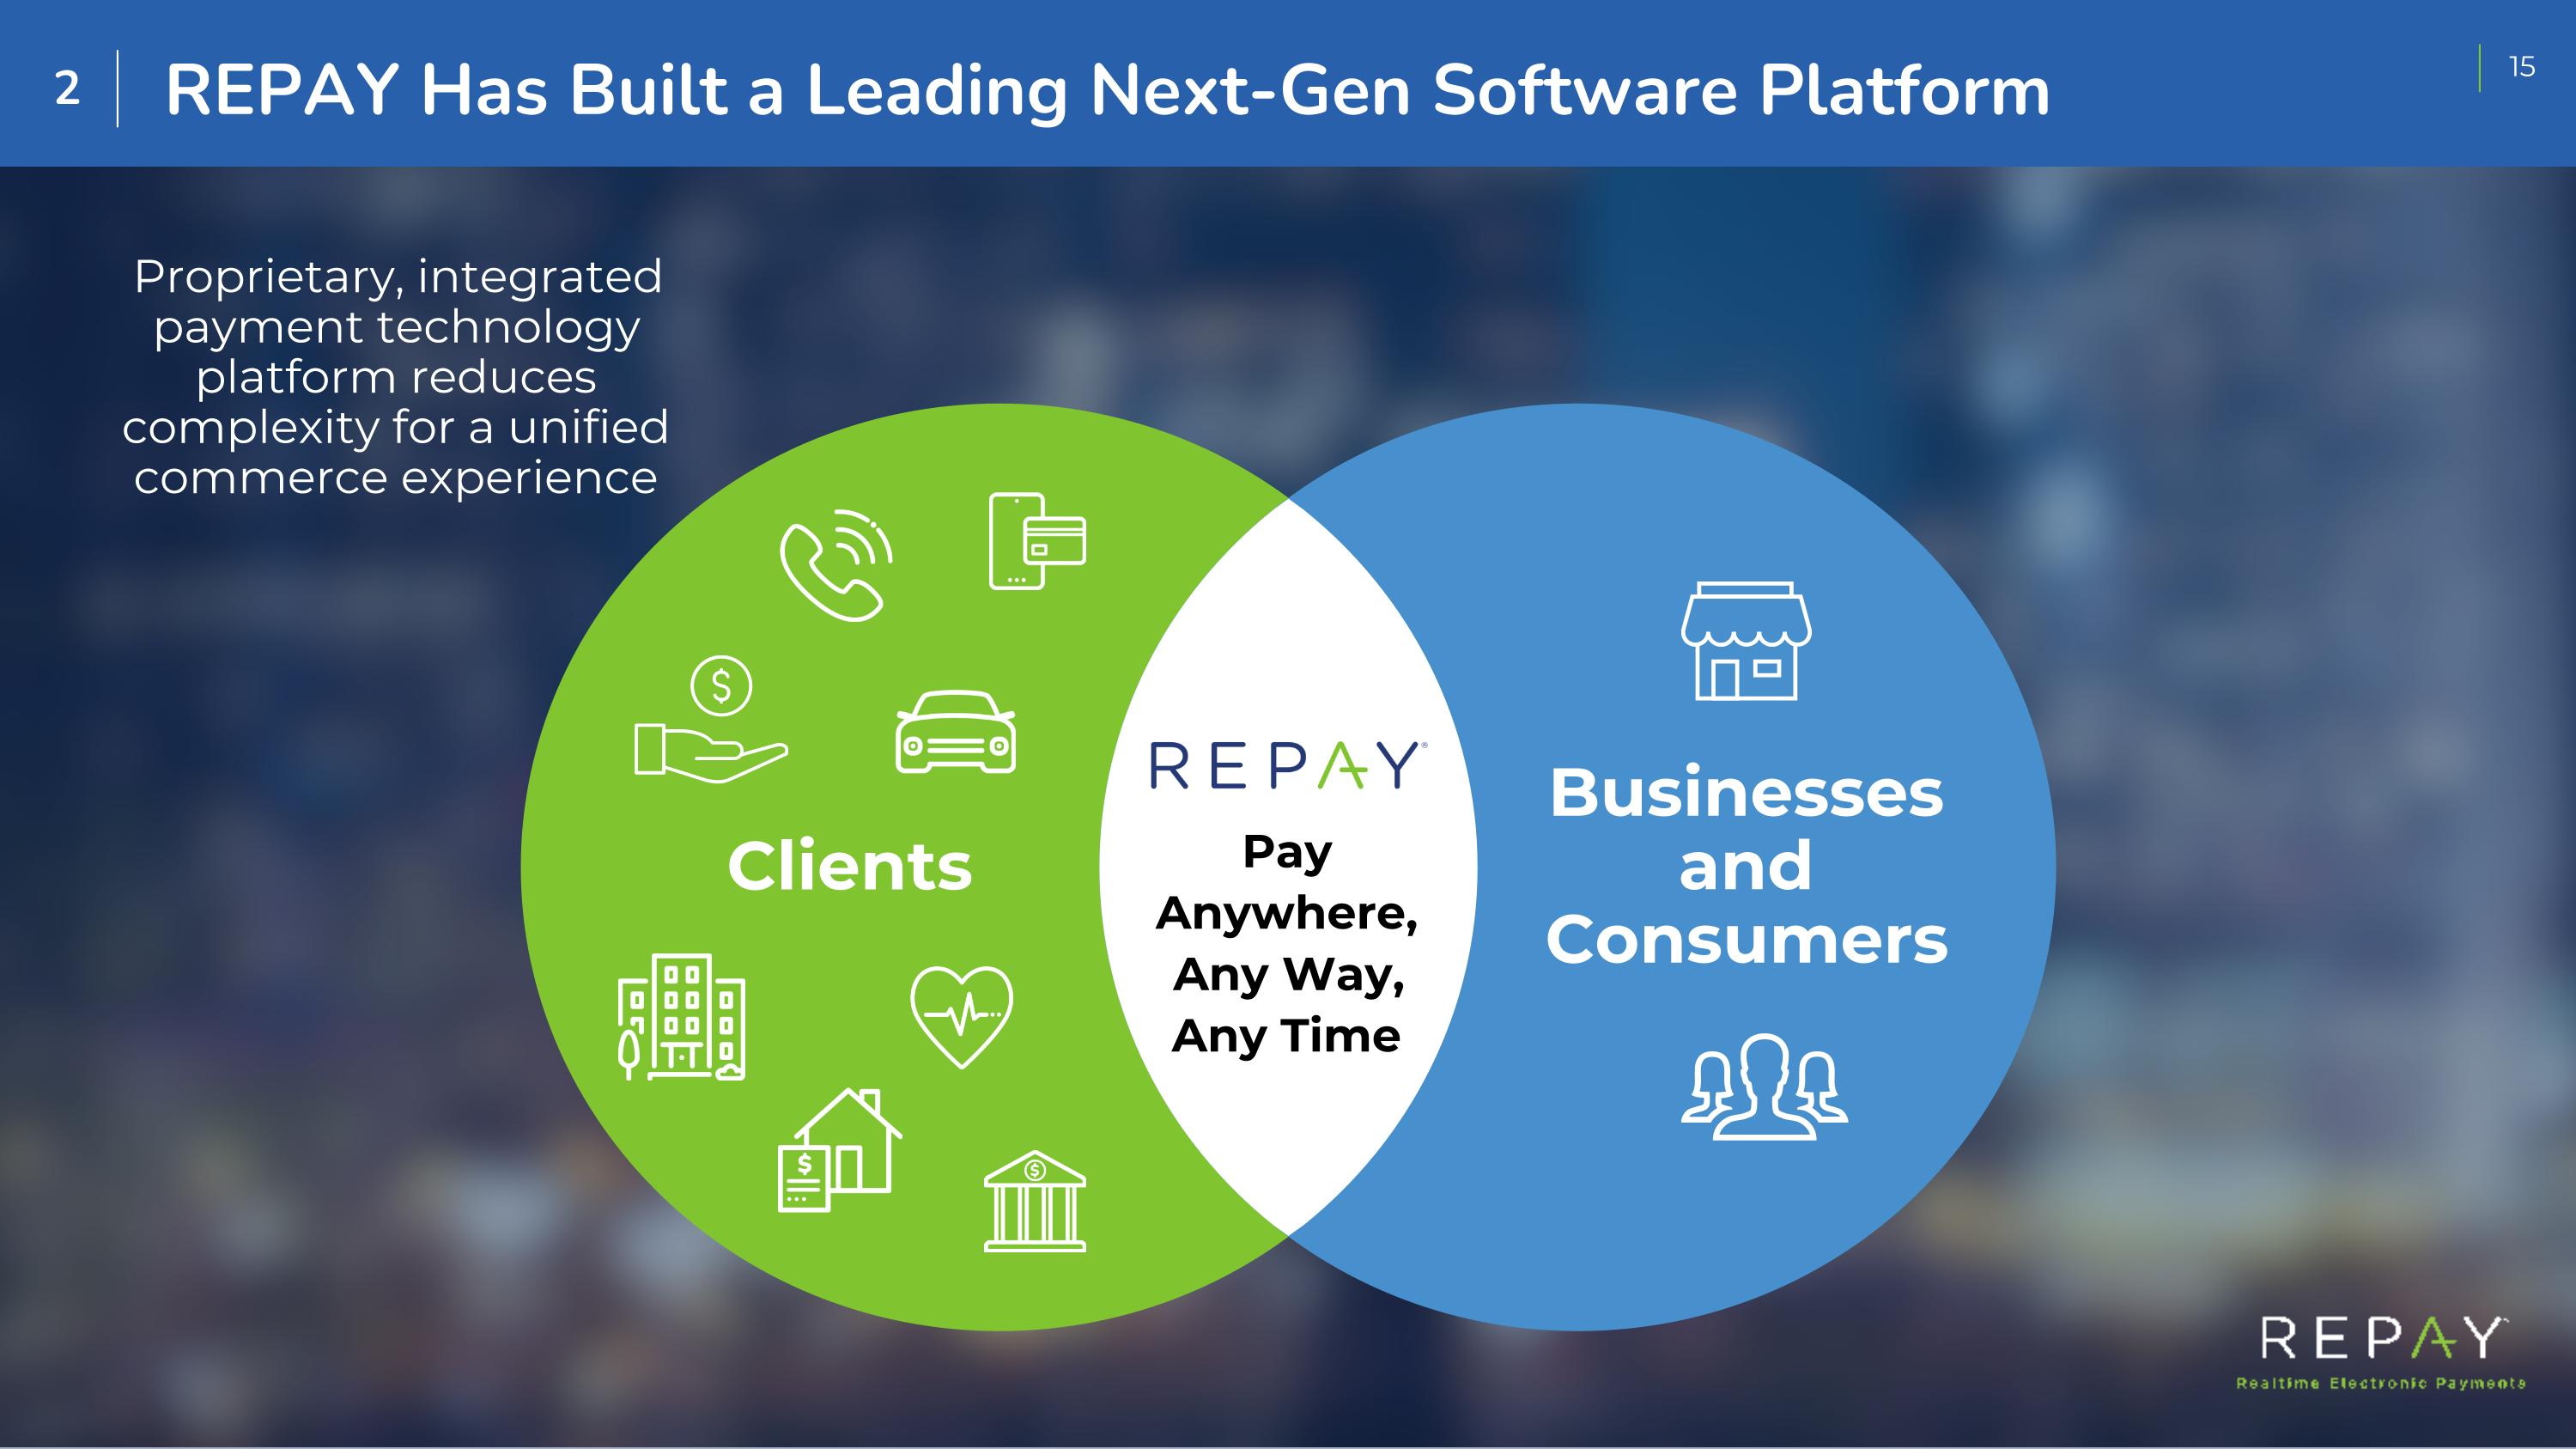
REPAY Has Built a Leading Next-Gen Software Platform Proprietary, integrated payment technology platform reduces complexity for a unified commerce experience Pay Anywhere, Any Way, Any Time Businesses and Consumers Clients 2
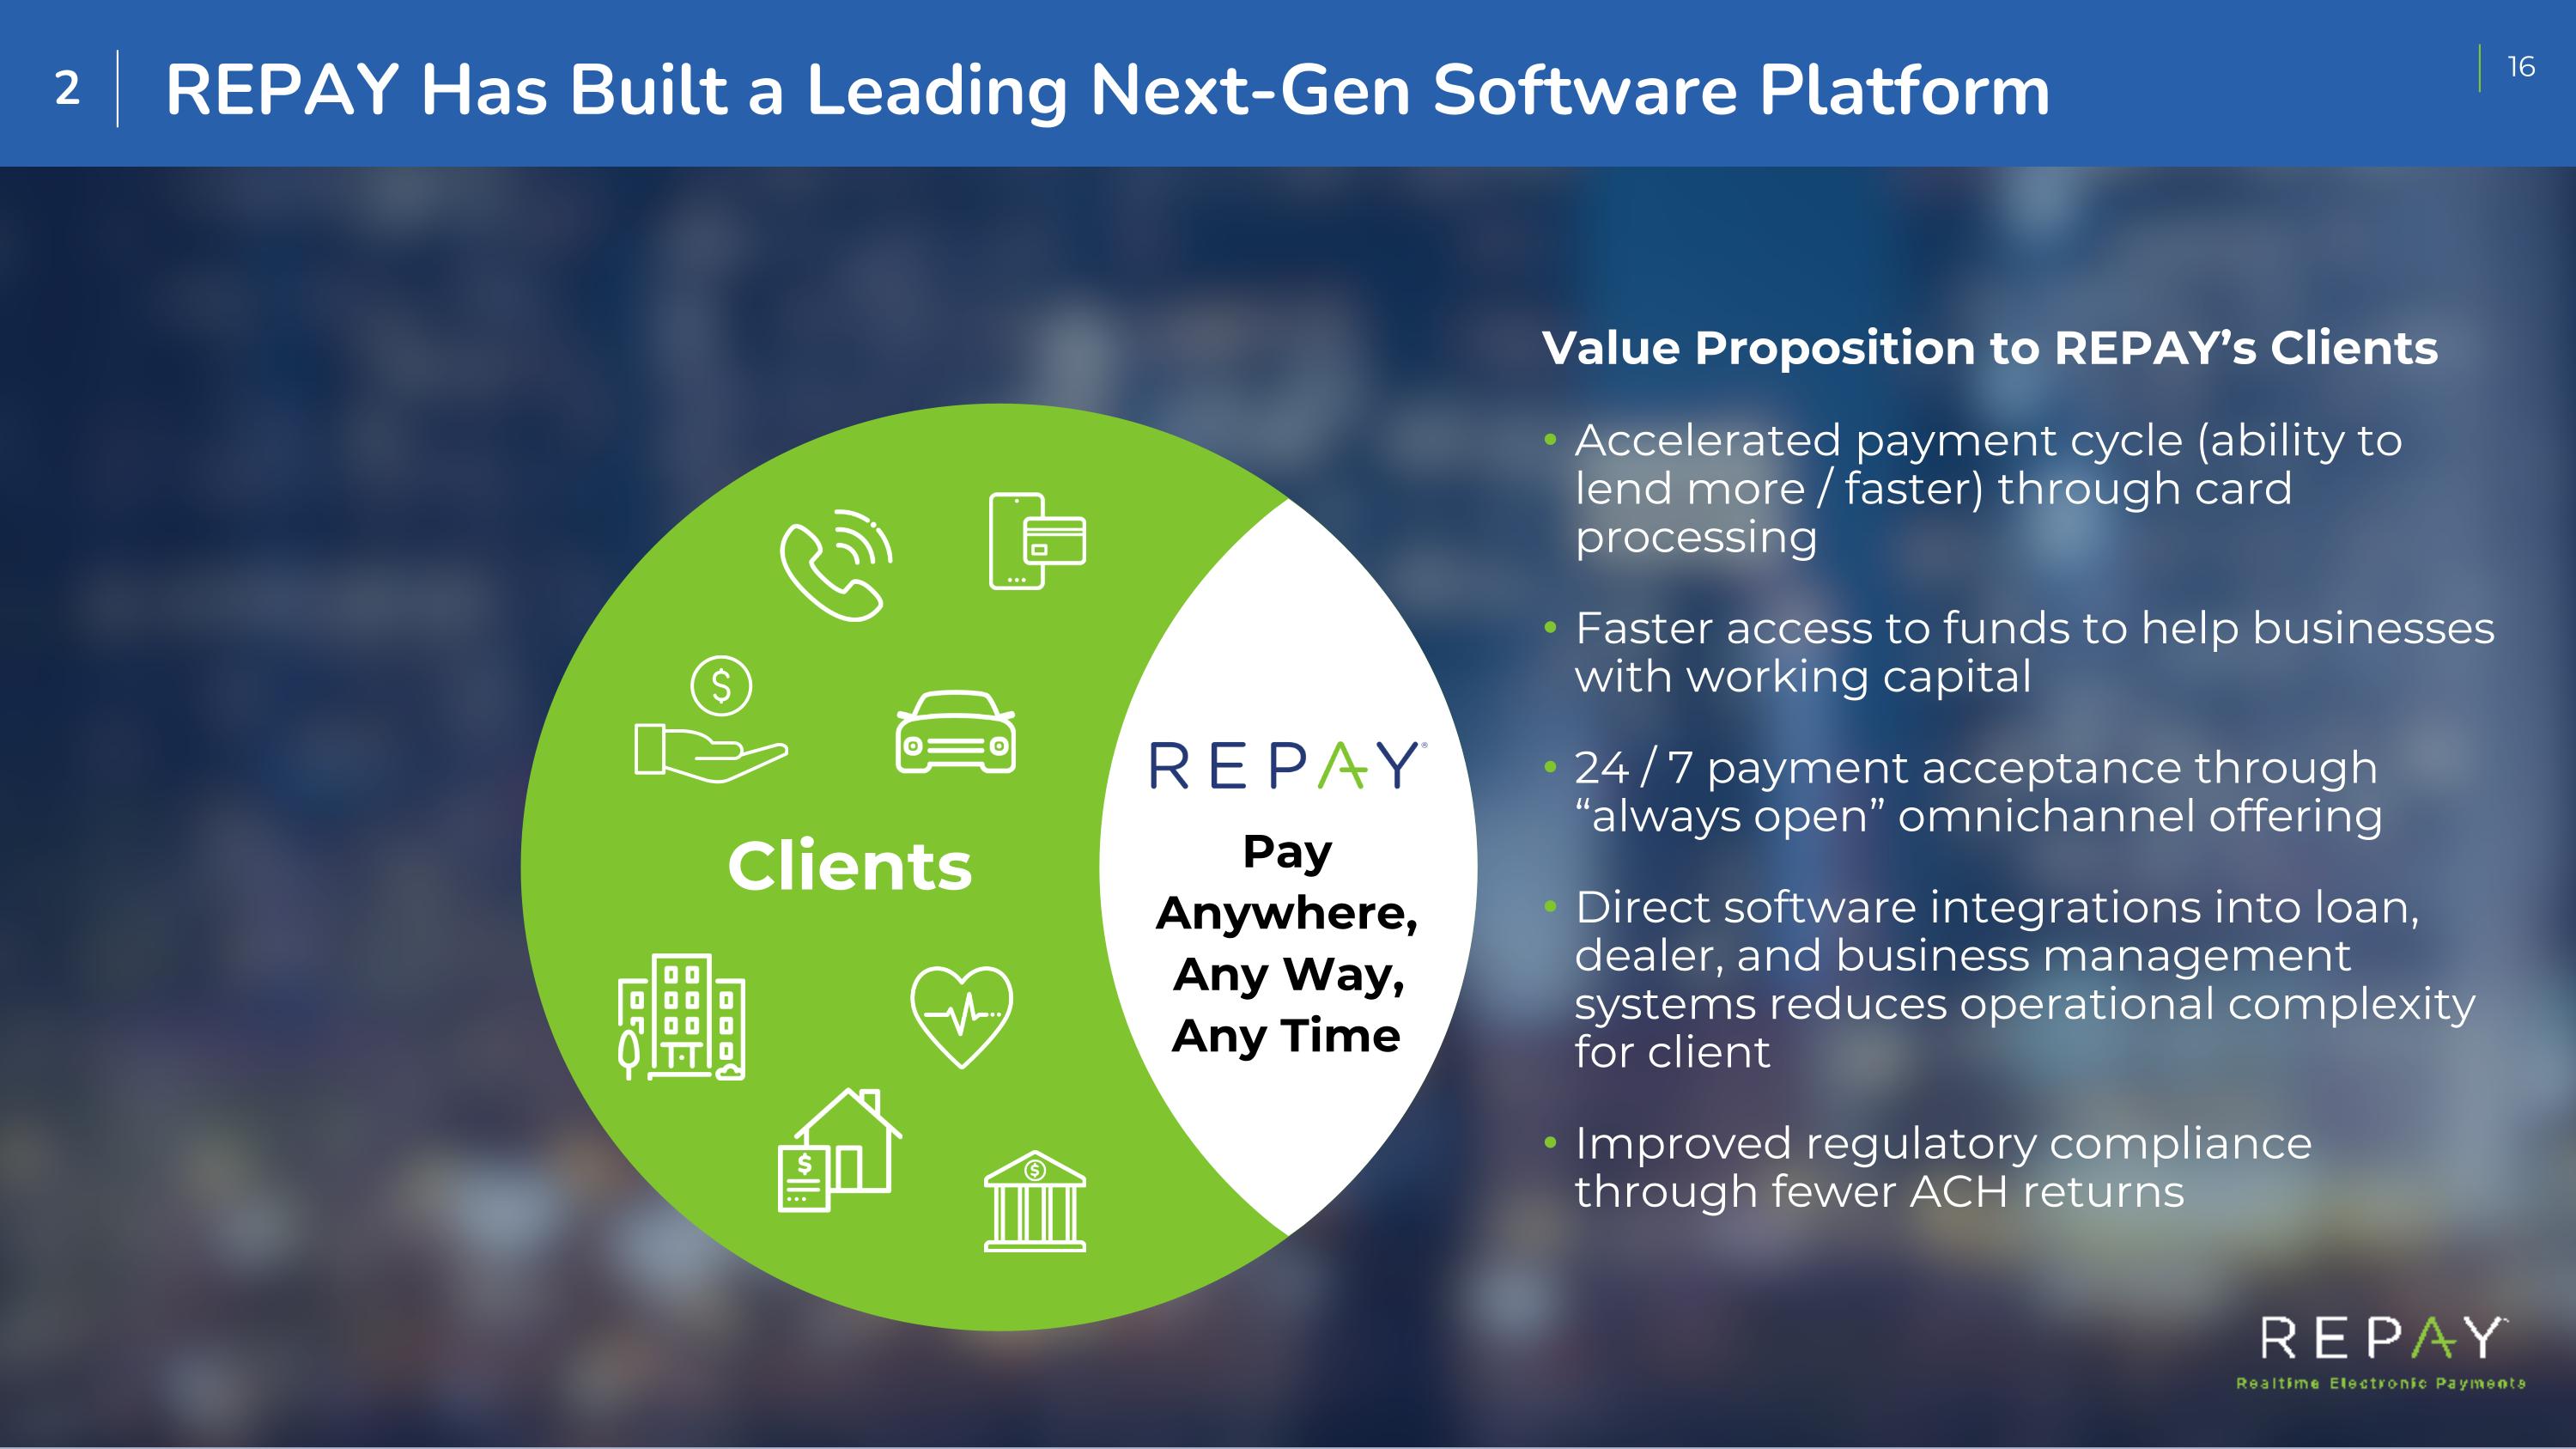
REPAY Has Built a Leading Next-Gen Software Platform Value Proposition to REPAY’s Clients Accelerated payment cycle (ability to lend more / faster) through card processing Faster access to funds to help businesses with working capital 24 / 7 payment acceptance through “always open” omnichannel offering Direct software integrations into loan, dealer, and business management systems reduces operational complexity for client Improved regulatory compliance through fewer ACH returns 2 Clients Pay Anywhere, Any Way, Any Time
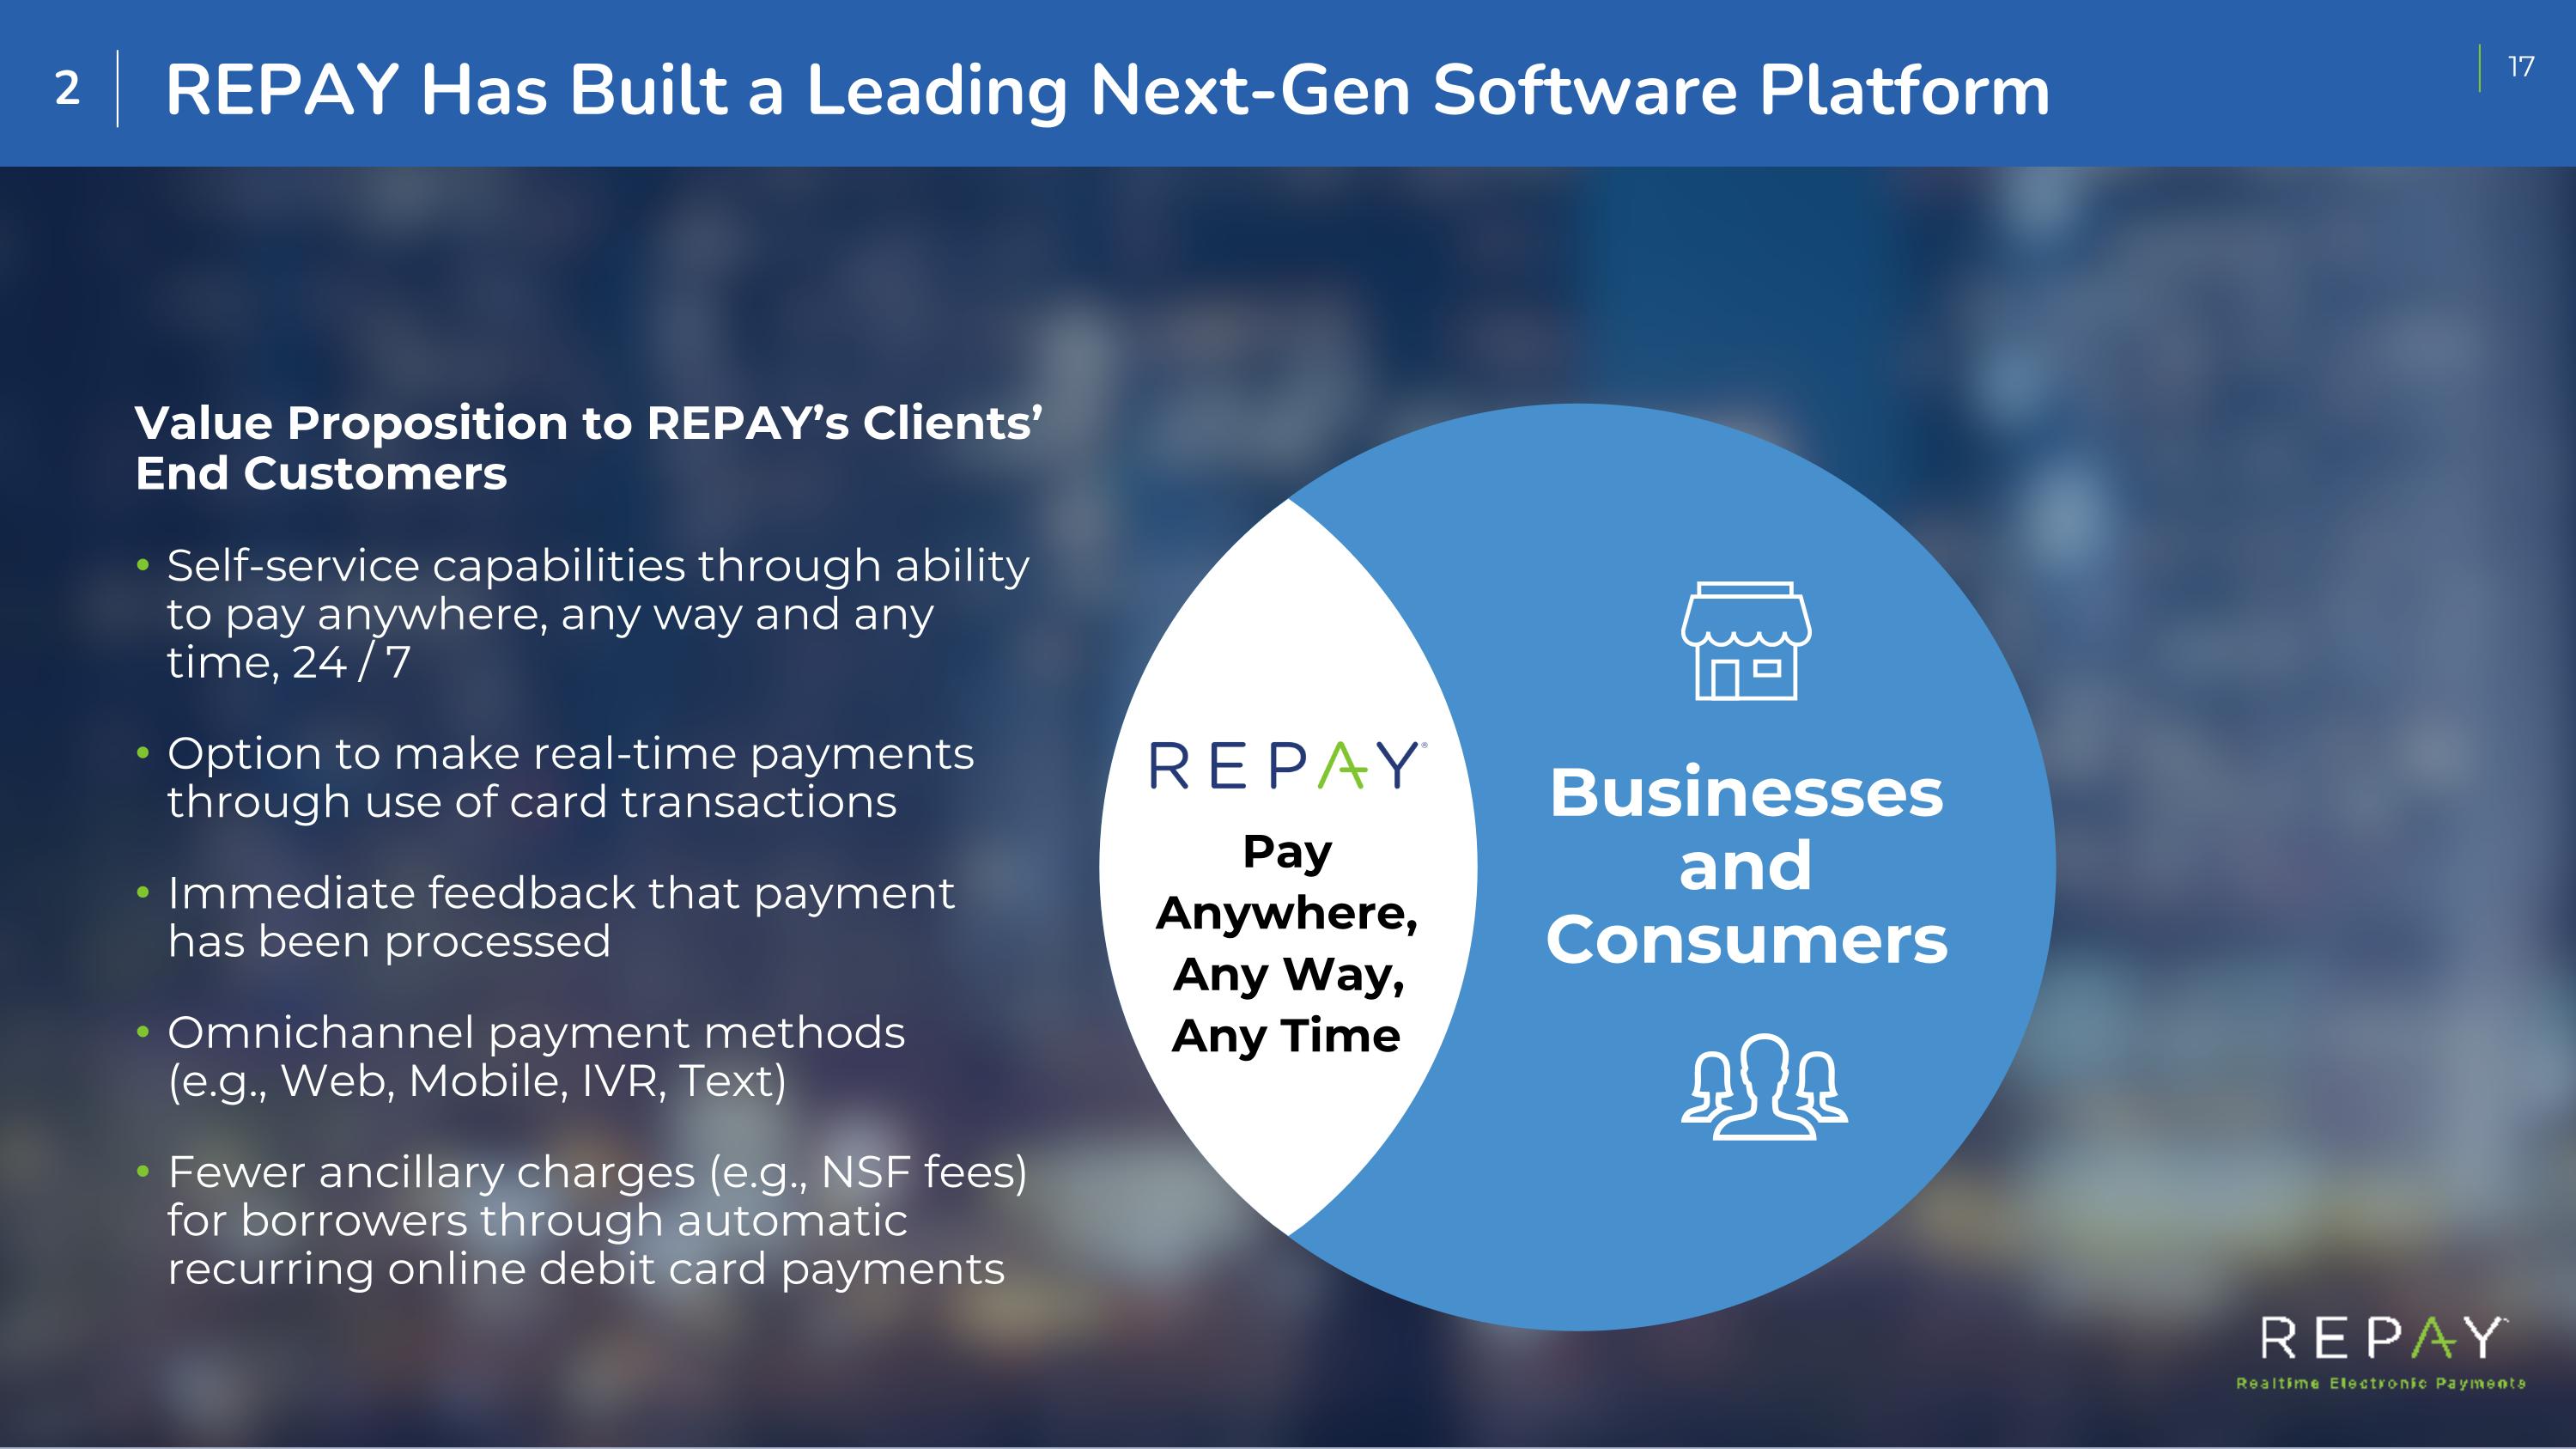
Value Proposition to REPAY’s Clients’ End Customers Self-service capabilities through ability to pay anywhere, any way and any time, 24 / 7 Option to make real-time payments through use of card transactions Immediate feedback that payment has been processed Omnichannel payment methods (e.g., Web, Mobile, IVR, Text) Fewer ancillary charges (e.g., NSF fees) for borrowers through automatic recurring online debit card payments 2 Pay Anywhere, Any Way, Any Time Businesses and Consumers REPAY Has Built a Leading Next-Gen Software Platform
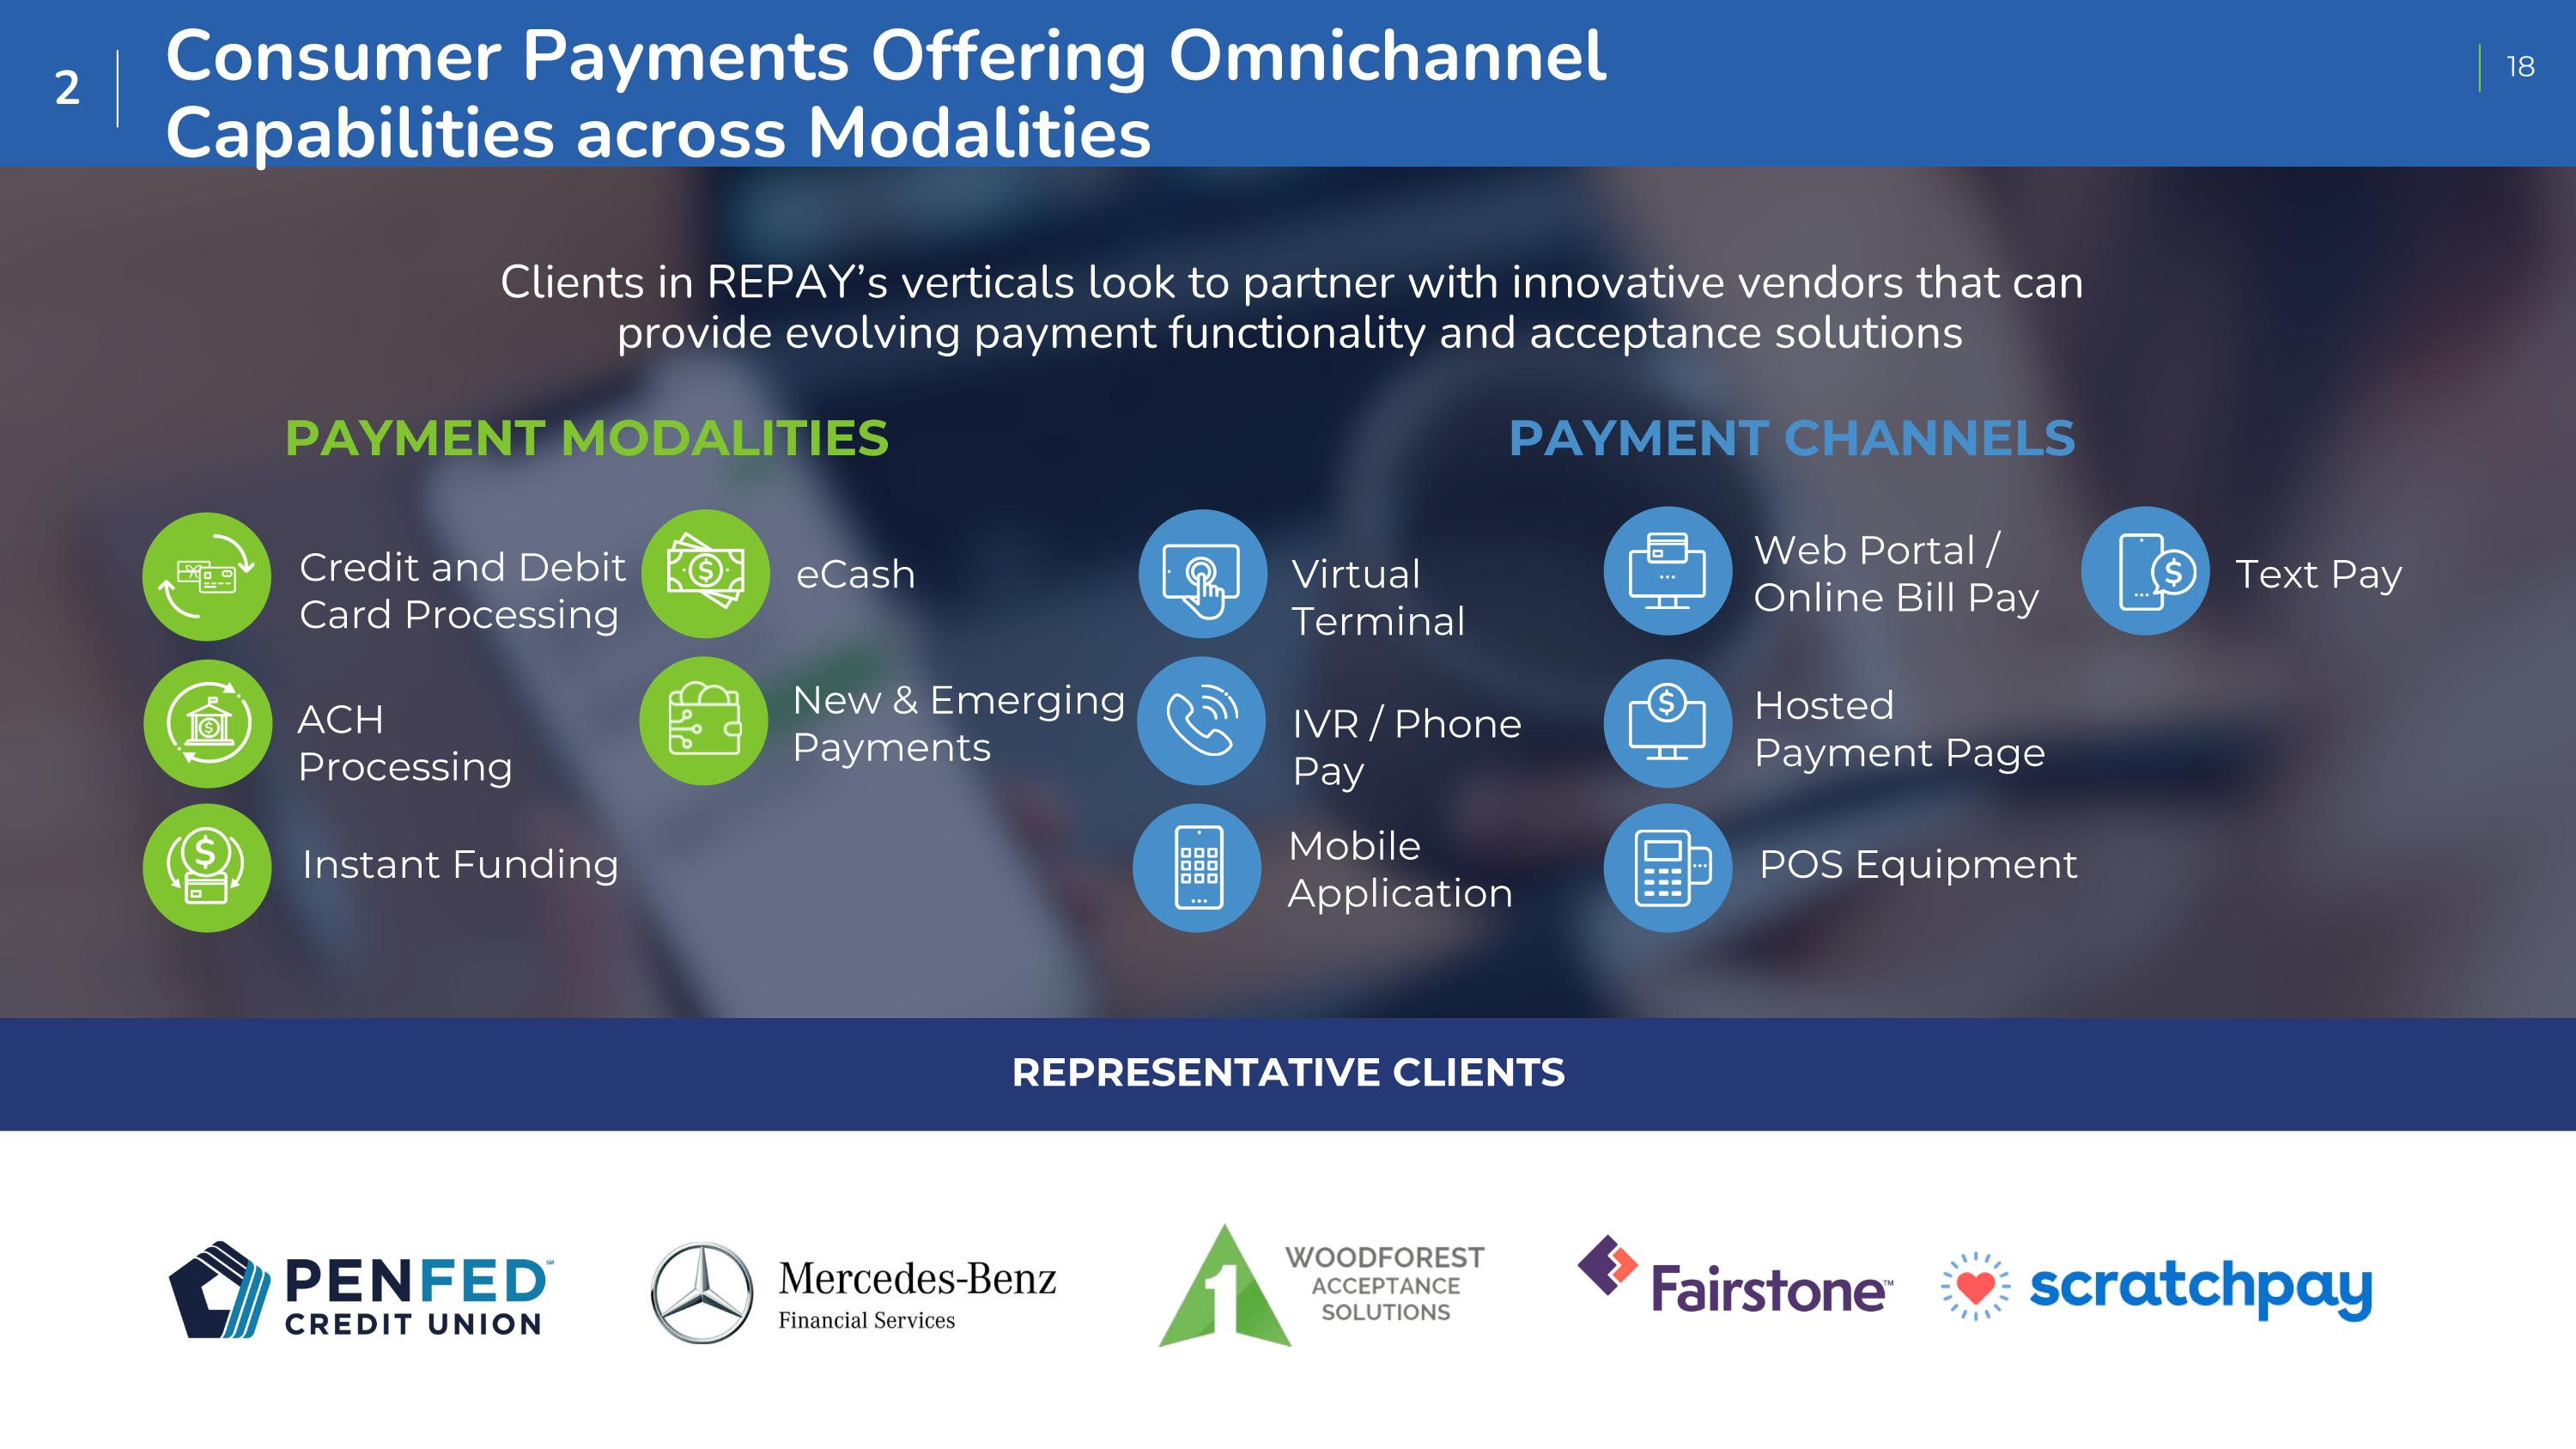
Consumer Payments Offering Omnichannel Capabilities across Modalities 2 Clients in REPAY’s verticals look to partner with innovative vendors that can provide evolving payment functionality and acceptance solutions Credit and Debit Card Processing ACH Processing Instant Funding eCash New & Emerging Payments Virtual Terminal IVR / Phone Pay Mobile Application Web Portal / Online Bill Pay Hosted Payment Page POS Equipment Text Pay PAYMENT MODALITIES PAYMENT CHANNELS REPRESENTATIVE CLIENTS
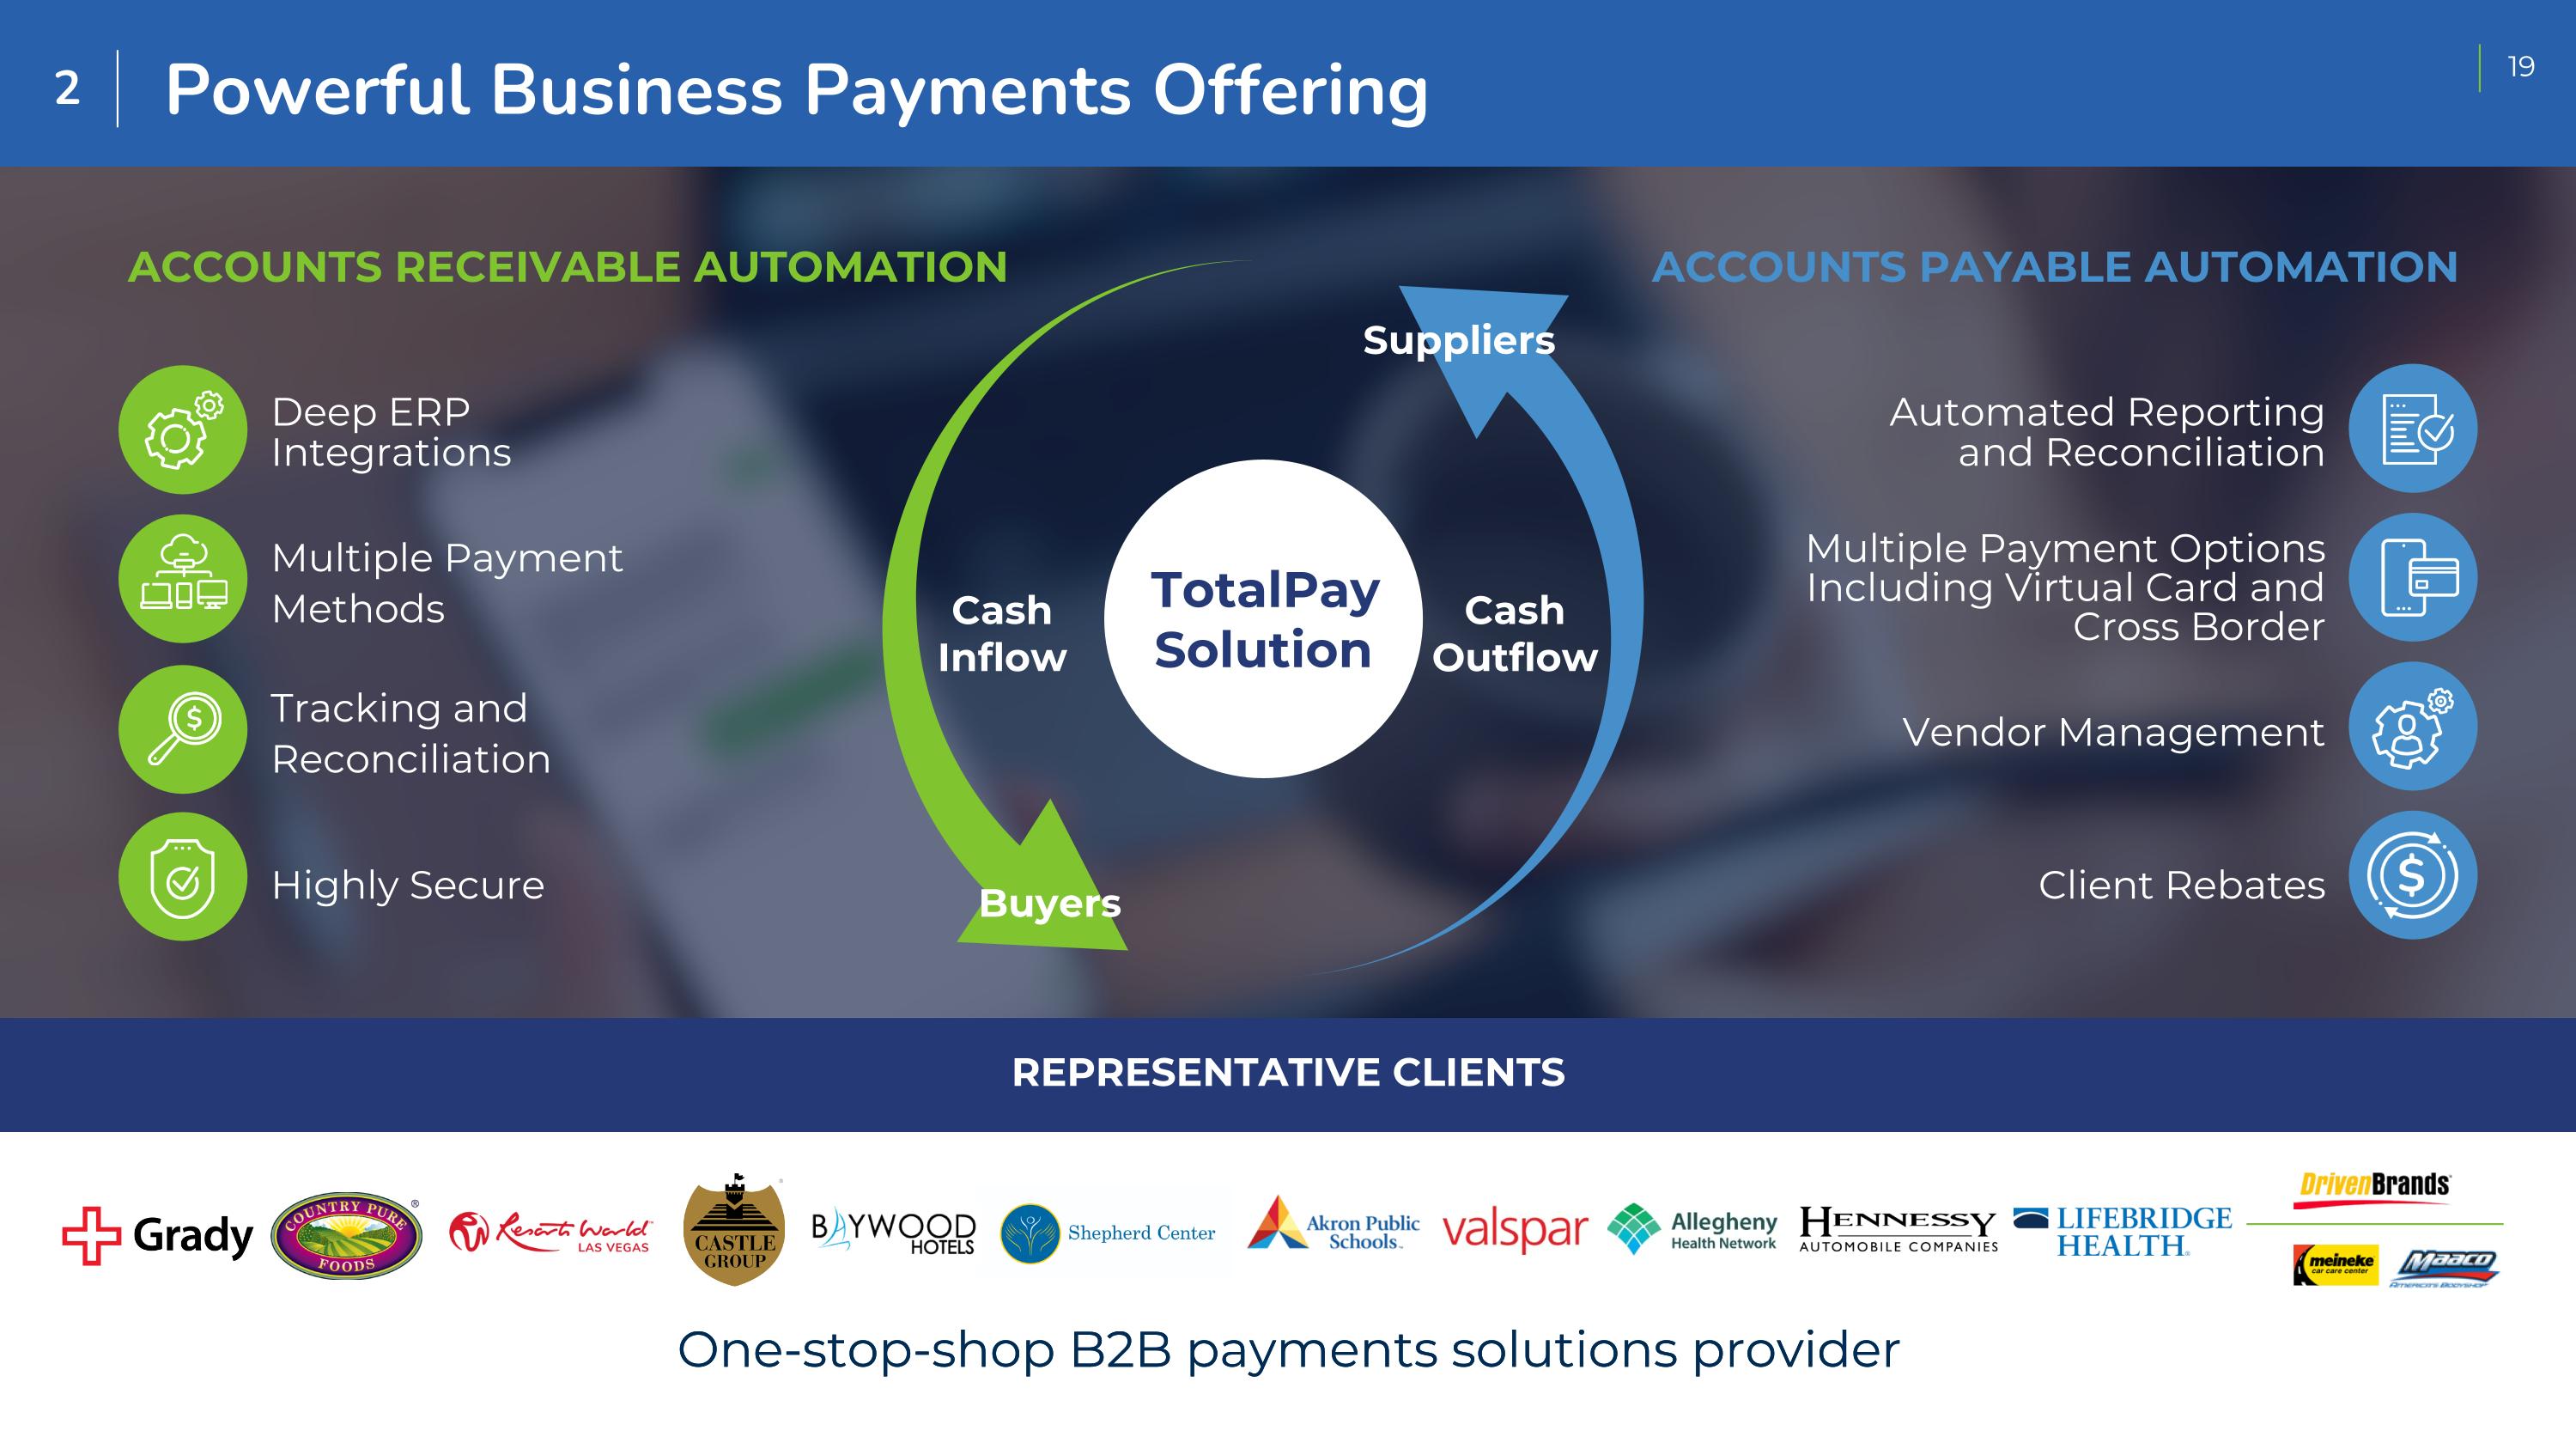
Powerful Business Payments Offering 2 One-stop-shop B2B payments solutions provider Automated Reporting and Reconciliation Multiple Payment Options Including Virtual Card and Cross Border Vendor Management Client Rebates Deep ERP Integrations Multiple Payment Methods Tracking and Reconciliation Highly Secure ACCOUNTS RECEIVABLE AUTOMATION ACCOUNTS PAYABLE AUTOMATION TotalPay Solution Cash Inflow Cash Outflow Buyers Suppliers One-stop-shop B2B payments solutions provider REPRESENTATIVE CLIENTS
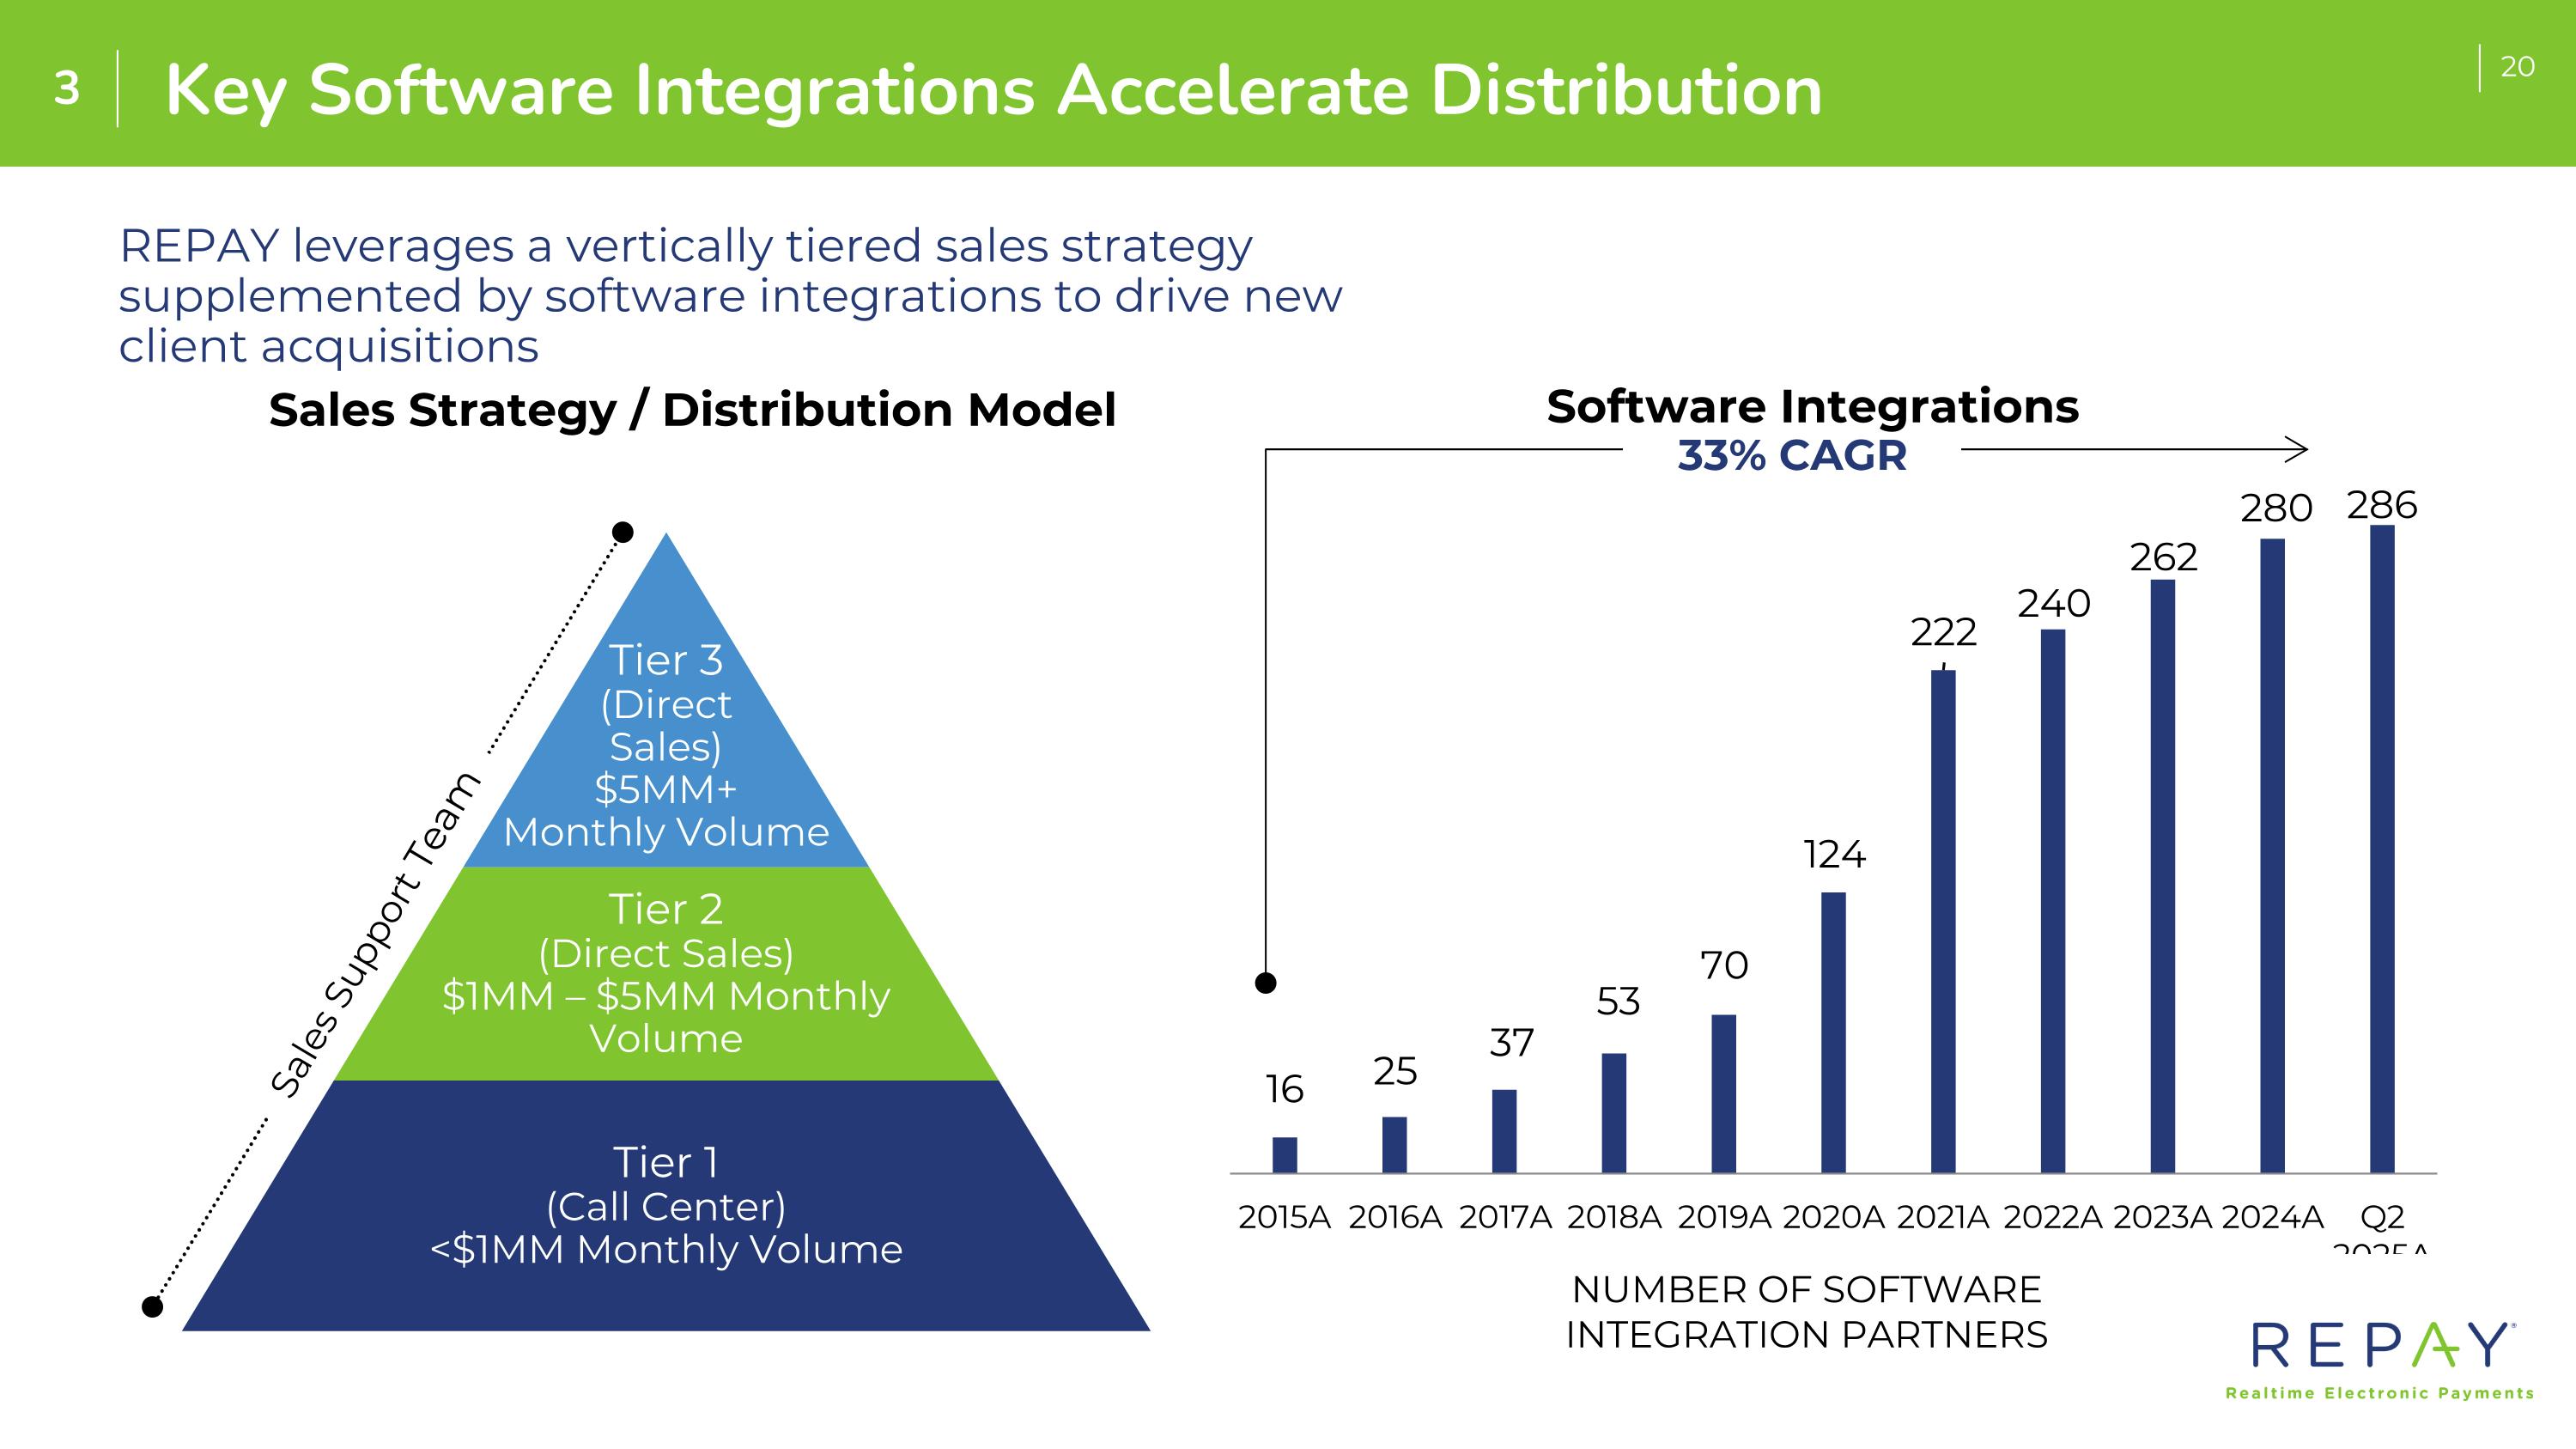
Key Software Integrations Accelerate Distribution REPAY leverages a vertically tiered sales strategy supplemented by software integrations to drive new client acquisitions Tier 3 (Direct Sales) $5MM+ Monthly Volume Tier 2 (Direct Sales) $1MM – $5MM Monthly Volume Tier 1 (Call Center) <$1MM Monthly Volume Sales Support Team NUMBER OF SOFTWARE INTEGRATION PARTNERS Sales Strategy / Distribution Model 3 33% CAGR Software Integrations
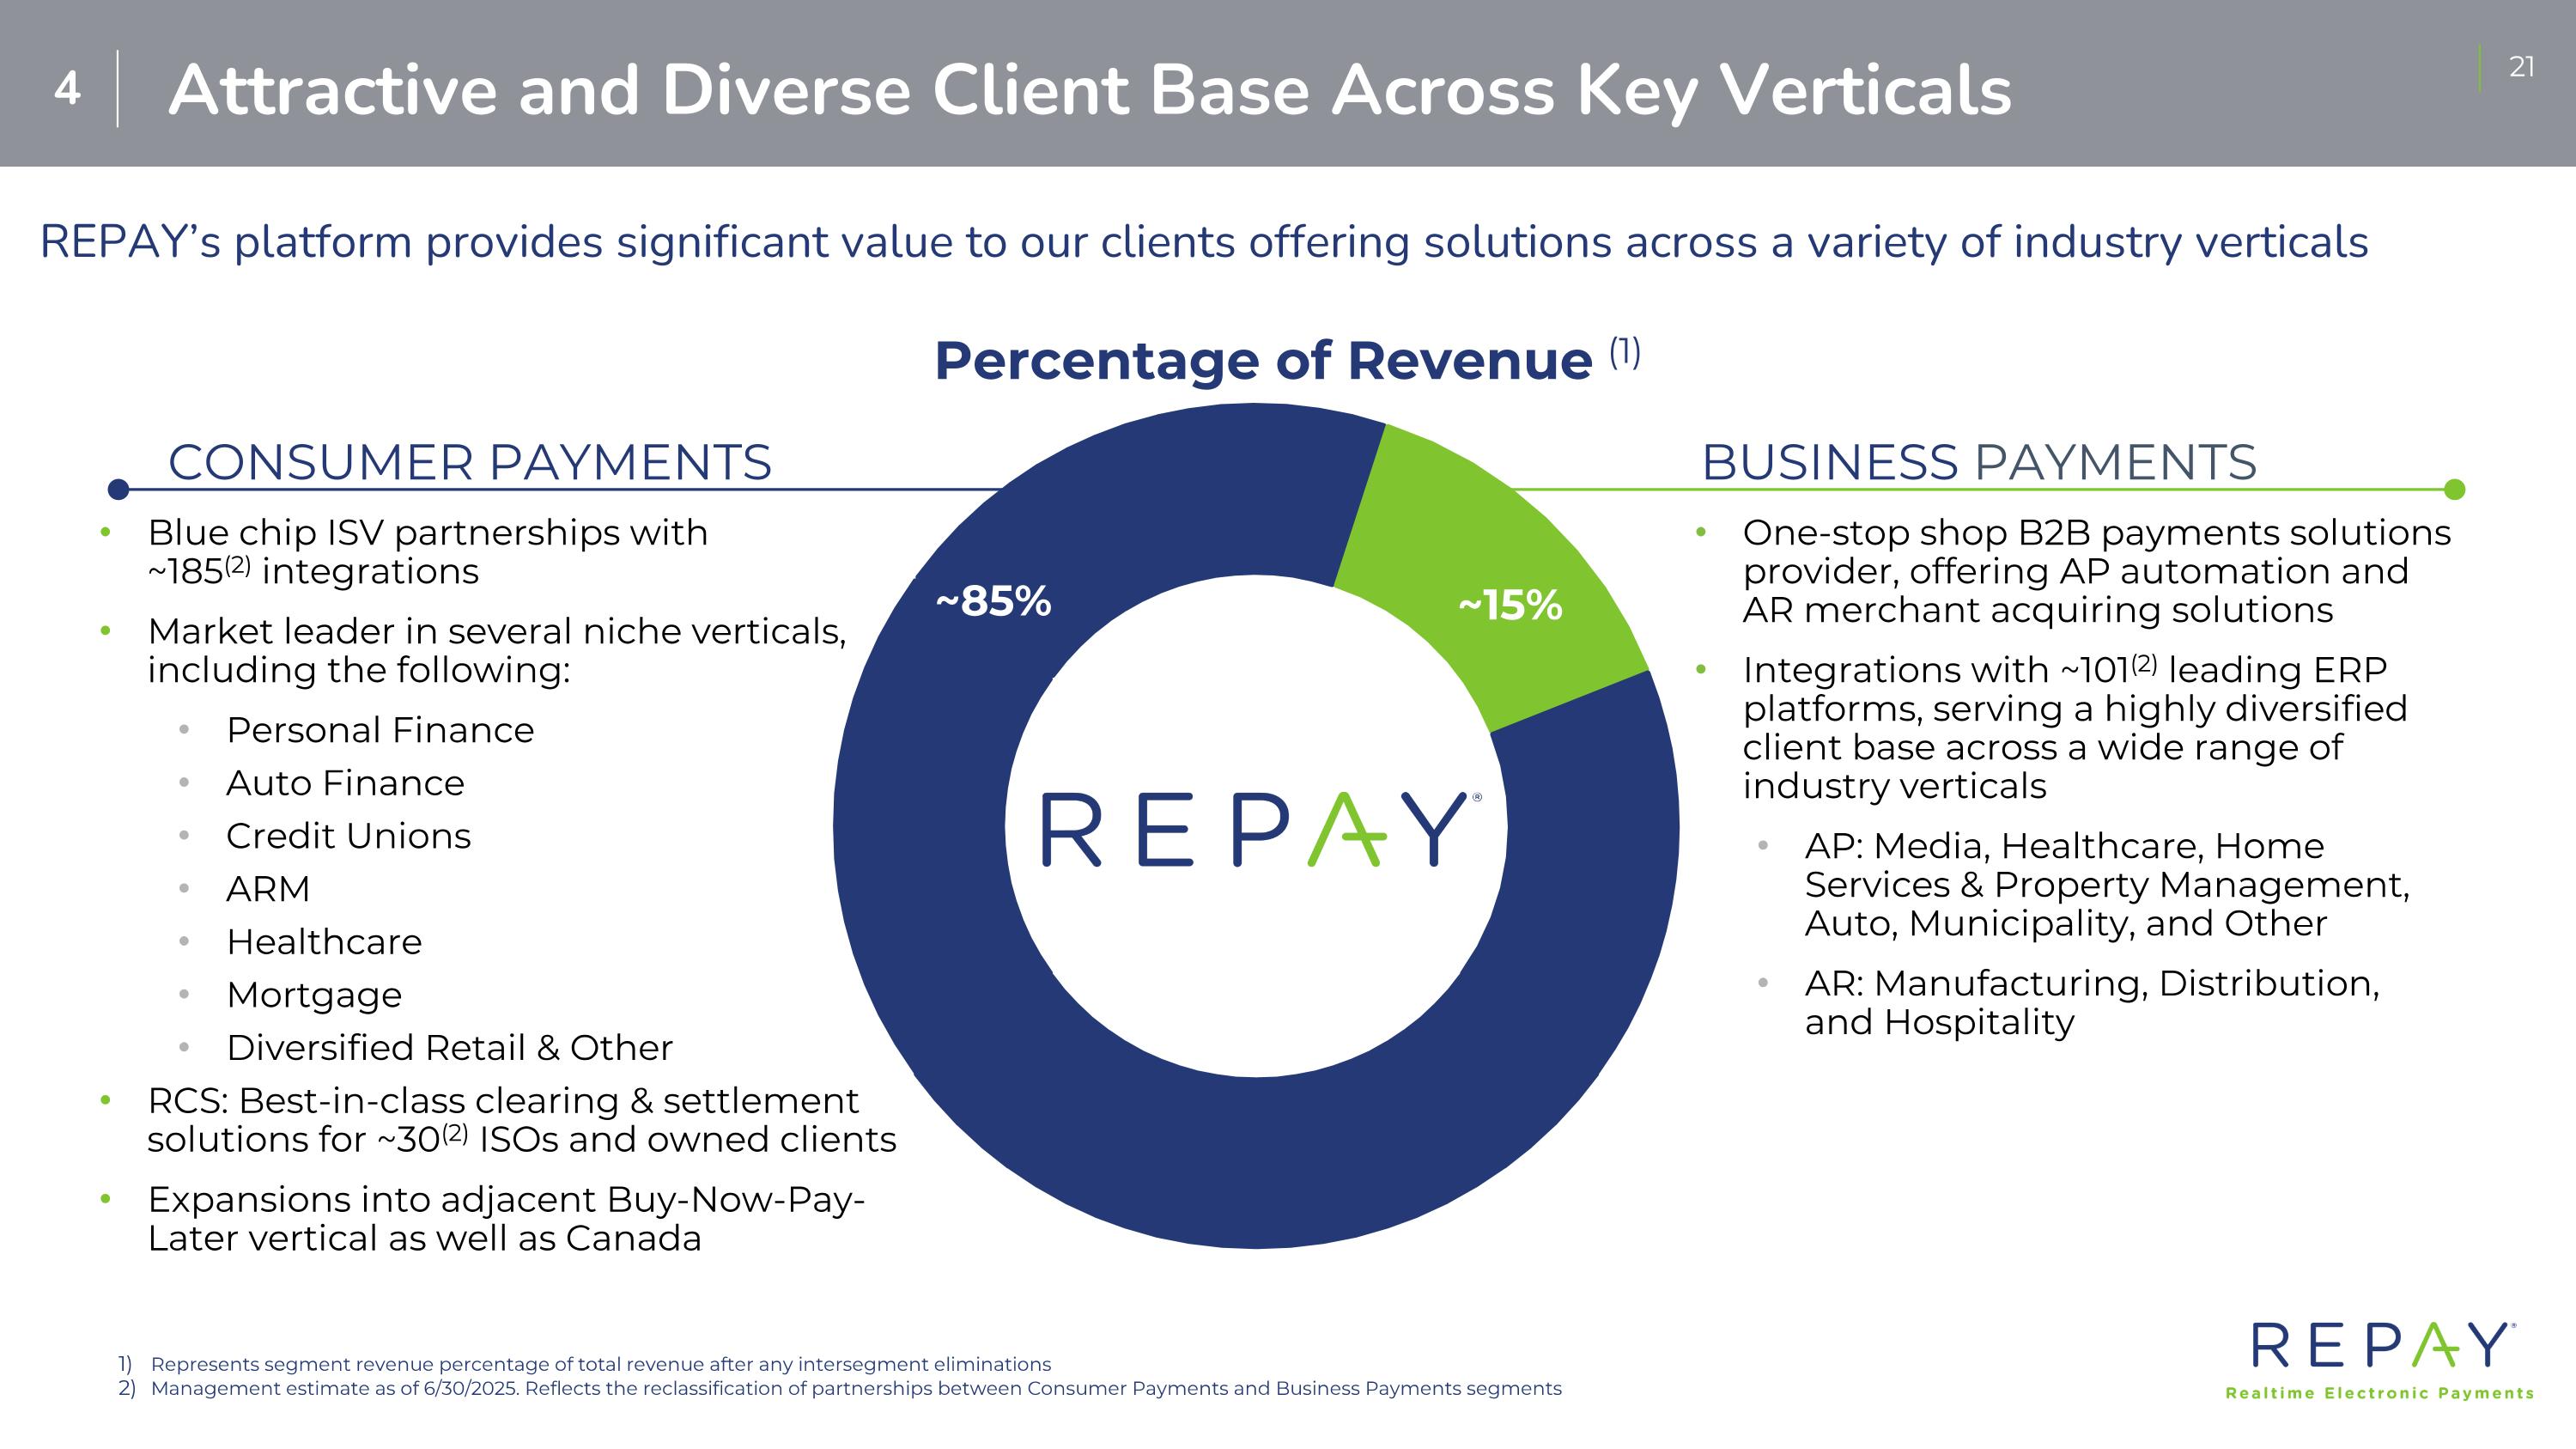
Attractive and Diverse Client Base Across Key Verticals REPAY’s platform provides significant value to our clients offering solutions across a variety of industry verticals Healthcare Other ARM B2B Loan Repayment ~20% of card payment volume(2) 4 Represents segment revenue percentage of total revenue after any intersegment eliminations Management estimate as of 6/30/2025. Reflects the reclassification of partnerships between Consumer Payments and Business Payments segments Percentage of Revenue (1) One-stop shop B2B payments solutions provider, offering AP automation and AR merchant acquiring solutions Integrations with ~101(2) leading ERP platforms, serving a highly diversified client base across a wide range of industry verticals AP: Media, Healthcare, Home Services & Property Management, Auto, Municipality, and Other AR: Manufacturing, Distribution, and Hospitality BUSINESS PAYMENTS CONSUMER PAYMENTS ~85% Blue chip ISV partnerships with ~185(2) integrations Market leader in several niche verticals, including the following: Personal Finance Auto Finance Credit Unions ARM Healthcare Mortgage Diversified Retail & Other RCS: Best-in-class clearing & settlement solutions for ~30(2) ISOs and owned clients Expansions into adjacent Buy-Now-Pay-Later vertical as well as Canada ~15%
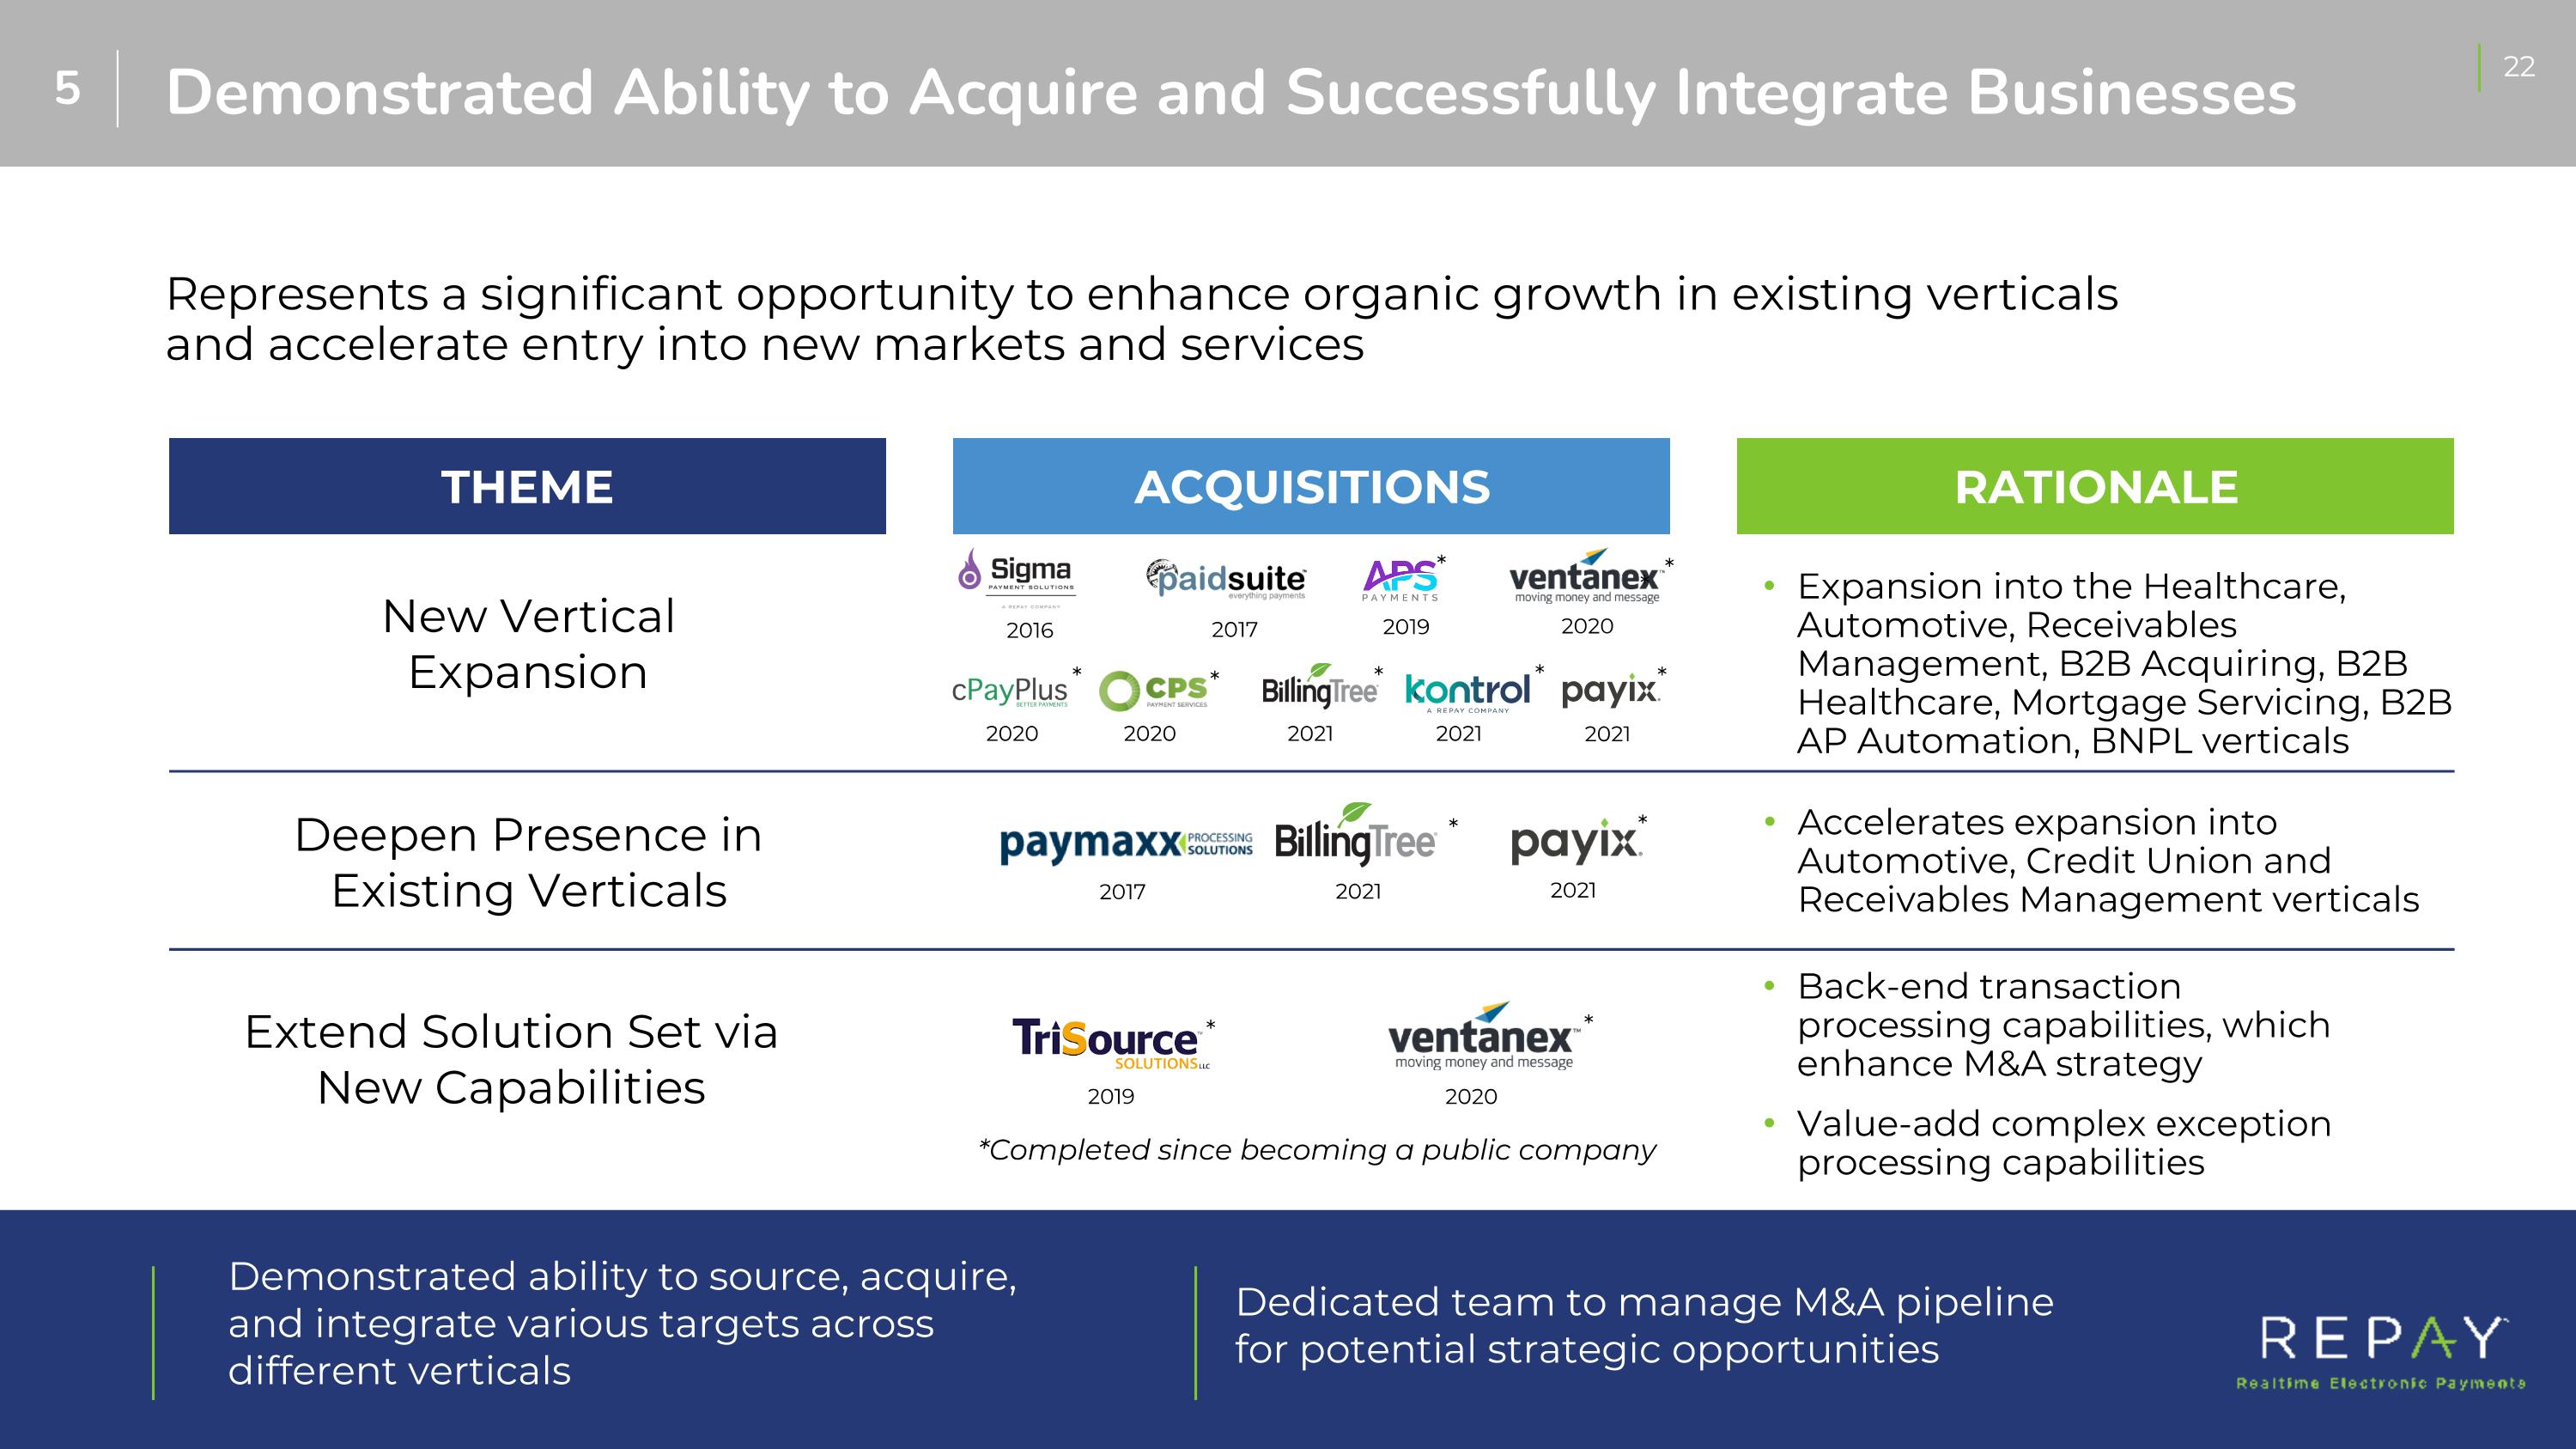
Demonstrated Ability to Acquire and Successfully Integrate Businesses Represents a significant opportunity to enhance organic growth in existing verticals and accelerate entry into new markets and services Extend Solution Set via New Capabilities New Vertical Expansion Deepen Presence in Existing Verticals Back-end transaction processing capabilities, which enhance M&A strategy Value-add complex exception processing capabilities Expansion into the Healthcare, Automotive, Receivables Management, B2B Acquiring, B2B Healthcare, Mortgage Servicing, B2B AP Automation, BNPL verticals Accelerates expansion into Automotive, Credit Union and Receivables Management verticals THEME Demonstrated ability to source, acquire, and integrate various targets across different verticals Dedicated team to manage M&A pipeline for potential strategic opportunities ACQUISITIONS RATIONALE 5 2017 2019 2016 2017 * 2019 * 2020 2020 * * 2020 * 2020 * 2021 2021 * * 2021 * 2021 * 2021 * *Completed since becoming a public company *
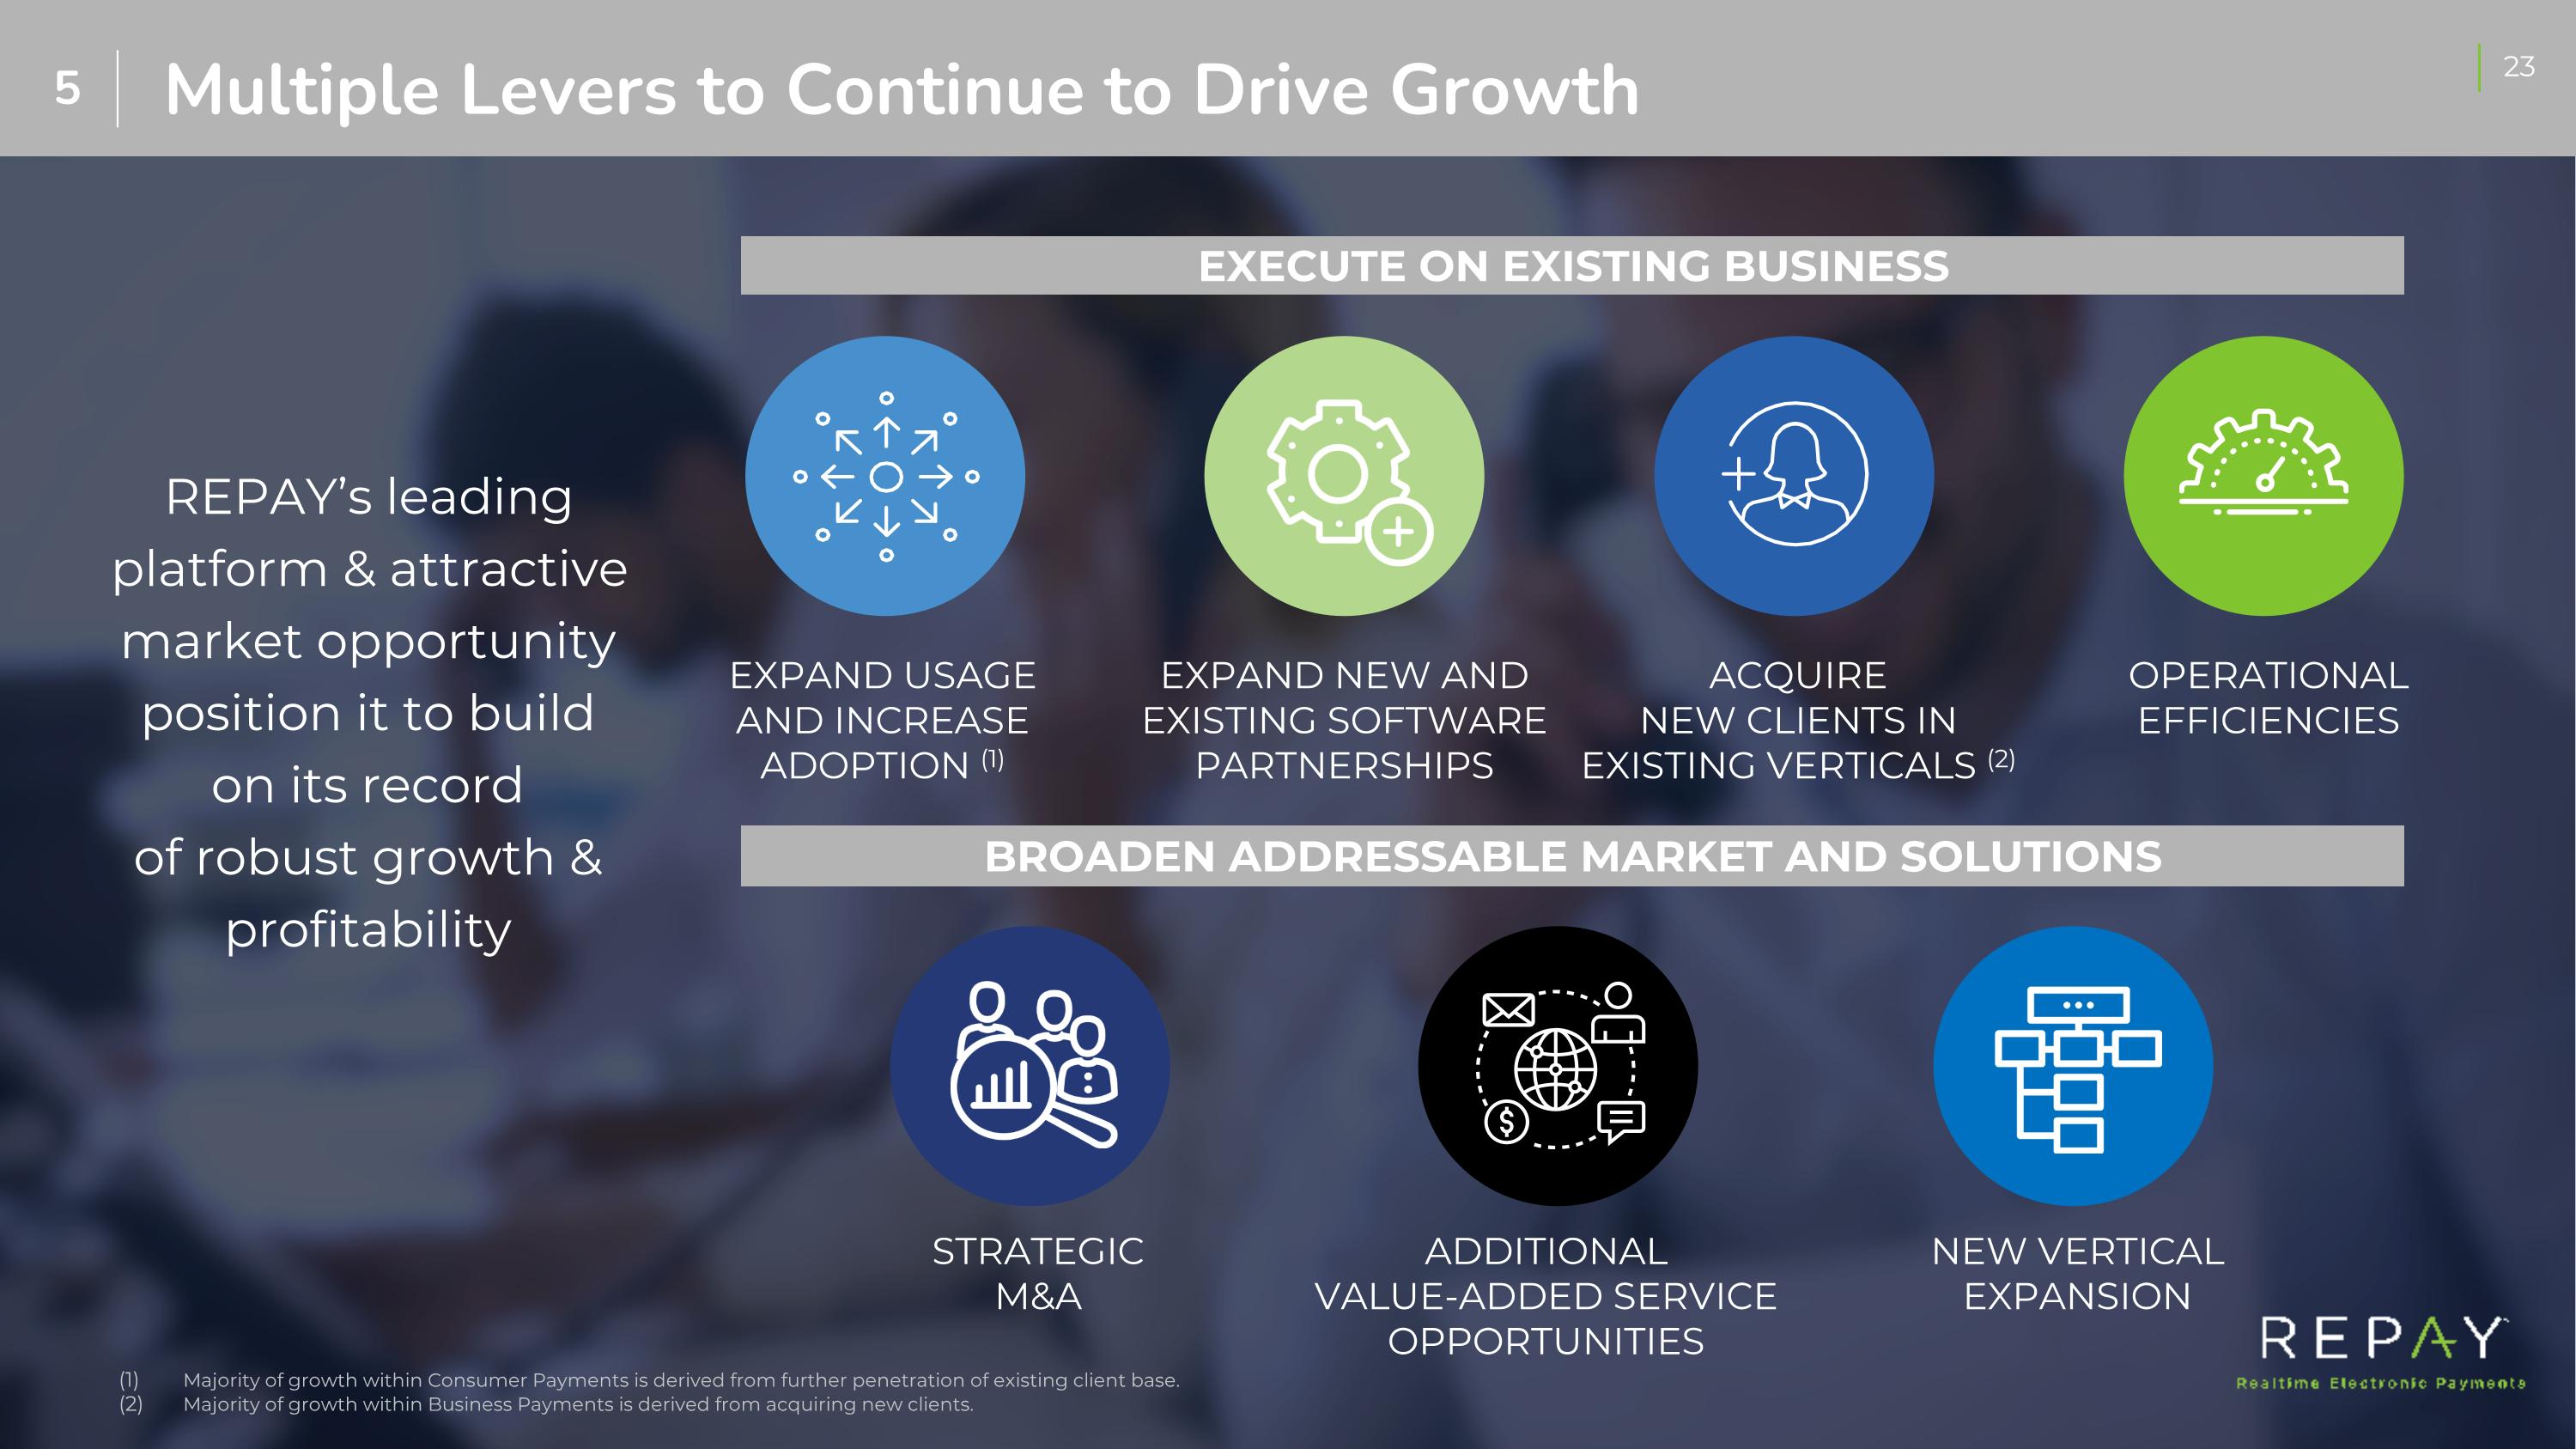
Majority of growth within Consumer Payments is derived from further penetration of existing client base. Majority of growth within Business Payments is derived from acquiring new clients. Multiple Levers to Continue to Drive Growth EXPAND USAGE AND INCREASE ADOPTION (1) ACQUIRE NEW CLIENTS IN EXISTING VERTICALS (2) OPERATIONAL EFFICIENCIES ADDITIONAL VALUE-ADDED SERVICE OPPORTUNITIES REPAY’s leading platform & attractive market opportunity position it to build on its record of robust growth & profitability EXECUTE ON EXISTING BUSINESS BROADEN ADDRESSABLE MARKET AND SOLUTIONS 5 NEW VERTICAL EXPANSION EXPAND NEW AND EXISTING SOFTWARE PARTNERSHIPS STRATEGIC M&A
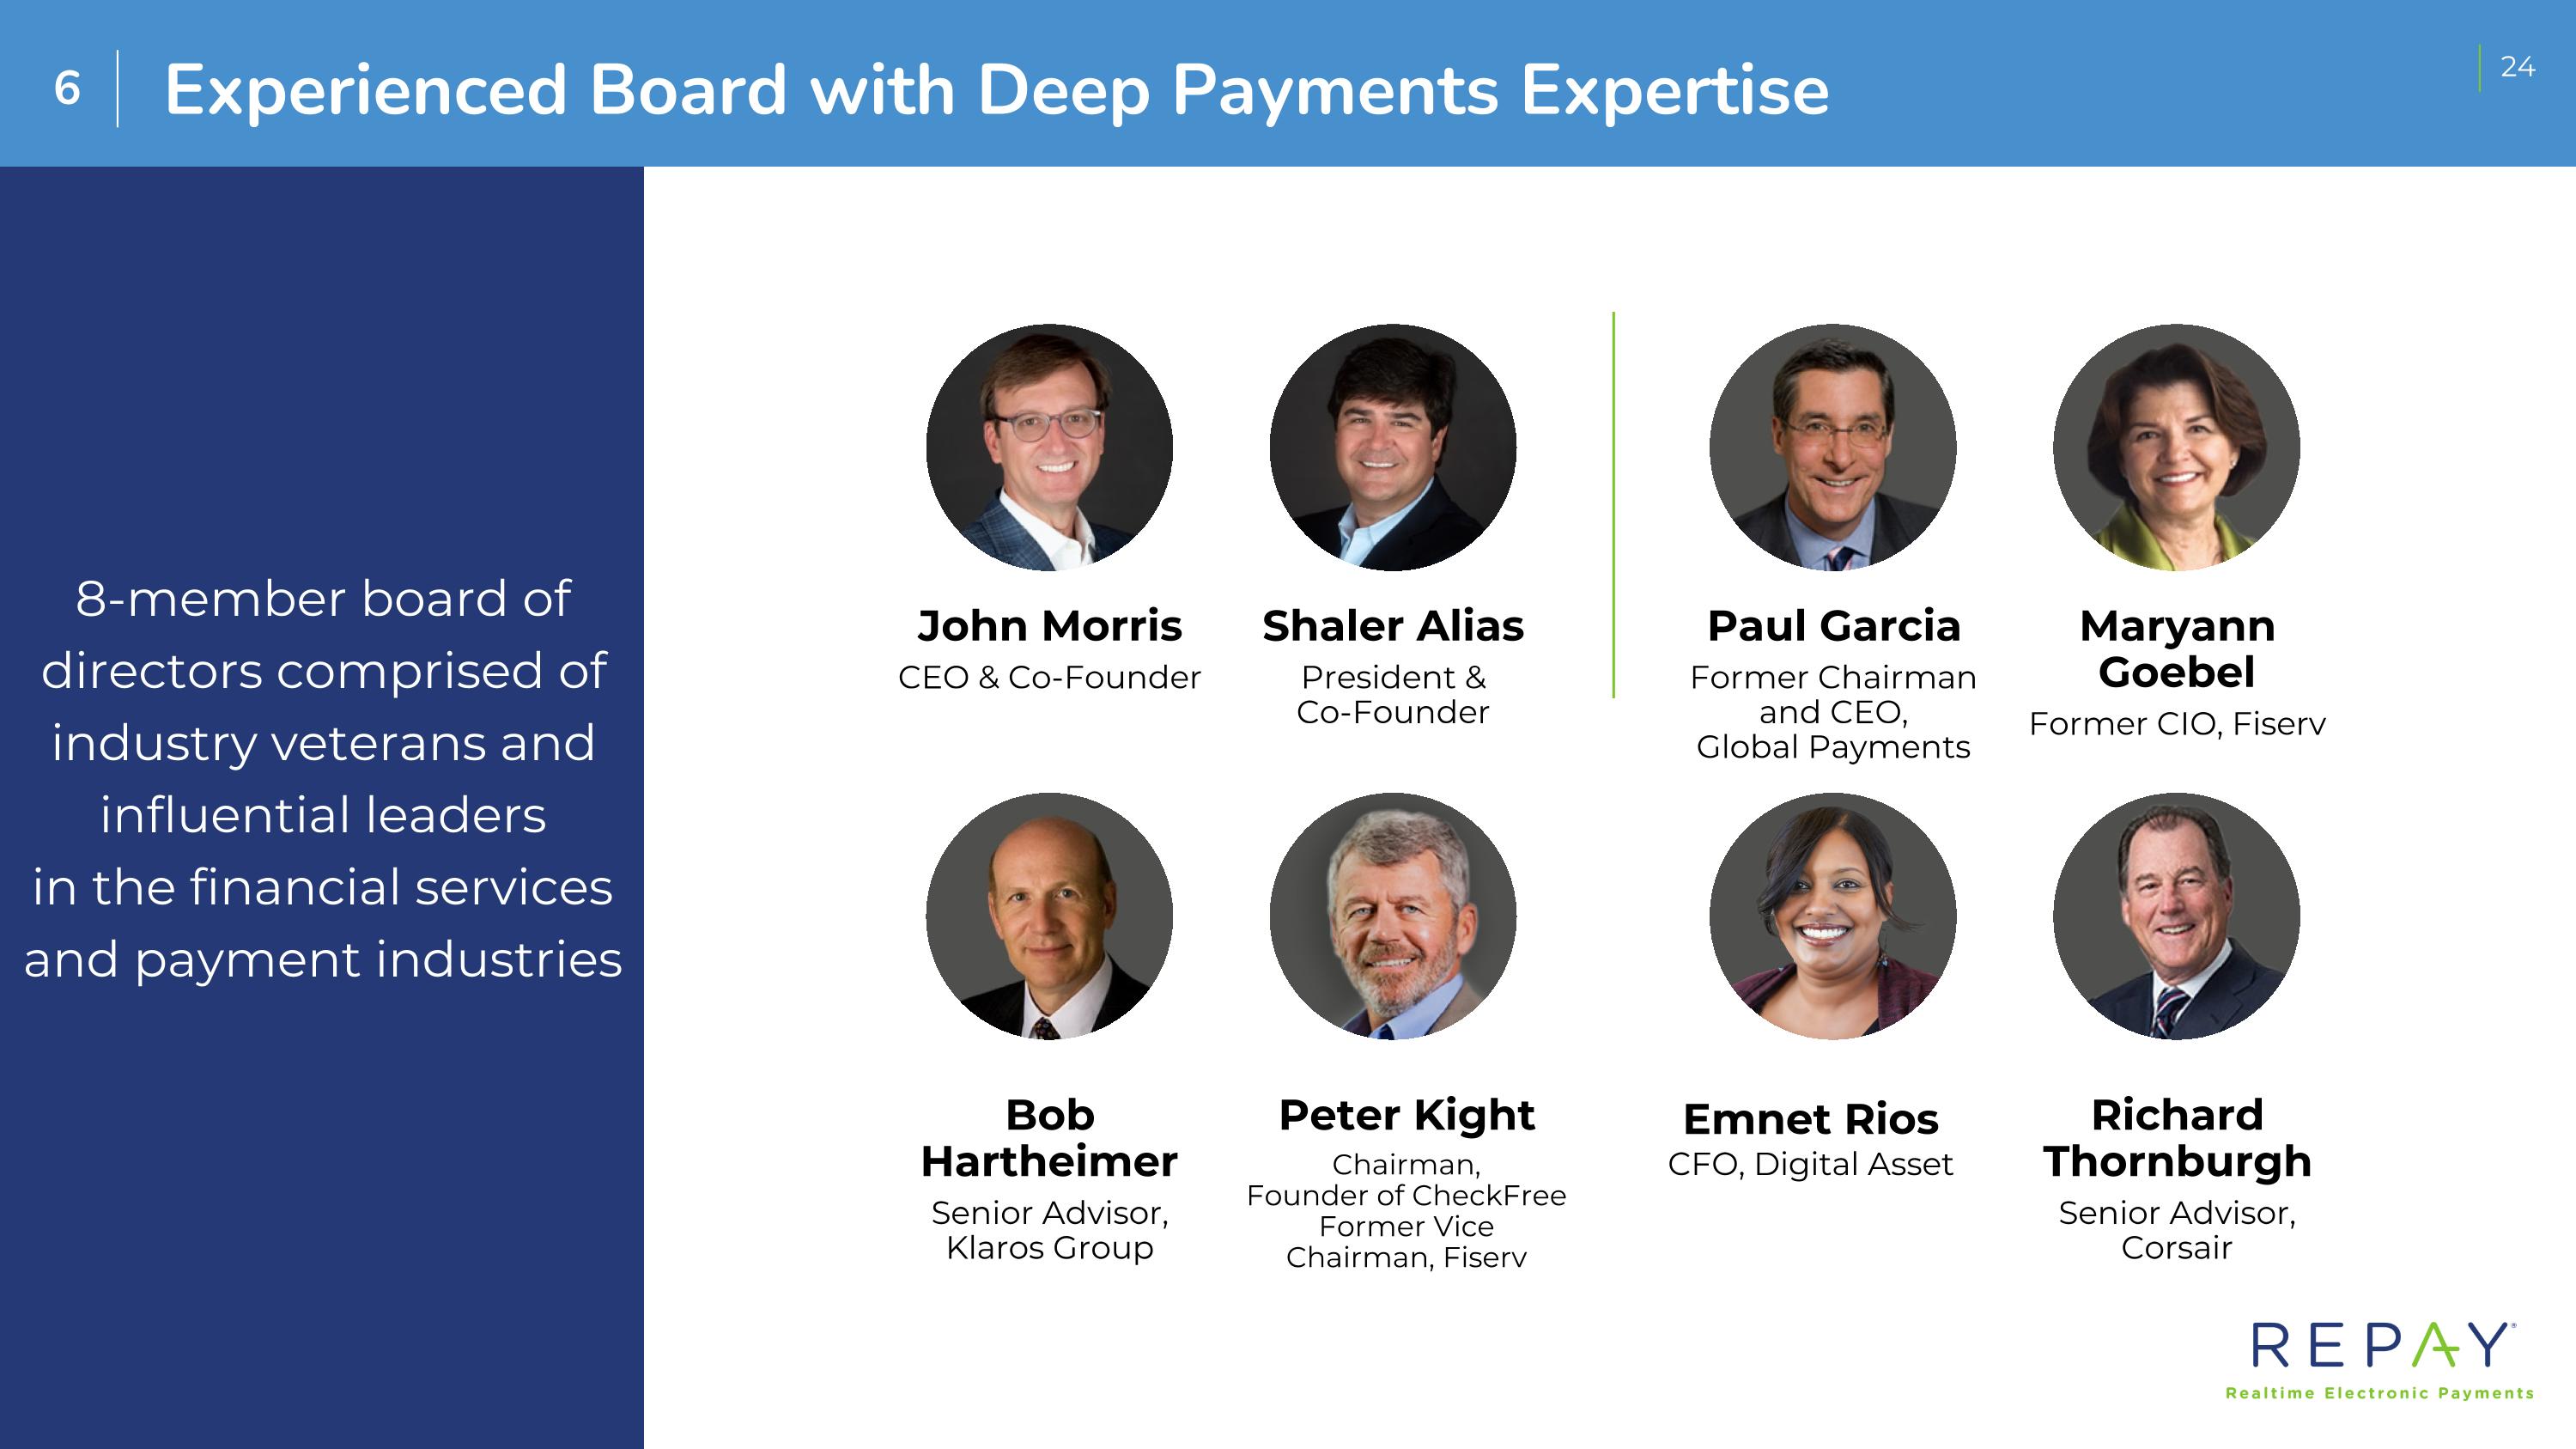
Richard Thornburgh Senior Advisor, Corsair Bob Hartheimer Senior Advisor, Klaros Group Experienced Board with Deep Payments Expertise John Morris CEO & Co-Founder Shaler Alias President & Co-Founder Peter Kight Chairman, Founder of CheckFree Former Vice Chairman, Fiserv Paul Garcia Former Chairman and CEO, Global Payments Maryann Goebel Former CIO, Fiserv 8-member board of directors comprised of industry veterans and influential leaders in the financial services and payment industries Emnet Rios CFO, Digital Asset 6

3 REPAY Financial Overview
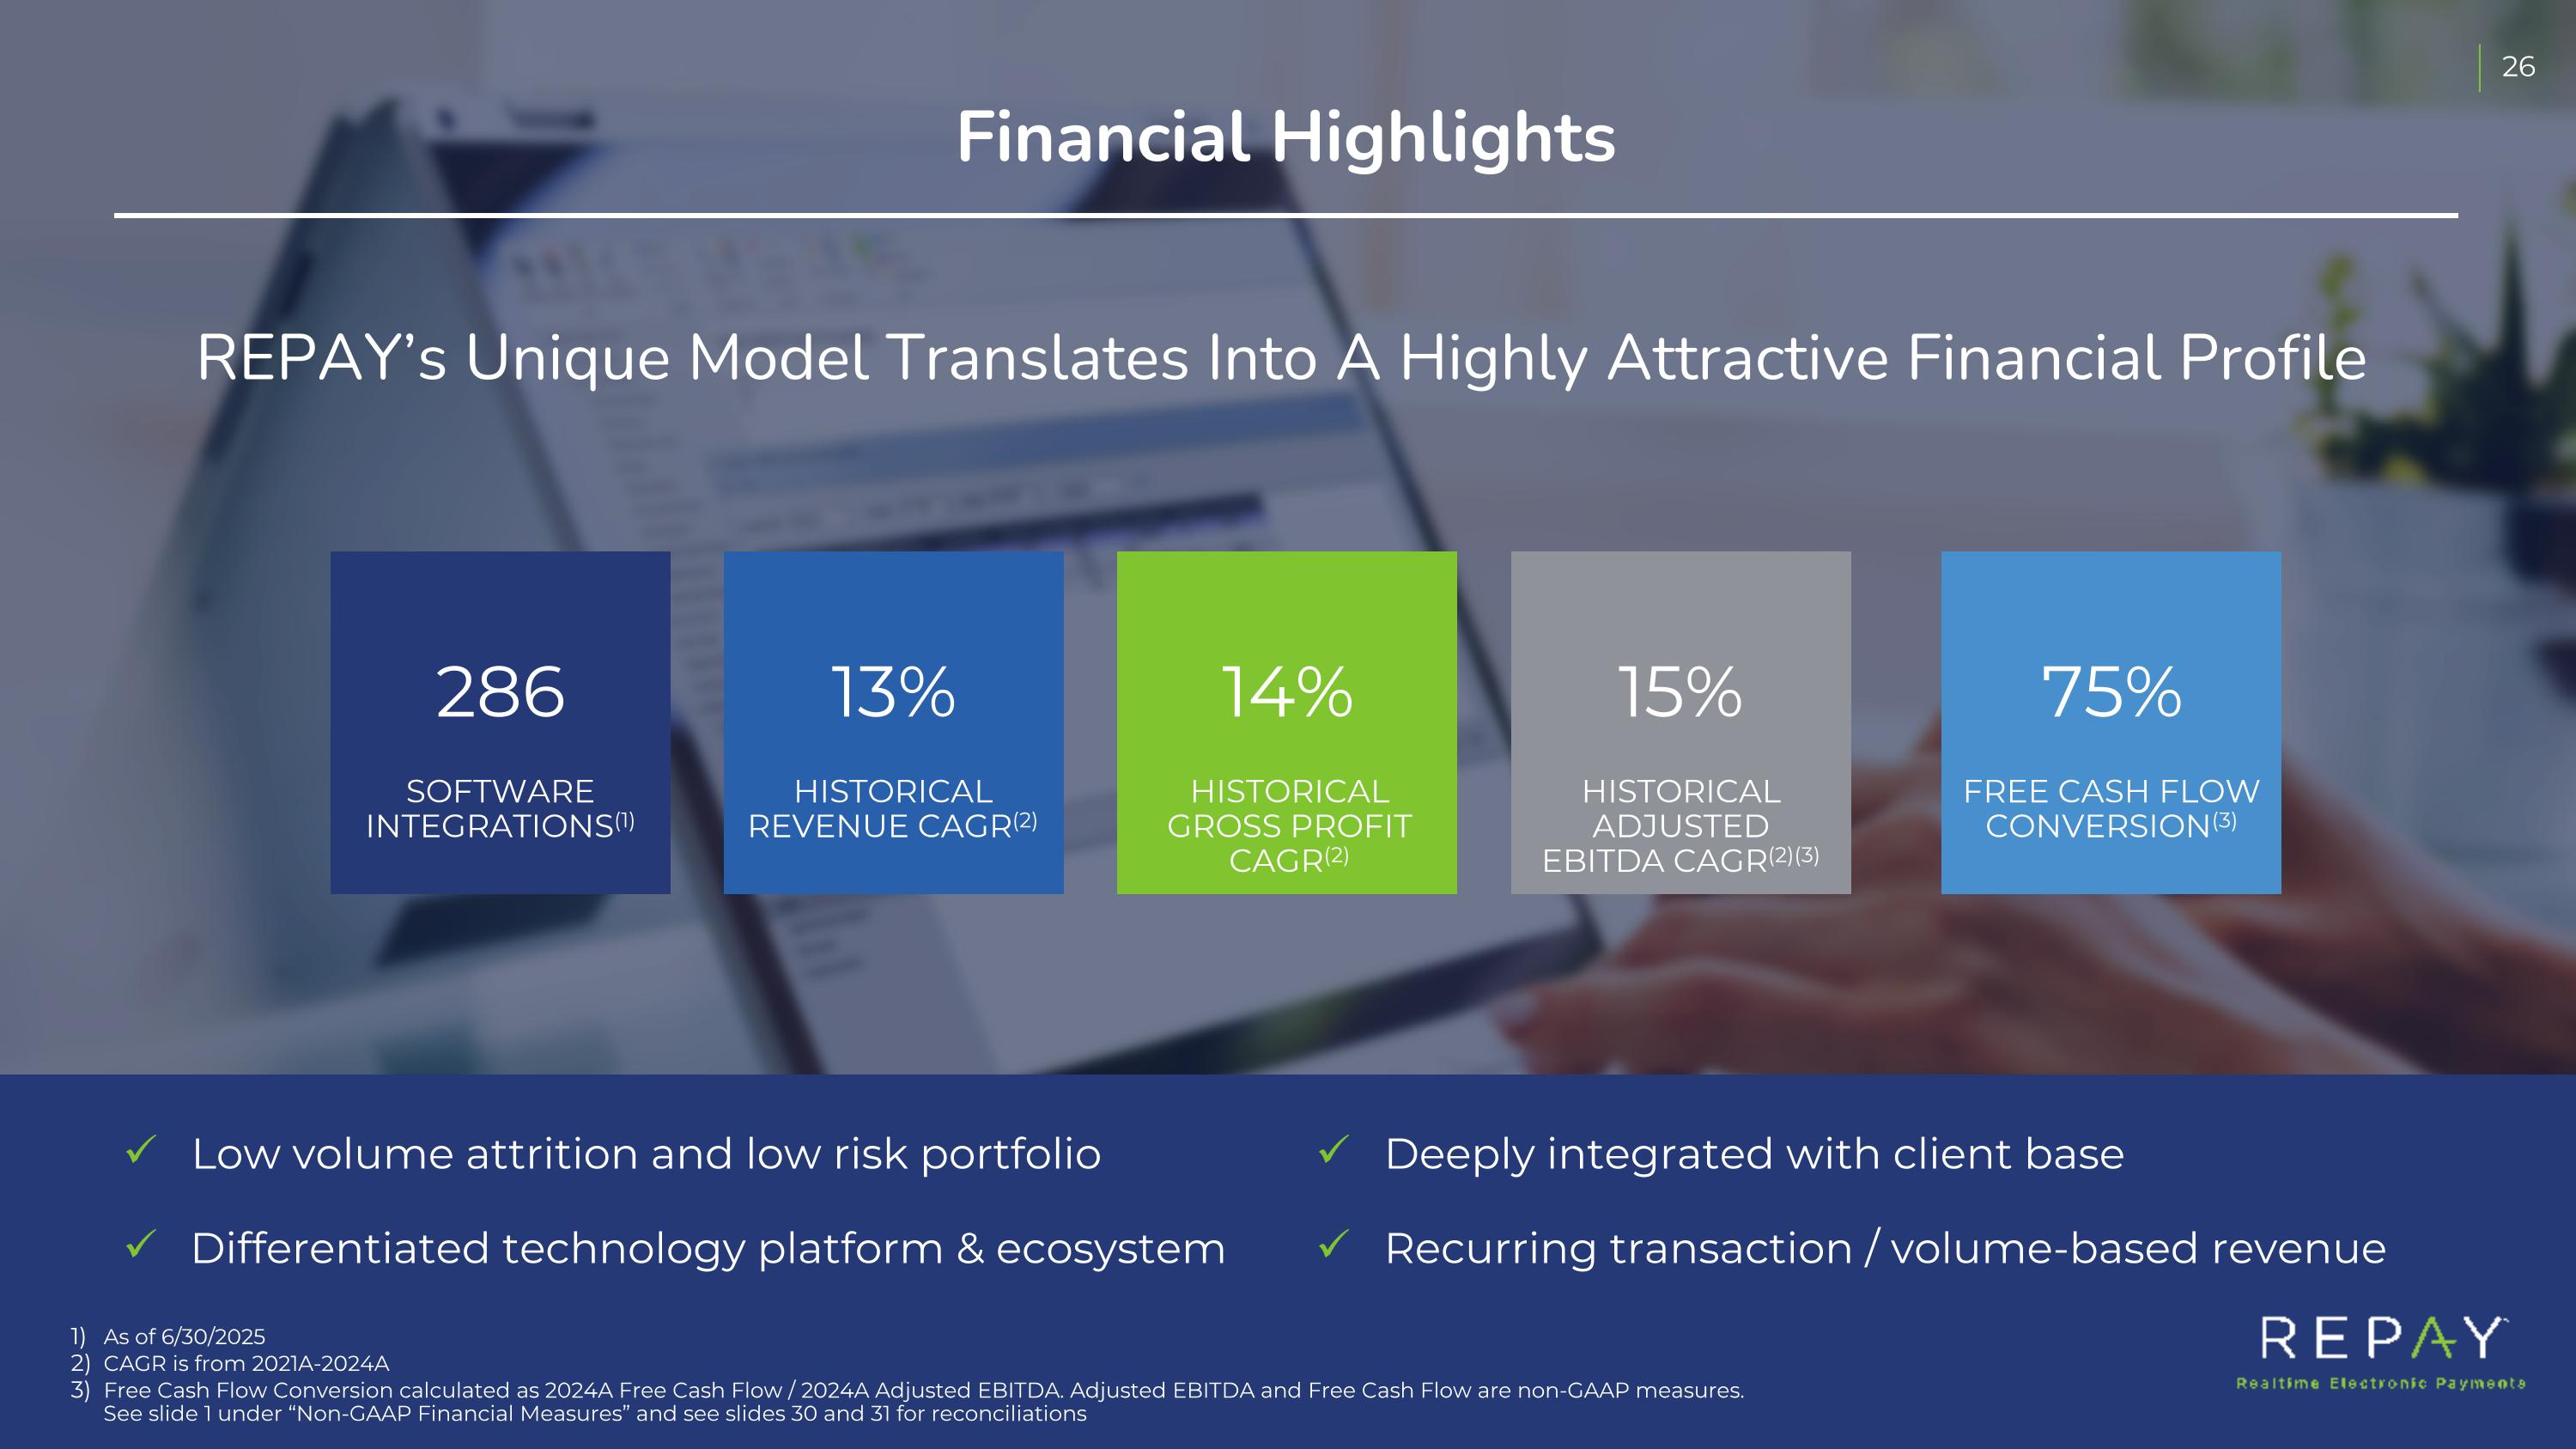
Financial Highlights Low volume attrition and low risk portfolio Differentiated technology platform & ecosystem Deeply integrated with client base Recurring transaction / volume-based revenue SOFTWARE INTEGRATIONS(1) 286 HISTORICAL REVENUE CAGR(2) 13% HISTORICAL GROSS PROFIT CAGR(2) 14% HISTORICAL ADJUSTED EBITDA CAGR(2)(3) 15% FREE CASH FLOW CONVERSION(3) 75% REPAY’s Unique Model Translates Into A Highly Attractive Financial Profile As of 6/30/2025 CAGR is from 2021A-2024A Free Cash Flow Conversion calculated as 2024A Free Cash Flow / 2024A Adjusted EBITDA. Adjusted EBITDA and Free Cash Flow are non-GAAP measures. See slide 1 under “Non-GAAP Financial Measures” and see slides 30 and 31 for reconciliations
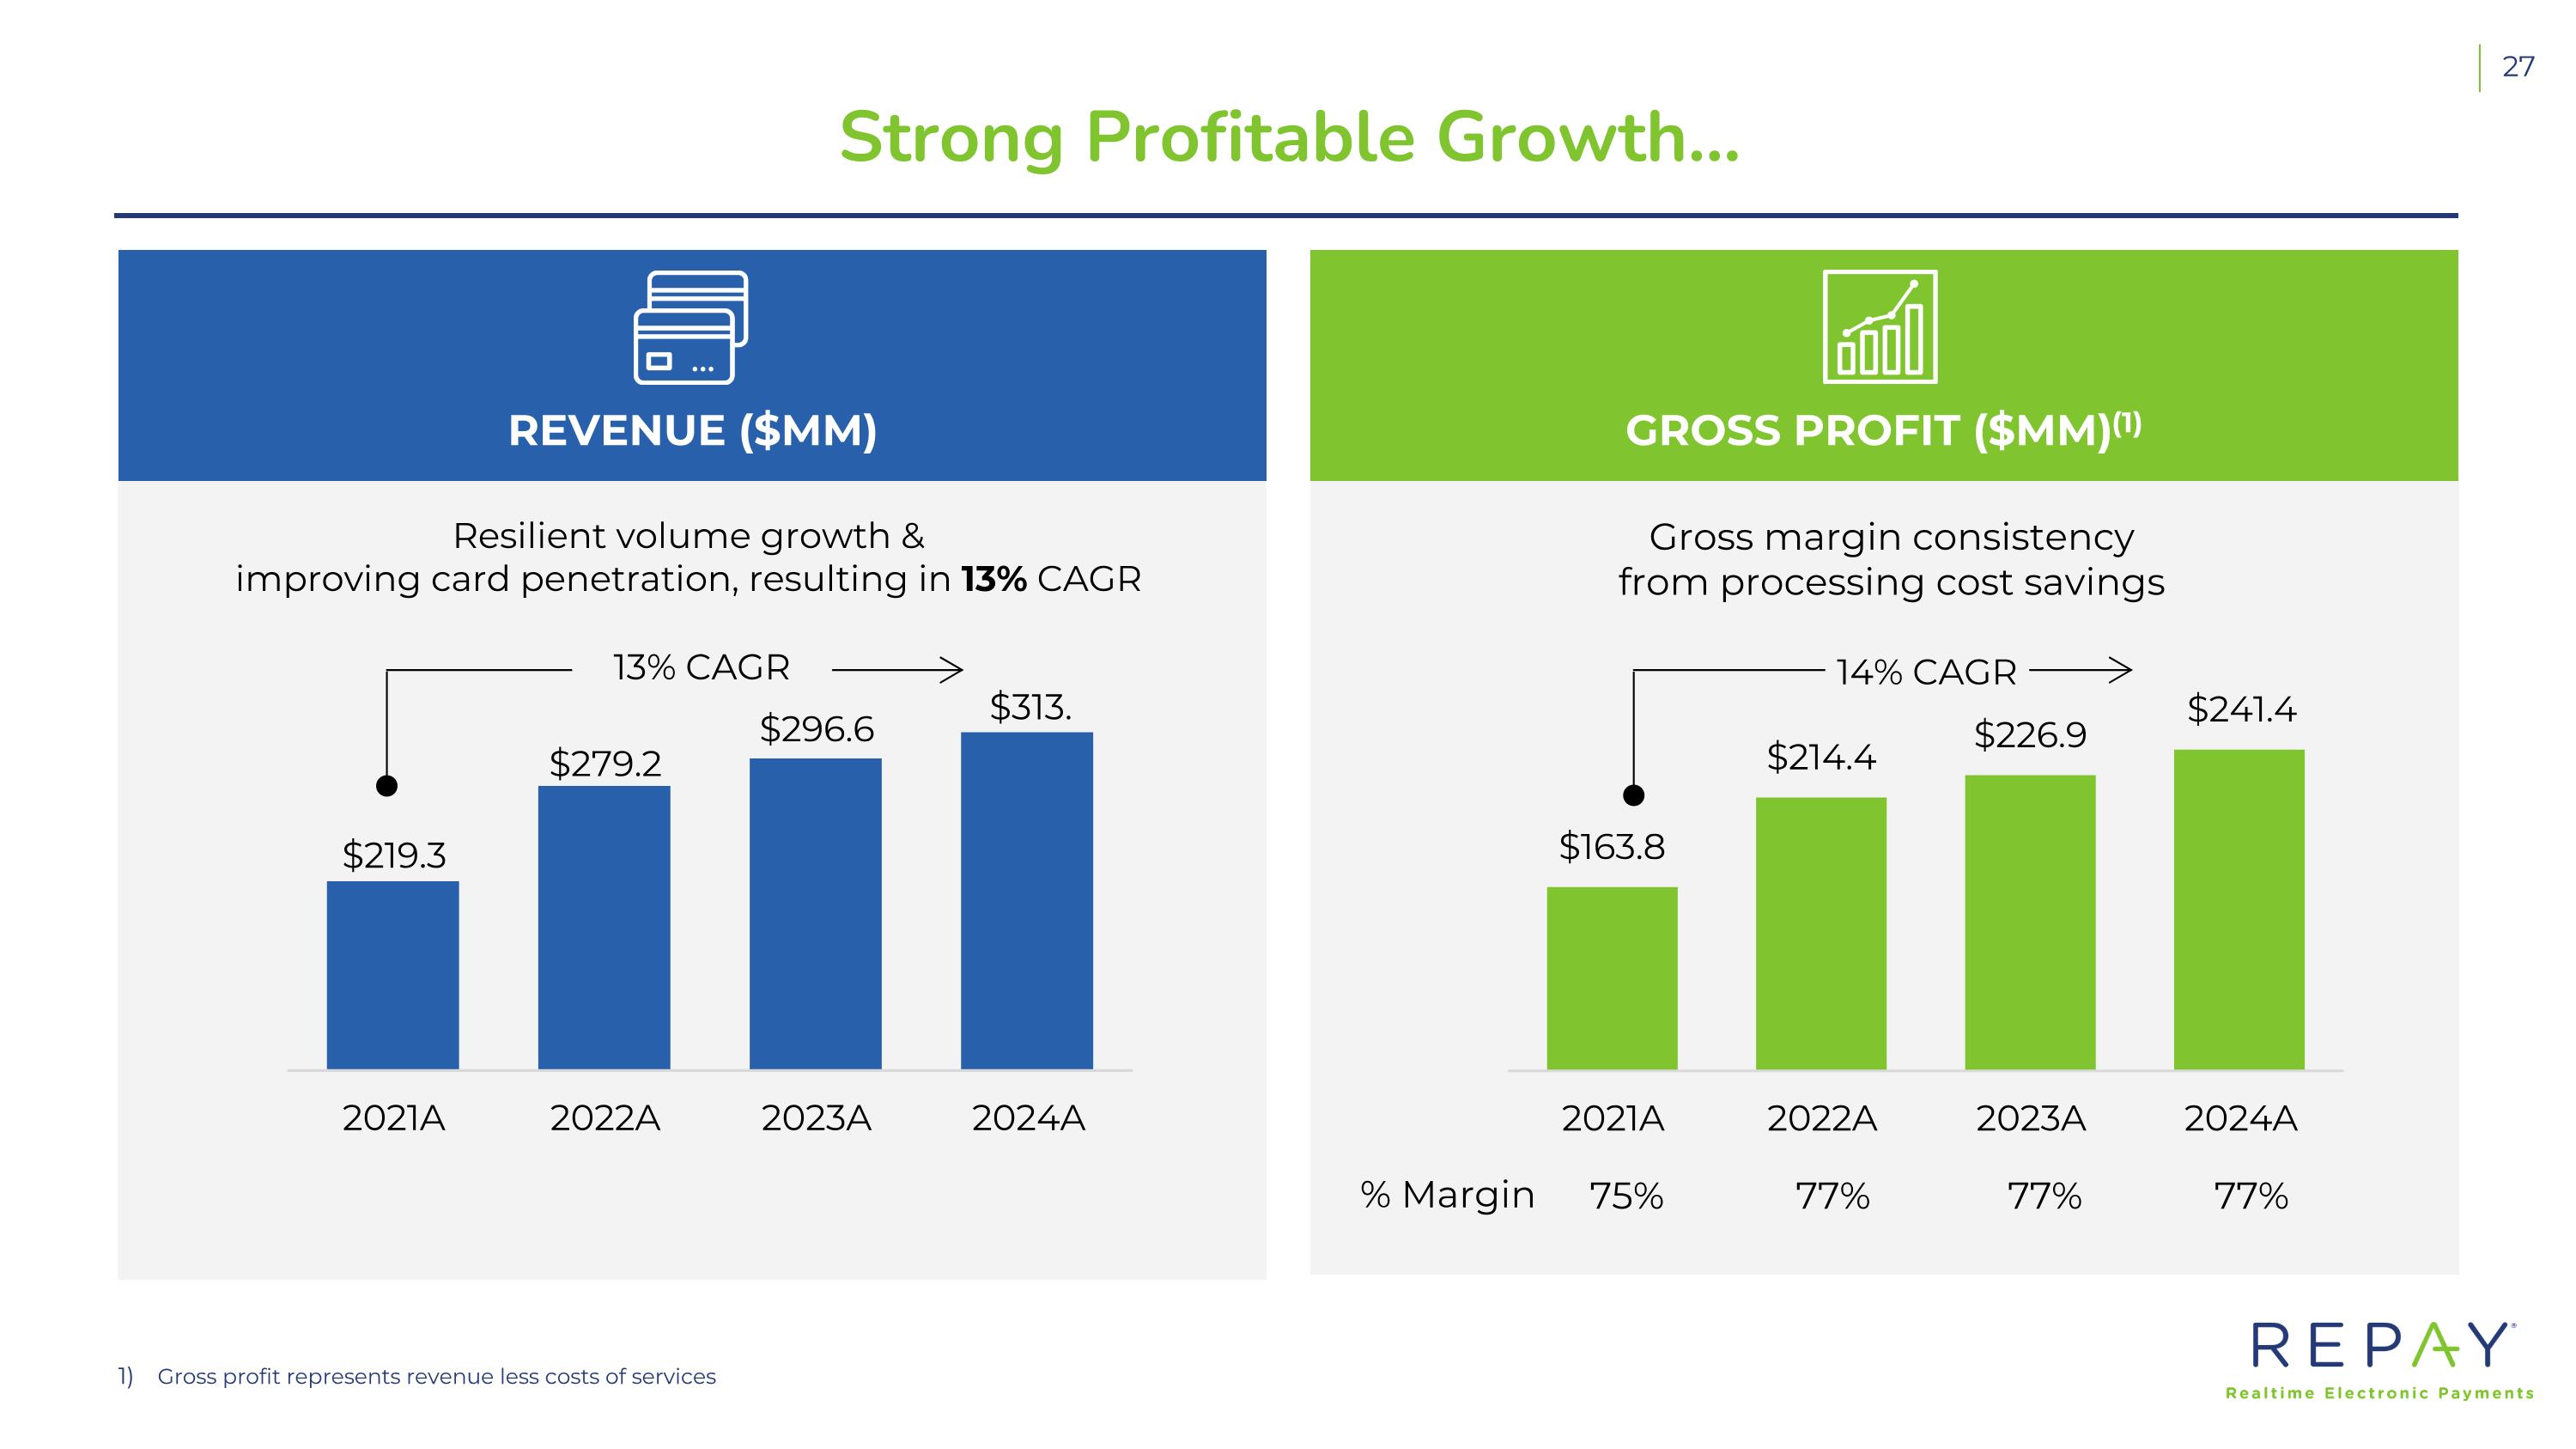
Revenue ($MM) Gross Profit ($MM)(1) Strong Profitable Growth… Resilient volume growth & improving card penetration, resulting in 13% CAGR Gross margin consistency from processing cost savings 13% CAGR 14% CAGR 75% 77% 77% % Margin 77% Gross profit represents revenue less costs of services
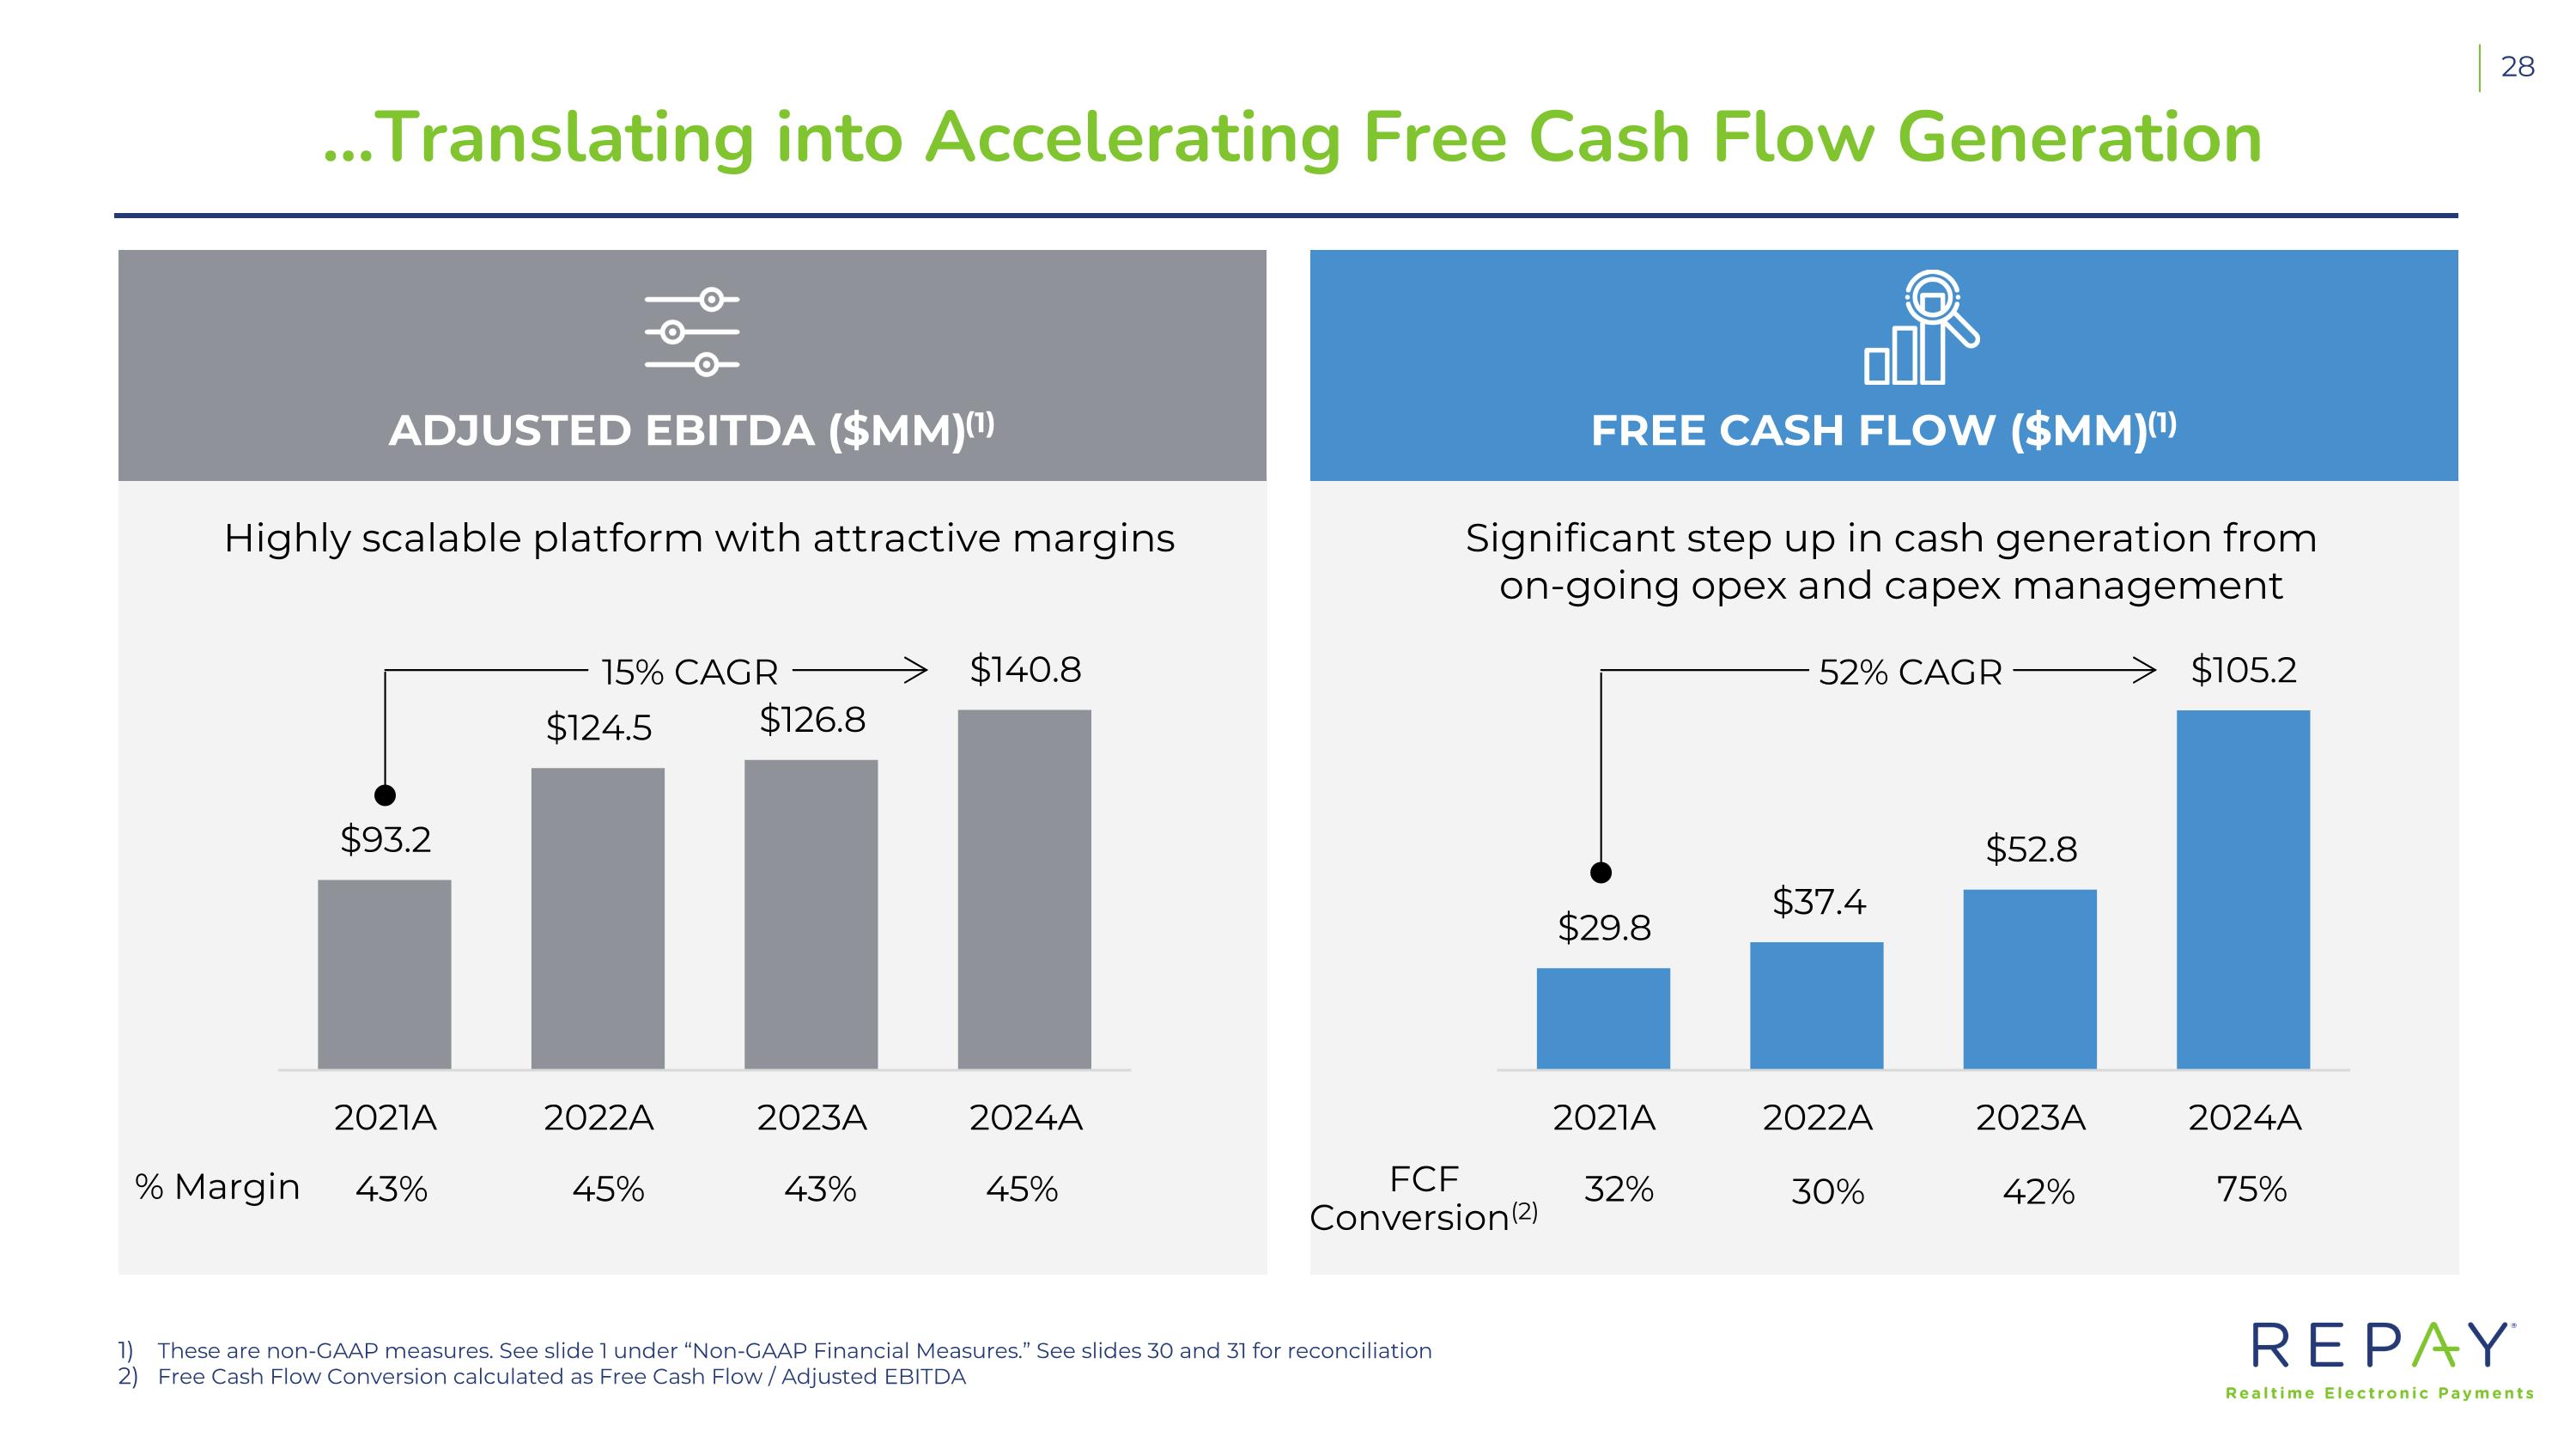
Adjusted EBITDA ($MM)(1) FREE CASH FLOW ($MM)(1) ...Translating into Accelerating Free Cash Flow Generation Highly scalable platform with attractive margins Significant step up in cash generation from on-going opex and capex management 43% 43% 45% 32% FCF Conversion(2) 30% 75% % Margin These are non-GAAP measures. See slide 1 under “Non-GAAP Financial Measures.” See slides 30 and 31 for reconciliation Free Cash Flow Conversion calculated as Free Cash Flow / Adjusted EBITDA 52% CAGR 15% CAGR 45% 42%
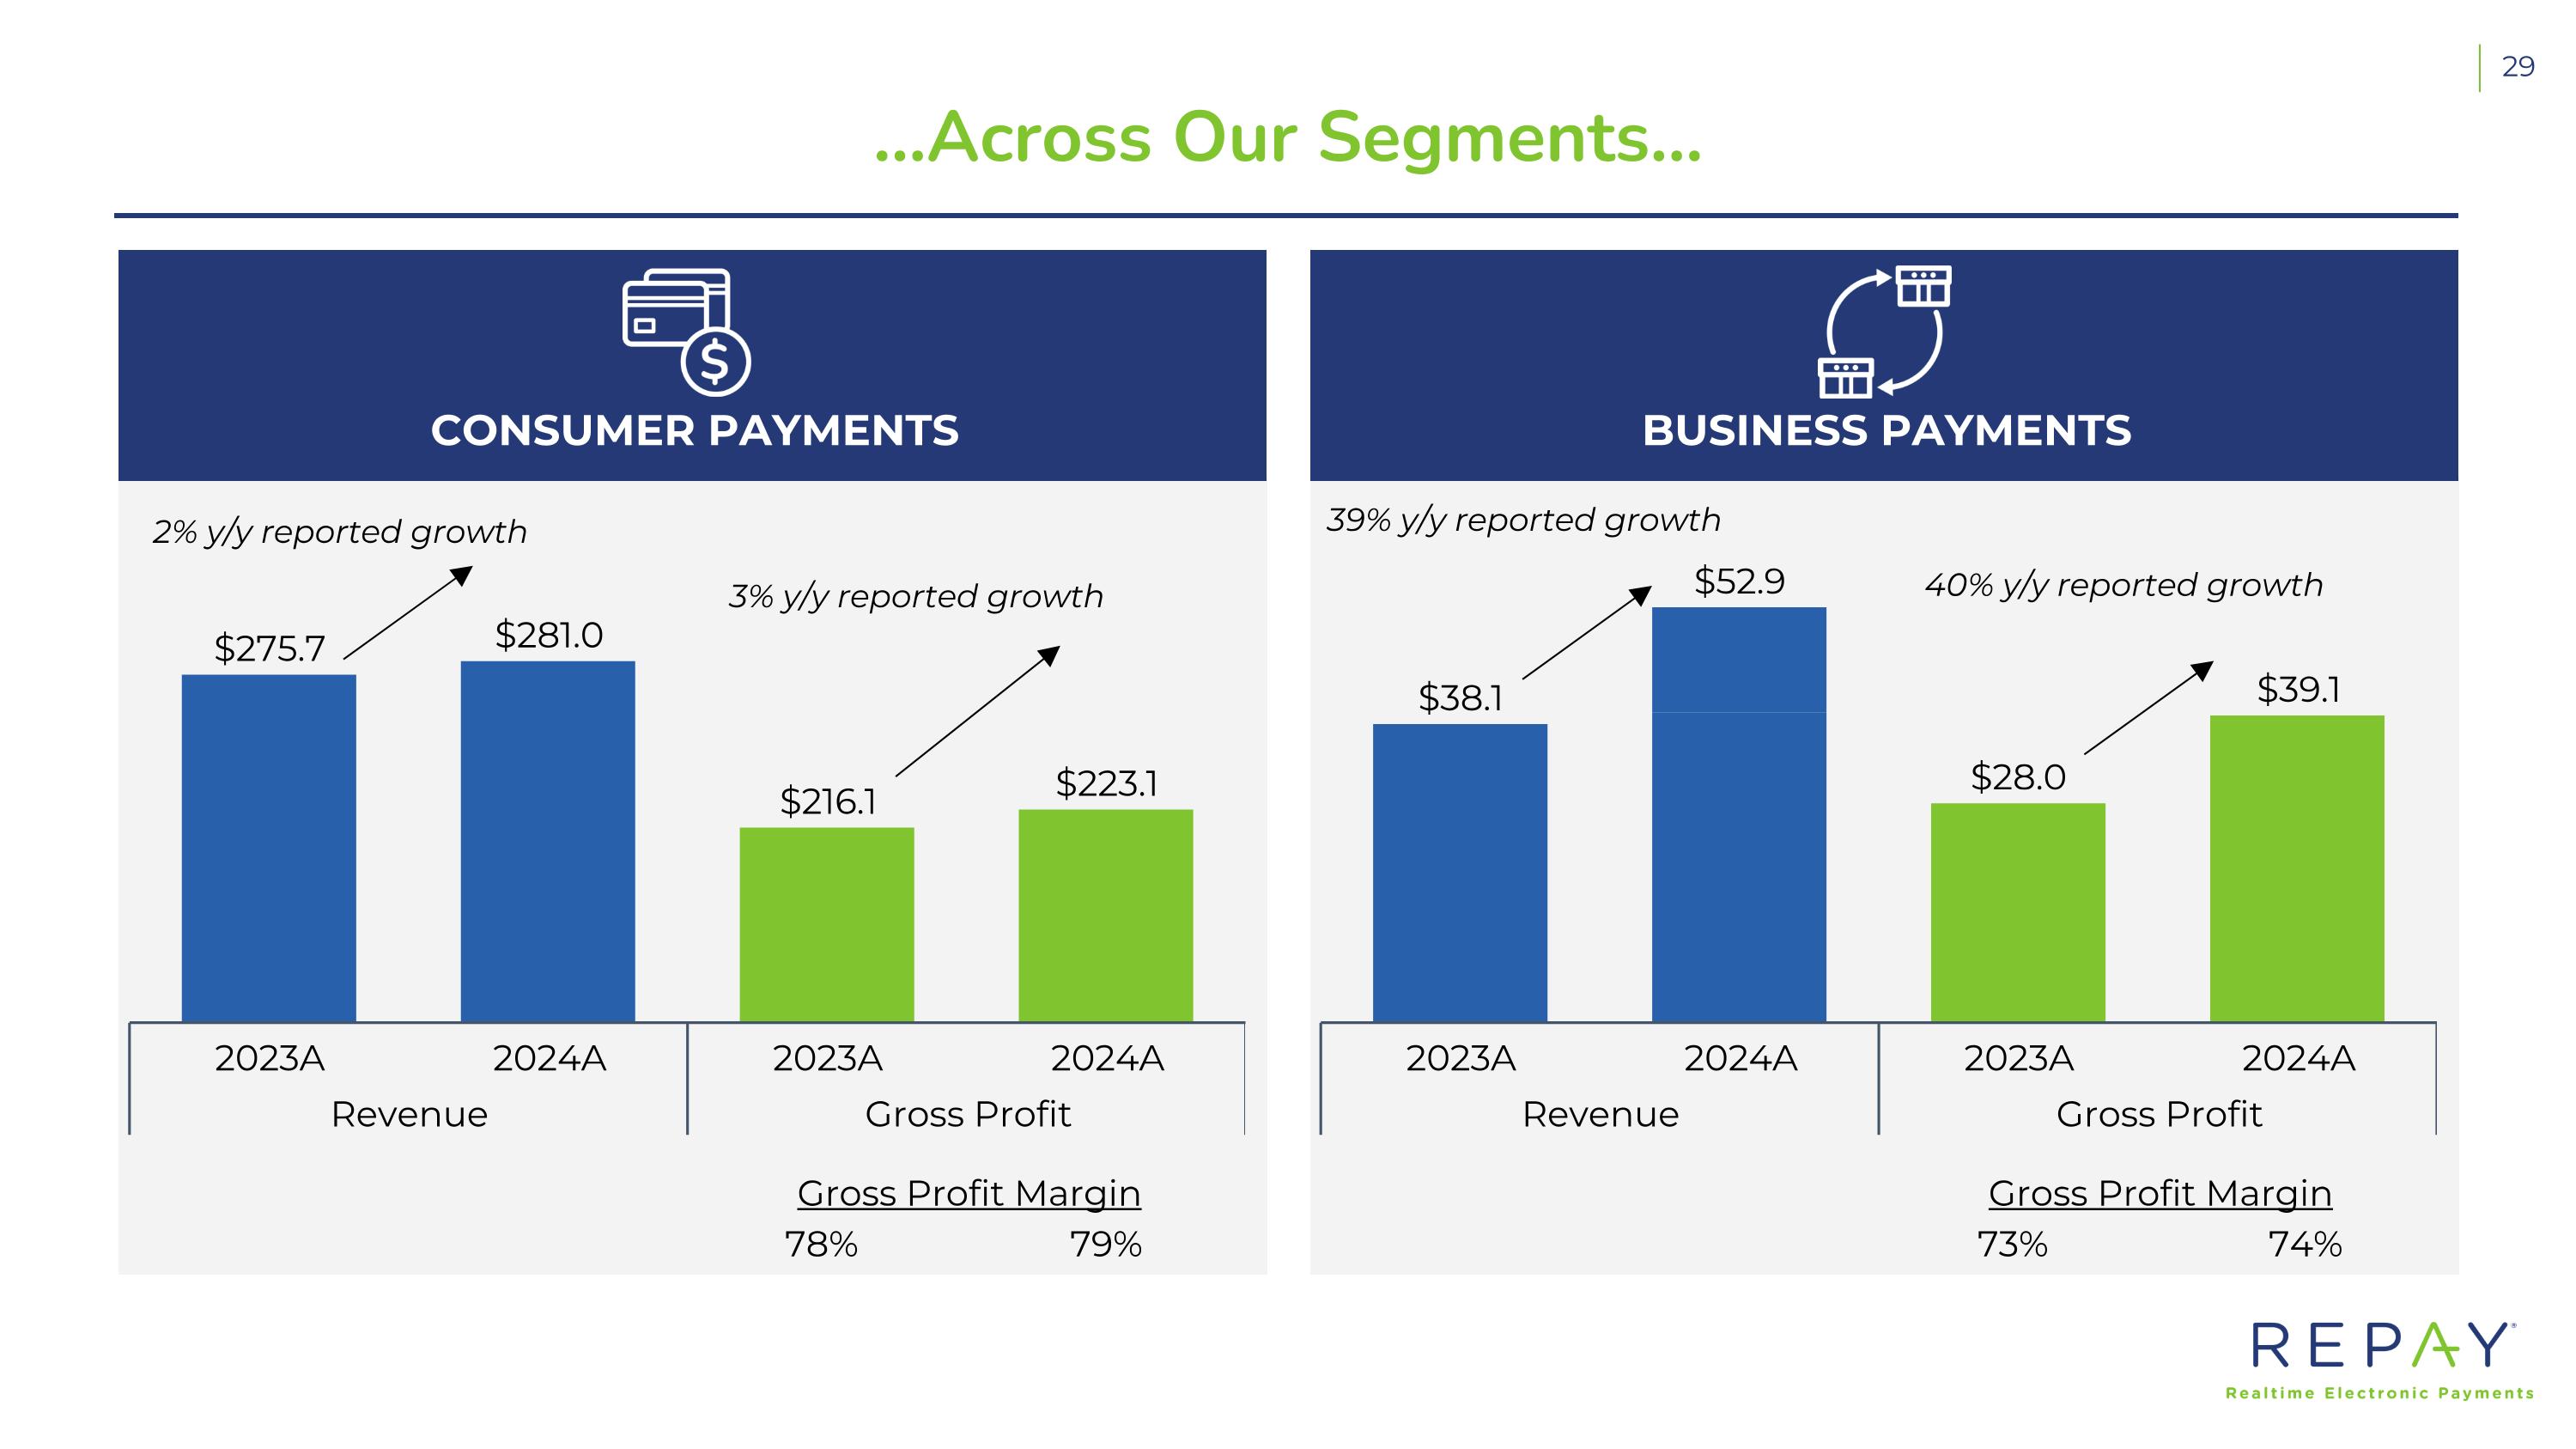
Consumer Payments Business Payments …Across Our Segments… 2% y/y reported growth Gross Profit Margin 78% 79% Gross Profit Margin 73% 74% 3% y/y reported growth 39% y/y reported growth 40% y/y reported growth
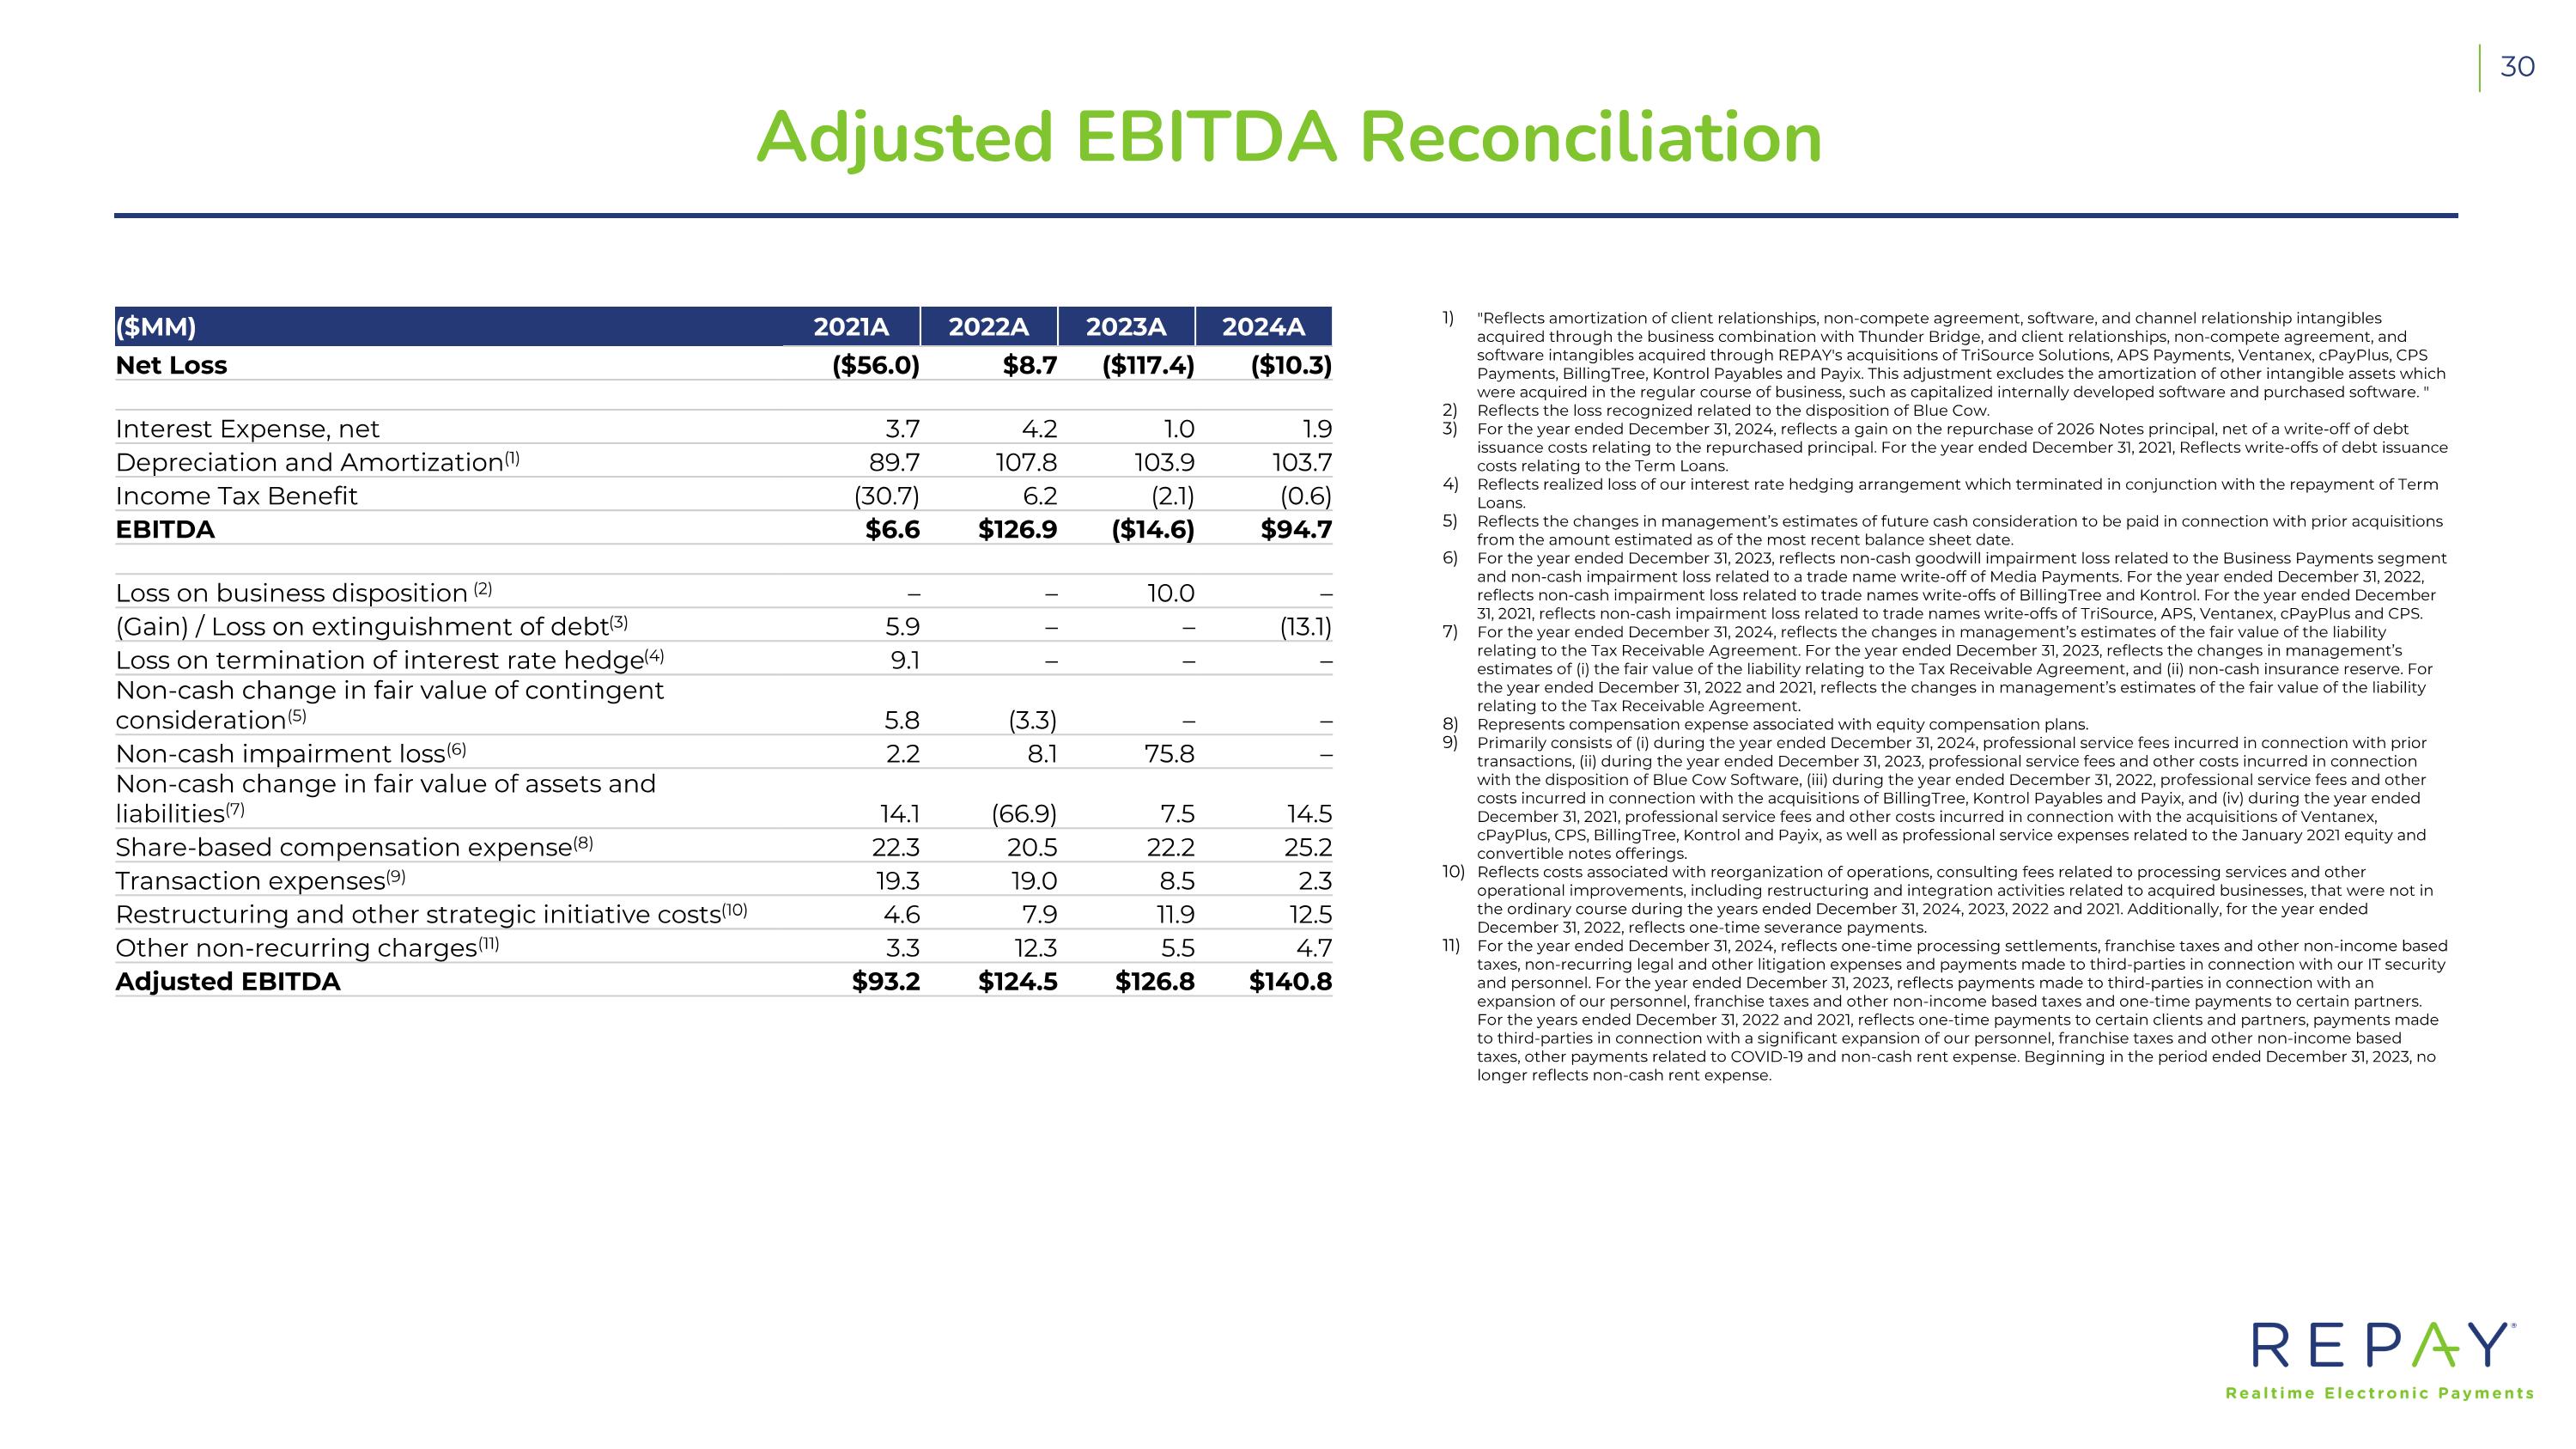
Adjusted EBITDA Reconciliation "Reflects amortization of client relationships, non-compete agreement, software, and channel relationship intangibles acquired through the business combination with Thunder Bridge, and client relationships, non-compete agreement, and software intangibles acquired through REPAY's acquisitions of TriSource Solutions, APS Payments, Ventanex, cPayPlus, CPS Payments, BillingTree, Kontrol Payables and Payix. This adjustment excludes the amortization of other intangible assets which were acquired in the regular course of business, such as capitalized internally developed software and purchased software. " Reflects the loss recognized related to the disposition of Blue Cow. For the year ended December 31, 2024, reflects a gain on the repurchase of 2026 Notes principal, net of a write-off of debt issuance costs relating to the repurchased principal. For the year ended December 31, 2021, Reflects write-offs of debt issuance costs relating to the Term Loans. Reflects realized loss of our interest rate hedging arrangement which terminated in conjunction with the repayment of Term Loans. Reflects the changes in management’s estimates of future cash consideration to be paid in connection with prior acquisitions from the amount estimated as of the most recent balance sheet date. For the year ended December 31, 2023, reflects non-cash goodwill impairment loss related to the Business Payments segment and non-cash impairment loss related to a trade name write-off of Media Payments. For the year ended December 31, 2022, reflects non-cash impairment loss related to trade names write-offs of BillingTree and Kontrol. For the year ended December 31, 2021, reflects non-cash impairment loss related to trade names write-offs of TriSource, APS, Ventanex, cPayPlus and CPS. For the year ended December 31, 2024, reflects the changes in management’s estimates of the fair value of the liability relating to the Tax Receivable Agreement. For the year ended December 31, 2023, reflects the changes in management’s estimates of (i) the fair value of the liability relating to the Tax Receivable Agreement, and (ii) non-cash insurance reserve. For the year ended December 31, 2022 and 2021, reflects the changes in management’s estimates of the fair value of the liability relating to the Tax Receivable Agreement. Represents compensation expense associated with equity compensation plans. Primarily consists of (i) during the year ended December 31, 2024, professional service fees incurred in connection with prior transactions, (ii) during the year ended December 31, 2023, professional service fees and other costs incurred in connection with the disposition of Blue Cow Software, (iii) during the year ended December 31, 2022, professional service fees and other costs incurred in connection with the acquisitions of BillingTree, Kontrol Payables and Payix, and (iv) during the year ended December 31, 2021, professional service fees and other costs incurred in connection with the acquisitions of Ventanex, cPayPlus, CPS, BillingTree, Kontrol and Payix, as well as professional service expenses related to the January 2021 equity and convertible notes offerings. Reflects costs associated with reorganization of operations, consulting fees related to processing services and other operational improvements, including restructuring and integration activities related to acquired businesses, that were not in the ordinary course during the years ended December 31, 2024, 2023, 2022 and 2021. Additionally, for the year ended December 31, 2022, reflects one-time severance payments. For the year ended December 31, 2024, reflects one-time processing settlements, franchise taxes and other non-income based taxes, non-recurring legal and other litigation expenses and payments made to third-parties in connection with our IT security and personnel. For the year ended December 31, 2023, reflects payments made to third-parties in connection with an expansion of our personnel, franchise taxes and other non-income based taxes and one-time payments to certain partners. For the years ended December 31, 2022 and 2021, reflects one-time payments to certain clients and partners, payments made to third-parties in connection with a significant expansion of our personnel, franchise taxes and other non-income based taxes, other payments related to COVID-19 and non-cash rent expense. Beginning in the period ended December 31, 2023, no longer reflects non-cash rent expense. ($MM) 2021A 2022A 2023A 2024A Net Loss ($56.0) $8.7 ($117.4) ($10.3) Interest Expense, net 3.7 4.2 1.0 1.9 Depreciation and Amortization(1) 89.7 107.8 103.9 103.7 Income Tax Benefit (30.7) 6.2 (2.1) (0.6) EBITDA $6.6 $126.9 ($14.6) $94.7 Loss on business disposition (2) – – 10.0 – (Gain) / Loss on extinguishment of debt(3) 5.9 – – (13.1) Loss on termination of interest rate hedge(4) 9.1 – – – Non-cash change in fair value of contingent consideration(5) 5.8 (3.3) – – Non-cash impairment loss(6) 2.2 8.1 75.8 – Non-cash change in fair value of assets and liabilities(7) 14.1 (66.9) 7.5 14.5 Share-based compensation expense(8) 22.3 20.5 22.2 25.2 Transaction expenses(9) 19.3 19.0 8.5 2.3 Restructuring and other strategic initiative costs(10) 4.6 7.9 11.9 12.5 Other non-recurring charges(11) 3.3 12.3 5.5 4.7 Adjusted EBITDA $93.2 $124.5 $126.8 $140.8
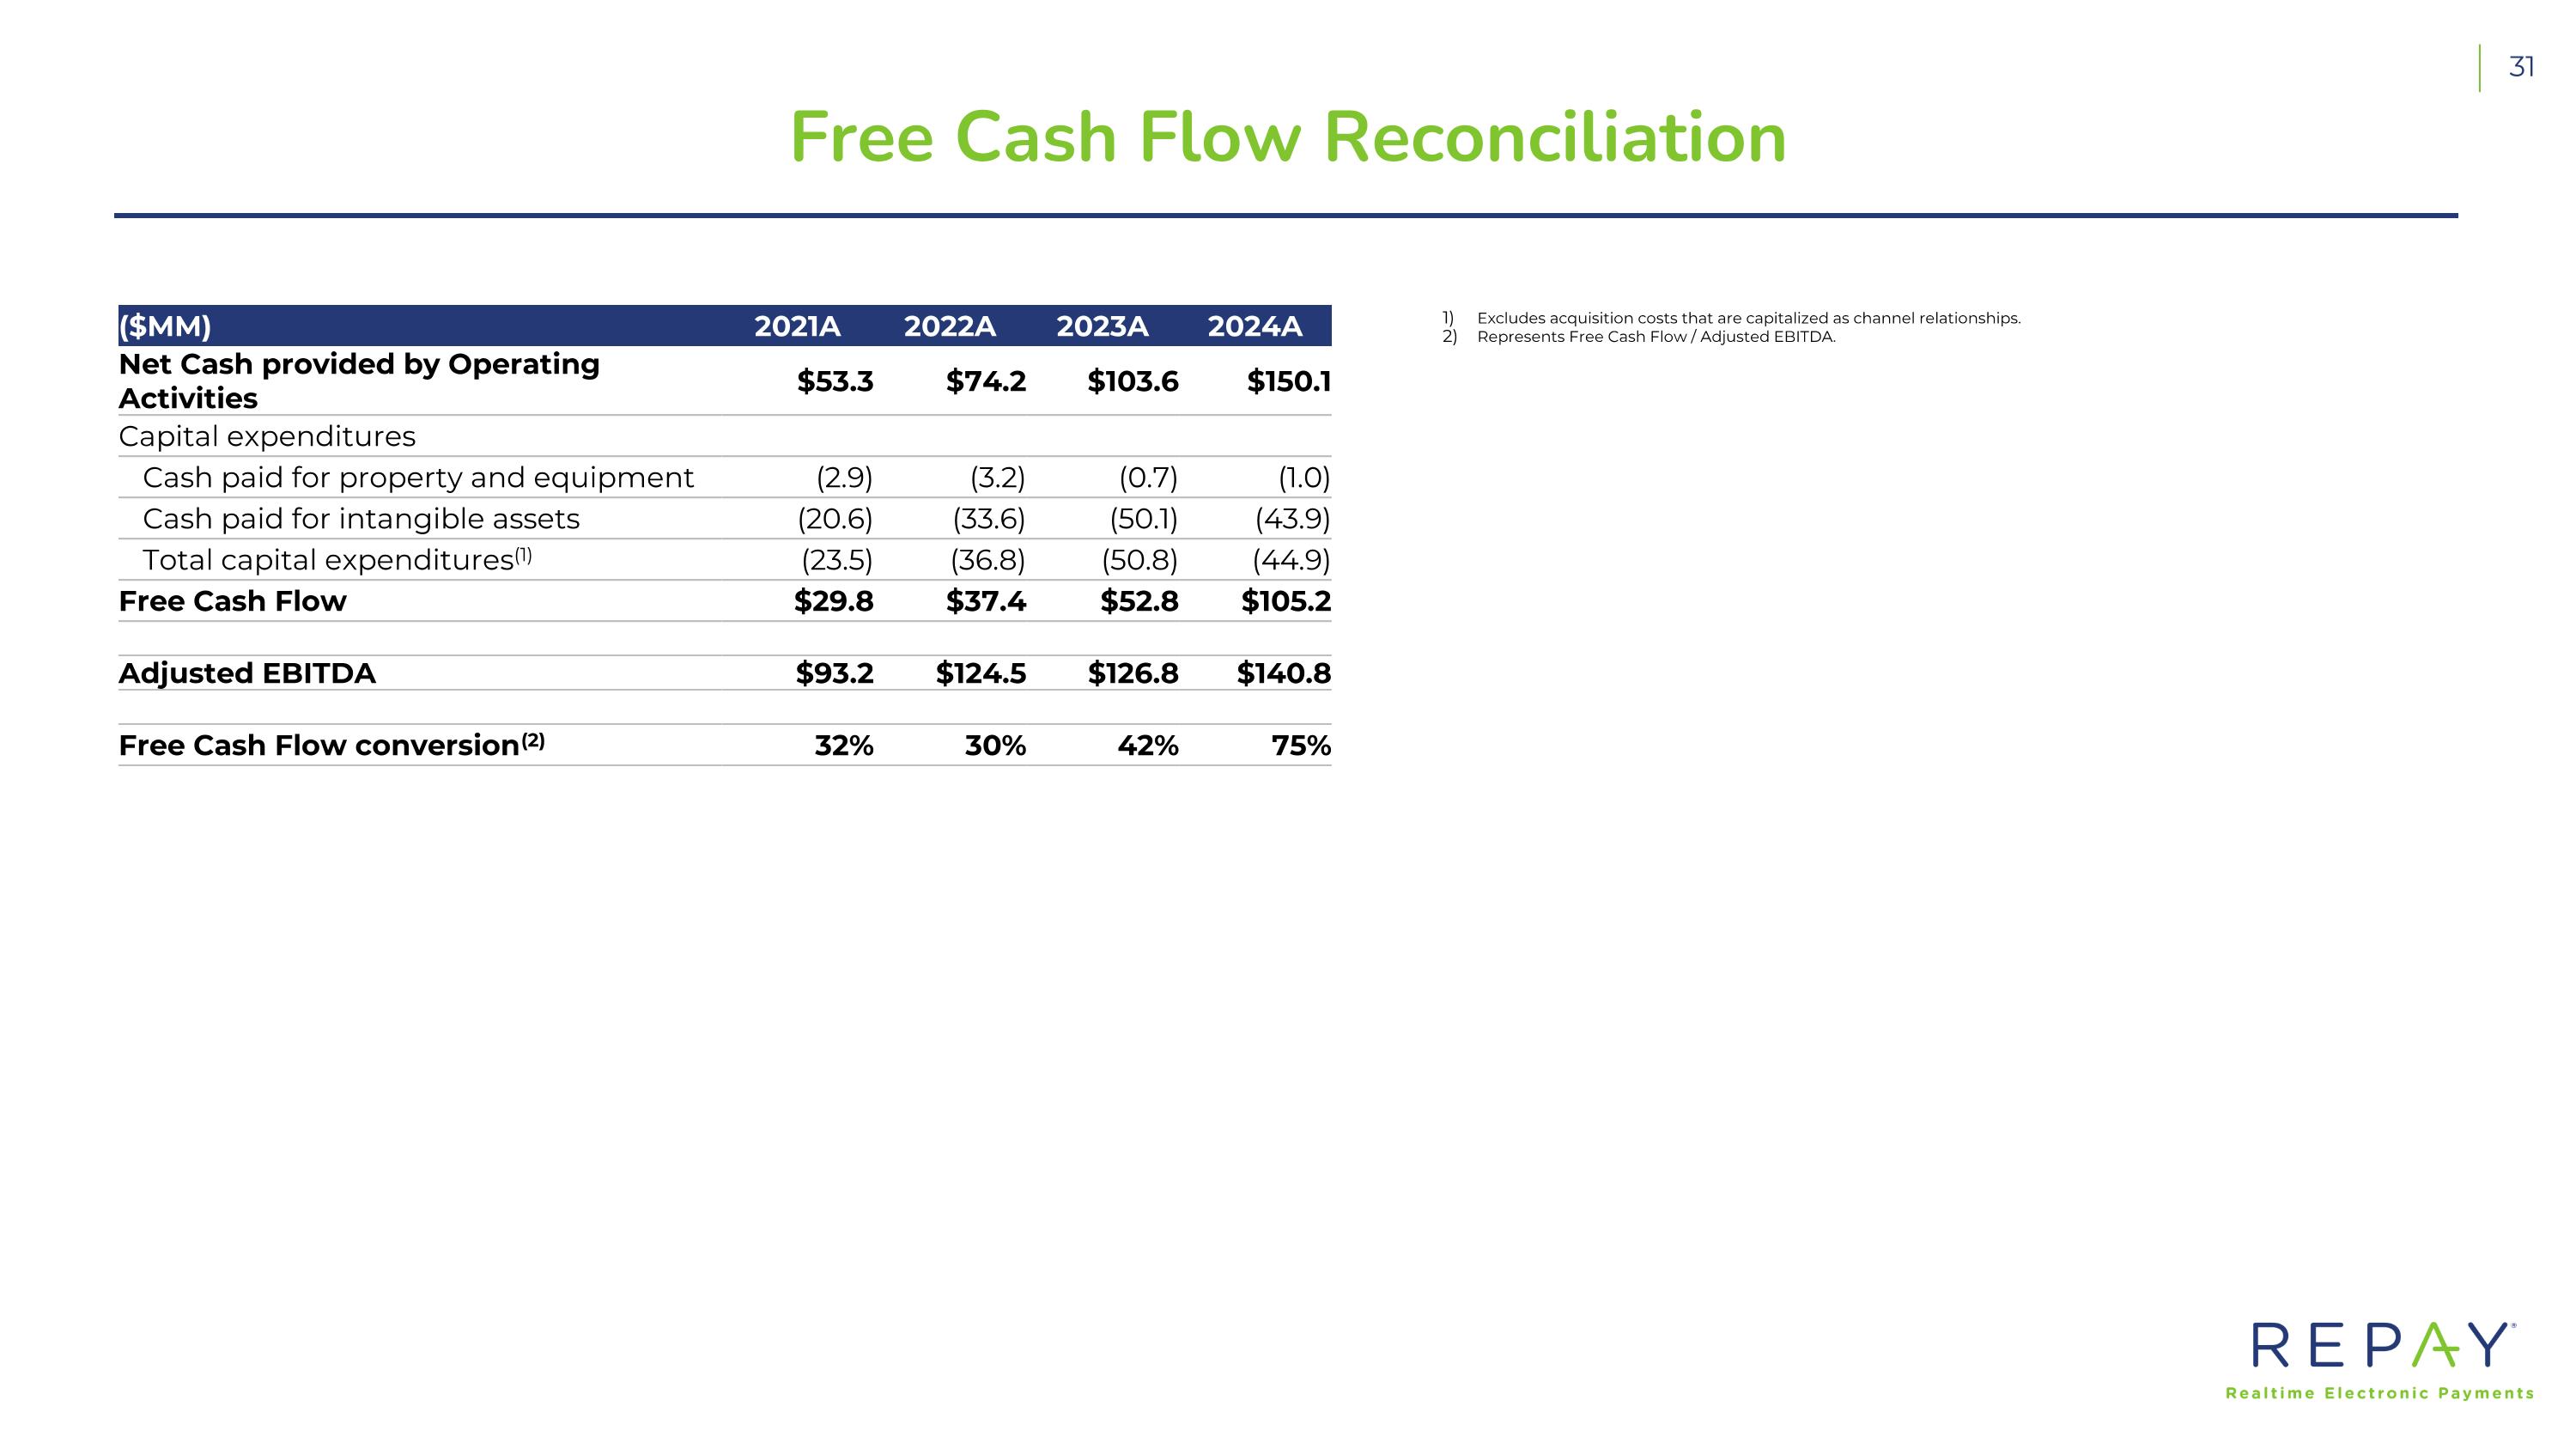
Free Cash Flow Reconciliation Excludes acquisition costs that are capitalized as channel relationships. Represents Free Cash Flow / Adjusted EBITDA. ($MM) 2021A 2022A 2023A 2024A Net Cash provided by Operating Activities $53.3 $74.2 $103.6 $150.1 Capital expenditures Cash paid for property and equipment (2.9) (3.2) (0.7) (1.0) Cash paid for intangible assets (20.6) (33.6) (50.1) (43.9) Total capital expenditures(1) (23.5) (36.8) (50.8) (44.9) Free Cash Flow $29.8 $37.4 $52.8 $105.2 Adjusted EBITDA $93.2 $124.5 $126.8 $140.8 Free Cash Flow conversion(2) 32% 30% 42% 75%

Thank you
Exhibit 99.4
REPAY Appoints New Chief Financial Officer August 11, 2025
ATLANTA--(BUSINESS WIRE)—August 11, 2025-- Repay Holdings Corporation (NASDAQ: RPAY) (“REPAY” or the “Company”), a leading provider of integrated payment processing solutions, today announced the appointment of Robert Houser as Chief Financial Officer of the Company, effective September 8, 2025.
“We are extremely excited to welcome Rob to REPAY. Rob brings over a decade of divisional CFO and operational experience within the payment industry to help him contribute immediately. Rob has held key strategic roles across his career and will be a great partner in running our company,” said John Morris, Co-Founder and CEO.
Most recently, Rob served as the Group CFO of the Public Sector and Advisor at Conduent Incorporated (Nasdaq: CNDT) (“Conduent”). He previously served as Conduent’s Global Head of Strategy, Corporate Development and Advisor to CEO. Prior to Conduent, Rob spent seven years at Fiserv, Inc. (NYSE: FI) holding positions as Senior Vice President, General Manager, and CFO across several divisions. Prior to Fiserv, he was the Global Head of FP&A and Investor Relations at Integra Lifesciences, Inc. (Nasdaq: IART). He previously held various finance, accounting, and strategy roles at Firmenich, Inc, Bristol-Myers Squibb Co. (NYSE: NMY), and Merck & Co Inc. (NYSE: MRK). Rob began his career as an auditor for KPMG LLP, and he earned his MBA and bachelor’s degree in accounting from Rider University.
“With Rob’s appointment, interim CFO Thomas Sullivan will return to his role as Chief Accounting Officer. We are extremely grateful for Thomas’s help in managing the finance organization over the past several months and the entire REPAY team for supporting the company through the CFO transition,” said John Morris.
About REPAY
REPAY provides integrated payment processing solutions to verticals that have specific transaction processing needs. REPAY’s proprietary, integrated payment technology platform reduces the complexity of electronic payments for clients, while enhancing the overall experience for consumers and businesses.
Forward-Looking Statements
This communication contains “forward-looking statements” within the meaning of the Private Securities Litigation Reform Act of 1995. Such statements include, but are not limited to, statements about REPAY’s expectations with respect to the announced leadership changes. Such forward-looking statements are based upon the current beliefs and expectations of REPAY’s management and are inherently subject to significant business, economic and competitive uncertainties and contingencies, many of which are difficult to predict and generally beyond REPAY’s control, including, without limitation, the factors described in REPAY’s reports filed with the U.S. Securities and Exchange Commission. Actual results and the timing of events may differ materially from the results anticipated in these forward-looking statements. All information set forth herein speaks only as of the date hereof in the case of information about REPAY or the date of such information in the case of information.
Contacts
Investor Relations for REPAY:
[email protected]
Media Relations for REPAY:
Kristen Hoyman
[email protected]
Source: Repay Holdings Corporation