
STBA 8-K
S&T Bancorp Inc (STBA)
8-K
2020-07-30
For: 2020-07-27
View Original
Added on
April 09, 2026
UNITED STATES
SECURITIES AND EXCHANGE COMMISSION
Washington, D.C. 20549
FORM 8-K
CURRENT REPORT
Pursuant to Section 13 OR 15(d) of The Securities Exchange Act of 1934
Date of Report (date of earliest event reported)
(Exact name of registrant as specified in its charter)
(State or other jurisdiction of incorporation or organization) | (Commission File Number) | (I.R.S. Employer Identification No.) | ||||||||||||
(Address of Principal Executive Offices) | (Zip Code) | |||||||||||||
(800 ) 325-2265
Registrant's telephone number, including area code
(Not applicable)
(Former name or former address, if changed since last report.)
Check the appropriate box below if the Form 8-K filing is intended to simultaneously satisfy the filing obligation of the registrant under any of the following provisions (see General Instruction A.2. below):
Securities registered pursuant to Section 12(b) of the Act:
| Title of each class | Trading Symbol(s) | Name of each exchange on which registered | ||||||
Indicate by check mark whether the registrant is an emerging growth company as defined in Rule 405 of the Securities Act of 1933 (§230.405 of this chapter) or Rule 12b-2 of the Securities Exchange Act of 1934 (§240.12b-2 of this chapter).
Emerging growth company ☐
If an emerging growth company, indicate by check mark if the registrant has elected not to use the extended transition period for complying with any new or revised financial accounting standards provided pursuant to Section 13(a) of the Exchange Act. ☐
Item 2.02 Results of Operations and Financial Condition.
On July 30, 2020 S&T Bancorp, Inc. announced by press release its earnings for the three and six months ended June 30, 2020. A copy of the press release is attached hereto as Exhibit 99.1 and is incorporated by reference in this Item 2.02. The information contained in this Item 2.02 of this Report on Form 8-K, including Exhibit 99.1, is being furnished and shall not be deemed "filed" for purposes of Section 18 of the Securities Exchange Act of 1934, as amended (the “Exchange Act”), or otherwise subject to the liabilities of that section, nor shall such information be deemed incorporated by reference in any filing under the Securities Exchange Act of 1933, as amended (the “Securities Act”), or the Exchange Act, except as shall be expressly set forth by specific reference in such filing.
Item 7.01 Regulation FD Disclosure
In connection with the issuance of its earnings for the three and six months ended June 30, 2020, S&T has also made available on its website materials that contain supplemental information about S&T’s financial results (“Supplemental Information”). A copy of the Supplemental Information is included in this Current Report as Exhibit 99.2 and is incorporated by reference in this Item 7.01. The information contained in this Item 7.01 of this Report on Form 8-K, including Exhibit 99.2 hereto, is being furnished and shall not be deemed to be "filed" for purposes of Section 18 of the Exchange Act or otherwise subject to the liabilities of that section, nor shall such information be deemed incorporated by reference in any filing under the Securities Act or the Exchange Act, except as shall be expressly set forth by reference in such a filing.
Item 8.01 Other Events.
The Board of Directors of S&T declared a $0.28 per share cash dividend on July 27, 2020. A copy of the press release is attached hereto as Exhibit 99.3. This is an increase of 3.7% compared to a dividend of $0.27 per share declared in the same period last year. The dividend is payable August 27, 2020 to shareholders of record on August 13, 2020.
Item 9.01 Financial Statements and Exhibits.
(d) Exhibits.
| Exhibit No. | Description of Exhibit | |||||||
| Press Release | ||||||||
| Supplemental Information | ||||||||
| Dividend Release | ||||||||
| 104 | Cover Page Interactive Data File (embedded in the cover page formatted in Inline XBRL) | |||||||
SIGNATURES
Pursuant to the requirements of the Securities Exchange Act of 1934, the registrant has duly caused this report to be signed by the undersigned thereunto duly authorized.
S&T Bancorp, Inc. | |||||
| /s/ Mark Kochvar | |||||
July 30, 2020 | Mark Kochvar Senior Executive Vice President, Chief Financial Officer | ||||
CONTACT: Mark Kochvar Chief Financial Officer 724.465.4826 800 Philadelphia Street Indiana, PA 15701 www.stbancorp.com |  | |||||||
FOR IMMEDIATE RELEASE
S&T Bancorp, Inc. Announces Second Quarter 2020 Results and Declares Second Quarter Dividend
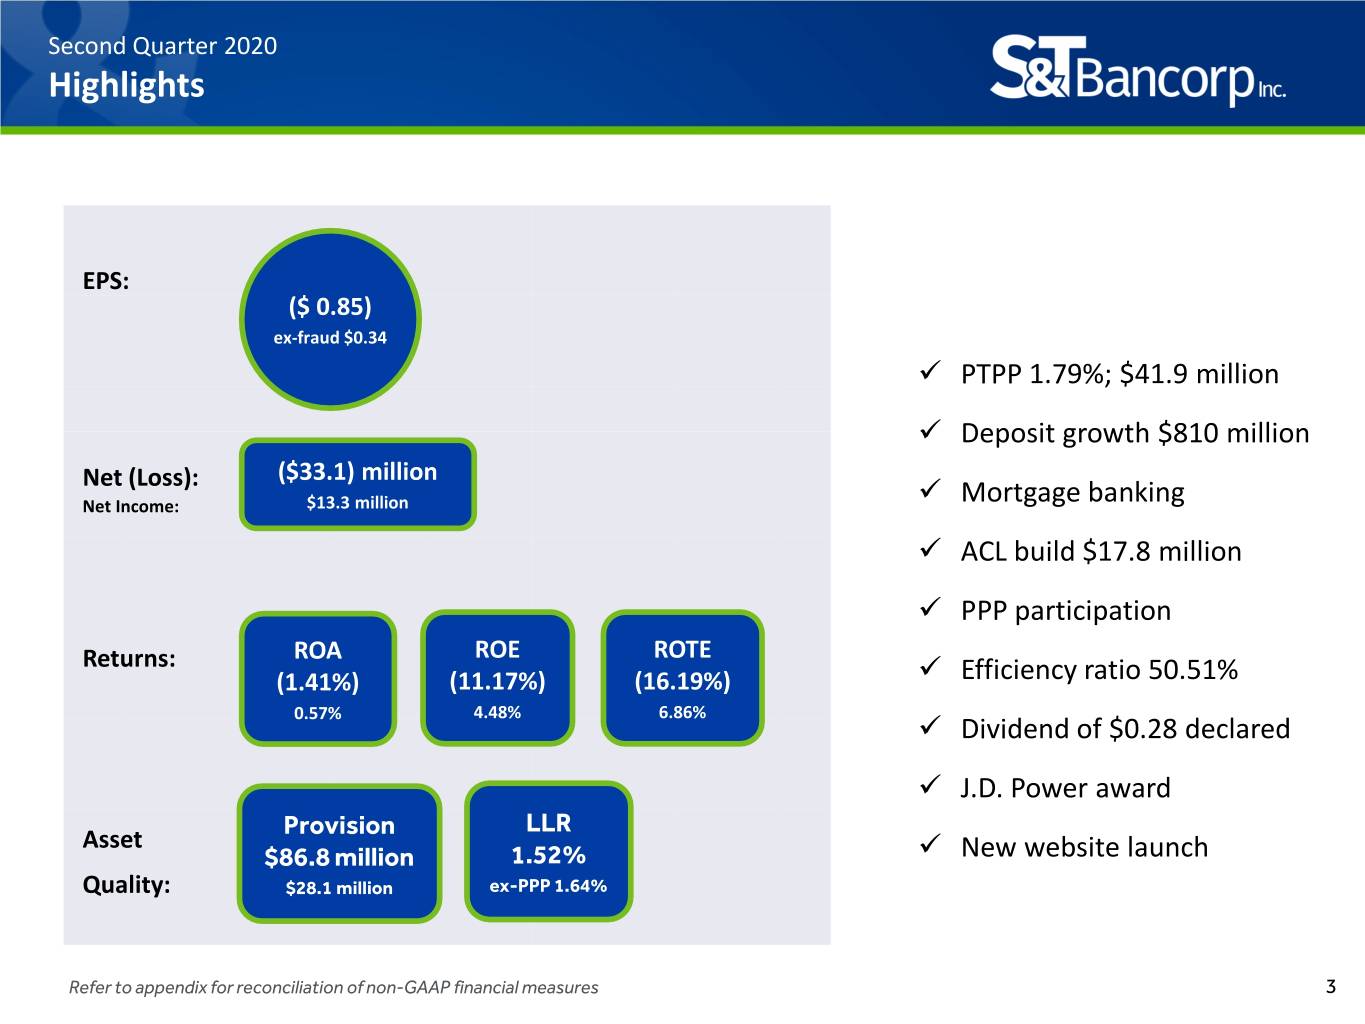
Indiana, Pa. - July 30 , 2020 - S&T Bancorp, Inc. (S&T) (NASDAQ: STBA), the holding company for S&T Bank, with operations in five markets including Western Pennsylvania, Eastern Pennsylvania, Northeast Ohio, Central Ohio, and Upstate New York, announced a net loss of ($33.1) million, or ($0.85) per diluted share, for the second quarter of 2020 compared to net income of $13.2 million, or $0.34 per diluted share, for the first quarter of 2020, and $26.1 million, or $0.76 per diluted share, for the second quarter of 2019.
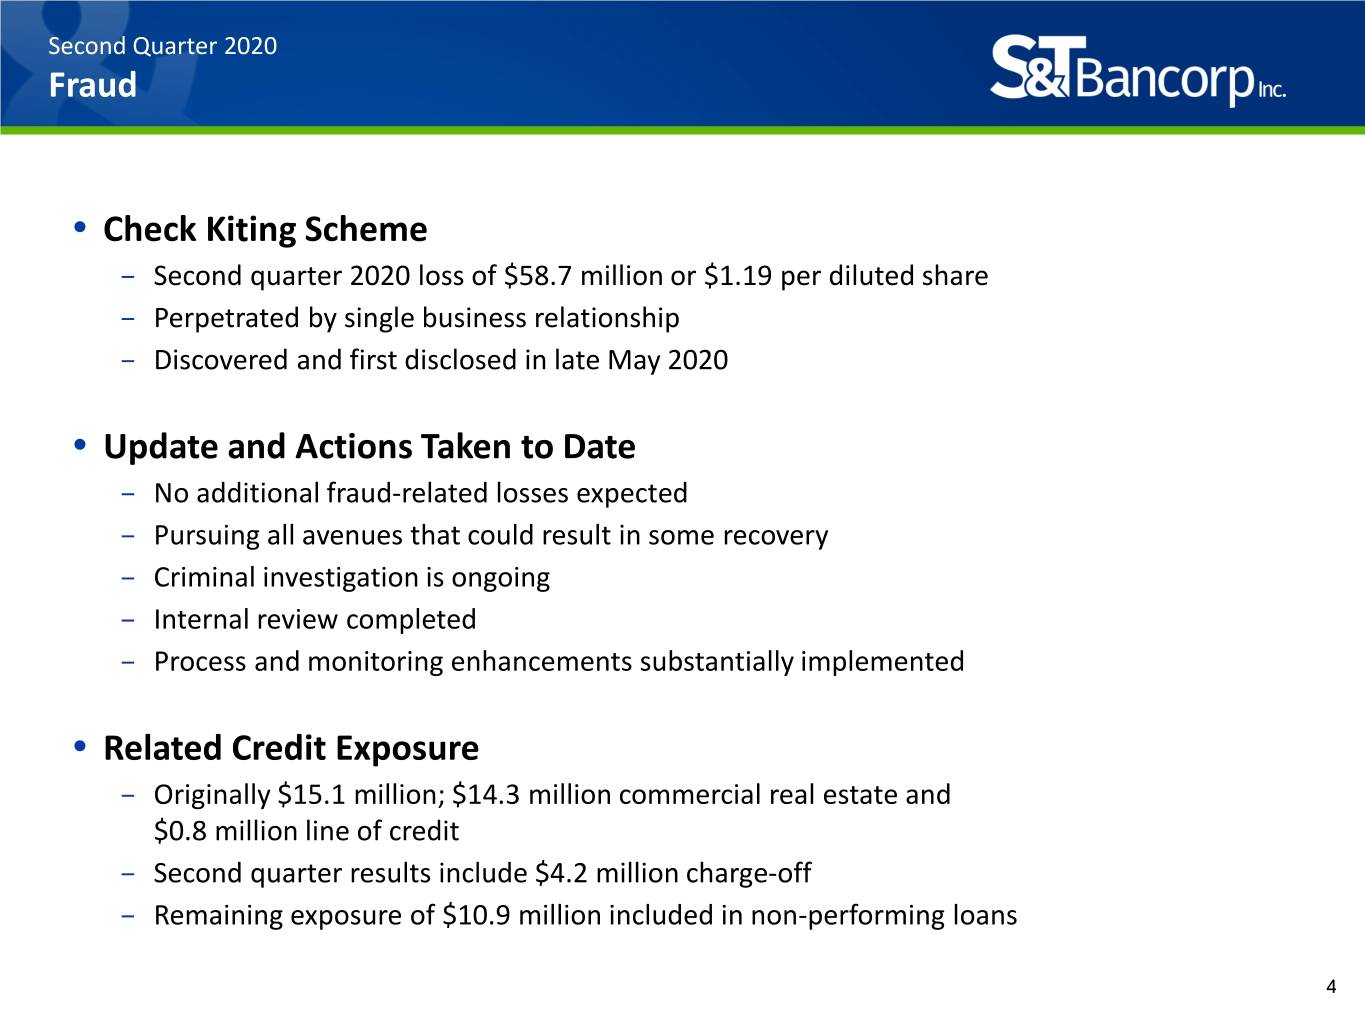
A loss of $58.7 million was recognized during the second quarter of 2020 related to a previously disclosed customer fraud resulting from a check kiting scheme. This fraud loss reduced net income by $46.3 million, or $1.19 per diluted share, resulting in a net loss for the second quarter of 2020. S&T continues to pursue all available sources of recovery to mitigate the loss.
“While we are very disappointed in the loss that we experienced this quarter related to the fraudulent activities of a single business customer, we are a resilient company with 118 years of history overcoming all manner of challenges. I am confident we will emerge from this situation as strong, if not stronger, than before,” said Todd Brice, Chief Executive Officer. “The personalized assistance given to our customers who are experiencing financial hardships as a result of COVID-19 is a direct reflection of the integral role we play in the communities where we operate. As we move forward, we will continue to be a source of strength for our customers and our employees.”
Impact and Response to the COVID-19 Pandemic:
As we navigate through these uncertain times, our focus remains on the health and safety of our employees and the customers and communities that we serve. We continue to support our customers through the potential financial hardships that have arisen through this crisis, including:
•Providing consumer and homeowner needs-based loan assistance with payment deferrals for 1,071 loans totaling $123.0 million
•Providing commercial and business needs-based loan assistance with payment deferrals for 1,289 loans totaling $1.3 billion
•Originating SBA Paycheck Protection Program (PPP) loans of $547.6 million
Second Quarter of 2020 Highlights:
•Return on average assets (ROA) was (1.41%), return on average equity (ROE) was (11.17%) and return on average tangible equity (ROTE) (non-GAAP) was (16.19%). Excluding the loss from the customer fraud ROA (non-GAAP) was 0.57%, ROE (non-GAAP) was 4.48% and ROTE (non-GAAP) was 6.86%.
•Portfolio loans increased $301.8 million compared to the first quarter of 2020. Excluding the PPP portfolio, loans decreased $245.8 million.
- more -
S&T Earnings Release -2
•With an influx of funds from PPP loans and stimulus payments, along with the heightened liquidity concerns of customers, deposits increased $810.0 million to $7.9 billion at June 30, 2020 compared to $7.1 billion at March 31, 2020.
•Net interest margin (FTE) (non-GAAP) was 3.31% compared to 3.53% for the first quarter of 2020.
•The allowance for credit losses to total portfolio loans was 1.52% at June 30, 2020 compared to 1.34% at March 31, 2020. Excluding the PPP loans, the allowance for credit losses to total portfolio loans was 1.64% at June 30, 2020.
•S&T's Board of Directors declared a $0.28 per share dividend. This is an increase of 3.7% compared to a dividend of $0.27 per share declared in the same period in the prior year.
“While we faced many challenges during the quarter given the uncertain environment, I couldn't be prouder of the incredible work that our employees have done for our customers,” said Todd Brice. “A testament to our employees was the recent announcement that S&T Bank was ranked #1 in customer satisfaction with retail banking in the Mid-Atlantic, including best in communication and advice, by J.D. Power which is a reflection of the confidence and trust our customers have in our great employees at S&T Bank."
Net Interest Income
Net interest income was $70.1 million for the second quarter of 2020 compared to $70.0 million for the first quarter of 2020. Average loans increased $474.2 million mainly due to loans from the PPP of $449.3 million compared to the first quarter of 2020. Net interest margin on a fully taxable equivalent basis (FTE) (non-GAAP) declined 22 basis points to 3.31% for the second quarter of 2020 from 3.53% in the first quarter of 2020 primarily due to decreases in short-term rates. Loan rates decreased 64 basis points to 4.00% and total interest-bearing deposit costs decreased 48 basis points to 0.67%.
Asset Quality
The customer fraud that resulted in a $58.7 million loss to the bank had a significant impact on asset quality during the second quarter of 2020. The customer also had a $15.1 million lending relationship which was charged down by $4.2 million leaving a new nonperforming loan of $10.9 million in the second quarter of 2020. Net loan charge-offs were $68.1 million for the second quarter of 2020 compared to $11.2 million in the first quarter of 2020. Excluding the fraud, net loan charge-offs were $9.4 million for the second quarter of 2020. The provision for credit losses increased $66.7 million to $86.8 million in the second quarter of 2020 compared to $20.1 million in the first quarter of 2020. Total nonperforming loans increased $16.3 million to $90.1 million, or 1.19% of total loans, at June 30, 2020 compared to $73.8 million, or 1.02% of total loans at March 31, 2020. The uncertainty around the economic environment due to the COVID-19 pandemic contributed to the higher allowance for credit losses of 1.52% of total portfolio loans as of June 30, 2020 compared to 1.34% at March 31, 2020. Excluding the PPP loans, the allowance for credit losses to total portfolio loans was 1.64%.
Noninterest Income and Expense
Noninterest income increased $2.8 million to $15.2 million in the second quarter of 2020 compared to $12.4 million in the first quarter of 2020. Other noninterest income increased by $3.7 million primarily due to the increase in the fair value of the assets in a nonqualified benefit plan of $2.1 million and an increase in the fair value of equity securities of $1.9 million. Mortgage banking income improved during the quarter by $1.4 million due to increased refinancing activity. These increases were offset by a decrease in service charges on deposit accounts of $1.2 million and commercial loan swap income of $1.5 million due to lower activity as a result of the COVID-19 pandemic.
Noninterest expense decreased $2.9 million to $43.5 million for the second quarter of 2020 compared to $46.4 million in the first quarter of 2020. The decrease in noninterest expense was mainly due to merger expenses of $2.3 million in the first quarter of 2020. Other expense decreased $1.6 million related to historic tax credits of $1.2
- more -
S&T Earnings Release -3
million in the first quarter of 2020. Professional services and legal increased $0.9 million mainly due to higher legal expense compared to the first quarter of 2020.
Financial Condition
Total assets increased $468.8 million to $9.5 billion at June 30, 2020 compared to $9.0 billion at March 31, 2020. Portfolio loans increased $301.8 million, which included $547.6 million of loans from the PPP, compared to
March 31, 2020. Excluding the PPP portfolio, loans decreased $245.8 million due to decreased activity related to the COVID-19 pandemic. Deposits increased $810.0 million to $7.9 billion at June 30, 2020 compared to $7.1 billion at March 31, 2020. The increase in deposits relates largely to customer PPP loans and stimulus payments along with customers conservatively holding cash deposits in these uncertain times.
All regulatory risk-based capital ratios declined at June 30, 2020 compared to March 31, 2020, except for total capital, due to a decrease in retained earnings offset in part by a reduction in risk weighted assets. S&T continues to maintain a strong capital position with all capital ratios above the well-capitalized thresholds of federal bank regulatory agencies.
Dividend
The Board of Directors of S&T declared a $0.28 per share cash dividend on July 27, 2020. This is an increase of 3.7% compared to a dividend of $0.27 per share declared in the same period in the prior year. The dividend is payable August 27, 2020 to shareholders of record on August 13, 2020.
Conference Call
S&T will host its second quarter 2020 earnings conference call live over the Internet at 1:00 p.m. ET on Thursday, July 30, 2020. To access the webcast, go to S&T’s webpage at www.stbancorp.com and click on “Events & Presentations.” Select “2nd Quarter 2020 Earnings Conference Call” and follow the instructions. After the live presentation, the webcast will be archived on this website for at least 90 days. A replay of the call will also be available until August 6, 2020, by dialing 1.877.481.4010; the Conference ID is 35499.
About S&T Bancorp, Inc. and S&T Bank
S&T Bancorp, Inc. is a $9.5 billion bank holding company that is headquartered in Indiana, Pennsylvania and trades on the NASDAQ Global Select Market under the symbol STBA. Its principal subsidiary, S&T Bank, was recently ranked #1 in customer satisfaction with retail banking in the Mid-Atlantic including best in communication and advice by J.D. Power. Established in 1902, S&T Bank operates in five markets including Western Pennsylvania, Eastern Pennsylvania, Northeast Ohio, Central Ohio, and Upstate New York. For more information visit stbancorp.com or stbank.com. Follow us on Facebook, Instagram, and LinkedIn.
This quarterly report on Form 10-Q contains or incorporates statements that we believe are “forward-looking statements” within the meaning of the Private Securities Litigation Reform Act of 1995. Forward-looking statements generally relate to our financial condition, results of operations, plans, objectives, outlook for earnings, revenues, expenses, capital and liquidity levels and ratios, asset levels, asset quality, financial position, and other matters regarding or affecting S&T and its future business and operations. Forward-looking statements are typically identified by words or phrases such as “will likely result”, “expect”, “anticipate”, “estimate”, “forecast”, “project”, “intend”, “ believe”, “assume”, “strategy”, “trend”, “plan”, “outlook”, “outcome”, “continue”, “remain”, “potential”, “opportunity”, “believe”, “comfortable”, “current”, “position”, “maintain”, “sustain”, “seek”, “achieve” and variations of such words and similar expressions, or future or conditional verbs such as will, would, should, could or may. Although we believe the assumptions upon which these forward-looking statements are based are reasonable, any of these assumptions could prove to be inaccurate and the forward-looking statements based on these assumptions could be incorrect. The matters discussed in these forward-looking statements are subject to various risks, uncertainties and other factors that could cause actual results and
- more -
S&T Earnings Release -4
trends to differ materially from those made, projected, or implied in or by the forward-looking statements depending on a variety of uncertainties or other factors including, but not limited to: credit losses and the credit risk of our commercial and consumer loan products; changes in the level of charge-offs and changes in estimates of the adequacy of the allowance for credit losses; cyber-security concerns; rapid technological developments and changes; operational risks or risk management failures by us or critical third parties, including fraud risk; our ability to manage our reputational risks; sensitivity to the interest rate environment including a prolonged period of low interest rates, a rapid increase in interest rates or a change in the shape of the yield curve; a change in spreads on interest-earning assets and interest-bearing liabilities; regulatory supervision and oversight, including changes in regulatory capital requirements and our ability to address those requirements; unanticipated changes in our liquidity position; changes in accounting policies, practices, or guidance, for example, our adoption of CECL; legislation affecting the financial services industry as a whole, and S&T, in particular; the outcome of pending and future litigation and governmental proceedings; increasing price and product/service competition; the ability to continue to introduce competitive new products and services on a timely, cost-effective basis; managing our internal growth and acquisitions; the possibility that the anticipated benefits from acquisitions, including DNB, cannot be fully realized in a timely manner or at all, or that integrating the acquired operations will be more difficult, disruptive or costly than anticipated; containing costs and expenses; reliance on significant customer relationships; an interruption or cessation of an important service by a third-party provider; our ability to attract and retain talented executives and employees; general economic or business conditions, including the strength of regional economic conditions in our market area; the duration and severity of the coronavirus (“COVID-19”) pandemic, both in our principal area of operations and nationally, including the ultimate impact of the pandemic on the economy generally and on our operations; deterioration of the housing market and reduced demand for mortgages; deterioration in the overall macroeconomic conditions or the state of the banking industry that could warrant further analysis of the carrying value of goodwill and could result in an adjustment to its carrying value resulting in a non-cash charge to net income; the stability of our core deposit base and access to contingency funding; re-emergence of turbulence in significant portions of the global financial and real estate markets that could impact our performance, both directly, by affecting our revenues and the value of our assets and liabilities, and indirectly, by affecting the economy generally and access to capital in the amounts, at the times and on the terms required to support our future businesses.
Many of these factors, as well as other factors, are described in our Annual Report on Form 10-K for the year ended December 31, 2019, including Part I, Item 1A-"Risk Factors" and any of our subsequent filings with the SEC. Forward-looking statements are based on beliefs and assumptions using information available at the time the statements are made. We caution you not to unduly rely on forward-looking statements because the assumptions, beliefs, expectations and projections about future events may, and often do, differ materially from actual results. Any forward-looking statement speaks only as to the date on which it is made, and we undertake no obligation to update any forward-looking statement to reflect developments occurring after the statement is made.
- more -
S&T Bancorp, Inc. | S&T Earnings Release - | 5 | |||||||||
| Consolidated Selected Financial Data | |||||||||||
| Unaudited | |||||||||||
| 2020 | 2020 | 2019 | ||||||||||||||||||
| Second | First | Second | ||||||||||||||||||
| (dollars in thousands, except per share data) | Quarter | Quarter | Quarter | |||||||||||||||||
| INTEREST AND DIVIDEND INCOME | ||||||||||||||||||||
| Loans, including fees | $75,498 | $82,051 | $74,728 | |||||||||||||||||
| Investment securities: | ||||||||||||||||||||
| Taxable | 3,791 | 4,282 | 3,647 | |||||||||||||||||
| Tax-exempt | 959 | 803 | 834 | |||||||||||||||||
| Dividends | 231 | 453 | 415 | |||||||||||||||||
| Total Interest and Dividend Income | 80,479 | 87,589 | 79,624 | |||||||||||||||||
| INTEREST EXPENSE | ||||||||||||||||||||
| Deposits | 9,227 | 15,338 | 16,055 | |||||||||||||||||
| Borrowings and junior subordinated debt securities | 1,104 | 2,215 | 2,742 | |||||||||||||||||
| Total Interest Expense | 10,331 | 17,553 | 18,797 | |||||||||||||||||
| NET INTEREST INCOME | 70,148 | 70,036 | 60,827 | |||||||||||||||||
| Provision for credit losses | 86,759 | 20,050 | 2,205 | |||||||||||||||||
| Net Interest (Loss) Income After Provision for Credit Losses | (16,611) | 49,986 | 58,622 | |||||||||||||||||
| NONINTEREST INCOME | ||||||||||||||||||||
| Net gain on sale of securities | 142 | — | — | |||||||||||||||||
| Debit and credit card | 3,612 | 3,482 | 3,501 | |||||||||||||||||
| Mortgage banking | 2,623 | 1,236 | 637 | |||||||||||||||||
| Wealth management | 2,586 | 2,362 | 2,062 | |||||||||||||||||
| Service charges on deposit accounts | 2,342 | 3,558 | 3,212 | |||||||||||||||||
| Commercial loan swap income | 945 | 2,484 | 1,102 | |||||||||||||||||
| Other | 2,974 | (719) | 2,387 | |||||||||||||||||
| Total Noninterest Income | 15,224 | 12,403 | 12,901 | |||||||||||||||||
| NONINTEREST EXPENSE | ||||||||||||||||||||
| Salaries and employee benefits | 21,419 | 21,335 | 20,290 | |||||||||||||||||
| Data processing and information technology | 3,585 | 3,868 | 3,414 | |||||||||||||||||
| Net occupancy | 3,437 | 3,765 | 2,949 | |||||||||||||||||
| Furniture, equipment and software | 3,006 | 2,519 | 2,301 | |||||||||||||||||
| Professional services and legal | 1,932 | 1,048 | 1,145 | |||||||||||||||||
| Other taxes | 1,604 | 1,600 | 1,456 | |||||||||||||||||
| FDIC insurance | 1,048 | 770 | 695 | |||||||||||||||||
| Marketing | 979 | 1,111 | 1,310 | |||||||||||||||||
| Merger related expense | — | 2,342 | 618 | |||||||||||||||||
| Other | 6,468 | 8,033 | 6,174 | |||||||||||||||||
| Total Noninterest Expense | 43,478 | 46,391 | 40,352 | |||||||||||||||||
| (Loss) Income Before Taxes | (44,865) | 15,998 | 31,171 | |||||||||||||||||
| Income tax (benefit) expense | (11,793) | 2,767 | 5,070 | |||||||||||||||||
| Net (Loss) Income | ($33,072) | $13,231 | $26,101 | |||||||||||||||||
| Per Share Data | ||||||||||||||||||||
| Shares outstanding at end of period | 39,263,460 | 39,125,425 | 34,330,338 | |||||||||||||||||
| Average shares outstanding - diluted | 39,013,161 | 39,325,938 | 34,201,448 | |||||||||||||||||
| Diluted (loss) earnings per share | ($0.85) | $0.34 | $0.76 | |||||||||||||||||
| Dividends declared per share | $0.28 | $0.28 | $0.27 | |||||||||||||||||
| Dividend yield (annualized) | 4.78 | % | 4.10 | % | 2.88 | % | ||||||||||||||
| Dividends paid to net income | NM | 83.52 | % | 35.41 | % | |||||||||||||||
| Book value | $28.93 | $30.06 | $28.11 | |||||||||||||||||
Tangible book value (1) | $19.22 | $20.29 | $19.68 | |||||||||||||||||
| Market value | $23.45 | $27.32 | $37.48 | |||||||||||||||||
| Profitability Ratios (Annualized) | ||||||||||||||||||||
| Return on average assets | (1.41 | %) | 0.61 | % | 1.44 | % | ||||||||||||||
| Return on average shareholders' equity | (11.17 | %) | 4.47 | % | 11.00 | % | ||||||||||||||
Return on average tangible shareholders' equity (2) | (16.19 | %) | 6.82 | % | 15.89 | % | ||||||||||||||
Efficiency ratio (FTE) (3) | 50.51 | % | 52.89 | % | 54.03 | % | ||||||||||||||
| NM - Not Meaningful | ||||||||||||||||||||
- more -
S&T Bancorp, Inc. | S&T Earnings Release - | 6 | |||||||||
| Consolidated Selected Financial Data | |||||||||||
| Unaudited | |||||||||||
| Six Months Ended June 30, | ||||||||||||||||||||
| (dollars in thousands, except per share data) | 2020 | 2019 | ||||||||||||||||||
| INTEREST INCOME | ||||||||||||||||||||
| Loans, including fees | $157,549 | $148,120 | ||||||||||||||||||
| Investment securities: | ||||||||||||||||||||
| Taxable | 8,074 | 7,437 | ||||||||||||||||||
| Tax-exempt | 1,762 | 1,679 | ||||||||||||||||||
| Dividends | 684 | 978 | ||||||||||||||||||
| Total Interest and Dividend Income | 168,069 | 158,214 | ||||||||||||||||||
| INTEREST EXPENSE | ||||||||||||||||||||
| Deposits | 24,565 | 31,036 | ||||||||||||||||||
| Borrowings and junior subordinated debt securities | 3,320 | 5,995 | ||||||||||||||||||
| Total Interest Expense | 27,885 | 37,031 | ||||||||||||||||||
| NET INTEREST INCOME | 140,184 | 121,183 | ||||||||||||||||||
| Provision for credit losses | 106,809 | 7,854 | ||||||||||||||||||
| Net Interest Income After Provision for Credit Losses | 33,375 | 113,329 | ||||||||||||||||||
| NONINTEREST INCOME | ||||||||||||||||||||
| Net gain on sale of securities | 142 | — | ||||||||||||||||||
| Debit and credit card | 7,093 | 6,476 | ||||||||||||||||||
| Mortgage banking | 3,859 | 1,131 | ||||||||||||||||||
| Wealth management | 4,949 | 4,109 | ||||||||||||||||||
| Service charges on deposit accounts | 5,900 | 6,365 | ||||||||||||||||||
| Commercial swap fee income | 3,429 | 1,683 | ||||||||||||||||||
| Other | 2,255 | 4,499 | ||||||||||||||||||
| Total Noninterest Income | 27,627 | 24,263 | ||||||||||||||||||
| NONINTEREST EXPENSE | ||||||||||||||||||||
| Salaries and employee benefits | 42,754 | 41,199 | ||||||||||||||||||
| Data processing and information technology | 7,453 | 6,646 | ||||||||||||||||||
| Net occupancy | 7,202 | 5,986 | ||||||||||||||||||
| Furniture, equipment and software | 5,525 | 4,531 | ||||||||||||||||||
| Professional services and legal | 2,980 | 2,329 | ||||||||||||||||||
| Other taxes | 3,205 | 2,641 | ||||||||||||||||||
| FDIC insurance | 1,818 | 1,211 | ||||||||||||||||||
| Marketing | 2,090 | 2,452 | ||||||||||||||||||
| Merger related expense | 2,342 | 618 | ||||||||||||||||||
| Other | 14,501 | 11,658 | ||||||||||||||||||
| Total Noninterest Expense | 89,869 | 79,271 | ||||||||||||||||||
| (Loss) Income Before Taxes | (28,867) | 58,321 | ||||||||||||||||||
| Income tax (benefit) expense | (9,026) | 9,292 | ||||||||||||||||||
| Net (Loss) Income | ($19,841) | $49,029 | ||||||||||||||||||
| Per Share Data | ||||||||||||||||||||
| Average shares outstanding - diluted | 39,142,351 | 34,369,756 | ||||||||||||||||||
| Diluted (loss) earnings per share | ($0.51) | $1.43 | ||||||||||||||||||
| Dividends declared per share | $0.56 | $0.54 | ||||||||||||||||||
| Dividends paid to net income | NM | 37.85 | % | |||||||||||||||||
| Profitability Ratios (annualized) | ||||||||||||||||||||
| Return on average assets | (0.44 | %) | 1.37 | % | ||||||||||||||||
| Return on average shareholders' equity | (3.35 | %) | 10.43 | % | ||||||||||||||||
Return on average tangible shareholders' equity (6) | (4.68 | %) | 15.09 | % | ||||||||||||||||
Efficiency ratio (FTE) (7) | 51.68 | % | 53.37 | % | ||||||||||||||||
| NM - Not Meaningful | ||||||||||||||||||||
- more -
S&T Bancorp, Inc. | S&T Earnings Release - | 7 | |||||||||
| Consolidated Selected Financial Data | |||||||||||
| Unaudited | |||||||||||
| 2020 | 2020 | 2019 | ||||||||||||||||||
| Second | First | Second | ||||||||||||||||||
| (dollars in thousands) | Quarter | Quarter | Quarter | |||||||||||||||||
| ASSETS | ||||||||||||||||||||
| Cash and due from banks, including interest-bearing deposits | $351,365 | $187,684 | $122,876 | |||||||||||||||||
| Securities, at fair value | 804,366 | 799,532 | 668,588 | |||||||||||||||||
| Loans held for sale | 14,259 | 7,309 | 8,135 | |||||||||||||||||
| Commercial loans: | ||||||||||||||||||||
| Commercial real estate | 3,345,513 | 3,442,495 | 2,906,895 | |||||||||||||||||
| Commercial and industrial | 2,140,355 | 1,781,402 | 1,559,727 | |||||||||||||||||
| Commercial construction | 459,264 | 396,518 | 267,203 | |||||||||||||||||
| Total Commercial Loans | 5,945,132 | 5,620,415 | 4,733,825 | |||||||||||||||||
| Consumer loans: | ||||||||||||||||||||
| Residential mortgage | 971,023 | 988,816 | 751,355 | |||||||||||||||||
| Home equity | 539,519 | 544,405 | 464,195 | |||||||||||||||||
| Installment and other consumer | 79,816 | 79,887 | 72,041 | |||||||||||||||||
| Consumer construction | 13,068 | 13,222 | 11,784 | |||||||||||||||||
| Total Consumer Loans | 1,603,426 | 1,626,330 | 1,299,375 | |||||||||||||||||
| Total Portfolio Loans | 7,548,558 | 7,246,745 | 6,033,200 | |||||||||||||||||
| Allowance for credit losses | (114,609) | (96,850) | (61,479) | |||||||||||||||||
| Total Portfolio Loans, Net | 7,433,949 | 7,149,895 | 5,971,721 | |||||||||||||||||
| Federal Home Loan Bank and other restricted stock, at cost | 15,151 | 28,253 | 22,491 | |||||||||||||||||
| Goodwill | 373,289 | 374,270 | 287,446 | |||||||||||||||||
| Other assets | 481,917 | 458,553 | 253,348 | |||||||||||||||||
| Total Assets | $9,474,296 | $9,005,496 | $7,334,605 | |||||||||||||||||
| LIABILITIES | ||||||||||||||||||||
| Deposits: | ||||||||||||||||||||
| Noninterest-bearing demand | $2,250,958 | $1,702,960 | $1,462,386 | |||||||||||||||||
| Interest-bearing demand | 1,055,261 | 962,937 | 549,663 | |||||||||||||||||
| Money market | 2,121,588 | 1,967,692 | 1,742,334 | |||||||||||||||||
| Savings | 916,268 | 836,237 | 754,062 | |||||||||||||||||
| Certificates of deposit | 1,523,841 | 1,588,053 | 1,348,255 | |||||||||||||||||
| Total Deposits | 7,867,916 | 7,057,879 | 5,856,700 | |||||||||||||||||
| Borrowings: | ||||||||||||||||||||
| Securities sold under repurchase agreements | 92,159 | 69,644 | 14,154 | |||||||||||||||||
| Short-term borrowings | 84,541 | 410,240 | 295,000 | |||||||||||||||||
| Long-term borrowings | 49,489 | 50,180 | 69,791 | |||||||||||||||||
| Junior subordinated debt securities | 64,053 | 64,038 | 45,619 | |||||||||||||||||
| Total Borrowings | 290,242 | 594,102 | 424,564 | |||||||||||||||||
| Other liabilities | 180,361 | 177,264 | 88,388 | |||||||||||||||||
| Total Liabilities | 8,338,519 | 7,829,245 | 6,369,652 | |||||||||||||||||
| SHAREHOLDERS' EQUITY | ||||||||||||||||||||
| Total Shareholders' Equity | 1,135,777 | 1,176,251 | 964,953 | |||||||||||||||||
| Total Liabilities and Shareholders' Equity | $9,474,296 | $9,005,496 | $7,334,605 | |||||||||||||||||
| Capitalization Ratios | ||||||||||||||||||||
| Shareholders' equity / assets | 11.99 | % | 13.06 | % | 13.16 | % | ||||||||||||||
Tangible common equity / tangible assets (4) | 8.30 | % | 9.21 | % | 9.59 | % | ||||||||||||||
| Tier 1 leverage ratio | 8.89 | % | 10.03 | % | 10.12 | % | ||||||||||||||
| Common equity tier 1 capital | 10.70 | % | 10.93 | % | 11.35 | % | ||||||||||||||
| Risk-based capital - tier 1 | 11.10 | % | 11.32 | % | 11.68 | % | ||||||||||||||
| Risk-based capital - total | 12.74 | % | 12.73 | % | 13.15 | % | ||||||||||||||
- more -
S&T Bancorp, Inc. | S&T Earnings Release - | 8 | |||||||||
| Consolidated Selected Financial Data | |||||||||||
| Unaudited | |||||||||||
| 2020 | 2020 | 2019 | ||||||||||||||||||
| Second | First | Second | ||||||||||||||||||
| (dollars in thousands) | Quarter | Quarter | Quarter | |||||||||||||||||
| Net Interest Margin (FTE) (QTD Averages) | ||||||||||||||||||||
| ASSETS | ||||||||||||||||||||
| Interest-bearing deposits with banks | $163,019 | 0.08% | $99,646 | 1.42% | $49,949 | 2.19% | ||||||||||||||
| Securities, at fair value | 785,229 | 2.56% | 786,858 | 2.54% | 673,117 | 2.66% | ||||||||||||||
| Loans held for sale | 9,931 | 3.08% | 1,867 | 3.76% | 1,452 | 4.44% | ||||||||||||||
| Commercial real estate | 3,389,616 | 4.23% | 3,408,684 | 4.73% | 2,895,146 | 5.01% | ||||||||||||||
| Commercial and industrial | 2,200,148 | 3.61% | 1,751,678 | 4.53% | 1,559,222 | 5.17% | ||||||||||||||
| Commercial construction | 430,912 | 3.75% | 386,363 | 4.68% | 242,192 | 5.37% | ||||||||||||||
| Total Commercial Loans | 6,020,676 | 3.97% | 5,546,725 | 4.66% | 4,696,560 | 5.08% | ||||||||||||||
| Residential mortgage | 976,916 | 4.20% | 990,866 | 4.18% | 734,372 | 4.50% | ||||||||||||||
| Home equity | 543,770 | 3.69% | 540,193 | 4.84% | 463,480 | 5.42% | ||||||||||||||
| Installment and other consumer | 79,944 | 6.34% | 79,680 | 7.01% | 71,319 | 7.23% | ||||||||||||||
| Consumer construction | 12,758 | 4.58% | 10,508 | 4.61% | 11,014 | 5.41% | ||||||||||||||
| Total Consumer Loans | 1,613,388 | 4.14% | 1,621,247 | 4.54% | 1,280,185 | 4.99% | ||||||||||||||
| Total Portfolio Loans | 7,634,064 | 4.00% | 7,167,972 | 4.64% | 5,976,745 | 5.06% | ||||||||||||||
| Total Loans | 7,643,995 | 4.00% | 7,169,839 | 4.64% | 5,978,197 | 5.06% | ||||||||||||||
| Federal Home Loan Bank and other restricted stock | 19,709 | 3.75% | 23,601 | 6.90% | 21,141 | 6.97% | ||||||||||||||
| Total Interest-earning Assets | 8,611,952 | 3.80% | 8,079,944 | 4.40% | 6,722,404 | 4.81% | ||||||||||||||
| Noninterest-earning assets | 817,767 | 687,382 | 523,636 | |||||||||||||||||
| Total Assets | $9,429,719 | $8,767,326 | $7,246,040 | |||||||||||||||||
| LIABILITIES AND SHAREHOLDERS' EQUITY | ||||||||||||||||||||
| Interest-bearing demand | $1,033,905 | 0.24% | $942,030 | 0.59% | $550,200 | 0.46% | ||||||||||||||
| Money market | 2,076,483 | 0.50% | 1,993,764 | 1.27% | 1,695,349 | 1.93% | ||||||||||||||
| Savings | 887,357 | 0.07% | 830,985 | 0.23% | 760,743 | 0.26% | ||||||||||||||
| Certificates of deposit | 1,560,885 | 1.51% | 1,601,324 | 1.80% | 1,389,968 | 1.95% | ||||||||||||||
| Total Interest-bearing Deposits | 5,558,630 | 0.67% | 5,368,103 | 1.15% | 4,396,260 | 1.46% | ||||||||||||||
| Securities sold under repurchase agreements | 85,302 | 0.25% | 30,790 | 0.56% | 16,337 | 0.69% | ||||||||||||||
| Short-term borrowings | 178,273 | 0.38% | 286,365 | 1.61% | 242,759 | 2.71% | ||||||||||||||
| Long-term borrowings | 49,774 | 2.53% | 51,845 | 2.52% | 70,049 | 2.86% | ||||||||||||||
| Junior subordinated debt securities | 64,044 | 3.58% | 64,195 | 4.40% | 45,619 | 5.03% | ||||||||||||||
| Total Borrowings | 377,393 | 1.18% | 433,195 | 2.06% | 374,764 | 2.94% | ||||||||||||||
| Total Interest-bearing Liabilities | 5,936,023 | 0.70% | 5,801,298 | 1.22% | 4,771,024 | 1.58% | ||||||||||||||
| Noninterest-bearing liabilities | 2,302,676 | 1,776,453 | 1,523,676 | |||||||||||||||||
| Shareholders' equity | 1,191,020 | 1,189,575 | 951,340 | |||||||||||||||||
| Total Liabilities and Shareholders' Equity | $9,429,719 | $8,767,326 | $7,246,040 | |||||||||||||||||
Net Interest Margin (5) | 3.31% | 3.53% | 3.68% | |||||||||||||||||
- more -
S&T Bancorp, Inc. | S&T Earnings Release - | 9 | |||||||||
| Consolidated Selected Financial Data | |||||||||||
| Unaudited | |||||||||||
| Six Months Ended June 30, | ||||||||||||||||||||
| (dollars in thousands) | 2020 | 2019 | ||||||||||||||||||
| Net Interest Margin (FTE) (YTD Averages) | ||||||||||||||||||||
| ASSETS | ||||||||||||||||||||
| Interest-bearing deposits with banks | $131,332 | 0.59% | $51,758 | 2.42% | ||||||||||||||||
| Securities, at fair value | 786,043 | 2.55% | 676,797 | 2.67% | ||||||||||||||||
| Loans held for sale | 5,899 | 3.19% | 1,175 | 4.29% | ||||||||||||||||
| Commercial real estate | 3,399,150 | 4.48% | 2,900,181 | 5.01% | ||||||||||||||||
| Commercial and industrial | 1,975,913 | 4.02% | 1,534,080 | 5.18% | ||||||||||||||||
| Commercial construction | 408,638 | 4.19% | 246,073 | 5.37% | ||||||||||||||||
| Total Commercial Loans | 5,783,701 | 4.30% | 4,680,334 | 5.09% | ||||||||||||||||
| Residential mortgage | 983,891 | 4.19% | 728,495 | 4.44% | ||||||||||||||||
| Home equity | 541,981 | 4.26% | 465,598 | 5.43% | ||||||||||||||||
| Installment and other consumer | 79,812 | 6.67% | 70,215 | 7.20% | ||||||||||||||||
| Consumer construction | 11,633 | 4.59% | 10,244 | 5.77% | ||||||||||||||||
| Total Consumer Loans | 1,617,317 | 4.34% | 1,274,552 | 4.96% | ||||||||||||||||
| Total Portfolio Loans | 7,401,018 | 4.31% | 5,954,886 | 5.06% | ||||||||||||||||
| Total Loans | 7,406,917 | 4.31% | 5,956,061 | 5.06% | ||||||||||||||||
| Federal Home Loan Bank and other restricted stock | 21,655 | 5.47% | 22,797 | 7.79% | ||||||||||||||||
| Total Interest-earning Assets | 8,345,947 | 4.09% | 6,707,413 | 4.81% | ||||||||||||||||
| Noninterest-earning assets | 752,576 | 521,082 | ||||||||||||||||||
| Total Assets | $9,098,523 | $7,228,495 | ||||||||||||||||||
| LIABILITIES AND SHAREHOLDERS' EQUITY | ||||||||||||||||||||
| Interest-bearing demand | $987,968 | 0.41% | $547,960 | 0.44% | ||||||||||||||||
| Money market | 2,035,124 | 0.88% | 1,632,234 | 1.91% | ||||||||||||||||
| Savings | 859,171 | 0.15% | 765,638 | 0.25% | ||||||||||||||||
| Certificates of deposit | 1,581,104 | 1.66% | 1,412,117 | 1.92% | ||||||||||||||||
| Total Interest-bearing deposits | 5,463,367 | 0.90% | 4,357,949 | 1.44% | ||||||||||||||||
| Securities sold under repurchase agreements | 58,046 | 0.33% | 19,735 | 0.59% | ||||||||||||||||
| Short-term borrowings | 232,319 | 1.14% | 280,862 | 2.72% | ||||||||||||||||
| Long-term borrowings | 50,809 | 2.53% | 70,122 | 2.85% | ||||||||||||||||
| Junior subordinated debt securities | 64,120 | 3.99% | 45,619 | 5.12% | ||||||||||||||||
| Total Borrowings | 405,294 | 1.65% | 416,338 | 2.90% | ||||||||||||||||
| Total Interest-bearing Liabilities | 5,868,661 | 0.96% | 4,774,287 | 1.56% | ||||||||||||||||
| Noninterest-bearing liabilities | 2,039,565 | 1,505,964 | ||||||||||||||||||
| Shareholders' equity | 1,190,297 | 948,244 | ||||||||||||||||||
| Total Liabilities and Shareholders' Equity | $9,098,523 | $7,228,495 | ||||||||||||||||||
Net Interest Margin (8) | 3.42% | 3.70% | ||||||||||||||||||
- more -
S&T Bancorp, Inc. | S&T Earnings Release - | 10 | |||||||||
| Consolidated Selected Financial Data | |||||||||||
| Unaudited | |||||||||||
| 2020 | 2020 | 2019 | ||||||||||||||||||
| Second | First | Second | ||||||||||||||||||
| (dollars in thousands) | Quarter | Quarter | Quarter | |||||||||||||||||
| Nonperforming Loans (NPL) | ||||||||||||||||||||
| Commercial loans: | % NPL | % NPL | % NPL | |||||||||||||||||
| Commercial real estate | $61,643 | 1.84% | $50,508 | 1.47% | $28,783 | 0.99% | ||||||||||||||
| Commercial and industrial | 8,484 | 0.40% | 9,081 | 0.51% | 4,130 | 0.26% | ||||||||||||||
| Commercial construction | 1,504 | 0.33% | 571 | 0.14% | 1,226 | 0.46% | ||||||||||||||
| Total Nonperforming Commercial Loans | 71,631 | 1.20% | 60,160 | 1.07% | 34,139 | 0.72% | ||||||||||||||
| Consumer loans: | ||||||||||||||||||||
| Residential mortgage | 14,649 | 1.51% | 10,582 | 1.07% | 6,782 | 0.90% | ||||||||||||||
| Home equity | 3,814 | 0.71% | 2,797 | 0.51% | 4,081 | 0.88% | ||||||||||||||
| Installment and other consumer | 19 | 0.02% | 258 | 0.32% | 25 | 0.03% | ||||||||||||||
| Total Nonperforming Consumer Loans | 18,482 | 1.14% | 13,637 | 0.83% | 10,888 | 0.83% | ||||||||||||||
| Total Nonperforming Loans | $90,113 | 1.19% | $73,797 | 1.02% | $45,027 | 0.75% | ||||||||||||||
| 2020 | 2020 | 2019 | ||||||||||||||||||
| Second | First | Second | ||||||||||||||||||
| (dollars in thousands) | Quarter | Quarter | Quarter | |||||||||||||||||
| Loan Charge-offs (Recoveries) | ||||||||||||||||||||
| Charge-offs | $68,304 | $11,445 | $2,667 | |||||||||||||||||
| Recoveries | (231) | (289) | (532) | |||||||||||||||||
| Net Loan Charge-offs (Recoveries) | $68,072 | $11,156 | $2,135 | |||||||||||||||||
| Net Loan Charge-offs (Recoveries) | ||||||||||||||||||||
| Commercial loans: | ||||||||||||||||||||
| Customer fraud | $58,671 | $— | $— | |||||||||||||||||
| Commercial real estate | 5,588 | 428 | 522 | |||||||||||||||||
| Commercial and industrial | 3,060 | 10,265 | 1,344 | |||||||||||||||||
| Commercial construction | (19) | (2) | (2) | |||||||||||||||||
| Total Commercial Loan Charge-offs (Recoveries) | 67,300 | 10,691 | 1,864 | |||||||||||||||||
| Consumer loans: | ||||||||||||||||||||
| Residential mortgage | 74 | 19 | (154) | |||||||||||||||||
| Home equity | 16 | 80 | 57 | |||||||||||||||||
| Installment and other consumer | 682 | 366 | 368 | |||||||||||||||||
| Total Consumer Loan Charge-offs | 772 | 465 | 271 | |||||||||||||||||
| Total Net Loan Charge-offs (Recoveries) | $68,072 | $11,156 | $2,135 | |||||||||||||||||
| Six Months Ended June 30, | ||||||||||||||||||||
| (dollars in thousands) | 2020 | 2019 | ||||||||||||||||||
| Loan Charge-offs (Recoveries) | ||||||||||||||||||||
| Charge-offs | $79,749 | $8,691 | ||||||||||||||||||
| Recoveries | (520) | (1,320) | ||||||||||||||||||
| Net Loan Charge-offs (Recoveries) | $79,229 | $7,371 | ||||||||||||||||||
| Net Loan Charge-offs (Recoveries) | ||||||||||||||||||||
| Commercial loans: | ||||||||||||||||||||
| Customer fraud | $58,671 | $— | ||||||||||||||||||
| Commercial real estate | 6,016 | 401 | ||||||||||||||||||
| Commercial and industrial | 13,325 | 6,403 | ||||||||||||||||||
| Commercial construction | (21) | (3) | ||||||||||||||||||
| Total Commercial Loan Charge-offs/(Recoveries) | 77,991 | 6,801 | ||||||||||||||||||
| Consumer loans: | ||||||||||||||||||||
| Residential mortgage | 93 | (38) | ||||||||||||||||||
| Home equity | 97 | 39 | ||||||||||||||||||
| Installment and other consumer | 1,048 | 651 | ||||||||||||||||||
| Consumer construction | — | (82) | ||||||||||||||||||
| Total Consumer Loan Charge-offs | 1,238 | 570 | ||||||||||||||||||
| Total Net Loan Charge-offs (Recoveries) | $79,229 | $7,371 | ||||||||||||||||||
- more -
S&T Bancorp, Inc. | S&T Earnings Release - | 11 | |||||||||
| Consolidated Selected Financial Data | |||||||||||
| Unaudited | |||||||||||
| 2020 | 2020 | 2019 | ||||||||||||||||||
| Second | First | Second | ||||||||||||||||||
| (dollars in thousands) | Quarter | Quarter | Quarter | |||||||||||||||||
| Asset Quality Data | ||||||||||||||||||||
| Nonperforming loans | $90,113 | $73,797 | $45,027 | |||||||||||||||||
| OREO | 2,740 | 3,389 | 1,495 | |||||||||||||||||
| Nonperforming assets | 92,853 | 77,186 | 46,522 | |||||||||||||||||
| Troubled debt restructurings (nonaccruing) | 31,755 | 36,054 | 9,943 | |||||||||||||||||
| Troubled debt restructurings (accruing) | 15,536 | 15,189 | 20,690 | |||||||||||||||||
| Total troubled debt restructurings | 47,291 | 51,243 | 30,633 | |||||||||||||||||
| Nonperforming loans / loans | 1.19 | % | 1.02 | % | 0.75 | % | ||||||||||||||
| Nonperforming assets / loans plus OREO | 1.23 | % | 1.06 | % | 0.77 | % | ||||||||||||||
| Allowance for credit losses / total portfolio loans | 1.52 | % | 1.34 | % | 1.02 | % | ||||||||||||||
| Allowance for credit losses / nonperforming loans | 127 | % | 131 | % | 137 | % | ||||||||||||||
| Net loan charge-offs (recoveries) | $68,072 | $11,156 | $2,135 | |||||||||||||||||
| Net loan charge-offs (recoveries)(annualized) / average loans | 3.58 | % | 0.63 | % | 0.14 | % | ||||||||||||||
| Six Months Ended June 30, | ||||||||||||||||||||
| (dollars in thousands) | 2020 | 2019 | ||||||||||||||||||
| Asset Quality Data | ||||||||||||||||||||
| Net loan charge-offs (recoveries) | $79,229 | $7,371 | ||||||||||||||||||
| Net loan charge-offs (recoveries)(annualized) / average loans | 2.15 | % | 0.25 | % | ||||||||||||||||
S&T Bancorp, Inc. | S&T Earnings Release - | 12 | |||||||||
| Consolidated Selected Financial Data | |||||||||||
| Unaudited | |||||||||||
Definitions and Reconciliation of GAAP to Non-GAAP Financial Measures:
| 2020 | 2020 | 2019 | ||||||||||||||||||
| Second | First | Second | ||||||||||||||||||
| Quarter | Quarter | Quarter | ||||||||||||||||||
(1) Tangible Book Value (non-GAAP) | ||||||||||||||||||||
| Total shareholders' equity | $1,135,777 | $1,176,251 | $964,953 | |||||||||||||||||
| Less: goodwill and other intangible assets | (383,032) | (384,557) | (289,701) | |||||||||||||||||
| Tax effect of other intangible assets | 2,046 | 2,160 | 474 | |||||||||||||||||
| Tangible common equity (non-GAAP) | $754,791 | $793,854 | $675,726 | |||||||||||||||||
| Common shares outstanding | 39,263 | 39,125 | 34,330 | |||||||||||||||||
| Tangible book value (non-GAAP) | $19.22 | $20.29 | $19.68 | |||||||||||||||||
(2) Return on Average Tangible Shareholders' Equity (non-GAAP) | ||||||||||||||||||||
| Net (loss) income (annualized) | ($133,016) | $53,216 | $104,689 | |||||||||||||||||
| Plus: amortization of intangibles (annualized) | 2,623 | 2,542 | 654 | |||||||||||||||||
| Tax effect of amortization of intangibles (annualized) | (551) | (534) | (137) | |||||||||||||||||
| Net (loss) income before amortization of intangibles (annualized) | ($130,944) | $55,224 | $105,206 | |||||||||||||||||
| Average total shareholders' equity | $1,191,020 | $1,189,575 | $951,340 | |||||||||||||||||
| Less: average goodwill and other intangible assets | (384,197) | (382,025) | (289,784) | |||||||||||||||||
| Tax effect of average goodwill and other intangible assets | 2,116 | 2,235 | 491 | |||||||||||||||||
| Average tangible equity (non-GAAP) | $808,939 | $809,785 | $662,047 | |||||||||||||||||
| Return on average tangible shareholders' equity (non-GAAP) | (16.19 | %) | 6.82 | % | 15.89 | % | ||||||||||||||
(3) Efficiency Ratio (non-GAAP) | ||||||||||||||||||||
| Noninterest expense | $43,478 | $46,391 | $40,352 | |||||||||||||||||
| Less: merger related expenses | — | (2,342) | 618 | |||||||||||||||||
| Noninterest expense excluding nonrecurring items | $43,478 | $44,049 | $40,352 | |||||||||||||||||
| Net interest income per consolidated statements of net income | $70,148 | $70,036 | $60,827 | |||||||||||||||||
| Less: net (gains) losses on sale of securities | (142) | — | — | |||||||||||||||||
| Plus: taxable equivalent adjustment | 847 | 849 | 958 | |||||||||||||||||
| Net interest income (FTE) (non-GAAP) | $70,853 | $70,885 | $61,785 | |||||||||||||||||
| Noninterest income | 15,224 | 12,403 | 12,901 | |||||||||||||||||
| Net interest income (FTE) (non-GAAP) plus noninterest income | $86,077 | $83,288 | $74,686 | |||||||||||||||||
| Efficiency ratio (non-GAAP) | 50.51 | % | 52.89 | % | 54.03 | % | ||||||||||||||
(4) Tangible Common Equity / Tangible Assets (non-GAAP) | ||||||||||||||||||||
| Total shareholders' equity | $1,135,777 | $1,176,251 | $964,953 | |||||||||||||||||
| Less: goodwill and other intangible assets | (383,032) | (384,557) | (289,701) | |||||||||||||||||
| Tax effect of goodwill and other intangible assets | 2,046 | 2,160 | 474 | |||||||||||||||||
| Tangible common equity (non-GAAP) | $754,791 | $793,854 | $675,726 | |||||||||||||||||
| Total assets | $9,474,296 | $9,005,496 | $7,334,605 | |||||||||||||||||
| Less: goodwill and other intangible assets | (383,032) | (384,557) | (289,701) | |||||||||||||||||
| Tax effect of goodwill and other intangible assets | 2,046 | 2,160 | 474 | |||||||||||||||||
| Tangible assets (non-GAAP) | $9,093,310 | $8,623,099 | $7,045,378 | |||||||||||||||||
| Tangible common equity to tangible assets (non-GAAP) | 8.30 | % | 9.21 | % | 9.59 | % | ||||||||||||||
(5) Net Interest Margin Rate (FTE) (non-GAAP) | ||||||||||||||||||||
| Interest income | $80,479 | $87,589 | $79,624 | |||||||||||||||||
| Less: interest expense | 10,331 | 17,553 | 18,797 | |||||||||||||||||
| Net interest income per consolidated statements of net income | $70,148 | $70,036 | $60,827 | |||||||||||||||||
| Plus: taxable equivalent adjustment | 847 | 849 | 958 | |||||||||||||||||
| Net interest income (FTE) (non-GAAP) | $70,995 | $70,885 | $61,785 | |||||||||||||||||
| Net interest income (FTE) (annualized) | $285,540 | $285,098 | $247,819 | |||||||||||||||||
| Average earning assets | $8,611,952 | $8,079,944 | $6,722,404 | |||||||||||||||||
| Net interest margin - (FTE) (non-GAAP) | 3.31 | % | 3.53 | % | 3.68 | % | ||||||||||||||
- more -
S&T Bancorp, Inc. | S&T Earnings Release - | 13 | |||||||||
| Consolidated Selected Financial Data | |||||||||||
| Unaudited | |||||||||||
Definitions and Reconciliation of GAAP to Non-GAAP Financial Measures - continued:
| Six Months Ended June 30, | ||||||||||||||||||||
| 2020 | 2019 | |||||||||||||||||||
(6) Return on Average Tangible Shareholders' Equity (non-GAAP) | ||||||||||||||||||||
| Net (loss) income (annualized) | ($39,900) | $98,870 | ||||||||||||||||||
| Plus: amortization of intangibles (annualized) | 2,582 | 697 | ||||||||||||||||||
| Tax effect of amortization of intangibles (annualized) | (542) | (146) | ||||||||||||||||||
| Net (loss) income before amortization of intangibles (annualized) | ($37,860) | $99,421 | ||||||||||||||||||
| Average total shareholders' equity | $1,190,297 | $948,244 | ||||||||||||||||||
| Less: average goodwill and other intangible assets | (383,111) | (289,869) | ||||||||||||||||||
| Tax effect of average goodwill and other intangible assets | 2,176 | 509 | ||||||||||||||||||
| Average tangible equity (non-GAAP) | $809,362 | $658,884 | ||||||||||||||||||
| Return on average tangible equity (non-GAAP) | (4.68 | %) | 15.09 | % | ||||||||||||||||
(7) Efficiency Ratio (non-GAAP) | ||||||||||||||||||||
| Noninterest expense | $89,869 | $79,271 | ||||||||||||||||||
| Less: merger related expenses | (2,342) | (618) | ||||||||||||||||||
| Noninterest expense excluding nonrecurring items | $87,527 | $78,653 | ||||||||||||||||||
| Net interest income per consolidated statements of net income | $140,184 | $121,183 | ||||||||||||||||||
| Less: net (gains) losses on sale of securities | (142) | — | ||||||||||||||||||
| Plus: taxable equivalent adjustment | 1,697 | 1,919 | ||||||||||||||||||
| Net interest income (FTE) (non-GAAP) | $141,739 | $123,102 | ||||||||||||||||||
| Noninterest income | 27,627 | 24,263 | ||||||||||||||||||
| Net interest income (FTE) (non-GAAP) plus noninterest income | $169,366 | $147,365 | ||||||||||||||||||
| Efficiency ratio (non-GAAP) | 51.68 | % | 53.37 | % | ||||||||||||||||
(8) Net Interest Margin Rate (FTE) (non-GAAP) | ||||||||||||||||||||
| Interest income | $168,069 | $158,214 | ||||||||||||||||||
| Less: interest expense | 27,885 | 37,031 | ||||||||||||||||||
| Net interest income per consolidated statements of net income | 140,184 | 121,183 | ||||||||||||||||||
| Plus: taxable equivalent adjustment | 1,697 | 1,919 | ||||||||||||||||||
| Net interest income (FTE) (non-GAAP) | $141,881 | $123,102 | ||||||||||||||||||
| Net interest income (FTE) (annualized) | $285,321 | $248,244 | ||||||||||||||||||
| Average earning assets | $8,345,947 | $6,707,413 | ||||||||||||||||||
| Net interest margin - (FTE) (non-GAAP) | 3.42 | % | 3.70 | % | ||||||||||||||||
- more -
S&T Bancorp, Inc. | S&T Earnings Release - | 14 | |||||||||
| Consolidated Selected Financial Data | |||||||||||
| Unaudited | |||||||||||
The following profitability metrics for the three and six months ended June 30, 2020 are adjusted to exclude a $58.7 million loss related to a customer fraud.
| 2020 | 2020 | |||||||||||||||||||
| Second | Six Months Ended June 30, | |||||||||||||||||||
| Quarter | ||||||||||||||||||||
| Return on Average Tangible Shareholders' Equity (non-GAAP) | ||||||||||||||||||||
| Net loss | ($33,072) | ($19,841) | ||||||||||||||||||
| Provision for credit losses | 58,671 | 58,671 | ||||||||||||||||||
| Tax effect | (12,321) | (12,321) | ||||||||||||||||||
| Net income excluding fraud | $13,278 | $26,509 | ||||||||||||||||||
| Net income excluding fraud (annualized) | $53,404 | $53,309 | ||||||||||||||||||
| Plus: amortization of intangibles (annualized) | 2,623 | 2,582 | ||||||||||||||||||
| Tax effect of amortization of intangibles (annualized) | (551) | (542) | ||||||||||||||||||
| Net income before amortization of intangibles (annualized) | $55,476 | $55,349 | ||||||||||||||||||
| Average total shareholders' equity | $1,191,020 | $1,190,297 | ||||||||||||||||||
| Less: average goodwill and other intangible assets | (384,197) | (383,111) | ||||||||||||||||||
| Tax effect of average goodwill and other intangible assets | 2,116 | 2,176 | ||||||||||||||||||
| Average tangible equity (non-GAAP) | $808,939 | $809,362 | ||||||||||||||||||
| Return on average tangible shareholders' equity (non-GAAP) | 6.86 | % | 6.84 | % | ||||||||||||||||
Return on Average Assets (non-GAAP) | ||||||||||||||||||||
| Net income excluding fraud (annualized) | $53,404 | $53,309 | ||||||||||||||||||
| Average total assets | 9,429,719 | 9,098,523 | ||||||||||||||||||
| Return on average assets (non-GAAP) | 0.57 | % | 0.59 | % | ||||||||||||||||
Return on Average Equity (non-GAAP) | ||||||||||||||||||||
| Net income excluding fraud (annualized) | $53,404 | $53,309 | ||||||||||||||||||
| Average total shareholders' equity | 1,191,020 | 1,190,297 | ||||||||||||||||||
| Return on average assets (non-GAAP) | 4.48 | % | 4.48 | % | ||||||||||||||||
- more -
Second Quarter 2020 Earnings Supplement MEMBER FDIC
Forward Looking Statements and Risk Factors This information contains certain forward-looking statements within the meaning of the Private Securities Litigation Reform Act of 1995. Forward-looking statements generally relate to our financial condition, results of operations, plans, objectives, outlook for earnings, revenues, expenses, capital and liquidity levels and ratios, asset levels, asset quality, financial position, and other matters regarding or affecting S&T and its future business and operations. Forward-looking statements are typically identified by words or phrases such as “will likely result”, “expect”, “anticipate”, “estimate”, “forecast”, “project”, “intend”, “ believe”, “assume”, “strategy”, “trend”, “plan”, “outlook”, “outcome”, “continue”, “remain”, “potential”, “opportunity”, “believe”, “comfortable”, “current”, “position”, “maintain”, “sustain”, “seek”, “achieve” and variations of such words and similar expressions, or future or conditional verbs such as will, would, should, could or may. Although we believe the assumptions upon which these forward-looking statements are based are reasonable, any of these assumptions could prove to be inaccurate and the forward-looking statements based on these assumptions could be incorrect. The matters discussed in these forward-looking statements are subject to various risks, uncertainties and other factors that could cause actual results and trends to differ materially from those made, projected, or implied in or by the forward-looking statements depending on a variety of uncertainties or other factors including, but not limited to: credit losses and the credit risk of our commercial and consumer loan products; changes in the level of charge-offs and changes in estimates of the adequacy of the allowance for loan losses; cyber-security concerns; rapid technological developments and changes; operational risks or risk management failures by us or critical third parties, including fraud risk; our ability to manage our reputational risks; sensitivity to the interest rate environment including a prolonged period of low interest rates, a rapid increase in interest rates or a change in the shape of the yield curve; a change in spreads on interest-earning assets and interest-bearing liabilities; regulatory supervision and oversight, including changes in regulatory capital requirements and our ability to address those requirements; unanticipated changes in our liquidity position; changes in accounting policies, practices, or guidance, for example, our adoption of CECL; legislation affecting the financial services industry as a whole, and S&T, in particular; the outcome of pending and future litigation and governmental proceedings; increasing price and product/service competition; the ability to continue to introduce competitive new products and services on a timely, cost-effective basis; managing our internal growth and acquisitions; the possibility that the anticipated benefits from acquisitions, including DNB, cannot be fully realized in a timely manner or at all, or that integrating the acquired operations will be more difficult, disruptive or costly than anticipated; containing costs and expenses; reliance on significant customer relationships; an interruption or cessation of an important service by a third-party provider; our ability to attract and retain talented executives and employees; general economic or business conditions, including the strength of regional economic conditions in our market area; the duration and severity of the corona virus (“COVID-19”) pandemic, both in our principal area of operations and nationally, including the ultimate impact of the pandemic on the economy generally and on our operations; deterioration of the housing market and reduced demand for mortgages; deterioration in the overall macroeconomic conditions or the state of the banking industry that could warrant further analysis of the carrying value of goodwill and could result in an adjustment to its carrying value resulting in a non-cash charge to net income; the stability of our core deposit base and access to contingency funding; re-emergence of turbulence in significant portions of the global financial and real estate markets that could impact our performance, both directly, by affecting our revenues and the value of our assets and liabilities, and indirectly, by affecting the economy generally and access to capital in the amounts, at the times and on the terms required to support our future businesses. Many of these factors, as well as other factors, are described in our filings with the SEC. Forward-looking statements are based on beliefs and assumptions using information available at the time the statements are made. We caution you not to unduly rely on forward-looking statements because the assumptions, beliefs, expectations and projections about future events may, and often do, differ materially from actual results. Any forward-looking statement speaks only as to the date on which it is made, and we undertake no obligation to update any forward-looking statement to reflect developments occurring after the statement is made. Non-GAAP Financial Measures In addition to the results of operations presented in accordance with Generally Accepted Accounting Principles (GAAP), S&T management uses and this presentation contains or references certain non-GAAP financial measures, such as net interest income on a fully taxable equivalent basis. S&T believes these financial measures provide information useful to investors in understanding our operational performance and business and performance trends which facilitate comparisons with the performance of others in the financial services industry. Although S&T believes that these non-GAAP financial measures enhance investors’ understanding of S&T’s business and performance, these non-GAAP financial measures should not be considered an alternative to GAAP. The non-GAAP financial measures contained therein should be read in conjunction with the audited financial statements and analysis as presented in the Annual Report on Form 10-K as well as the unaudited financial statements and analyses as presented in the respective Quarterly Reports in Exhibit 99.1 of Form 8-K for S&T Bancorp, Inc. and subsidiaries. 2
Second Quarter 2020 Highlights EPS: ($ 0.85) ex-fraud $0.34 PTPP 1.79%; $41.9 million Deposit growth $810 million ($33.1) million Net (Loss): Net Income: $13.3 million Mortgage banking ACL build $17.8 million PPP participation ROA ROE ROTE Returns: (1.41%) (11.17%) (16.19%) Efficiency ratio 50.51% 0.57% 4.48% 6.86% Dividend of $0.28 declared J.D. Power award Provision LLR Asset $86.8 million 1.52% New website launch Quality: $28.1 million ex-PPP 1.64% Refer to appendix for reconciliation of non-GAAP financial measures 3
Second Quarter 2020 Fraud • Check Kiting Scheme – Second quarter 2020 loss of $58.7 million or $1.19 per diluted share – Perpetrated by single business relationship – Discovered and first disclosed in late May 2020 • Update and Actions Taken to Date – No additional fraud-related losses expected – Pursuing all avenues that could result in some recovery – Criminal investigation is ongoing – Internal review completed – Process and monitoring enhancements substantially implemented • Related Credit Exposure – Originally $15.1 million; $14.3 million commercial real estate and $0.8 million line of credit – Second quarter results include $4.2 million charge-off – Remaining exposure of $10.9 million included in non-performing loans 4
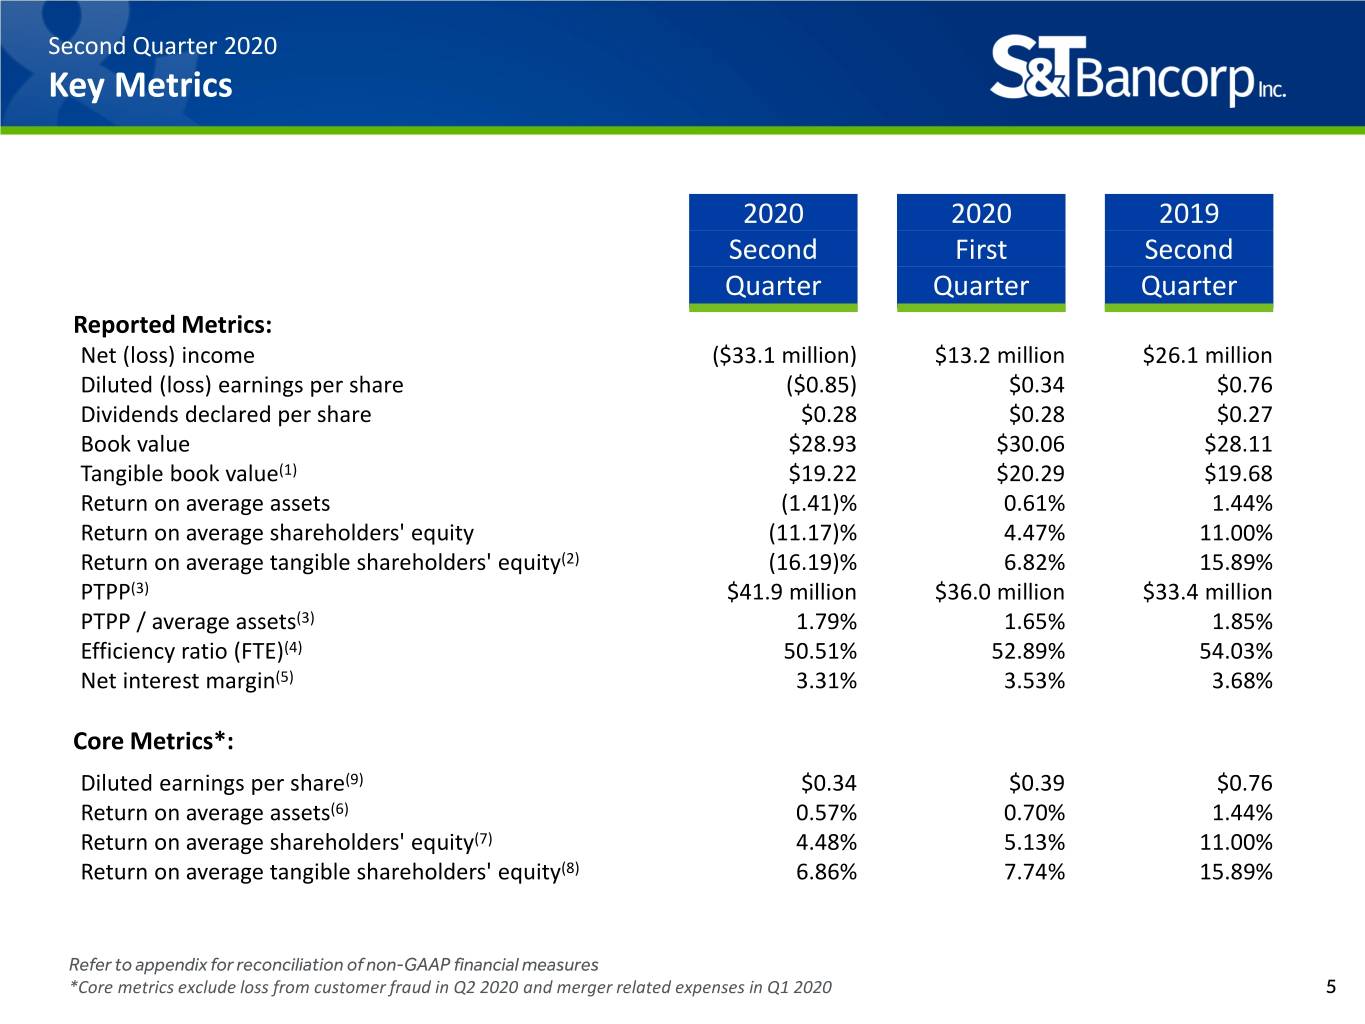
Second Quarter 2020 Key Metrics 2020 2020 2019 Second First Second Quarter Quarter Quarter Reported Metrics: Net (loss) income ($33.1 million) $13.2 million $26.1 million Diluted (loss) earnings per share ($0.85) $0.34 $0.76 Dividends declared per share $0.28 $0.28 $0.27 Book value $28.93 $30.06 $28.11 Tangible book value(1) $19.22 $20.29 $19.68 Return on average assets (1.41)% 0.61% 1.44% Return on average shareholders' equity (11.17)% 4.47% 11.00% Return on average tangible shareholders' equity(2) (16.19)% 6.82% 15.89% PTPP(3) $41.9 million $36.0 million $33.4 million PTPP / average assets(3) 1.79% 1.65% 1.85% Efficiency ratio (FTE)(4) 50.51% 52.89% 54.03% Net interest margin(5) 3.31% 3.53% 3.68% Core Metrics*: Diluted earnings per share(9) $0.34 $0.39 $0.76 Return on average assets(6) 0.57% 0.70% 1.44% Return on average shareholders' equity(7) 4.48% 5.13% 11.00% Return on average tangible shareholders' equity(8) 6.86% 7.74% 15.89% Refer to appendix for reconciliation of non-GAAP financial measures *Core metrics exclude loss from customer fraud in Q2 2020 and merger related expenses in Q1 2020 5
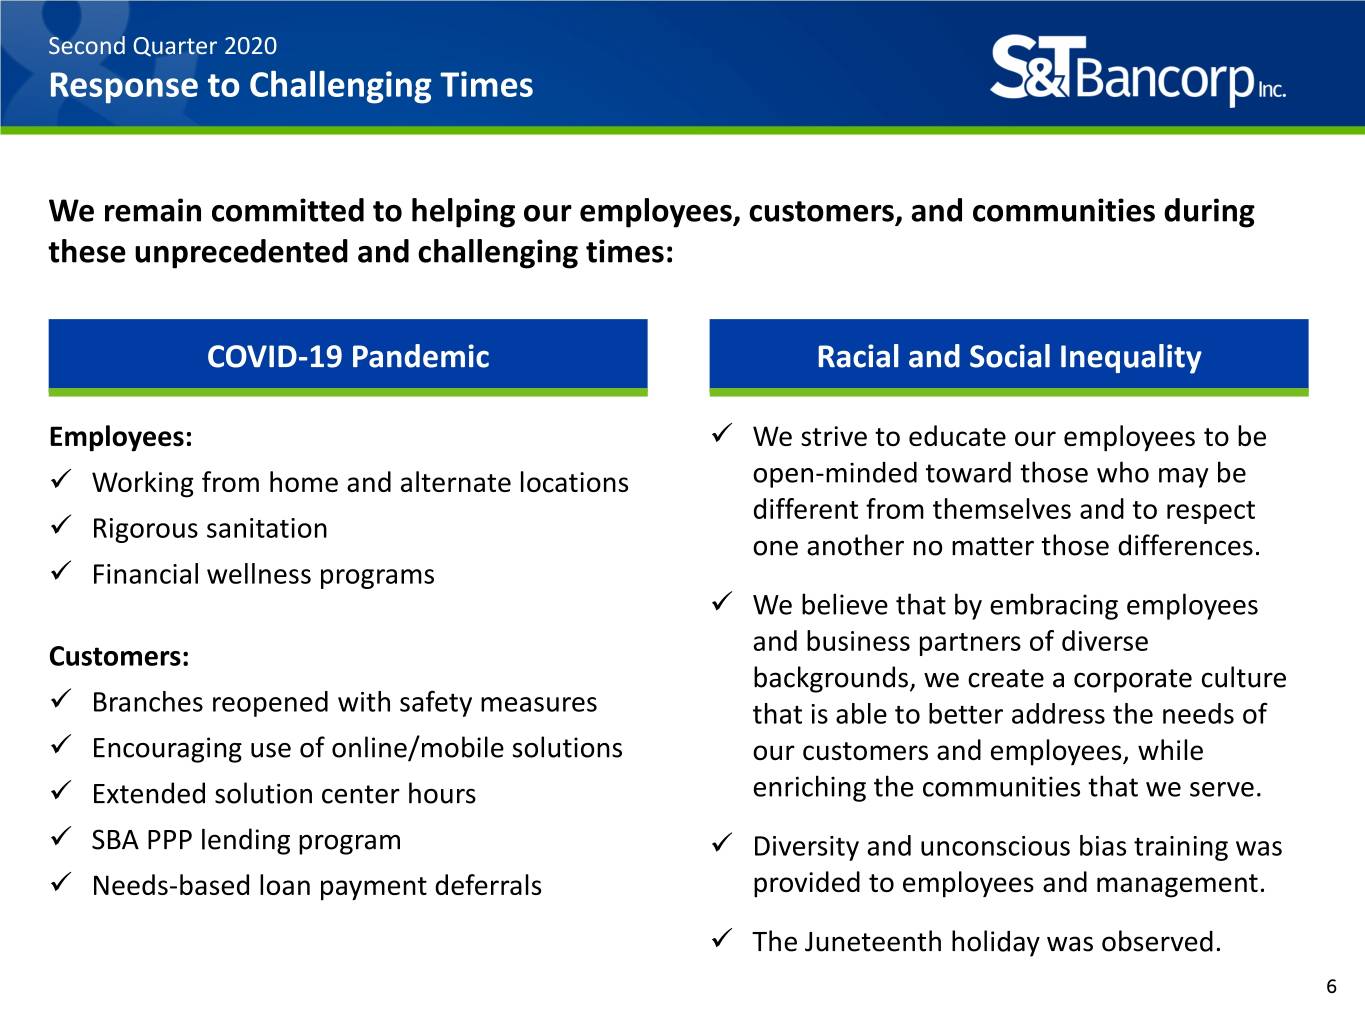
Second Quarter 2020 Response to Challenging Times We remain committed to helping our employees, customers, and communities during these unprecedented and challenging times: COVID-19 Pandemic Racial and Social Inequality Employees: We strive to educate our employees to be Working from home and alternate locations open-minded toward those who may be different from themselves and to respect Rigorous sanitation one another no matter those differences. Financial wellness programs We believe that by embracing employees and business partners of diverse Customers: backgrounds, we create a corporate culture Branches reopened with safety measures that is able to better address the needs of Encouraging use of online/mobile solutions our customers and employees, while Extended solution center hours enriching the communities that we serve. SBA PPP lending program Diversity and unconscious bias training was Needs-based loan payment deferrals provided to employees and management. The Juneteenth holiday was observed. 6
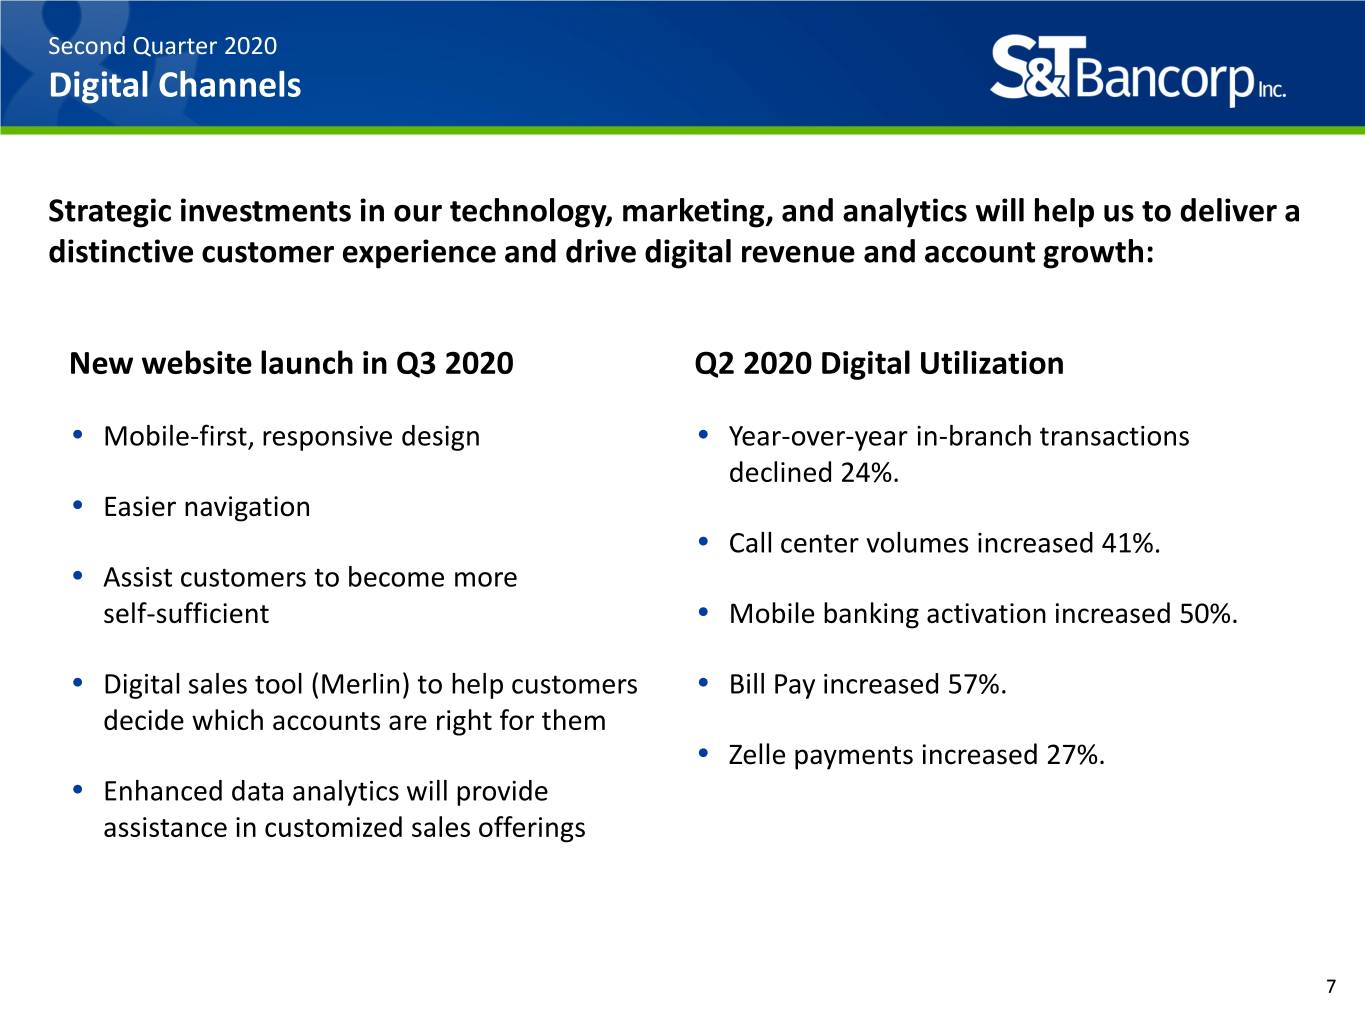
Second Quarter 2020 Digital Channels Strategic investments in our technology, marketing, and analytics will help us to deliver a distinctive customer experience and drive digital revenue and account growth: New website launch in Q3 2020 Q2 2020 Digital Utilization • Mobile-first, responsive design • Year-over-year in-branch transactions declined 24%. • Easier navigation • Call center volumes increased 41%. • Assist customers to become more self-sufficient • Mobile banking activation increased 50%. • Digital sales tool (Merlin) to help customers • Bill Pay increased 57%. decide which accounts are right for them • Zelle payments increased 27%. • Enhanced data analytics will provide assistance in customized sales offerings 7
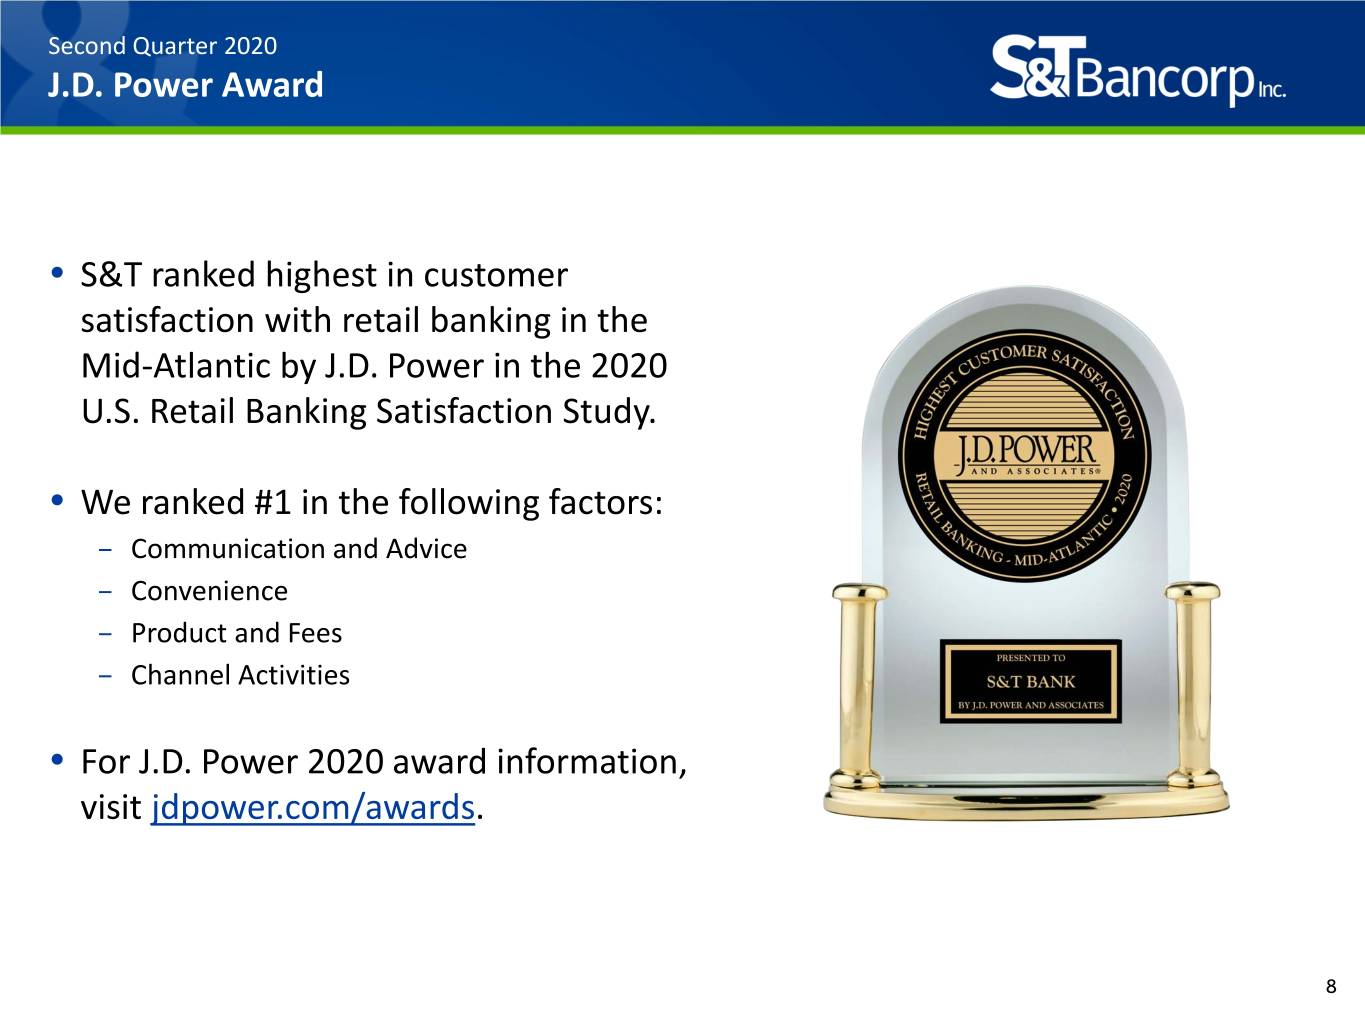
Second Quarter 2020 J.D. Power Award • S&T ranked highest in customer satisfaction with retail banking in the Mid-Atlantic by J.D. Power in the 2020 U.S. Retail Banking Satisfaction Study. • We ranked #1 in the following factors: – Communication and Advice – Convenience – Product and Fees – Channel Activities • For J.D. Power 2020 award information, visit jdpower.com/awards. 8
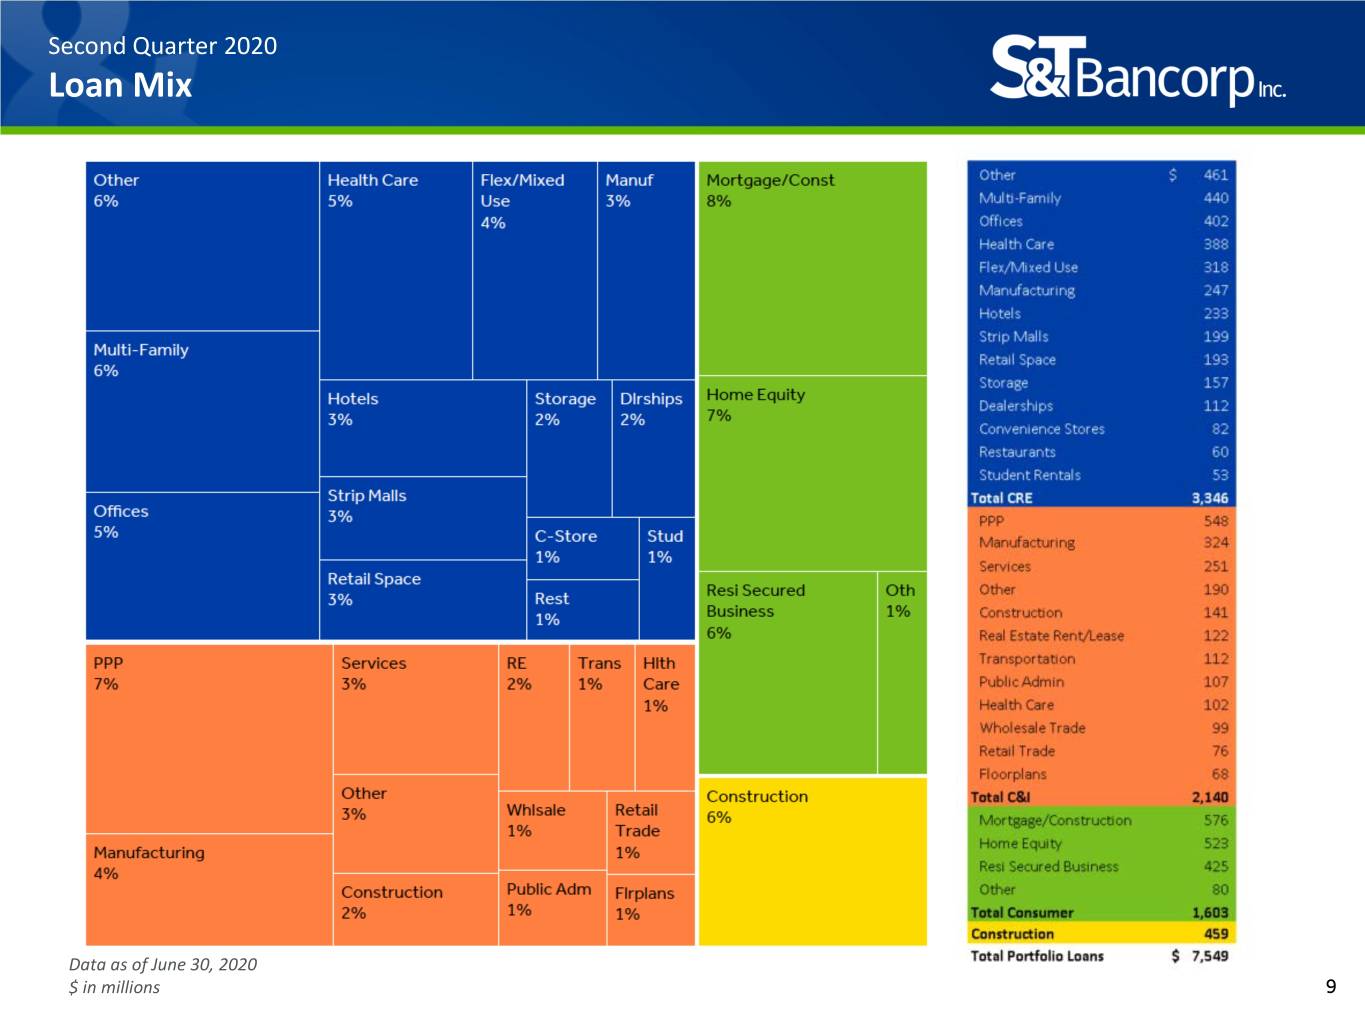
Second Quarter 2020 Loan Mix Data as of June 30, 2020 $ in millions 9
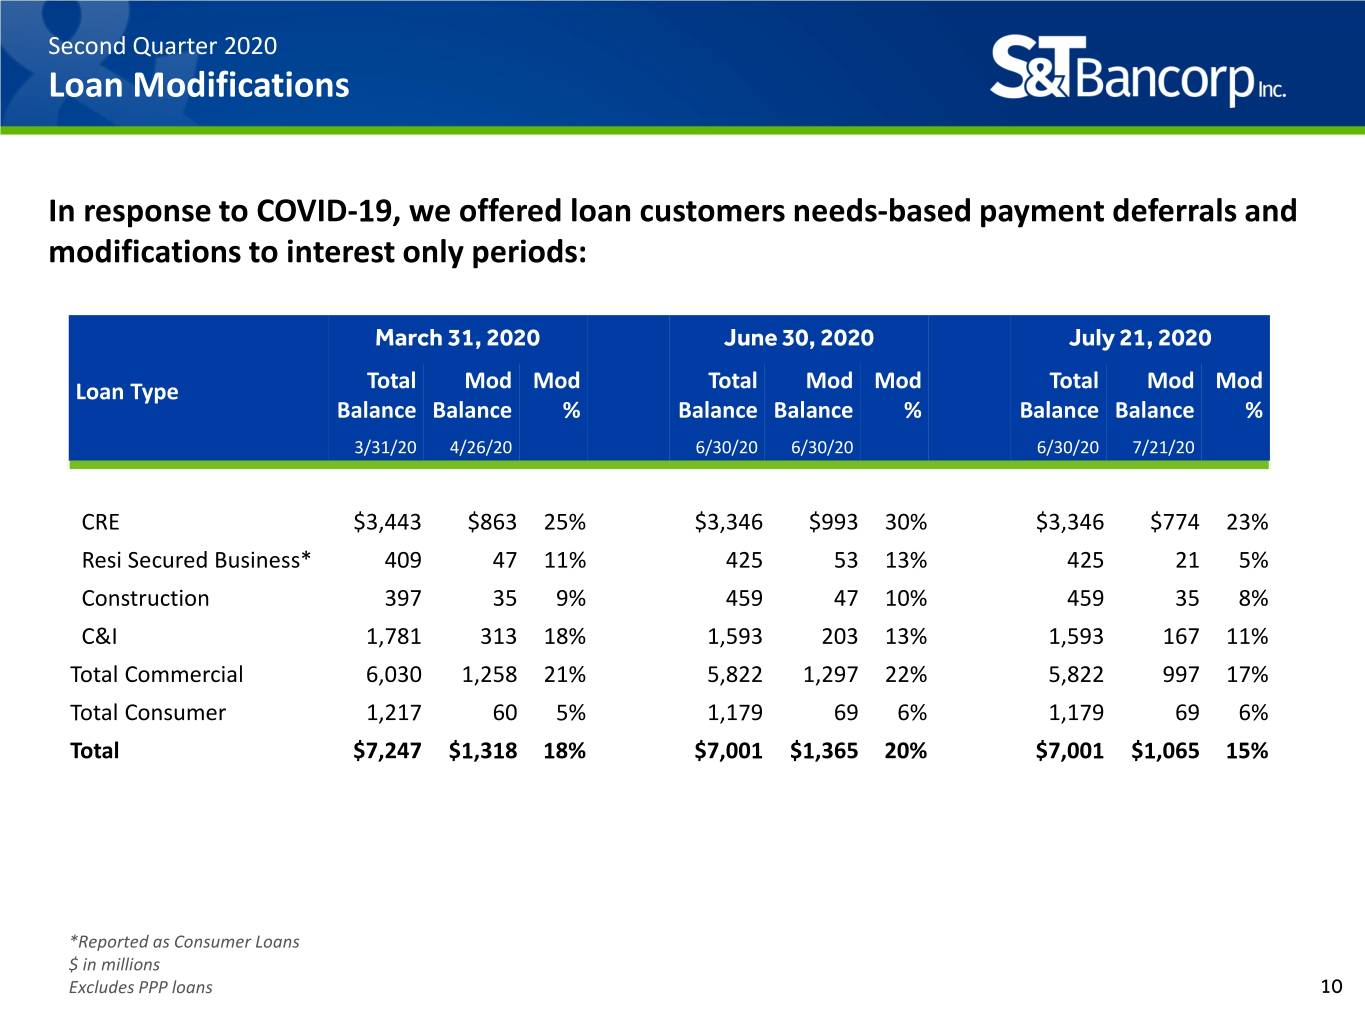
Second Quarter 2020 Loan Modifications In response to COVID-19, we offered loan customers needs-based payment deferrals and modifications to interest only periods: March 31, 2020 June 30, 2020 July 21, 2020 Loan Type Total Mod Mod Total Mod Mod Total Mod Mod Balance Balance % Balance Balance % Balance Balance % 3/31/20 4/26/20 6/30/20 6/30/20 6/30/20 7/21/20 CRE $3,443 $863 25% $3,346 $993 30% $3,346 $774 23% Resi Secured Business* 409 47 11% 425 53 13% 425 21 5% Construction 397 35 9% 459 47 10% 459 35 8% C&I 1,781 313 18% 1,593 203 13% 1,593 167 11% Total Commercial 6,030 1,258 21% 5,822 1,297 22% 5,822 997 17% Total Consumer 1,217 60 5% 1,179 69 6% 1,179 69 6% Total $7,247 $1,318 18% $7,001 $1,365 20% $7,001 $1,065 15% *Reported as Consumer Loans $ in millions Excludes PPP loans 10
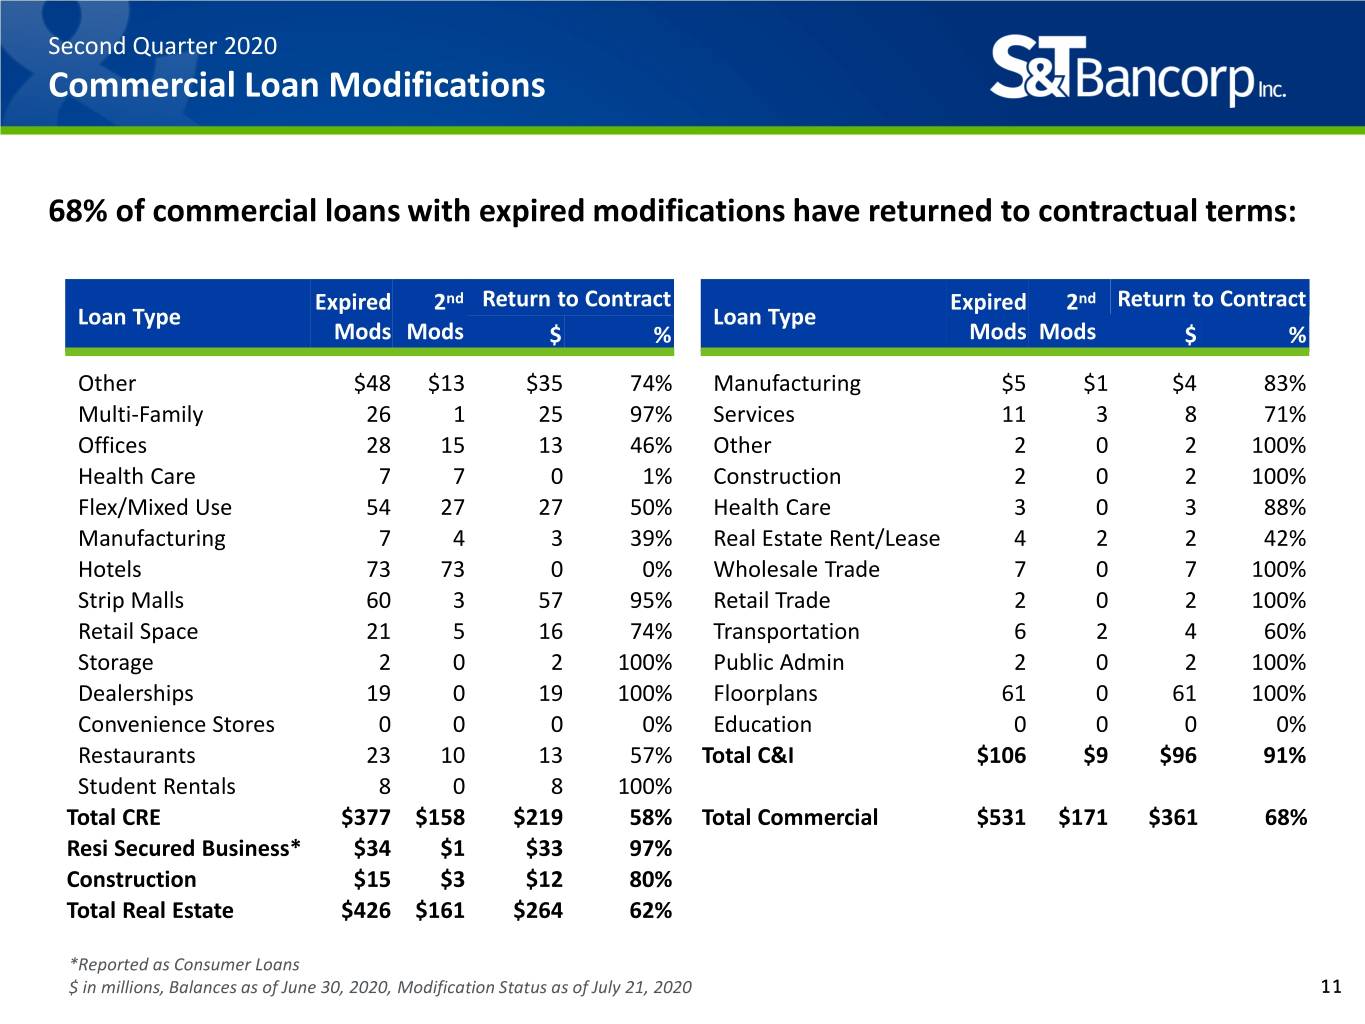
Second Quarter 2020 Commercial Loan Modifications 68% of commercial loans with expired modifications have returned to contractual terms: Expired 2nd Return to Contract Expired 2nd Return to Contract Loan Type Loan Type Mods Mods $ % Mods Mods $ % Other $48 $13 $35 74% Manufacturing $5 $1 $4 83% Multi-Family 26 1 25 97% Services 11 3 8 71% Offices 28 15 13 46% Other 2 0 2 100% Health Care 7 7 0 1% Construction 2 0 2 100% Flex/Mixed Use 54 27 27 50% Health Care 3 0 3 88% Manufacturing 7 4 3 39% Real Estate Rent/Lease 4 2 2 42% Hotels 73 73 0 0% Wholesale Trade 7 0 7 100% Strip Malls 60 3 57 95% Retail Trade 2 0 2 100% Retail Space 21 5 16 74% Transportation 6 2 4 60% Storage 2 0 2 100% Public Admin 2 0 2 100% Dealerships 19 0 19 100% Floorplans 61 0 61 100% Convenience Stores 0 0 0 0% Education 0 0 0 0% Restaurants 23 10 13 57% Total C&I $106 $9 $96 91% Student Rentals 8 0 8 100% Total CRE $377 $158 $219 58% Total Commercial $531 $171 $361 68% Resi Secured Business* $34 $1 $33 97% Construction $15 $3 $12 80% Total Real Estate $426 $161 $264 62% *Reported as Consumer Loans $ in millions, Balances as of June 30, 2020, Modification Status as of July 21, 2020 11
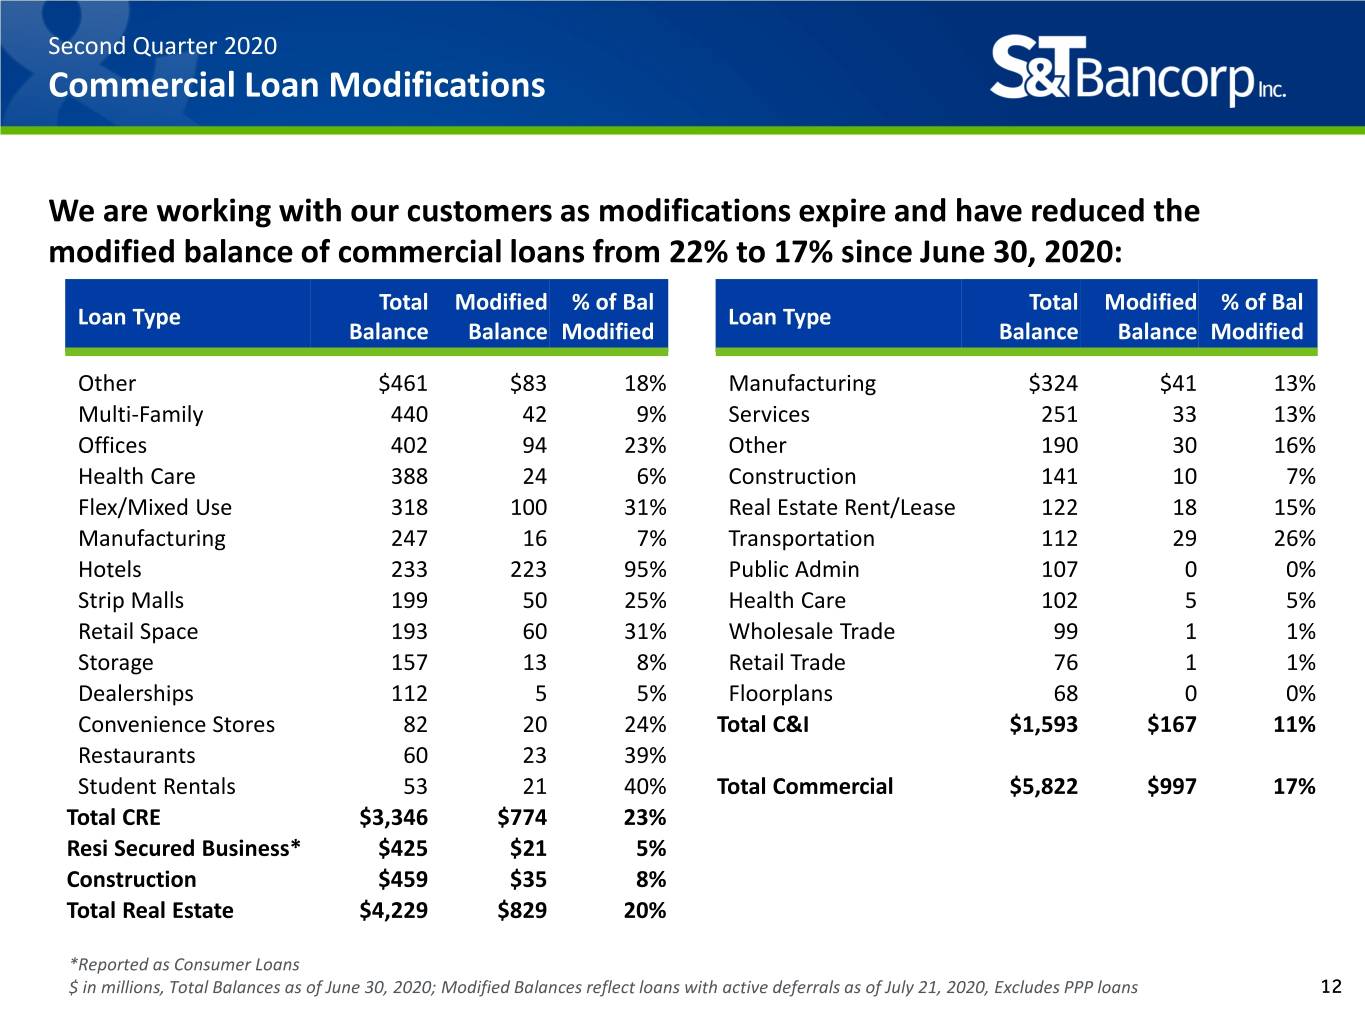
Second Quarter 2020 Commercial Loan Modifications We are working with our customers as modifications expire and have reduced the modified balance of commercial loans from 22% to 17% since June 30, 2020: Total Modified % of Bal Total Modified % of Bal Loan Type Loan Type Balance Balance Modified Balance Balance Modified Other $461 $83 18% Manufacturing $324 $41 13% Multi-Family 440 42 9% Services 251 33 13% Offices 402 94 23% Other 190 30 16% Health Care 388 24 6% Construction 141 10 7% Flex/Mixed Use 318 100 31% Real Estate Rent/Lease 122 18 15% Manufacturing 247 16 7% Transportation 112 29 26% Hotels 233 223 95% Public Admin 107 0 0% Strip Malls 199 50 25% Health Care 102 5 5% Retail Space 193 60 31% Wholesale Trade 99 1 1% Storage 157 13 8% Retail Trade 76 1 1% Dealerships 112 5 5% Floorplans 68 0 0% Convenience Stores 82 20 24% Total C&I $1,593 $167 11% Restaurants 60 23 39% Student Rentals 53 21 40% Total Commercial $5,822 $997 17% Total CRE $3,346 $774 23% Resi Secured Business* $425 $21 5% Construction $459 $35 8% Total Real Estate $4,229 $829 20% *Reported as Consumer Loans $ in millions, Total Balances as of June 30, 2020; Modified Balances reflect loans with active deferrals as of July 21, 2020, Excludes PPP loans 12
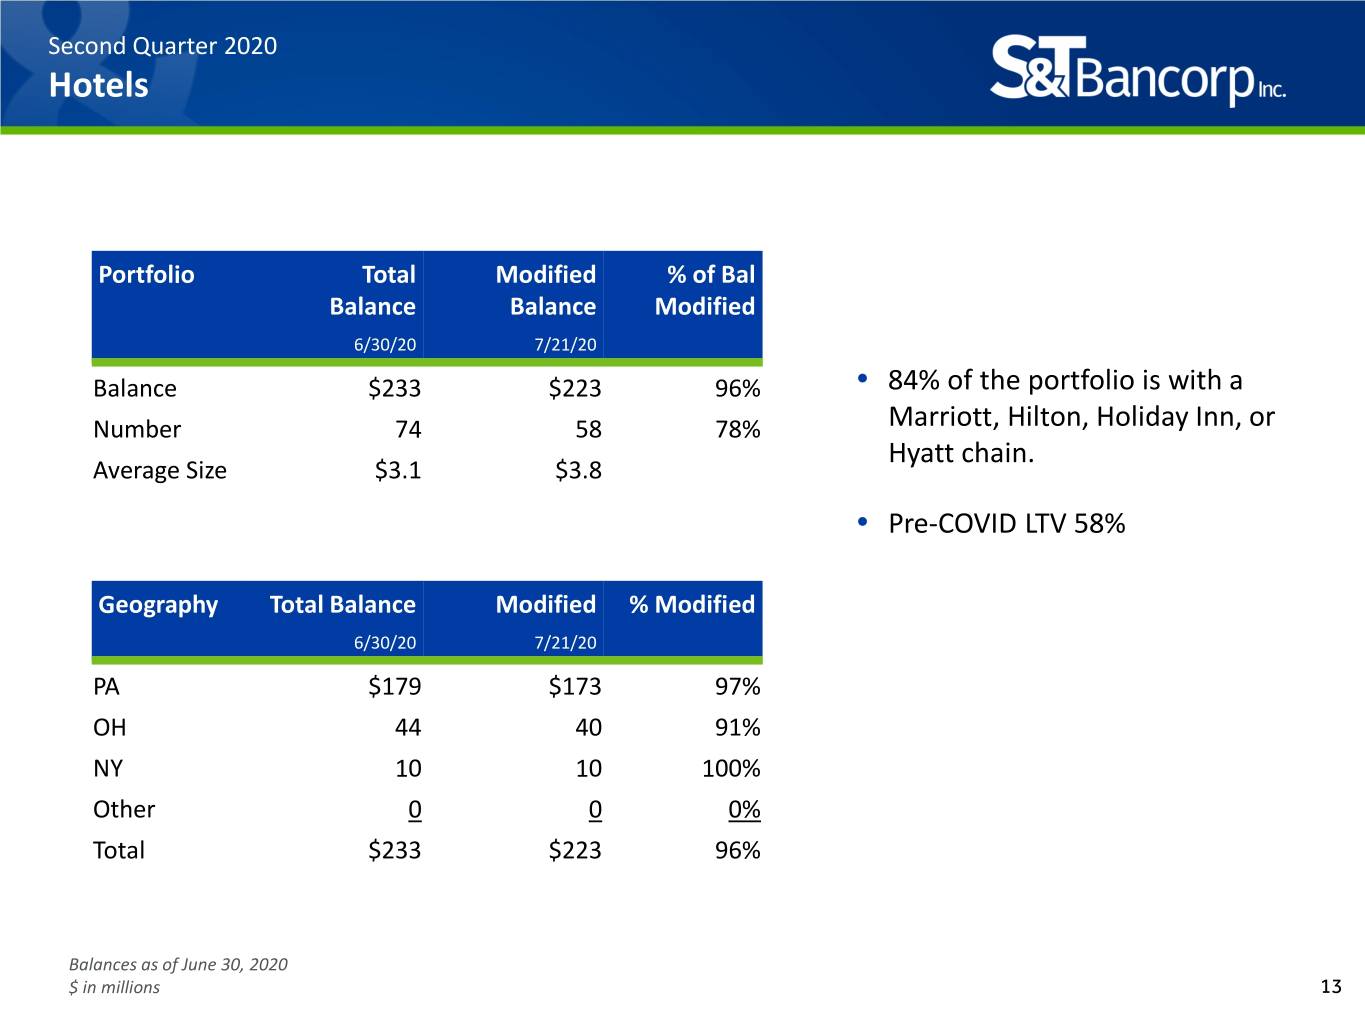
Second Quarter 2020 Hotels Portfolio Total Modified % of Bal Balance Balance Modified 6/30/20 7/21/20 Balance $233 $223 96% • 84% of the portfolio is with a Number 74 58 78% Marriott, Hilton, Holiday Inn, or Hyatt chain. Average Size $3.1 $3.8 • Pre-COVID LTV 58% Geography Total Balance Modified % Modified 6/30/20 7/21/20 PA $179 $173 97% OH 44 40 91% NY 10 10 100% Other 0 0 0% Total $233 $223 96% Balances as of June 30, 2020 $ in millions 13
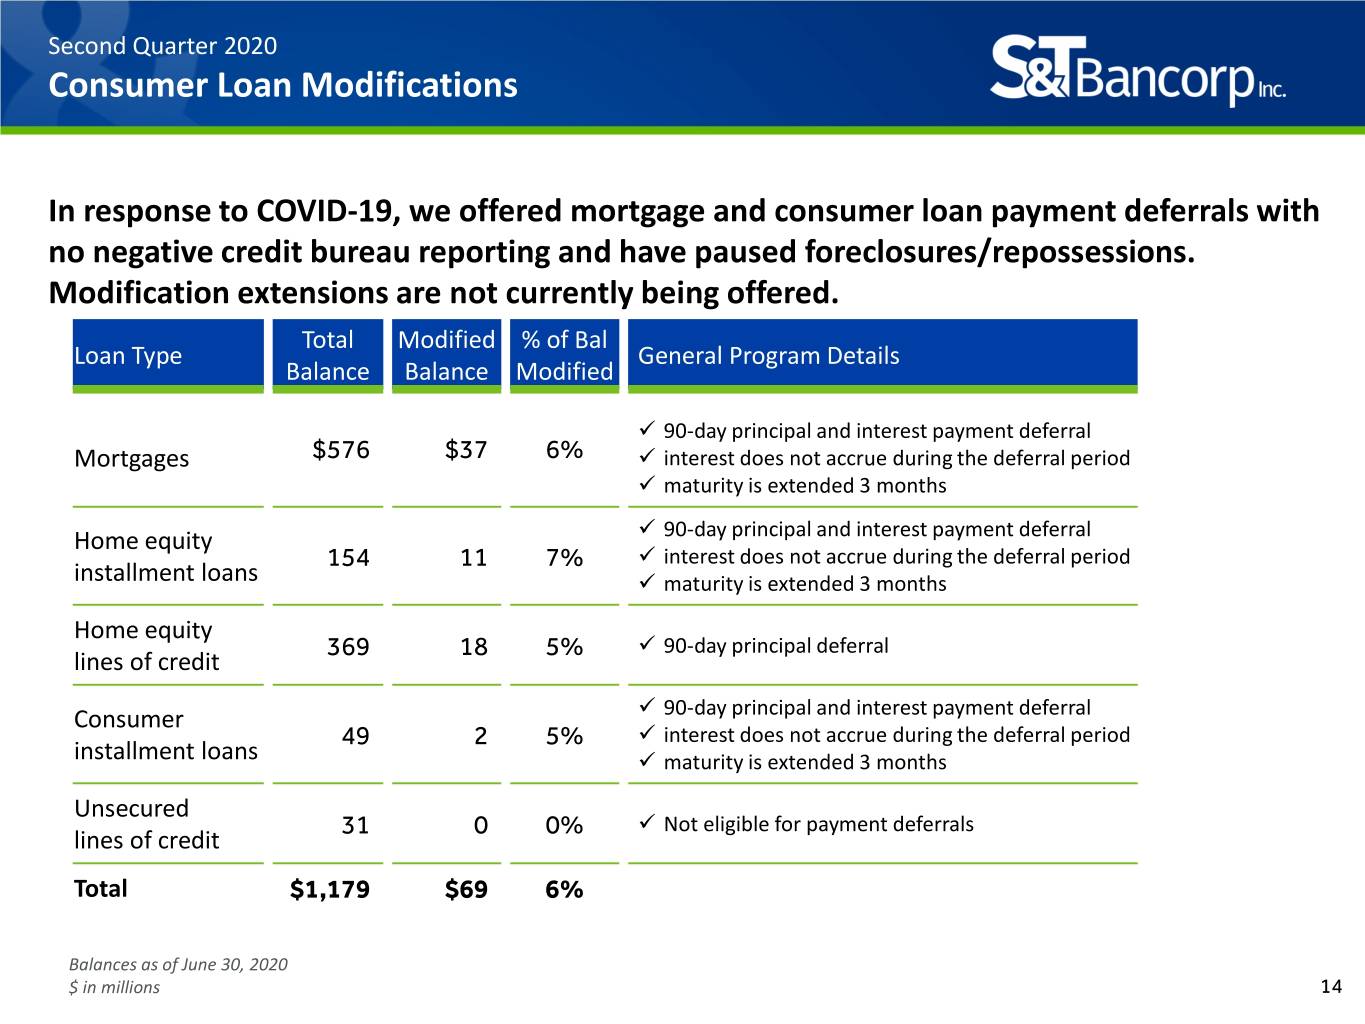
Second Quarter 2020 Consumer Loan Modifications In response to COVID-19, we offered mortgage and consumer loan payment deferrals with no negative credit bureau reporting and have paused foreclosures/repossessions. Modification extensions are not currently being offered. Total Modified % of Bal Loan Type General Program Details Balance Balance Modified 90-day principal and interest payment deferral Mortgages $576 $37 6% interest does not accrue during the deferral period maturity is extended 3 months Home equity 90-day principal and interest payment deferral 154 11 7% interest does not accrue during the deferral period installment loans maturity is extended 3 months Home equity 369 18 5% 90-day principal deferral lines of credit Consumer 90-day principal and interest payment deferral 49 2 5% interest does not accrue during the deferral period installment loans maturity is extended 3 months Unsecured 31 0 0% Not eligible for payment deferrals lines of credit Total $1,179 $69 6% Balances as of June 30, 2020 $ in millions 14
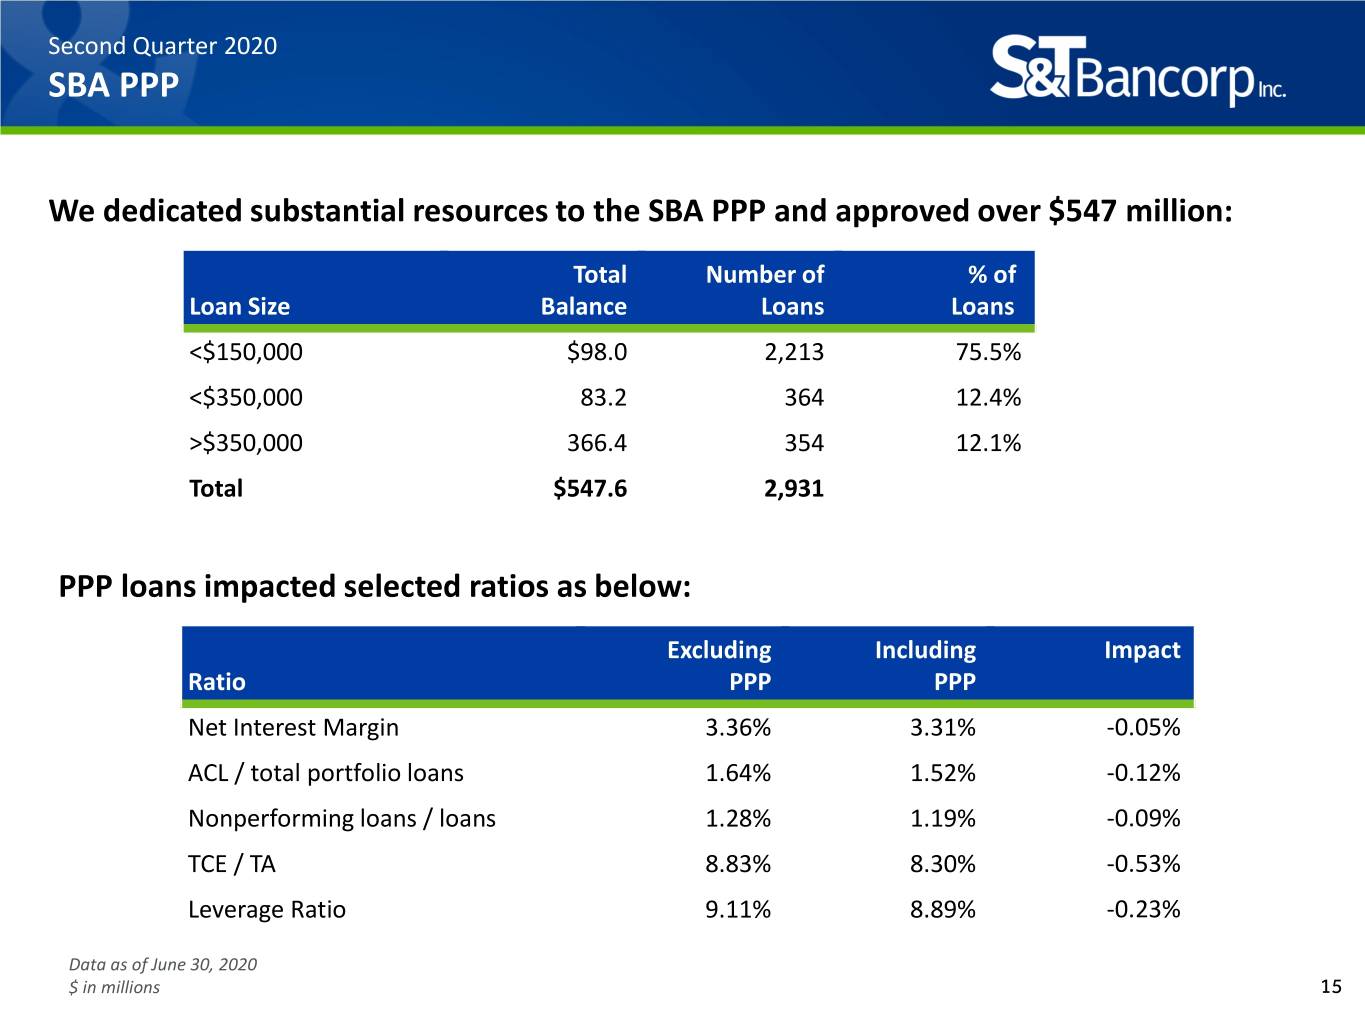
Second Quarter 2020 SBA PPP We dedicated substantial resources to the SBA PPP and approved over $547 million: Total Number of % of. Loan Size Balance Loans Loans. <$150,000 $98.0 2,213 75.5% <$350,000 83.2 364 12.4% >$350,000 366.4 354 12.1% Total $547.6 2,931 PPP loans impacted selected ratios as below: Excluding Including Impact Ratio PPP PPP Net Interest Margin 3.36% 3.31% -0.05% ACL / total portfolio loans 1.64% 1.52% -0.12% Nonperforming loans / loans 1.28% 1.19% -0.09% TCE / TA 8.83% 8.30% -0.53% Leverage Ratio 9.11% 8.89% -0.23% Data as of June 30, 2020 $ in millions 15
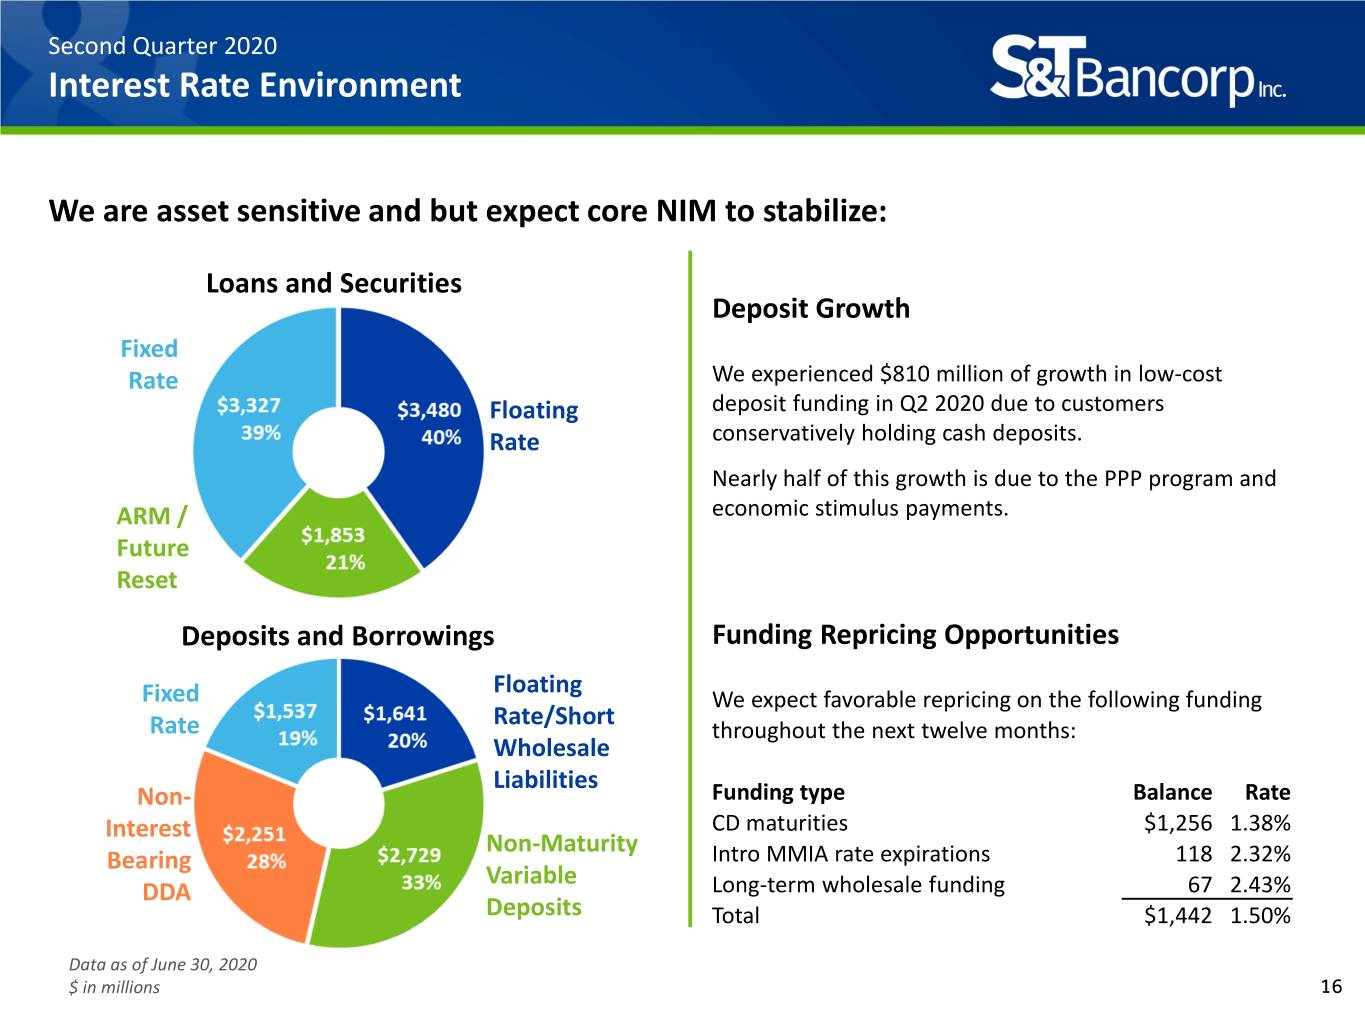
Second Quarter 2020 Interest Rate Environment We are asset sensitive and but expect core NIM to stabilize: Loans and Securities Deposit Growth Fixed Rate We experienced $810 million of growth in low-cost Floating deposit funding in Q2 2020 due to customers Rate conservatively holding cash deposits. Nearly half of this growth is due to the PPP program and ARM / economic stimulus payments. Future Reset Deposits and Borrowings Funding Repricing Opportunities Floating Fixed We expect favorable repricing on the following funding Rate/Short Rate throughout the next twelve months: Wholesale Liabilities Non- Funding type Balance Rate Interest CD maturities $1,256 1.38% Non-Maturity Bearing Intro MMIA rate expirations 118 2.32% Variable DDA Long-term wholesale funding 67 2.43% Deposits Total $1,442 1.50% Data as of June 30, 2020 $ in millions 16
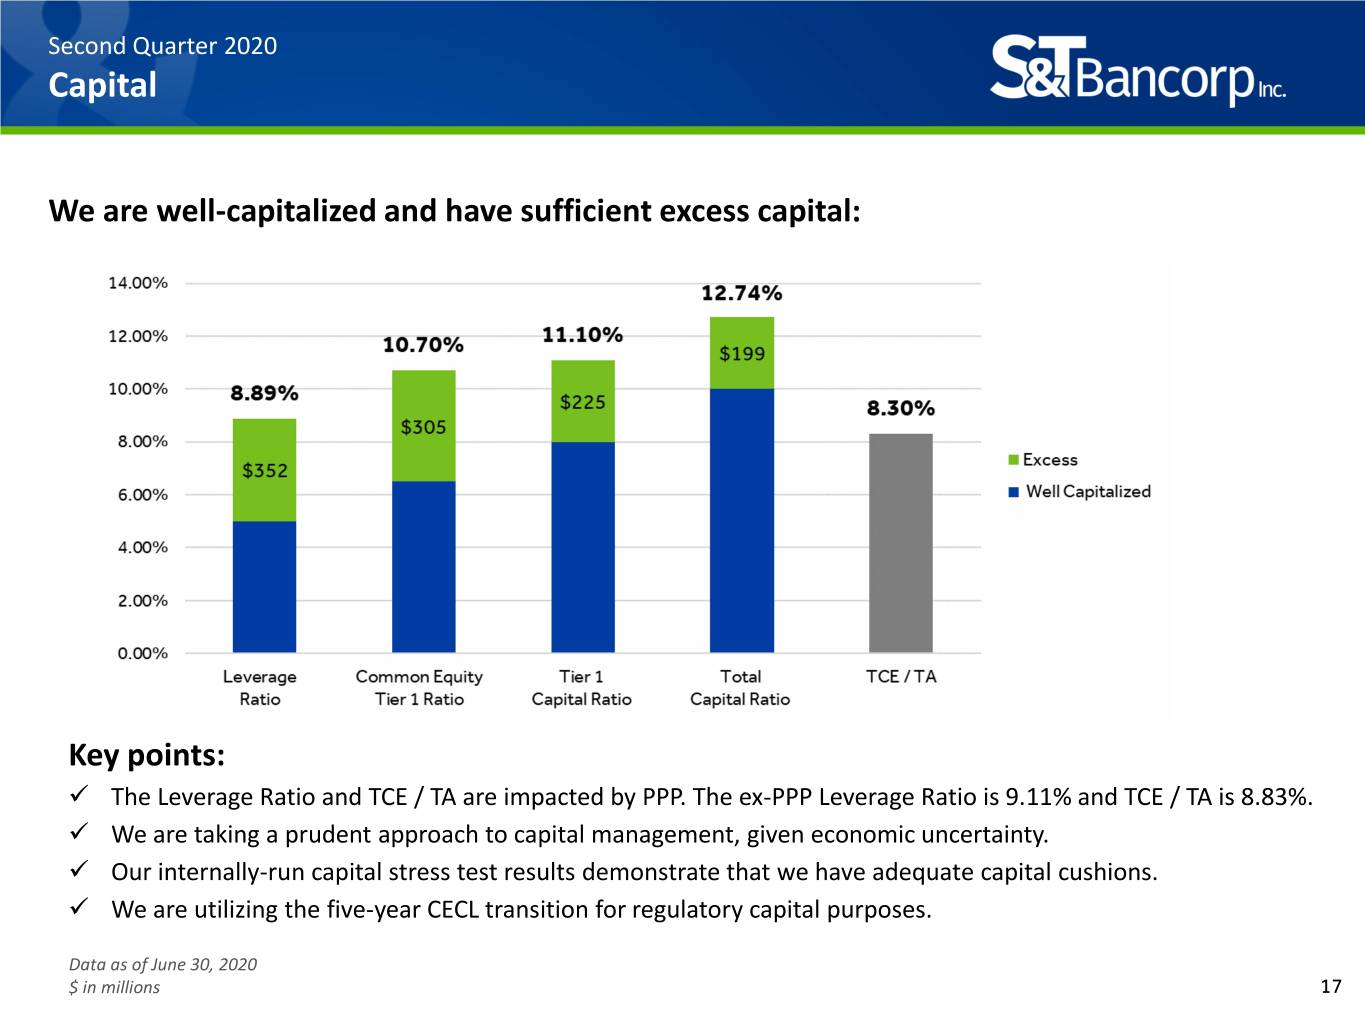
Second Quarter 2020 Capital We are well-capitalized and have sufficient excess capital: Key points: The Leverage Ratio and TCE / TA are impacted by PPP. The ex-PPP Leverage Ratio is 9.11% and TCE / TA is 8.83%. We are taking a prudent approach to capital management, given economic uncertainty. Our internally-run capital stress test results demonstrate that we have adequate capital cushions. We are utilizing the five-year CECL transition for regulatory capital purposes. Data as of June 30, 2020 $ in millions 17
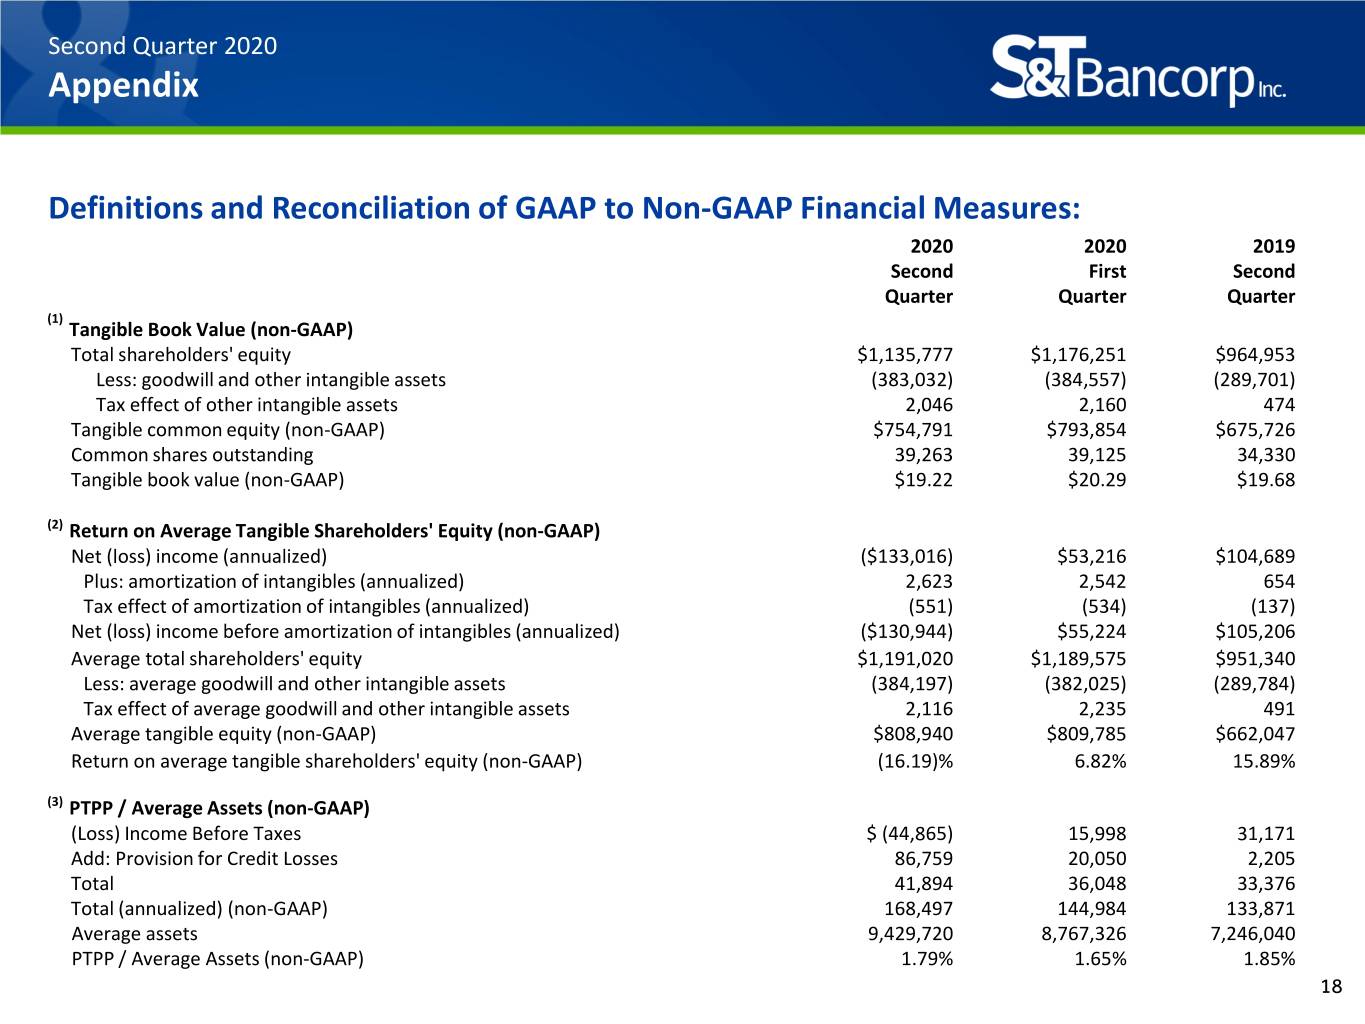
Second Quarter 2020 Appendix Definitions and Reconciliation of GAAP to Non-GAAP Financial Measures: 2020 2020 2019 Second First Second Quarter Quarter Quarter (1) Tangible Book Value (non-GAAP) Total shareholders' equity $1,135,777 $1,176,251 $964,953 Less: goodwill and other intangible assets (383,032) (384,557) (289,701) Tax effect of other intangible assets 2,046 2,160 474 Tangible common equity (non-GAAP) $754,791 $793,854 $675,726 Common shares outstanding 39,263 39,125 34,330 Tangible book value (non-GAAP) $19.22 $20.29 $19.68 (2) Return on Average Tangible Shareholders' Equity (non-GAAP) Net (loss) income (annualized) ($133,016) $53,216 $104,689 Plus: amortization of intangibles (annualized) 2,623 2,542 654 Tax effect of amortization of intangibles (annualized) (551) (534) (137) Net (loss) income before amortization of intangibles (annualized) ($130,944) $55,224 $105,206 Average total shareholders' equity $1,191,020 $1,189,575 $951,340 Less: average goodwill and other intangible assets (384,197) (382,025) (289,784) Tax effect of average goodwill and other intangible assets 2,116 2,235 491 Average tangible equity (non-GAAP) $808,940 $809,785 $662,047 Return on average tangible shareholders' equity (non-GAAP) (16.19)% 6.82% 15.89% (3) PTPP / Average Assets (non-GAAP) (Loss) Income Before Taxes $ (44,865) 15,998 31,171 Add: Provision for Credit Losses 86,759 20,050 2,205 Total 41,894 36,048 33,376 Total (annualized) (non-GAAP) 168,497 144,984 133,871 Average assets 9,429,720 8,767,326 7,246,040 PTPP / Average Assets (non-GAAP) 1.79% 1.65% 1.85% 18
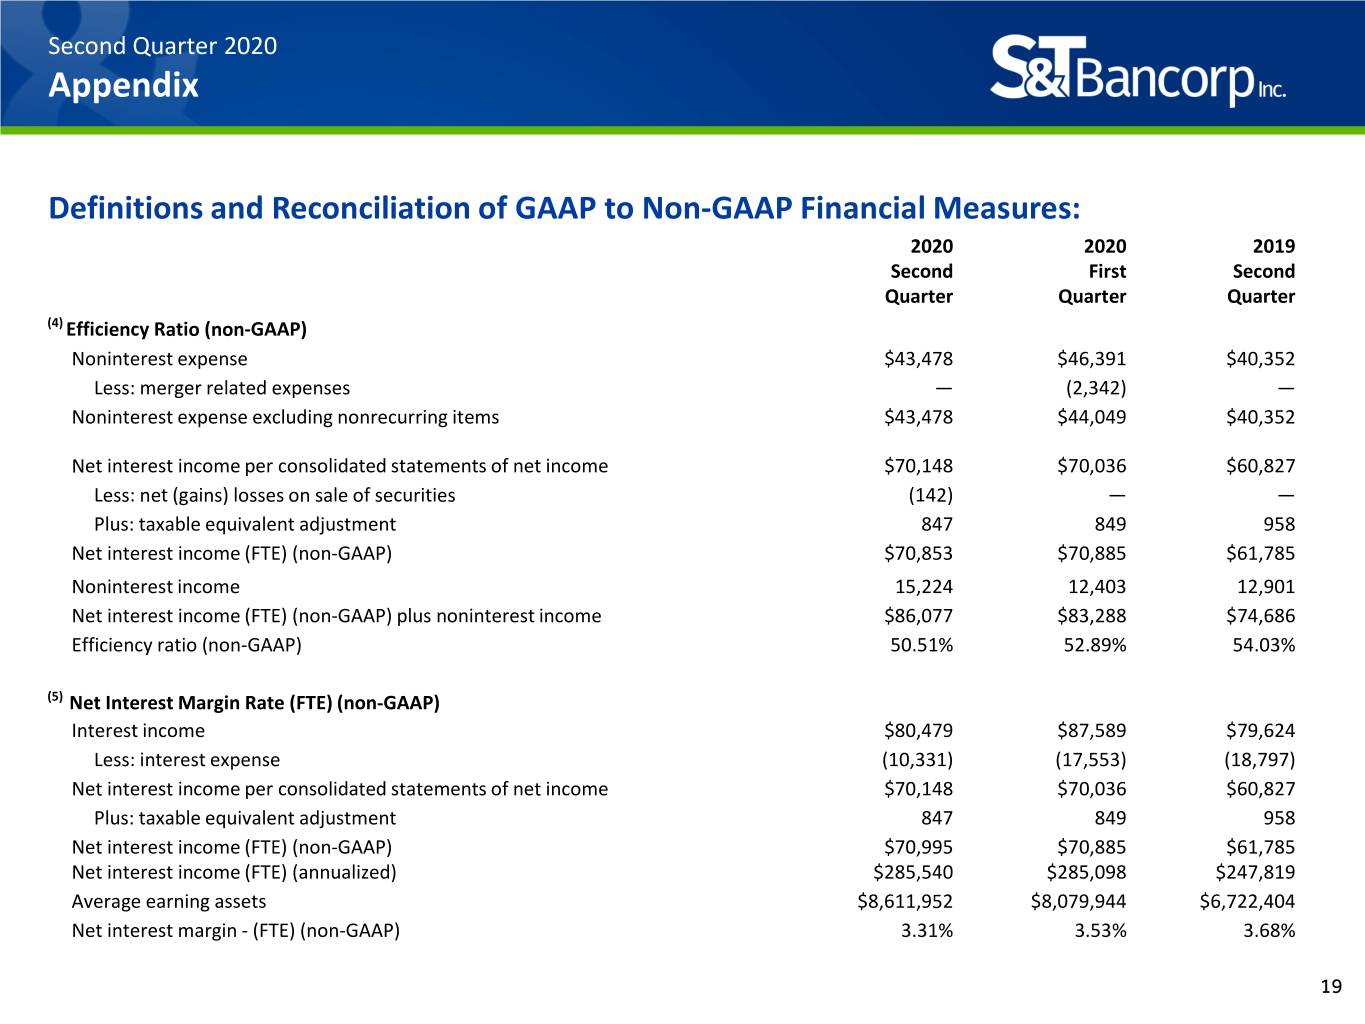
Second Quarter 2020 Appendix Definitions and Reconciliation of GAAP to Non-GAAP Financial Measures: 2020 2020 2019 Second First Second Quarter Quarter Quarter (4) Efficiency Ratio (non-GAAP) Noninterest expense $43,478 $46,391 $40,352 Less: merger related expenses — (2,342) — Noninterest expense excluding nonrecurring items $43,478 $44,049 $40,352 Net interest income per consolidated statements of net income $70,148 $70,036 $60,827 Less: net (gains) losses on sale of securities (142) — — Plus: taxable equivalent adjustment 847 849 958 Net interest income (FTE) (non-GAAP) $70,853 $70,885 $61,785 Noninterest income 15,224 12,403 12,901 Net interest income (FTE) (non-GAAP) plus noninterest income $86,077 $83,288 $74,686 Efficiency ratio (non-GAAP) 50.51% 52.89% 54.03% (5) Net Interest Margin Rate (FTE) (non-GAAP) Interest income $80,479 $87,589 $79,624 Less: interest expense (10,331) (17,553) (18,797) Net interest income per consolidated statements of net income $70,148 $70,036 $60,827 Plus: taxable equivalent adjustment 847 849 958 Net interest income (FTE) (non-GAAP) $70,995 $70,885 $61,785 Net interest income (FTE) (annualized) $285,540 $285,098 $247,819 Average earning assets $8,611,952 $8,079,944 $6,722,404 Net interest margin - (FTE) (non-GAAP) 3.31% 3.53% 3.68% 19
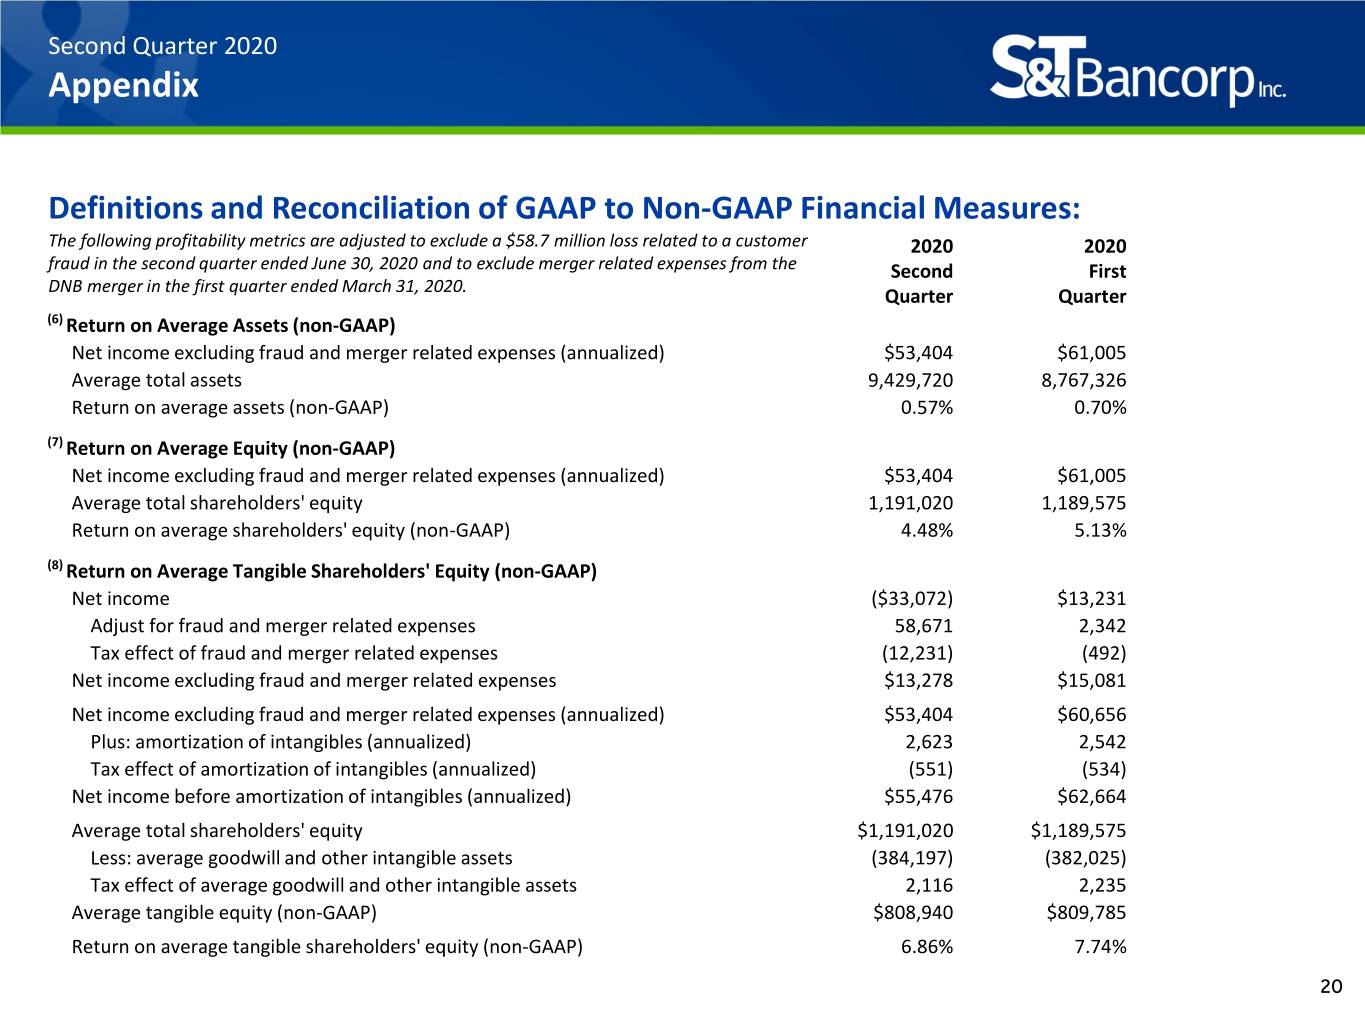
Second Quarter 2020 Appendix Definitions and Reconciliation of GAAP to Non-GAAP Financial Measures: The following profitability metrics are adjusted to exclude a $58.7 million loss related to a customer 2020 2020 fraud in the second quarter ended June 30, 2020 and to exclude merger related expenses from the Second First DNB merger in the first quarter ended March 31, 2020. Quarter Quarter (6) Return on Average Assets (non-GAAP) Net income excluding fraud and merger related expenses (annualized) $53,404 $61,005 Average total assets 9,429,720 8,767,326 Return on average assets (non-GAAP) 0.57% 0.70% (7) Return on Average Equity (non-GAAP) Net income excluding fraud and merger related expenses (annualized) $53,404 $61,005 Average total shareholders' equity 1,191,020 1,189,575 Return on average shareholders' equity (non-GAAP) 4.48% 5.13% (8) Return on Average Tangible Shareholders' Equity (non-GAAP) Net income ($33,072) $13,231 Adjust for fraud and merger related expenses 58,671 2,342 Tax effect of fraud and merger related expenses (12,231) (492) Net income excluding fraud and merger related expenses $13,278 $15,081 Net income excluding fraud and merger related expenses (annualized) $53,404 $60,656 Plus: amortization of intangibles (annualized) 2,623 2,542 Tax effect of amortization of intangibles (annualized) (551) (534) Net income before amortization of intangibles (annualized) $55,476 $62,664 Average total shareholders' equity $1,191,020 $1,189,575 Less: average goodwill and other intangible assets (384,197) (382,025) Tax effect of average goodwill and other intangible assets 2,116 2,235 Average tangible equity (non-GAAP) $808,940 $809,785 Return on average tangible shareholders' equity (non-GAAP) 6.86% 7.74% 20
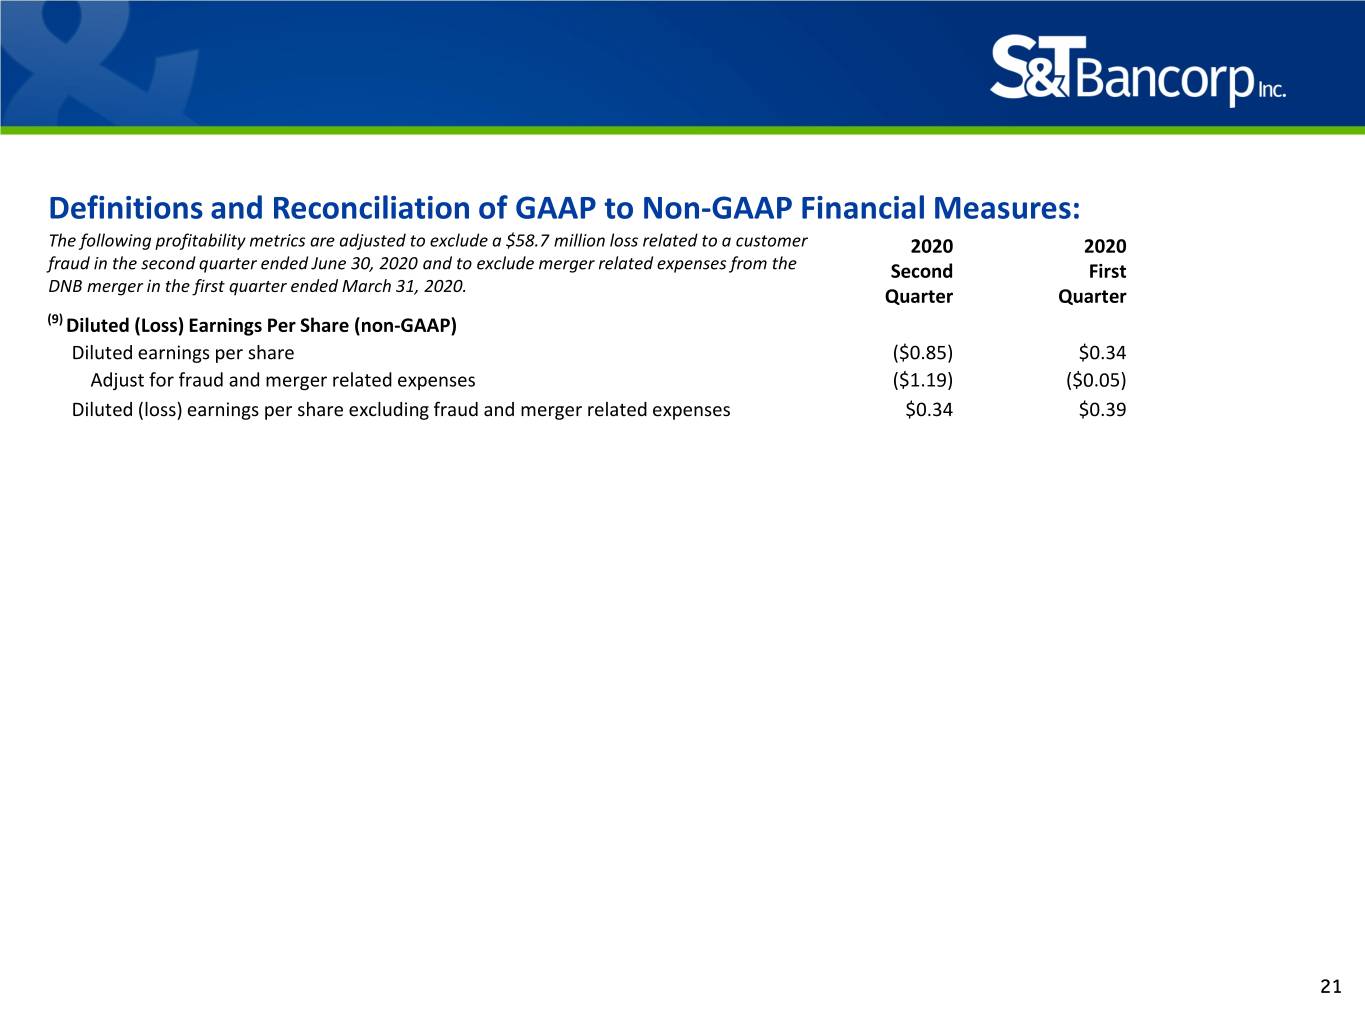
Definitions and Reconciliation of GAAP to Non-GAAP Financial Measures: The following profitability metrics are adjusted to exclude a $58.7 million loss related to a customer 2020 2020 fraud in the second quarter ended June 30, 2020 and to exclude merger related expenses from the Second First DNB merger in the first quarter ended March 31, 2020. Quarter Quarter (9) Diluted (Loss) Earnings Per Share (non-GAAP) Diluted earnings per share ($0.85) $0.34 Adjust for fraud and merger related expenses ($1.19) ($0.05) Diluted (loss) earnings per share excluding fraud and merger related expenses $0.34 $0.39 21
Second Quarter 2020 Earnings Supplement MEMBER FDIC
CONTACT: Mark Kochvar Chief Financial Officer 724.465.4826 800 Philadelphia Street Indiana, PA 15701 www.stbancorp.com |  | |||||||
FOR IMMEDIATE RELEASE
S&T Bancorp, Inc. Declares Dividend
Indiana, Pa. - July 28, 2020 - The Board of Directors of S&T Bancorp, Inc. (S&T) (NASDAQ: STBA), the holding company for S&T Bank, with operations in five markets including Western Pennsylvania, Eastern Pennsylvania, Northeast Ohio, Central Ohio, and Upstate New York, declared a $0.28 per share cash dividend at its regular meeting held July 27, 2020. This is an increase of 3.7 percent compared to a common stock dividend of $0.27 per share declared in the same period in the prior year. The annualized yield using the July 27, 2020 closing price of $22.93 is 4.9 percent. The dividend is payable August 27, 2020 to shareholders of record on August 13, 2020.
About S&T Bancorp, Inc. and S&T Bank
S&T Bancorp, Inc. is a $9.0 billion bank holding company that is headquartered in Indiana, Pennsylvania and trades on the NASDAQ Global Select Market under the symbol STBA. Its principal subsidiary, S&T Bank, was recently ranked #1 in customer satisfaction with retail banking in the Mid-Atlantic including best in communication and advice by J.D. Power. Established in 1902, S&T Bank operates in five markets including Western Pennsylvania, Eastern Pennsylvania, Northeast Ohio, Central Ohio, and Upstate New York. For more information visit stbancorp.com or stbank.com. Follow us on Facebook, Instagram, and LinkedIn.