
TBI 8-K
TrueBlue, Inc. (TBI)
8-K
2020-05-04
For: 2020-05-04
View Original
Added on
April 07, 2026
UNITED STATES
SECURITIES AND EXCHANGE COMMISSION
WASHINGTON, DC 20549
FORM 8-K
CURRENT REPORT
PURSUANT TO SECTION 13 OR 15(D) OF THE
SECURITIES EXCHANGE ACT OF 1934
Date of report (Date of earliest event reported): May 4, 2020

(Exact Name of Registrant as Specified in Its Charter)
(State or Other Jurisdiction
of Incorporation)
(Commission File Number) | (IRS Employer Identification No.) | |
(Address of principal executive offices) (Zip Code)
Registrant’s telephone number, including area code: (253 ) 383-9101
Not Applicable
(Former Name or Former Address, if Changed Since Last Report)
Check the appropriate box below if the Form 8-K filing is intended to simultaneously satisfy the filing obligation of the registrant under any of the following provisions (see General Instruction A.2. below):
Written communications pursuant to Rule 425 under the Securities Act (17 CFR 230.425) | |
Soliciting material pursuant to Rule 14a-12 under the Exchange Act (17 CFR 240.14a-12) | |
Pre-commencement communications pursuant to Rule 14d-2(b) under the Exchange Act (17 CFR 240.14d-2(b)) | |
Pre-commencement communications pursuant to Rule 13e-4(c) under the Exchange Act (17 CFR 240.13e-4(c)) | |
Securities registered pursuant to Section 12(b) of the Act:
Title of each class | Trading Symbol(s) | Name of each exchange on which registered |
Indicate by check mark whether the registrant is an emerging growth company as defined in as defined in Rule 405 of the Securities Act of 1933 (§230.405 of this chapter) or Rule 12b-2 of the Securities Exchange Act of 1934 (§240.12b-2 of this chapter).
Emerging growth company ☐
If an emerging growth company, indicate by check mark if the registrant has elected not to use the extended transition period for complying with any new or revised financial accounting standards provided pursuant to Section 13(a) of the Exchange Act. ☐
Item 2.02. | Results of Operations and Financial Condition. |
On May 4, 2020, TrueBlue, Inc. (the “company”) issued a press release (the “Press Release”) reporting its financial results for the first quarter ended March 29, 2020, a copy of which is attached hereto as Exhibit 99.1 and the contents of which are incorporated herein by this reference. Also attached to this report as Exhibit 99.2 is a slide presentation relating to the financial results for the first quarter ended March 29, 2020 (the “Earnings Results Presentation”), which will be discussed by management of the company on a live conference call at 2:00 p.m. Pacific Time (5:00 p.m. Eastern Time) on Monday, May 4, 2020. The Earnings Results Presentation is also available on the company’s website at www.trueblue.com.
In accordance with General Instruction B.2. of Form 8-K, the information contained above in this report (including the Press Release and the Earnings Results Presentation) shall not be deemed “Filed” for purposes of Section 18 of the Securities Exchange Act of 1934, as amended, or otherwise subject to the liabilities of that section, nor shall the Press Release or the Earnings Results Presentation be deemed incorporated by reference in any filing under the Securities Act of 1933, as amended, except as shall be expressly set forth by specific reference in such a filing. This report will not be deemed a determination or an admission as to the materiality of any information in the report that is required to be disclosed solely by Regulation FD.
Item 9.01. | Financial Statements and Exhibits. |
(d) | Exhibits |
Exhibit Number | Exhibit Description | Filed Herewith |
99.1 | X | |
99.2 | X | |
104 | Cover page interactive data file - The cover page from this Current Report on Form 8-K is formatted as Inline XBRL | X |
SIGNATURE
Pursuant to the requirements of the Securities Exchange Act of 1934, the registrant has duly caused this report to be signed on its behalf by the undersigned hereunto duly authorized.
TRUEBLUE, INC. | ||||
(Registrant) | ||||
Date: | May 4, 2020 | By: | /s/ Derrek L. Gafford | |
Derrek L. Gafford | ||||
Chief Financial Officer and Executive Vice President | ||||
TRUEBLUE REPORTS FIRST QUARTER 2020 RESULTS
TACOMA, WASH. - May 4, 2020 -- TrueBlue (NYSE:TBI) today announced its first quarter results for 2020.
First quarter revenue was $494 million, a decrease of 11 percent compared to revenue of $552 million in the first quarter of 2019. Net loss per diluted share was $4.04 compared to net income per diluted share of $0.21 in the first quarter of 2019. Adjusted net loss1 per diluted share was $0.01 compared to adjusted net income per diluted share of $0.27 in the first quarter of 2019.
Included in the results for the first quarter is a non-cash goodwill and intangible asset impairment charge of $175 million which is equivalent to $152 million after tax or $4.08 per diluted share. The impairment was driven by a weaker economic outlook in connection with the impact of the COVID-19 pandemic.
“We experienced improving revenue trends during January and February, which reversed course in March,” said Patrick Beharelle, CEO of TrueBlue. “The second half of March saw a significant drop in demand associated with government and societal actions to address the COVID-19 threat. In response, we have taken actions to reduce our operating expenses by approximately $100 million this year while preserving key strengths of our business, such as our branch footprint and technology innovation, to be prepared when business conditions improve.”
“We entered 2020 from a position of strength given our balance sheet that included only $37 million of debt and a similar amount of cash,” said Derrek Gafford, CFO of TrueBlue. “In March, we extended our existing $300 million revolving credit facility for five years and drew substantially all of the remaining availability to further enhance our liquidity position.”
“As a key provider of services to other essential businesses, we’re still very much open for business,” said Mr. Beharelle. “We are keenly focused on preserving capital and leveraging our digital app, JobStack, to facilitate safe interactions with our clients and associates. At times like these, TrueBlue’s underlying mission – connecting people with work – is even more crucial, and as a company we remain focused on helping the workers and clients we serve get back on their feet.”
2020 Outlook
The COVID-19 pandemic is creating a material impact on the demand for our services. Given the uncertainty of future societal and business restrictions, TrueBlue is not providing customary quarterly guidance. However, the company is providing an assortment of historical and forward-looking information to help investors form their own estimates, which can be found in the quarterly earnings presentation filed today.
Management will discuss first quarter 2020 results on a webcast at 2 p.m. PDT (5 p.m. EDT), today, Monday, May 4, 2020. The webcast can be accessed on TrueBlue’s website: www.trueblue.com.
About TrueBlue
TrueBlue (NYSE: TBI) is a leading provider of specialized workforce solutions that help clients achieve business growth and improve productivity. In 2019, TrueBlue connected approximately 724,000 people with work. Its PeopleReady segment offers on-demand, industrial staffing, PeopleManagement offers contingent, on-site industrial staffing and commercial driver services, and PeopleScout offers recruitment process outsourcing (RPO) and managed service provider (MSP) solutions to a wide variety of industries. Learn more at www.trueblue.com.
1 See the financial statements accompanying the release and the company’s website for more information on non-GAAP terms.
Forward-looking statements
This document contains forward-looking statements relating to our plans and expectations, all of which are subject to risks and uncertainties. Such statements are based on management’s expectations and assumptions as of the date of this release and involve many risks and uncertainties that could cause actual results to differ materially from those expressed or implied in our forward-looking statements including: (1) national and global economic conditions, (2) the continued impact of COVID-19 and related economic impact and governmental response, (3) our ability to successfully reduce operating expenses and otherwise adapt to the changing economic environment caused by COVID–19, (4) our ability to access sufficient capital to finance our operations, including our ability to comply with or obtain waivers for covenants contained in our revolving credit facility, (5) our ability to attract and retain clients, (6) our ability to attract sufficient qualified candidates and employees to meet the needs of our clients, (7) our ability to maintain profit margins, (8) new laws and regulations that could affect our operations or financial results, (9) our ability to successfully execute on business strategies to further digitize our business model, and (10) any reduction or change in tax credits we utilize, including the Work Opportunity Tax Credit. Other information regarding factors that could affect our results is included in our Securities Exchange Commission (SEC) filings, including the company’s most recent reports on Forms 10-K and 10-Q, copies of which may be obtained
by visiting our website at www.trueblue.com under the Investor Relations section or the SEC’s website at www.sec.gov. We assume no obligation to update or revise any forward-looking statement, whether as a result of new information, future events, or otherwise, except as required by law. Any other references to future financial estimates are included for informational purposes only and subject to risk factors discussed in our most recent filings with the SEC.
In addition, we use several non-GAAP financial measures when presenting our financial results in this document. Please refer to the reconciliations between our GAAP and non-GAAP financial measures in the appendix to this document and on our website at www.trueblue.com under the Investor Relations section for additional information on both current and historical periods. The presentation of these non-GAAP financial measures is used to enhance the understanding of certain aspects of our financial performance. It is not meant to be considered in isolation, superior to, or as a substitute for the directly comparable financial measures prepared in accordance with U.S. GAAP, and may not be comparable to similarly titled measures of other companies.
Contact:
Derrek Gafford, Executive Vice President and CFO
253-680-8214
TRUEBLUE, INC.
SUMMARY CONSOLIDATED STATEMENTS OF OPERATIONS
(Unaudited)
13 Weeks Ended | |||||||
(in thousands, except per share data) | Mar 29, 2020 | Mar 31, 2019 | |||||
Revenue from services | $ | 494,252 | $ | 552,352 | |||
Cost of services | 368,093 | 405,657 | |||||
Gross profit | 126,159 | 146,695 | |||||
Selling, general and administrative expense | 117,381 | 127,980 | |||||
Depreciation and amortization | 9,094 | 9,952 | |||||
Goodwill and intangible asset impairment charge | 175,189 | — | |||||
Income (loss) from operations | (175,505 | ) | 8,763 | ||||
Interest and other income (expense), net | 263 | 553 | |||||
Income (loss) before tax expense (benefit) | (175,242 | ) | 9,316 | ||||
Income tax expense (benefit) | (24,748 | ) | 1,040 | ||||
Net income (loss) | $ | (150,494 | ) | $ | 8,276 | ||
Net income (loss) per common share: | |||||||
Basic | $ | (4.04 | ) | $ | 0.21 | ||
Diluted | $ | (4.04 | ) | $ | 0.21 | ||
Weighted average shares outstanding: | |||||||
Basic | 37,255 | 39,366 | |||||
Diluted | 37,255 | 39,735 | |||||
TRUEBLUE, INC.
SUMMARY CONSOLIDATED BALANCE SHEETS
(Unaudited)
(in thousands) | Mar 29, 2020 | Dec 29, 2019 | |||||
ASSETS | |||||||
Cash and cash equivalents | $ | 265,260 | $ | 37,608 | |||
Accounts receivable, net | 292,988 | 342,303 | |||||
Other current assets | 35,156 | 41,822 | |||||
Total current assets | 593,404 | 421,733 | |||||
Property and equipment, net | 67,036 | 66,150 | |||||
Restricted cash and investments | 218,907 | 230,932 | |||||
Goodwill and intangible assets, net | 127,920 | 311,171 | |||||
Other assets, net | 127,878 | 106,169 | |||||
Total assets | $ | 1,135,145 | $ | 1,136,155 | |||
LIABILITIES AND SHAREHOLDERS’ EQUITY | |||||||
Current liabilities | $ | 187,049 | $ | 230,806 | |||
Long-term debt | 293,500 | 37,100 | |||||
Other long-term liabilities | 238,654 | 242,276 | |||||
Total liabilities | 719,203 | 510,182 | |||||
Shareholders’ equity | 415,942 | 625,973 | |||||
Total liabilities and shareholders’ equity | $ | 1,135,145 | $ | 1,136,155 | |||
TRUEBLUE, INC.
CONSOLIDATED STATEMENTS OF CASH FLOWS
(Unaudited)
13 Weeks Ended | |||||||
(in thousands) | Mar 29, 2020 | Mar 31, 2019 | |||||
Cash flows from operating activities: | |||||||
Net income (loss) | $ | (150,494 | ) | $ | 8,276 | ||
Adjustments to reconcile net income (loss) to net cash provided by operating activities: | |||||||
Depreciation and amortization | 9,094 | 9,952 | |||||
Goodwill and intangible asset impairment charge | 175,189 | — | |||||
Provision for doubtful accounts | 3,289 | 1,778 | |||||
Stock-based compensation | 1,508 | 3,606 | |||||
Deferred income taxes | (23,432 | ) | 3,209 | ||||
Non-cash lease expense | 3,763 | 3,565 | |||||
Other operating activities | 5,375 | (1,841 | ) | ||||
Changes in operating assets and liabilities: | |||||||
Accounts receivable | 45,407 | 26,558 | |||||
Income tax receivable | 435 | (3,645 | ) | ||||
Other assets | 5,958 | (5,274 | ) | ||||
Accounts payable and other accrued expenses | (28,443 | ) | (9,878 | ) | |||
Accrued wages and benefits | (11,733 | ) | (10,266 | ) | |||
Workers’ compensation claims reserve | (2,163 | ) | (4,380 | ) | |||
Operating lease liabilities | (3,811 | ) | (3,414 | ) | |||
Other liabilities | (2,334 | ) | 3,268 | ||||
Net cash provided by operating activities | 27,608 | 21,514 | |||||
Cash flows from investing activities: | |||||||
Capital expenditures | (7,028 | ) | (5,862 | ) | |||
Purchases of restricted available-for-sale investments | (1,149 | ) | (3,070 | ) | |||
Sales of restricted available-for-sale investments | 1,269 | 1,886 | |||||
Maturities of restricted held-to-maturity investments | 6,168 | 8,451 | |||||
Net cash provided by (used in) investing activities | (740 | ) | 1,405 | ||||
Cash flows from financing activities: | |||||||
Purchases and retirement of common stock | (52,348 | ) | (5,303 | ) | |||
Net proceeds from employee stock purchase plans | 323 | 380 | |||||
Common stock repurchases for taxes upon vesting of restricted stock | (1,792 | ) | (1,438 | ) | |||
Net change in Revolving Credit Facility | 256,400 | (37,800 | ) | ||||
Other | (508 | ) | (69 | ) | |||
Net cash provided by (used in) financing activities | 202,075 | (44,230 | ) | ||||
Effect of exchange rate changes on cash, cash equivalents and restricted cash | (1,738 | ) | 314 | ||||
Net change in cash, cash equivalents, and restricted cash | 227,205 | (20,997 | ) | ||||
Cash, cash equivalents and restricted cash, beginning of period | 92,371 | 102,450 | |||||
Cash, cash equivalents and restricted cash, end of period | $ | 319,576 | $ | 81,453 | |||
TRUEBLUE, INC.
SEGMENT DATA
(Unaudited)
13 Weeks Ended | |||||||
(in thousands) | Mar 29, 2020 | Mar 31, 2019 | |||||
Revenue from services: | |||||||
PeopleReady | $ | 299,294 | $ | 326,868 | |||
PeopleManagement | 141,614 | 158,044 | |||||
PeopleScout | 53,344 | 67,440 | |||||
Total company | $ | 494,252 | $ | 552,352 | |||
Segment profit (loss) (1): | |||||||
PeopleReady | $ | 7,655 | $ | 11,470 | |||
PeopleManagement | (314 | ) | 2,306 | ||||
PeopleScout | 2,508 | 10,427 | |||||
9,849 | 24,203 | ||||||
Corporate unallocated expense | (5,209 | ) | (7,277 | ) | |||
Total company Adjusted EBITDA (2) | 4,640 | 16,926 | |||||
Work Opportunity Tax Credit processing fees (3) | (135 | ) | (240 | ) | |||
Acquisition/integration costs (4) | — | (577 | ) | ||||
Goodwill and intangible asset impairment charge (5) | (175,189 | ) | — | ||||
Other adjustments (6) | 4,273 | 2,606 | |||||
EBITDA (2) | (166,411 | ) | 18,715 | ||||
Depreciation and amortization | (9,094 | ) | (9,952 | ) | |||
Interest and other income (expense), net | 263 | 553 | |||||
Income (loss) before tax expense (benefit) | (175,242 | ) | 9,316 | ||||
Income tax expense (benefit) | 24,748 | (1,040 | ) | ||||
Net income (loss) | $ | (150,494 | ) | $ | 8,276 | ||
(1) | We evaluate performance based on segment revenue and segment profit. Segment profit (loss) includes revenue, related cost of services, and ongoing operating expenses directly attributable to the reportable segment. Segment profit (loss) excludes goodwill and intangible impairment charges, depreciation and amortization expense, unallocated corporate general and administrative expense, interest, other income and expense, income taxes, and other adjustments not considered to be ongoing. |
(2) | See the Non-GAAP Financial Measures table on the next page for definitions of EBITDA and Adjusted EBITDA. |
(3) | These third-party processing fees are associated with generating the Work Opportunity Tax Credits, which are designed to encourage employers to hire workers from certain targeted groups with higher than average unemployment rates. |
(4) | Acquisition/integration costs relate to the acquisition of TMP Holdings LTD completed on June 12, 2018. |
(5) | The goodwill and intangible asset impairment charge for the 13 weeks ended March 29, 2020 relates to our PeopleManagement and PeopleScout reportable segments. |
(6) | Other adjustments for the periods presented primarily include implementation costs for cloud-based systems and amortization of software as a service assets, which is reported in selling, general and administrative expense. Other adjustments for the 13 weeks ended March 29, 2020, also include $1.3 million in workforce reduction costs. These other cost adjustments were offset by a $6.3 million benefit from a reduction in expected costs to comply with the Affordable Care Act, which were recorded in prior fiscal years. For the 13 weeks ended March 31, 2019, the aforementioned other costs were partially offset by $3.9 million of workers’ compensation benefit related to additional insurance coverage associated with former workers’ compensation carriers that are in liquidation. |
TRUEBLUE, INC.
NON-GAAP FINANCIAL MEASURES AND NON-GAAP RECONCILIATIONS
In addition to financial measures presented in accordance with U.S. GAAP, we monitor certain non-GAAP key financial measures. The presentation of these non-GAAP financial measures is used to enhance the understanding of certain aspects of our financial performance. It is not meant to be considered in isolation, superior to, or as a substitute for the directly comparable financial measures prepared in accordance with U.S. GAAP, and may not be comparable to similarly titled measures of other companies.
Non-GAAP Measure | Definition | Purpose of Adjusted Measures | |
EBITDA and Adjusted EBITDA | EBITDA excludes from net income: - interest and other income (expense), net, - income taxes, and - depreciation and amortization. Adjusted EBITDA, further excludes: - Work Opportunity Tax Credit third-party processing fees, - acquisition/integration costs, - goodwill and intangible asset impairment charge, and - other adjustments. | - Enhances comparability on a consistent basis and provides investors with useful insight into the underlying trends of the business. - Used by management to assess performance and effectiveness of our business strategies. - Provides a measure, among others, used in the determination of incentive compensation for management. | |
Adjusted net income (loss) and Adjusted net income (loss) per diluted share | Net income (loss) and net income (loss) per diluted share, excluding: - amortization of intangibles of acquired businesses, - acquisition/integration costs, - goodwill and intangible asset impairment charge, - other adjustments, - tax effect of each adjustment to U.S. GAAP net income (loss), and - adjust income taxes to our normalized long-term expected tax rate. | - Enhances comparability on a consistent basis and provides investors with useful insight into the underlying trends of the business. - Used by management to assess performance and effectiveness of our business strategies. | |
1. | RECONCILIATION OF U.S. GAAP NET INCOME (LOSS) TO ADJUSTED NET INCOME (LOSS) AND ADJUSTED NET INCOME (LOSS) PER DILUTED SHARE |
(Unaudited)
13 Weeks Ended | |||||||
(in thousands, except for per share data) | Mar 29, 2020 | Mar 31, 2019 | |||||
Net income (loss) | $ | (150,494 | ) | $ | 8,276 | ||
Amortization of intangible assets of acquired businesses (1) | 4,004 | 5,081 | |||||
Acquisition/integration costs (2) | — | 577 | |||||
Goodwill and intangible asset impairment charge (3) | 175,189 | — | |||||
Other adjustments (4) | (4,273 | ) | (2,606 | ) | |||
Tax effect of adjustments to net income (loss) (5) | (20,990 | ) | (427 | ) | |||
Adjustment of income taxes to normalized effective rate (6) | (3,719 | ) | (264 | ) | |||
Adjusted net income (loss) | $ | (283 | ) | $ | 10,637 | ||
Adjusted net income (loss) per diluted share | $ | (0.01 | ) | $ | 0.27 | ||
Diluted weighted average shares outstanding | 37,255 | 39,735 | |||||
2. | RECONCILIATION OF U.S. GAAP NET INCOME (LOSS) TO EBITDA AND ADJUSTED EBITDA |
(Unaudited)
13 Weeks Ended | |||||||
(in thousands) | Mar 29, 2020 | Mar 31, 2019 | |||||
Net income (loss) | $ | (150,494 | ) | $ | 8,276 | ||
Income tax expense | (24,748 | ) | 1,040 | ||||
Interest and other (income) expense, net | (263 | ) | (553 | ) | |||
Depreciation and amortization | 9,094 | 9,952 | |||||
EBITDA | (166,411 | ) | 18,715 | ||||
Work Opportunity Tax Credit processing fees (7) | 135 | 240 | |||||
Acquisition/integration costs (2) | — | 577 | |||||
Goodwill and intangible asset impairment charge (3) | 175,189 | — | |||||
Other adjustments (4) | (4,273 | ) | (2,606 | ) | |||
Adjusted EBITDA | $ | 4,640 | $ | 16,926 | |||
(1) | Amortization of intangible assets of acquired businesses. |
(2) | Acquisition/integration costs for the acquisition of TMP Holding LTD completed on June 12, 2018. |
(3) | The goodwill and intangible asset impairment charge for the 13 weeks ended March 29, 2020 relates to our PeopleManagement and PeopleScout reportable segments. |
(4) | Other adjustments for the periods presented primarily include implementation costs for cloud-based systems and amortization of software as a service assets, which is reported in selling, general and administrative expense. Other adjustments for the 13 weeks ended March 29, 2020, also include $1.3 million in workforce reduction costs. These other cost adjustments were offset by a $6.3 million benefit from a reduction in expected costs to comply with the Affordable Care Act, which were recorded in prior fiscal years. For the 13 weeks ended March 31, 2019, the aforementioned other costs were partially offset by $3.9 million of workers’ compensation benefit related to additional insurance coverage associated with former workers’ compensation carriers that are in liquidation. |
(5) | Total tax effect of each of the adjustments to U.S. GAAP net income using the expected, long-term ongoing rate of 12 percent relative to14 percent for 2019. |
(6) | Adjustment of the effective income tax rate to the expected long-term ongoing rate of 12 percent relative to 14 percent for 2019. |
(7) | These third-party processing fees are associated with generating the Work Opportunity Tax Credits, which are designed to encourage employers to hire workers from certain targeted groups with higher than average unemployment rates. |

Q1 2020 Earnings May 2020
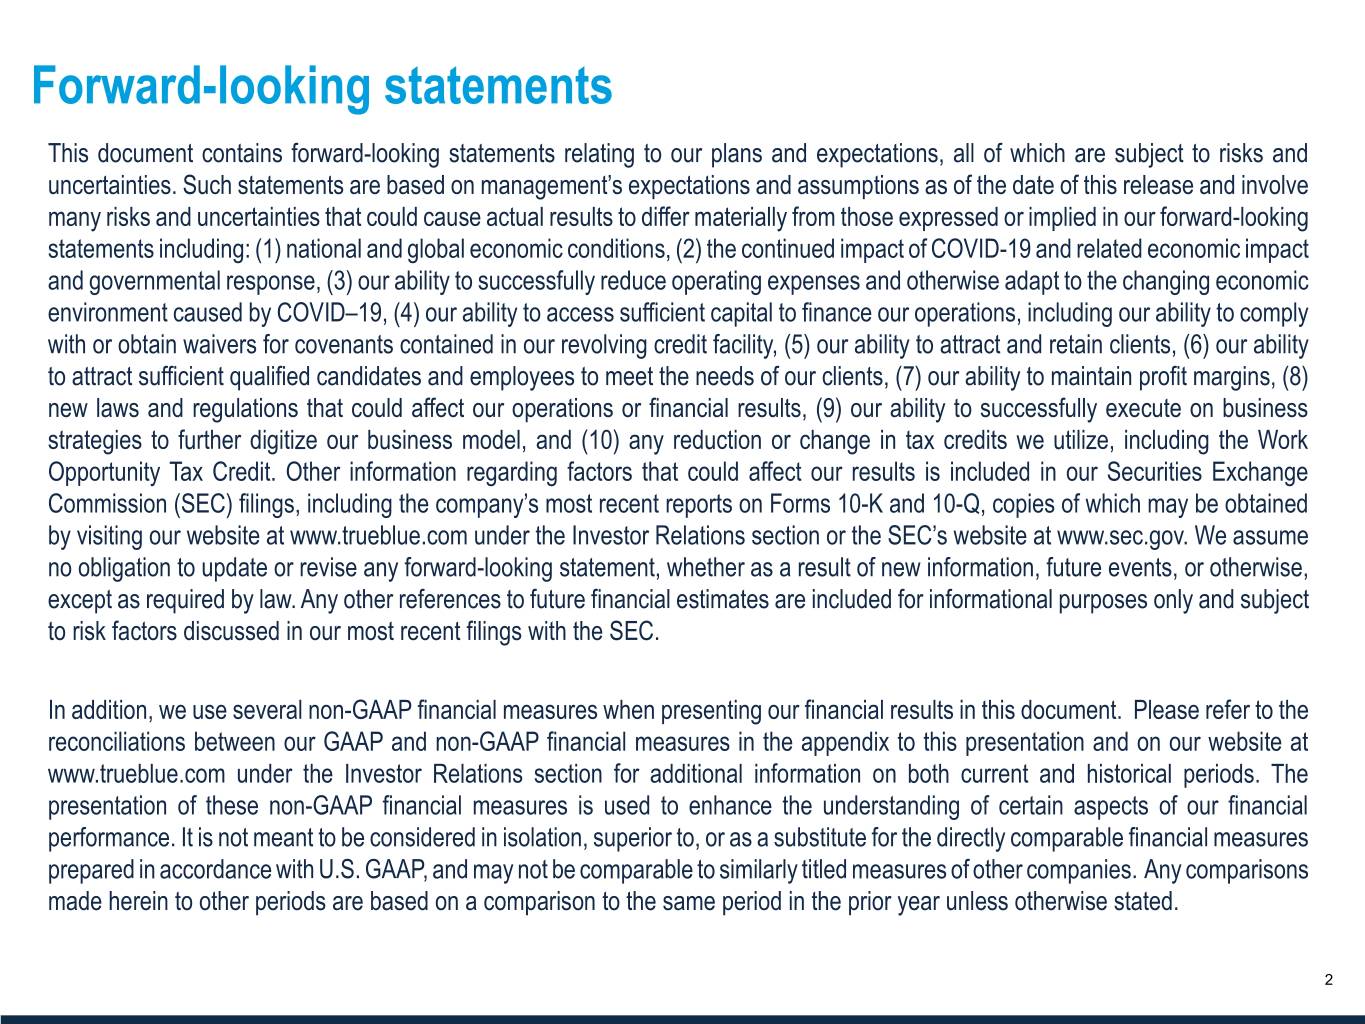
Forward-looking statements This document contains forward-looking statements relating to our plans and expectations, all of which are subject to risks and uncertainties. Such statements are based on management’s expectations and assumptions as of the date of this release and involve many risks and uncertainties that could cause actual results to differ materially from those expressed or implied in our forward-looking statements including: (1) national and global economic conditions, (2) the continued impact of COVID-19 and related economic impact and governmental response, (3) our ability to successfully reduce operating expenses and otherwise adapt to the changing economic environment caused by COVID–19, (4) our ability to access sufficient capital to finance our operations, including our ability to comply with or obtain waivers for covenants contained in our revolving credit facility, (5) our ability to attract and retain clients, (6) our ability to attract sufficient qualified candidates and employees to meet the needs of our clients, (7) our ability to maintain profit margins, (8) new laws and regulations that could affect our operations or financial results, (9) our ability to successfully execute on business strategies to further digitize our business model, and (10) any reduction or change in tax credits we utilize, including the Work Opportunity Tax Credit. Other information regarding factors that could affect our results is included in our Securities Exchange Commission (SEC) filings, including the company’s most recent reports on Forms 10-K and 10-Q, copies of which may be obtained by visiting our website at www.trueblue.com under the Investor Relations section or the SEC’s website at www.sec.gov. We assume no obligation to update or revise any forward-looking statement, whether as a result of new information, future events, or otherwise, except as required by law. Any other references to future financial estimates are included for informational purposes only and subject to risk factors discussed in our most recent filings with the SEC. In addition, we use several non-GAAP financial measures when presenting our financial results in this document. Please refer to the reconciliations between our GAAP and non-GAAP financial measures in the appendix to this presentation and on our website at www.trueblue.com under the Investor Relations section for additional information on both current and historical periods. The presentation of these non-GAAP financial measures is used to enhance the understanding of certain aspects of our financial performance. It is not meant to be considered in isolation, superior to, or as a substitute for the directly comparable financial measures prepared in accordance with U.S. GAAP, and may not be comparable to similarly titled measures of other companies. Any comparisons made herein to other periods are based on a comparison to the same period in the prior year unless otherwise stated. www.TrueBlue.com 2
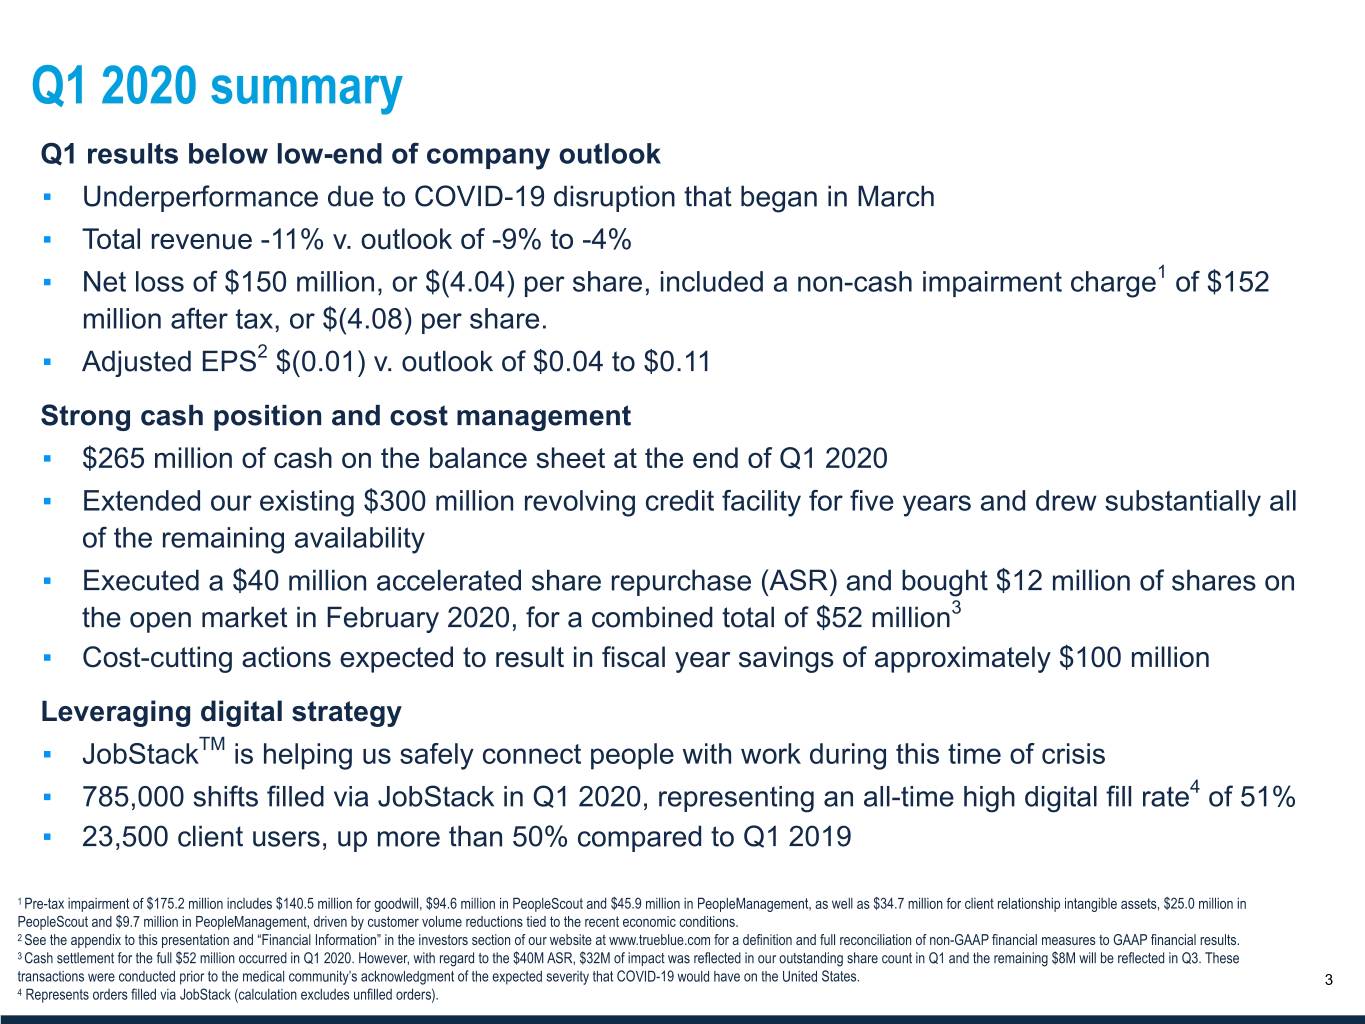
Q1 2020 summary Q1 results below low-end of company outlook ▪ Underperformance due to COVID-19 disruption that began in March ▪ Total revenue -11% v. outlook of -9% to -4% ▪ Net loss of $150 million, or $(4.04) per share, included a non-cash impairment charge1 of $152 million after tax, or $(4.08) per share. ▪ Adjusted EPS2 $(0.01) v. outlook of $0.04 to $0.11 Strong cash position and cost management ▪ $265 million of cash on the balance sheet at the end of Q1 2020 ▪ Extended our existing $300 million revolving credit facility for five years and drew substantially all of the remaining availability ▪ Executed a $40 million accelerated share repurchase (ASR) and bought $12 million of shares on the open market in February 2020, for a combined total of $52 million3 ▪ Cost-cutting actions expected to result in fiscal year savings of approximately $100 million Leveraging digital strategy ▪ JobStackTM is helping us safely connect people with work during this time of crisis ▪ 785,000 shifts filled via JobStack in Q1 2020, representing an all-time high digital fill rate4 of 51% ▪ 23,500 client users, up more than 50% compared to Q1 2019 1 Pre-tax impairment of $175.2 million includes $140.5 million for goodwill, $94.6 million in PeopleScout and $45.9 million in PeopleManagement, as well as $34.7 million for client relationship intangible assets, $25.0 million in PeopleScout and $9.7 million in PeopleManagement, driven by customer volume reductions tied to the recent economic conditions. 2 See the appendix to this presentation and “Financial Information” in the investors section of our website at www.trueblue.com for a definition and full reconciliation of non-GAAP financial measures to GAAP financial results. 3 Cash settlement for the full $52 million occurred in Q1 2020. However, with regard to the $40M ASR, $32M of impact was reflected in our outstanding share count in Q1 and the remaining $8M will be reflected in Q3. These transactionswww.TrueBlue.com were conducted prior to the medical community’s acknowledgment of the expected severity that COVID-19 would have on the United States. 3 4 Represents orders filled via JobStack (calculation excludes unfilled orders).
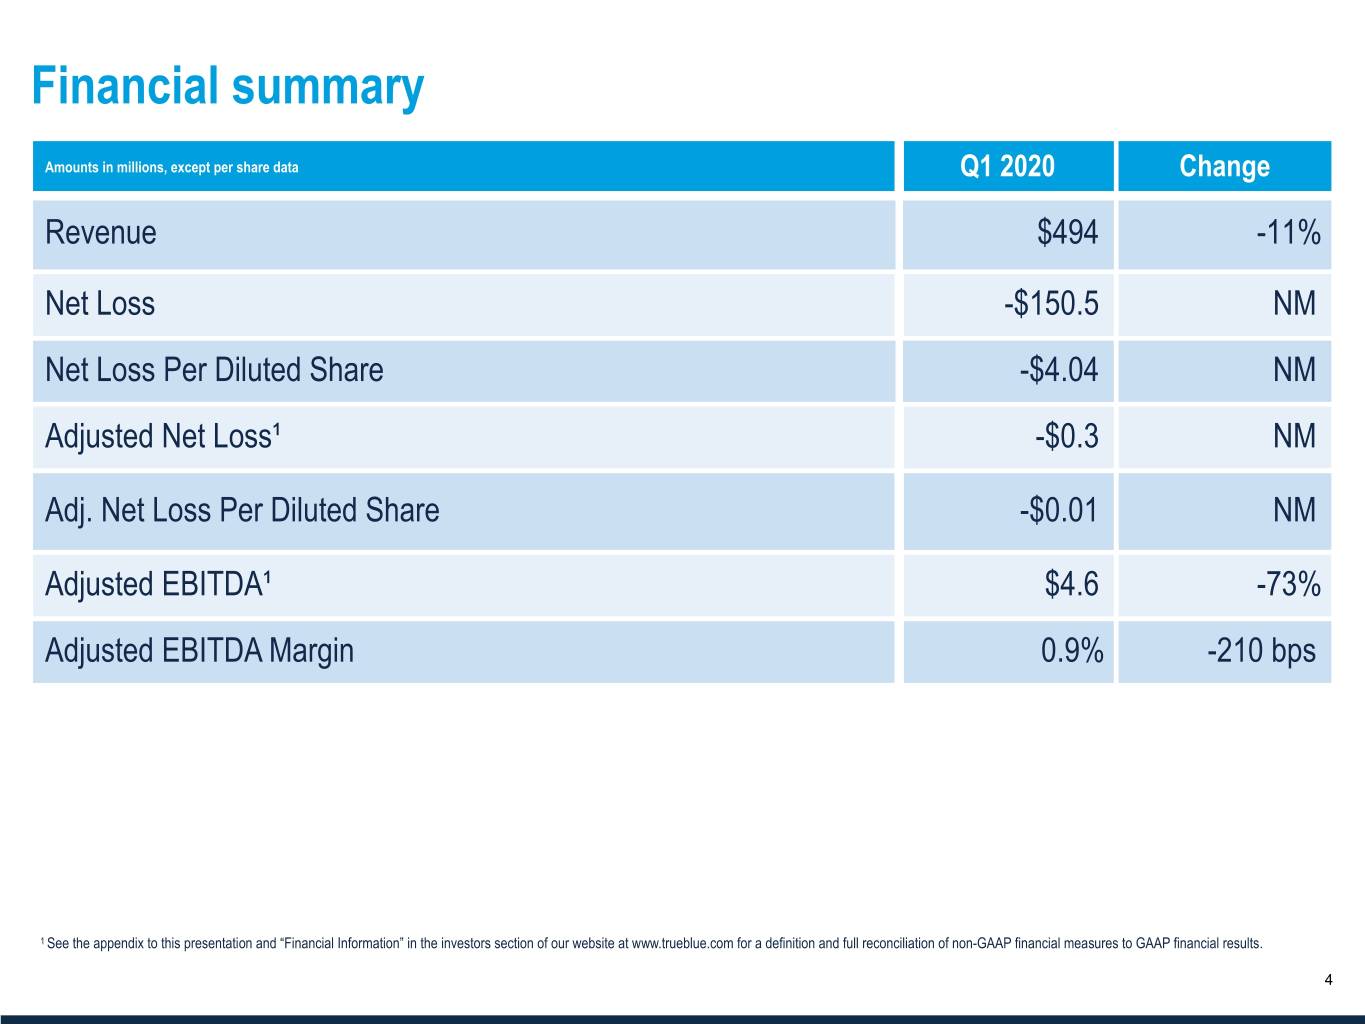
Financial summary Amounts in millions, except per share data Q1 2020 Change Revenue $494 -11% Net Loss -$150.5 NM Net Loss Per Diluted Share -$4.04 NM Adjusted Net Loss¹ -$0.3 NM Adj. Net Loss Per Diluted Share -$0.01 NM Adjusted EBITDA¹ $4.6 -73% Adjusted EBITDA Margin 0.9% -210 bps 1 See the appendix to this presentation and “Financial Information” in the investors section of our website at www.trueblue.com for a definition and full reconciliation of non-GAAP financial measures to GAAP financial results. www.TrueBlue.com 4
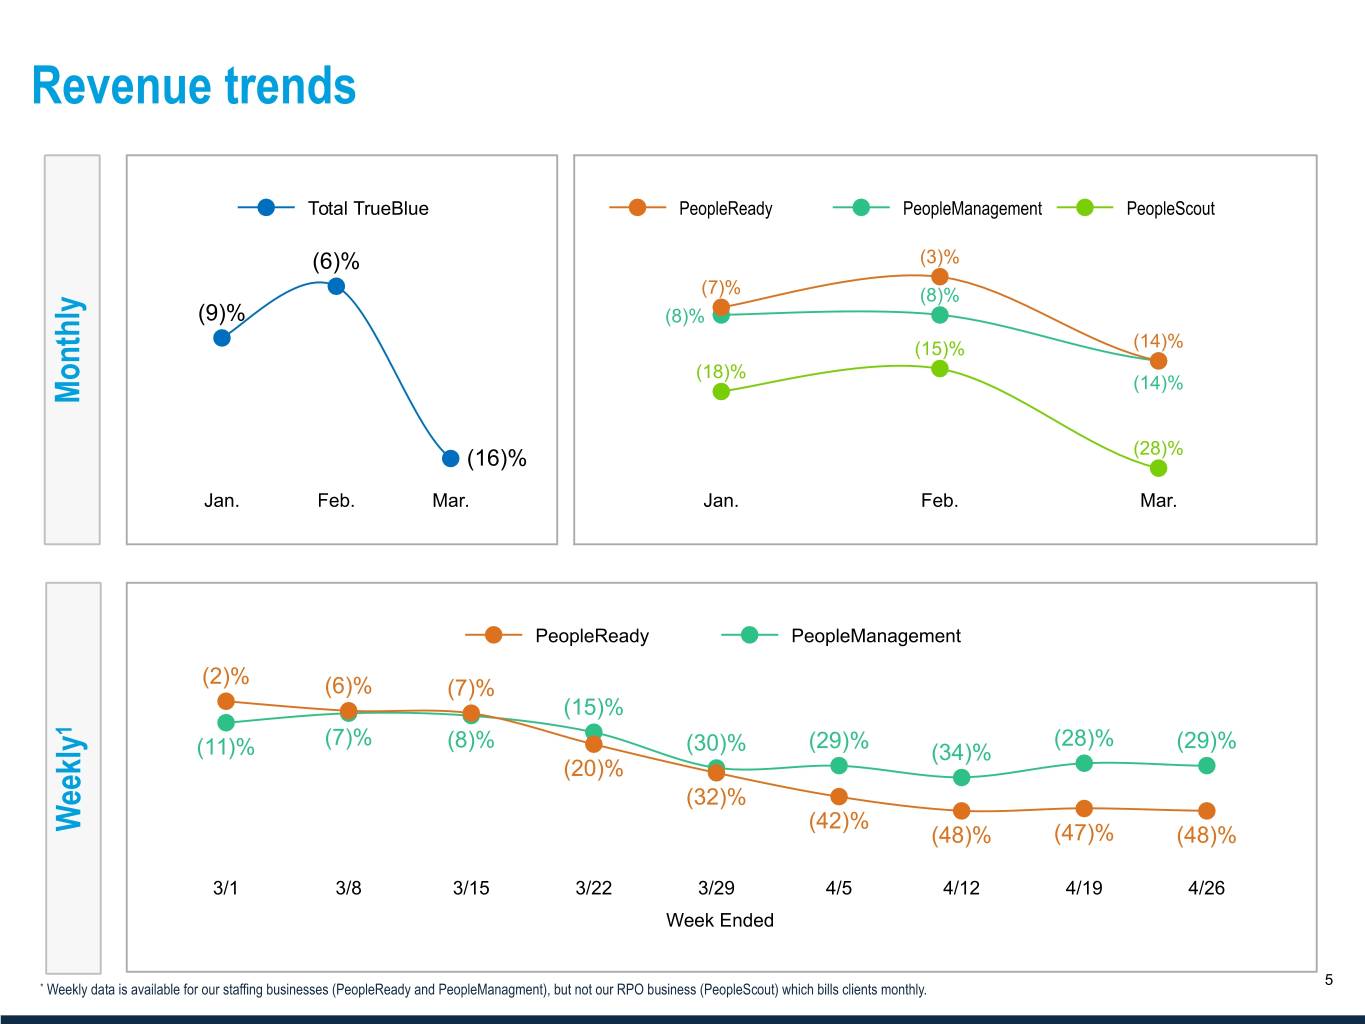
Revenue trends Total TrueBlue PeopleReady PeopleManagement PeopleScout (6)% (3)% (7)% (8)% (9)% (8)% (15)% (14)% (18)% (14)% Monthly (16)% (28)% Jan. Feb. Mar. Jan. Feb. Mar. PeopleReady PeopleManagement (2)% (6)% (7)% (15)% 1 (7)% (8)% (29)% (28)% (29)% (11)% (30)% (34)% (20)% (32)% Weekly (42)% (48)% (47)% (48)% 3/1 3/8 3/15 3/22 3/29 4/5 4/12 4/19 4/26 Week Ended www.TrueBlue.com 5 * Weekly data is available for our staffing businesses (PeopleReady and PeopleManagment), but not our RPO business (PeopleScout) which bills clients monthly.
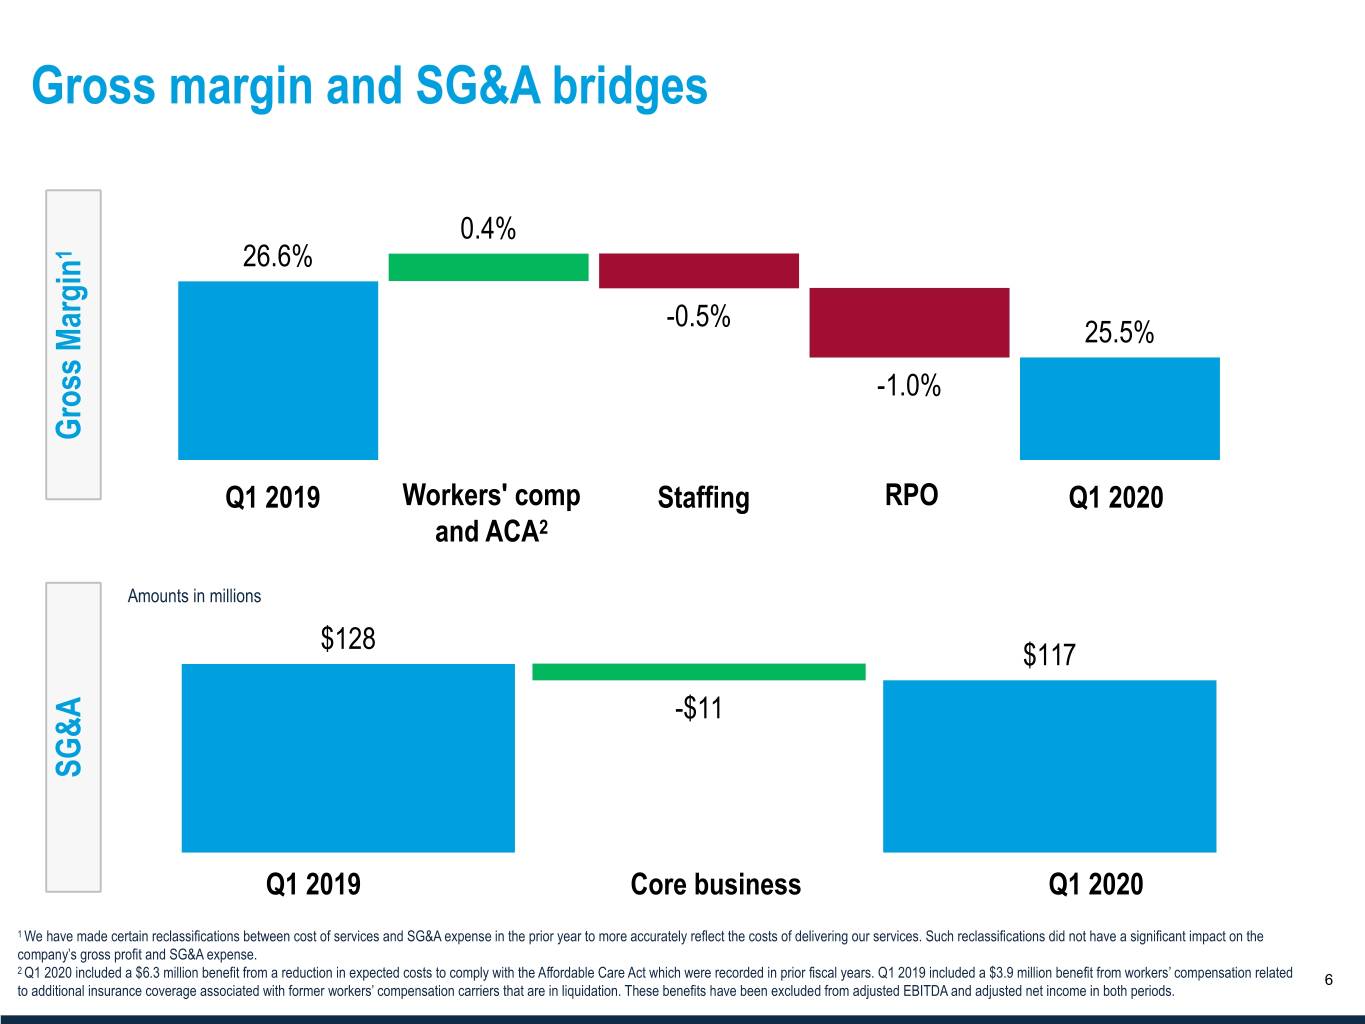
Gross margin and SG&A bridges 0.4% 1 26.6% -0.5% 25.5% -1.0% Gross Margin Q1 2019 Workers' comp Staffing RPO Q1 2020 and ACA2 Amounts in millions $128 $117 -$11 SG&A Q1 2019 Core business Q1 2020 1 We have made certain reclassifications between cost of services and SG&A expense in the prior year to more accurately reflect the costs of delivering our services. Such reclassifications did not have a significant impact on the company’s gross profit and SG&A expense. 2 Q1www.TrueBlue.com 2020 included a $6.3 million benefit from a reduction in expected costs to comply with the Affordable Care Act which were recorded in prior fiscal years. Q1 2019 included a $3.9 million benefit from workers’ compensation related 6 to additional insurance coverage associated with former workers’ compensation carriers that are in liquidation. These benefits have been excluded from adjusted EBITDA and adjusted net income in both periods.
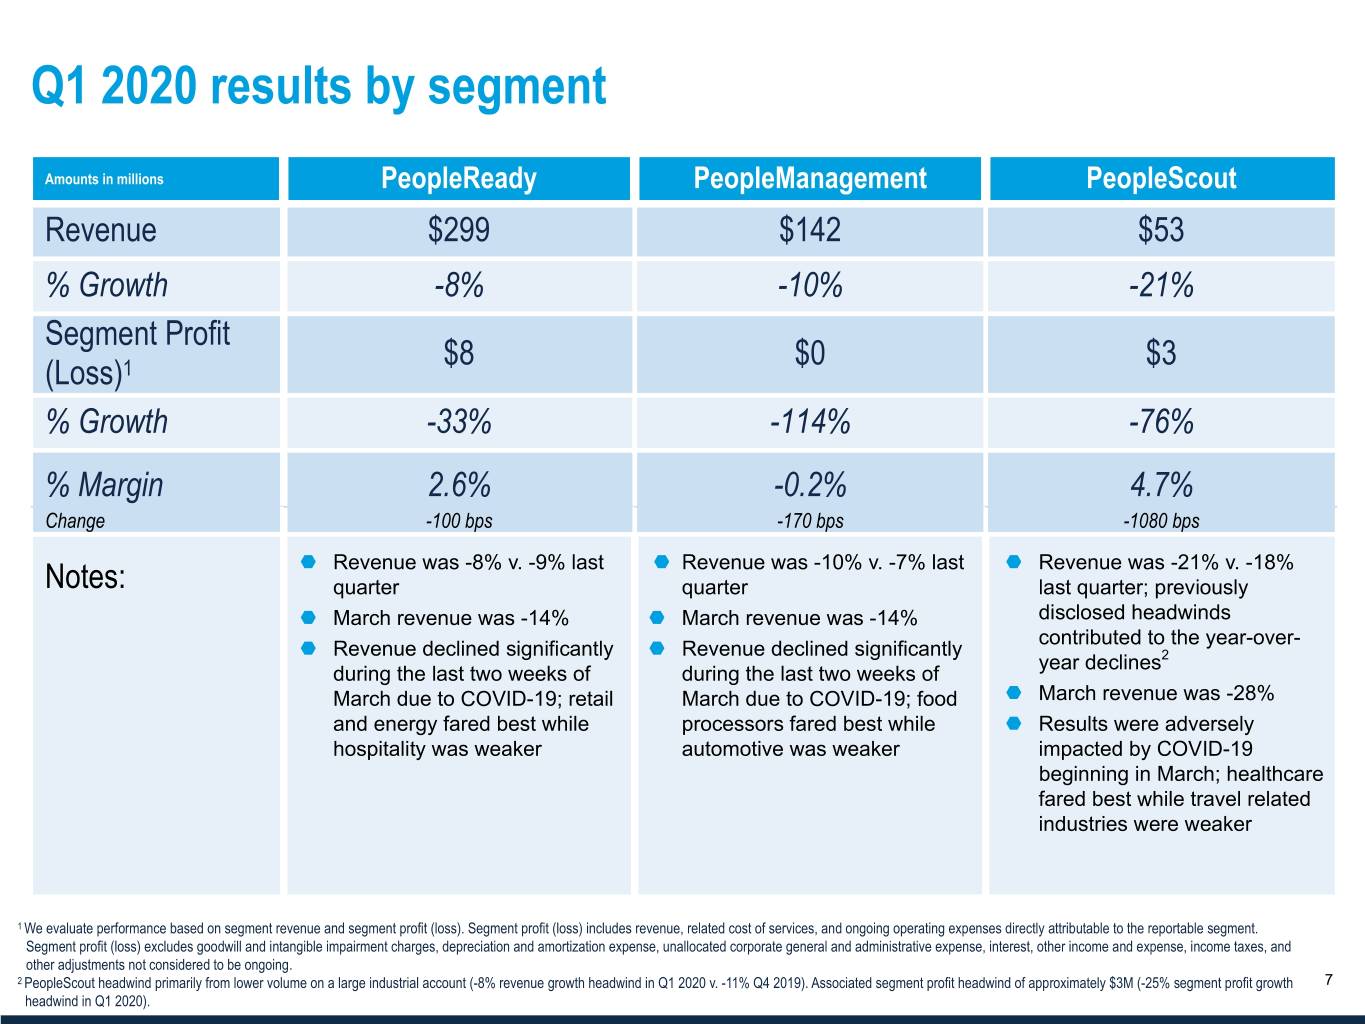
Q1 2020 results by segment Amounts in millions PeopleReady PeopleManagement PeopleScout Revenue $299 $142 $53 % Growth -8% -10% -21% Segment Profit $8 $0 $3 (Loss)1 % Growth -33% -114% -76% % Margin 2.6% -0.2% 4.7% Change -100 bps -170 bps -1080 bps ¬ Revenue was -8% v. -9% last ¬ Revenue was -10% v. -7% last ¬ Revenue was -21% v. -18% Notes: quarter quarter last quarter; previously ¬ March revenue was -14% ¬ March revenue was -14% disclosed headwinds contributed to the year-over- ¬ Revenue declined significantly ¬ Revenue declined significantly year declines2 during the last two weeks of during the last two weeks of ¬ March due to COVID-19; retail March due to COVID-19; food March revenue was -28% and energy fared best while processors fared best while ¬ Results were adversely hospitality was weaker automotive was weaker impacted by COVID-19 beginning in March; healthcare fared best while travel related industries were weaker 1 We evaluate performance based on segment revenue and segment profit (loss). Segment profit (loss) includes revenue, related cost of services, and ongoing operating expenses directly attributable to the reportable segment. Segment profit (loss) excludes goodwill and intangible impairment charges, depreciation and amortization expense, unallocated corporate general and administrative expense, interest, other income and expense, income taxes, and other adjustments not considered to be ongoing. 2 PeopleScoutwww.TrueBlue.com headwind primarily from lower volume on a large industrial account (-8% revenue growth headwind in Q1 2020 v. -11% Q4 2019). Associated segment profit headwind of approximately $3M (-25% segment profit growth 7 headwind in Q1 2020).
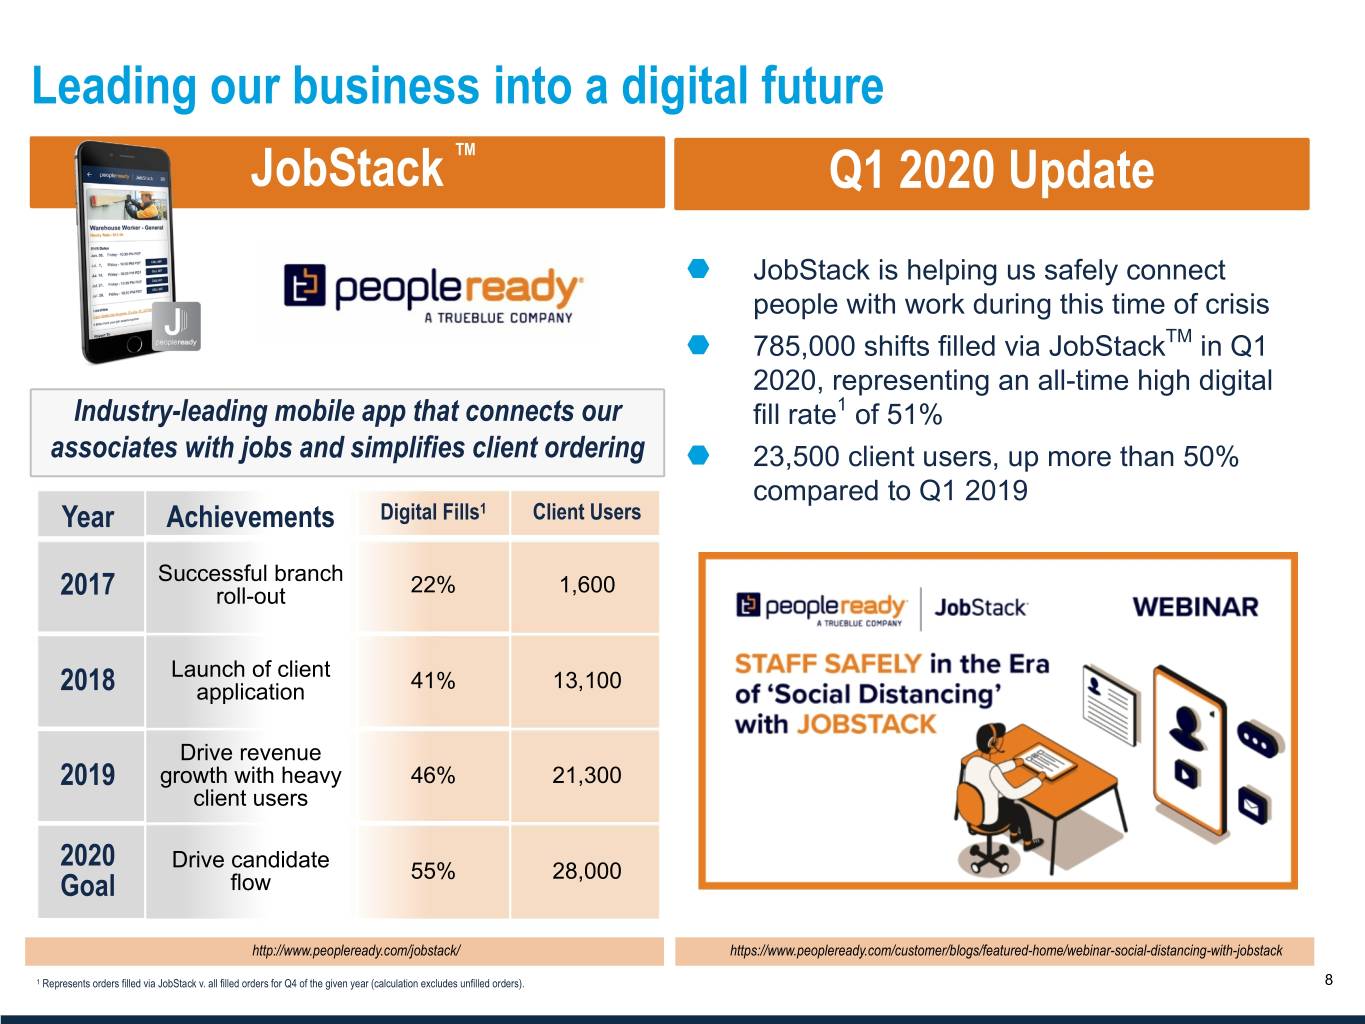
Leading our business into a digital future JobStack TM Q1 2020 Update ¬ JobStack is helping us safely connect people with work during this time of crisis ¬ 785,000 shifts filled via JobStackTM in Q1 2020, representing an all-time high digital Industry-leading mobile app that connects our fill rate1 of 51% associates with jobs and simplifies client ordering ¬ 23,500 client users, up more than 50% compared to Q1 2019 Year Achievements Digital Fills1 Client Users Successful branch 2017 roll-out 22% 1,600 Launch of client 2018 application 41% 13,100 Drive revenue 2019 growth with heavy 46% 21,300 client users 2020 Drive candidate Goal flow 55% 28,000 http://www.peopleready.com/jobstack/ https://www.peopleready.com/customer/blogs/featured-home/webinar-social-distancing-with-jobstack www.TrueBlue.com1 Represents orders filled via JobStack v. all filled orders for Q4 of the given year (calculation excludes unfilled orders). 8
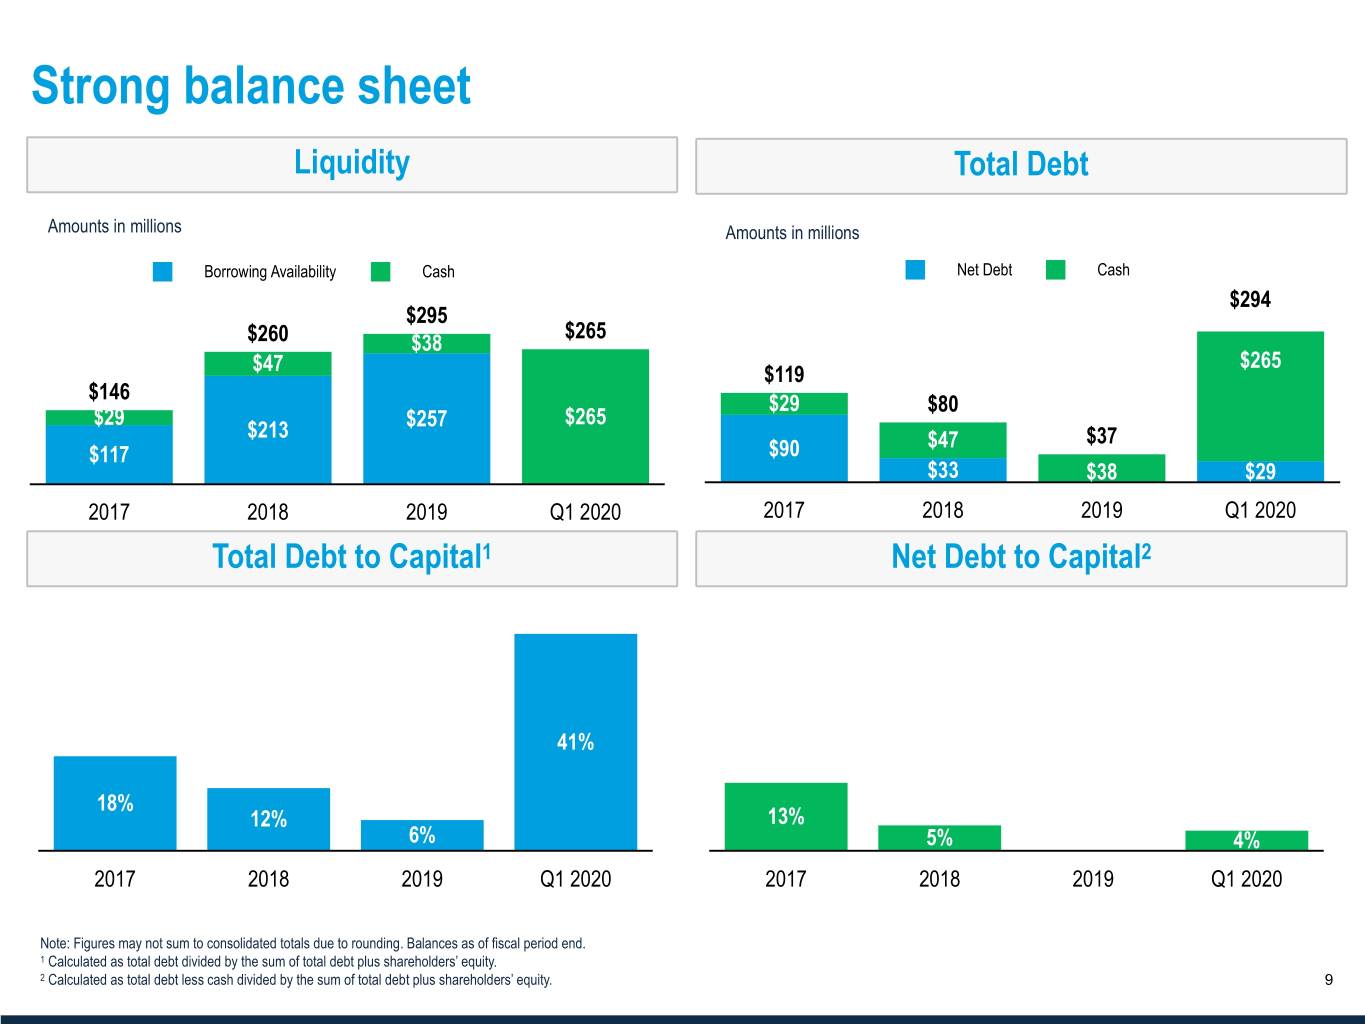
Strong balance sheet Liquidity Total Debt Amounts in millions Amounts in millions Borrowing Availability Cash Net Debt Cash $294 $295 $265 $260 $38 $265 $47 $119 $146 $29 $80 $29 $257 $265 $213 $47 $37 $117 $90 $33 $38 $29 2017 2018 2019 Q1 2020 2017 2018 2019 Q1 2020 Total Debt to Capital1 Net Debt to Capital2 41% 18% 12% 13% —% 6% 5% 4% 2017 2018 2019 Q1 2020 2017 2018 2019 Q1 2020 Note: Figures may not sum to consolidated totals due to rounding. Balances as of fiscal period end. 1 Calculated as total debt divided by the sum of total debt plus shareholders’ equity. www.TrueBlue.com2 Calculated as total debt less cash divided by the sum of total debt plus shareholders’ equity. 9
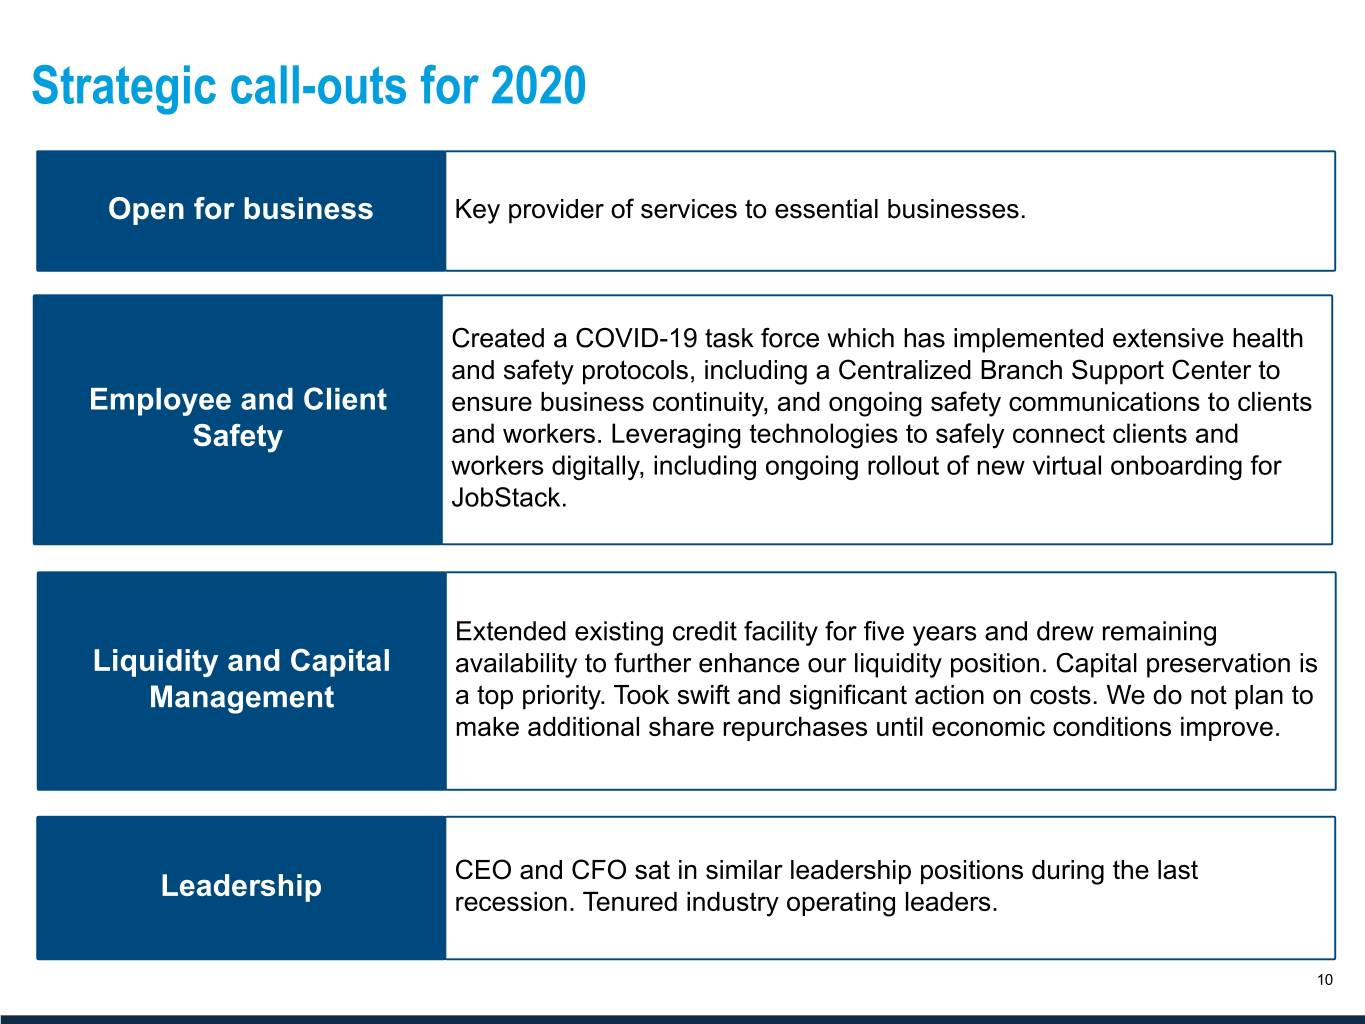
Strategic call-outs for 2020 Open for business Key provider of services to essential businesses. Created a COVID-19 task force which has implemented extensive health and safety protocols, including a Centralized Branch Support Center to Employee and Client ensure business continuity, and ongoing safety communications to clients Safety and workers. Leveraging technologies to safely connect clients and workers digitally, including ongoing rollout of new virtual onboarding for JobStack. Extended existing credit facility for five years and drew remaining Liquidity and Capital availability to further enhance our liquidity position. Capital preservation is Management a top priority. Took swift and significant action on costs. We do not plan to make additional share repurchases until economic conditions improve. CEO and CFO sat in similar leadership positions during the last Leadership recession. Tenured industry operating leaders. www.TrueBlue.com 10

Outlook
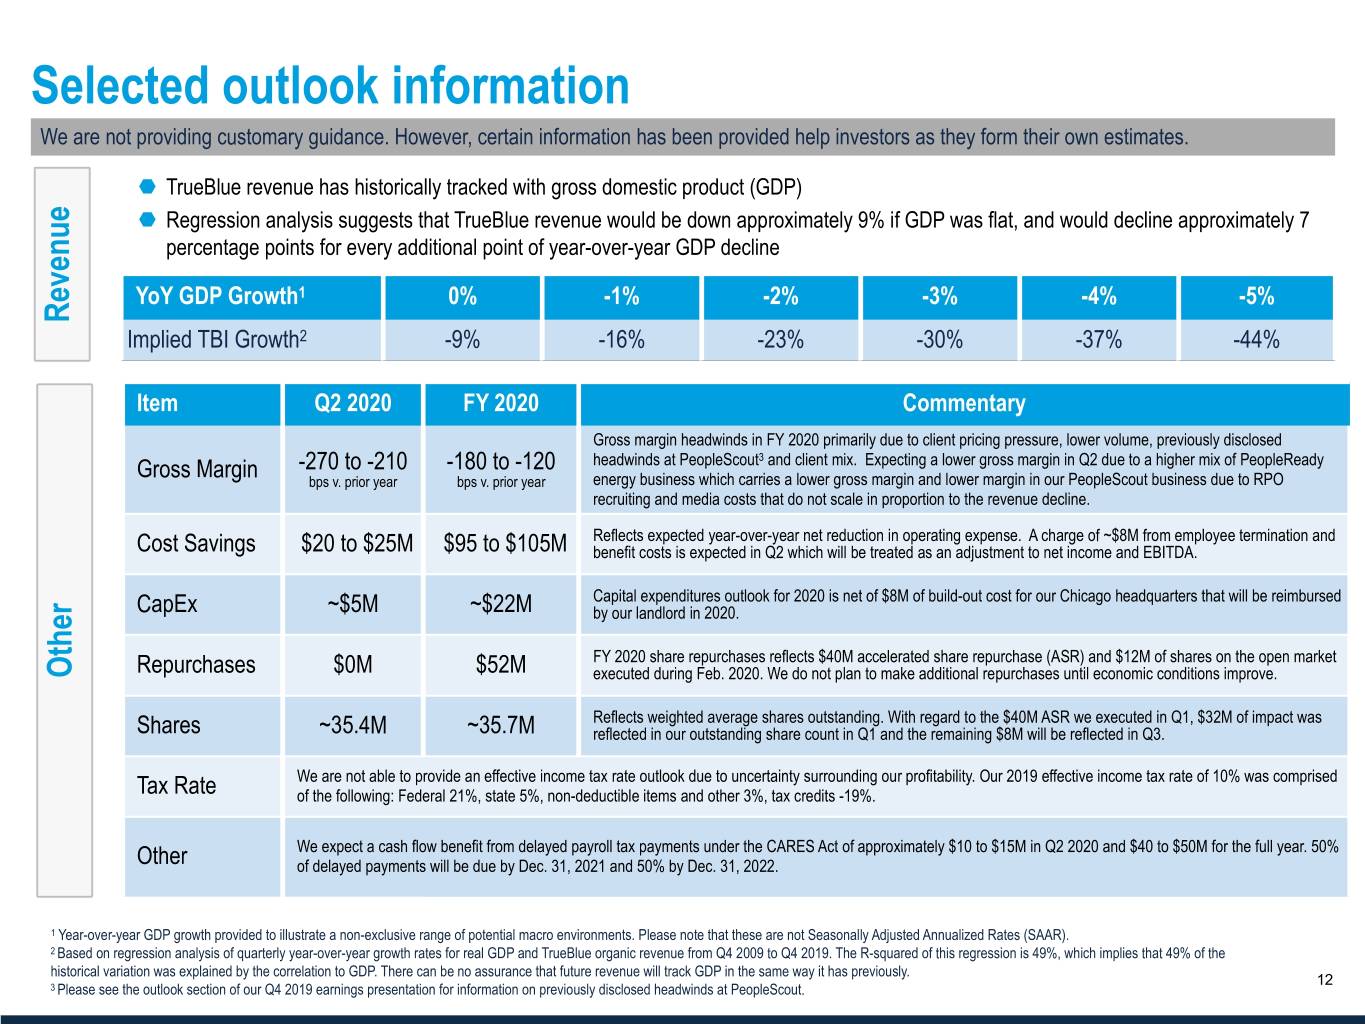
Selected outlook information We are not providing customary guidance. However, certain information has been provided help investors as they form their own estimates. ¬ TrueBlue revenue has historically tracked with gross domestic product (GDP) ¬ Regression analysis suggests that TrueBlue revenue would be down approximately 9% if GDP was flat, and would decline approximately 7 percentage points for every additional point of year-over-year GDP decline YoY GDP Growth1 0% -1% -2% -3% -4% -5% Revenue Implied TBI Growth2 -9% -16% -23% -30% -37% -44% Item Q2 2020 FY 2020 Commentary Gross margin headwinds in FY 2020 primarily due to client pricing pressure, lower volume, previously disclosed Gross Margin -270 to -210 -180 to -120 headwinds at PeopleScout3 and client mix. Expecting a lower gross margin in Q2 due to a higher mix of PeopleReady bps v. prior year bps v. prior year energy business which carries a lower gross margin and lower margin in our PeopleScout business due to RPO recruiting and media costs that do not scale in proportion to the revenue decline. Reflects expected year-over-year net reduction in operating expense. A charge of ~$8M from employee termination and Cost Savings $20 to $25M $95 to $105M benefit costs is expected in Q2 which will be treated as an adjustment to net income and EBITDA. Capital expenditures outlook for 2020 is net of $8M of build-out cost for our Chicago headquarters that will be reimbursed CapEx ~$5M ~$22M by our landlord in 2020. FY 2020 share repurchases reflects $40M accelerated share repurchase (ASR) and $12M of shares on the open market Other Repurchases $0M $52M executed during Feb. 2020. We do not plan to make additional repurchases until economic conditions improve. Reflects weighted average shares outstanding. With regard to the $40M ASR we executed in Q1, $32M of impact was Shares ~35.4M ~35.7M reflected in our outstanding share count in Q1 and the remaining $8M will be reflected in Q3. We are not able to provide an effective income tax rate outlook due to uncertainty surrounding our profitability. Our 2019 effective income tax rate of 10% was comprised Tax Rate of the following: Federal 21%, state 5%, non-deductible items and other 3%, tax credits -19%. We expect a cash flow benefit from delayed payroll tax payments under the CARES Act of approximately $10 to $15M in Q2 2020 and $40 to $50M for the full year. 50% Other of delayed payments will be due by Dec. 31, 2021 and 50% by Dec. 31, 2022. 1 Year-over-year GDP growth provided to illustrate a non-exclusive range of potential macro environments. Please note that these are not Seasonally Adjusted Annualized Rates (SAAR). 2 Based on regression analysis of quarterly year-over-year growth rates for real GDP and TrueBlue organic revenue from Q4 2009 to Q4 2019. The R-squared of this regression is 49%, which implies that 49% of the historical variation was explained by the correlation to GDP. There can be no assurance that future revenue will track GDP in the same way it has previously. www.TrueBlue.com 12 3 Please see the outlook section of our Q4 2019 earnings presentation for information on previously disclosed headwinds at PeopleScout. PeopleScout Client Headwinds Q1 Q2 Q3 Q4 Revenue Headwind -$5 -$4 -$2 $0 l As previously disclosed, PeopleScout headwind from one client lost after being acquired and less volume / lower margins on another large account. The first client had no order volume starting in Q2 2019 and Segment Profit Headwind -$3 -$2 -$1 $0 the second client had no order volume in Q4 2019.

Appendix
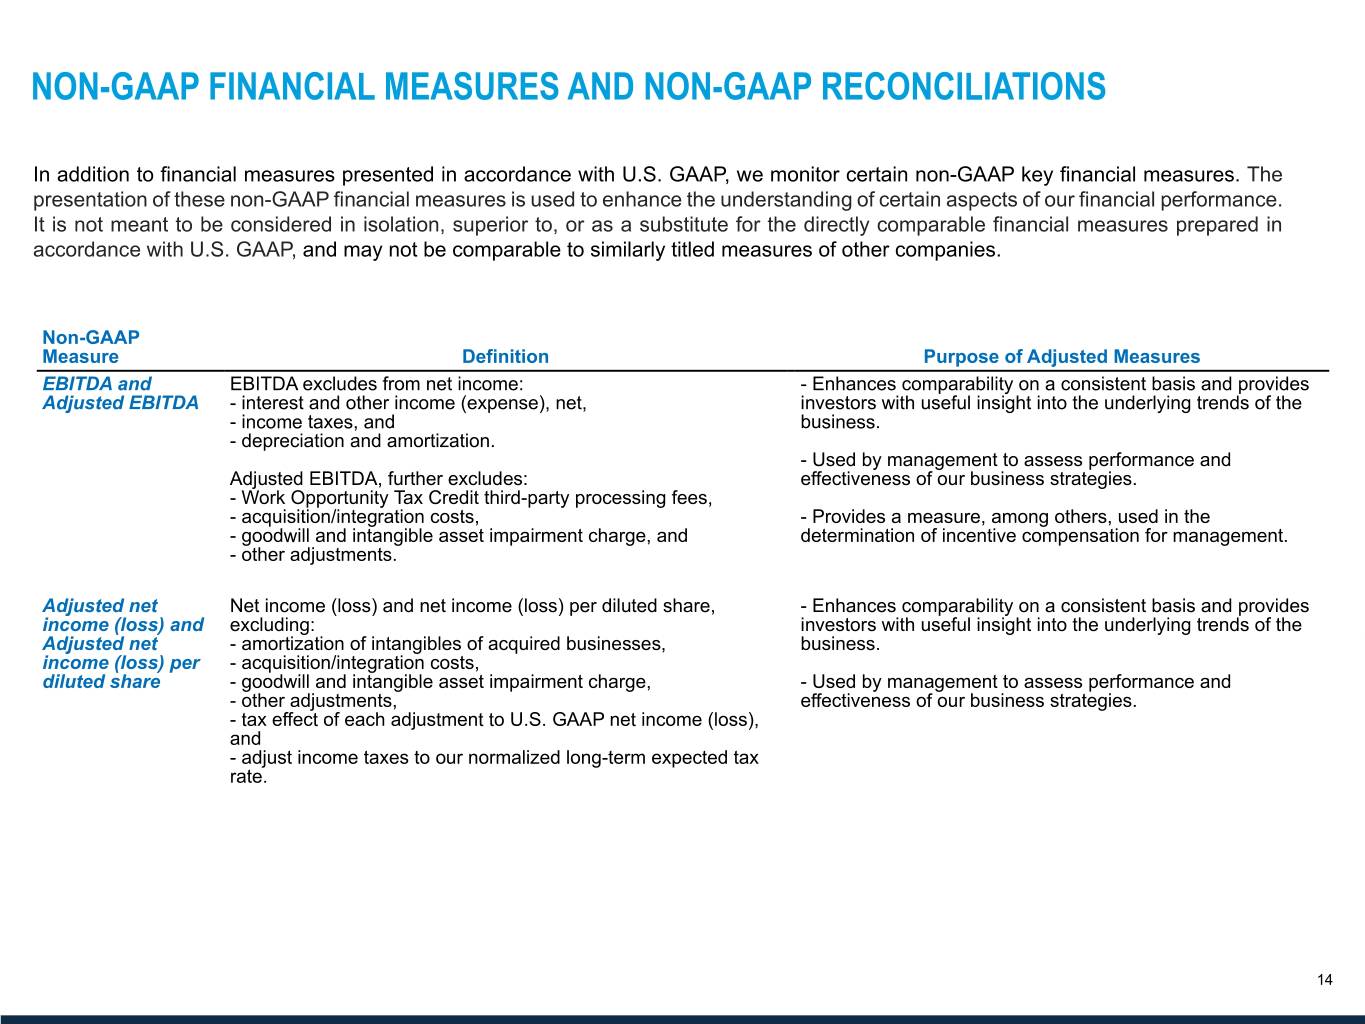
NON-GAAP FINANCIAL MEASURES AND NON-GAAP RECONCILIATIONS In addition to financial measures presented in accordance with U.S. GAAP, we monitor certain non-GAAP key financial measures. The presentation of these non-GAAP financial measures is used to enhance the understanding of certain aspects of our financial performance. It is not meant to be considered in isolation, superior to, or as a substitute for the directly comparable financial measures prepared in accordance with U.S. GAAP, and may not be comparable to similarly titled measures of other companies. Non-GAAP Measure Definition Purpose of Adjusted Measures EBITDA and EBITDA excludes from net income: - Enhances comparability on a consistent basis and provides Adjusted EBITDA - interest and other income (expense), net, investors with useful insight into the underlying trends of the - income taxes, and business. - depreciation and amortization. - Used by management to assess performance and Adjusted EBITDA, further excludes: effectiveness of our business strategies. - Work Opportunity Tax Credit third-party processing fees, - acquisition/integration costs, - Provides a measure, among others, used in the - goodwill and intangible asset impairment charge, and determination of incentive compensation for management. - other adjustments. Adjusted net Net income (loss) and net income (loss) per diluted share, - Enhances comparability on a consistent basis and provides income (loss) and excluding: investors with useful insight into the underlying trends of the Adjusted net - amortization of intangibles of acquired businesses, business. income (loss) per - acquisition/integration costs, diluted share - goodwill and intangible asset impairment charge, - Used by management to assess performance and - other adjustments, effectiveness of our business strategies. - tax effect of each adjustment to U.S. GAAP net income (loss), and - adjust income taxes to our normalized long-term expected tax rate. www.TrueBlue.com 14
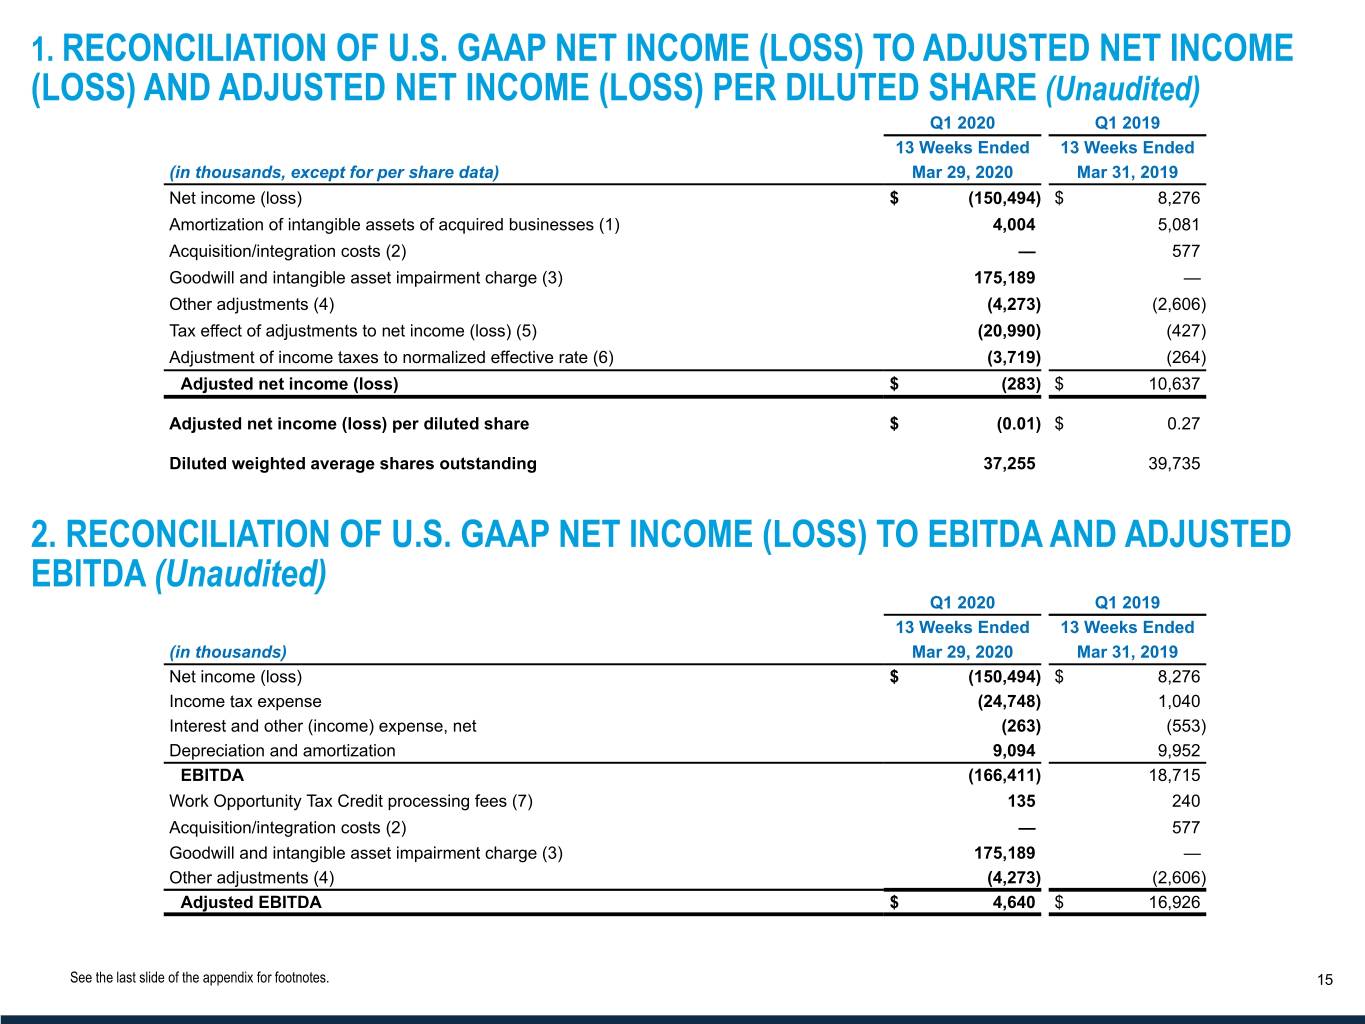
1. RECONCILIATION OF U.S. GAAP NET INCOME (LOSS) TO ADJUSTED NET INCOME (LOSS) AND ADJUSTED NET INCOME (LOSS) PER DILUTED SHARE (Unaudited) Q1 2020 Q1 2019 13 Weeks Ended 13 Weeks Ended (in thousands, except for per share data) Mar 29, 2020 Mar 31, 2019 Net income (loss) $ (150,494) $ 8,276 Amortization of intangible assets of acquired businesses (1) 4,004 5,081 Acquisition/integration costs (2) — 577 Goodwill and intangible asset impairment charge (3) 175,189 — Other adjustments (4) (4,273) (2,606) Tax effect of adjustments to net income (loss) (5) (20,990) (427) Adjustment of income taxes to normalized effective rate (6) (3,719) (264) Adjusted net income (loss) $ (283) $ 10,637 Adjusted net income (loss) per diluted share $ (0.01) $ 0.27 Diluted weighted average shares outstanding 37,255 39,735 2. RECONCILIATION OF U.S. GAAP NET INCOME (LOSS) TO EBITDA AND ADJUSTED EBITDA (Unaudited) Q1 2020 Q1 2019 13 Weeks Ended 13 Weeks Ended (in thousands) Mar 29, 2020 Mar 31, 2019 Net income (loss) $ (150,494) $ 8,276 Income tax expense (24,748) 1,040 Interest and other (income) expense, net (263) (553) Depreciation and amortization 9,094 9,952 EBITDA (166,411) 18,715 Work Opportunity Tax Credit processing fees (7) 135 240 Acquisition/integration costs (2) — 577 Goodwill and intangible asset impairment charge (3) 175,189 — Other adjustments (4) (4,273) (2,606) Adjusted EBITDA $ 4,640 $ 16,926 www.TrueBlue.comSee the last slide of the appendix for footnotes. 15
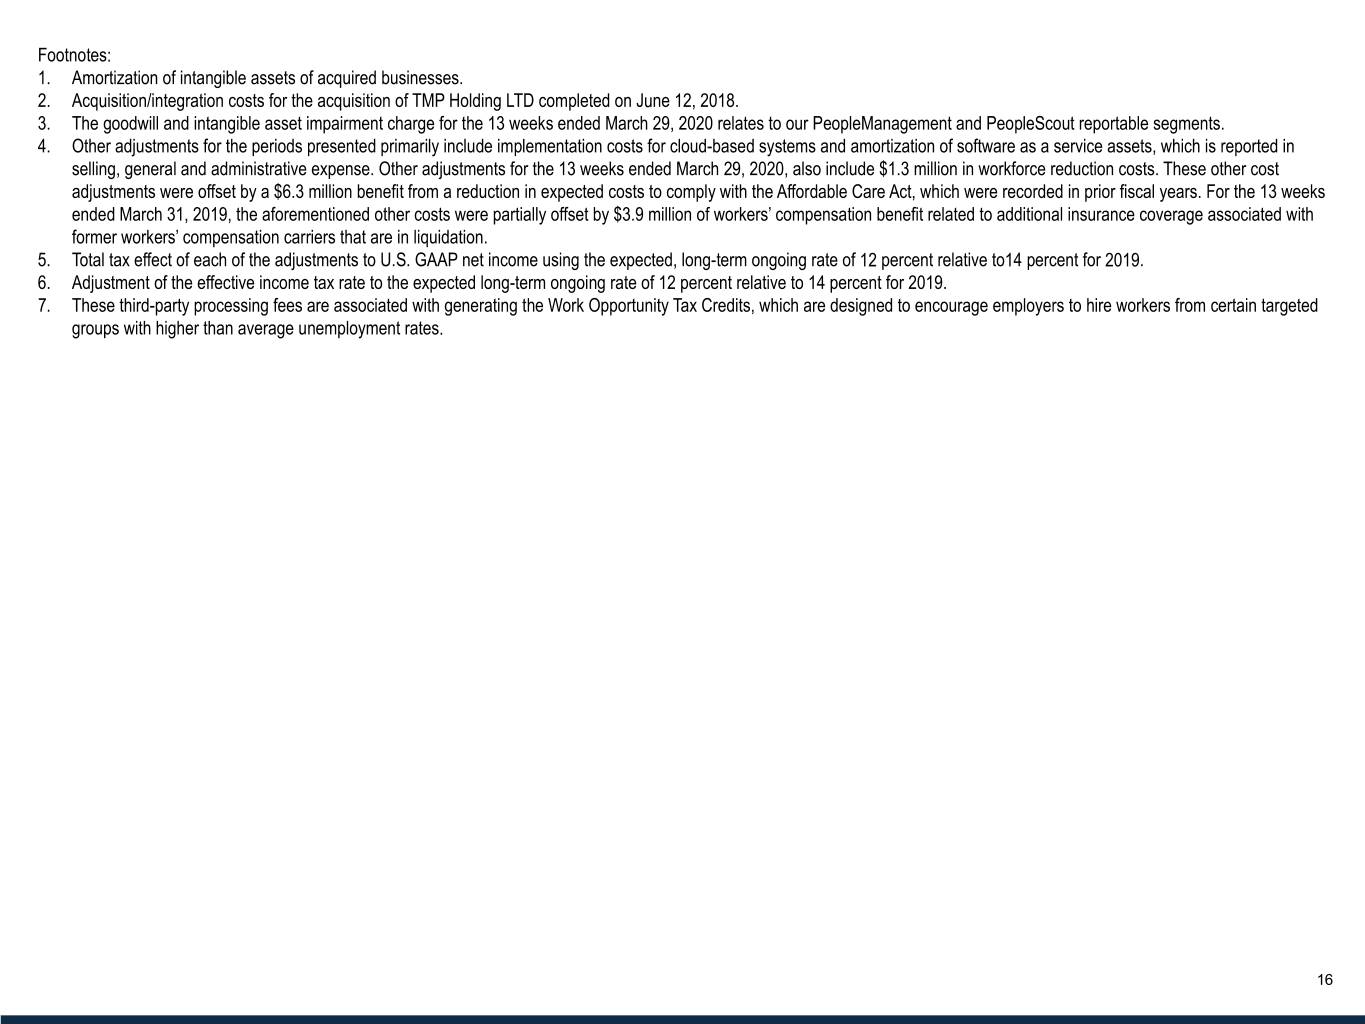
Footnotes: 1. Amortization of intangible assets of acquired businesses. 2. Acquisition/integration costs for the acquisition of TMP Holding LTD completed on June 12, 2018. 3. The goodwill and intangible asset impairment charge for the 13 weeks ended March 29, 2020 relates to our PeopleManagement and PeopleScout reportable segments. 4. Other adjustments for the periods presented primarily include implementation costs for cloud-based systems and amortization of software as a service assets, which is reported in selling, general and administrative expense. Other adjustments for the 13 weeks ended March 29, 2020, also include $1.3 million in workforce reduction costs. These other cost adjustments were offset by a $6.3 million benefit from a reduction in expected costs to comply with the Affordable Care Act, which were recorded in prior fiscal years. For the 13 weeks ended March 31, 2019, the aforementioned other costs were partially offset by $3.9 million of workers’ compensation benefit related to additional insurance coverage associated with former workers’ compensation carriers that are in liquidation. 5. Total tax effect of each of the adjustments to U.S. GAAP net income using the expected, long-term ongoing rate of 12 percent relative to14 percent for 2019. 6. Adjustment of the effective income tax rate to the expected long-term ongoing rate of 12 percent relative to 14 percent for 2019. 7. These third-party processing fees are associated with generating the Work Opportunity Tax Credits, which are designed to encourage employers to hire workers from certain targeted groups with higher than average unemployment rates. www.TrueBlue.com 16