
UCB 8-K
United Community Banks Inc (UCB)
8-K
2020-04-22
For: 2020-04-21
View Original
Added on
April 11, 2026
UNITED STATES
SECURITIES AND EXCHANGE COMMISSION
Washington, D.C. 20549
FORM 8-K
CURRENT REPORT
PURSUANT TO SECTION 13 OR 15(d) OF THE SECURITIES EXCHANGE ACT OF 1934
Date of Report (Date of earliest event reported): April 21, 2020
(Exact name of registrant as specified in its charter)
(State or other jurisdiction of incorporation) | (Commission file number) | (IRS Employer Identification No.) | ||
(Address of principal executive offices)
Registrant’s telephone number, including area code:
(706 ) 781-2265
Not applicable
(Former name or former address, if changed since last report)
Check the appropriate box below if the Form 8-K filing is intended to simultaneously satisfy the filing obligation of the registrant under any of the following provisions:
Written communications pursuant to Rule 425 under the Securities Act (17 CFR 230.425) | ||
Soliciting material pursuant to Rule 14a-12 under the Exchange Act (17 CFR 240.14a-12) | ||
Pre-commencement communications pursuant to Rule 14d-2(b) under the Exchange Act (17 CFR 240.14d-2(b)) | ||
Pre-commencement communications pursuant to Rule 13e-4(c) under the Exchange Act (17 CFR 240.13e-4(c)) | ||
Securities registered pursuant to Section 12(b) of the Act: | ||
Title of Each Class | Trading Symbol(s) | Name of Each Exchange on Which Registered |
Indicate by check mark whether the registrant is an emerging growth company as defined in as defined in Rule 405 of the Securities Act of 1933 (§230.405 of this chapter) or Rule 12b-2 of the Securities Exchange Act of 1934 (§240.12b-2 of this chapter).
Emerging growth company ☐
If an emerging growth company, indicate by check mark if the registrant has elected not to use the extended transition period for complying with any new or revised financial accounting standards provided pursuant to Section 13(a) of the Exchange Act. ☐
Item 2.02 | Results of Operations and Financial Condition. |
On April 21, 2020, United Community Banks, Inc. (“United”) issued a press release announcing financial results for the first quarter of 2020. The press release is furnished as Exhibit 99.1 to this Current Report on Form 8-K. | |
Item 7.01 | Regulation FD Disclosure. |
On April 22, 2020, United will hold an earnings conference call and webcast at 11:00 a.m. (Eastern Time) to discuss financial results for the first quarter of 2020. The press release referenced above in Item 2.02 contains information about how to access the conference call and webcast. A copy of the slide presentation to be used during the earnings call and webcast is furnished as Exhibit 99.2 to this Current Report on Form 8-K. The slide presentation also will be available on our website, www.ucbi.com, under the “Investor Relations – Events and Presentations” section. | |
Item 9.01 | Financial Statements and Exhibits. |
(d) Exhibits | The following exhibit index lists the exhibits that are either filed or furnished with the Current Report on Form 8-K. |
EXHIBIT INDEX | |
Exhibit No. | Description |
104 | The cover page from this Current Report on Form 8-K, formatted in Inline XBRL. |
SIGNATURES
Pursuant to the requirements of the Securities Exchange Act of 1934, the registrant has duly caused this report to be signed on its behalf by the undersigned hereunto duly authorized.
UNITED COMMUNITY BANKS, INC. | ||
By: | /s/ Jefferson L. Harralson | |
Jefferson L. Harralson | ||
Executive Vice President and | ||
Chief Financial Officer | ||
Date: April 21, 2020 | ||

For Immediate Release
For more information:
Jefferson Harralson
Chief Financial Officer
(864) 240-6208
United Community Banks, Inc. Reports First Quarter Results
Entering Cycle on Strong Financial Footing
GREENVILLE, SC - April 21, 2020 - United Community Banks, Inc. (NASDAQ: UCBI) (“United”) today reported first quarter financial results, with solid year-over-year loan and deposit growth. United delivered net income of $31.9 million, pre-tax pre-provision income of $62.9 million, and built its allowance for credit losses with a $22.2 million provision for credit losses given the uncertain environment. Diluted earnings per share were $0.40, a decrease of $0.15 or 27% from a year ago. Excluding merger-related and other charges, diluted operating earnings per share were $0.41, also down 27% from last year. United’s return on assets (“ROA”) was 0.99% and its return on common equity was 7.9% for the quarter. On an operating basis, United’s ROA was 1.01% and its return on tangible common equity was 10.6%.
Chairman and CEO Lynn Harton stated, “While I am pleased to report a solid quarter in a difficult environment, I am most proud of how our employees are delivering for our customers during this public health crisis. We consider ourselves ‘Financial First Responders’ and feel privileged to take care of our customers in this time of significant stress. Among other things, we were able to help support our small business clients who have experienced financial hardship due to COVID-19 by offering loan deferrals as needed, and by participating in the Small Business
Administration’s Paycheck Protection Program (“PPP”). As one of the largest Preferred SBA lenders in the Southeast, we mobilized our existing SBA team, as well as hundreds of additional United bankers to process applications as quickly as possible. As a result, our team was able to successfully process applications totaling more than $960 million and reserve funding for 6,918 small businesses as of April 16, 2020.
Harton continued, “We are focused on the safety of employees and customers, with 54% of our non-branch employees working from home, and all branches operating a drive-through only model with lobbies available by appointment. The investments we have made in our digital delivery channels are paying off with increased online account openings as well as increased web traffic, and digital and social engagement. Looking forward, based on much of what we are learning now, we have the potential to be even stronger with greater innovation and business growth opportunities.”
This quarter saw record core transaction growth with loans growing at a 6% annualized rate and total deposits up by 5% on an annualized basis. Increased purchased loan accretion drove United’s net interest margin 14 basis points higher in the quarter. Excluding purchased loan accretion, the net interest margin was down just 1 basis point. Total deposits were up $138 million over last quarter, with core transaction deposits up $238 million, or 13% annualized. This was mainly driven by demand deposit growth of $165 million.
Mr. Harton concluded, “I am also tremendously proud that for 2020, Forbes recognized United for the seventh consecutive year on its list of the 100 Best Banks in America. Additionally, this quarter United received the 2019 Greenwich Excellence Award for overall satisfaction in Middle Market Banking in the South, and Small Business Banking Excellence Awards for both overall satisfaction and cash management in the South. These honors are remarkable and are only achieved through the dedication of our bankers to build a company where great people can build fulfilling careers through helping our customers reach their financial goals.”
First Quarter 2020 Financial Highlights:
• | EPS decreased by 27% as compared to last year on both a GAAP and operating basis |
• | Return on assets of 0.99%, or 1.01% excluding merger-related and other charges |
• | Pre-tax pre-provision return on assets of 1.95%, or 1.98%, excluding merger-related charges |
• | Return on common equity of 7.9% |
• | Return on tangible common equity of 10.6%, excluding merger-related and other charges |
• | United adopted the CECL model in 1Q; the uncertain economic outlook necessitated a provision for credit losses of $22.2 million |
• | Loan production of $919 million compared to $782 million in Q1 2019 |
• | Loan growth of 6% for the quarter on an annualized basis |
• | Core transaction deposits were up $238 million or 13% annualized, mainly driven by demand deposit growth of $165 million during the quarter |
• | Net interest margin of 4.07% was up 14 basis points compared to the fourth quarter, and down 3 basis points from a year ago |
• | Mortgage rate locks of $801 million, exceeding our previous quarterly record by 58%, and compared to $312 million a year ago |
• | Noninterest income was down $4.4 million on a linked quarter basis, as record mortgage rate locks and production were more than offset by a larger negative mortgage servicing rights mark-to-market |
• | Efficiency ratio of 56.15%, or 55.59% excluding merger-related and other charges |
• | Net charge-offs of $8.1 million, or 37 basis points as a percent of average loans, up 19 basis points from last quarter mainly due to a single commercial loan default totaling $6.4 million |
• | Nonperforming assets of 0.28% of total assets, which is flat compared to December 31, 2019 |
• | Repurchased 826,482 shares at an average price of $25.14 in the quarter |
Conference Call
United will hold a conference call, Wednesday, April 22, 2020, at 11 a.m. ET to discuss the contents of this press release and to share business highlights for the quarter. To access the call, dial (877) 380-5665 and use the conference number 1559838. The conference call also will be webcast and available for replay for 30 days by selecting “Events & Presentations” within the Investor Relations section of United’s website at www.ucbi.com.
UNITED COMMUNITY BANKS, INC. | |||||||||||||||||||||||
Selected Financial Information | |||||||||||||||||||||||
2020 | 2019 | First Quarter 2020 - 2019 Change | |||||||||||||||||||||
(in thousands, except per share data) | First Quarter | Fourth Quarter | Third Quarter | Second Quarter | First Quarter | ||||||||||||||||||
INCOME SUMMARY | |||||||||||||||||||||||
Interest revenue | $ | 136,547 | $ | 136,419 | $ | 140,615 | $ | 139,156 | $ | 136,516 | |||||||||||||
Interest expense | 17,941 | 19,781 | 21,277 | 21,372 | 20,882 | ||||||||||||||||||
Net interest revenue | 118,606 | 116,638 | 119,338 | 117,784 | 115,634 | 3 | % | ||||||||||||||||
Provision for credit losses | 22,191 | 3,500 | 3,100 | 3,250 | 3,300 | ||||||||||||||||||
Noninterest income | 25,814 | 30,183 | 29,031 | 24,531 | 20,968 | 23 | |||||||||||||||||
Total revenue | 122,229 | 143,321 | 145,269 | 139,065 | 133,302 | (8 | ) | ||||||||||||||||
Expenses | 81,538 | 81,424 | 82,924 | 81,813 | 76,084 | 7 | |||||||||||||||||
Income before income tax expense | 40,691 | 61,897 | 62,345 | 57,252 | 57,218 | (29 | ) | ||||||||||||||||
Income tax expense | 8,807 | 12,885 | 13,983 | 13,167 | 12,956 | (32 | ) | ||||||||||||||||
Net income | 31,884 | 49,012 | 48,362 | 44,085 | 44,262 | (28 | ) | ||||||||||||||||
Merger-related and other charges | 808 | (74 | ) | 2,605 | 4,087 | 739 | |||||||||||||||||
Income tax benefit of merger-related and other charges | (182 | ) | 17 | (600 | ) | (940 | ) | (172 | ) | ||||||||||||||
Net income - operating (1) | $ | 32,510 | $ | 48,955 | $ | 50,367 | $ | 47,232 | $ | 44,829 | (27 | ) | |||||||||||
Pre-tax pre-provision income (5) | $ | 62,882 | $ | 65,397 | $ | 65,445 | $ | 60,502 | $ | 60,518 | 4 | ||||||||||||
PERFORMANCE MEASURES | |||||||||||||||||||||||
Per common share: | |||||||||||||||||||||||
Diluted net income - GAAP | $ | 0.40 | $ | 0.61 | $ | 0.60 | $ | 0.55 | $ | 0.55 | (27 | ) | |||||||||||
Diluted net income - operating (1) | 0.41 | 0.61 | 0.63 | 0.59 | 0.56 | (27 | ) | ||||||||||||||||
Cash dividends declared | 0.18 | 0.18 | 0.17 | 0.17 | 0.16 | 13 | |||||||||||||||||
Book value | 20.80 | 20.53 | 20.16 | 19.65 | 18.93 | 10 | |||||||||||||||||
Tangible book value (3) | 16.52 | 16.28 | 15.90 | 15.38 | 14.93 | 11 | |||||||||||||||||
Key performance ratios: | |||||||||||||||||||||||
Return on common equity - GAAP (2)(4) | 7.85 | % | 12.07 | % | 12.16 | % | 11.45 | % | 11.85 | % | |||||||||||||
Return on common equity - operating (1)(2)(4) | 8.01 | 12.06 | 12.67 | 12.27 | 12.00 | ||||||||||||||||||
Return on tangible common equity - operating (1)(2)(3)(4) | 10.57 | 15.49 | 16.38 | 15.88 | 15.46 | ||||||||||||||||||
Return on assets - GAAP (4) | 0.99 | 1.50 | 1.51 | 1.40 | 1.44 | ||||||||||||||||||
Return on assets - operating (1)(4) | 1.01 | 1.50 | 1.58 | 1.50 | 1.45 | ||||||||||||||||||
Return on assets - pre-tax pre-provision (4)(5) | 1.95 | 2.00 | 2.05 | 1.92 | 1.96 | ||||||||||||||||||
Return on assets - pre-tax pre-provision, excluding merger-related and other charges (1)(4)(5) | 1.98 | 2.00 | 2.13 | 2.05 | 1.99 | ||||||||||||||||||
Net interest margin (fully taxable equivalent) (4) | 4.07 | 3.93 | 4.12 | 4.12 | 4.10 | ||||||||||||||||||
Efficiency ratio - GAAP | 56.15 | 54.87 | 55.64 | 57.28 | 55.32 | ||||||||||||||||||
Efficiency ratio - operating (1) | 55.59 | 54.92 | 53.90 | 54.42 | 54.78 | ||||||||||||||||||
Equity to total assets | 12.54 | 12.66 | 12.53 | 12.25 | 12.06 | ||||||||||||||||||
Tangible common equity to tangible assets (3) | 10.22 | 10.32 | 10.16 | 9.86 | 9.76 | ||||||||||||||||||
ASSET QUALITY | |||||||||||||||||||||||
Nonperforming loans | $ | 36,208 | $ | 35,341 | $ | 30,832 | $ | 26,597 | $ | 23,624 | 53 | ||||||||||||
Foreclosed properties | 475 | 476 | 102 | 75 | 1,127 | (58 | ) | ||||||||||||||||
Total nonperforming assets ("NPAs") | 36,683 | 35,817 | 30,934 | 26,672 | 24,751 | 48 | |||||||||||||||||
Allowance for credit losses - loans | 81,905 | 62,089 | 62,514 | 62,204 | 61,642 | 33 | |||||||||||||||||
Net charge-offs | 8,114 | 3,925 | 2,723 | 2,438 | 3,130 | 159 | |||||||||||||||||
Allowance for credit losses to loans | 0.92 | % | 0.70 | % | 0.70 | % | 0.70 | % | 0.73 | % | |||||||||||||
Net charge-offs to average loans (4) | 0.37 | 0.18 | 0.12 | 0.11 | 0.15 | ||||||||||||||||||
NPAs to loans and foreclosed properties | 0.41 | 0.41 | 0.35 | 0.30 | 0.29 | ||||||||||||||||||
NPAs to total assets | 0.28 | 0.28 | 0.24 | 0.21 | 0.20 | ||||||||||||||||||
AVERAGE BALANCES ($ in millions) | |||||||||||||||||||||||
Loans | $ | 8,829 | $ | 8,890 | $ | 8,836 | $ | 8,670 | $ | 8,430 | 5 | ||||||||||||
Investment securities | 2,520 | 2,486 | 2,550 | 2,674 | 2,883 | (13 | ) | ||||||||||||||||
Earning assets | 11,798 | 11,832 | 11,568 | 11,534 | 11,498 | 3 | |||||||||||||||||
Total assets | 12,944 | 12,946 | 12,681 | 12,608 | 12,509 | 3 | |||||||||||||||||
Deposits | 10,915 | 10,924 | 10,531 | 10,493 | 10,361 | 5 | |||||||||||||||||
Shareholders’ equity | 1,653 | 1,623 | 1,588 | 1,531 | 1,478 | 12 | |||||||||||||||||
Common shares - basic (thousands) | 79,340 | 79,659 | 79,663 | 79,673 | 79,807 | (1 | ) | ||||||||||||||||
Common shares - diluted (thousands) | 79,446 | 79,669 | 79,667 | 79,678 | 79,813 | — | |||||||||||||||||
AT PERIOD END ($ in millions) | |||||||||||||||||||||||
Loans | $ | 8,935 | $ | 8,813 | $ | 8,903 | $ | 8,838 | $ | 8,493 | 5 | ||||||||||||
Investment securities | 2,540 | 2,559 | 2,515 | 2,620 | 2,720 | (7 | ) | ||||||||||||||||
Total assets | 13,086 | 12,916 | 12,809 | 12,779 | 12,506 | 5 | |||||||||||||||||
Deposits | 11,035 | 10,897 | 10,757 | 10,591 | 10,534 | 5 | |||||||||||||||||
Shareholders’ equity | 1,641 | 1,636 | 1,605 | 1,566 | 1,508 | 9 | |||||||||||||||||
Common shares outstanding (thousands) | 78,284 | 79,014 | 78,974 | 79,075 | 79,035 | (1 | ) | ||||||||||||||||
(1) Excludes merger-related and other charges which includes termination of pension plan in the third quarter of 2019, executive retirement charges in the second quarter of 2019 and amortization of certain executive change of control benefits. (2) Net income divided by average realized common equity, which excludes accumulated other comprehensive income (loss). (3) Excludes effect of acquisition related intangibles and associated amortization. (4) Annualized. (5) Excludes income tax expense and provision for credit losses.
UNITED COMMUNITY BANKS, INC. | ||||||||||||||||||||
Non-GAAP Performance Measures Reconciliation | ||||||||||||||||||||
Selected Financial Information | ||||||||||||||||||||
2020 | 2019 | |||||||||||||||||||
First Quarter | Fourth Quarter | Third Quarter | Second Quarter | First Quarter | ||||||||||||||||
(in thousands, except per share data) | ||||||||||||||||||||
Expense reconciliation | ||||||||||||||||||||
Expenses (GAAP) | $ | 81,538 | $ | 81,424 | $ | 82,924 | $ | 81,813 | $ | 76,084 | ||||||||||
Merger-related and other charges | (808 | ) | 74 | (2,605 | ) | (4,087 | ) | (739 | ) | |||||||||||
Expenses - operating | $ | 80,730 | $ | 81,498 | $ | 80,319 | $ | 77,726 | $ | 75,345 | ||||||||||
Net income to operating income reconciliation | ||||||||||||||||||||
Net income (GAAP) | $ | 31,884 | $ | 49,012 | $ | 48,362 | $ | 44,085 | $ | 44,262 | ||||||||||
Merger-related and other charges | 808 | (74 | ) | 2,605 | 4,087 | 739 | ||||||||||||||
Income tax benefit of merger-related and other charges | (182 | ) | 17 | (600 | ) | (940 | ) | (172 | ) | |||||||||||
Net income - operating | $ | 32,510 | $ | 48,955 | $ | 50,367 | $ | 47,232 | $ | 44,829 | ||||||||||
Net income to pre-tax pre-provision income reconciliation | ||||||||||||||||||||
Net income (GAAP) | $ | 31,884 | $ | 49,012 | $ | 48,362 | $ | 44,085 | $ | 44,262 | ||||||||||
Income tax expense | 8,807 | 12,885 | 13,983 | 13,167 | 12,956 | |||||||||||||||
Provision for credit losses | 22,191 | 3,500 | 3,100 | 3,250 | 3,300 | |||||||||||||||
Pre-tax pre-provision income | $ | 62,882 | $ | 65,397 | $ | 65,445 | $ | 60,502 | $ | 60,518 | ||||||||||
Diluted income per common share reconciliation | ||||||||||||||||||||
Diluted income per common share (GAAP) | $ | 0.40 | $ | 0.61 | $ | 0.60 | $ | 0.55 | $ | 0.55 | ||||||||||
Merger-related and other charges, net of tax | 0.01 | — | 0.03 | 0.04 | 0.01 | |||||||||||||||
Diluted income per common share - operating | $ | 0.41 | $ | 0.61 | $ | 0.63 | $ | 0.59 | $ | 0.56 | ||||||||||
Book value per common share reconciliation | ||||||||||||||||||||
Book value per common share (GAAP) | $ | 20.80 | $ | 20.53 | $ | 20.16 | $ | 19.65 | $ | 18.93 | ||||||||||
Effect of goodwill and other intangibles | (4.28 | ) | (4.25 | ) | (4.26 | ) | (4.27 | ) | (4.00 | ) | ||||||||||
Tangible book value per common share | $ | 16.52 | $ | 16.28 | $ | 15.90 | $ | 15.38 | $ | 14.93 | ||||||||||
Return on tangible common equity reconciliation | ||||||||||||||||||||
Return on common equity (GAAP) | 7.85 | % | 12.07 | % | 12.16 | % | 11.45 | % | 11.85 | % | ||||||||||
Merger-related and other charges, net of tax | 0.16 | (0.01 | ) | 0.51 | 0.82 | 0.15 | ||||||||||||||
Return on common equity - operating | 8.01 | 12.06 | 12.67 | 12.27 | 12.00 | |||||||||||||||
Effect of goodwill and other intangibles | 2.56 | 3.43 | 3.71 | 3.61 | 3.46 | |||||||||||||||
Return on tangible common equity - operating | 10.57 | % | 15.49 | % | 16.38 | % | 15.88 | % | 15.46 | % | ||||||||||
Return on assets reconciliation | ||||||||||||||||||||
Return on assets (GAAP) | 0.99 | % | 1.50 | % | 1.51 | % | 1.40 | % | 1.44 | % | ||||||||||
Merger-related and other charges, net of tax | 0.02 | — | 0.07 | 0.10 | 0.01 | |||||||||||||||
Return on assets - operating | 1.01 | % | 1.50 | % | 1.58 | % | 1.50 | % | 1.45 | % | ||||||||||
Return on assets to return on assets- pre-tax pre-provision reconciliation | ||||||||||||||||||||
Return on assets (GAAP) | 0.99 | % | 1.50 | % | 1.51 | % | 1.40 | % | 1.44 | % | ||||||||||
Income tax expense | 0.27 | 0.39 | 0.44 | 0.42 | 0.41 | |||||||||||||||
Provision for credit losses | 0.69 | 0.11 | 0.10 | 0.10 | 0.11 | |||||||||||||||
Return on assets - pre-tax, pre-provision | 1.95 | 2.00 | 2.05 | 1.92 | 1.96 | |||||||||||||||
Merger-related and other charges | 0.03 | — | 0.08 | 0.13 | 0.03 | |||||||||||||||
Return on assets - pre-tax pre-provision, excluding merger-related and other charges | 1.98 | % | 2.00 | % | 2.13 | % | 2.05 | % | 1.99 | % | ||||||||||
Efficiency ratio reconciliation | ||||||||||||||||||||
Efficiency ratio (GAAP) | 56.15 | % | 54.87 | % | 55.64 | % | 57.28 | % | 55.32 | % | ||||||||||
Merger-related and other charges | (0.56 | ) | 0.05 | (1.74 | ) | (2.86 | ) | (0.54 | ) | |||||||||||
Efficiency ratio - operating | 55.59 | % | 54.92 | % | 53.90 | % | 54.42 | % | 54.78 | % | ||||||||||
Tangible common equity to tangible assets reconciliation | ||||||||||||||||||||
Equity to total assets (GAAP) | 12.54 | % | 12.66 | % | 12.53 | % | 12.25 | % | 12.06 | % | ||||||||||
Effect of goodwill and other intangibles | (2.32 | ) | (2.34 | ) | (2.37 | ) | (2.39 | ) | (2.30 | ) | ||||||||||
Tangible common equity to tangible assets | 10.22 | % | 10.32 | % | 10.16 | % | 9.86 | % | 9.76 | % | ||||||||||
UNITED COMMUNITY BANKS, INC. | |||||||||||||||||||||||||||
Financial Highlights | |||||||||||||||||||||||||||
Loan Portfolio Composition at Period-End | |||||||||||||||||||||||||||
2020 | 2019 | Linked Quarter Change | Year over Year Change | ||||||||||||||||||||||||
(in millions) | First Quarter | Fourth Quarter | Third Quarter | Second Quarter | First Quarter | ||||||||||||||||||||||
LOANS BY CATEGORY | |||||||||||||||||||||||||||
Owner occupied commercial RE | $ | 1,703 | $ | 1,720 | $ | 1,692 | $ | 1,658 | $ | 1,620 | $ | (17 | ) | $ | 83 | ||||||||||||
Income producing commercial RE | 2,065 | 2,008 | 1,934 | 1,939 | 1,867 | 57 | 198 | ||||||||||||||||||||
Commercial & industrial | 1,310 | 1,221 | 1,271 | 1,299 | 1,284 | 89 | 26 | ||||||||||||||||||||
Commercial construction | 959 | 976 | 1,001 | 983 | 866 | (17 | ) | 93 | |||||||||||||||||||
Equipment financing | 761 | 745 | 729 | 674 | 606 | 16 | 155 | ||||||||||||||||||||
Total commercial | 6,798 | 6,670 | 6,627 | 6,553 | 6,243 | 128 | 555 | ||||||||||||||||||||
Residential mortgage | 1,128 | 1,118 | 1,121 | 1,108 | 1,064 | 10 | 64 | ||||||||||||||||||||
Home equity lines of credit | 668 | 661 | 669 | 675 | 684 | 7 | (16 | ) | |||||||||||||||||||
Residential construction | 216 | 236 | 229 | 219 | 200 | (20 | ) | 16 | |||||||||||||||||||
Consumer | 125 | 128 | 257 | 283 | 302 | (3 | ) | (177 | ) | ||||||||||||||||||
Total loans | $ | 8,935 | $ | 8,813 | $ | 8,903 | $ | 8,838 | $ | 8,493 | $ | 122 | $ | 442 | |||||||||||||
LOANS BY MARKET | |||||||||||||||||||||||||||
North Georgia | $ | 958 | $ | 967 | $ | 1,002 | $ | 1,002 | $ | 970 | (9 | ) | (12 | ) | |||||||||||||
Atlanta | 1,820 | 1,762 | 1,740 | 1,745 | 1,524 | 58 | 296 | ||||||||||||||||||||
North Carolina | 1,124 | 1,156 | 1,117 | 1,084 | 1,074 | (32 | ) | 50 | |||||||||||||||||||
Coastal Georgia | 604 | 631 | 611 | 604 | 603 | (27 | ) | 1 | |||||||||||||||||||
Gainesville | 235 | 246 | 246 | 244 | 243 | (11 | ) | (8 | ) | ||||||||||||||||||
East Tennessee | 425 | 421 | 435 | 446 | 458 | 4 | (33 | ) | |||||||||||||||||||
South Carolina | 1,774 | 1,708 | 1,705 | 1,674 | 1,674 | 66 | 100 | ||||||||||||||||||||
Commercial Banking Solutions | 1,995 | 1,922 | 1,916 | 1,884 | 1,766 | 73 | 229 | ||||||||||||||||||||
Indirect auto | — | — | 131 | 155 | 181 | — | (181 | ) | |||||||||||||||||||
Total loans | $ | 8,935 | $ | 8,813 | $ | 8,903 | $ | 8,838 | $ | 8,493 | $ | 122 | $ | 442 | |||||||||||||
UNITED COMMUNITY BANKS, INC. | ||||||||||||||||||
Financial Highlights | ||||||||||||||||||
Credit Quality | ||||||||||||||||||
2020 | 2019 | |||||||||||||||||
(in thousands) | First Quarter | Fourth Quarter | Third Quarter | |||||||||||||||
NONACCRUAL LOANS | ||||||||||||||||||
Owner occupied RE | $ | 10,405 | $ | 10,544 | $ | 8,430 | ||||||||||||
Income producing RE | 2,235 | 1,996 | 2,030 | |||||||||||||||
Commercial & industrial | 3,169 | 2,545 | 2,625 | |||||||||||||||
Commercial construction | 1,724 | 2,277 | 1,894 | |||||||||||||||
Equipment financing | 2,439 | 3,141 | 1,974 | |||||||||||||||
Total commercial | 19,972 | 20,503 | 16,953 | |||||||||||||||
Residential mortgage | 12,458 | 10,567 | 9,475 | |||||||||||||||
Home equity lines of credit | 3,010 | 3,173 | 3,065 | |||||||||||||||
Residential construction | 540 | 939 | 597 | |||||||||||||||
Consumer | 228 | 159 | 742 | |||||||||||||||
Total | $ | 36,208 | $ | 35,341 | $ | 30,832 | ||||||||||||
2020 | 2019 | ||||||||||||||||||||
First Quarter | Fourth Quarter | Third Quarter | |||||||||||||||||||
(in thousands) | Net Charge-Offs | Net Charge-Offs to Average Loans (1) | Net Charge-Offs | Net Charge-Offs to Average Loans (1) | Net Charge-Offs | Net Charge-Offs to Average Loans (1) | |||||||||||||||
NET CHARGE-OFFS BY CATEGORY | |||||||||||||||||||||
Owner occupied RE | $ | (1,028 | ) | (0.24 | )% | $ | (208 | ) | (0.05 | )% | $ | (39 | ) | (0.01 | )% | ||||||
Income producing RE | 270 | 0.05 | 95 | 0.02 | 431 | 0.09 | |||||||||||||||
Commercial & industrial | 7,185 | 2.30 | 1,809 | 0.58 | 691 | 0.21 | |||||||||||||||
Commercial construction | (141 | ) | (0.06 | ) | (140 | ) | (0.06 | ) | (247 | ) | (0.10 | ) | |||||||||
Equipment financing | 1,507 | 0.81 | 1,550 | 0.84 | 1,174 | 0.67 | |||||||||||||||
Total commercial | 7,793 | 0.47 | 3,106 | 0.19 | 2,010 | 0.12 | |||||||||||||||
Residential mortgage | 9 | — | 89 | 0.03 | 158 | 0.06 | |||||||||||||||
Home equity lines of credit | (83 | ) | (0.05 | ) | 198 | 0.12 | 83 | 0.05 | |||||||||||||
Residential construction | (12 | ) | (0.02 | ) | (24 | ) | (0.04 | ) | (5 | ) | (0.01 | ) | |||||||||
Consumer | 407 | 1.30 | 556 | 0.90 | 477 | 0.70 | |||||||||||||||
Total | $ | 8,114 | 0.37 | $ | 3,925 | 0.18 | $ | 2,723 | 0.12 | ||||||||||||
(1) Annualized. | |||||||||||||||||||||
UNITED COMMUNITY BANKS, INC. Consolidated Balance Sheets (Unaudited) | ||||||||
(in thousands, except share and per share data) | March 31, 2020 | December 31, 2019 | ||||||
ASSETS | ||||||||
Cash and due from banks | $ | 155,008 | $ | 125,844 | ||||
Interest-bearing deposits in banks | 365,494 | 389,362 | ||||||
Cash and cash equivalents | 520,502 | 515,206 | ||||||
Debt securities available for sale | 2,249,876 | 2,274,581 | ||||||
Debt securities held to maturity (fair value $301,595 and $287,904) | 290,404 | 283,533 | ||||||
Loans held for sale at fair value | 89,959 | 58,484 | ||||||
Loans and leases held for investment | 8,935,424 | 8,812,553 | ||||||
Less allowance for credit losses - loans and leases | (81,905 | ) | (62,089 | ) | ||||
Loans and leases, net | 8,853,519 | 8,750,464 | ||||||
Premises and equipment, net | 214,744 | 215,976 | ||||||
Bank owned life insurance | 200,778 | 202,664 | ||||||
Accrued interest receivable | 31,570 | 32,660 | ||||||
Net deferred tax asset | 30,715 | 34,059 | ||||||
Derivative financial instruments | 82,668 | 35,007 | ||||||
Goodwill and other intangible assets, net | 341,207 | 342,247 | ||||||
Other assets | 179,924 | 171,135 | ||||||
Total assets | $ | 13,085,866 | $ | 12,916,016 | ||||
LIABILITIES AND SHAREHOLDERS' EQUITY | ||||||||
Liabilities: | ||||||||
Deposits: | ||||||||
Noninterest-bearing demand | $ | 3,624,806 | $ | 3,477,979 | ||||
NOW and interest-bearing demand | 2,391,976 | 2,461,895 | ||||||
Money market | 2,277,052 | 2,230,628 | ||||||
Savings | 732,209 | 706,467 | ||||||
Time | 1,840,767 | 1,859,574 | ||||||
Brokered | 168,116 | 160,701 | ||||||
Total deposits | 11,034,926 | 10,897,244 | ||||||
Long-term debt | 212,849 | 212,664 | ||||||
Derivative financial instruments | 27,349 | 15,516 | ||||||
Accrued expenses and other liabilities | 170,130 | 154,900 | ||||||
Total liabilities | 11,445,254 | 11,280,324 | ||||||
Shareholders' equity: | ||||||||
Common stock, $1 par value; 150,000,000 shares authorized; 78,283,544 and 79,013,729 shares issued and outstanding | 78,284 | 79,014 | ||||||
Common stock issuable; 591,053 and 664,640 shares | 10,534 | 11,491 | ||||||
Capital surplus | 1,478,719 | 1,496,641 | ||||||
Retained earnings | 54,206 | 40,152 | ||||||
Accumulated other comprehensive income | 18,869 | 8,394 | ||||||
Total shareholders' equity | 1,640,612 | 1,635,692 | ||||||
Total liabilities and shareholders' equity | $ | 13,085,866 | $ | 12,916,016 | ||||
UNITED COMMUNITY BANKS, INC. Consolidated Statements of Income (Unaudited) | ||||||||
Three Months Ended March 31, | ||||||||
(in thousands, except per share data) | 2020 | 2019 | ||||||
Interest revenue: | ||||||||
Loans, including fees | $ | 118,063 | $ | 115,259 | ||||
Investment securities, including tax exempt of $1,523 and $1,169 | 17,394 | 20,818 | ||||||
Deposits in banks and short-term investments | 1,090 | 439 | ||||||
Total interest revenue | 136,547 | 136,516 | ||||||
Interest expense: | ||||||||
Deposits: | ||||||||
NOW and interest-bearing demand | 2,978 | 3,609 | ||||||
Money market | 4,531 | 4,132 | ||||||
Savings | 35 | 32 | ||||||
Time | 7,531 | 8,184 | ||||||
Deposits | 15,075 | 15,957 | ||||||
Short-term borrowings | 1 | 161 | ||||||
Federal Home Loan Bank advances | 1 | 1,422 | ||||||
Long-term debt | 2,864 | 3,342 | ||||||
Total interest expense | 17,941 | 20,882 | ||||||
Net interest revenue | 118,606 | 115,634 | ||||||
Provision for credit losses | 22,191 | 3,300 | ||||||
Net interest revenue after provision for credit losses | 96,415 | 112,334 | ||||||
Noninterest income: | ||||||||
Service charges and fees | 8,638 | 8,453 | ||||||
Mortgage loan gains and other related fees | 8,310 | 3,748 | ||||||
Brokerage fees | 1,640 | 1,337 | ||||||
Gains from sales of other loans, net | 1,674 | 1,303 | ||||||
Securities losses, net | — | (267 | ) | |||||
Other | 5,552 | 6,394 | ||||||
Total noninterest income | 25,814 | 20,968 | ||||||
Total revenue | 122,229 | 133,302 | ||||||
Noninterest expenses: | ||||||||
Salaries and employee benefits | 51,358 | 47,503 | ||||||
Communications and equipment | 5,946 | 5,788 | ||||||
Occupancy | 5,714 | 5,584 | ||||||
Advertising and public relations | 1,274 | 1,286 | ||||||
Postage, printing and supplies | 1,670 | 1,586 | ||||||
Professional fees | 4,097 | 3,161 | ||||||
Lending and loan servicing expense | 2,293 | 2,334 | ||||||
Outside services - electronic banking | 1,832 | 1,609 | ||||||
FDIC assessments and other regulatory charges | 1,484 | 1,710 | ||||||
Amortization of intangibles | 1,040 | 1,293 | ||||||
Merger-related and other charges | 808 | 546 | ||||||
Other | 4,022 | 3,684 | ||||||
Total noninterest expenses | 81,538 | 76,084 | ||||||
Net income before income taxes | 40,691 | 57,218 | ||||||
Income tax expense | 8,807 | 12,956 | ||||||
Net income | $ | 31,884 | $ | 44,262 | ||||
Net income available to common shareholders | $ | 31,641 | $ | 43,947 | ||||
Net income per common share: | ||||||||
Basic | $ | 0.40 | $ | 0.55 | ||||
Diluted | 0.40 | 0.55 | ||||||
Weighted average common shares outstanding: | ||||||||
Basic | 79,340 | 79,807 | ||||||
Diluted | 79,446 | 79,813 | ||||||
Average Consolidated Balance Sheets and Net Interest Analysis |
For the Three Months Ended March 31, |
2020 | 2019 | |||||||||||||||||||||
(dollars in thousands, fully taxable equivalent (FTE)) | Average Balance | Interest | Average Rate | Average Balance | Interest | Average Rate | ||||||||||||||||
Assets: | ||||||||||||||||||||||
Interest-earning assets: | ||||||||||||||||||||||
Loans, net of unearned income (FTE) (1)(2) | $ | 8,828,880 | $ | 117,796 | 5.37 | % | $ | 8,429,976 | $ | 115,347 | 5.55 | % | ||||||||||
Taxable securities (3) | 2,357,635 | 15,871 | 2.69 | 2,712,995 | 19,649 | 2.90 | ||||||||||||||||
Tax-exempt securities (FTE) (1)(3) | 162,253 | 2,045 | 5.04 | 169,702 | 1,570 | 3.70 | ||||||||||||||||
Federal funds sold and other interest-earning assets | 448,775 | 1,632 | 1.46 | 185,623 | 618 | 1.33 | ||||||||||||||||
Total interest-earning assets (FTE) | 11,797,543 | 137,344 | 4.68 | 11,498,296 | 137,184 | 4.83 | ||||||||||||||||
Noninterest-earning assets: | ||||||||||||||||||||||
Allowance for credit losses | (69,777 | ) | (61,784 | ) | ||||||||||||||||||
Cash and due from banks | 128,254 | 123,801 | ||||||||||||||||||||
Premises and equipment | 219,243 | 216,611 | ||||||||||||||||||||
Other assets (3) | 868,452 | 731,628 | ||||||||||||||||||||
Total assets | $ | 12,943,715 | $ | 12,508,552 | ||||||||||||||||||
Liabilities and Shareholders' Equity: | ||||||||||||||||||||||
Interest-bearing liabilities: | ||||||||||||||||||||||
Interest-bearing deposits: | ||||||||||||||||||||||
NOW and interest-bearing demand | $ | 2,412,733 | 2,978 | 0.50 | $ | 2,286,619 | 3,609 | 0.64 | ||||||||||||||
Money market | 2,340,723 | 4,531 | 0.78 | 2,098,052 | 4,132 | 0.80 | ||||||||||||||||
Savings | 712,110 | 35 | 0.02 | 672,197 | 32 | 0.02 | ||||||||||||||||
Time | 1,841,552 | 7,250 | 1.58 | 1,627,584 | 5,336 | 1.33 | ||||||||||||||||
Brokered time deposits | 80,821 | 281 | 1.40 | 482,048 | 2,848 | 2.40 | ||||||||||||||||
Total interest-bearing deposits | 7,387,939 | 15,075 | 0.82 | 7,166,500 | 15,957 | 0.90 | ||||||||||||||||
Federal funds purchased and other borrowings | 396 | 1 | 1.02 | 21,549 | 161 | 3.03 | ||||||||||||||||
Federal Home Loan Bank advances | 165 | 1 | 2.44 | 223,945 | 1,422 | 2.58 | ||||||||||||||||
Long-term debt | 212,762 | 2,864 | 5.41 | 261,971 | 3,342 | 5.17 | ||||||||||||||||
Total borrowed funds | 213,323 | 2,866 | 5.40 | 507,465 | 4,925 | 3.94 | ||||||||||||||||
Total interest-bearing liabilities | 7,601,262 | 17,941 | 0.95 | 7,673,965 | 20,882 | 1.10 | ||||||||||||||||
Noninterest-bearing liabilities: | ||||||||||||||||||||||
Noninterest-bearing deposits | 3,527,385 | 3,194,401 | ||||||||||||||||||||
Other liabilities | 162,187 | 162,213 | ||||||||||||||||||||
Total liabilities | 11,290,834 | 11,030,579 | ||||||||||||||||||||
Shareholders' equity | 1,652,881 | 1,477,973 | ||||||||||||||||||||
Total liabilities and shareholders' equity | $ | 12,943,715 | $ | 12,508,552 | ||||||||||||||||||
Net interest revenue (FTE) | $ | 119,403 | $ | 116,302 | ||||||||||||||||||
Net interest-rate spread (FTE) | 3.73 | % | 3.73 | % | ||||||||||||||||||
Net interest margin (FTE) (4) | 4.07 | % | 4.10 | % | ||||||||||||||||||
(1) | Interest revenue on tax-exempt securities and loans has been increased to reflect comparable interest on taxable securities and loans. The rate used was 26%, reflecting the statutory federal income tax rate and the federal tax adjusted state income tax rate. |
(2) | Included in the average balance of loans outstanding are loans on which the accrual of interest has been discontinued and loans that are held for sale. |
(3) | Securities available for sale are shown at amortized cost. Pretax unrealized gains of $52.9 million in 2020 and unrealized losses of $25.9 million in 2019 are included in other assets for purposes of this presentation. |
(4) | Net interest margin is taxable equivalent net interest revenue divided by average interest-earning assets. |
About United Community Banks, Inc.
United Community Banks, Inc. (NASDAQ: UCBI) is a bank holding company headquartered in Blairsville, Georgia, with executive offices in Greenville, South Carolina. United is one of the southeast region’s largest full-service financial institutions with $13.1 billion in assets, and 149 offices in Georgia, North Carolina, South Carolina and Tennessee. It operates principally through United Community Bank, its bank subsidiary, which specializes in personalized community banking services for individuals, small businesses and companies. Services include a full range of consumer and commercial banking products, including mortgage, advisory, and treasury management. Respected national research firms consistently recognize United Community Bank for outstanding customer service. For five of the past six years, J.D. Power has ranked United Community Bank first in customer satisfaction in the Southeast. In 2019, Forbes magazine included United in its inaugural list of the World’s Best Banks, and in 2020, recognized United for the seventh consecutive year on its list of the 100 Best Banks in America. United Community Bank also received the 2019 Greenwich Excellence Award for overall satisfaction in Middle Market Banking in the South and Small Business Banking Excellence Awards for both overall satisfaction and cash management in the South. Additional information about UCBI and the Bank can be found at www.ucbi.com.
Non-GAAP Financial Measures
This press release, including the accompanying financial statement tables, contains financial information determined by methods other than in accordance with generally accepted accounting principles, or GAAP. This financial information includes certain operating performance measures, which exclude merger-related and other charges that are not considered part of recurring operations, such as “operating net income,” “pre-tax pre-provision income,” “operating net income per diluted common share,” “operating earnings per share,” “tangible book value per common share,” “operating return on common equity,” “operating return on tangible common equity,” “operating return on assets,” “return on assets - pre-tax pre-provision, excluding merger-related and other charges,” “return on assets - pre-tax pre-provision,” “operating efficiency ratio,” and “tangible common equity to tangible assets.” These non-GAAP measures are included because United believes they may provide useful supplemental information for evaluating United’s underlying performance trends. These measures should be viewed in addition
to, and not as an alternative to or substitute for, measures determined in accordance with GAAP, and are not necessarily comparable to non-GAAP measures that may be presented by other companies. To the extent applicable, reconciliations of these non-GAAP measures to the most directly comparable measures as reported in accordance with GAAP are included with the accompanying financial statement tables.
# # #
1Q INVESTOR PRESENTATION April 21, 2020 Member FDIC. © 2020 United Community Bank
Disclosures CAUTIONARY STATEMENT This Investor Presentation contains forward-looking statements about United Community Banks, Inc. (“United”), as defined in federal securities laws. Statements that are not historical or current facts, including statements about beliefs and expectations, are forward-looking statements and are based on information available to, and assumptions and estimates made by, management as of the date hereof. Because forward-looking statements involve inherent risks and uncertainties, our actual results may differ materially from those expressed or implied in any such statements. The COVID-19 pandemic is adversely impacting United, its employees, customers, vendors, counterparties, and the communities that it serves. The ultimate extent of the impact of COVID— 19 on United’s financial position, results of operations, liquidity, and prospects is highly uncertain. United’s results could be adversely affected by, among other things, volatility in financial markets, continued deterioration of economic and business conditions, further increases in unemployment rates, deterioration in the credit quality of United’s loan portfolio, deterioration in the value of United’s investment securities, and changes in statutes, regulations, and regulatory policies or practices. For a discussion of these and other risks that may cause such forward-looking statements to differ materially from actual results, please refer to United’s filings with the Securities and Exchange Commission, including its 2019 Annual Report on Form 10-K under the sections entitled “Cautionary Note Regarding Forward-Looking Statements” and “Risk Factors.” Forward-looking statements speak only as of the date they are made, and we undertake no obligation to update or revise forward-looking statements. NON-GAAP MEASURES This Investor Presentation includes financial information determined by methods other than in accordance with generally accepted accounting principles (“GAAP”). This financial information includes certain operating performance measures, which exclude merger-related and other charges that are not considered part of recurring operations. Such measures include: “Earnings per share – operating,” “Diluted earnings per share – operating,” “Tangible book value per share,” “Return on common equity – operating,” “Return on tangible common equity – operating,” “Return on assets – operating,” “Return on assets – pre-tax pre- provision, excluding merger-related and other charges,” “Efficiency ratio – operating,” “Expenses – operating,” and “Tangible common equity to tangible assets.” Management has included these non-GAAP measures because it believes these measures may provide useful supplemental information for evaluating United’s underlying performance trends. Further, management uses these measures in managing and evaluating United’s business and intends to refer to them in discussions about our operations and performance. Operating performance measures should be viewed in addition to, and not as an alternative to or substitute for, measures determined in accordance with GAAP, and are not necessarily comparable to non-GAAP measures that may be presented by other companies. To the extent applicable, reconciliations of these non-GAAP measures to the most directly comparable GAAP measures can be found in the ‘Non-GAAP Reconciliation Tables’ included in the exhibits to this Presentation. 2
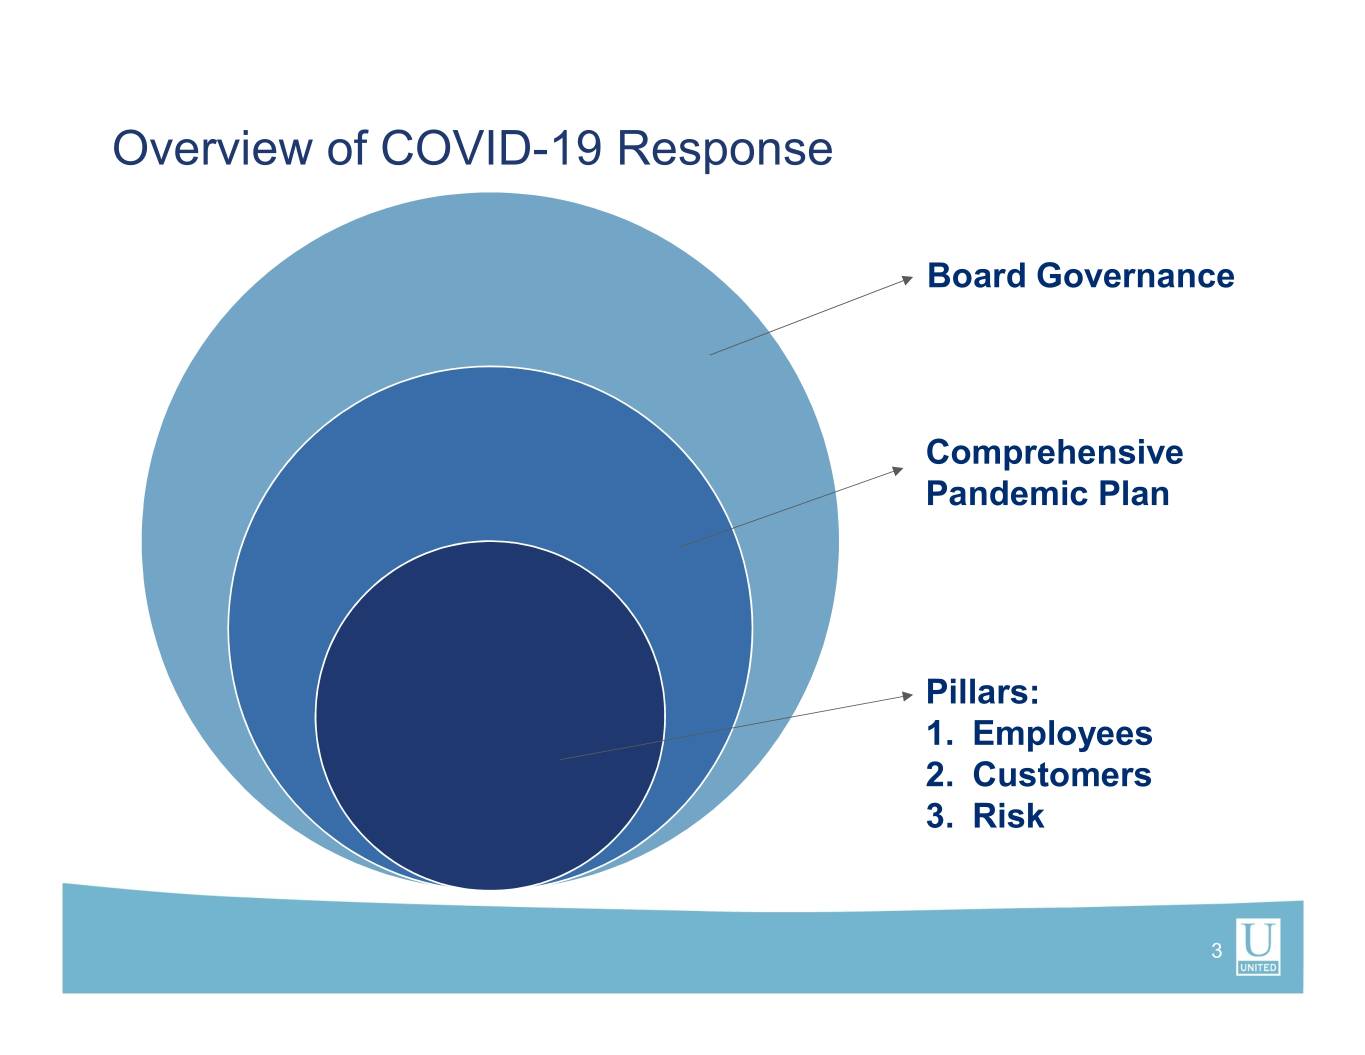
Overview of COVID-19 Response Board Governance Comprehensive Pandemic Plan Pillars: 1. Employees 2. Customers 3. Risk 3
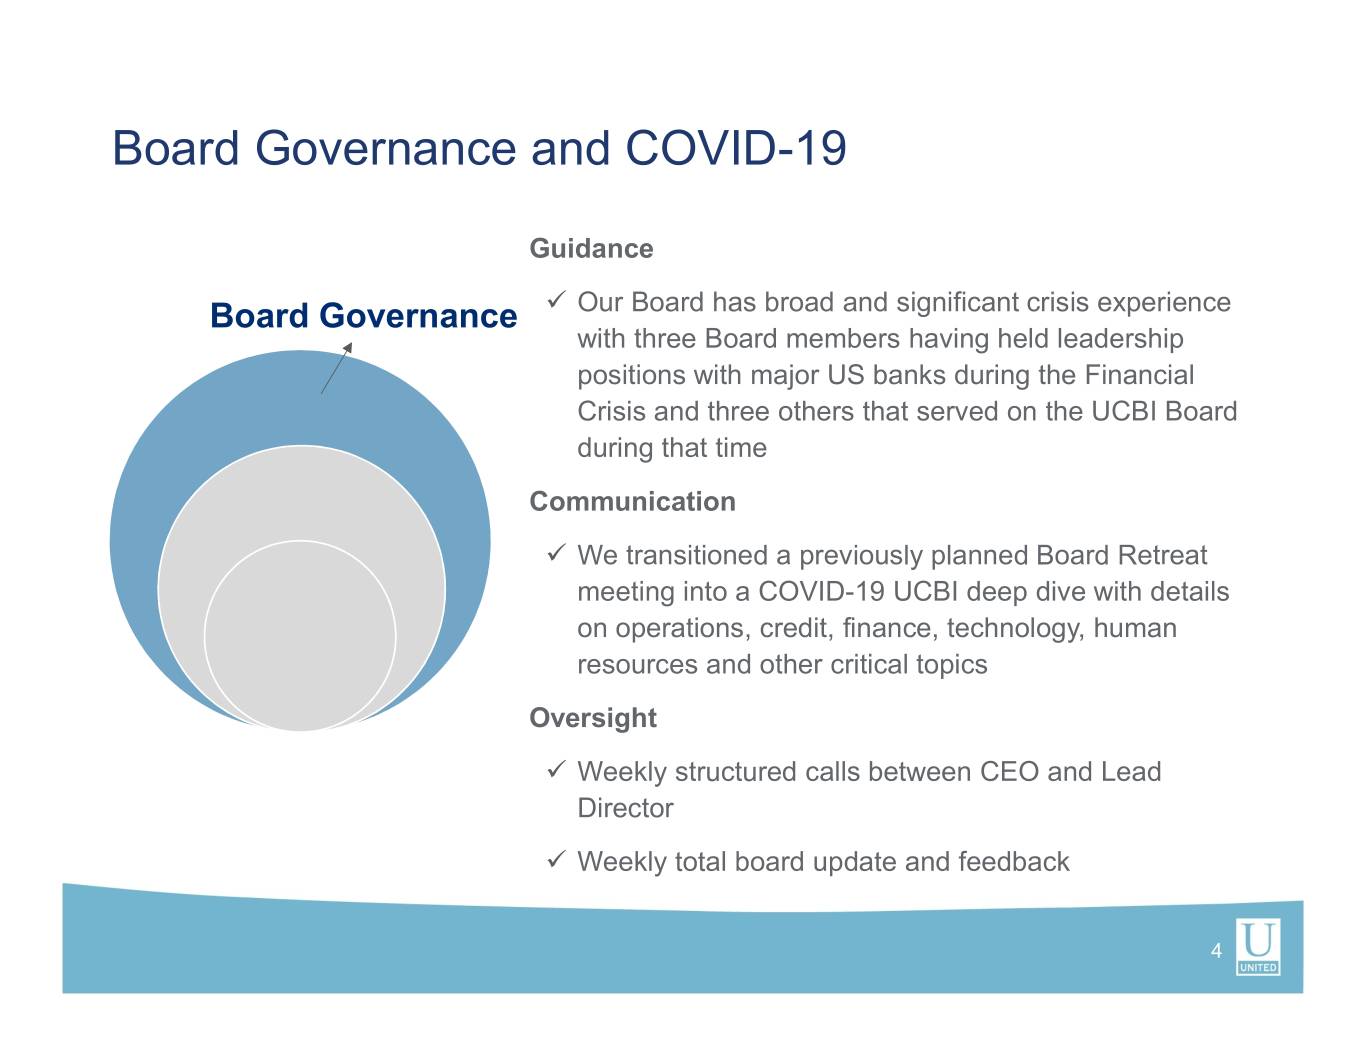
Board Governance and COVID-19 Guidance Board Governance Our Board has broad and significant crisis experience with three Board members having held leadership positions with major US banks during the Financial Crisis and three others that served on the UCBI Board during that time Communication We transitioned a previously planned Board Retreat meeting into a COVID-19 UCBI deep dive with details on operations, credit, finance, technology, human resources and other critical topics Oversight Weekly structured calls between CEO and Lead Director Weekly total board update and feedback 4
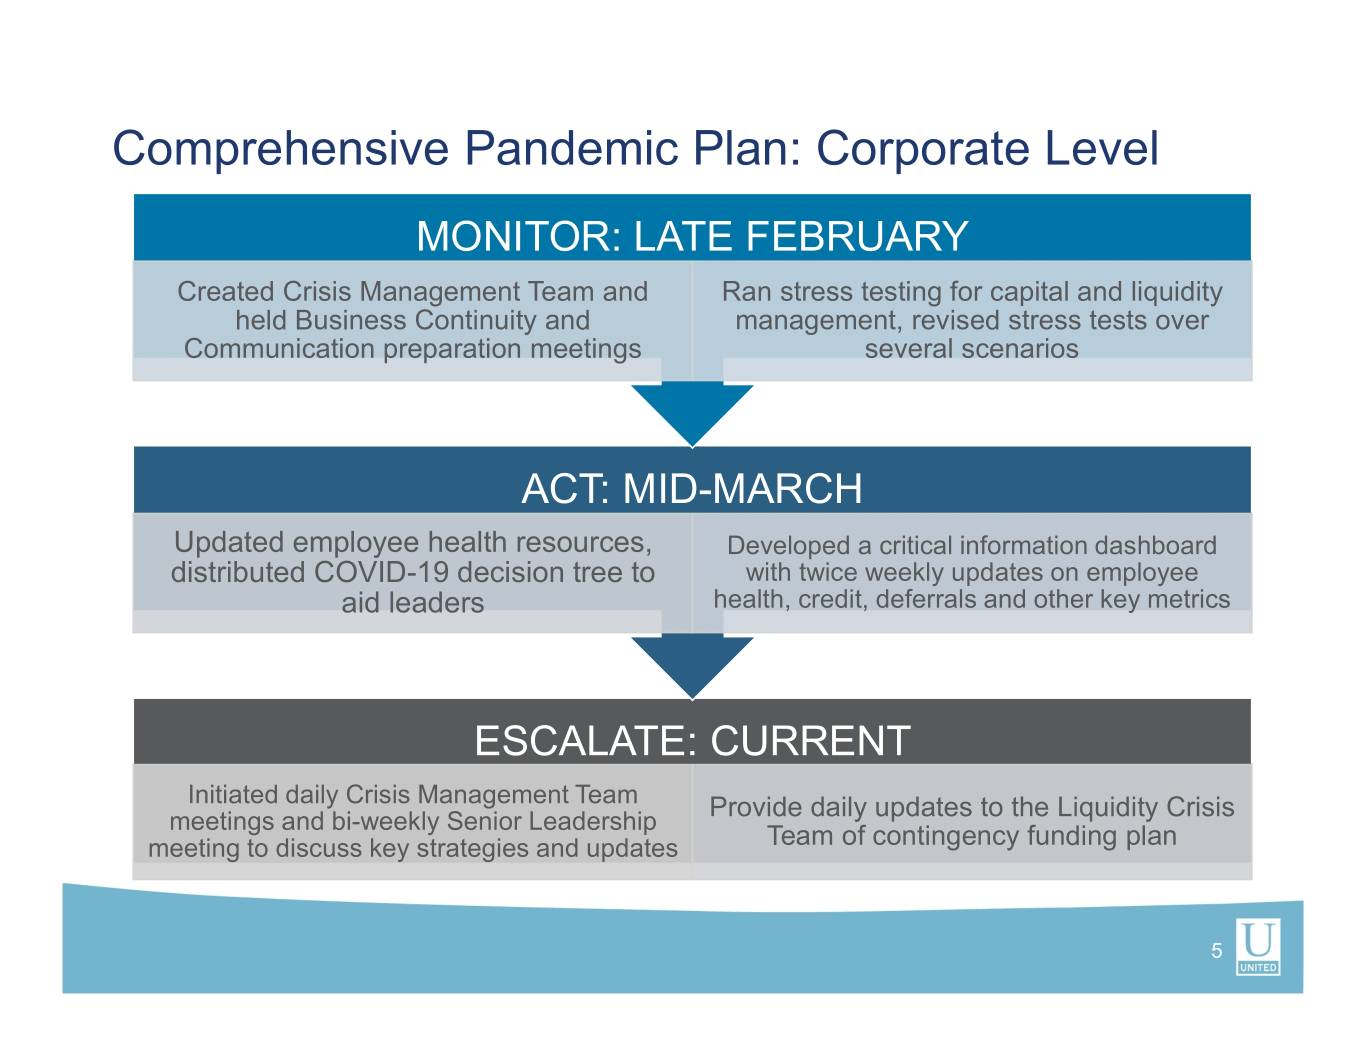
Comprehensive Pandemic Plan: Corporate Level MONITOR: LATE FEBRUARY Created Crisis Management Team and Ran stress testing for capital and liquidity held Business Continuity and management, revised stress tests over Communication preparation meetings several scenarios ACT: MID-MARCH Updated employee health resources, Developed a critical information dashboard distributed COVID-19 decision tree to with twice weekly updates on employee aid leaders health, credit, deferrals and other key metrics ESCALATE: CURRENT Initiated daily Crisis Management Team Provide daily updates to the Liquidity Crisis meetings and bi-weekly Senior Leadership meeting to discuss key strategies and updates Team of contingency funding plan 5
Pillars: Supporting Our Employees ! EMPLOYEES CUSTOMERS RISK 6

Supporting Our Employees: Safety Doubled remote access bandwidth to allow for more capacity to work from home if needed—brought capacity to 900 from 350 previously Bought and issued additional laptops to further increase efficiency for home workers Implemented an extra 10 days of paid time off to be used in the case of quarantine, isolation, family care needs or lack of child care related to COVID-19 illness or other related scenario Allowing up to 10 unused 2020 vacation days to be carried over into 2021 if an employee is unable to use their full 2020 vacation days due to COVID-19 While not specifically COVID-19 related, in the first quarter we We are established a Minimum Wage Per Hour Enhancement Project to better reward and retain key employees that are on the front lines and those “Financial First who support each of us every day Responders” For responsibilities that are critical to have on site we have: and we are proud that our team has shown up Created rotations to ensure significant space between employees for our customers in this Enhanced cleaning products used to comply with CDC guidelines time of significant stress. Increased availability of hand sanitizer in all locations 7
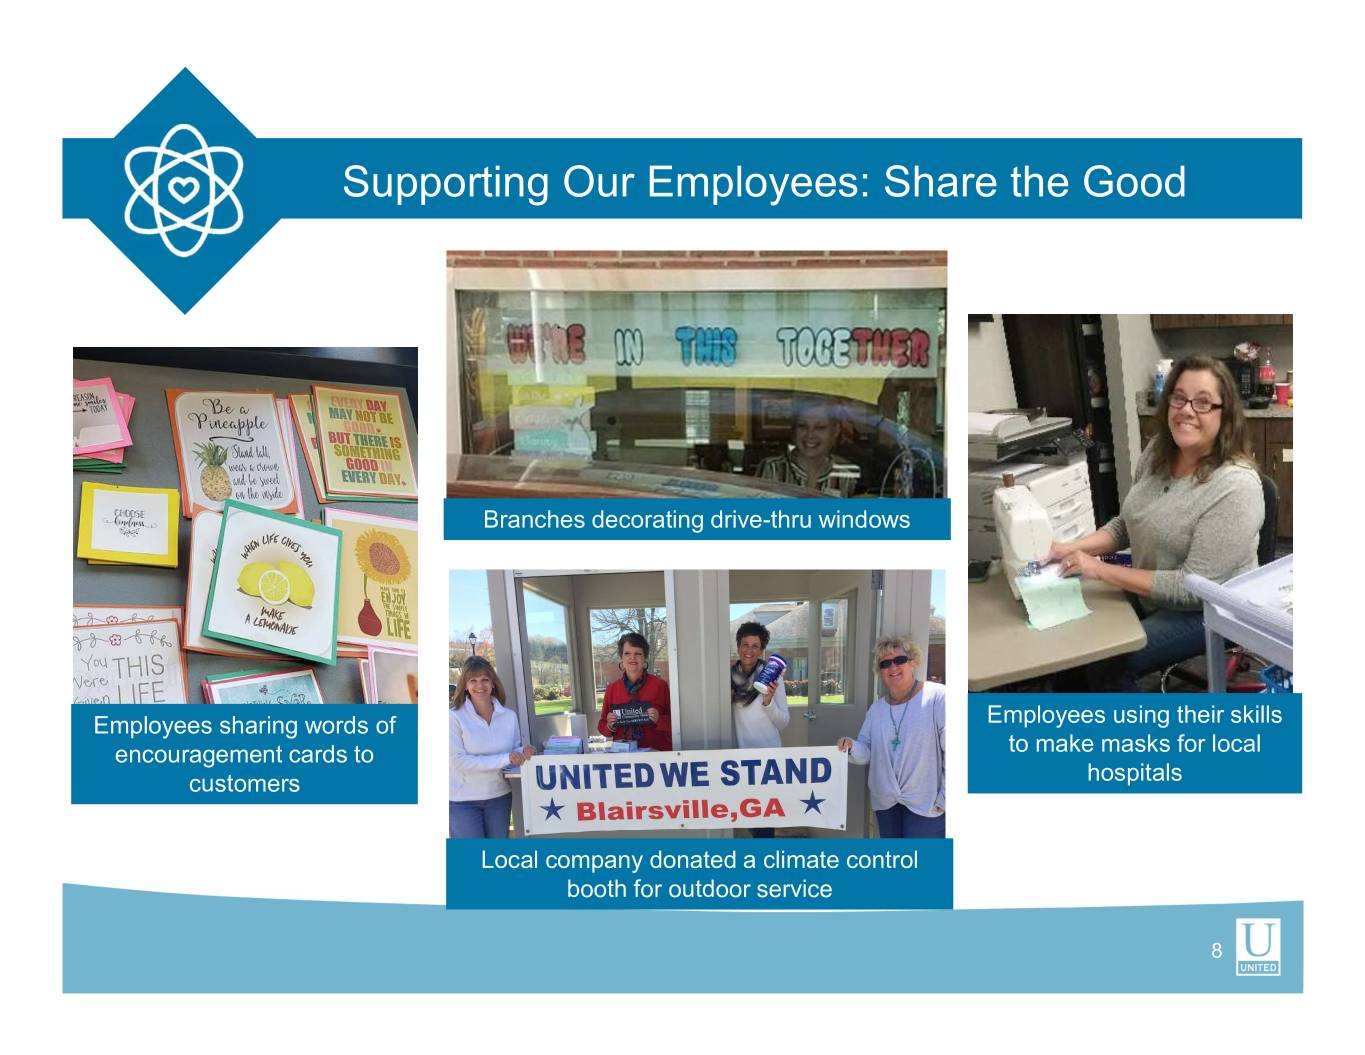
Supporting Our Employees: Share the Good Branches decorating drive-thru windows Employees sharing words of Employees using their skills encouragement cards to to make masks for local customers hospitals Local company donated a climate control booth for outdoor service 8
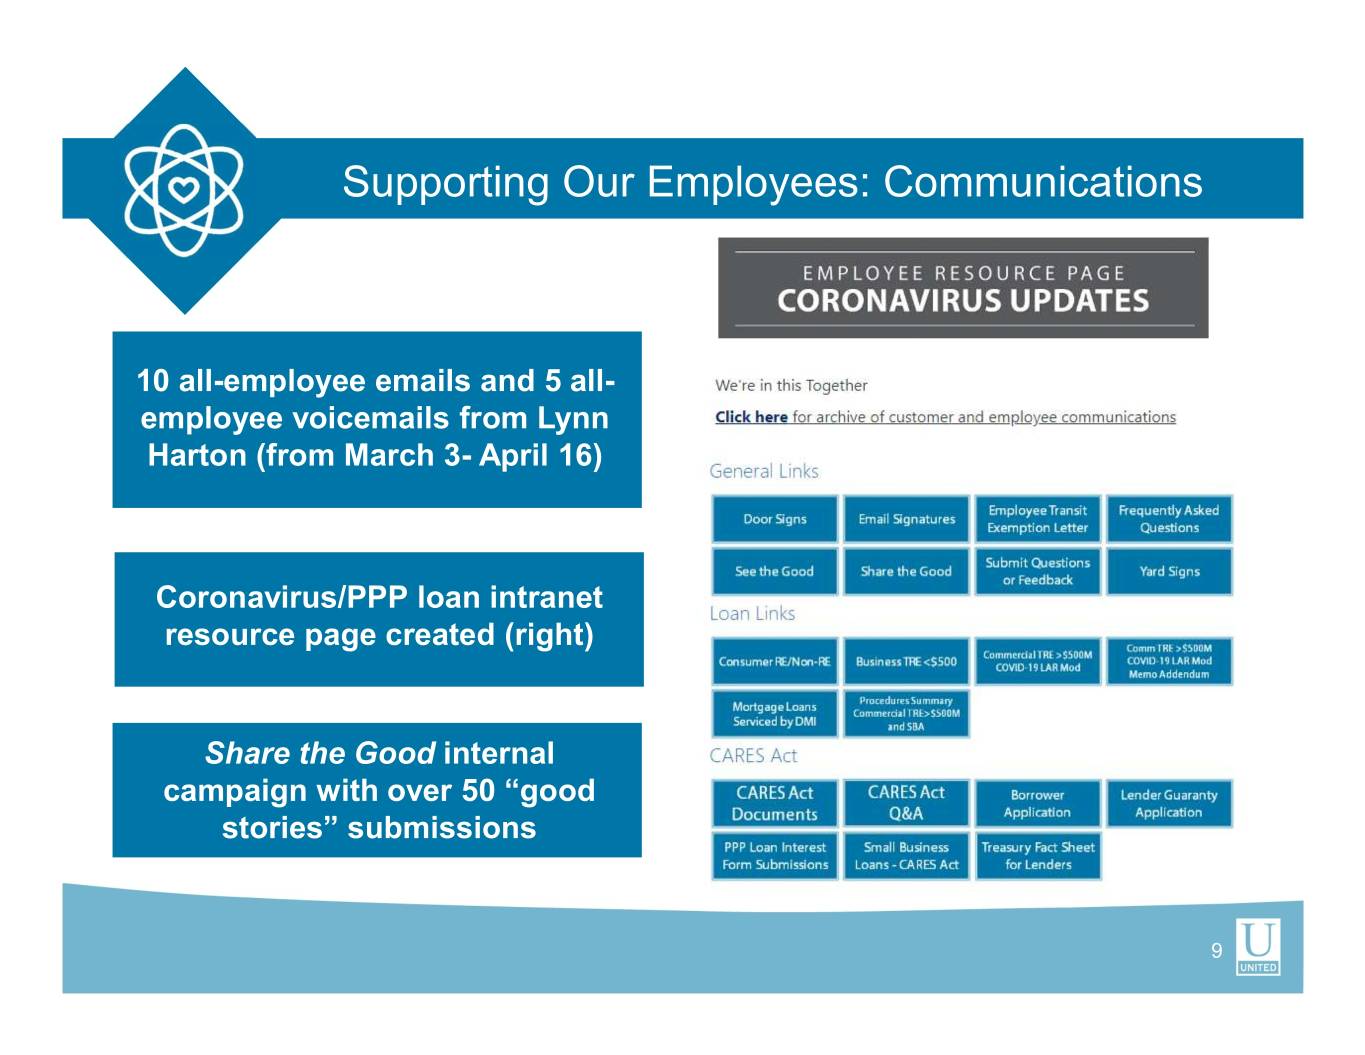
Supporting Our Employees: Communications 10 all-employee emails and 5 all- employee voicemails from Lynn Harton (from March 3- April 16) Coronavirus/PPP loan intranet resource page created (right) Share the Good internal campaign with over 50 “good stories” submissions 9
Pillars: Supporting Our Customers ! EMPLOYEES CUSTOMERS RISK 10
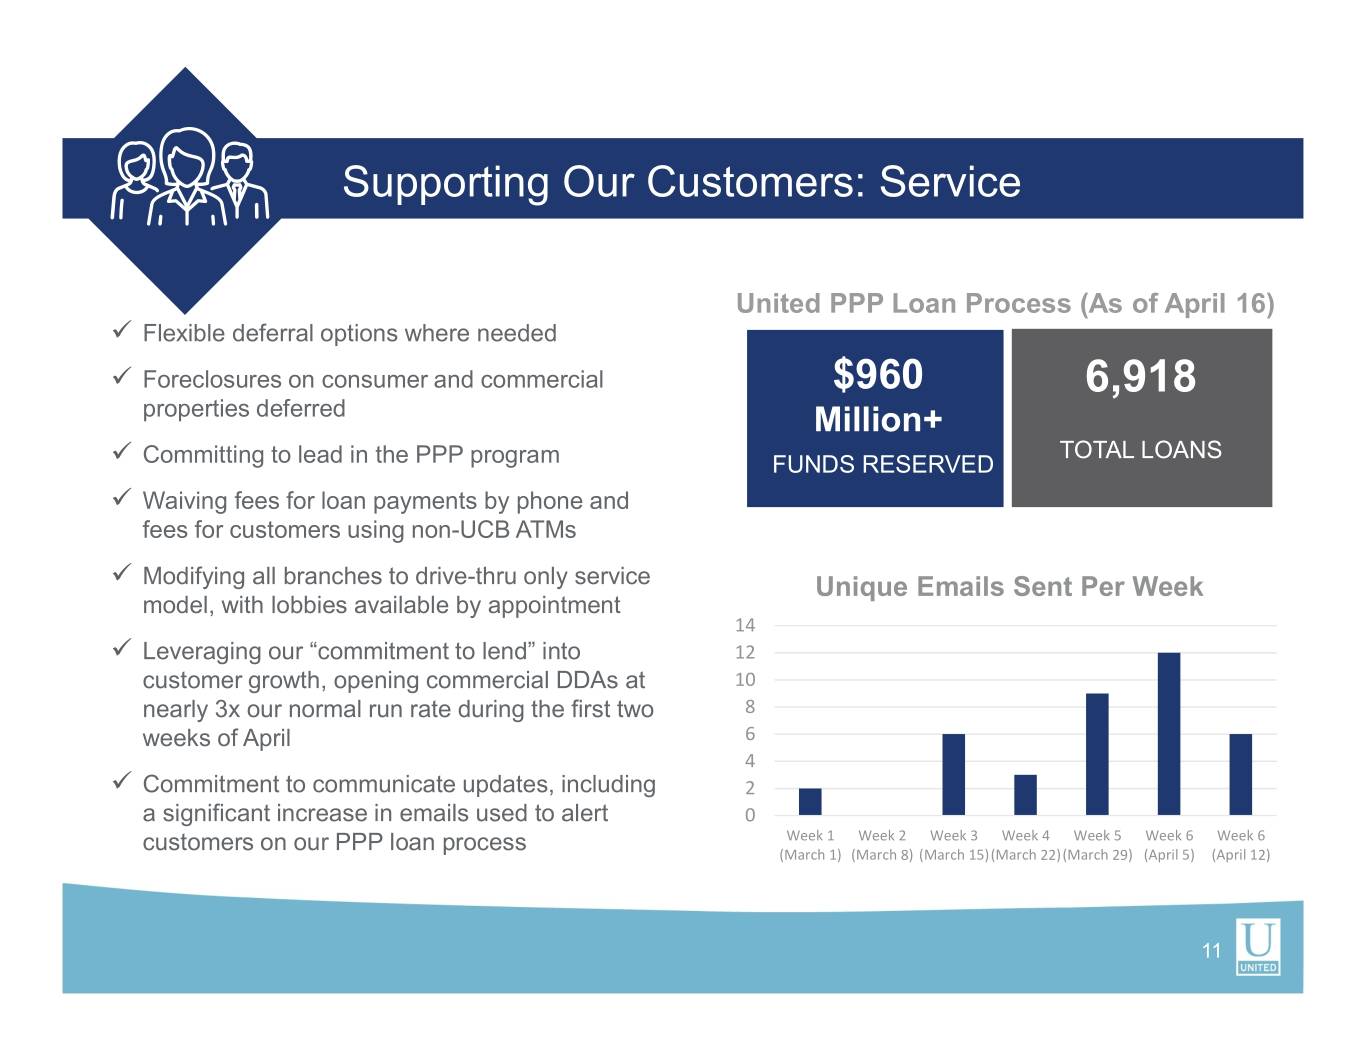
Supporting Our Customers: Service United PPP Loan Process (As of April 16) Flexible deferral options where needed Foreclosures on consumer and commercial $960 6,918 properties deferred Million+ TOTAL LOANS Committing to lead in the PPP program FUNDS RESERVED Waiving fees for loan payments by phone and fees for customers using non-UCB ATMs Modifying all branches to drive-thru only service Unique Emails Sent Per Week model, with lobbies available by appointment 14 Leveraging our “commitment to lend” into 12 customer growth, opening commercial DDAs at 10 nearly 3x our normal run rate during the first two 8 weeks of April 6 4 Commitment to communicate updates, including 2 a significant increase in emails used to alert 0 customers on our PPP loan process Week 1 Week 2 Week 3 Week 4 Week 5 Week 6 Week 6 (March 1) (March 8) (March 15)(March 22)(March 29) (April 5) (April 12) 11
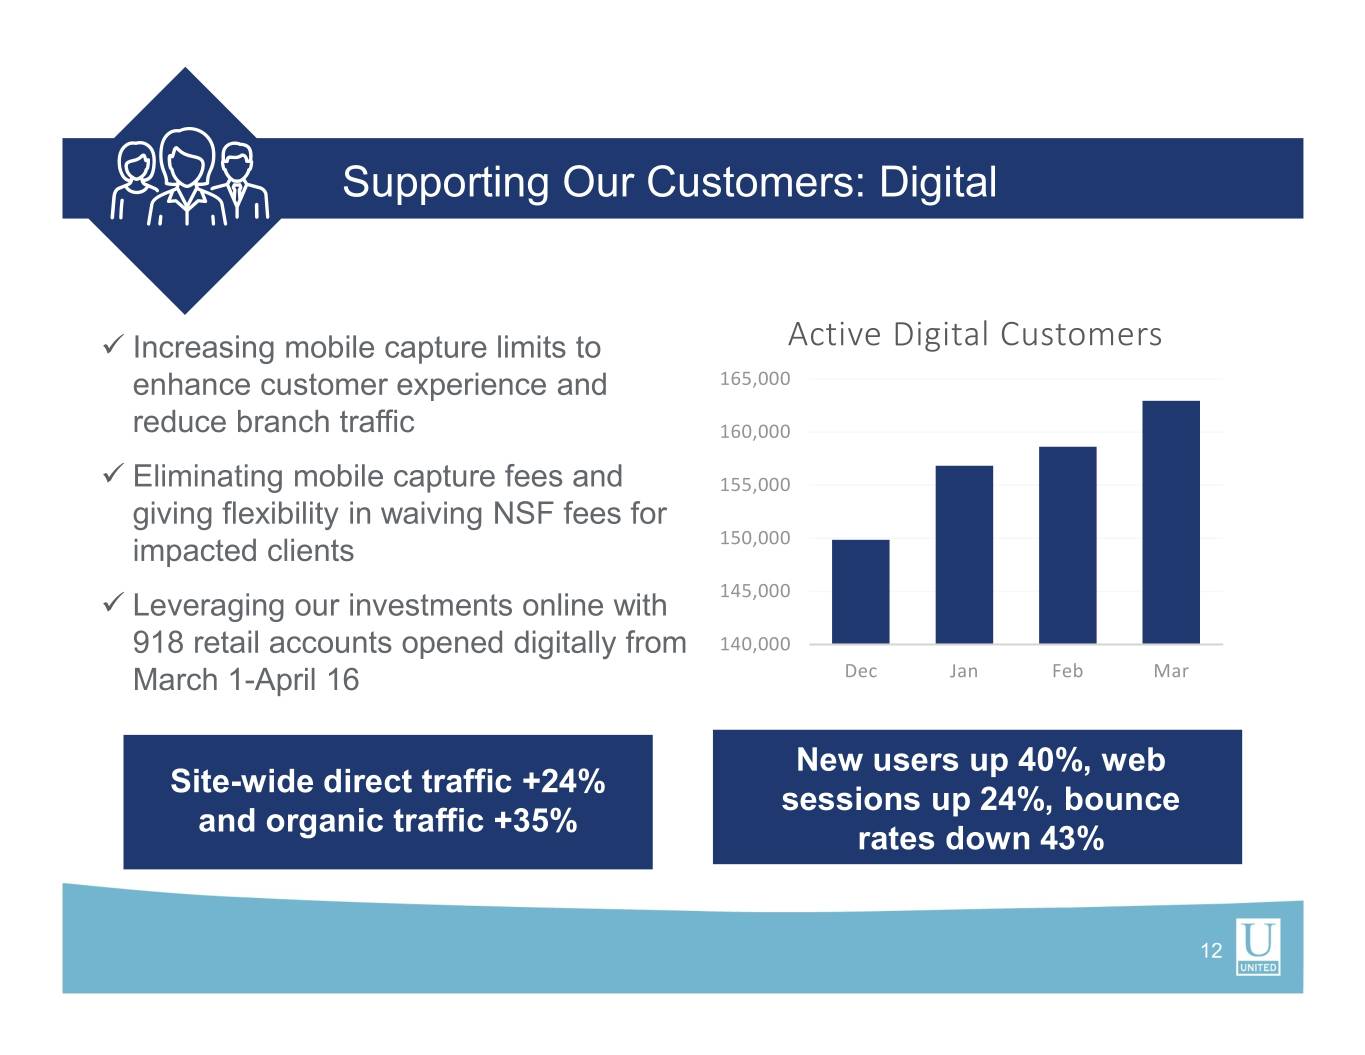
Supporting Our Customers: Digital Increasing mobile capture limits to Active Digital Customers enhance customer experience and 165,000 reduce branch traffic 160,000 Eliminating mobile capture fees and 155,000 giving flexibility in waiving NSF fees for impacted clients 150,000 Leveraging our investments online with 145,000 918 retail accounts opened digitally from 140,000 March 1-April 16 Dec Jan Feb Mar New users up 40%, web Site-wide direct traffic +24% sessions up 24%, bounce and organic traffic +35% rates down 43% 12
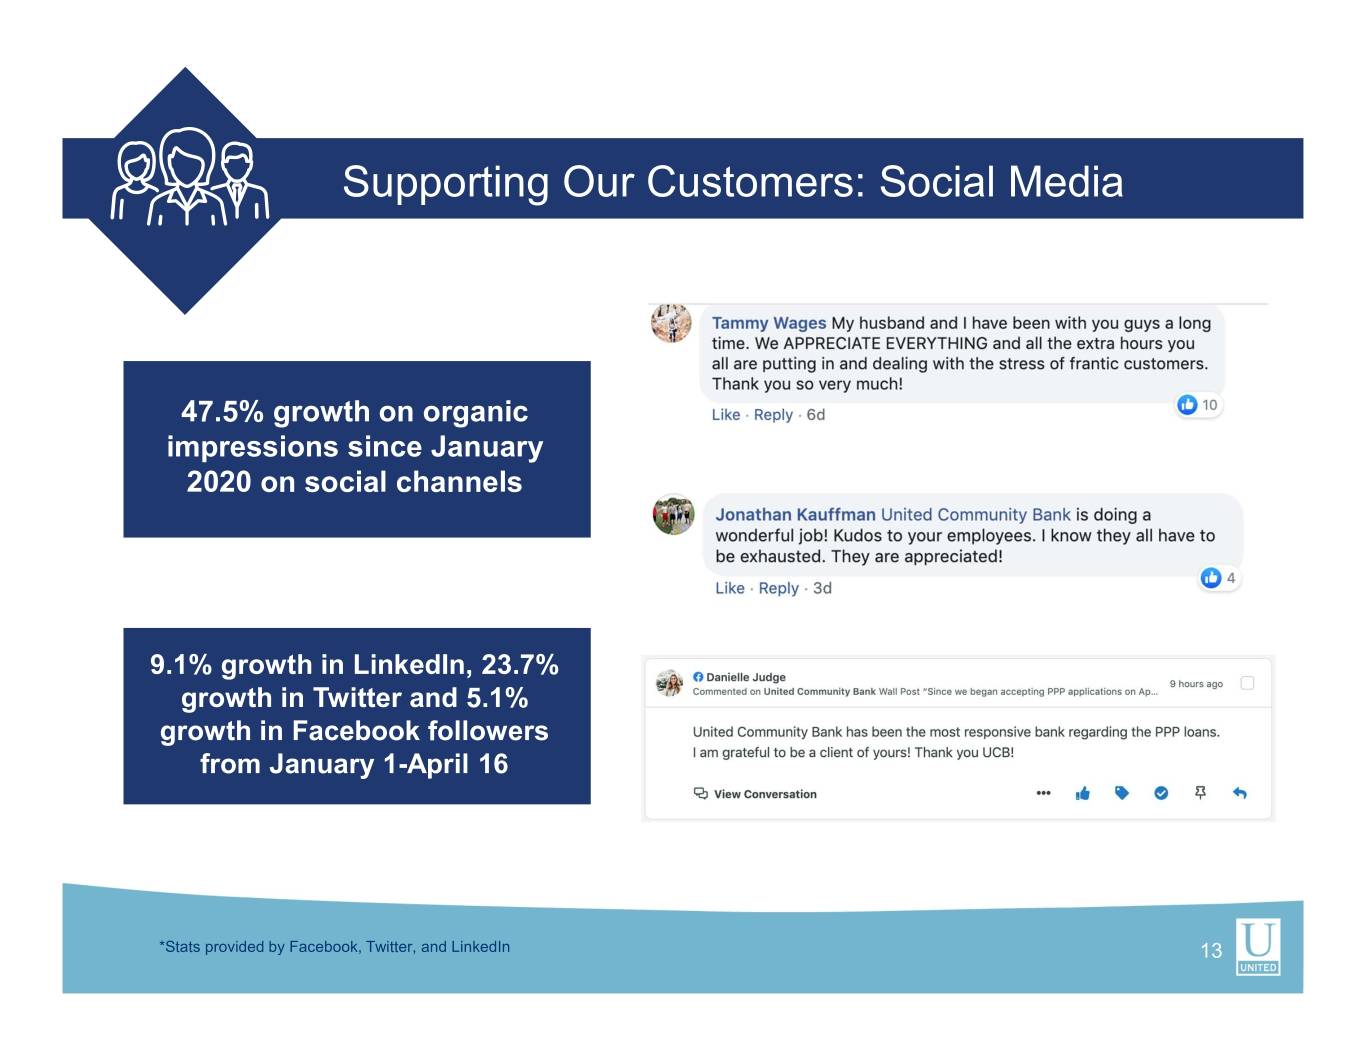
Supporting Our Customers: Social Media 47.5% growth on organic impressions since January 2020 on social channels 9.1% growth in LinkedIn, 23.7% growth in Twitter and 5.1% growth in Facebook followers from January 1-April 16 Site-wide direct traffic +20% and organic traffic +25% *Stats provided by Facebook, Twitter, and LinkedIn 13
Pillars: Managing Our Risk ! EMPLOYEES CUSTOMERS RISK 14
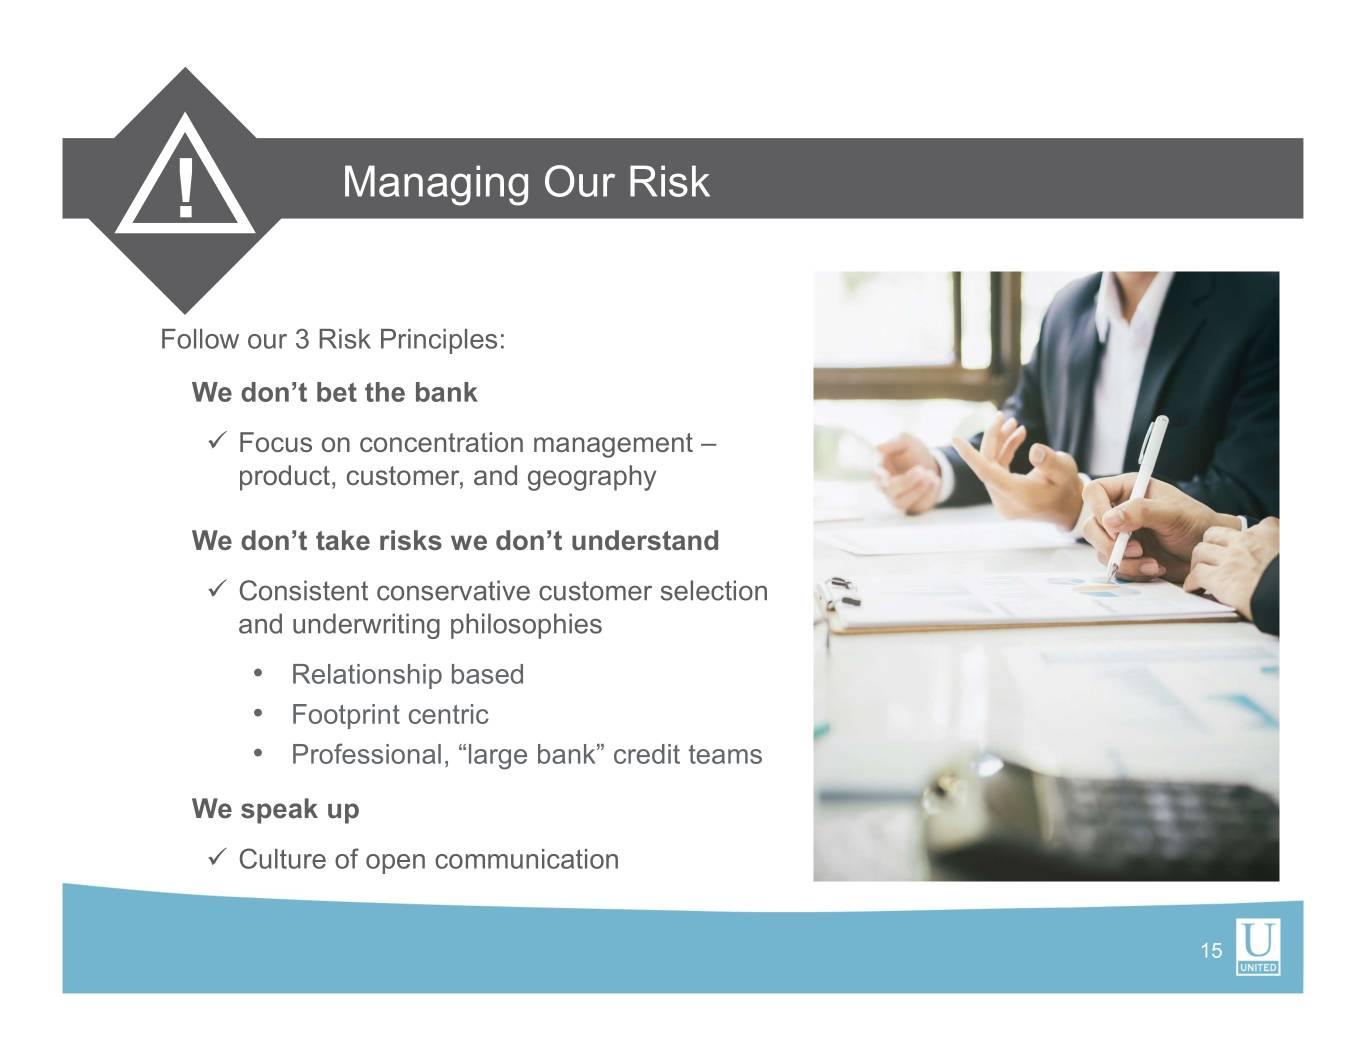
! Managing Our Risk Follow our 3 Risk Principles: We don’t bet the bank Focus on concentration management – product, customer, and geography We don’t take risks we don’t understand Consistent conservative customer selection and underwriting philosophies • Relationship based • Footprint centric • Professional, “large bank” credit teams We speak up Culture of open communication 15
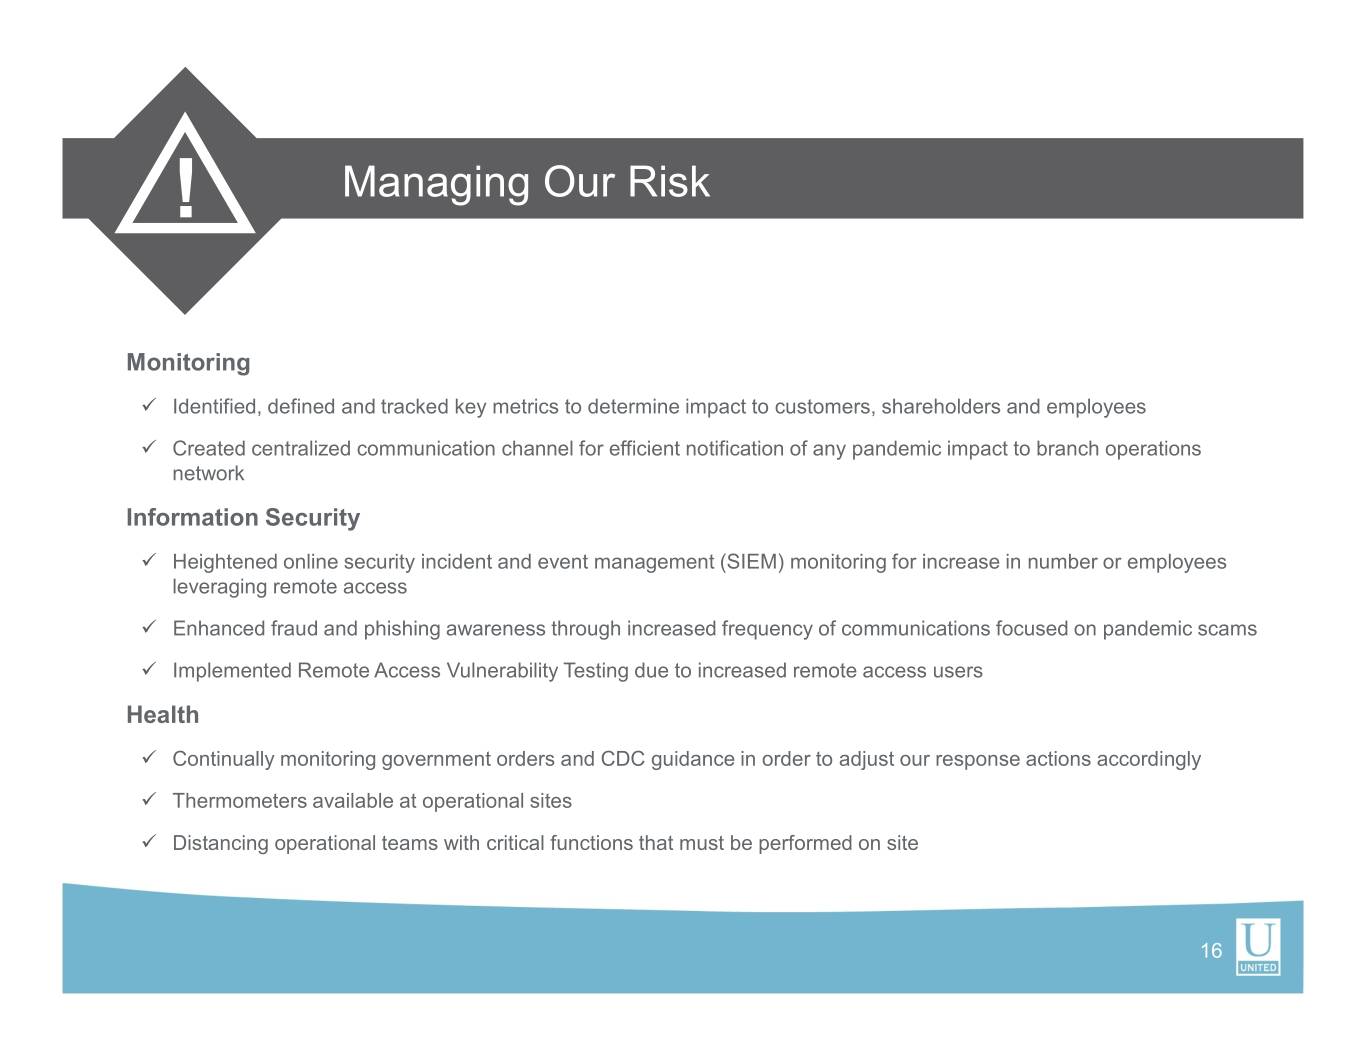
! Managing Our Risk Monitoring Identified, defined and tracked key metrics to determine impact to customers, shareholders and employees Created centralized communication channel for efficient notification of any pandemic impact to branch operations network Information Security Heightened online security incident and event management (SIEM) monitoring for increase in number or employees leveraging remote access Enhanced fraud and phishing awareness through increased frequency of communications focused on pandemic scams Implemented Remote Access Vulnerability Testing due to increased remote access users Health Continually monitoring government orders and CDC guidance in order to adjust our response actions accordingly Thermometers available at operational sites Distancing operational teams with critical functions that must be performed on site 16
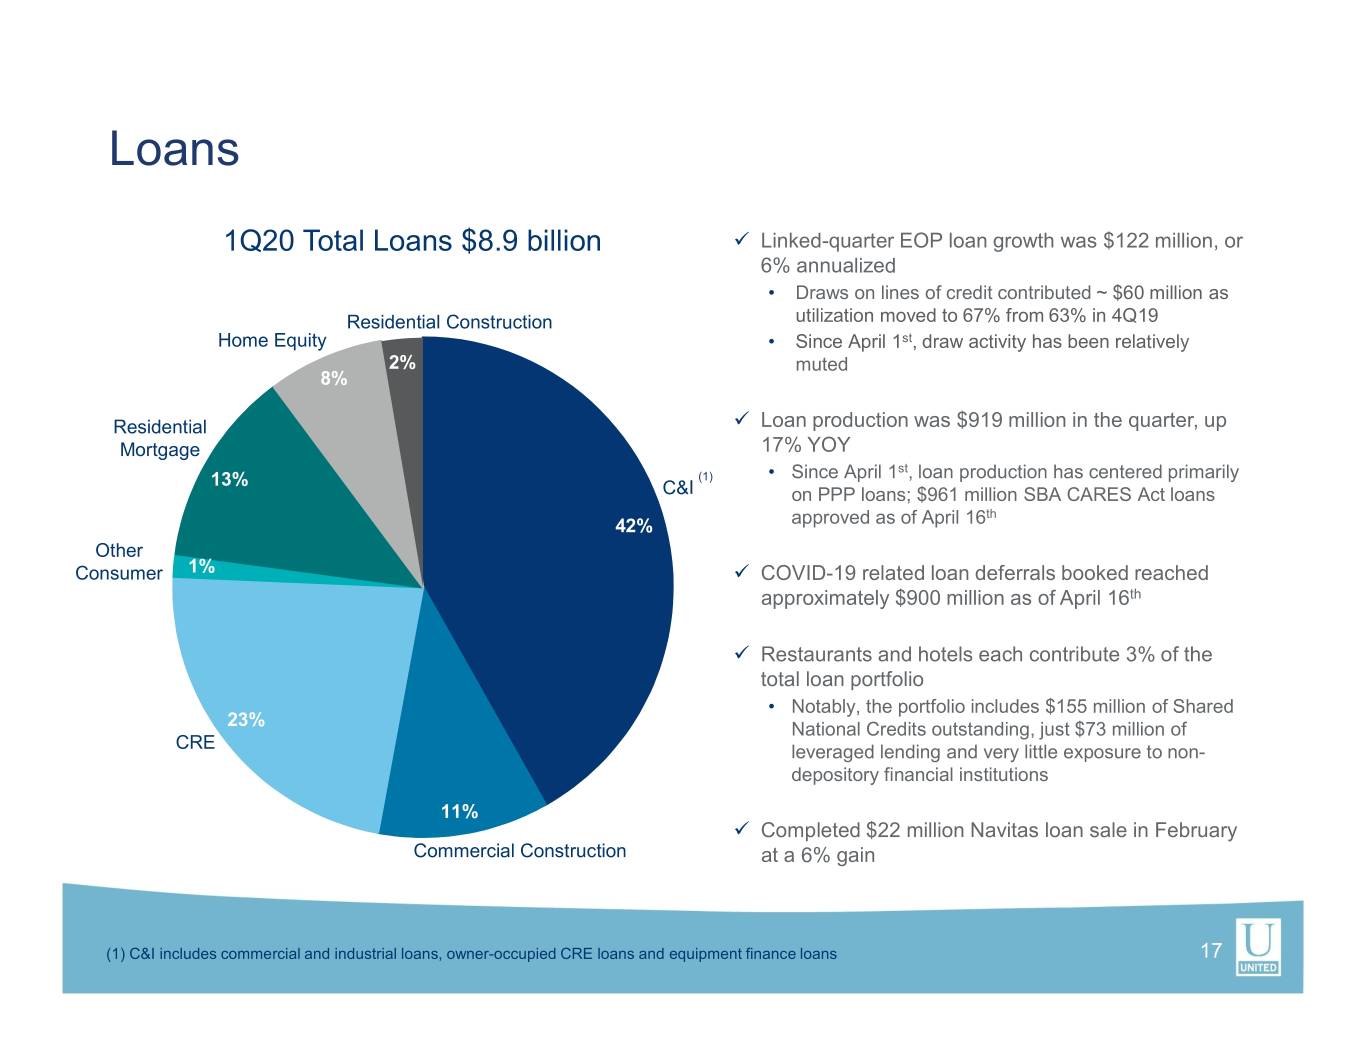
Loans 1Q20 Total Loans $8.9 billion Linked-quarter EOP loan growth was $122 million, or 6% annualized • Draws on lines of credit contributed ~ $60 million as Residential Construction utilization moved to 67% from 63% in 4Q19 Home Equity • Since April 1st, draw activity has been relatively 2% muted 8% Residential Loan production was $919 million in the quarter, up Mortgage 17% YOY st 13% (1) • Since April 1 , loan production has centered primarily C&I on PPP loans; $961 million SBA CARES Act loans th 42% approved as of April 16 Other Consumer 1% COVID-19 related loan deferrals booked reached approximately $900 million as of April 16th Restaurants and hotels each contribute 3% of the total loan portfolio • Notably, the portfolio includes $155 million of Shared 23% National Credits outstanding, just $73 million of CRE leveraged lending and very little exposure to non- depository financial institutions 11% Completed $22 million Navitas loan sale in February Commercial Construction at a 6% gain (1) C&I includes commercial and industrial loans, owner-occupied CRE loans and equipment finance loans 17
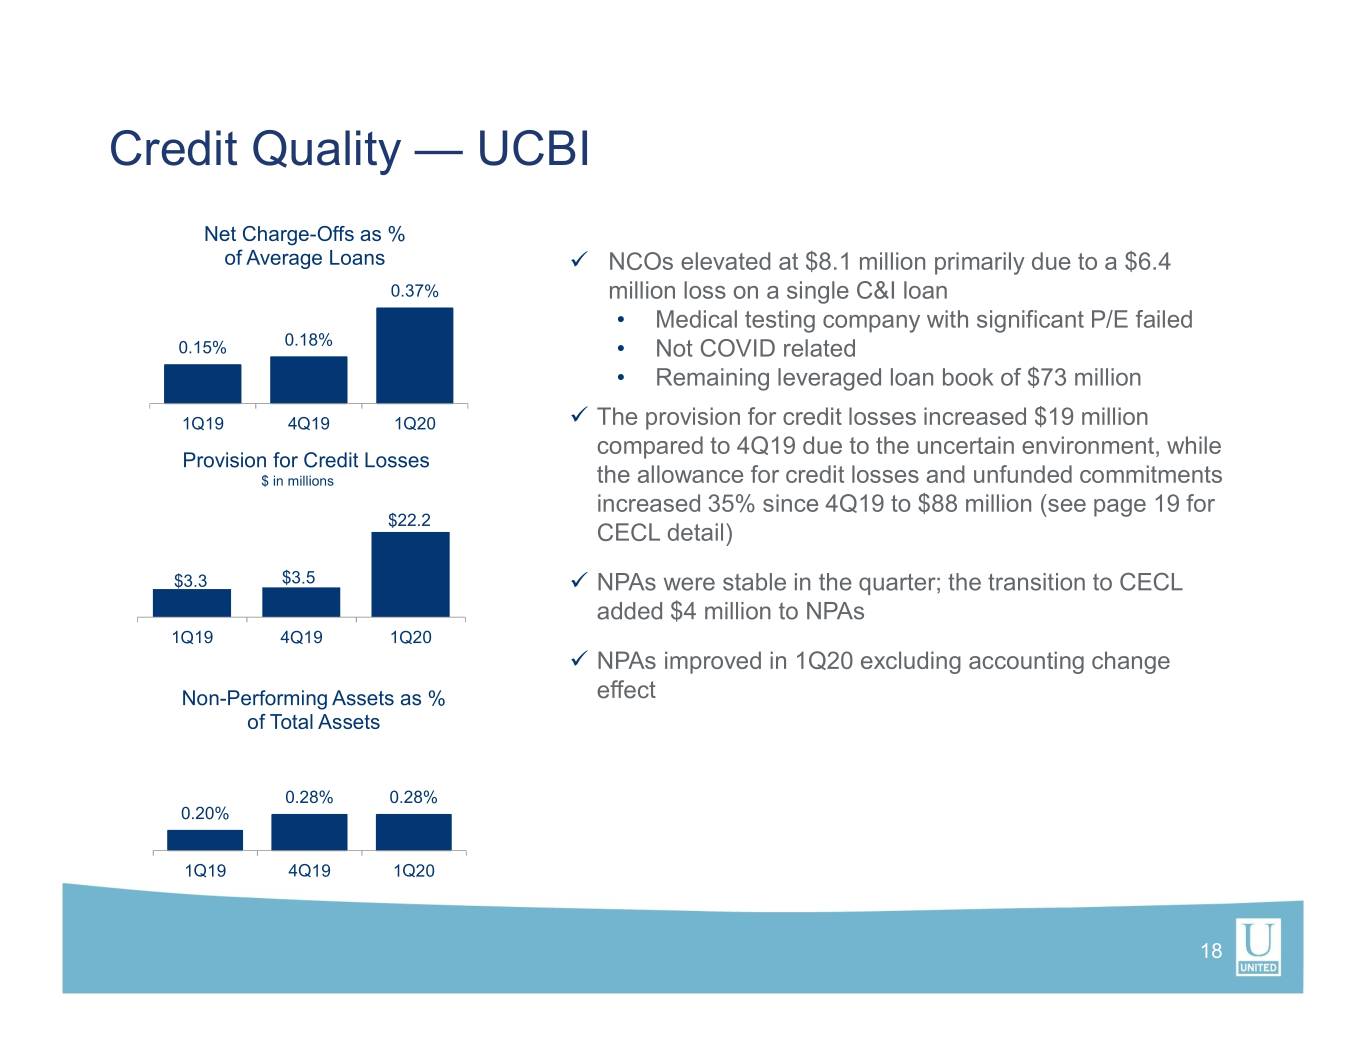
Credit Quality — UCBI Net Charge-Offs as % of Average Loans NCOs elevated at $8.1 million primarily due to a $6.4 0.37% million loss on a single C&I loan • Medical testing company with significant P/E failed 0.15% 0.18% • Not COVID related • Remaining leveraged loan book of $73 million 1Q19 4Q19 1Q20 The provision for credit losses increased $19 million compared to 4Q19 due to the uncertain environment, while Provision for Credit Losses $ in millions the allowance for credit losses and unfunded commitments increased 35% since 4Q19 to $88 million (see page 19 for $22.2 CECL detail) $3.3 $3.5 NPAs were stable in the quarter; the transition to CECL added $4 million to NPAs 1Q19 4Q19 1Q20 NPAs improved in 1Q20 excluding accounting change Non-Performing Assets as % effect of Total Assets 0.28% 0.28% 0.20% 1Q19 4Q19 1Q20 18
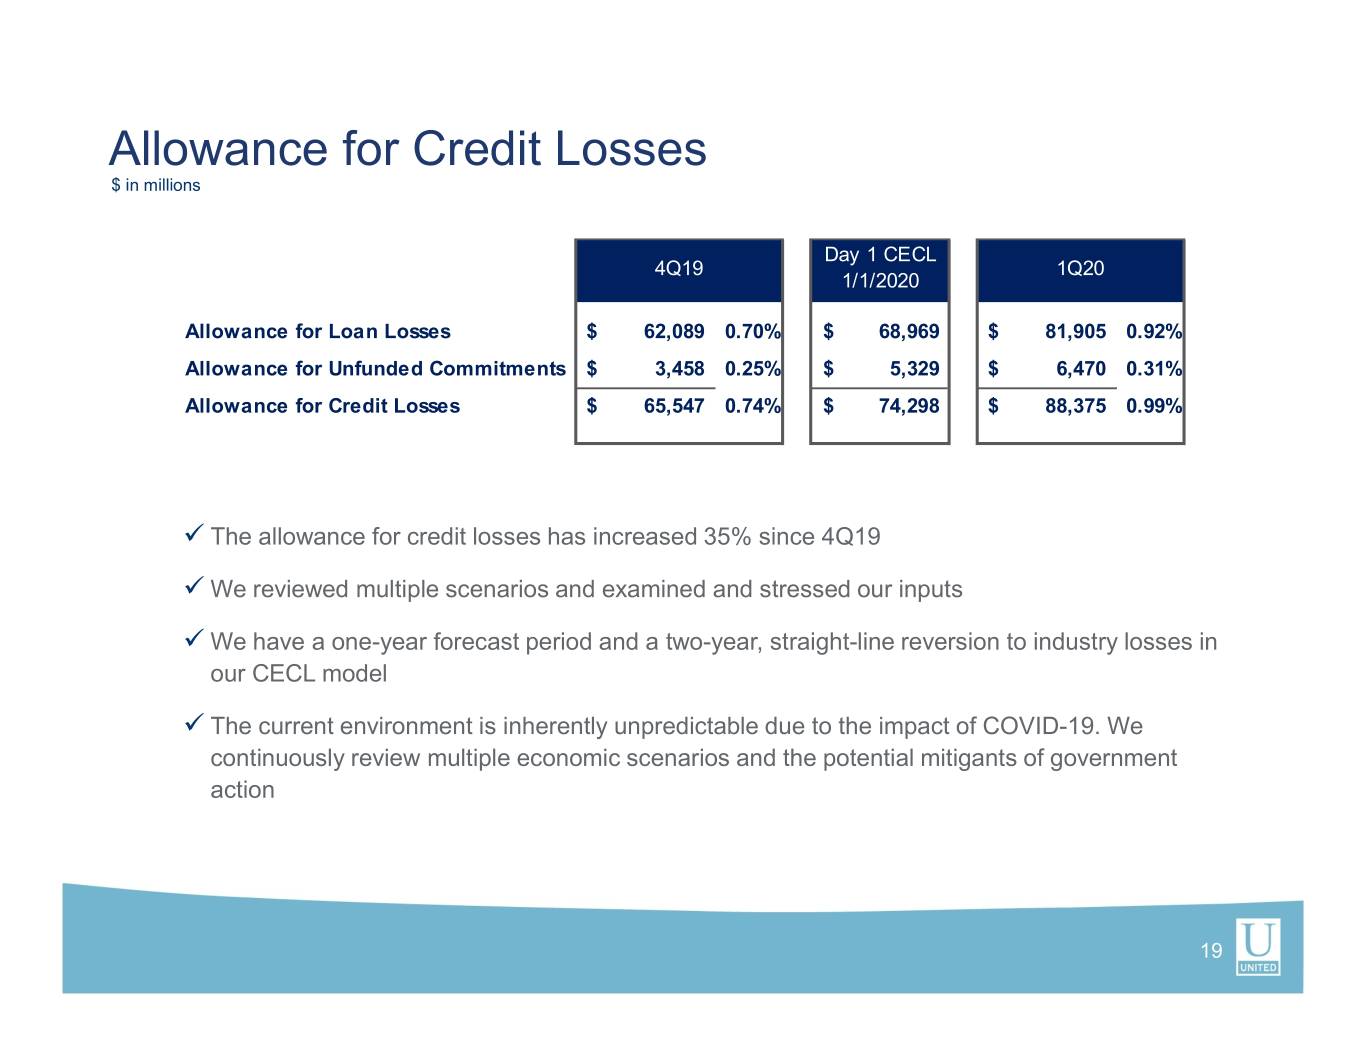
Allowance for Credit Losses $ in millions Day 1 CECL 4Q19 1Q20 1/1/2020 Allowance for Loan Losses$ 62,089 0.70%$ 68,969 $ 81,905 0.92% Allowance for Unfunded Commitments$ 3,458 0.25%$ 5,329 $ 6,470 0.31% Allowance for Credit Losses$ 65,547 0.74%$ 74,298 $ 88,375 0.99% The allowance for credit losses has increased 35% since 4Q19 We reviewed multiple scenarios and examined and stressed our inputs We have a one-year forecast period and a two-year, straight-line reversion to industry losses in our CECL model The current environment is inherently unpredictable due to the impact of COVID-19. We continuously review multiple economic scenarios and the potential mitigants of government action 19
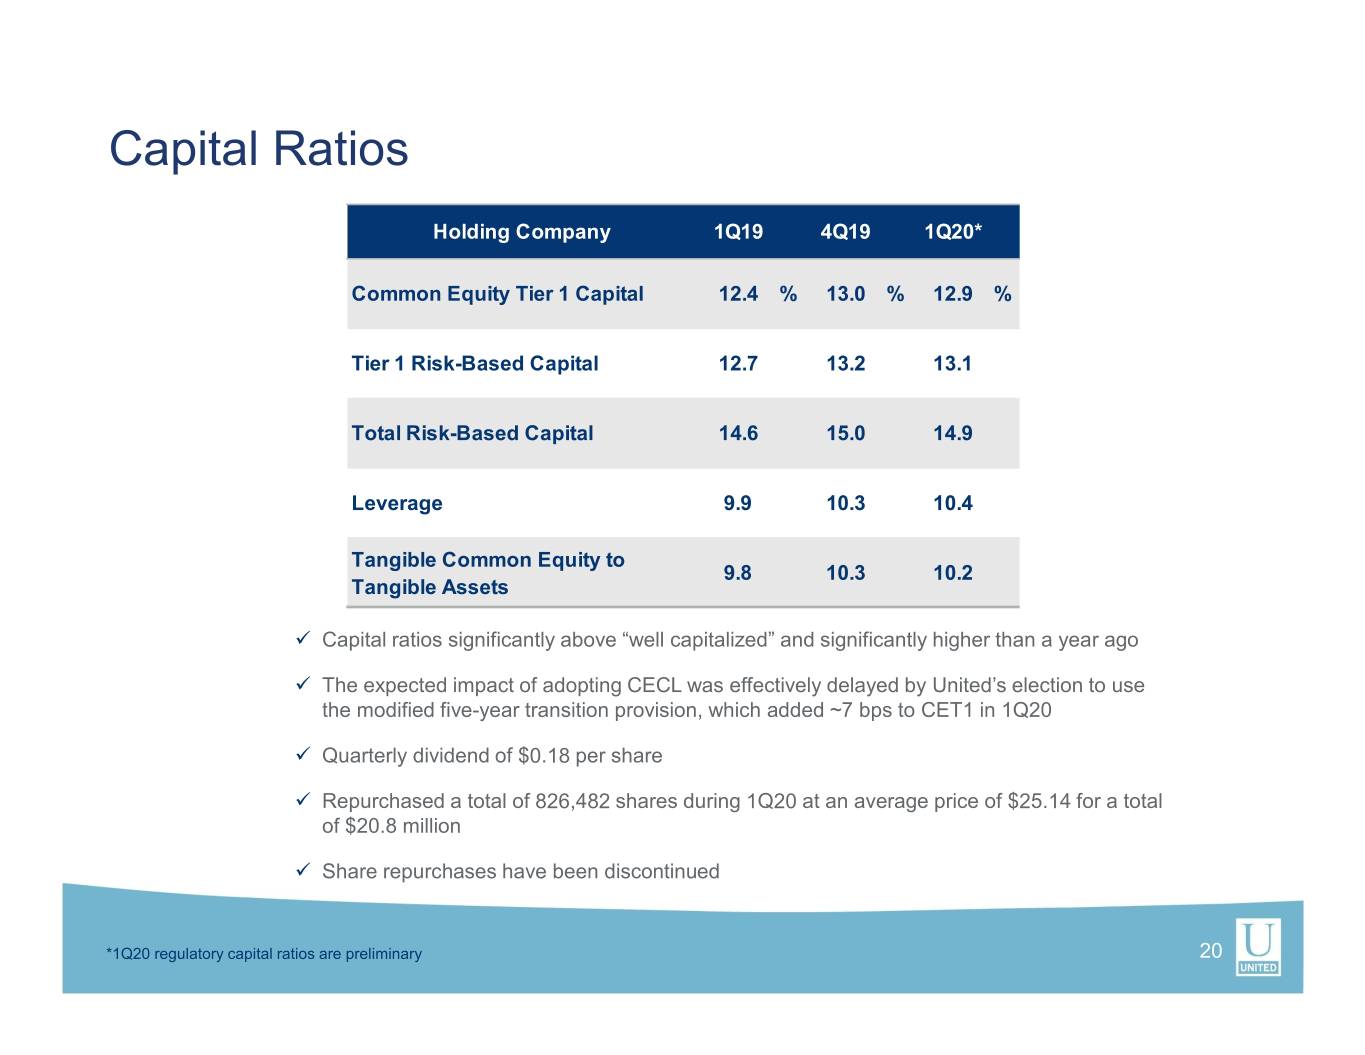
Capital Ratios Holding Company 1Q19 4Q19 1Q20* Common Equity Tier 1 Capital 12.4 % 13.0 % 12.9 % Tier 1 Risk-Based Capital 12.7 13.2 13.1 Total Risk-Based Capital 14.6 15.0 14.9 Leverage 9.9 10.3 10.4 Tangible Common Equity to 9.8 10.3 10.2 Tangible Assets Capital ratios significantly above “well capitalized” and significantly higher than a year ago The expected impact of adopting CECL was effectively delayed by United’s election to use the modified five-year transition provision, which added ~7 bps to CET1 in 1Q20 Quarterly dividend of $0.18 per share Repurchased a total of 826,482 shares during 1Q20 at an average price of $25.14 for a total of $20.8 million Share repurchases have been discontinued *1Q20 regulatory capital ratios are preliminary 20
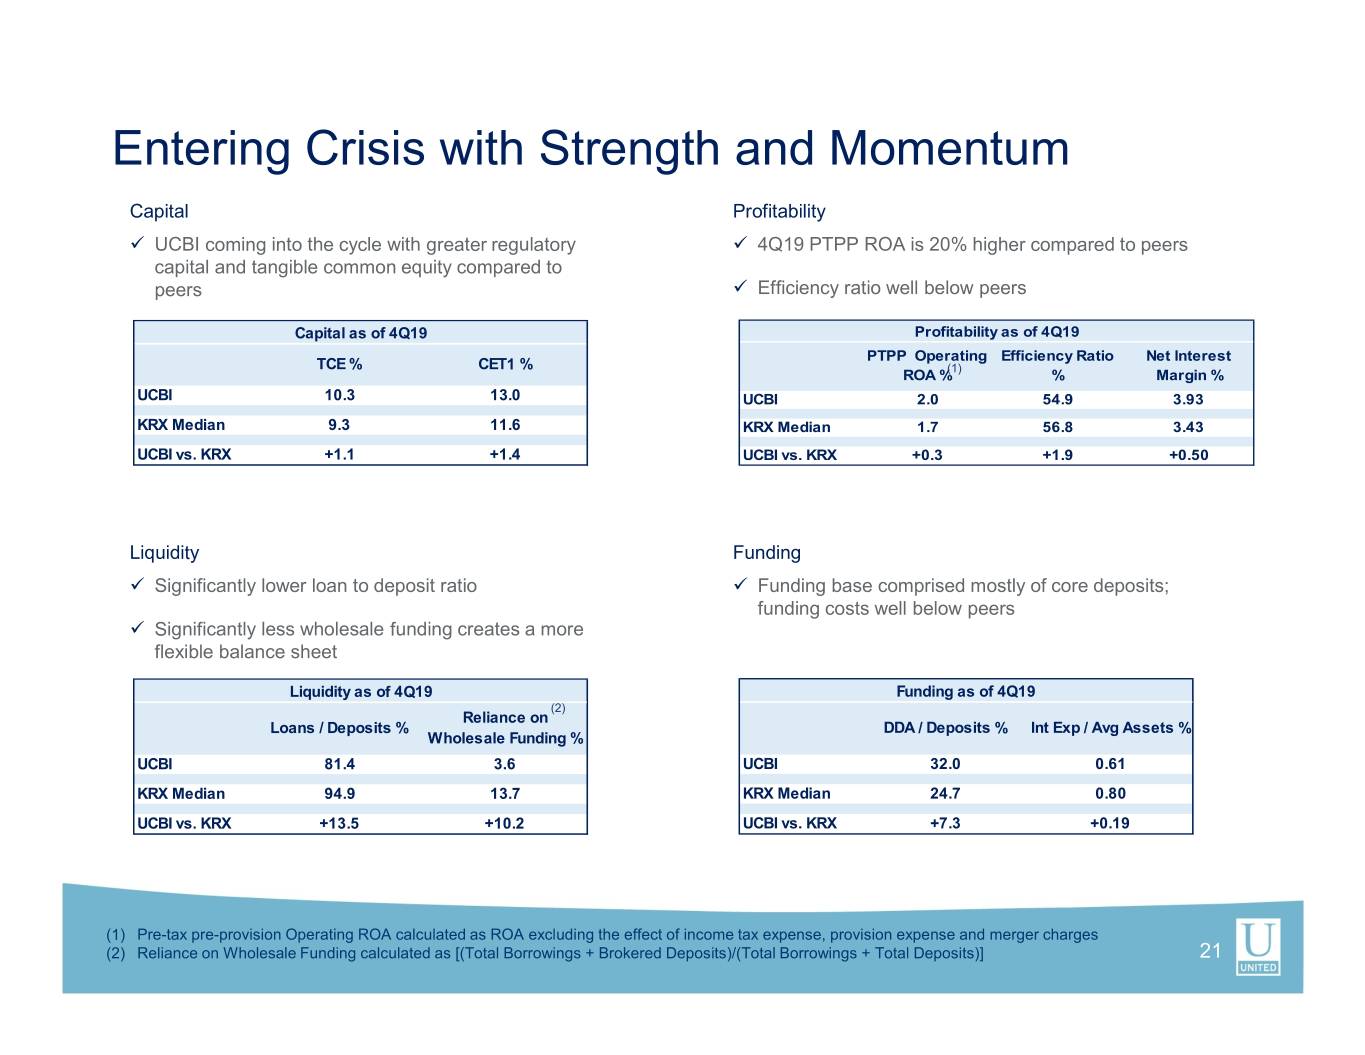
Entering Crisis with Strength and Momentum Capital Profitability UCBI coming into the cycle with greater regulatory 4Q19 PTPP ROA is 20% higher compared to peers capital and tangible common equity compared to peers Efficiency ratio well below peers Capital as of 4Q19 Profitability as of 4Q19 PTPP Operating Efficiency Ratio Net Interest TCE % CET1 % ROA %(1) % Margin % UCBI 10.3 13.0 UCBI 2.0 54.9 3.93 KRX Median 9.3 11.6 KRX Median 1.7 56.8 3.43 UCBI vs. KRX +1.1 +1.4 UCBI vs. KRX +0.3 +1.9 +0.50 Liquidity Funding Significantly lower loan to deposit ratio Funding base comprised mostly of core deposits; funding costs well below peers Significantly less wholesale funding creates a more flexible balance sheet Liquidity as of 4Q19 Funding as of 4Q19 (2) Reliance on Loans / Deposits % DDA / Deposits % Int Exp / Avg Assets % Wholesale Funding % UCBI 81.4 3.6 UCBI 32.0 0.61 KRX Median 94.9 13.7 KRX Median 24.7 0.80 UCBI vs. KRX +13.5 +10.2 UCBI vs. KRX +7.3 +0.19 (1) Pre-tax pre-provision Operating ROA calculated as ROA excluding the effect of income tax expense, provision expense and merger charges (2) Reliance on Wholesale Funding calculated as [(Total Borrowings + Brokered Deposits)/(Total Borrowings + Total Deposits)] 21
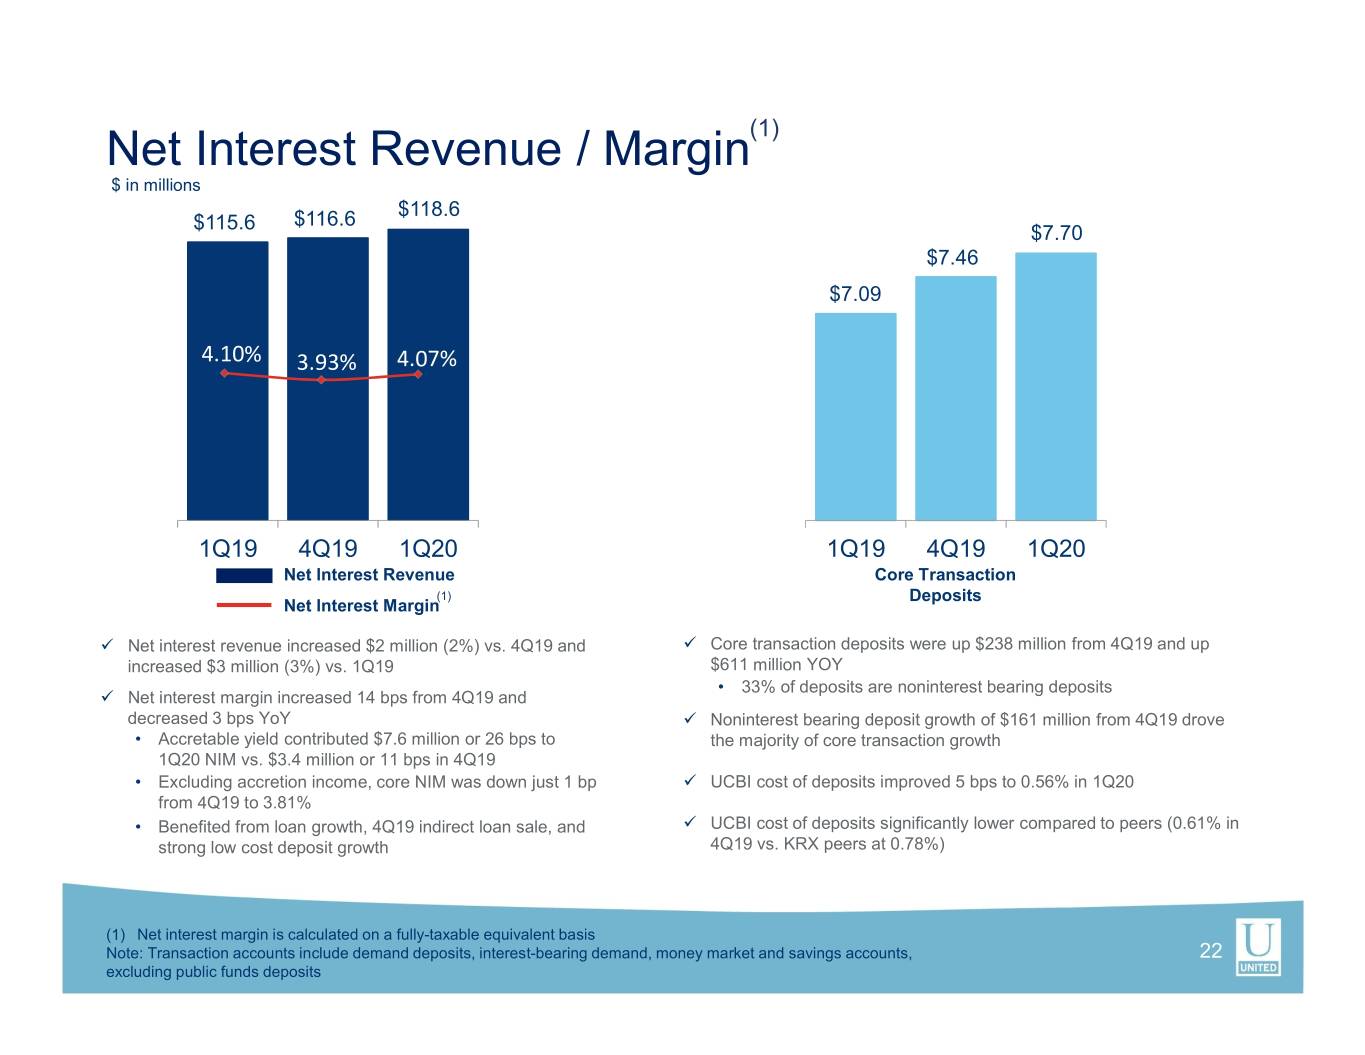
Net Interest Revenue / Margin(1) $ in millions $118.6 $115.6 $116.6 $7.70 $7.46 $7.09 4.10% 3.93% 4.07% 1Q19 4Q19 1Q20 1Q19 4Q19 1Q20 Net Interest Revenue Core Transaction (1) Deposits Net Interest Margin Net interest revenue increased $2 million (2%) vs. 4Q19 and Core transaction deposits were up $238 million from 4Q19 and up increased $3 million (3%) vs. 1Q19 $611 million YOY • 33% of deposits are noninterest bearing deposits Net interest margin increased 14 bps from 4Q19 and decreased 3 bps YoY Noninterest bearing deposit growth of $161 million from 4Q19 drove • Accretable yield contributed $7.6 million or 26 bps to the majority of core transaction growth 1Q20 NIM vs. $3.4 million or 11 bps in 4Q19 • Excluding accretion income, core NIM was down just 1 bp UCBI cost of deposits improved 5 bps to 0.56% in 1Q20 from 4Q19 to 3.81% • Benefited from loan growth, 4Q19 indirect loan sale, and UCBI cost of deposits significantly lower compared to peers (0.61% in strong low cost deposit growth 4Q19 vs. KRX peers at 0.78%) (1) Net interest margin is calculated on a fully-taxable equivalent basis Note: Transaction accounts include demand deposits, interest-bearing demand, money market and savings accounts, 22 excluding public funds deposits
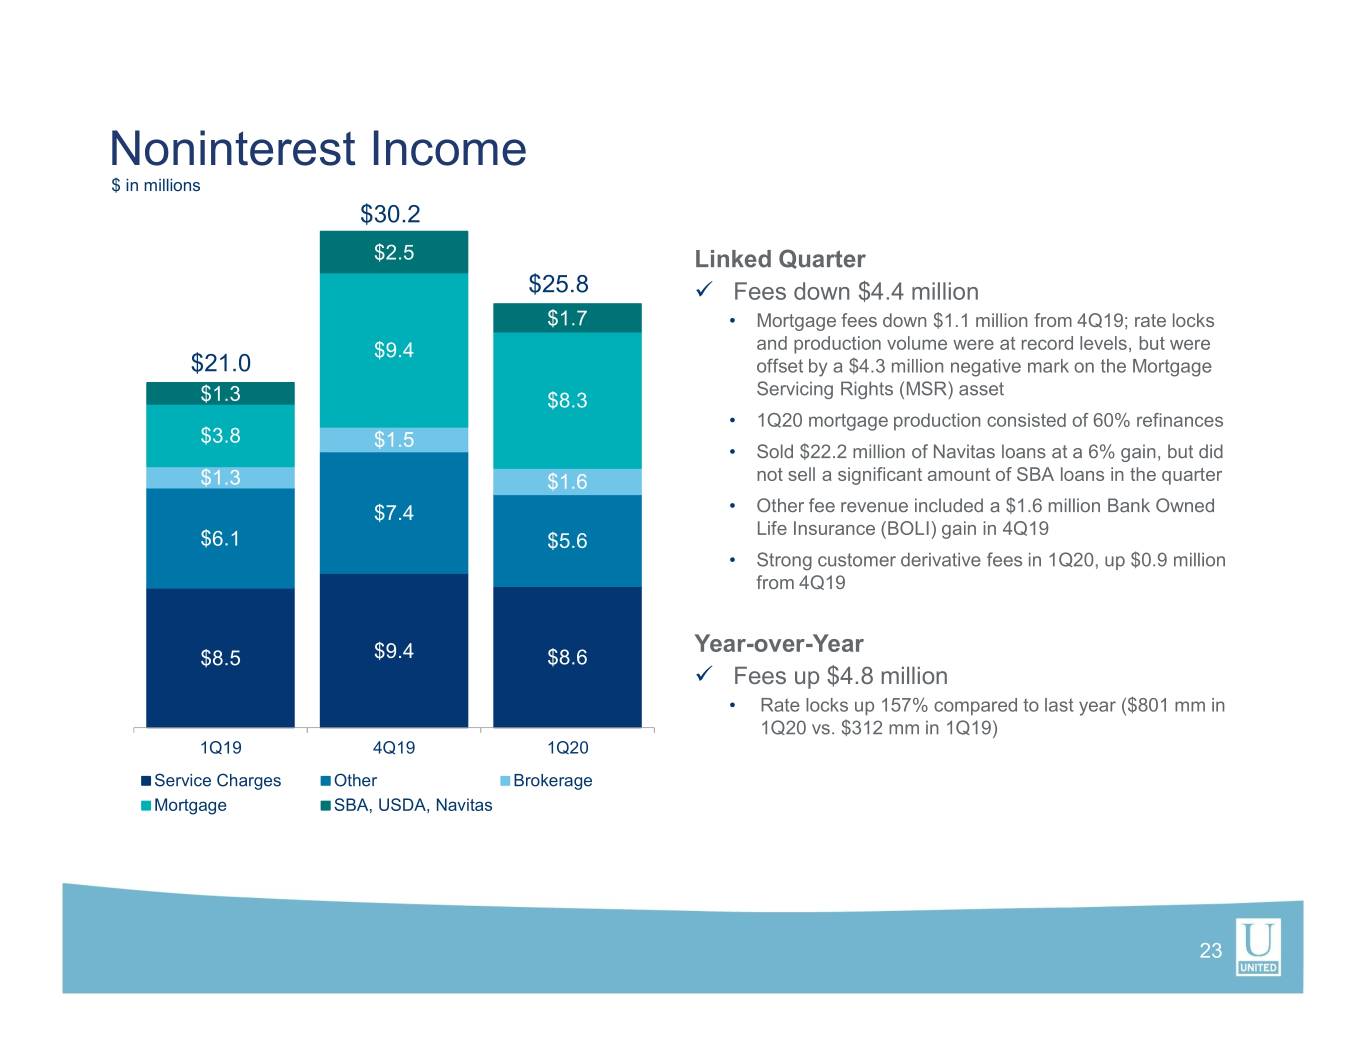
Noninterest Income $ in millions $30.2 $2.5 Linked Quarter $25.8 Fees down $4.4 million $1.7 • Mortgage fees down $1.1 million from 4Q19; rate locks $9.4 and production volume were at record levels, but were $21.0 offset by a $4.3 million negative mark on the Mortgage Servicing Rights (MSR) asset $1.3 $8.3 • 1Q20 mortgage production consisted of 60% refinances $3.8 $1.5 • Sold $22.2 million of Navitas loans at a 6% gain, but did $1.3 $1.6 not sell a significant amount of SBA loans in the quarter $7.4 • Other fee revenue included a $1.6 million Bank Owned Life Insurance (BOLI) gain in 4Q19 $6.1 $5.6 • Strong customer derivative fees in 1Q20, up $0.9 million from 4Q19 Year-over-Year $8.5 $9.4 $8.6 Fees up $4.8 million • Rate locks up 157% compared to last year ($801 mm in 1Q20 vs. $312 mm in 1Q19) 1Q19 4Q19 1Q20 Service Charges Other Brokerage Mortgage SBA, USDA, Navitas 23
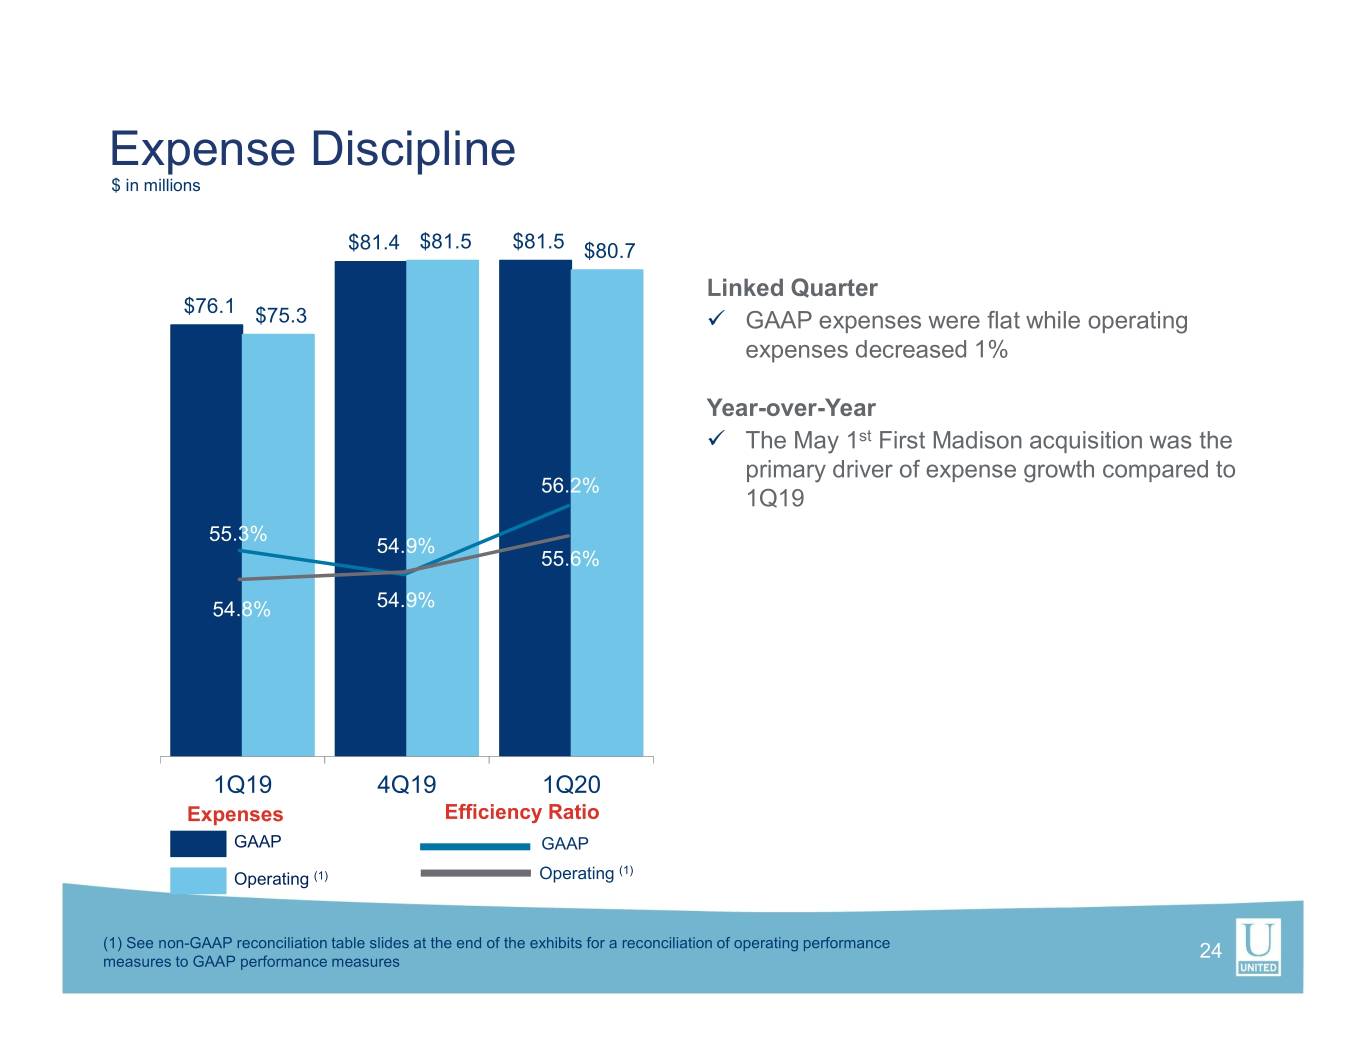
Expense Discipline $ in millions $81.4 $81.5 $81.5 $80.7 Linked Quarter $76.1 $75.3 GAAP expenses were flat while operating expenses decreased 1% Year-over-Year The May 1st First Madison acquisition was the primary driver of expense growth compared to 56.2% 1Q19 55.3% 54.9% 55.6% 54.8% 54.9% 1Q19 4Q19 1Q20 Expenses Efficiency Ratio GAAP GAAP (1) Operating (1) Operating (1) See non-GAAP reconciliation table slides at the end of the exhibits for a reconciliation of operating performance 24 measures to GAAP performance measures
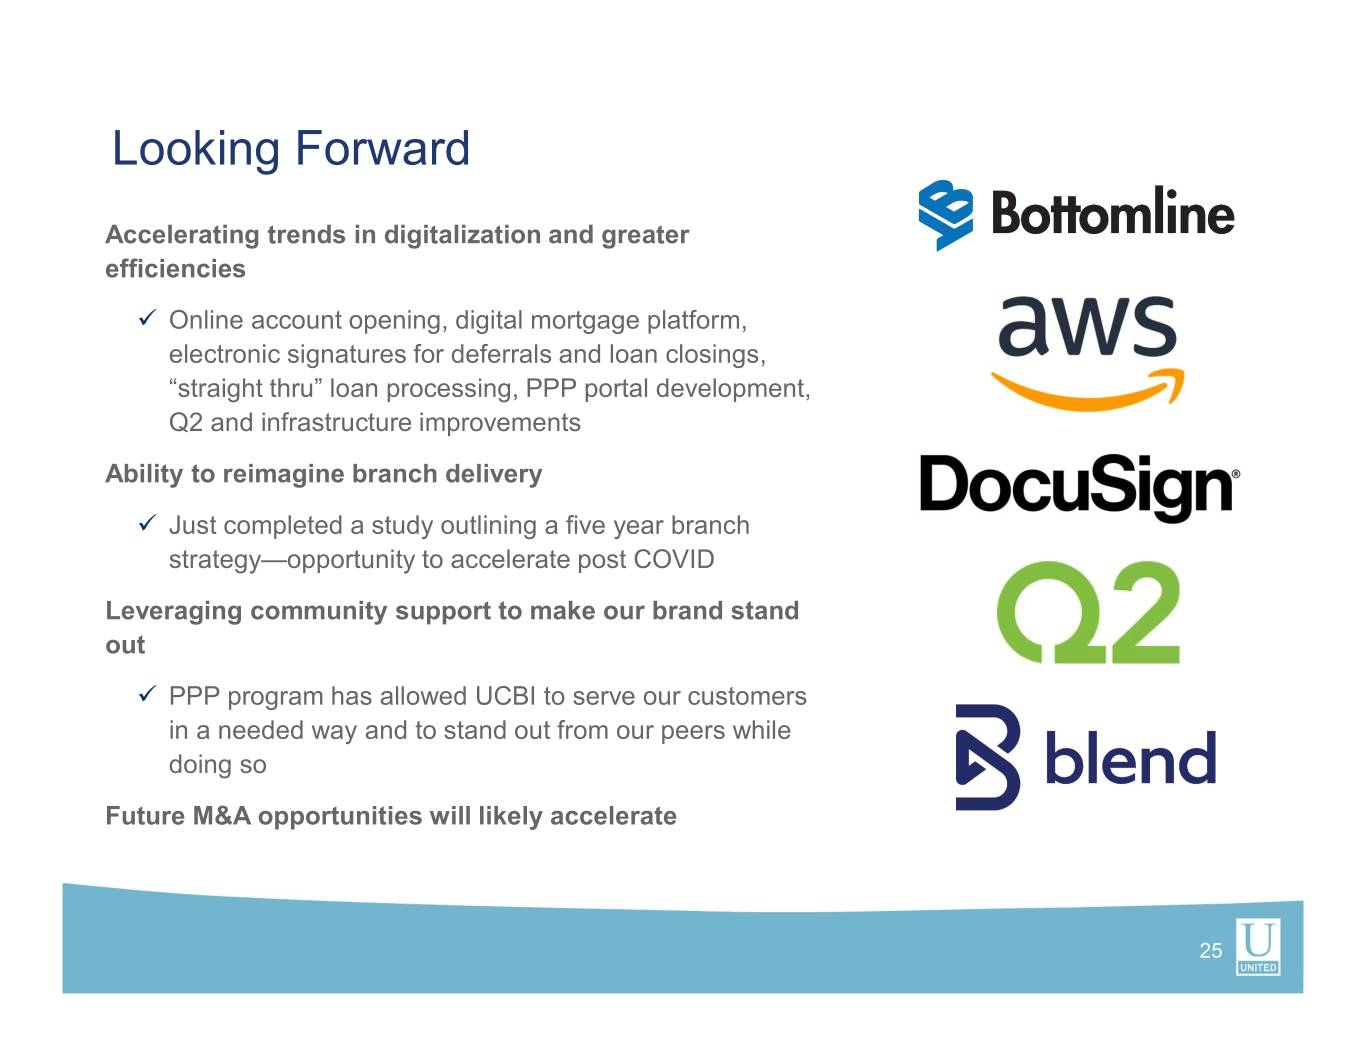
Looking Forward Accelerating trends in digitalization and greater efficiencies Online account opening, digital mortgage platform, electronic signatures for deferrals and loan closings, “straight thru” loan processing, PPP portal development, Q2 and infrastructure improvements Ability to reimagine branch delivery Just completed a study outlining a five year branch strategy—opportunity to accelerate post COVID Leveraging community support to make our brand stand out PPP program has allowed UCBI to serve our customers in a needed way and to stand out from our peers while doing so Future M&A opportunities will likely accelerate 25
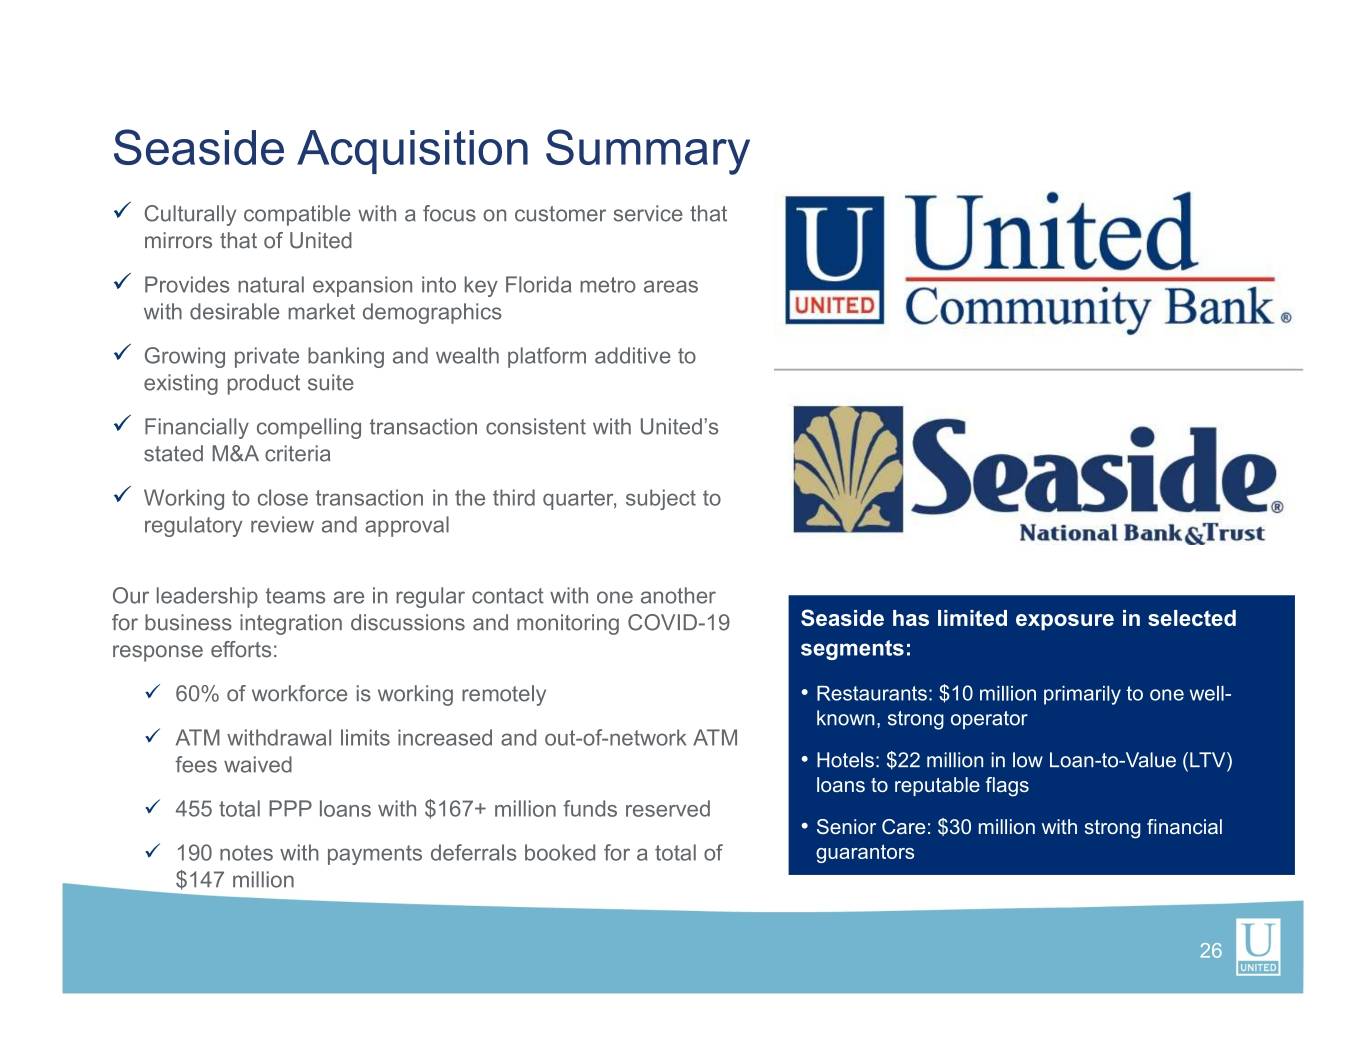
Seaside Acquisition Summary Culturally compatible with a focus on customer service that mirrors that of United Provides natural expansion into key Florida metro areas with desirable market demographics Growing private banking and wealth platform additive to existing product suite Financially compelling transaction consistent with United’s stated M&A criteria Working to close transaction in the third quarter, subject to regulatory review and approval Our leadership teams are in regular contact with one another for business integration discussions and monitoring COVID-19 Seaside has limited exposure in selected response efforts: segments: 60% of workforce is working remotely • Restaurants: $10 million primarily to one well- known, strong operator ATM withdrawal limits increased and out-of-network ATM fees waived • Hotels: $22 million in low Loan-to-Value (LTV) loans to reputable flags 455 total PPP loans with $167+ million funds reserved • Senior Care: $30 million with strong financial 190 notes with payments deferrals booked for a total of guarantors $147 million 26

1Q INVESTOR PRESENTATION Exhibits Member FDIC. © 2020 United Community Bank
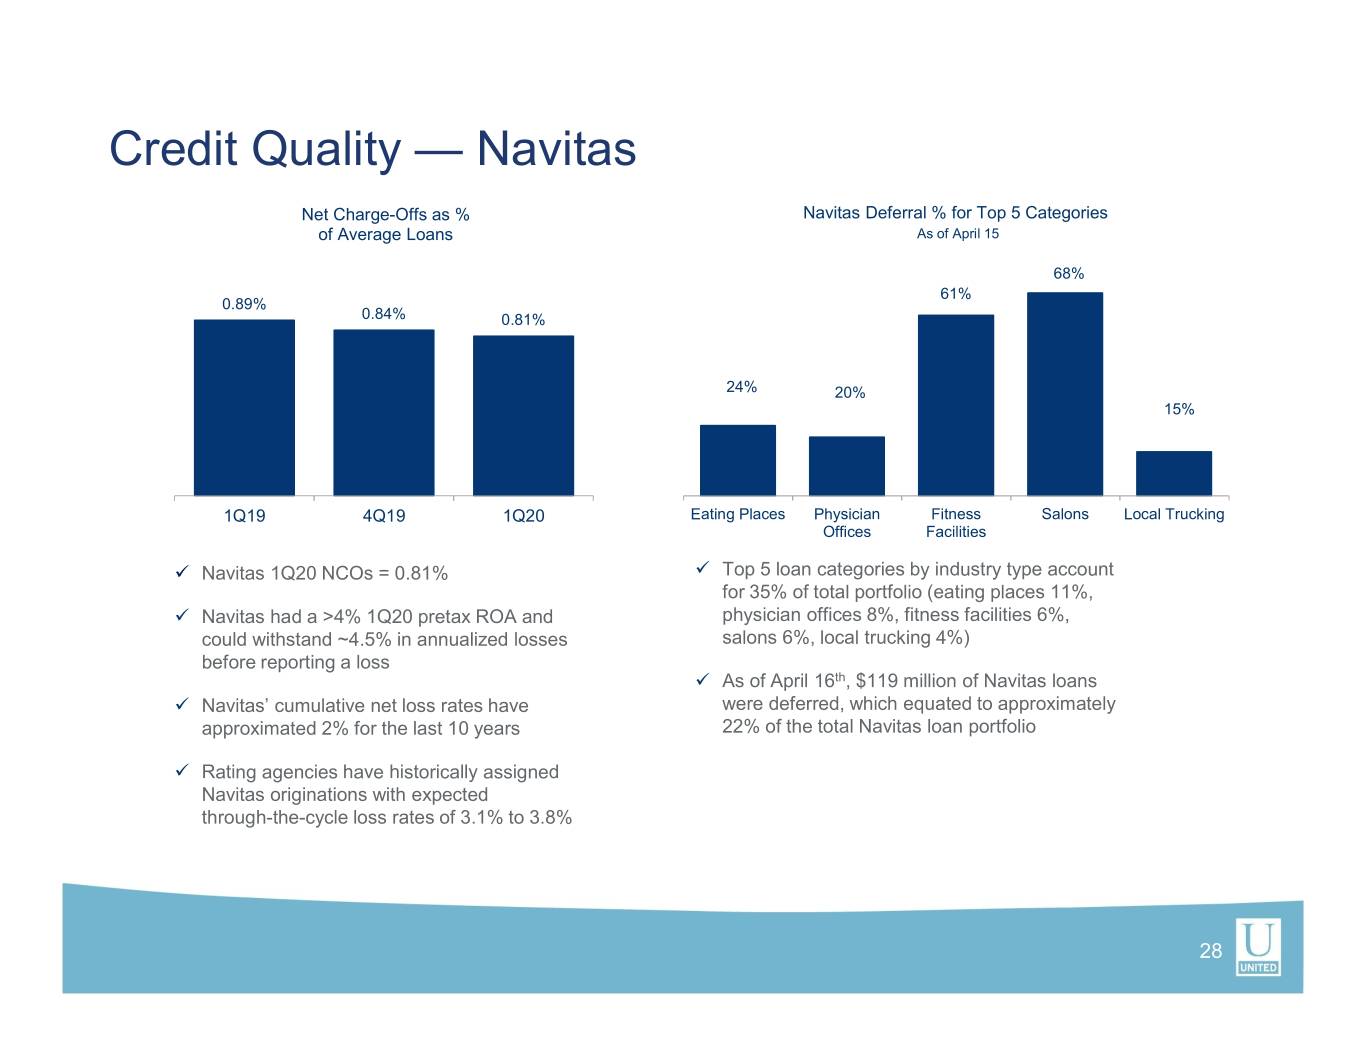
Credit Quality — Navitas Net Charge-Offs as % Navitas Deferral % for Top 5 Categories of Average Loans As of April 15 68% 61% 0.89% 0.84% 0.81% 24% 20% 15% 1Q19 4Q19 1Q20 Eating Places Physician Fitness Salons Local Trucking Offices Facilities Navitas 1Q20 NCOs = 0.81% Top 5 loan categories by industry type account for 35% of total portfolio (eating places 11%, Navitas had a >4% 1Q20 pretax ROA and physician offices 8%, fitness facilities 6%, could withstand ~4.5% in annualized losses salons 6%, local trucking 4%) before reporting a loss As of April 16th, $119 million of Navitas loans Navitas’ cumulative net loss rates have were deferred, which equated to approximately approximated 2% for the last 10 years 22% of the total Navitas loan portfolio Rating agencies have historically assigned Navitas originations with expected through-the-cycle loss rates of 3.1% to 3.8% 28
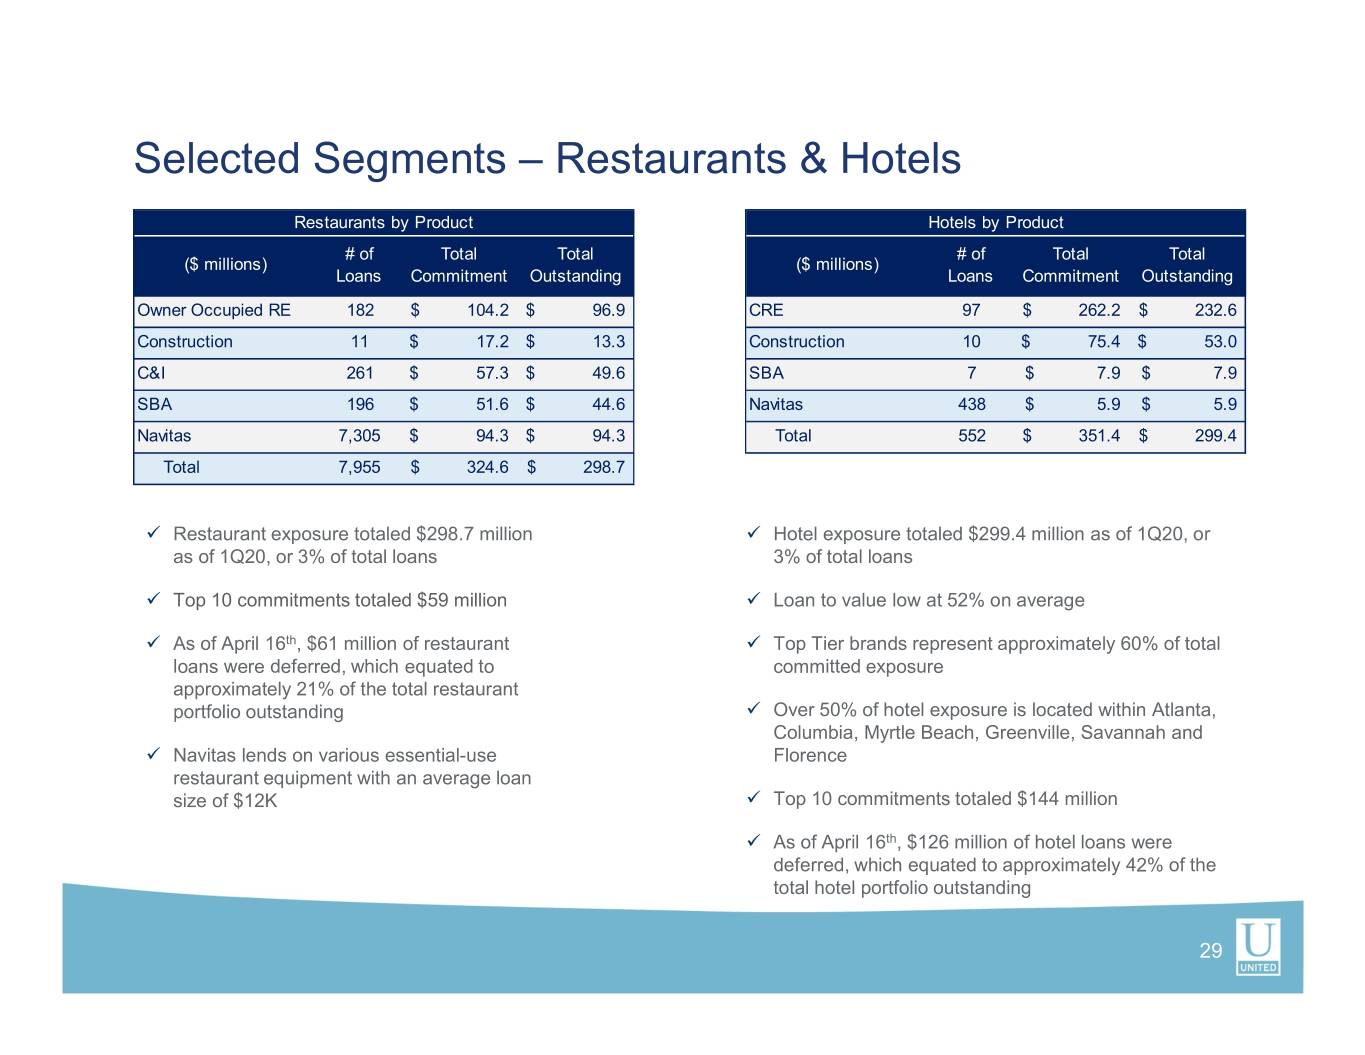
Selected Segments – Restaurants & Hotels Restaurants by Product Hotels by Product # of Total Total # of Total Total ($ millions) ($ millions) Loans Commitment Outstanding Loans Commitment Outstanding Owner Occupied RE 182$ 104.2 $ 96.9 CRE 97$ 262.2 $ 232.6 Construction 11$ 17.2 $ 13.3 Construction 10$ 75.4 $ 53.0 C&I 261$ 57.3 $ 49.6 SBA 7$ 7.9 $ 7.9 SBA 196$ 51.6 $ 44.6 Navitas 438$ 5.9 $ 5.9 Navitas 7,305$ 94.3 $ 94.3 Total 552$ 351.4 $ 299.4 Total 7,955$ 324.6 $ 298.7 Restaurant exposure totaled $298.7 million Hotel exposure totaled $299.4 million as of 1Q20, or as of 1Q20, or 3% of total loans 3% of total loans Top 10 commitments totaled $59 million Loan to value low at 52% on average As of April 16th, $61 million of restaurant Top Tier brands represent approximately 60% of total loans were deferred, which equated to committed exposure approximately 21% of the total restaurant portfolio outstanding Over 50% of hotel exposure is located within Atlanta, Columbia, Myrtle Beach, Greenville, Savannah and Navitas lends on various essential-use Florence restaurant equipment with an average loan size of $12K Top 10 commitments totaled $144 million As of April 16th, $126 million of hotel loans were deferred, which equated to approximately 42% of the total hotel portfolio outstanding 29
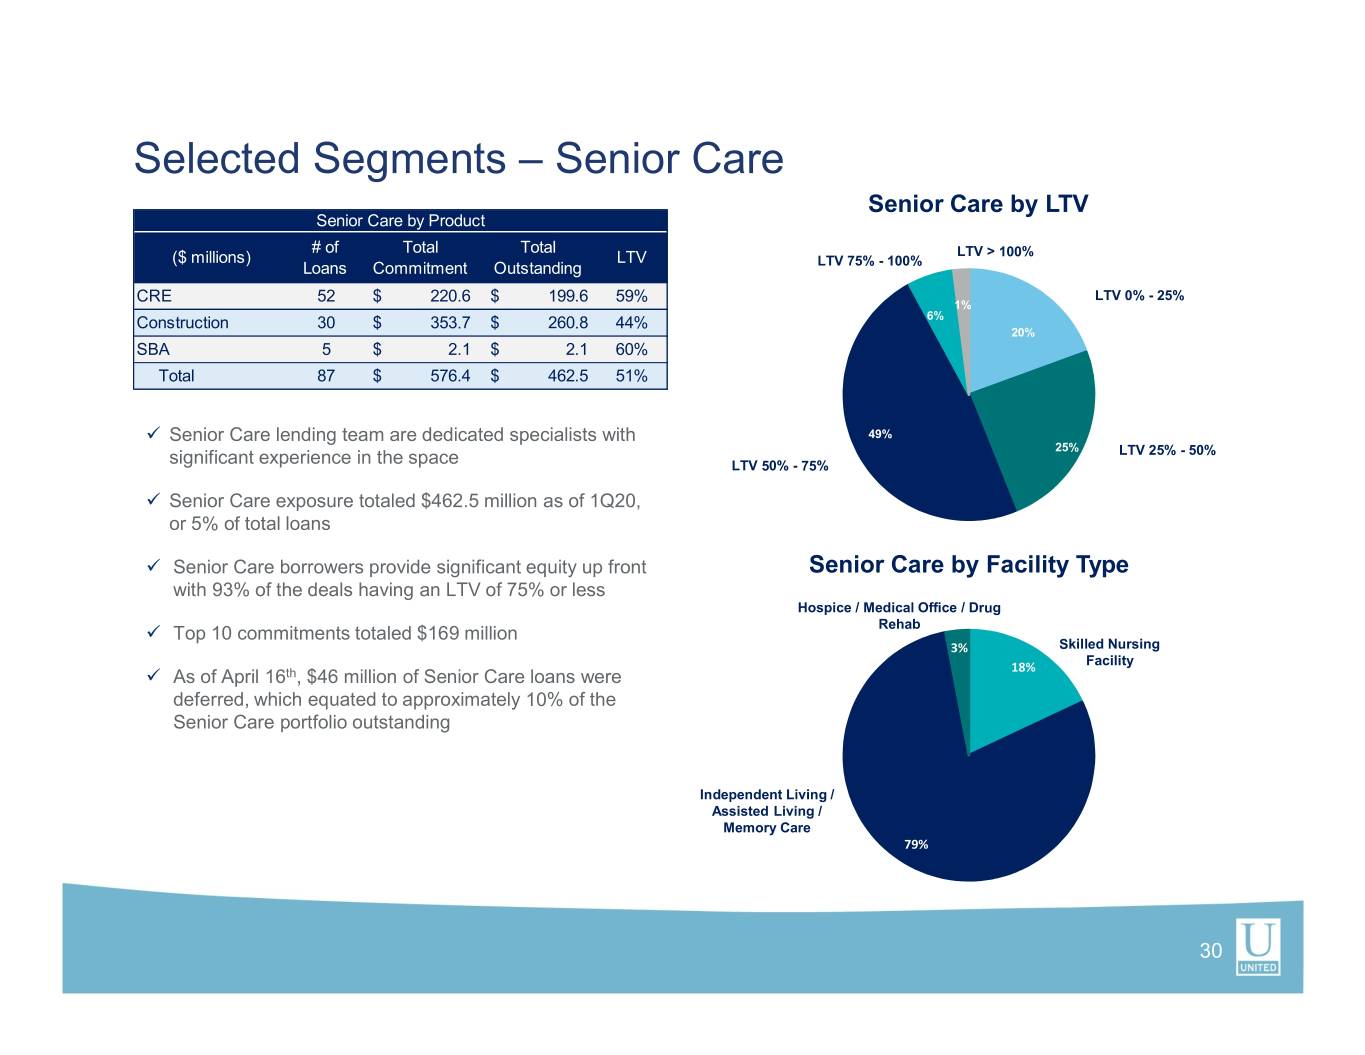
Selected Segments – Senior Care Senior Care by LTV Senior Care by Product # of Total Total ($ millions) LTV LTV > 100% Loans Commitment Outstanding LTV 75% - 100% CRE 52$ 220.6 $ 199.6 59% LTV 0% - 25% 1% Construction 30$ 353.7 $ 260.8 44% 6% 20% SBA 5$ 2.1 $ 2.1 60% Total 87$ 576.4 $ 462.5 51% Senior Care lending team are dedicated specialists with 49% 25% LTV 25% - 50% significant experience in the space LTV 50% - 75% Senior Care exposure totaled $462.5 million as of 1Q20, or 5% of total loans Senior Care borrowers provide significant equity up front Senior Care by Facility Type with 93% of the deals having an LTV of 75% or less Hospice / Medical Office / Drug Top 10 commitments totaled $169 million Rehab 3% Skilled Nursing Facility As of April 16th, $46 million of Senior Care loans were 18% deferred, which equated to approximately 10% of the Senior Care portfolio outstanding Independent Living / Assisted Living / Memory Care 79% 30
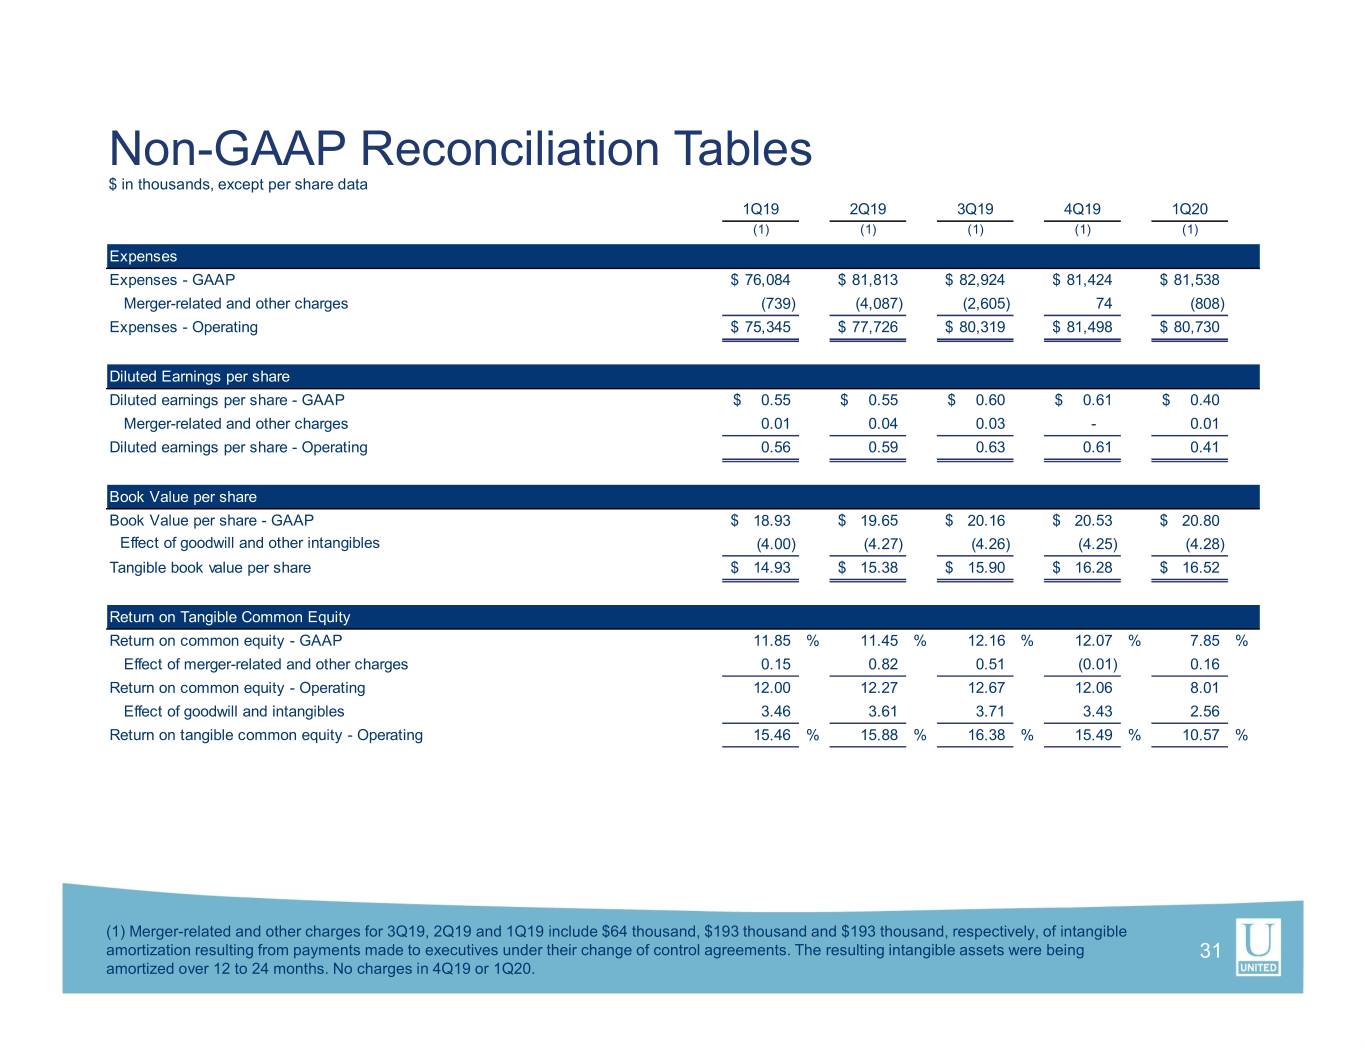
Non-GAAP Reconciliation Tables $ in thousands, except per share data 1Q19 2Q19 3Q19 4Q19 1Q20 (1) (1) (1) (1) (1) Expenses Expenses - GAAP$ 76,084 $ 81,813 $ 82,924 $ 81,424 $ 81,538 Merger-related and other charges (739) (4,087) (2,605) 74 (808) Expenses - Operating$ 75,345 $ 77,726 $ 80,319 $ 81,498 $ 80,730 Diluted Earnings per share Diluted earnings per share - GAAP$ 0.55 $ 0.55 $ 0.60 $ 0.61 $ 0.40 Merger-related and other charges 0.01 0.04 0.03 - 0.01 Diluted earnings per share - Operating 0.56 0.59 0.63 0.61 0.41 Book Value per share Book Value per share - GAAP$ 18.93 $ 19.65 $ 20.16 $ 20.53 $ 20.80 Effect of goodwill and other intangibles (4.00) (4.27) (4.26) (4.25) (4.28) Tangible book value per share$ 14.93 $ 15.38 $ 15.90 $ 16.28 $ 16.52 Return on Tangible Common Equity Return on common equity - GAAP 11.85 % 11.45 % 12.16 % 12.07 % 7.85 % Effect of merger-related and other charges 0.15 0.82 0.51 (0.01) 0.16 Return on common equity - Operating 12.00 12.27 12.67 12.06 8.01 Effect of goodwill and intangibles 3.46 3.61 3.71 3.43 2.56 Return on tangible common equity - Operating 15.46 % 15.88 % 16.38 % 15.49 % 10.57 % (1) Merger-related and other charges for 3Q19, 2Q19 and 1Q19 include $64 thousand, $193 thousand and $193 thousand, respectively, of intangible amortization resulting from payments made to executives under their change of control agreements. The resulting intangible assets were being 31 amortized over 12 to 24 months. No charges in 4Q19 or 1Q20.
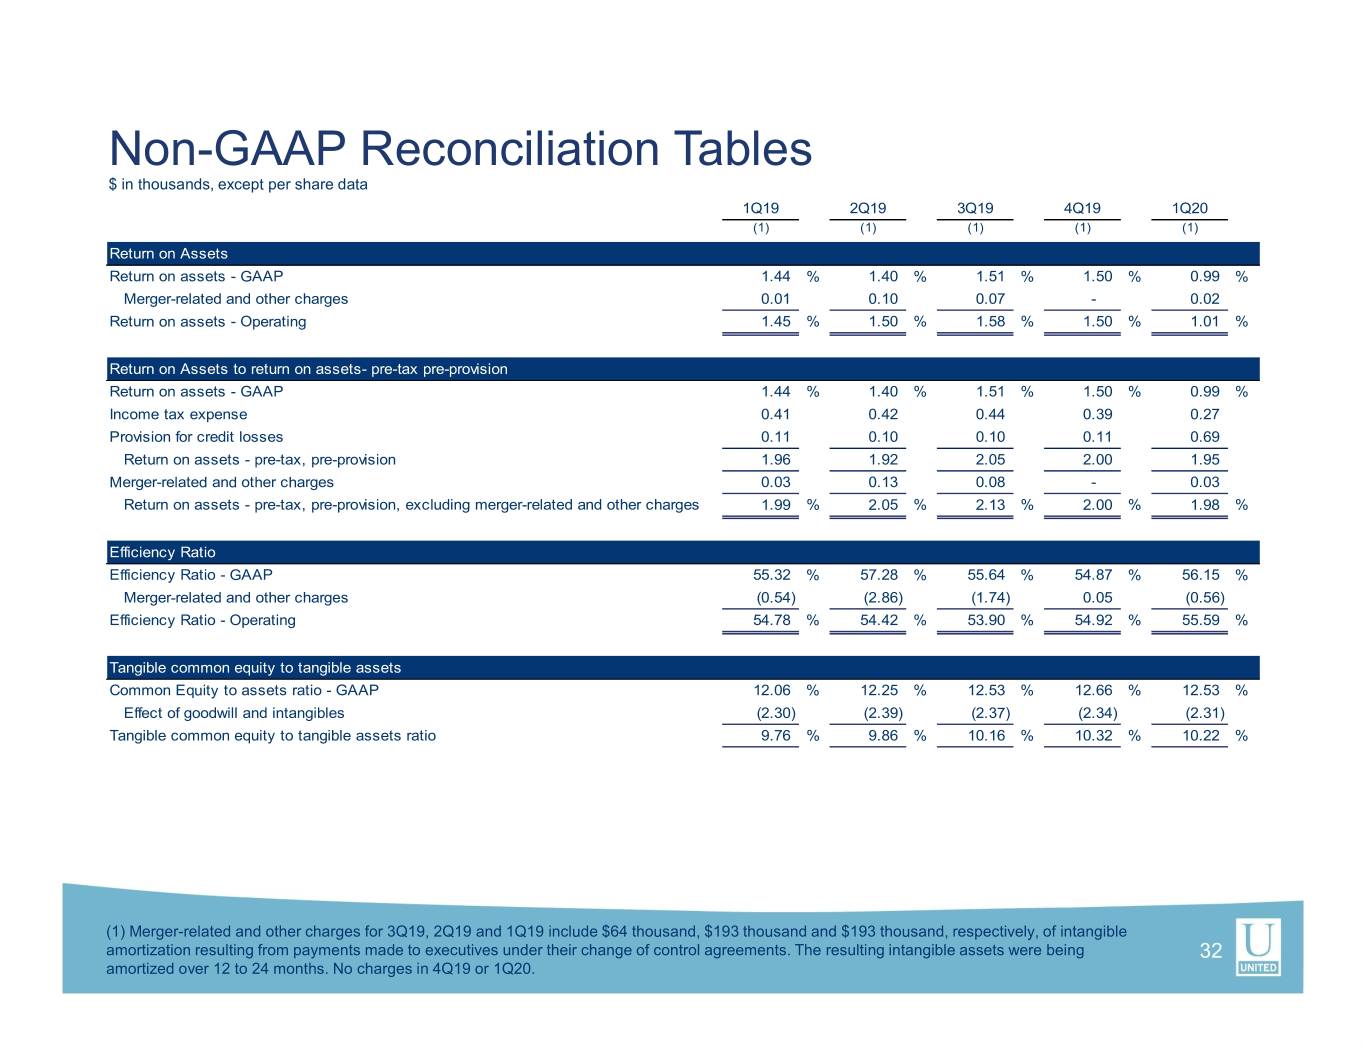
Non-GAAP Reconciliation Tables $ in thousands, except per share data 1Q19 2Q19 3Q19 4Q19 1Q20 (1) (1) (1) (1) (1) Return on Assets Return on assets - GAAP 1.44 % 1.40 % 1.51 % 1.50 % 0.99 % Merger-related and other charges 0.01 0.10 0.07 - 0.02 Return on assets - Operating 1.45 % 1.50 % 1.58 % 1.50 % 1.01 % Return on Assets to return on assets- pre-tax pre-provision Return on assets - GAAP 1.44 % 1.40 % 1.51 % 1.50 % 0.99 % Income tax expense 0.41 0.42 0.44 0.39 0.27 Provision for credit losses 0.11 0.10 0.10 0.11 0.69 Return on assets - pre-tax, pre-provision 1.96 1.92 2.05 2.00 1.95 Merger-related and other charges 0.03 0.13 0.08 - 0.03 Return on assets - pre-tax, pre-provision, excluding merger-related and other charges 1.99 % 2.05 % 2.13 % 2.00 % 1.98 % Efficiency Ratio Efficiency Ratio - GAAP 55.32 % 57.28 % 55.64 % 54.87 % 56.15 % Merger-related and other charges (0.54) (2.86) (1.74) 0.05 (0.56) Efficiency Ratio - Operating 54.78 % 54.42 % 53.90 % 54.92 % 55.59 % Tangible common equity to tangible assets Common Equity to assets ratio - GAAP 12.06 % 12.25 % 12.53 % 12.66 % 12.53 % Effect of goodwill and intangibles (2.30) (2.39) (2.37) (2.34) (2.31) Tangible common equity to tangible assets ratio 9.76 % 9.86 % 10.16 % 10.32 % 10.22 % (1) Merger-related and other charges for 3Q19, 2Q19 and 1Q19 include $64 thousand, $193 thousand and $193 thousand, respectively, of intangible amortization resulting from payments made to executives under their change of control agreements. The resulting intangible assets were being 32 amortized over 12 to 24 months. No charges in 4Q19 or 1Q20.