
UP 8-K
Wheels Up Experience Inc. (UP)
8-K
2026-02-19
For: 2026-02-19
View Original
Added on
April 09, 2026
UNITED STATES
SECURITIES AND EXCHANGE COMMISSION
Washington, D.C. 20549
FORM 8-K
CURRENT REPORT
PURSUANT TO SECTION 13 OR 15(d)
OF THE SECURITIES EXCHANGE ACT OF 1934
Date of Report (Date of earliest event reported): February 19, 2026
(Exact name of registrant as specified in its charter)
| (State or other jurisdiction | (Commission | (I.R.S. Employer | ||||||
| of incorporation) | File Number) | Identification No.) | ||||||
| (Address of principal executive offices) | (Zip Code) | ||||
(212 ) 257-5252
(Registrant’s telephone number, including area code)
(Former name or former address, if changed since last report)
Check the appropriate box below if the Form 8-K filing is intended to simultaneously satisfy the filing obligation of the registrant under any of the following provisions:
| Written communications pursuant to Rule 425 under the Securities Act (17 CFR 230.425) | ||||||||
| Soliciting material pursuant to Rule 14a-12 under the Exchange Act (17 CFR 240.14a-12) | ||||||||
| Pre-commencement communications pursuant to Rule 14d-2(b) under the Exchange Act (17 CFR 240.14d-2(b)) | ||||||||
| Pre-commencement communications pursuant to Rule 13e-4(c) under the Exchange Act (17 CFR 240.13e-4(c)) | ||||||||
Securities registered pursuant to Section 12(b) of the Act:
| Title of each class | Trading Symbol(s) | Name of each exchange on which registered | ||||||||||||
Indicate by check mark whether the registrant is an emerging growth company as defined in Rule 405 of the Securities Act of 1933 (§230.405 of this chapter) or Rule 12b-2 of the Securities Exchange Act of 1934 (§240.12b-2 of this chapter).
Emerging growth company ☐
If an emerging growth company, indicate by check mark if the registrant has elected not to use the extended transition period for complying with any new or revised financial accounting standards provided pursuant to Section 13(a) of the Exchange Act. ☐
Item 2.02 Results of Operations and Financial Condition.
On February 19, 2026 , Wheels Up Experience Inc. (the “Company”) issued a press release and an investor letter announcing its financial results for the three months and fiscal year ended December 31, 2025. The full text of the press release and investor letter are furnished as Exhibits 99.1 and 99.2, respectively, to this Current Report on Form 8-K (“Current Report”) and are incorporated by reference herein.
The information in Item 2.02 of this Current Report and Exhibits 99.1 and 99.2 is being furnished pursuant to Item 2.02 of Form 8-K and shall not be deemed “filed” for purposes of Section 18 of the Securities Exchange Act of 1934, as amended (the “Exchange Act”), or otherwise subject to the liabilities of that section, nor shall it be deemed incorporated by reference in any filing made by the Company under the Securities Act of 1933, as amended, or the Exchange Act, except as may be expressly set forth by specific reference in such filing.
Item 9.01 Financial Statements and Exhibits.
(d) Exhibits.
| Exhibit Number | Description | |||||||
| 99.1 | ||||||||
| 99.2 | ||||||||
| 104 | Cover Page Interactive Data File (embedded within the Inline XBRL document) | |||||||
SIGNATURE
Pursuant to the requirements of the Securities Exchange Act of 1934, the registrant has duly caused this report to be signed on its behalf by the undersigned hereunto duly authorized.
WHEELS UP EXPERIENCE INC. | |||||||||||
Date: February 19, 2026 | By: | /s/ George Mattson | |||||||||
| Name: | George Mattson | ||||||||||
| Title: | Chief Executive Officer | ||||||||||
Exhibit 99.1

Wheels Up Announces Fourth Quarter Results
Significant improvement in Net loss and first-ever positive Adjusted EBITDAR on benefits from fleet transition and cost reduction initiatives
Operational reliability reaches record levels in fourth quarter
Fleet modernization, introduction of Signature Membership, and Delta partnership advance commercial momentum
ATLANTA – February 19, 2026 – Wheels Up Experience Inc. (NYSE:UP) today announced financial results for the fourth quarter of 2025. Highlights of the quarter, including GAAP results, non-GAAP financial measures and key operating metrics, are on pages three and four and incorporated herein.
Commentary from Wheels Up’s Chief Executive Officer George Mattson about the company’s financial and operating results for the fourth quarter ended December 31, 2025 is included in an Investor Letter that can be found on Wheels Up’s Investor Relations website at https://investors.wheelsup.com.
Fourth Quarter 2025 Results
•Private jet Flight revenue was up 4% sequentially from the third quarter and flat year-over-year. Total Revenue of $184 million was flat sequentially and down 10% year-over-year, reflecting discontinued membership programs, lower group charter sales, and the divestiture of non-core services businesses in the third quarter of 2025
•Net loss of $29 million, a 67% year-over-year improvement driven by a stronger mix of profitable membership and charter flying, exit of unprofitable fleets, early progress toward its $70 million annual run-rate cost reduction target, and one-time gains from aircraft sale-leaseback transactions
•Positive Adjusted EBITDA of $33 million, and Adjusted EBITDAR of $37 million, both improving by more than $40 million year-over-year
•Gross profit of $13 million, with the year-over-year result pressured by approximately $9 million of non-recurring fleet modernization expenses
•Adjusted Contribution of $35 million, and Adjusted Contribution Margin of 19.1%, roughly flat versus the prior year period, with transitory inefficiencies associated with fleet modernization negatively impacting Adjusted Contribution Margin by approximately 3.5 points in the fourth quarter
•Quarter-end liquidity of $234 million, including $134 million of cash and cash equivalents, and the company’s undrawn $100 million revolving credit facility
“Over the past year, we have stabilized private jet revenue, strengthened our revenue mix, invested in operational reliability and fleet modernization, and enhanced the customer experience, driving a meaningful improvement in profitability,” said Wheels Up Chief Executive Officer George Mattson. “In 2026, we expect to complete our membership program and fleet transition and fully align our products, services, and operations with our strategy. With a modernized fleet, a stronger mix of corporate and high‑value customers, continued operational and cost discipline, and the unique competitive advantages from our Delta partnership, we are advancing toward our long‑term objective of sustainable, profitable growth.”
Business highlights
•Continued operational excellence underpins financial progress. Wheels Up delivered a Completion Rate of 99%, up 1 point year-over-year, and On-Time Performance (D-60) of 91%, up 4 points from the prior period. The company achieved 24 brand days in the quarter, days with a perfect Completion Rate and no cancellations, including six out of the seven busiest days during the Christmas holiday period - providing a best-in-class experience for customers.
•New go-to-market model, fully integrating the company’s global aviation platform under one brand. Wheels Up has unified its full range of customer offerings under a single brand and organizational structure. The newly integrated commercial model will provide a single, personalized team to manage private aviation membership, global private charter, group charter, and hybrid private-commercial itineraries. This approach fully realizes and delivers the breadth of the Wheels Up portfolio and reinforces the company's commitment to a more personalized, customer-centric, end-to-end aviation experience.
•Complete fleet transition expected by year end. Premium Phenom and Challenger jets comprised approximately 40% of Wheels Up’s controlled jet fleet at quarter end. The company has continued to add to these fleets in 2026 and expects its fleet transformation will be completed ahead of its original mid-2027 timeline. The company also expects that approximately half of its premium jet fleet will have new livery and interior work completed or in process by the end of 2026.
•Robust customer response to the Signature Membership program. In September, the company introduced the Wheels Up Signature Membership, a premium membership for its Challenger and Phenom fleets. Customer response to this new product has been positive and the company has already sold over 600 Signature Memberships since launch. These memberships represented more than 40% of total Membership Fund sales for the quarter, with approximately 25% of sales from new customers.
•Corporate membership growth reflects unique advantage of Delta partnership. For the fourth quarter, corporate Membership Fund sales grew 35% year-over-year. Corporate membership was our fastest growing segment and represented 40% of Membership Fund sales for the quarter.
•High-speed satellite Wi-Fi installation begins. The company has begun installation of streaming-quality satellite Wi-Fi on its Phenom and Challenger fleets. Given strong customer reaction, the company is accelerating its installation timeline and expects to have nearly all of its fleet equipped by the end of the year.
•Strategic sale-leaseback transaction. In December, the company executed a sale-leaseback transaction with an institutional capital provider for three Challenger and seven Phenom aircraft, consistent with its longer-term strategy of optimizing its mix of owned and leased aircraft. With long-term operating leases in place, the company will continue to operate the aircraft, all of which have or will be painted, branded, refurbished, and equipped with streaming-quality satellite Wi-Fi. The transaction generated a one-time gain on sale of approximately $24 million and net cash proceeds of approximately $30 million. The cash proceeds and incremental borrowing capacity unlocked by the transaction are expected to support Wheels Up's planned 2026 aircraft acquisitions.
Financial and Operating Highlights
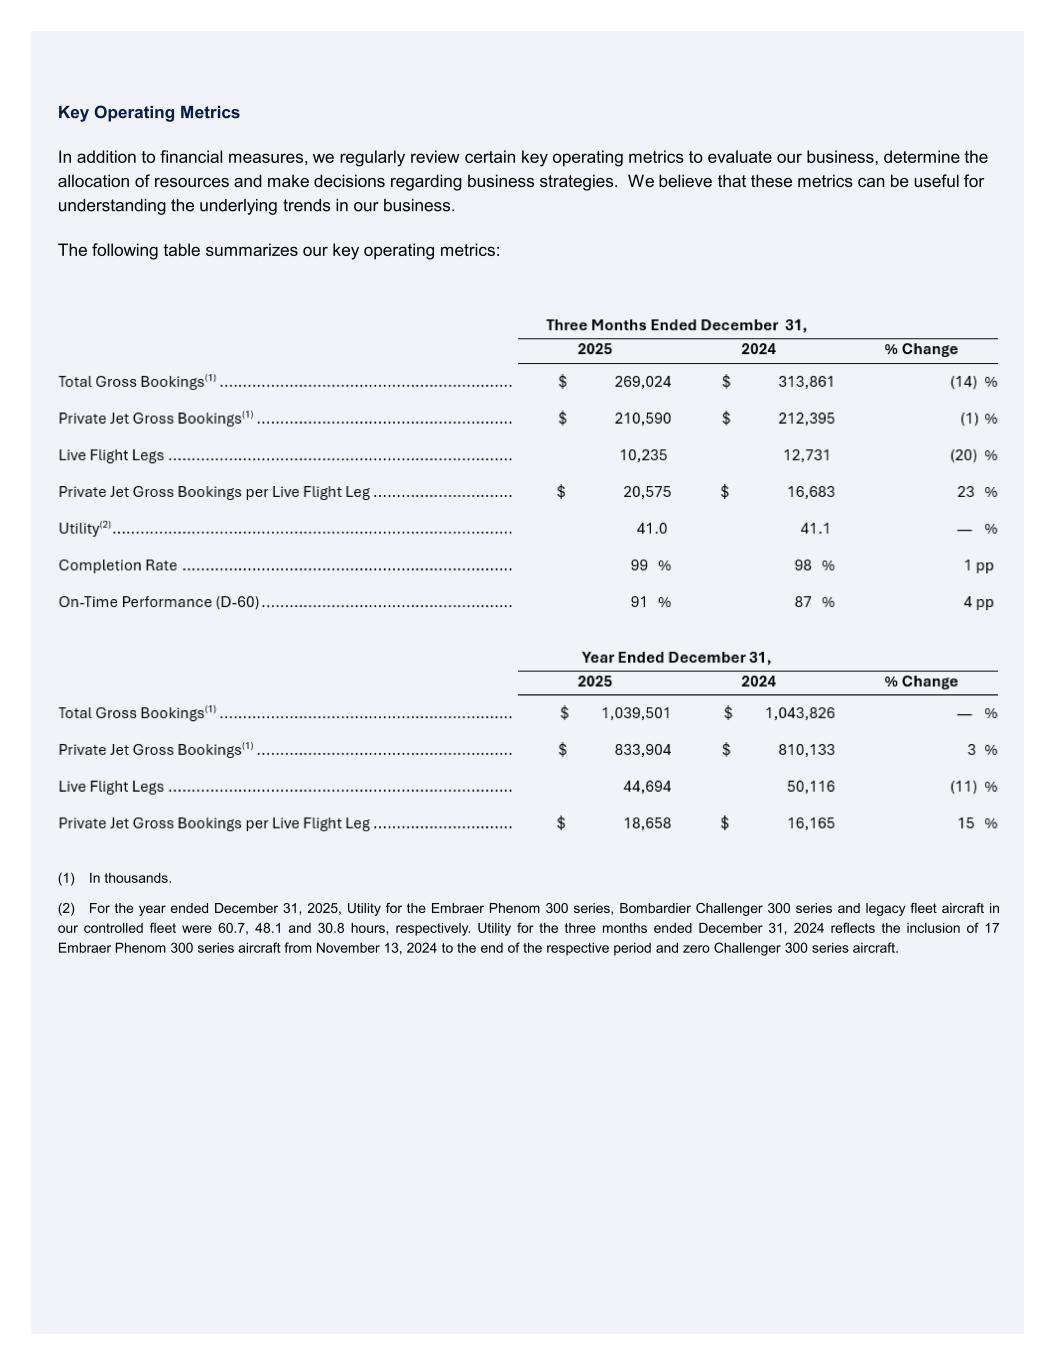
| Three Months Ended December 31, | |||||||||||||||||
| 2025 | 2024 | % Change | |||||||||||||||
Total Gross Bookings(1) | $ | 269,024 | $ | 313,861 | (14) | % | |||||||||||
Private Jet Gross Bookings(1) | $ | 210,590 | $ | 212,395 | (1) | % | |||||||||||
Live Flight Legs | 10,235 | 12,731 | (20) | % | |||||||||||||
| Private Jet Gross Bookings per Live Flight Leg | $ | 20,575 | $ | 16,683 | 23 | % | |||||||||||
Utility(2) | 41.0 | 41.1 | — | % | |||||||||||||
| Completion Rate | 99 | % | 98 | % | 1 pp | ||||||||||||
| On-Time Performance (D-60) | 91 | % | 87 | % | 4 pp | ||||||||||||
| Year Ended December 31, | |||||||||||||||||
| 2025 | 2024 | % Change | |||||||||||||||
Total Gross Bookings(1) | $ | 1,039,501 | $ | 1,043,826 | — | % | |||||||||||
Private Jet Gross Bookings(1) | $ | 833,904 | $ | 810,133 | 3 | % | |||||||||||
Live Flight Legs | 44,694 | 50,116 | (11) | % | |||||||||||||
| Private Jet Gross Bookings per Live Flight Leg | $ | 18,658 | $ | 16,165 | 15 | % | |||||||||||
| Three Months Ended December 31, | |||||||||||||||||||||||
| (In thousands, except percentages) | 2025 | 2024 | $ Change | % Change | |||||||||||||||||||
| Revenue | $ | 183,842 | $ | 204,815 | $ | (20,973) | (10) | % | |||||||||||||||
Gross profit | $ | 12,799 | $ | 15,475 | $ | (2,676) | (17) | % | |||||||||||||||
| Adjusted Contribution | $ | 35,058 | $ | 39,616 | $ | (4,558) | (12) | % | |||||||||||||||
| Adjusted Contribution Margin | 19.1% | 19.3% | n/a | (0.2) | pp | ||||||||||||||||||
| Net loss | $ | (28,875) | $ | (87,538) | $ | 58,663 | (67) | % | |||||||||||||||
| Adjusted EBITDA | $ | 32,928 | $ | (11,307) | $ | 44,235 | n/m | ||||||||||||||||
| Adjusted EBITDAR | $ | 36,908 | $ | (3,174) | $ | 40,082 | n/m | ||||||||||||||||
| Year Ended December 31, | |||||||||||||||||||||||
| (In thousands, except percentages) | 2025 | 2024 | $ Change | % Change | |||||||||||||||||||
| Revenue | $ | 736,495 | $ | 792,104 | $ | (55,609) | (7) | % | |||||||||||||||
Gross profit | $ | 12,569 | $ | 2,483 | $ | 10,086 | n/m | ||||||||||||||||
| Adjusted Contribution | $ | 104,069 | $ | 85,687 | $ | 18,382 | 21 | % | |||||||||||||||
| Adjusted Contribution Margin | 14.1% | 10.8% | n/a | 3.3 | pp | ||||||||||||||||||
| Net loss | $ | (294,217) | $ | (339,635) | $ | 45,418 | (13) | % | |||||||||||||||
| Adjusted EBITDA | $ | (43,483) | $ | (117,873) | $ | 74,390 | 63 | % | |||||||||||||||
| Adjusted EBITDAR | $ | (26,654) | $ | (84,613) | $ | 57,959 | 68 | % | |||||||||||||||
Net cash used in operating activities(3) | $ | (166,295) | $ | (77,888) | $ | (88,407) | n/m | ||||||||||||||||
__________________
For information regarding Wheels Up's use and definitions of our key operating metrics and non-GAAP financial measures, see “Definitions of Key Operating Metrics,” “Definitions of Non-GAAP Financial Measures” and “Reconciliations of Non-GAAP Financial Measures” sections herein.
(1)In thousands.
(2)For the three months ended December 31, 2025, Utility for the Embraer Phenom 300 series, Bombardier Challenger 300 series and legacy fleet aircraft in our controlled fleet were 60.7, 48.1 and 30.8 hours, respectively. Utility for the three months ended December 31, 2024 reflects the inclusion of 17 Embraer Phenom 300 series aircraft from November 13, 2024 to the end of the respective period and zero Challenger 300 series aircraft.
(3)During the years ended December 31, 2025 and 2024, we sold $576.0 million and $595.4 million, respectively, of Membership Funds.
n/m Not meaningful
About Wheels Up
Wheels Up is a leading global provider of on-demand private aviation with a large, diverse fleet and a network of safety-vetted charter operators, all committed to safety and service. Customers access charter and membership programs and premium commercial travel benefits through a strategic partnership with Delta Air Lines. Wheels Up also provides cargo services to a range of clients, including individuals and government organizations, via Air Partner Cargo. With the Wheels Up app and website, members can easily search, book, and fly. For more information, visit www.wheelsup.com.
Cautionary Note Regarding Forward-Looking Statements
This press release contains certain “forward-looking statements” within the meaning of the federal securities laws. Forward-looking statements provide current expectations of future circumstances or events based on certain assumptions and include any statement, projection or forecast that does not directly relate to any historical or current fact. Forward-looking statements are subject to known and unknown risks, uncertainties, assumptions and other important factors, many of which are outside of the control of Wheels Up Experience Inc. (“Wheels Up”, “we”, “us”, “our” or the “Company”), that could cause actual results to differ materially from the results discussed in the forward-looking statements. These forward-looking statements include, but are not limited to, statements regarding: (i) Wheels Up’s growth plans, the size, demand, competition in and growth potential of the markets for Wheels Up’s service offerings and the degree of market adoption of Wheels Up’s membership program, charter offerings and any future services it may offer; (ii) the potential impact of Wheels Up’s cost reduction and operational efficiency and
productivity initiatives on its business and results of operations, including timing, magnitude and possible effects on liquidity levels and working capital; (iii) Wheels Up’s fleet modernization strategy, its ability to execute such strategy on the timeline that it currently anticipates and the expected commercial, financial and operational impacts to Wheels Up, including due to changes in the market for purchases and sales of aircraft; (iv) Wheels Up’s liquidity and future cash flows, certain restrictions related to its indebtedness obligations and its ability to perform under its contractual and indebtedness obligations; (v) Wheels Up’s ability to achieve its financial goals in the future on the most recent schedule that it has announced; (vi) the potential impacts or benefits from pursuing strategic actions involving Wheels Up or its subsidiaries or affiliates, including, among others, acquisitions and divestitures, new debt or equity financings, refinancings of existing indebtedness, stock repurchases and commercial partnerships or arrangements; and (vii) the impacts of general economic and geopolitical conditions on Wheels Up’s business and the aviation industry, including due to, among others, fluctuations in interest rates, inflation, foreign currencies, taxes, tariffs and trade policies, government shutdowns or funding changes, and consumer and business spending decisions. The words “anticipate,” “believe,” “can,” “continue,” “could,” “estimate,” “expect,” “future,” “intend,” “may,” “might,” “plan,” “possible,” “potential,” “predict,” “project,” “should,” “strive,” “would” and similar expressions may identify forward-looking statements, but the absence of these words does not mean that statement is not forward-looking. We have identified certain known material risk factors applicable to Wheels Up in our Annual Report on Form 10-K for the year ended December 31, 2024 filed with the U.S. Securities and Exchange Commission (“SEC”) on March 11, 2025 (“2024 Annual Report”) and our other filings with the SEC. It is not always possible for us to predict how new risks and uncertainties that arise from time to time may affect us. You are cautioned not to place undue reliance upon any forward-looking statements, which speak only as of the date made. Except as required by law, we do not intend to update any of these forward-looking statements after the date of this press release.
Use of Non-GAAP Financial Measures
This press release includes certain non-GAAP financial measures, such as Adjusted EBITDA, Adjusted EBITDAR, Adjusted Contribution and Adjusted Contribution Margin. These non-GAAP financial measures are in addition to, and not a substitute for or superior to, measures of financial performance prepared in accordance with U.S. generally accepted accounting principles (“GAAP”) and should not be considered as an alternative to any performance measures derived in accordance with GAAP. Definitions and reconciliations of non-GAAP financial measures to their most comparable GAAP counterparts are included in the sections titled “Definitions of Non-GAAP Financial Measures” and “Reconciliations of Non-GAAP Financial Measures,” respectively, in this press release. Wheels Up believes that these non-GAAP financial measures provide useful supplemental information to investors about Wheels Up. However, there are certain limitations related to the use of these non-GAAP financial measures and their nearest GAAP measures, including that they exclude significant expenses that are required to be recorded in Wheels Up’s financial measures under GAAP. Other companies may calculate non-GAAP financial measures differently, or may use other measures to calculate their financial performance, and therefore, Wheels Up’s non-GAAP financial measures may not be directly comparable to similarly titled measures of other companies. Additionally, to the extent that forward-looking non-GAAP financial measures are provided, they are presented on a non-GAAP basis without reconciliations of such forward-looking non-GAAP financial measures due to the inherent difficulty in forecasting and quantifying certain amounts that are necessary for such reconciliations.
For more information on these non-GAAP financial measures, see the sections titled “Definitions of Non-GAAP Financial Measures” and “Reconciliations of Non-GAAP Financial Measures” included in this press release.
Contacts
Investors:
Media:
WHEELS UP EXPERIENCE INC.
CONSOLIDATED STATEMENTS OF OPERATIONS
(Unaudited, in thousands except share and per share data)
| Three Months Ended December 31, | Change in | ||||||||||||||||||||||
| 2025 | 2024 | $ | % | ||||||||||||||||||||
| Revenue | $ | 183,842 | $ | 204,815 | $ | (20,973) | (10) | % | |||||||||||||||
| Costs and expenses: | |||||||||||||||||||||||
| Cost of revenue (exclusive of items shown separately below) | 157,498 | 176,266 | (18,768) | (11) | % | ||||||||||||||||||
| Technology and development | 8,710 | 9,486 | (776) | (8) | % | ||||||||||||||||||
| Sales and marketing | 20,013 | 21,371 | (1,358) | (6) | % | ||||||||||||||||||
| General and administrative | 26,269 | 38,350 | (12,081) | (32) | % | ||||||||||||||||||
| Depreciation and amortization | 13,545 | 13,074 | 471 | 4 | % | ||||||||||||||||||
| Gain on sale of aircraft held for sale | (39,272) | (1,942) | (37,330) | n/m | |||||||||||||||||||
| (Gain) loss on disposal of assets, net | (1,211) | 3,295 | (4,506) | n/m | |||||||||||||||||||
| Total costs and expenses | 185,552 | 259,900 | (74,348) | (29) | % | ||||||||||||||||||
| Loss from operations | (1,710) | (55,085) | 53,375 | (97) | % | ||||||||||||||||||
| Other income (expense): | |||||||||||||||||||||||
| Gain (loss) on divestiture | (152) | 357 | (509) | n/m | |||||||||||||||||||
| Loss on extinguishment of debt | (40) | (14,914) | 14,874 | n/m | |||||||||||||||||||
| Change in fair value of warrant liability | — | (17) | 17 | n/m | |||||||||||||||||||
| Interest income | 405 | 922 | (517) | (56) | % | ||||||||||||||||||
| Interest expense | (24,996) | (18,089) | (6,907) | 38 | % | ||||||||||||||||||
| Other income (expense), net | (1,248) | (218) | (1,030) | n/m | |||||||||||||||||||
| Total other income (expense) | (26,031) | (31,959) | 5,928 | (19) | % | ||||||||||||||||||
| Loss before income taxes | (27,741) | (87,044) | 59,303 | (68) | % | ||||||||||||||||||
| Income tax expense | (1,134) | (494) | (640) | n/m | |||||||||||||||||||
| Net loss | (28,875) | (87,538) | 58,663 | (67) | % | ||||||||||||||||||
| Less: net income (loss) attributable to non-controlling interests | — | — | — | — | % | ||||||||||||||||||
| Net loss attributable to Wheels Up Experience Inc. | $ | (28,875) | $ | (87,538) | $ | 58,663 | (67) | % | |||||||||||||||
| Net loss per share of Class A common stock: | |||||||||||||||||||||||
| Basic and Diluted | $ | (0.04) | $ | (0.13) | $ | 0.09 | (68) | % | |||||||||||||||
| Weighted-average shares of Class A common stock outstanding: | |||||||||||||||||||||||
| Basic and Diluted | 721,809,784 | 697,836,353 | 23,973,431 | 3 | % | ||||||||||||||||||
WHEELS UP EXPERIENCE INC.
CONSOLIDATED STATEMENTS OF OPERATIONS
(Unaudited, in thousands except share and per share data)
| Year Ended December 31, | Change in | ||||||||||||||||||||||
| 2025 | 2024 | $ | % | ||||||||||||||||||||
| Revenue | $ | 736,495 | $ | 792,104 | $ | (55,609) | (7) | % | |||||||||||||||
| Costs and expenses: | |||||||||||||||||||||||
| Cost of revenue (exclusive of items shown separately below) | 662,755 | 733,075 | (70,320) | (10) | % | ||||||||||||||||||
| Technology and development | 38,762 | 40,690 | (1,928) | (5) | % | ||||||||||||||||||
| Sales and marketing | 88,643 | 84,317 | 4,326 | 5 | % | ||||||||||||||||||
| General and administrative | 145,300 | 137,594 | 7,706 | 6 | % | ||||||||||||||||||
| Depreciation and amortization | 61,171 | 56,546 | 4,625 | 8 | % | ||||||||||||||||||
| Gain on sale of aircraft held for sale | (51,763) | (4,622) | (47,141) | n/m | |||||||||||||||||||
| (Gain) loss on disposal of assets, net | (4,960) | 3,295 | (8,255) | n/m | |||||||||||||||||||
| Total costs and expenses | 939,908 | 1,050,895 | (110,987) | (11) | % | ||||||||||||||||||
| Loss from operations | (203,413) | (258,791) | 55,378 | 21 | % | ||||||||||||||||||
| Other income (expense): | |||||||||||||||||||||||
| Gain on divestiture | 1,681 | 2,003 | (322) | n/m | |||||||||||||||||||
| Loss on extinguishment of debt | (119) | (17,714) | 17,595 | n/m | |||||||||||||||||||
| Change in fair value of warrant liability | — | (8) | 8 | n/m | |||||||||||||||||||
| Interest income | 3,020 | 2,170 | 850 | 39 | % | ||||||||||||||||||
| Interest expense | (90,470) | (65,352) | (25,118) | 38 | % | ||||||||||||||||||
| Other income (expense), net | (1,413) | (717) | (696) | n/m | |||||||||||||||||||
| Total other income (expense) | (87,301) | (79,618) | (7,683) | (10) | % | ||||||||||||||||||
| Loss before income taxes | (290,714) | (338,409) | 47,695 | (14) | % | ||||||||||||||||||
| Income tax expense | (3,503) | (1,226) | (2,277) | n/m | |||||||||||||||||||
| Net loss | (294,217) | (339,635) | 45,418 | (13) | % | ||||||||||||||||||
| Less: net income (loss) attributable to non-controlling interests | — | — | — | — | % | ||||||||||||||||||
| Net loss attributable to Wheels Up Experience Inc. | $ | (294,217) | $ | (339,635) | $ | 45,418 | (13) | % | |||||||||||||||
| Net loss per share of Class A common stock: | |||||||||||||||||||||||
| Basic and Diluted | $ | (0.42) | $ | (0.49) | $ | 0.07 | (14) | % | |||||||||||||||
| Weighted-average shares of Class A common stock outstanding: | |||||||||||||||||||||||
| Basic and Diluted | 705,991,790 | 697,713,626 | 8,278,164 | 1 | % | ||||||||||||||||||
WHEELS UP EXPERIENCE INC.
CONSOLIDATED BALANCE SHEETS
(Unaudited, in thousands, except share data)
| December 31, 2025 | December 31, 2024 | ||||||||||
| ASSETS | |||||||||||
| Current assets: | |||||||||||
| Cash and cash equivalents | $ | 133,926 | $ | 216,426 | |||||||
| Accounts receivable, net | 24,249 | 32,316 | |||||||||
| Other receivables | 1,493 | 1,182 | |||||||||
| Parts and supplies inventories, net | 11,586 | 12,177 | |||||||||
| Aircraft held for sale | 18,463 | 35,663 | |||||||||
| Prepaid expenses | 27,091 | 23,546 | |||||||||
| Other current assets | 32,549 | 10,759 | |||||||||
| Total current assets | 249,357 | 332,069 | |||||||||
| Property and equipment, net | 219,729 | 348,339 | |||||||||
| Operating lease right-of-use assets | 111,886 | 56,911 | |||||||||
| Goodwill | 209,897 | 217,045 | |||||||||
| Intangible assets, net | 75,102 | 96,904 | |||||||||
| Restricted cash | 30,577 | 30,042 | |||||||||
| Other non-current assets | 72,266 | 76,701 | |||||||||
| Total assets | $ | 968,814 | $ | 1,158,011 | |||||||
| LIABILITIES AND EQUITY | |||||||||||
| Current liabilities: | |||||||||||
| Current maturities of long-term debt | $ | 19,039 | $ | 31,748 | |||||||
| Accounts payable | 20,443 | 29,977 | |||||||||
| Accrued expenses | 104,010 | 89,484 | |||||||||
| Deferred revenue, current | 738,852 | 749,432 | |||||||||
| Operating lease liabilities, current | 16,891 | 13,953 | |||||||||
| Intangible liabilities, current | 1,525 | 1,525 | |||||||||
| Other current liabilities | 6,796 | 1,165 | |||||||||
| Total current liabilities | 907,556 | 917,284 | |||||||||
| Long-term debt, net | 316,358 | 376,308 | |||||||||
| Deferred revenue, non-current | — | 180 | |||||||||
| Operating lease liabilities, non-current | 121,067 | 50,810 | |||||||||
| Warrant liability | 20 | 20 | |||||||||
| Intangible liabilities, non-current | 7,626 | 9,152 | |||||||||
| Other non-current liabilities | 8,288 | 485 | |||||||||
| Total liabilities | 1,360,915 | 1,354,239 | |||||||||
| Mezzanine equity: | |||||||||||
| Executive performance award | — | 5,881 | |||||||||
| Total mezzanine equity | — | 5,881 | |||||||||
| Stockholders’ equity: | |||||||||||
Common stock, $0.0001 par value; 1,500,000,000 authorized; 723,590,076 and 698,342,097 shares issued and 722,017,754 and 697,902,646 shares outstanding as of as of December 31, 2025 and December 31, 2024, respectively | 72 | 70 | |||||||||
| Additional paid-in capital | 2,020,408 | 1,921,581 | |||||||||
| Accumulated deficit | (2,397,112) | (2,102,895) | |||||||||
| Accumulated other comprehensive loss | (5,633) | (12,662) | |||||||||
| Treasury stock, at cost, 1,572,322 and 439,451 shares, respectively | (9,837) | (8,203) | |||||||||
| Total Wheels Up Experience Inc. stockholders’ equity | (392,101) | (202,109) | |||||||||
| Non-controlling interests | — | — | |||||||||
| Total stockholders’ equity | (392,101) | (202,109) | |||||||||
| Total liabilities and equity | $ | 968,814 | $ | 1,158,011 | |||||||
WHEELS UP EXPERIENCE INC.
CONSOLIDATED STATEMENTS OF CASH FLOWS
(Unaudited, in thousands)
| Year Ended December 31, | |||||||||||
| 2025 | 2024 | ||||||||||
| Cash flows from operating activities: | |||||||||||
| Net loss | $ | (294,217) | $ | (339,635) | |||||||
| Adjustments to reconcile net loss to net cash used in operating activities: | |||||||||||
| Depreciation and amortization | 61,171 | 56,546 | |||||||||
| Amortization of deferred financing costs and debt discount | 17,522 | 8,711 | |||||||||
| Payment in kind interest | 54,216 | 43,412 | |||||||||
| Equity-based compensation | 45,430 | 45,977 | |||||||||
| Reserve for excess and obsolete inventory | 3,622 | 12,063 | |||||||||
| Impairment of lease related assets | 20,195 | — | |||||||||
| Loss on extinguishment of debt | 119 | 17,714 | |||||||||
| Gain on sale of aircraft held for sale | (55,217) | (4,622) | |||||||||
| Other | (13,839) | (2,060) | |||||||||
| Changes in assets and liabilities: | |||||||||||
| Accounts receivable | 2,528 | 2,794 | |||||||||
| Other receivables | (309) | 4,349 | |||||||||
| Parts and supplies inventories | (3,173) | 2,861 | |||||||||
| Prepaid expenses | (618) | 30,117 | |||||||||
| Other non-current assets | 5,774 | 33,803 | |||||||||
| Accounts payable | (9,252) | (2,882) | |||||||||
| Accrued expenses | 13,979 | (11,233) | |||||||||
| Deferred revenue | (12,959) | 25,383 | |||||||||
| Other assets and liabilities | (1,267) | (1,186) | |||||||||
| Net cash used in operating activities | (166,295) | (77,888) | |||||||||
| Cash flows from investing activities: | |||||||||||
| Purchases of property and equipment | (93,629) | (122,811) | |||||||||
| Capitalized software development costs | (11,469) | (15,021) | |||||||||
| Proceeds from sale of divested business | 20,689 | 7,894 | |||||||||
| Purchases of aircraft held for sale | (11,760) | (2,408) | |||||||||
| Proceeds from sale of aircraft held for sale, net | 271,587 | 85,560 | |||||||||
| Other | 4,950 | 105 | |||||||||
| Net cash (used in) provided by investing activities | 180,368 | (46,681) | |||||||||
| Cash flows from financing activities: | |||||||||||
| Proceeds from sales of shares of Common Stock | 47,517 | — | |||||||||
| Purchase of shares for treasury | (1,633) | (485) | |||||||||
| Proceeds from long-term debt | 65,743 | 327,201 | |||||||||
| Payment of debt issuance costs | (152) | (1,594) | |||||||||
| Repayments of long-term debt | (209,988) | (246,460) | |||||||||
| Net cash (used in) provided by financing activities | (98,513) | 78,662 | |||||||||
| Effect of exchange rate changes on cash | 2,475 | (450) | |||||||||
| Net decrease in cash, cash equivalents and restricted cash | (81,965) | (46,357) | |||||||||
| Cash, cash equivalents and restricted cash, beginning of period | 246,468 | 292,825 | |||||||||
| Cash, cash equivalents and restricted cash, end of period | $ | 164,503 | $ | 246,468 | |||||||
Definitions of Key Operating Metrics
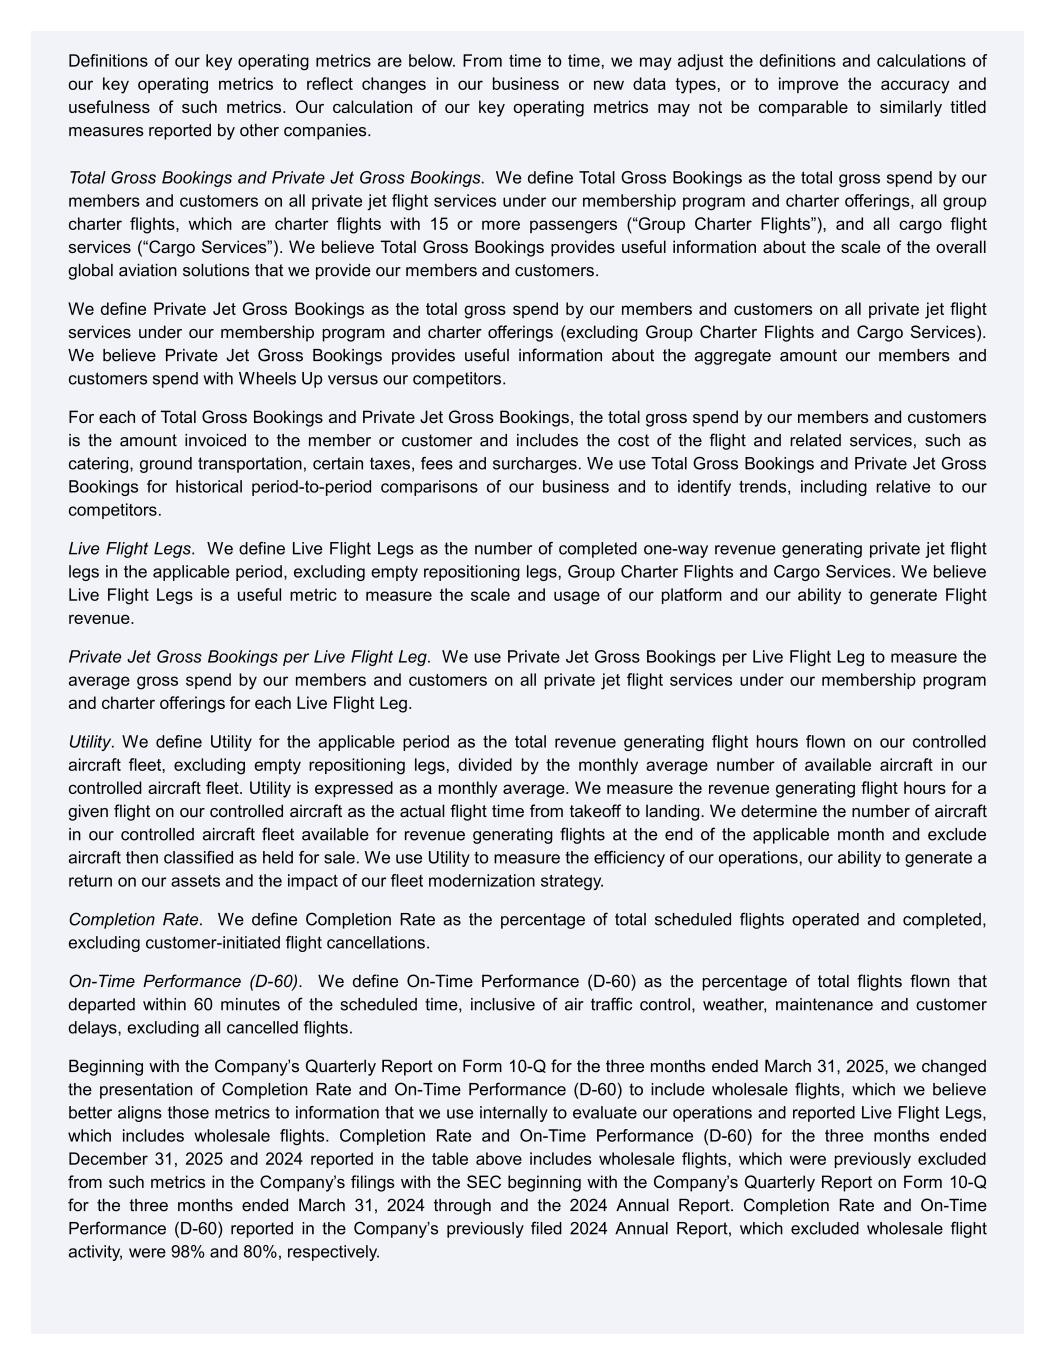
Definitions of our key operating metrics are below. From time to time, we may adjust the definitions and calculations of our key operating metrics to reflect changes in our business or new data types, or to improve the accuracy and usefulness of such metrics. Our calculation of our key operating metrics may not be comparable to similarly titled measures reported by other companies.
Total Gross Bookings and Private Jet Gross Bookings. We define Total Gross Bookings as the total gross spend by our members and customers on all private jet flight services under our membership program and charter offerings, all group charter flights, which are charter flights with 15 or more passengers (“Group Charter Flights”), and all cargo flight services (“Cargo Services”). We believe Total Gross Bookings provides useful information about the scale of the overall global aviation solutions that we provide our members and customers.
We define Private Jet Gross Bookings as the total gross spend by our members and customers on all private jet flight services under our membership program and charter offerings (excluding Group Charter Flights and Cargo Services). We believe Private Jet Gross Bookings provides useful information about the aggregate amount our members and customers spend with Wheels Up versus our competitors.
For each of Total Gross Bookings and Private Jet Gross Bookings, the total gross spend by our members and customers is the amount invoiced to the member or customer and includes the cost of the flight and related services, such as catering, ground transportation, certain taxes, fees and surcharges. We use Total Gross Bookings and Private Jet Gross Bookings for historical period-to-period comparisons of our business and to identify trends, including relative to our competitors.
Live Flight Legs. We define Live Flight Legs as the number of completed one-way revenue generating private jet flight legs in the applicable period, excluding empty repositioning legs, Group Charter Flights and Cargo Services. We believe Live Flight Legs is a useful metric to measure the scale and usage of our platform, and our ability to generate Flight revenue.
Private Jet Gross Bookings per Live Flight Leg. We use Private Jet Gross Bookings per Live Flight Leg to measure the average gross spend by our members and customers on all private jet flight services under our membership program and charter offerings for each Live Flight Leg.
Utility. We define Utility for the applicable period as the total revenue generating flight hours flown on our controlled aircraft fleet, excluding empty repositioning legs, divided by the monthly average number of available aircraft in our controlled aircraft fleet. Utility is expressed as a monthly average. We measure the revenue generating flight hours for a given flight on our controlled aircraft as the actual flight time from takeoff to landing. We determine the number of aircraft in our controlled aircraft fleet available for revenue generating flights at the end of the applicable month and exclude aircraft then classified as held for sale. We use Utility to measure the efficiency of our operations, our ability to generate a return on our assets and the impact of our fleet modernization strategy.
Completion Rate. We define Completion Rate as the percentage of total scheduled flights operated and completed, excluding customer-initiated flight cancellations.
On-Time Performance (D-60). We define On-Time Performance (D-60) as the percentage of total flights flown that departed within 60 minutes of the scheduled time, inclusive of air traffic control, weather, maintenance and customer delays, excluding all cancelled flights.
Beginning with the Company’s Quarterly Report on Form 10-Q for the three months ended March 31, 2025, we changed the presentation of Completion Rate and On-Time Performance (D-60) to include wholesale flights, which we believe better aligns those metrics to information that we use internally to evaluate our operations and reported Live Flight Legs, which includes wholesale flights. Completion Rate and On-Time Performance (D-60) for the three months ended December 31, 2025 and 2024 reported in the table above includes wholesale flights, which were previously excluded from such metrics in the Company’s filings with the SEC beginning with the Company’s Quarterly Report on Form 10-Q for the three months ended March 31, 2024 through and including the 2024 Annual Report. Completion Rate and On-Time Performance (D-60) reported in the Company’s previously filed 2024 Annual Report, which excluded wholesale flight activity, were 98% and 80%, respectively.
Definitions of Non-GAAP Financial Measures
Adjusted EBITDA and Adjusted EBITDAR. We calculate Adjusted EBITDA as Net income (loss) adjusted for (i) Interest income (expense), (ii) Income tax expense, (iii) Depreciation and amortization, (iv) Equity-based compensation expense, (v) Acquisition and integration related expenses and (vi) other items not indicative of our ongoing operating performance, including but not limited to, restructuring charges. We calculate Adjusted EBITDAR as Adjusted EBITDA, as further adjusted for aircraft lease costs.
We include Adjusted EBITDA and Adjusted EBITDAR as supplemental measures for assessing operating performance, to be used in conjunction with bonus program target achievement determinations, strategic internal planning, annual budgeting, allocating resources and making operating decisions, and to provide useful information for historical period-to-period comparisons of our business, as each measure removes the effect of certain non-cash expenses and other items not indicative of our ongoing operating performance.
Adjusted EBITDAR is included as a supplemental measure, because we believe it provides an alternate presentation to adjust for the effects of financing in general and the accounting effects of capital spending and acquisitions of aircraft, which may be acquired outright, acquired subject to acquisition debt, including under the Revolving Equipment Notes Facility, by capital lease or by operating lease, each of which may vary significantly between periods and results in a different accounting presentation.
Adjusted Contribution and Adjusted Contribution Margin. We calculate Adjusted Contribution as Gross profit (loss) excluding Depreciation and amortization and adjusted further for equity-based compensation included in Cost of revenue and other items included in Cost of revenue that are not indicative of our ongoing operating performance. Adjusted Contribution Margin is calculated by dividing Adjusted Contribution by total Revenue.
We include Adjusted Contribution and Adjusted Contribution Margin as supplemental measures for assessing operating performance and for the following: to be used to understand our ability to achieve profitability over time through scale and leveraging costs; and to provide useful information for historical period-to-period comparisons of our business and to identify trends.
Reconciliations of Non-GAAP Financial Measures
Adjusted EBITDA and Adjusted EBITDAR
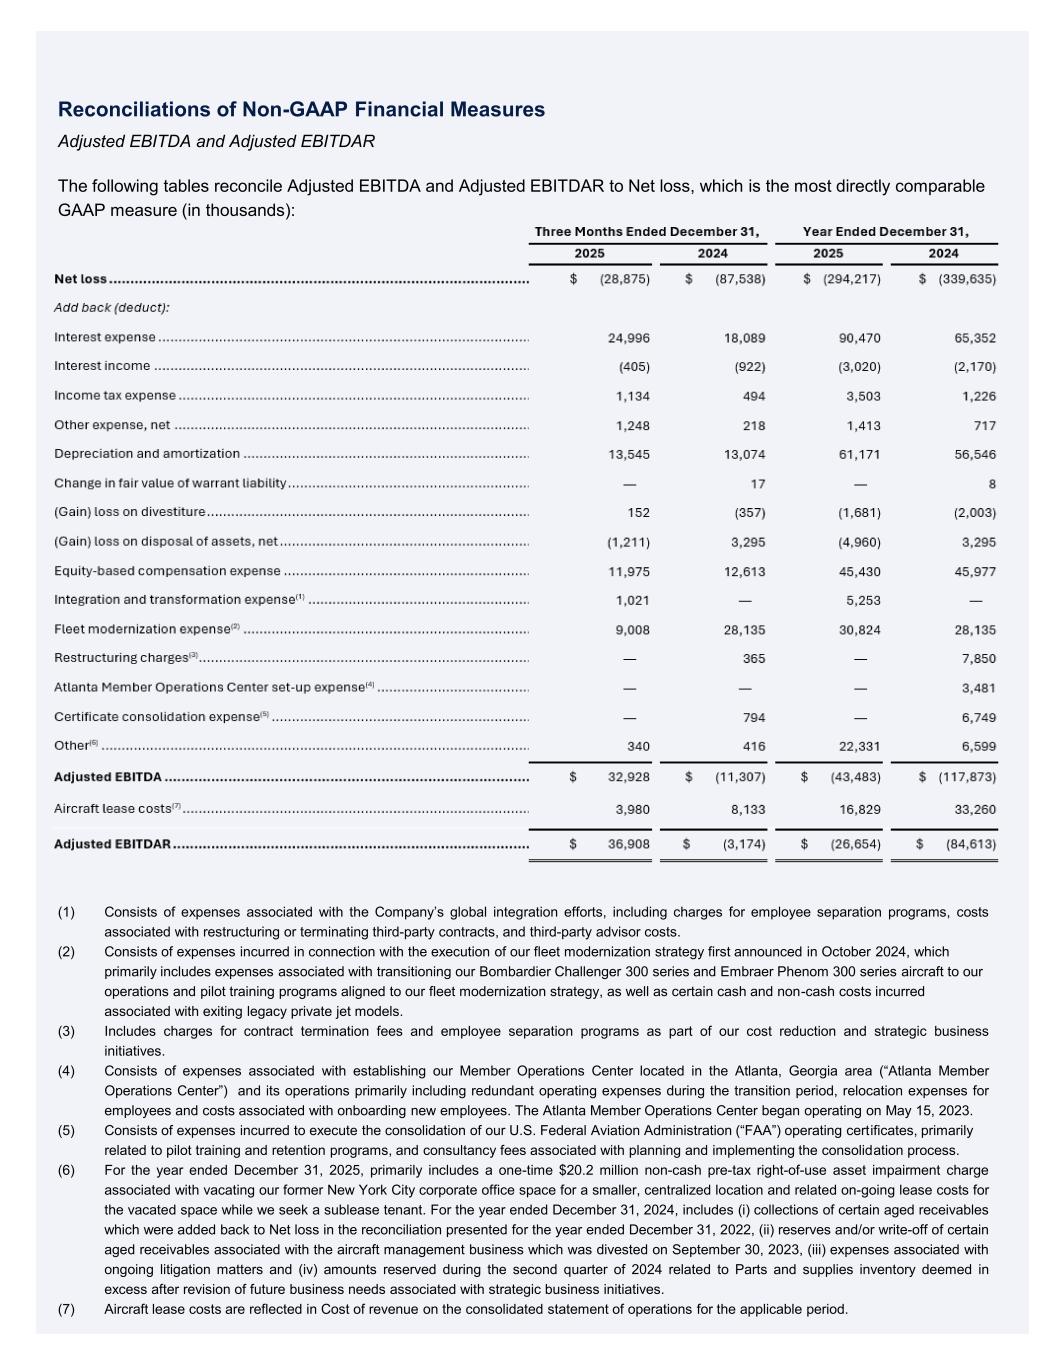
The following tables reconcile Adjusted EBITDA and Adjusted EBITDAR to Net loss, which is the most directly comparable GAAP measure (in thousands):
| Three Months Ended December 31, | Year Ended December 31, | ||||||||||||||||||||||
| 2025 | 2024 | 2025 | 2024 | ||||||||||||||||||||
| Net loss | $ | (28,875) | $ | (87,538) | $ | (294,217) | $ | (339,635) | |||||||||||||||
| Add back (deduct): | |||||||||||||||||||||||
| Interest expense | 24,996 | 18,089 | 90,470 | 65,352 | |||||||||||||||||||
| Interest income | (405) | (922) | (3,020) | (2,170) | |||||||||||||||||||
| Income tax expense | 1,134 | 494 | 3,503 | 1,226 | |||||||||||||||||||
| Other expense, net | 1,248 | 218 | 1,413 | 717 | |||||||||||||||||||
| Depreciation and amortization | 13,545 | 13,074 | 61,171 | 56,546 | |||||||||||||||||||
| Change in fair value of warrant liability | — | 17 | — | 8 | |||||||||||||||||||
| (Gain) loss on divestiture | 152 | (357) | (1,681) | (2,003) | |||||||||||||||||||
| (Gain) loss on disposal of assets, net | (1,211) | 3,295 | (4,960) | 3,295 | |||||||||||||||||||
| Equity-based compensation expense | 11,975 | 12,613 | 45,430 | 45,977 | |||||||||||||||||||
Integration and transformation expense(1) | 1,021 | — | 5,253 | — | |||||||||||||||||||
Fleet modernization expense(2) | 9,008 | 28,135 | 30,824 | 28,135 | |||||||||||||||||||
Restructuring charges(3) | — | 365 | — | 7,850 | |||||||||||||||||||
Atlanta Member Operations Center set-up expense(4) | — | — | — | 3,481 | |||||||||||||||||||
Certificate consolidation expense(5) | — | 794 | — | 6,749 | |||||||||||||||||||
Other(6) | 340 | 416 | 22,331 | 6,599 | |||||||||||||||||||
| Adjusted EBITDA | $ | 32,928 | $ | (11,307) | $ | (43,483) | $ | (117,873) | |||||||||||||||
Aircraft lease costs(7) | 3,980 | 8,133 | 16,829 | 33,260 | |||||||||||||||||||
| Adjusted EBITDAR | $ | 36,908 | $ | (3,174) | $ | (26,654) | $ | (84,613) | |||||||||||||||
(1)Consists of expenses associated with the Company’s global integration efforts, including charges for employee separation programs and third-party advisor costs.
(2)Consists of expenses incurred in connection with the execution of our fleet modernization strategy first announced in October 2024, which primarily includes expenses associated with transitioning our Bombardier Challenger 300 series and Embraer Phenom 300 series aircraft to our operations and pilot training programs aligned to our fleet modernization strategy, as well as certain cash and non-cash costs incurred associated with exiting legacy private jet models.
(3)Includes charges for contract termination fees and employee separation programs as part of our cost reduction and strategic business initiatives.
(4)Consists of expenses associated with establishing our Member Operations Center located in the Atlanta, Georgia area (“Atlanta Member Operations Center”) and its operations primarily including redundant operating expenses during the transition period, relocation expenses for employees and costs associated with onboarding new employees. The Atlanta Member Operations Center began operating on May 15, 2023.
(5)Consists of expenses incurred to execute the consolidation of our U.S. Federal Aviation Administration (“FAA”) operating certificates, primarily related to pilot training and retention programs, and consultancy fees associated with planning and implementing the consolidation process.
(6)For the year ended December 31, 2025, primarily includes a one-time $20.2 million non-cash pre-tax right-of-use asset impairment charge associated with vacating our former New York City corporate office space for a smaller, centralized location and related on-going lease costs for the vacated space while we seek a sublease tenant. For the year ended December 31, 2024, includes (i) collections of certain aged receivables which were added back to Net loss in the reconciliation presented for the year ended December 31, 2022, (ii) reserves and/or write-off of certain aged receivables associated with the aircraft management business which was divested on September 30, 2023, (iii) expenses associated with litigation matters and (iv) amounts reserved during the second quarter of 2024 related to Parts and supplies inventory deemed in excess after revision of future business needs associated with strategic business initiatives.
(7)Aircraft lease costs are reflected in Cost of revenue on the consolidated statement of operations for the applicable period.
Refer to “Supplemental Expense Information” below, for further information.
Adjusted Contribution and Adjusted Contribution Margin
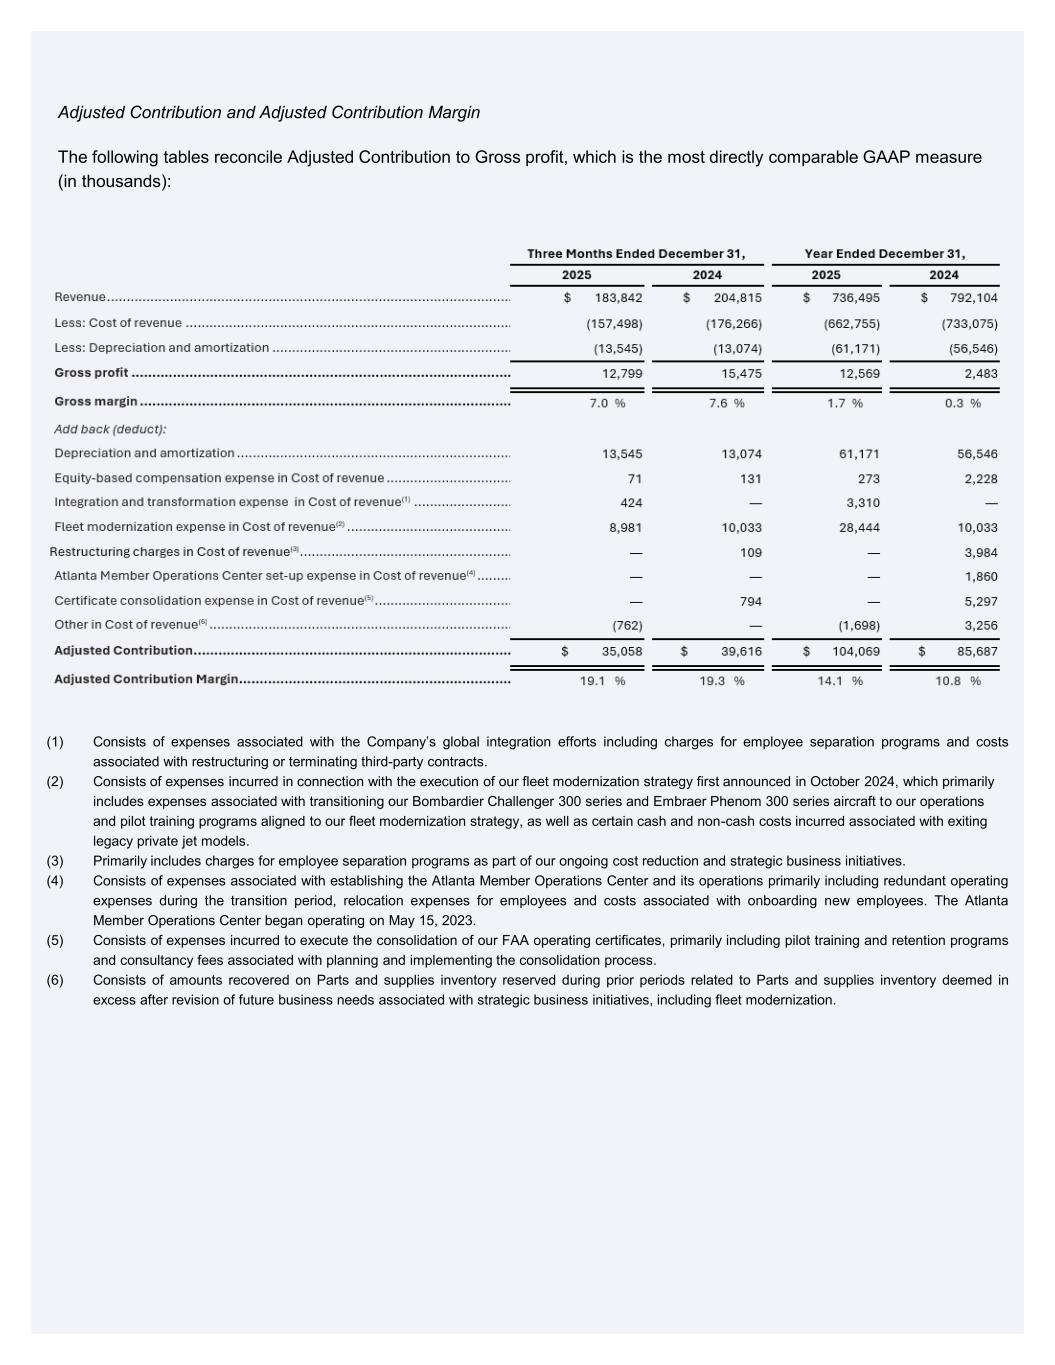
The following tables reconcile Adjusted Contribution to Gross profit, which is the most directly comparable GAAP measure (in thousands):
| Three Months Ended December 31, | Year Ended December 31, | ||||||||||||||||||||||
| 2025 | 2024 | 2025 | 2024 | ||||||||||||||||||||
| Revenue | $ | 183,842 | $ | 204,815 | $ | 736,495 | $ | 792,104 | |||||||||||||||
| Less: Cost of revenue | (157,498) | (176,266) | (662,755) | (733,075) | |||||||||||||||||||
| Less: Depreciation and amortization | (13,545) | (13,074) | (61,171) | (56,546) | |||||||||||||||||||
| Gross profit | 12,799 | 15,475 | 12,569 | 2,483 | |||||||||||||||||||
| Gross margin | 7.0% | 7.6% | 1.7% | 0.3% | |||||||||||||||||||
| Add back (deduct): | |||||||||||||||||||||||
| Depreciation and amortization | 13,545 | 13,074 | 61,171 | 56,546 | |||||||||||||||||||
| Equity-based compensation expense in Cost of revenue | 71 | 131 | 273 | 2,228 | |||||||||||||||||||
Integration and transformation expense in Cost of revenue(1) | 424 | — | 3,310 | — | |||||||||||||||||||
Fleet modernization expense in Cost of revenue(2) | 8,981 | 10,033 | 28,444 | 10,033 | |||||||||||||||||||
Restructuring charges in Cost of revenue(3) | — | 109 | — | 3,984 | |||||||||||||||||||
Atlanta Member Operations Center set-up expense in Cost of revenue(4) | — | — | — | 1,860 | |||||||||||||||||||
Certificate consolidation expense in Cost of revenue(5) | — | 794 | — | 5,297 | |||||||||||||||||||
Other in Cost of revenue(6) | (762) | — | (1,698) | 3,256 | |||||||||||||||||||
| Adjusted Contribution | $ | 35,058 | $ | 39,616 | $ | 104,069 | $ | 85,687 | |||||||||||||||
| Adjusted Contribution Margin | 19.1% | 19.3% | 14.1% | 10.8% | |||||||||||||||||||
(1)Consists of expenses associated with the Company’s global integration efforts including charges for employee separation programs.
(2)Consists of expenses incurred in connection with the execution of our fleet modernization strategy first announced in October 2024, which primarily includes expenses associated with transitioning our Bombardier Challenger 300 series and Embraer Phenom 300 series aircraft to our operations and pilot training programs aligned to our fleet modernization strategy, as well as certain cash and non-cash costs incurred associated with exiting legacy private jet models.
(3)Primarily includes charges for employee separation programs as part of our ongoing cost reduction and strategic business initiatives.
(4)Consists of expenses associated with establishing the Atlanta Member Operations Center and its operations primarily including redundant operating expenses during the transition period, relocation expenses for employees and costs associated with onboarding new employees. The Atlanta Member Operations Center began operating on May 15, 2023.
(5)Consists of expenses incurred to execute the consolidation of our FAA operating certificates, primarily including pilot training and retention programs and consultancy fees associated with planning and implementing the consolidation process.
(6)Consists of amounts recovered on Parts and supplies inventory reserved during prior periods related to Parts and supplies inventory deemed in excess after revision of future business needs associated with strategic business initiatives, including fleet modernization.
Supplemental Revenue Information
| (In thousands) | Three months ended December 31, | Change in | |||||||||||||||||||||
| 2025 | 2024 | $ | % | ||||||||||||||||||||
| Membership | $ | 5,911 | $ | 11,483 | $ | (5,572) | (49) | % | |||||||||||||||
| Flight | 161,621 | 163,897 | (2,276) | (1) | % | ||||||||||||||||||
Other | 16,310 | 29,435 | (13,125) | (45) | % | ||||||||||||||||||
Total | $ | 183,842 | $ | 204,815 | $ | (20,973) | (10) | % | |||||||||||||||
| (In thousands) | Year ended December 31, | Change in | |||||||||||||||||||||
| 2025 | 2024 | $ | % | ||||||||||||||||||||
| Membership | $ | 28,887 | $ | 57,614 | $ | (28,727) | (50) | % | |||||||||||||||
| Flight | 622,688 | 633,865 | (11,177) | (2) | % | ||||||||||||||||||
Other | 84,920 | 100,625 | (15,705) | (16) | % | ||||||||||||||||||
Total | $ | 736,495 | $ | 792,104 | $ | (55,609) | (7) | % | |||||||||||||||
Supplemental Expense Information
| (In thousands) | Three Months Ended December 31, 2025 | ||||||||||||||||||||||||||||
| Cost of revenue | Technology and development | Sales and marketing | General and administrative | Total | |||||||||||||||||||||||||
| Equity-based compensation expense | $ | 71 | $ | 195 | $ | 349 | $ | 11,360 | $ | 11,975 | |||||||||||||||||||
| Integration and transformation | 424 | 284 | 73 | 240 | 1,021 | ||||||||||||||||||||||||
| Fleet modernization expense | 8,981 | — | — | 27 | 9,008 | ||||||||||||||||||||||||
| Other | (762) | — | — | 1,102 | 340 | ||||||||||||||||||||||||
| (In thousands) | Year Ended December 31, 2025 | ||||||||||||||||||||||||||||
| Cost of revenue | Technology and development | Sales and marketing | General and administrative | Total | |||||||||||||||||||||||||
| Equity-based compensation expense | $ | 273 | $ | 1,365 | $ | 1,139 | $ | 42,653 | $ | 45,430 | |||||||||||||||||||
| Integration and transformation | 3,310 | 284 | 573 | 1,086 | 5,253 | ||||||||||||||||||||||||
| Fleet Modernization | 28,444 | — | 72 | 2,308 | 30,824 | ||||||||||||||||||||||||
| Other | (1,698) | — | — | 24,029 | 22,331 | ||||||||||||||||||||||||
| (In thousands) | Three Months Ended December 31, 2024 | ||||||||||||||||||||||||||||
| Cost of revenue | Technology and development | Sales and marketing | General and administrative | Total | |||||||||||||||||||||||||
| Equity-based compensation expense | $ | 131 | $ | 421 | $ | 233 | $ | 11,828 | $ | 12,613 | |||||||||||||||||||
| Restructuring charges | 109 | — | — | 256 | 365 | ||||||||||||||||||||||||
Fleet modernization expense(1) | 10,033 | — | 33 | 3,666 | 28,135 | ||||||||||||||||||||||||
| Certificate consolidation expense | 794 | — | — | — | 794 | ||||||||||||||||||||||||
| Other | — | — | — | 416 | 416 | ||||||||||||||||||||||||
| (In thousands) | Year Ended December 31, 2024 | ||||||||||||||||||||||||||||
| Cost of revenue | Technology and development | Sales and marketing | General and administrative | Total | |||||||||||||||||||||||||
| Equity-based compensation expense | $ | 2,228 | $ | 1,302 | $ | 661 | $ | 41,786 | $ | 45,977 | |||||||||||||||||||
| Restructuring charges | 3,984 | — | 1,648 | 2,218 | 7,850 | ||||||||||||||||||||||||
Fleet modernization expense(1) | 10,033 | — | 33 | 3,666 | 28,135 | ||||||||||||||||||||||||
| Atlanta Member Operations Center set-up expense | 1,860 | — | — | 1,621 | 3,481 | ||||||||||||||||||||||||
| Certificate consolidation expense | 5,297 | — | — | 1,452 | 6,749 | ||||||||||||||||||||||||
| Other | 3,256 | — | — | 3,343 | 6,599 | ||||||||||||||||||||||||
__________________
(1)Total Fleet modernization expense includes loss on debt extinguishment of $14.4 million for the three and twelve months December 31, 2024 associated with the redemption in-full of the Company’s former 2022 equipment notes on November 13, 2024.
Investor Letter EX-99.2
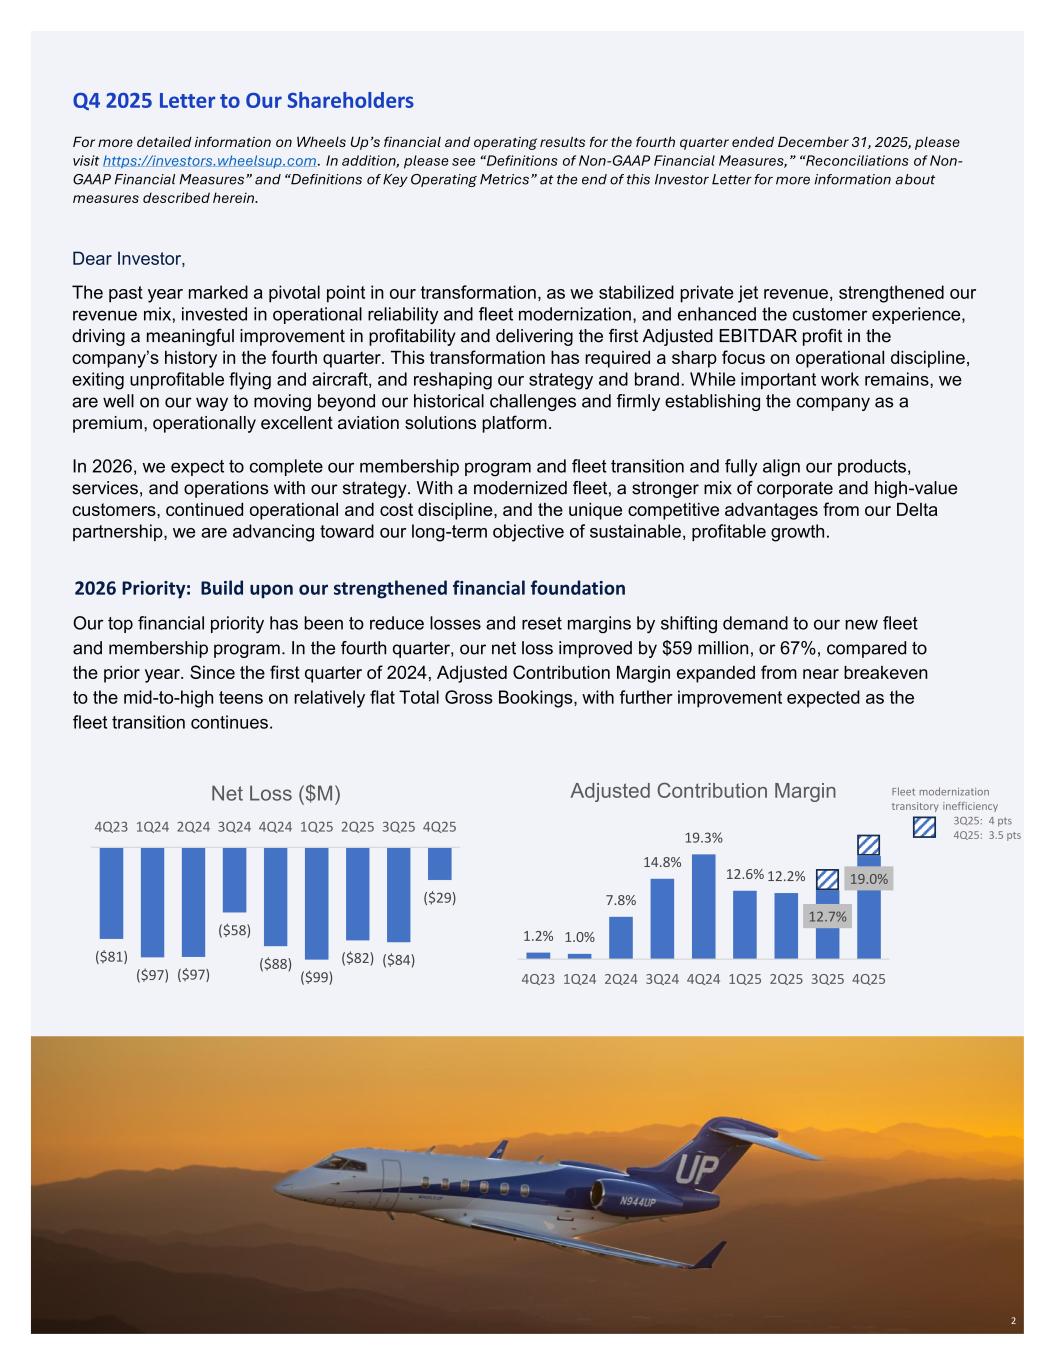
Dear Investor, The past year marked a pivotal point in our transformation, as we stabilized private jet revenue, strengthened our revenue mix, invested in operational reliability and fleet modernization, and enhanced the customer experience, driving a meaningful improvement in profitability and delivering the first Adjusted EBITDAR profit in the company’s history in the fourth quarter. This transformation has required a sharp focus on operational discipline, exiting unprofitable flying and aircraft, and reshaping our strategy and brand. While important work remains, we are well on our way to moving beyond our historical challenges and firmly establishing the company as a premium, operationally excellent aviation solutions platform. In 2026, we expect to complete our membership program and fleet transition and fully align our products, services, and operations with our strategy. With a modernized fleet, a stronger mix of corporate and high-value customers, continued operational and cost discipline, and the unique competitive advantages from our Delta partnership, we are advancing toward our long-term objective of sustainable, profitable growth. Q4 2025 Letter to Our Shareholders For more detailed information on Wheels Up’s financial and operating results for the fourth quarter ended December 31, 2025, please visit https://investors.wheelsup.com. In addition, please see “Definitions of Non-GAAP Financial Measures,” “Reconciliations of Non- GAAP Financial Measures” and “Definitions of Key Operating Metrics” at the end of this Investor Letter for more information about measures described herein. 2026 Priority: Build upon our strengthened financial foundation Our top financial priority has been to reduce losses and reset margins by shifting demand to our new fleet and membership program. In the fourth quarter, our net loss improved by $59 million, or 67%, compared to the prior year. Since the first quarter of 2024, Adjusted Contribution Margin expanded from near breakeven to the mid-to-high teens on relatively flat Total Gross Bookings, with further improvement expected as the fleet transition continues. ($81) ($97) ($97) ($58) ($88) ($99) ($82) ($84) ($29) 4Q23 1Q24 2Q24 3Q24 4Q24 1Q25 2Q25 3Q25 4Q25 Net Loss ($M) Add image 2 1.2% 1.0% 7.8% 14.8% 19.3% 12.6% 12.2% 12.7% 19.0% 4Q23 1Q24 2Q24 3Q24 4Q24 1Q25 2Q25 3Q25 4Q25 Adjusted Contribution Margin Fleet modernization transitory inefficiency 3Q25: 4 pts 4Q25: 3.5 pts
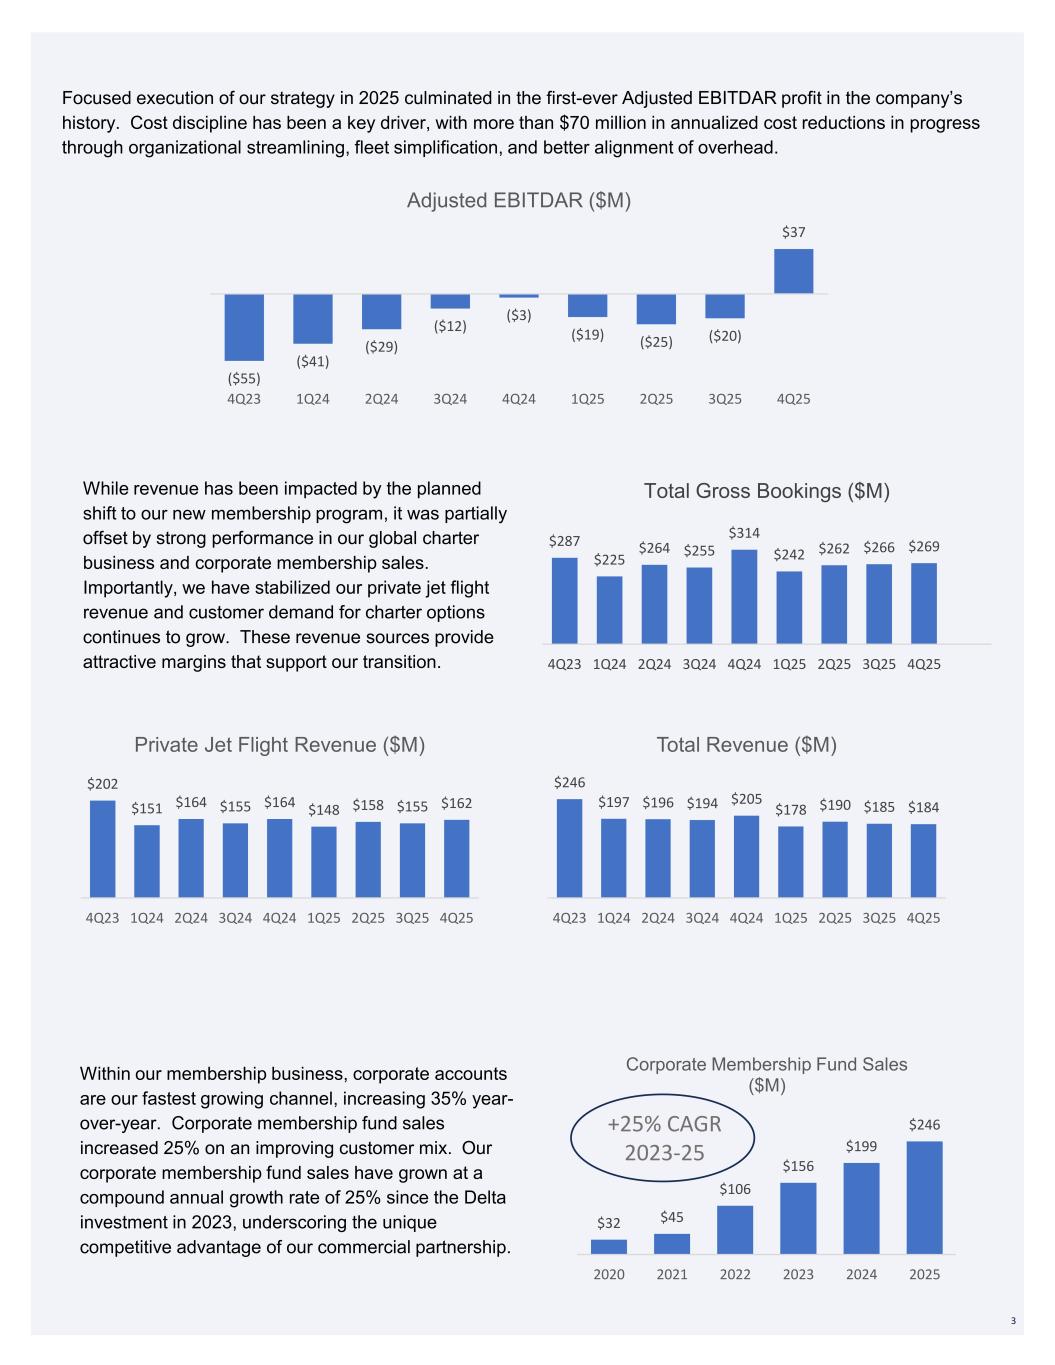
While revenue has been impacted by the planned shift to our new membership program, it was partially offset by strong performance in our global charter business and corporate membership sales. Importantly, we have stabilized our private jet flight revenue and customer demand for charter options continues to grow. These revenue sources provide attractive margins that support our transition. $246 $197 $196 $194 $205 $178 $190 $185 $184 4Q23 1Q24 2Q24 3Q24 4Q24 1Q25 2Q25 3Q25 4Q25 Total Revenue ($M) $287 $225 $264 $255 $314 $242 $262 $266 $269 4Q23 1Q24 2Q24 3Q24 4Q24 1Q25 2Q25 3Q25 4Q25 Total Gross Bookings ($M) Focused execution of our strategy in 2025 culminated in the first-ever Adjusted EBITDAR profit in the company’s history. Cost discipline has been a key driver, with more than $70 million in annualized cost reductions in progress through organizational streamlining, fleet simplification, and better alignment of overhead. Within our membership business, corporate accounts are our fastest growing channel, increasing 35% year- over-year. Corporate membership fund sales increased 25% on an improving customer mix. Our corporate membership fund sales have grown at a compound annual growth rate of 25% since the Delta investment in 2023, underscoring the unique competitive advantage of our commercial partnership. $32 $45 $106 $156 $199 $246 2020 2021 2022 2023 2024 2025 Corporate Membership Fund Sales ($M) +25% CAGR 2023-25 3 ($55) ($41) ($29) ($12) ($3) ($19) ($25) ($20) $37 4Q23 1Q24 2Q24 3Q24 4Q24 1Q25 2Q25 3Q25 4Q25 Adjusted EBITDAR ($M) $202 $151 $164 $155 $164 $148 $158 $155 $162 4Q23 1Q24 2Q24 3Q24 4Q24 1Q25 2Q25 3Q25 4Q25 Private Jet Flight Revenue ($M)
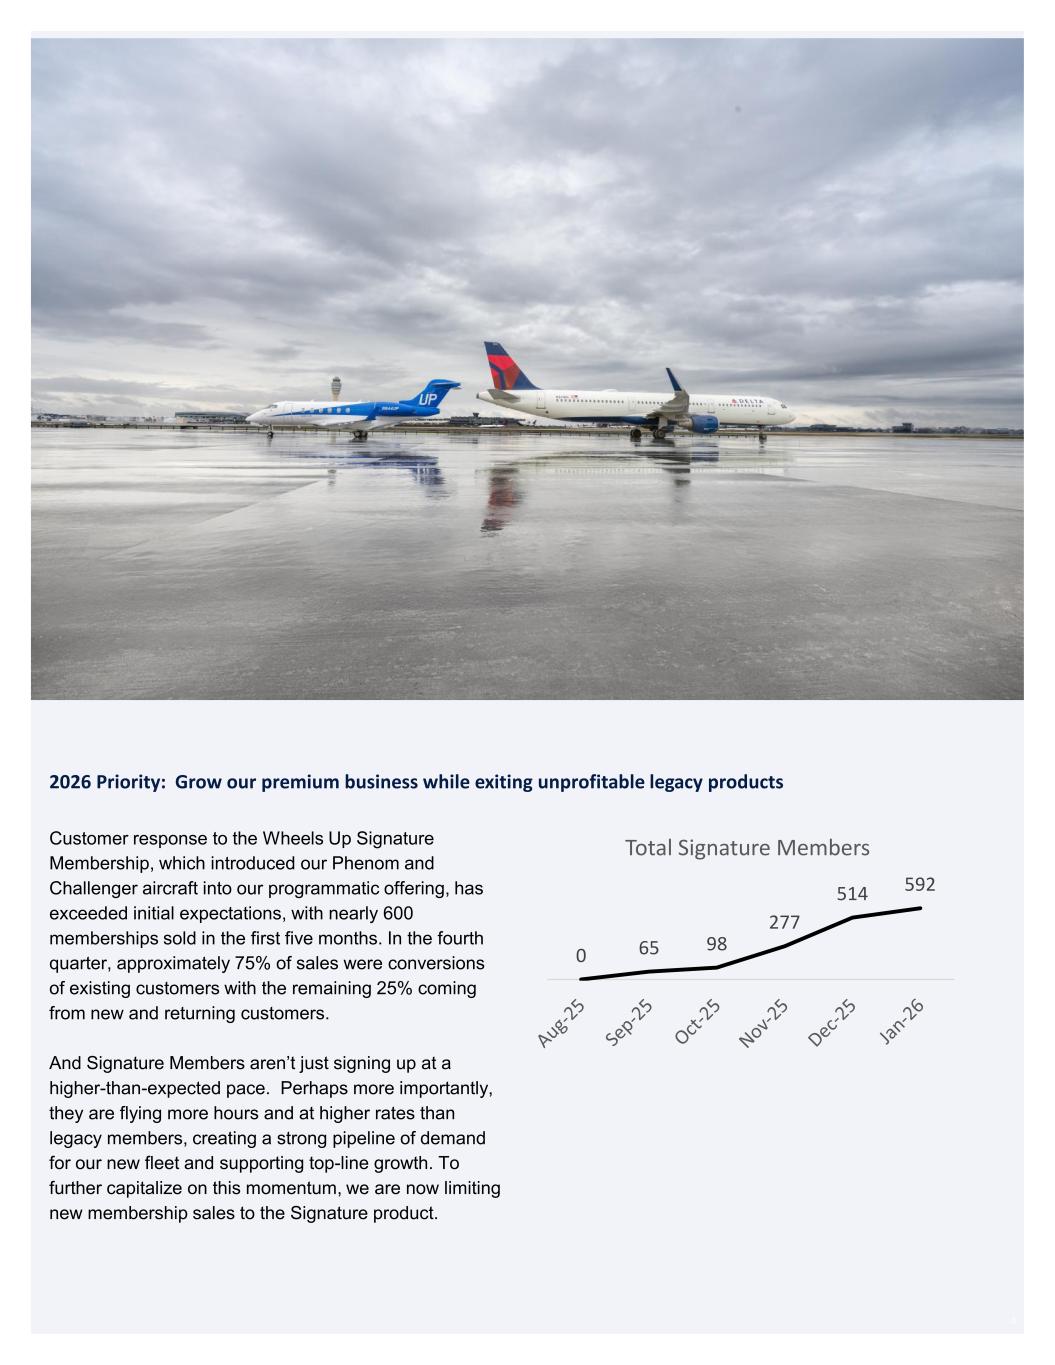
2026 Priority: Grow our premium business while exiting unprofitable legacy products Customer response to the Wheels Up Signature Membership, which introduced our Phenom and Challenger aircraft into our programmatic offering, has exceeded initial expectations, with nearly 600 memberships sold in the first five months. In the fourth quarter, approximately 75% of sales were conversions of existing customers with the remaining 25% coming from new and returning customers. And Signature Members aren’t just signing up at a higher-than-expected pace. Perhaps more importantly, they are flying more hours and at higher rates than legacy members, creating a strong pipeline of demand for our new fleet and supporting top-line growth. To further capitalize on this momentum, we are now limiting new membership sales to the Signature product. 0 65 98 277 514 592 Total Signature Members 4
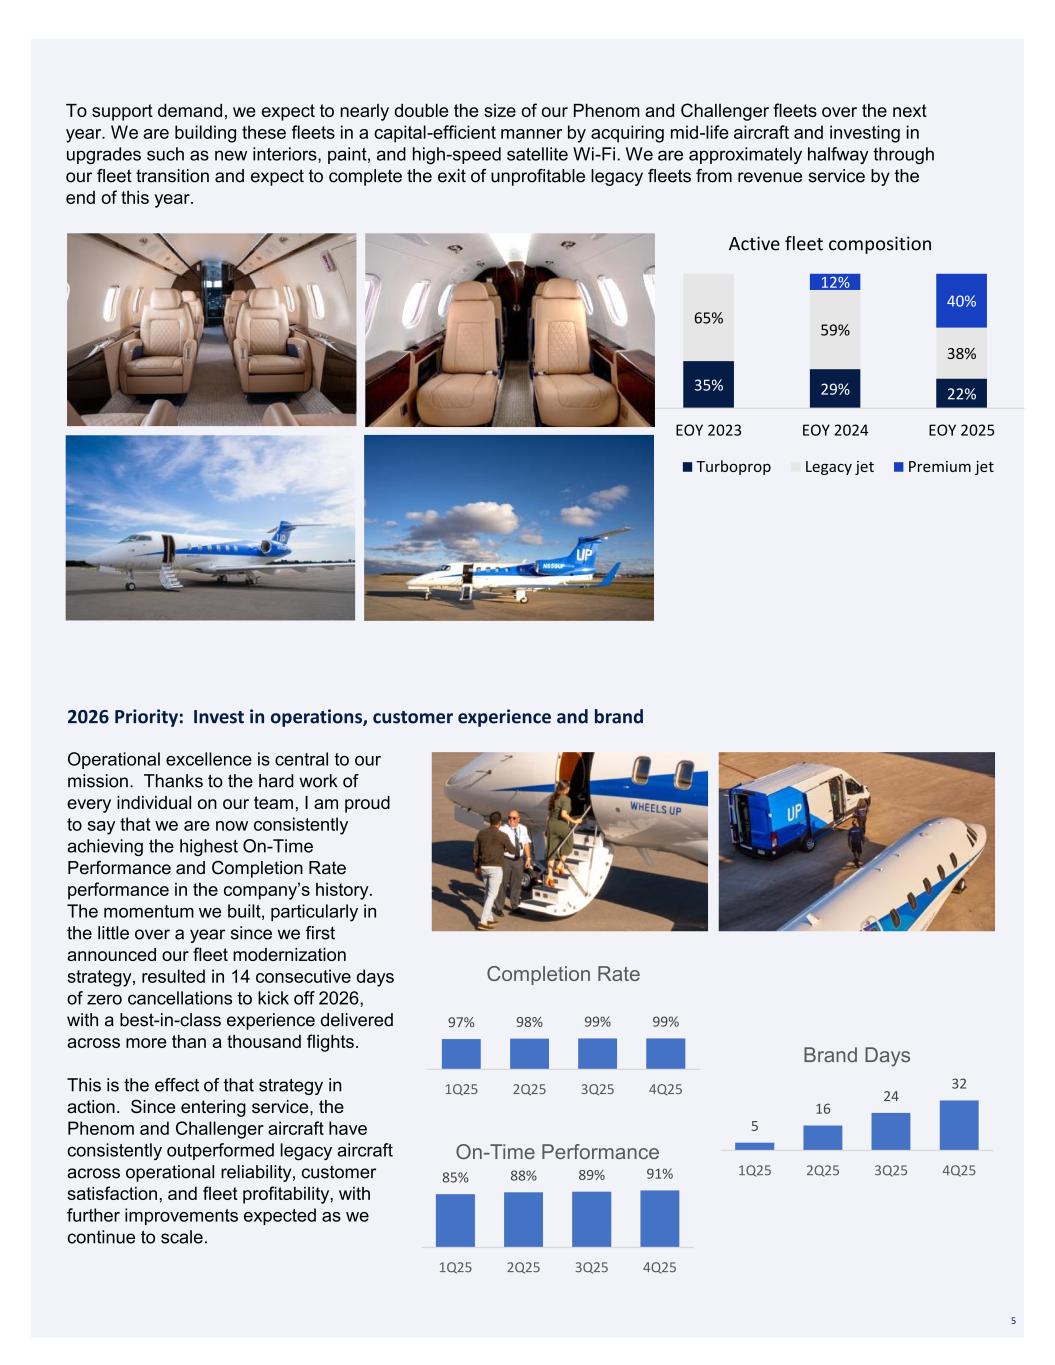
To support demand, we expect to nearly double the size of our Phenom and Challenger fleets over the next year. We are building these fleets in a capital-efficient manner by acquiring mid-life aircraft and investing in upgrades such as new interiors, paint, and high-speed satellite Wi-Fi. We are approximately halfway through our fleet transition and expect to complete the exit of unprofitable legacy fleets from revenue service by the end of this year. 2026 Priority: Invest in operations, customer experience and brand Operational excellence is central to our mission. Thanks to the hard work of every individual on our team, I am proud to say that we are now consistently achieving the highest On-Time Performance and Completion Rate performance in the company’s history. The momentum we built, particularly in the little over a year since we first announced our fleet modernization strategy, resulted in 14 consecutive days of zero cancellations to kick off 2026, with a best-in-class experience delivered across more than a thousand flights. This is the effect of that strategy in action. Since entering service, the Phenom and Challenger aircraft have consistently outperformed legacy aircraft across operational reliability, customer satisfaction, and fleet profitability, with further improvements expected as we continue to scale. 35% 29% 22% 65% 59% 38% 12% 40% EOY 2023 EOY 2024 EOY 2025 Active fleet composition Turboprop Legacy jet Premium jet 5 97% 98% 99% 99% 1Q25 2Q25 3Q25 4Q25 Completion Rate 85% 88% 89% 91% 1Q25 2Q25 3Q25 4Q25 On-Time Performance 5 16 24 32 1Q25 2Q25 3Q25 4Q25 Brand Days
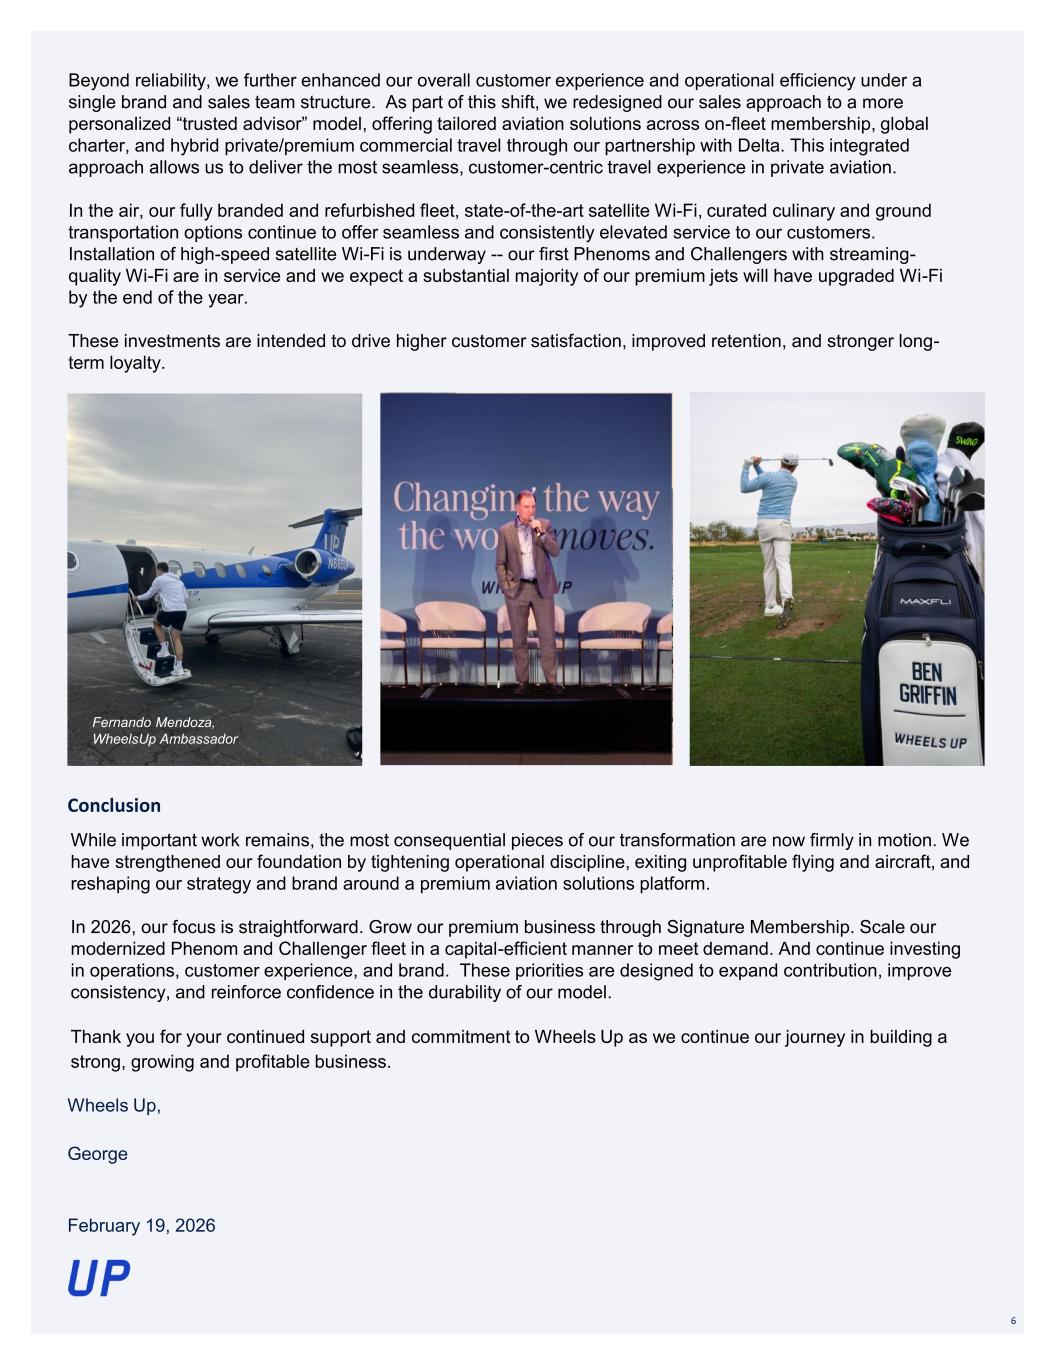
Beyond reliability, we further enhanced our overall customer experience and operational efficiency under a single brand and sales team structure. As part of this shift, we redesigned our sales approach to a more personalized “trusted advisor” model, offering tailored aviation solutions across on-fleet membership, global charter, and hybrid private/premium commercial travel through our partnership with Delta. This integrated approach allows us to deliver the most seamless, customer-centric travel experience in private aviation. In the air, our fully branded and refurbished fleet, state-of-the-art satellite Wi-Fi, curated culinary and ground transportation options continue to offer seamless and consistently elevated service to our customers. Installation of high-speed satellite Wi-Fi is underway -- our first Phenoms and Challengers with streaming- quality Wi-Fi are in service and we expect a substantial majority of our premium jets will have upgraded Wi-Fi by the end of the year. These investments are intended to drive higher customer satisfaction, improved retention, and stronger long- term loyalty. Conclusion While important work remains, the most consequential pieces of our transformation are now firmly in motion. We have strengthened our foundation by tightening operational discipline, exiting unprofitable flying and aircraft, and reshaping our strategy and brand around a premium aviation solutions platform. In 2026, our focus is straightforward. Grow our premium business through Signature Membership. Scale our modernized Phenom and Challenger fleet in a capital-efficient manner to meet demand. And continue investing in operations, customer experience, and brand. These priorities are designed to expand contribution, improve consistency, and reinforce confidence in the durability of our model. Thank you for your continued support and commitment to Wheels Up as we continue our journey in building a strong, growing and profitable business. Wheels Up, George February 19, 2026 6 Fernando Mendoza, WheelsUp Ambassador
About Wheels Up Wheels Up is a leading global provider of on-demand private aviation with a large, diverse fleet and a network of safety-vetted charter operators, all committed to safety and service. Customers access charter and membership programs and premium commercial travel benefits through a strategic partnership with Delta Air Lines. Wheels Up also provides cargo services to a range of clients, including individuals and government organizations, via Air Partner Cargo. With the Wheels Up app and website, members can easily search, book, and fly. For more information, visit www.wheelsup.com. Cautionary Note Regarding Forward-Looking Statements This shareholder letter contains certain “forward-looking statements” within the meaning of the federal securities laws. Forward-looking statements provide current expectations of future circumstances or events based on certain assumptions and include any statement, projection or forecast that does not directly relate to any historical or current fact. Forward-looking statements are subject to known and unknown risks, uncertainties, assumptions and other important factors, many of which are outside of the control of Wheels Up Experience Inc. (“Wheels Up”, “we”, “us”, “our” or the “Company”), that could cause actual results to differ materially from the results discussed in the forward-looking statements. These forward-looking statements include, but are not limited to, statements regarding: (i) Wheels Up’s growth plans, the size, demand, competition in and growth potential of the markets for Wheels Up’s service offerings and the degree of market adoption of Wheels Up’s membership program, charter offerings and any future services it may offer; (ii) the potential impact of Wheels Up’s cost reduction and operational efficiency and productivity initiatives on its business and results of operations, including timing, magnitude and possible effects on liquidity levels and working capital; (iii) Wheels Up’s fleet modernization strategy, its ability to execute such strategy on the timeline that it currently anticipates and the expected commercial, financial and operational impacts to Wheels Up, including due to changes in the market for purchases and sales of aircraft; (iv) Wheels Up’s liquidity and future cash flows, certain restrictions related to its indebtedness obligations and its ability to perform under its contractual and indebtedness obligations; (v) Wheels Up’s ability to achieve its financial goals in the future on the most recent schedule that it has announced; (vi) the potential impacts or benefits from pursuing strategic actions involving Wheels Up or its subsidiaries or affiliates, including, among others, acquisitions and divestitures, new debt or equity financings, refinancings of existing indebtedness, stock repurchases and commercial partnerships or arrangements; and (vii) the impacts of general economic and geopolitical conditions on Wheels Up’s business and the aviation industry, including due to, among others, fluctuations in interest rates, inflation, foreign currencies, taxes, tariffs and trade policies, government shutdowns or funding changes, and consumer and business spending decisions. The words “anticipate,” “believe,” “can,” “continue,” “could,” “estimate,” “expect,” “future,” “intend,” “may,” “might,” “plan,” “possible,” “potential,” “predict,” “project,” “should,” “strive,” “would” and similar expressions may identify forward-looking statements, but the absence of these words does not mean that statement is not forward-looking. We have identified certain known material risk factors applicable to Wheels Up in our Annual Report on Form 10-K for the year ended December 31, 2024 filed with the U.S. Securities and Exchange Commission (“SEC”) on March 11, 2025 ("2024 Annual Report") and our other filings with the SEC. It is not always possible for us to predict how new risks and uncertainties that arise from time to time may affect us. You are cautioned not to place undue reliance upon any forward-looking statements, which speak only as of the date made. Except as required by law, we do not intend to update any of these forward-looking statements after the date of this shareholder letter.
Use of Non-GAAP Financial Measures This investor letter includes certain non-GAAP financial measures, such as Adjusted EBITDA, Adjusted EBITDAR, Adjusted Contribution and Adjusted Contribution Margin. These non-GAAP financial measures are in addition to, and not a substitute for or superior to, measures of financial performance prepared in accordance with U.S. generally accepted accounting principles (“GAAP”) and should not be considered as an alternative to any performance measures derived in accordance with GAAP. Definitions and reconciliations of non-GAAP financial measures to their most comparable GAAP counterparts are included in the sections titled “Definitions of Non- GAAP Financial Measures” and “Reconciliations of Non-GAAP Financial Measures,” respectively, in this investor letter. Wheels Up believes that these non-GAAP financial measures provide useful supplemental information to investors about Wheels Up. However, there are certain limitations related to the use of these non-GAAP financial measures and their nearest GAAP measures, including that they exclude significant expenses that are required to be recorded in Wheels Up’s financial measures under GAAP. Other companies may calculate non-GAAP financial measures differently, or may use other measures to calculate their financial performance, and therefore, Wheels Up’s non-GAAP financial measures may not be directly comparable to similarly titled measures of other companies. Additionally, to the extent that forward-looking non-GAAP financial measures are provided, they are presented on a non-GAAP basis without reconciliations of such forward-looking non-GAAP financial measures due to the inherent difficulty in forecasting and quantifying certain amounts that are necessary for such reconciliations. Definitions of Non-GAAP Financial Measures Adjusted EBITDA & Adjusted EBITDAR. We calculate Adjusted EBITDA as Net income (loss) adjusted for (i) Interest income (expense), (ii) Income tax expense, (iii) Depreciation and amortization, (iv) Equity-based compensation expense, (v) Acquisition and integration related expenses and (vi) other items not indicative of our ongoing operating performance, including but not limited to, restructuring charges. We calculate Adjusted EBITDAR as Adjusted EBITDA, as further adjusted for aircraft lease costs. We include Adjusted EBITDA and Adjusted EBITDAR as supplemental measures for assessing operating performance, to be used in conjunction with bonus program target achievement determinations, strategic internal planning, annual budgeting, allocating resources and making operating decisions, and to provide useful information for historical period-to-period comparisons of our business, as each measure removes the effect of certain non-cash expenses and other items not indicative of our ongoing operating performance. Adjusted EBITDAR is included as a supplemental measure, because we believe it provides an alternate presentation to adjust for the effects of financing in general and the accounting effects of capital spending and acquisitions of aircraft, which may be acquired outright, acquired subject to acquisition debt, including under the Revolving Equipment Notes Facility, by capital lease or by operating lease, each of which may vary significantly between periods and results in a different accounting presentation. Adjusted Contribution & Adjusted Contribution Margin. We calculate Adjusted Contribution as Gross profit (loss) excluding Depreciation and amortization and adjusted further for equity-based compensation included in Cost of revenue and other items included in Cost of revenue that are not indicative of our ongoing operating performance. Adjusted Contribution Margin is calculated by dividing Adjusted Contribution by total Revenue. We include Adjusted Contribution and Adjusted Contribution Margin as supplemental measures for assessing operating performance and for the following: to be used to understand our ability to achieve profitability over time through scale and leveraging costs; and to provide useful information for historical period-to-period comparisons of our business and to identify trends.
Adjusted EBITDA and Adjusted EBITDAR The following tables reconcile Adjusted EBITDA and Adjusted EBITDAR to Net loss, which is the most directly comparable GAAP measure (in thousands): Reconciliations of Non-GAAP Financial Measures (1) Consists of expenses associated with the Company’s global integration efforts, including charges for employee separation programs, costs associated with restructuring or terminating third-party contracts, and third-party advisor costs. (2) Consists of expenses incurred in connection with the execution of our fleet modernization strategy first announced in October 2024, which primarily includes expenses associated with transitioning our Bombardier Challenger 300 series and Embraer Phenom 300 series aircraft to our operations and pilot training programs aligned to our fleet modernization strategy, as well as certain cash and non-cash costs incurred associated with exiting legacy private jet models. (3) Includes charges for contract termination fees and employee separation programs as part of our cost reduction and strategic business initiatives. (4) Consists of expenses associated with establishing our Member Operations Center located in the Atlanta, Georgia area (“Atlanta Member Operations Center”) and its operations primarily including redundant operating expenses during the transition period, relocation expenses for employees and costs associated with onboarding new employees. The Atlanta Member Operations Center began operating on May 15, 2023. (5) Consists of expenses incurred to execute the consolidation of our U.S. Federal Aviation Administration (“FAA”) operating certificates, primarily related to pilot training and retention programs, and consultancy fees associated with planning and implementing the consolidation process. (6) For the year ended December 31, 2025, primarily includes a one-time $20.2 million non-cash pre-tax right-of-use asset impairment charge associated with vacating our former New York City corporate office space for a smaller, centralized location and related on-going lease costs for the vacated space while we seek a sublease tenant. For the year ended December 31, 2024, includes (i) collections of certain aged receivables which were added back to Net loss in the reconciliation presented for the year ended December 31, 2022, (ii) reserves and/or write-off of certain aged receivables associated with the aircraft management business which was divested on September 30, 2023, (iii) expenses associated with ongoing litigation matters and (iv) amounts reserved during the second quarter of 2024 related to Parts and supplies inventory deemed in excess after revision of future business needs associated with strategic business initiatives. (7) Aircraft lease costs are reflected in Cost of revenue on the consolidated statement of operations for the applicable period.
(1) Consists of expenses associated with the Company’s global integration efforts including charges for employee separation programs and costs associated with restructuring or terminating third-party contracts. (2) Consists of expenses incurred in connection with the execution of our fleet modernization strategy first announced in October 2024, which primarily includes expenses associated with transitioning our Bombardier Challenger 300 series and Embraer Phenom 300 series aircraft to our operations and pilot training programs aligned to our fleet modernization strategy, as well as certain cash and non-cash costs incurred associated with exiting legacy private jet models. (3) Primarily includes charges for employee separation programs as part of our ongoing cost reduction and strategic business initiatives. (4) Consists of expenses associated with establishing the Atlanta Member Operations Center and its operations primarily including redundant operating expenses during the transition period, relocation expenses for employees and costs associated with onboarding new employees. The Atlanta Member Operations Center began operating on May 15, 2023. (5) Consists of expenses incurred to execute the consolidation of our FAA operating certificates, primarily including pilot training and retention programs and consultancy fees associated with planning and implementing the consolidation process. (6) Consists of amounts recovered on Parts and supplies inventory reserved during prior periods related to Parts and supplies inventory deemed in excess after revision of future business needs associated with strategic business initiatives, including fleet modernization. Adjusted Contribution and Adjusted Contribution Margin The following tables reconcile Adjusted Contribution to Gross profit, which is the most directly comparable GAAP measure (in thousands):
Key Operating Metrics In addition to financial measures, we regularly review certain key operating metrics to evaluate our business, determine the allocation of resources and make decisions regarding business strategies. We believe that these metrics can be useful for understanding the underlying trends in our business. The following table summarizes our key operating metrics: (1) In thousands. (2) For the year ended December 31, 2025, Utility for the Embraer Phenom 300 series, Bombardier Challenger 300 series and legacy fleet aircraft in our controlled fleet were 60.7, 48.1 and 30.8 hours, respectively. Utility for the three months ended December 31, 2024 reflects the inclusion of 17 Embraer Phenom 300 series aircraft from November 13, 2024 to the end of the respective period and zero Challenger 300 series aircraft.
Definitions of our key operating metrics are below. From time to time, we may adjust the definitions and calculations of our key operating metrics to reflect changes in our business or new data types, or to improve the accuracy and usefulness of such metrics. Our calculation of our key operating metrics may not be comparable to similarly titled measures reported by other companies. Total Gross Bookings and Private Jet Gross Bookings. We define Total Gross Bookings as the total gross spend by our members and customers on all private jet flight services under our membership program and charter offerings, all group charter flights, which are charter flights with 15 or more passengers (“Group Charter Flights”), and all cargo flight services (“Cargo Services”). We believe Total Gross Bookings provides useful information about the scale of the overall global aviation solutions that we provide our members and customers. We define Private Jet Gross Bookings as the total gross spend by our members and customers on all private jet flight services under our membership program and charter offerings (excluding Group Charter Flights and Cargo Services). We believe Private Jet Gross Bookings provides useful information about the aggregate amount our members and customers spend with Wheels Up versus our competitors. For each of Total Gross Bookings and Private Jet Gross Bookings, the total gross spend by our members and customers is the amount invoiced to the member or customer and includes the cost of the flight and related services, such as catering, ground transportation, certain taxes, fees and surcharges. We use Total Gross Bookings and Private Jet Gross Bookings for historical period-to-period comparisons of our business and to identify trends, including relative to our competitors. Live Flight Legs. We define Live Flight Legs as the number of completed one-way revenue generating private jet flight legs in the applicable period, excluding empty repositioning legs, Group Charter Flights and Cargo Services. We believe Live Flight Legs is a useful metric to measure the scale and usage of our platform and our ability to generate Flight revenue. Private Jet Gross Bookings per Live Flight Leg. We use Private Jet Gross Bookings per Live Flight Leg to measure the average gross spend by our members and customers on all private jet flight services under our membership program and charter offerings for each Live Flight Leg. Utility. We define Utility for the applicable period as the total revenue generating flight hours flown on our controlled aircraft fleet, excluding empty repositioning legs, divided by the monthly average number of available aircraft in our controlled aircraft fleet. Utility is expressed as a monthly average. We measure the revenue generating flight hours for a given flight on our controlled aircraft as the actual flight time from takeoff to landing. We determine the number of aircraft in our controlled aircraft fleet available for revenue generating flights at the end of the applicable month and exclude aircraft then classified as held for sale. We use Utility to measure the efficiency of our operations, our ability to generate a return on our assets and the impact of our fleet modernization strategy. Completion Rate. We define Completion Rate as the percentage of total scheduled flights operated and completed, excluding customer-initiated flight cancellations. On-Time Performance (D-60). We define On-Time Performance (D-60) as the percentage of total flights flown that departed within 60 minutes of the scheduled time, inclusive of air traffic control, weather, maintenance and customer delays, excluding all cancelled flights. Beginning with the Company’s Quarterly Report on Form 10-Q for the three months ended March 31, 2025, we changed the presentation of Completion Rate and On-Time Performance (D-60) to include wholesale flights, which we believe better aligns those metrics to information that we use internally to evaluate our operations and reported Live Flight Legs, which includes wholesale flights. Completion Rate and On-Time Performance (D-60) for the three months ended December 31, 2025 and 2024 reported in the table above includes wholesale flights, which were previously excluded from such metrics in the Company’s filings with the SEC beginning with the Company’s Quarterly Report on Form 10-Q for the three months ended March 31, 2024 through and the 2024 Annual Report. Completion Rate and On-Time Performance (D-60) reported in the Company’s previously filed 2024 Annual Report, which excluded wholesale flight activity, were 98% and 80%, respectively.