
USB 8-K
US Bancorp De (USB)
UNITED STATES
SECURITIES AND EXCHANGE COMMISSION
Washington, D.C. 20549
FORM
CURRENT REPORT
PURSUANT TO SECTION 13 OR 15(d) OF THE
SECURITIES EXCHANGE ACT OF 1934
Date of Report (Date of earliest event reported):
(Exact name of registrant as specified in its charter)
(Commission File Number)
| (State or other jurisdiction | (I.R.S. Employer Identification | |
| of incorporation) | Number) |
| (Address of principal executive offices and zip code) |
(
(Registrant’s telephone number, including area code)
(not applicable)
(Former name or former address, if changed since last report)
Check the appropriate box below if the Form 8-K filing is intended to simultaneously satisfy the filing obligation of the registrant under any of the following provisions:
Written communications pursuant to Rule 425 Under the Securities Act (17 CFR 230.425) |
Soliciting material pursuant to Rule 14a-12 under the Exchange Act (17 CFR 240.14a-12) |
Pre-commencement communications pursuant to Rule 14d-2(b) under the Exchange Act (17 CFR 240.14d-2(b)) |
Pre-commencement communications pursuant to Rule 13e-4(c) under the Exchange Act (17 CFR 240.13e-4(c)) |
Securities registered pursuant to Section 12(b) of the Act:
Title of each class |
Trading |
Name of each exchange | ||
Indicate by check mark whether the registrant is an emerging growth company as defined in Rule 405 of the Securities Act of 1933 (§230.405 of this chapter) or Rule l2b-2 of the Securities Exchange Act of 1934 (§240.12b-2 of this chapter).
Emerging growth company
If an emerging growth company, indicate by check mark if the registrant has elected not to use the extended transition period for complying with any new or revised financial accounting standards provided pursuant to Section l3(a) of the Exchange Act. ☐
ITEM 2.02 RESULTS OF OPERATIONS AND FINANCIAL CONDITION.
On October 14, 2021, U.S. Bancorp (the “Company”) issued a press release reporting quarter-ended September 30, 2021 results, and posted on its website its 3Q21 Earnings Conference Call Presentation, which contains certain additional historical and forward-looking information relating to the Company. The press release is included as Exhibit 99.1 hereto and is incorporated herein by reference. The information included in the press release is considered to be “filed” under the Securities Exchange Act of 1934. The 3Q21 Earnings Conference Call Presentation is included as Exhibit 99.2 hereto and is incorporated herein by reference. The information included in the 3Q21 Earnings Conference Call Presentation is considered to be “furnished” under the Securities Exchange Act of 1934 and shall not be deemed incorporated by reference in any filings under the Securities Act of 1933. The press release and 3Q21 Earnings Conference Call Presentation contain forward-looking statements regarding the Company and each includes a cautionary statement identifying important factors that could cause actual results to differ materially from those anticipated.
ITEM 9.01 FINANCIAL STATEMENTS AND EXHIBITS.
(d) Exhibits.
| 99.1 |
| 99.2 |
| 104 | Cover Page Interactive Data File (embedded within the Inline XBRL document) |
SIGNATURES
Pursuant to the requirements of the Securities Exchange Act of 1934, the registrant has duly caused this report to be signed on its behalf by the undersigned hereunto duly authorized.
| U.S. BANCORP |
| By /s/ Lisa R. Stark |
| Lisa R. Stark |
| Executive Vice President and Controller |
DATE: October 14, 2021
Exhibit 99.1
|
|
U.S. Bancorp Reports Third Quarter 2021 Results
• Net income of $2.0 billion and net revenue of $5.9 billion • Return on average assets of 1.45% and return on average common equity of 15.9% • Common Equity Tier 1 capital ratio of 10.2% and strong levels of liquidity
|

|
3Q21 Key Financial Data |
3Q21 Highlights |
| PROFITABILITY METRICS |
3Q21 | 2Q21 | 3Q20 |
• Net income of $2,028 million and diluted earnings per common share of $1.30
• Return on average assets of 1.45% and return on average common equity of 15.9%
• Net revenue of $5,890 million, including $3,197 million of net interest income and $2,693 million of noninterest income
• Positive operating leverage on a linked quarter basis driven by 2.8% linked quarter noninterest income growth
• Payments revenue increased 3.6%
• Trust and investment management fees increased 2.9%
• Average total earning assets growth of 3.5% year-over-year
• Average total deposits growth of 6.4% year-over-year
• Allowance for credit losses declined $310 million during the quarter given improving economic outlook and credit trends
• CET1 capital ratio increased to 10.2% at September 30, 2021, compared with 9.4% at September 30, 2020
| ||||||||||||
| Return on average assets (%) |
1.45 | 1.44 | 1.17 | |||||||||||||
| Return on average common equity (%) |
15.9 | 16.3 | 12.8 | |||||||||||||
| Return on tangible common equity (%) (a) |
20.2 | 20.9 | 16.6 | |||||||||||||
| Net interest margin (%) |
2.53 | 2.53 | 2.67 | |||||||||||||
| Efficiency ratio (%) (a) |
58.4 | 59.0 | 56.6 | |||||||||||||
| INCOME STATEMENT (b) |
3Q21 | 2Q21 | 3Q20 | |||||||||||||
| Net interest income (taxable-equivalent basis) |
$3,197 | $3,164 | $3,252 | |||||||||||||
| Noninterest income |
$2,693 | $2,619 | $2,712 | |||||||||||||
| Net income attributable to U.S. Bancorp |
$2,028 | $1,982 | $1,580 | |||||||||||||
| Diluted earnings per common share |
$1.30 | $1.28 | $.99 | |||||||||||||
| Dividends declared per common share |
$.46 | $.42 | $.42 | |||||||||||||
| BALANCE SHEET (b) |
3Q21 | 2Q21 | 3Q20 | |||||||||||||
| Average total loans |
$296,739 | $294,284 | $311,018 | |||||||||||||
| Average total deposits |
$431,487 | $429,210 | $405,523 | |||||||||||||
| Net charge-off ratio |
.20% | .25% | .66% | |||||||||||||
| Book value per common share (period end) |
$32.22 | $31.74 | $30.93 | |||||||||||||
| Basel III standardized CET1 (c) |
10.2% | 9.9% | 9.4% | |||||||||||||
|
|
||||||||||||||||
| (a) See Non-GAAP Financial Measures reconciliation on page 16 |
|
|||||||||||||||
| (b) Dollars in millions, except per share data |
|
|||||||||||||||
| (c) CET1 = Common equity tier 1 capital ratio |
|
|||||||||||||||
|
CEO Commentary
| ||||||||||
“In the third quarter we generated net revenue of $5.9 billion, net income of $2.0 billion, and a return on tangible common equity of over 20%. Our results were supported by continued momentum across our fee businesses, a pick-up in loan growth, and improvement in our efficiency ratio. Credit quality was once again better than expected and for the third straight quarter our net charge-off ratio hit a record low level. We continue to supplement our organic growth by utilizing excess capital for strategically sound, financially attractive acquisitions. During the quarter we acquired Bento Technologies, which expands the capabilities of our payments ecosystem, and entered into a definitive agreement to acquire MUFG Union Bank’s core regional banking franchise. These acquisitions provide strategic and secular growth opportunities that will allow U.S. Bank to continue to deliver industry leading results for years to come. I want to thank all our employees for their continued hard work and dedication to serving all of our stakeholders.”
— Andy Cecere, Chairman, President and CEO, U.S. Bancorp
In the Spotlight
U.S. Bancorp to acquire MUFG Union Bank
U.S. Bancorp has entered into a definitive agreement to acquire MUFG Union Bank’s core regional banking franchise for approximately $8 billion, including $5.5 billion in cash and approximately 44 million shares of U.S. Bancorp common stock. The acquisition would add more than 1 million consumer customers and about 190,000 small business customers on the West Coast in addition to approximately $58 billion in loans and $90 billion in deposits. The acquisition will provide benefits for both customers and the communities served by the combined organization through improved technology, expanded products and customer choice. The transaction is expected to close in the first half of 2022.
Award-winning Mobile App
The U.S. Bank Mobile App was ranked first among banking apps by industry benchmarking firm Keynova in its 3Q 2021 scorecard. The firm evaluates the top 17 banks on more than 200 criteria across four main categories: functionality, ease of use, privacy and security, and quality and availability.
U.S. Bank to launch fleet industry Voyager Mastercard
U.S. Bank and Mastercard have partnered on a new card for fleet-related expenses. The new U.S. Bank Voyager Mastercard will build on U.S. Bank’s existing Voyager card, which allows customers to pay for fuel, fleet maintenance and other expenses at more than 320,000 merchant locations. Now customers can use a single card to pay for fleet-related expenses at any merchant that accepts Mastercard, providing unprecedented flexibility to support fleet operations and productivity on two major networks.
U.S. Bank Acquires Small Business Payments Software Company
In September, U.S. Bank acquired Bento Technologies, known as Bento for Business, a fintech company based in Chicago and San Francisco that provides payment and expense management services to small and mid-size businesses. The acquisition is part of U.S. Bank’s vision to bring payments and banking services together to simplify cash flow and money management for small businesses.

Investor contact: Jennifer Thompson, 612.303.0778 | Media contact: Jeff Shelman, 612.422.1423
|
|
U.S. Bancorp Third Quarter 2021 Results | |

| INCOME STATEMENT HIGHLIGHTS | ||||||||||||||||||||||||||||||||
| ($ in millions, except per-share data) | Percent Change | |||||||||||||||||||||||||||||||
| 3Q 2021 |
2Q 2021 |
3Q 2020 |
3Q21 vs 2Q21 |
3Q21 vs 3Q20 |
YTD 2021 |
YTD 2020 |
Percent Change |
|||||||||||||||||||||||||
| Net interest income |
$3,171 | $3,137 | $3,227 | 1.1 | (1.7) | $9,371 | $9,650 | (2.9 | ) | |||||||||||||||||||||||
| Taxable-equivalent adjustment |
26 | 27 | 25 | (3.7 | ) | 4.0 | 79 | 73 | 8.2 | |||||||||||||||||||||||
| Net interest income (taxable-equivalent basis) |
3,197 | 3,164 | 3,252 | 1.0 | (1.7) | 9,450 | 9,723 | (2.8 | ) | |||||||||||||||||||||||
| Noninterest income |
2,693 | 2,619 | 2,712 | 2.8 | (.7) | 7,693 | 7,851 | (2.0 | ) | |||||||||||||||||||||||
| Total net revenue |
5,890 | 5,783 | 5,964 | 1.9 | (1.2) | 17,143 | 17,574 | (2.5 | ) | |||||||||||||||||||||||
| Noninterest expense |
3,429 | 3,387 | 3,371 | 1.2 | 1.7 | 10,195 | 10,005 | 1.9 | ||||||||||||||||||||||||
| Income before provision and income taxes |
2,461 | 2,396 | 2,593 | 2.7 | (5.1) | 6,948 | 7,569 | (8.2 | ) | |||||||||||||||||||||||
| Provision for credit losses |
(163 | ) | (170 | ) | 635 | 4.1 | nm | (1,160 | ) | 3,365 | nm | |||||||||||||||||||||
| Income before taxes |
2,624 | 2,566 | 1,958 | 2.3 | 34.0 | 8,108 | 4,204 | 92.9 | ||||||||||||||||||||||||
| Income taxes and taxable-equivalent adjustment |
590 | 578 | 372 | 2.1 | 58.6 | 1,801 | 744 | nm | ||||||||||||||||||||||||
| Net income |
2,034 | 1,988 | 1,586 | 2.3 | 28.2 | 6,307 | 3,460 | 82.3 | ||||||||||||||||||||||||
| Net (income) loss attributable to noncontrolling interests |
(6 | ) | (6 | ) | (6 | ) | -- | -- | (17 | ) | (20 | ) | 15.0 | |||||||||||||||||||
| Net income attributable to U.S. Bancorp |
$2,028 | $1,982 | $1,580 | 2.3 | 28.4 | $6,290 | $3,440 | 82.8 | ||||||||||||||||||||||||
| Net income applicable to U.S. Bancorp common shareholders |
$1,934 | $1,914 | $1,494 | 1.0 | 29.5 | $6,023 | $3,196 | 88.5 | ||||||||||||||||||||||||
| Diluted earnings per common share |
$1.30 | $1.28 | $.99 | 1.6 | 31.3 | $4.04 | $2.11 | 91.5 | ||||||||||||||||||||||||
Net income attributable to U.S. Bancorp was $2,028 million for the third quarter of 2021, which was $448 million higher than the $1,580 million for the third quarter of 2020, and $46 million higher than the $1,982 million for the second quarter of 2021. Diluted earnings per common share were $1.30 in the third quarter of 2021, compared with $0.99 in the third quarter of 2020 and $1.28 in the second quarter of 2021.
The increase in net income year-over-year was primarily due to lower provision for credit losses driven by a reserve release, a result of continued improvement in the global economy, as well as strong credit and collateral performance. This compares with a reserve build during 2020 related to acquired loans. Net interest income decreased 1.7 percent on a year-over-year taxable-equivalent basis due to changes in loan portfolio composition and lower average loan balances primarily driven by commercial loan paydowns by corporate customers accessing the capital markets and the Small Business Administration (“SBA”) Paycheck Protection Program, partially offset by the benefit of deposit and funding mix in addition to higher loan fees related to the SBA Paycheck Protection Program. The net interest margin declined from 2.67 percent a year ago to 2.53 percent in the third quarter of 2021 primarily due to the impact of declining interest rates on loan yields, the mix of earning assets and lower reinvestment yields in the investment portfolio, partially offset by the net benefit of funding composition and higher loan fees. Noninterest income decreased 0.7 percent compared with a year ago driven by lower mortgage banking revenue, commercial products revenue related to slower capital markets activities and other noninterest income, mostly offset by improvements in payment services revenue, trust and investment management fees, deposit service charges, treasury management fees and investment products fees. Noninterest expense increased 1.7 percent reflecting increases in compensation expense, primarily related to performance-based incentive compensation, as well as higher professional services expense, marketing and business development expense and technology and communications expense, partially offset by lower net occupancy and equipment expense and other noninterest expense.
Net income increased on a linked quarter basis primarily due to 1.9 percent growth in total net revenue including growth in net interest income and stronger noninterest income. Net interest income on a taxable-equivalent basis increased 1.0 percent primarily due to higher loan fees mainly related to the SBA Paycheck Protection Program, lower premium amortization in the investment portfolio, and one more day in the quarter, partially offset by lower loan yields and earning asset mix. The net interest margin was flat on a linked quarter basis primarily reflecting favorable funding and deposit mix as well as higher loan fees, partially offset by lower loan yields in addition to earning asset composition. Noninterest income increased 2.8 percent compared with the second quarter of 2021 driven by increases in payment services revenue, trust and investment management fees, deposit service charges and mortgage banking revenue, partially offset by lower securities gains and other noninterest income. Noninterest expense increased 1.2 percent on a linked quarter basis reflecting higher compensation expense and professional services expense, partly offset by lower other noninterest expense.
2
|
|
U.S. Bancorp Third Quarter 2021 Results | |
| NET INTEREST INCOME | ||||||||||||||||||||||||||||||||
| (Taxable-equivalent basis; $ in millions) | Change | |||||||||||||||||||||||||||||||
| 3Q 2021 |
2Q 2021 |
3Q 2020 |
3Q21 vs 2Q21 |
3Q21 vs 3Q20 |
YTD 2021 |
YTD 2020 |
Change | |||||||||||||||||||||||||
| Components of net interest income |
||||||||||||||||||||||||||||||||
| Income on earning assets |
$3,435 | $3,409 | $3,598 | $26 | $(163) | $10,211 | $11,437 | $(1,226) | ||||||||||||||||||||||||
| Expense on interest-bearing liabilities |
238 | 245 | 346 | (7) | (108) | 761 | 1,714 | (953) | ||||||||||||||||||||||||
| Net interest income |
$3,197 | $3,164 | $3,252 | $33 | $(55) | $9,450 | $9,723 | $(273) | ||||||||||||||||||||||||
| Average yields and rates paid |
||||||||||||||||||||||||||||||||
| Earning assets yield |
2.72% | 2.73% | 2.95% | (.01)% | (.23)% | 2.72% | 3.21% | (.49)% | ||||||||||||||||||||||||
| Rate paid on interest-bearing liabilities |
.27 | .28 | .39 | (.01) | (.12) | .28 | .63 | (.35) | ||||||||||||||||||||||||
| Gross interest margin |
2.45% | 2.45% | 2.56% | --% | (.11)% | 2.44% | 2.58% | (.14)% | ||||||||||||||||||||||||
| Net interest margin |
2.53% | 2.53% | 2.67% | --% | (.14)% | 2.52% | 2.73% | (.21)% | ||||||||||||||||||||||||
| Average balances |
||||||||||||||||||||||||||||||||
| Investment securities (a) |
$151,755 | $160,615 | $128,565 | $(8,860) | $23,190 | $152,653 | $123,444 | $29,209 | ||||||||||||||||||||||||
| Loans |
296,739 | 294,284 | 311,018 | 2,455 | (14,279) | 295,014 | 308,935 | (13,921) | ||||||||||||||||||||||||
| Earning assets |
503,325 | 500,751 | 486,104 | 2,574 | 17,221 | 500,616 | 476,018 | 24,598 | ||||||||||||||||||||||||
| Interest-bearing liabilities |
353,129 | 356,565 | 357,739 | (3,436) | (4,610) | 356,731 | 363,585 | (6,854) | ||||||||||||||||||||||||
| (a) Excludes unrealized gain (loss) | ||||||||||||||||||||||||||||||||
Net interest income on a taxable-equivalent basis in the third quarter of 2021 was $3,197 million, a decrease of $55 million (1.7 percent) compared with the third quarter of 2020. The decrease was primarily due to loan mix and lower average loan volumes primarily driven by corporate loan paydowns by corporate customers accessing the capital markets and SBA Paycheck Protection Program loans, partially offset by favorable deposit and funding mix and higher loan fees related to the SBA Paycheck Protection Program. Average earning assets were $17.2 billion (3.5 percent) higher than the third quarter of 2020, reflecting an increase of $23.2 billion (18.0 percent) in average investment securities and an increase of $8.9 billion (23.0 percent) in average other earning assets, primarily driven by higher cash balances, while average total loans decreased $14.3 billion (4.6 percent) due to continued paydowns by corporate customers.
Net interest income on a taxable-equivalent basis increased $33 million (1.0 percent) on a linked quarter basis primarily due to higher loan fees primarily related to the SBA Paycheck Protection Program, lower premium amortization in the investment portfolio, and one more day in the quarter, partially offset by lower loan yields and earning asset mix. Average earning assets were $2.6 billion (0.5 percent) higher on a linked quarter basis, reflecting increases of $2.5 billion (0.8 percent) in average loans and an increase of $9.4 billion (24.6 percent) in average other earning assets, driven by higher cash balances, partially offset by a decrease of $8.9 billion (5.5 percent) in average investment securities.
The net interest margin in the third quarter of 2021 was 2.53 percent, compared with 2.67 percent in the third quarter of 2020 and 2.53 percent in the second quarter of 2021. The decrease in the net interest margin from the prior year was primarily due to the impact of declining interest rates on loan yields, the mix of earning assets and lower reinvestment yields in the investment portfolio, partially offset by the net benefit of funding composition and higher loan fees. Net interest margin was flat on a linked quarter basis reflecting favorable funding and deposit mix as well as higher loan fees, partially offset by lower loan yields in addition to earning asset composition.
The increase in average investment securities year-over-year was due to purchases of mortgage-backed, U.S. Treasury and state and political securities, net of prepayments and maturities, while the decrease on a linked quarter basis was primarily driven by repayments and maturities.
3
|
|
U.S. Bancorp Third Quarter 2021 Results | |
| AVERAGE LOANS | ||||||||||||||||||||||||||||||||
| ($ in millions) | Percent Change | |||||||||||||||||||||||||||||||
| 3Q 2021 |
2Q 2021 |
3Q 2020 |
3Q21 vs 2Q21 |
3Q21 vs 3Q20 |
YTD 2021 |
YTD 2020 |
Percent Change |
|||||||||||||||||||||||||
| Commercial |
$96,673 | $97,713 | $109,899 | (1.1 | ) | (12.0) | $97,047 | $110,886 | (12.5) | |||||||||||||||||||||||
| Lease financing |
5,159 | 5,261 | 5,590 | (1.9 | ) | (7.7 | ) | 5,251 | 5,615 | (6.5) | ||||||||||||||||||||||
| Total commercial |
101,832 | 102,974 | 115,489 | (1.1 | ) | (11.8 | ) | 102,298 | 116,501 | (12.2) | ||||||||||||||||||||||
| Commercial mortgages |
28,080 | 27,721 | 29,849 | 1.3 | (5.9 | ) | 27,923 | 29,855 | (6.5) | |||||||||||||||||||||||
| Construction and development |
10,841 | 10,843 | 11,080 | -- | (2.2 | ) | 10,834 | 10,844 | (.1) | |||||||||||||||||||||||
| Total commercial real estate |
38,921 | 38,564 | 40,929 | .9 | (4.9 | ) | 38,757 | 40,699 | (4.8) | |||||||||||||||||||||||
| Residential mortgages |
74,104 | 73,351 | 75,786 | 1.0 | (2.2 | ) | 74,215 | 72,612 | 2.2 | |||||||||||||||||||||||
| Credit card |
21,905 | 21,116 | 22,052 | 3.7 | (.7 | ) | 21,391 | 22,465 | (4.8) | |||||||||||||||||||||||
| Retail leasing |
7,643 | 7,873 | 8,438 | (2.9 | ) | (9.4 | ) | 7,829 | 8,441 | (7.3) | ||||||||||||||||||||||
| Home equity and second mortgages |
10,936 | 11,368 | 13,551 | (3.8 | ) | (19.3 | ) | 11,451 | 14,256 | (19.7) | ||||||||||||||||||||||
| Other |
41,398 | 39,038 | 34,773 | 6.0 | 19.1 | 39,073 | 33,961 | 15.1 | ||||||||||||||||||||||||
| Total other retail |
59,977 | 58,279 | 56,762 | 2.9 | 5.7 | 58,353 | 56,658 | 3.0 | ||||||||||||||||||||||||
| Total loans |
$296,739 | $294,284 | $311,018 | .8 | (4.6 | ) | $295,014 | $308,935 | (4.5) | |||||||||||||||||||||||
Average total loans for the third quarter of 2021 were $14.3 billion (4.6 percent) lower than the third quarter of 2020. The decrease was primarily due to lower total commercial loans (11.8 percent) driven by continued paydowns by corporate customers that accessed the capital markets last year and SBA Paycheck Protection Program loans, lower home equity and second mortgages (19.3 percent) as more customers chose to refinance their existing first lien residential mortgage balances during the prior year due to the low interest rate environment, lower total commercial real estate loans (4.9 percent) as a result of paydowns and lower residential mortgages (2.2 percent) driven by paydowns. These decreases were partially offset by strong growth in other retail loans (19.1 percent) driven by growth in installment loans due to strong auto and recreational vehicle lending.
Average total loans were $2.5 billion (0.8 percent) higher than the second quarter of 2021 primarily driven by higher other retail loans (6.0 percent) driven by growth in installment loans, higher credit card loans (3.7 percent) due to higher sales volumes as well as account growth and higher residential mortgages (1.0 percent) due to higher closings, partially offset by lower total commercial loans (1.1 percent) primarily due to paydowns of SBA Paycheck Protection Program loans by corporate customers.
4
|
|
U.S. Bancorp Third Quarter 2021 Results | |
| AVERAGE DEPOSITS | ||||||||||||||||||||||||||||||||
| ($ in millions) | Percent Change | |||||||||||||||||||||||||||||||
| 3Q | 2Q | 3Q | 3Q21 vs | 3Q21 vs | YTD | YTD | Percent | |||||||||||||||||||||||||
| 2021 | 2021 | 2020 | 2Q21 | 3Q20 | 2021 | 2020 | Change | |||||||||||||||||||||||||
| Noninterest-bearing deposits |
$ | 129,018 | $ | 125,297 | $ | 109,375 | 3.0 | 18.0 | $ | 124,262 | $ | 92,935 | 33.7 | |||||||||||||||||||
| Interest-bearing savings deposits |
||||||||||||||||||||||||||||||||
| Interest checking |
103,036 | 103,356 | 84,494 | (.3 | ) | 21.9 | 101,280 | 81,890 | 23.7 | |||||||||||||||||||||||
| Money market savings |
112,543 | 113,673 | 124,115 | (1.0 | ) | (9.3 | ) | 116,968 | 125,247 | (6.6 | ) | |||||||||||||||||||||
| Savings accounts |
63,387 | 62,102 | 53,499 | 2.1 | 18.5 | 61,462 | 50,937 | 20.7 | ||||||||||||||||||||||||
| Total savings deposits |
278,966 | 279,131 | 262,108 | (.1 | ) | 6.4 | 279,710 | 258,074 | 8.4 | |||||||||||||||||||||||
| Time deposits |
23,503 | 24,782 | 34,040 | (5.2 | ) | (31.0 | ) | 25,067 | 39,589 | (36.7 | ) | |||||||||||||||||||||
| Total interest-bearing deposits |
302,469 | 303,913 | 296,148 | (.5 | ) | 2.1 | 304,777 | 297,663 | 2.4 | |||||||||||||||||||||||
| Total deposits |
$ | 431,487 | $ | 429,210 | $ | 405,523 | .5 | 6.4 | $ | 429,039 | $ | 390,598 | 9.8 | |||||||||||||||||||
Average total deposits for the third quarter of 2021 were $26.0 billion (6.4 percent) higher than the third quarter of 2020, including approximately $7 billion related to the acquisition of deposit balances from State Farm Bank in the fourth quarter of 2020. Average noninterest-bearing deposits increased $19.6 billion (18.0 percent) primarily within Corporate and Commercial Banking and Wealth Management and Investment Services, partially offset by a decrease in Payments Services. Average total savings deposits were $16.9 billion (6.4 percent) higher year-over-year driven by Consumer and Business Banking, partially offset by a decrease in Corporate and Commercial Banking. Average time deposits were $10.5 billion (31.0 percent) lower than the prior year quarter primarily within Corporate and Commercial Banking and Wealth Management and Investment Services. Changes in time deposits are primarily related to those deposits managed as an alternative to other funding sources, based largely on relative pricing and liquidity characteristics.
Average total deposits increased $2.3 billion (0.5 percent) from the second quarter of 2021. On a linked quarter basis, average noninterest-bearing deposits increased $3.7 billion (3.0 percent) driven by Corporate and Commercial Banking and Wealth Management and Investment Services. Average total savings deposits were flat compared with the second quarter of 2021 as decreases in Wealth Management and Investment Services and Corporate and Commercial Banking were offset by an increase in Consumer and Business Banking. Average time deposits, which are managed based on funding needs, relative pricing and liquidity characteristics, were $1.3 billion (5.2 percent) lower on a linked quarter basis, with decreases across most business lines.
The growth in average noninterest-bearing deposits and total average savings deposits year-over-year was primarily a result of actions by the federal government to increase liquidity in the financial system and government stimulus programs.
5
|
|
U.S. Bancorp Third Quarter 2021 Results | |
| NONINTEREST INCOME | ||||||||||||||||||||||||||||||||
| ($ in millions) | Percent Change | |||||||||||||||||||||||||||||||
| 3Q | 2Q | 3Q | 3Q21 vs | 3Q21 vs | YTD | YTD | Percent | |||||||||||||||||||||||||
| 2021 | 2021 | 2020 | 2Q21 | 3Q20 | 2021 | 2020 | Change | |||||||||||||||||||||||||
| Credit and debit card revenue |
$393 | $396 | $388 | (.8) | 1.3 | $1,125 | $976 | 15.3 | ||||||||||||||||||||||||
| Corporate payment products revenue |
156 | 138 | 125 | 13.0 | 24.8 | 420 | 371 | 13.2 | ||||||||||||||||||||||||
| Merchant processing services |
392 | 374 | 347 | 4.8 | 13.0 | 1,084 | 950 | 14.1 | ||||||||||||||||||||||||
| Trust and investment management fees |
459 | 446 | 434 | 2.9 | 5.8 | 1,349 | 1,295 | 4.2 | ||||||||||||||||||||||||
| Deposit service charges |
194 | 176 | 170 | 10.2 | 14.1 | 531 | 512 | 3.7 | ||||||||||||||||||||||||
| Treasury management fees |
155 | 160 | 145 | (3.1 | ) | 6.9 | 462 | 425 | 8.7 | |||||||||||||||||||||||
| Commercial products revenue |
277 | 280 | 303 | (1.1 | ) | (8.6 | ) | 837 | 904 | (7.4 | ) | |||||||||||||||||||||
| Mortgage banking revenue |
418 | 346 | 553 | 20.8 | (24.4 | ) | 1,063 | 1,596 | (33.4 | ) | ||||||||||||||||||||||
| Investment products fees |
62 | 60 | 48 | 3.3 | 29.2 | 177 | 142 | 24.6 | ||||||||||||||||||||||||
| Securities gains (losses), net |
20 | 43 | 12 | (53.5 | ) | 66.7 | 88 | 143 | (38.5 | ) | ||||||||||||||||||||||
| Other |
167 | 200 | 187 | (16.5 | ) | (10.7 | ) | 557 | 537 | 3.7 | ||||||||||||||||||||||
| Total noninterest income |
$ | 2,693 | $ | 2,619 | $ | 2,712 | 2.8 | (.7 | ) | $ | 7,693 | $ | 7,851 | (2.0 | ) | |||||||||||||||||
Third quarter noninterest income of $2,693 million was $19 million (0.7 percent) lower than the third quarter of 2020. Mortgage banking revenue decreased $135 million (24.4 percent) driven by lower production volume and related gain on sale margins, partially offset by the favorable net impact of the change in fair value of mortgage servicing rights, net of hedging activities, as well as gains on higher GNMA loan sales. Commercial products revenue decreased $26 million (8.6 percent) primarily due to lower capital markets activity and trading revenue, partially offset by higher syndication revenue and fees. Other noninterest income decreased $20 million (10.7 percent) primarily due to the third quarter of 2020 impact of higher equity investment income and transition services agreement revenue associated with the sale of the Company’s ATM third-party servicing business, partially offset by certain asset impairments as a result of branch optimization and higher retail leasing end of term residual gains in the third quarter of 2021. Mostly offsetting these decreases, payments services revenue increased $81 million (9.4 percent) compared with the third quarter of 2020. During 2020, payment services revenue had been adversely affected by the impact of the pandemic on consumer and business spending, particularly related to travel and entertainment activities. However, spending has continued to strengthen across most sectors driven by government stimulus, local jurisdictions reducing restrictions and consumer behaviors normalizing. The components of payment services revenue included higher credit and debit card revenue of $5 million (1.3 percent) driven by higher net interchange revenue related to sales volume as well as stronger transaction and cash advance fees, partially offset by lower prepaid card processing activities as government stimulus dissipates and higher investment in customer acquisition. In addition, corporate payment products revenue increased $31 million (24.8 percent) reflecting improving business spending, and merchant processing services revenue increased $45 million (13.0 percent) driven by higher sales volume as well as higher merchant and equipment fees. Trust and investment management fees increased $25 million (5.8 percent) driven by business growth and favorable market conditions. Deposit service charges increased $24 million (14.1 percent) primarily due to customer activity and ATM processing revenue. Treasury management fees increased $10 million (6.9 percent) due to core growth driven by the COVID-19 economic recovery, partially offset by lower IRS volumes due to the extension of the 2019 tax filing deadline to the third quarter of 2020. Investment products fees increased $14 million (29.2 percent) primarily driven by favorable market conditions and core growth.
Noninterest income was $74 million (2.8 percent) higher in the third quarter of 2021 compared with the second quarter of 2021. Payment services revenue increased $33 million (3.6 percent) compared with the second quarter of 2021 as the global economy continues to recover from the impacts of the COVID-19 pandemic. Within payment services, corporate payment products revenue increased $18 million (13.0 percent) driven by improving business spending and merchant processing services increased $18 million (4.8 percent) driven by higher merchant and equipment fees as well as higher sales volume. Credit card revenue declined slightly due to lower prepaid card fees and higher investment in customer acquisition. Trust and investment management fees increased $13 million (2.9 percent) driven by favorable market conditions, lower fee waivers and core growth. Deposit service charges increased $18 million (10.2 percent) primarily due to seasonally higher customer activity. Mortgage banking revenue increased $72 million (20.8 percent) driven by higher production volume and related gain on sale margins as well as higher loan sales, partially offset by a slightly unfavorable net impact of the change in fair value of mortgage servicing rights, net of hedging activities.
6
|
|
U.S. Bancorp Third Quarter 2021 Results | |
| NONINTEREST EXPENSE | ||||||||||||||||||||||||||||||||
| ($ in millions) | Percent Change | |||||||||||||||||||||||||||||||
| 3Q 2021 |
2Q 2021 |
3Q 2020 |
3Q21 vs 2Q21 |
3Q21 vs 3Q20 |
YTD 2021 |
YTD 2020 |
Percent Change |
|||||||||||||||||||||||||
| Compensation |
$ | 1,847 | $ | 1,798 | $ | 1,687 | 2.7 | 9.5 | $5,448 | $4,992 | 9.1 | |||||||||||||||||||||
| Employee benefits |
336 | 337 | 335 | (.3 | ) | .3 | 1,057 | 1,001 | 5.6 | |||||||||||||||||||||||
| Net occupancy and equipment |
259 | 258 | 276 | .4 | (6.2 | ) | 780 | 823 | (5.2 | ) | ||||||||||||||||||||||
| Professional services |
126 | 108 | 102 | 16.7 | 23.5 | 332 | 307 | 8.1 | ||||||||||||||||||||||||
| Marketing and business development |
99 | 90 | 72 | 10.0 | 37.5 | 237 | 213 | 11.3 | ||||||||||||||||||||||||
| Technology and communications |
361 | 362 | 334 | (.3 | ) | 8.1 | 1,082 | 932 | 16.1 | |||||||||||||||||||||||
| Postage, printing and supplies |
69 | 65 | 70 | 6.2 | (1.4 | ) | 203 | 214 | (5.1 | ) | ||||||||||||||||||||||
| Other intangibles |
41 | 40 | 44 | 2.5 | (6.8 | ) | 119 | 129 | (7.8 | ) | ||||||||||||||||||||||
| Other |
291 | 329 | 451 | (11.6 | ) | (35.5 | ) | 937 | 1,394 | (32.8 | ) | |||||||||||||||||||||
| Total noninterest expense |
$ | 3,429 | $ | 3,387 | $ | 3,371 | 1.2 | 1.7 | $ | 10,195 | $ | 10,005 | 1.9 | |||||||||||||||||||
Third quarter noninterest expense of $3,429 million was $58 million (1.7 percent) higher than the third quarter of 2020 reflecting increases in compensation expense, professional services expense, marketing and business development expense and technology and communications expense, partially offset by lower net occupancy and equipment expense and other noninterest expense. Compensation expense increased $160 million (9.5 percent) compared with the third quarter of 2020 due to performance-based incentives, merit, and revenue-related compensation driven by business production. Professional services expense increased $24 million (23.5 percent) primarily due to an increase in business investment and related initiatives in the third quarter of 2021. Marketing and business development expense increased $27 million (37.5 percent) due to the timing of marketing campaigns supporting business development and lower marketing activities during the pandemic. Technology and communications expense increased $27 million (8.1 percent) primarily due to higher capital expenditures supporting business technology investments. These increases were partially offset by lower net occupancy and equipment expense of $17 million (6.2 percent) primarily related to optimization initiatives and lower other noninterest expense of $160 million (35.5 percent) primarily due to higher COVID-19 related accruals in the third quarter of 2020, including recognizing liabilities related to future delivery exposures for merchant and airline processing. In addition, the decline reflects the timing of lower amortization related to tax-advantaged investments which were scaled back in 2020 during the pandemic. In 2021, investment levels in tax-advantaged projects are normalizing which will benefit future tax rates while increasing amortization.
Noninterest expense increased $42 million (1.2 percent) on a linked quarter basis largely driven by an increase of $49 million (2.7 percent) in compensation expense due to performance-based incentives, revenue-related compensation driven by business production, and one extra day in the quarter. Professional services expense increased $18 million (16.7 percent) primarily due to an increase in initiatives in the third quarter of 2021. Partially offsetting these increases, other noninterest expense decreased $38 million (11.6 percent) primarily due to lower accruals related to future delivery exposures for merchant and airline processing. On a linked quarter basis, we expect amortization of tax-advantaged investments to seasonally increase approximately $60 million in the fourth quarter of 2021.
Provision for Income Taxes
The provision for income taxes for the third quarter of 2021 resulted in a tax rate of 22.5 percent on a taxable-equivalent basis (effective tax rate of 21.7 percent), compared with 19.0 percent on a taxable-equivalent basis (effective tax rate of 18.0 percent) in the third quarter of 2020, and a tax rate of 22.5 percent on a taxable-equivalent basis (effective tax rate of 21.7 percent) in the second quarter of 2021. The increase in the tax rate year-over-year was due to the marginal impact of providing taxes on higher pretax earnings in the third quarter of 2021.
7
|
|
U.S. Bancorp Third Quarter 2021 Results | |
| ALLOWANCE FOR CREDIT LOSSES | ||||||||||||||||||||||||||||||||||||||||
| ($ in millions) | 3Q 2021 |
% (a) | 2Q 2021 |
% (a) | 1Q 2021 |
% (a) | 4Q 2020 |
% (a) | 3Q 2020 |
% (a) | ||||||||||||||||||||||||||||||
| Balance, beginning of period |
$6,610 | $6,960 | $8,010 | $8,010 | $7,890 | |||||||||||||||||||||||||||||||||||
| Net charge-offs |
||||||||||||||||||||||||||||||||||||||||
| Commercial |
13 | .05 | 26 | .11 | 52 | .22 | 142 | .56 | 167 | .60 | ||||||||||||||||||||||||||||||
| Lease financing |
1 | .08 | 1 | .08 | 4 | .30 | 8 | .57 | 11 | .78 | ||||||||||||||||||||||||||||||
|
|
|
|
|
|
|
|
|
|
|
|||||||||||||||||||||||||||||||
| Total commercial |
14 | .05 | 27 | .11 | 56 | .22 | 150 | .56 | 178 | .61 | ||||||||||||||||||||||||||||||
| Commercial mortgages |
1 | .01 | -- | -- | (12 | ) | (.17 | ) | 82 | 1.12 | 85 | 1.13 | ||||||||||||||||||||||||||||
| Construction and development |
12 | .44 | -- | -- | 5 | .19 | 2 | .07 | (2 | ) | (.07 | ) | ||||||||||||||||||||||||||||
|
|
|
|
|
|
|
|
|
|
|
|||||||||||||||||||||||||||||||
| Total commercial real estate |
13 | .13 | -- | -- | (7 | ) | (.07 | ) | 84 | .83 | 83 | .81 | ||||||||||||||||||||||||||||
| Residential mortgages |
(10 | ) | (.05 | ) | (10 | ) | (.05 | ) | (5 | ) | (.03 | ) | (7 | ) | (.04 | ) | (3 | ) | (.02 | ) | ||||||||||||||||||||
| Credit card |
111 | 2.01 | 148 | 2.81 | 144 | 2.76 | 165 | 2.99 | 201 | 3.63 | ||||||||||||||||||||||||||||||
| Retail leasing |
1 | .05 | (1 | ) | (.05 | ) | 1 | .05 | 9 | .43 | 20 | .94 | ||||||||||||||||||||||||||||
| Home equity and second mortgages |
(3 | ) | (.11 | ) | (3 | ) | (.11 | ) | (2 | ) | (.07 | ) | (3 | ) | (.09 | ) | (2 | ) | (.06 | ) | ||||||||||||||||||||
| Other |
21 | .20 | 19 | .20 | 36 | .40 | 43 | .48 | 38 | .43 | ||||||||||||||||||||||||||||||
|
|
|
|
|
|
|
|
|
|
|
|||||||||||||||||||||||||||||||
| Total other retail |
19 | .13 | 15 | .10 | 35 | .25 | 49 | .34 | 56 | .39 | ||||||||||||||||||||||||||||||
|
|
|
|
|
|
|
|
|
|
|
|||||||||||||||||||||||||||||||
| Total net charge-offs |
147 | .20 | 180 | .25 | 223 | .31 | 441 | .58 | 515 | .66 | ||||||||||||||||||||||||||||||
| Provision for credit losses |
(163 | ) | (170 | ) | (827 | ) | 441 | 635 | ||||||||||||||||||||||||||||||||
|
|
|
|
|
|
|
|
|
|
|
|||||||||||||||||||||||||||||||
| Balance, end of period |
$6,300 | $6,610 | $6,960 | $8,010 | $8,010 | |||||||||||||||||||||||||||||||||||
|
|
|
|
|
|
|
|
|
|
|
|||||||||||||||||||||||||||||||
| Components |
||||||||||||||||||||||||||||||||||||||||
| Allowance for loan losses |
$5,792 | $6,026 | $6,343 | $7,314 | $7,407 | |||||||||||||||||||||||||||||||||||
| Liability for unfunded credit commitments |
508 | 584 | 617 | 696 | 603 | |||||||||||||||||||||||||||||||||||
|
|
|
|
|
|
|
|
|
|
|
|||||||||||||||||||||||||||||||
| Total allowance for credit losses |
$6,300 | $6,610 | $6,960 | $8,010 | $8,010 | |||||||||||||||||||||||||||||||||||
|
|
|
|
|
|
|
|
|
|
|
|||||||||||||||||||||||||||||||
| Gross charge-offs |
$266 | $314 | $374 | $556 | $611 | |||||||||||||||||||||||||||||||||||
| Gross recoveries |
$119 | $134 | $151 | $115 | $96 | |||||||||||||||||||||||||||||||||||
| Allowance for credit losses as a percentage of Period-end loans |
2.12 | 2.23 | 2.36 | 2.69 | 2.61 | |||||||||||||||||||||||||||||||||||
| Nonperforming loans |
695 | 649 | 617 | 654 | 678 | |||||||||||||||||||||||||||||||||||
| Nonperforming assets |
667 | 624 | 579 | 617 | 631 | |||||||||||||||||||||||||||||||||||
| (a) Annualized and calculated on average loan balances |
| |||||||||||||||||||||||||||||||||||||||
8
|
|
U.S. Bancorp Third Quarter 2021 Results | |
The Company’s provision for credit losses for the third quarter of 2021 was a benefit of $163 million, which was $7 million higher than the prior quarter and $798 million lower than the third quarter of 2020. During 2021, factors affecting economic conditions, including passing of additional government stimulus, widespread vaccine availability in the U.S. and reduced levels of new virus cases, have contributed to an economic recovery. However, economic uncertainty remains associated with rising inflationary concerns, additional virus variants and lack of a clear path to government funding. In addition to these factors, expected loss estimates consider various factors including customer specific information impacting changes in risk ratings, projected delinquencies and potential effects of diminishing liquidity without support of mortgage forbearance and direct federal stimulus. Currently, consumer credit trends continue to perform better than expected, while select commercial portfolios continue to be monitored for structural shifts associated with the pandemic.
Total net charge-offs in the third quarter of 2021 were $147 million, compared with $180 million in the second quarter of 2021, and $515 million in the third quarter of 2020. The net charge-off ratio was 0.20 percent in the third quarter of 2021, compared with 0.25 percent in the second quarter of 2021 and 0.66 percent in the third quarter of 2020. Net charge-offs decreased $33 million (18.3 percent) compared with the second quarter of 2021 associated with improving economic conditions, borrower liquidity and strong asset prices in the market that support repayment and recovery on problem loans. Net charge-offs decreased $368 million (71.5 percent) compared with the third quarter of 2020 reflecting improvement across all loan categories.
The allowance for credit losses was $6,300 million at September 30, 2021, compared with $6,610 million at June 30, 2021, and $8,010 million at September 30, 2020. The decrease on a linked quarter basis was driven by continued strong credit and collateral performance and incremental improvement in the economy, partially offset by increased economic uncertainty compared with the reserve build during 2020 driven by the concerns associated with the economic impact of COVID-19. The ratio of the allowance for credit losses to period-end loans was 2.12 percent at September 30, 2021, compared with 2.23 percent at June 30, 2021, and 2.61 percent at September 30, 2020. The ratio of the allowance for credit losses to nonperforming loans was 695 percent at September 30, 2021, compared with 649 percent at June 30, 2021, and 678 percent at September 30, 2020.
Nonperforming assets were $944 million at September 30, 2021, compared with $1,059 million at June 30, 2021, and $1,270 million at September 30, 2020. The ratio of nonperforming assets to loans and other real estate was 0.32 percent at September 30, 2021, compared with 0.36 percent at June 30, 2021, and 0.41 percent at September 30, 2020. The year-over-year and linked quarter decrease in nonperforming assets was primarily due to decreases in total commercial nonperforming loans and commercial mortgage nonperforming loans. Accruing loans 90 days or more past due were $385 million at September 30, 2021, compared with $376 million at June 30, 2021, and $461 million at September 30, 2020. The Company expects credit quality to return to more normalized levels over time as the economy rebounds and consumer spending resumes. However, some manageable levels of elevated nonperforming assets in certain industries and loan categories impacted by the pandemic may experience longer recovery periods.
9
|
|
U.S. Bancorp Third Quarter 2021 Results | |
| DELINQUENT LOAN RATIOS AS A PERCENT OF ENDING LOAN BALANCES | ||||||||||||||||||||
| (Percent) | Sep 30 2021 |
Jun 30 2021 |
Mar 31 2021 |
Dec 31 2020 |
Sep 30 2020 |
|||||||||||||||
| Delinquent loan ratios - 90 days or more past due excluding nonperforming loans |
|
|||||||||||||||||||
| Commercial |
.04 | .04 | .06 | .05 | .06 | |||||||||||||||
| Commercial real estate |
.05 | .01 | .01 | .01 | -- | |||||||||||||||
| Residential mortgages |
.15 | .16 | .19 | .18 | .15 | |||||||||||||||
| Credit card |
.66 | .70 | .95 | .88 | .91 | |||||||||||||||
| Other retail |
.11 | .10 | .12 | .15 | .14 | |||||||||||||||
| Total loans |
.13 | .13 | .16 | .16 | .15 | |||||||||||||||
| Delinquent loan ratios - 90 days or more past due including nonperforming loans |
|
|||||||||||||||||||
| Commercial |
.25 | .32 | .39 | .42 | .48 | |||||||||||||||
| Commercial real estate |
.82 | .81 | .94 | 1.15 | .82 | |||||||||||||||
| Residential mortgages |
.47 | .49 | .54 | .50 | .46 | |||||||||||||||
| Credit card |
.66 | .70 | .95 | .88 | .91 | |||||||||||||||
| Other retail |
.36 | .39 | .42 | .42 | .40 | |||||||||||||||
| Total loans |
.43 | .47 | .54 | .57 | .53 | |||||||||||||||
| ASSET QUALITY (a) | ||||||||||||||||||||
| ($ in millions) | ||||||||||||||||||||
| Sep 30 2021 |
Jun 30 2021 |
Mar 31 2021 |
Dec 31 2020 |
Sep 30 2020 |
||||||||||||||||
| Nonperforming loans |
||||||||||||||||||||
| Commercial |
$179 | $247 | $298 | $321 | $403 | |||||||||||||||
| Lease financing |
37 | 44 | 49 | 54 | 56 | |||||||||||||||
| Total commercial |
216 | 291 | 347 | 375 | 459 | |||||||||||||||
| Commercial mortgages |
215 | 224 | 266 | 411 | 323 | |||||||||||||||
| Construction and development |
81 | 88 | 90 | 39 | 7 | |||||||||||||||
| Total commercial real estate |
296 | 312 | 356 | 450 | 330 | |||||||||||||||
| Residential mortgages |
237 | 244 | 253 | 245 | 240 | |||||||||||||||
| Credit card |
-- | -- | -- | -- | -- | |||||||||||||||
| Other retail |
157 | 171 | 172 | 154 | 152 | |||||||||||||||
| Total nonperforming loans |
906 | 1,018 | 1,128 | 1,224 | 1,181 | |||||||||||||||
| Other real estate |
17 | 17 | 19 | 24 | 35 | |||||||||||||||
| Other nonperforming assets |
21 | 24 | 55 | 50 | 54 | |||||||||||||||
| Total nonperforming assets |
$944 | $1,059 | $1,202 | $1,298 | $1,270 | |||||||||||||||
| Accruing loans 90 days or more past due |
$385 | $376 | $476 | $477 | $461 | |||||||||||||||
| Nonperforming assets to loans plus ORE (%) |
.32 | .36 | .41 | .44 | .41 | |||||||||||||||
| (a) Throughout this document, nonperforming assets and related ratios do not include accruing loans 90 days or more past due
|
| |||||||||||||||||||
10
|
|
U.S. Bancorp Third Quarter 2021 Results | |
| COMMON SHARES | ||||||||||||||||||||
| (Millions) | 3Q 2021 |
2Q 2021 |
1Q 2021 |
4Q 2020 |
3Q 2020 |
|||||||||||||||
| Beginning shares outstanding |
1,483 | 1,497 | 1,507 | 1,506 | 1,506 | |||||||||||||||
| Shares issued for stock incentive plans, acquisitions and other corporate purposes |
-- | 1 | 3 | 1 | -- | |||||||||||||||
| Shares repurchased |
-- | (15 | ) | (13 | ) | -- | -- | |||||||||||||
|
|
|
|
|
|
|
|
|
|
|
|||||||||||
| Ending shares outstanding |
1,483 | 1,483 | 1,497 | 1,507 | 1,506 | |||||||||||||||
|
|
|
|
|
|
|
|
|
|
|
|||||||||||
| CAPITAL POSITION | ||||||||||||||||||||
| ($ in millions) | Sep 30 | Jun 30 | Mar 31 | Dec 31 | Sep 30 | |||||||||||||||
| 2021 | 2021 | 2021 | 2020 | 2020 | ||||||||||||||||
| Total U.S. Bancorp shareholders’ equity |
$ | 53,743 | $ | 53,039 | $ | 51,678 | $ | 53,095 | $ | 52,565 | ||||||||||
| Basel III Standardized Approach (a) |
||||||||||||||||||||
| Common equity tier 1 capital |
$ | 41,014 | $ | 39,691 | $ | 39,103 | $ | 38,045 | $ | 37,485 | ||||||||||
| Tier 1 capital |
47,426 | 46,103 | 45,517 | 44,474 | 43,916 | |||||||||||||||
| Total risk-based capital |
54,178 | 53,625 | 53,625 | 52,602 | 52,086 | |||||||||||||||
| Common equity tier 1 capital ratio |
10.2 | % | 9.9 | % | 9.9 | % | 9.7 | % | 9.4 | % | ||||||||||
| Tier 1 capital ratio |
11.7 | 11.5 | 11.5 | 11.3 | 11.0 | |||||||||||||||
| Total risk-based capital ratio |
13.4 | 13.4 | 13.5 | 13.4 | 13.1 | |||||||||||||||
| Leverage ratio |
8.7 | 8.5 | 8.4 | 8.3 | 8.3 | |||||||||||||||
| Tangible common equity to tangible assets (b) |
6.8 | 6.8 | 6.6 | 6.9 | 7.0 | |||||||||||||||
| Tangible common equity to risk-weighted assets (b) |
9.4 | 9.3 | 9.1 | 9.5 | 9.3 | |||||||||||||||
| Common equity tier 1 capital to risk-weighted assets, reflecting the full implementation of the current expected credit losses methodology (b) |
9.7 | 9.5 | 9.5 | 9.3 | 9.0 | |||||||||||||||
| (a) Amounts and ratios calculated in accordance with transitional regulatory requirements related to the current expected credit losses methodology |
| |||||||||||||||||||
| (b) See Non-GAAP Financial Measures reconciliation on page 16 |
||||||||||||||||||||
Total U.S. Bancorp shareholders’ equity was $53.7 billion at September 30, 2021, compared with $53.0 billion at June 30, 2021, and $52.6 billion at September 30, 2020. The capital restrictions instituted by the Federal Reserve in the third quarter of 2020 in response to the economic uncertainty from the pandemic expired on June 30, 2021. Based on the results of the 2021 Annual Stress Test, the Company’s Board of Directors approved a 9.5 percent increase to its third quarter dividend payable in October 2021. The Company suspended share repurchases at the beginning of the third quarter due to its recently announced acquisition of MUFG Union Bank’s core regional banking franchise. The Company does not expect to commence repurchasing shares again until after the acquisition closes in order to build capital prior to the acquisition. The Company expects to operate at a CET1 capital ratio between our target ratio and 9.0 percent after closing of the acquisition.
All regulatory ratios continue to be in excess of “well-capitalized” requirements. The common equity tier 1 capital to risk-weighted assets ratio using the Basel III standardized approach was 10.2 percent at September 30, 2021, compared with 9.9 percent at June 30, 2021, and 9.4 percent at September 30, 2020. The Company’s common equity tier 1 capital to risk-weighted assets ratio, reflecting the full implementation of the current expected credit losses methodology was 9.7 percent at September 30, 2021, compared with 9.5 percent at June 30, 2021, and 9.0 percent at September 30, 2020.
11
|
|
U.S. Bancorp Third Quarter 2021 Results | |
| Investor Conference Call |
On Thursday, October 14, 2021, at 7 a.m. CT, Chairman, President and Chief Executive Officer Andy Cecere and Vice Chair and Chief Financial Officer Terry Dolan will host a conference call to review the financial results. The conference call will be available online or by telephone. To access the webcast and presentation, visit U.S. Bancorp’s website at usbank.com and click on “About Us,” “Investor Relations” and “Webcasts & Presentations.” To access the conference call from locations within the United States and Canada, please dial 866.316.1409. Participants calling from outside the United States and Canada, please dial 706.634.9086. The conference ID number for all participants is 7689764. For those unable to participate during the live call, a recording will be available at approximately 10 a.m. CT on Thursday, October 14 and will be accessible until Thursday, October 21 at 10:59 p.m. CT. To access the recorded message within the United States and Canada, please dial 855.859.2056. If calling from outside the United States and Canada, please dial 404.537.3406 to access the recording. The conference ID is 7689764.
| About U.S. Bancorp |
U.S. Bancorp, with nearly 70,000 employees and $567 billion in assets as of September 30, 2021, is the parent company of U.S. Bank National Association. The Minneapolis-based company serves millions of customers locally, nationally and globally through a diversified mix of businesses: Consumer and Business Banking; Payment Services; Corporate & Commercial Banking; and Wealth Management and Investment Services. The company has been recognized for its approach to digital innovation, social responsibility, and customer service, including being named one of the 2021 World’s Most Ethical Companies and Fortune’s most admired superregional bank. Learn more at usbank.com/about.
| Forward-looking Statements |
“Safe Harbor” Statement under the Private Securities Litigation Reform Act of 1995:
This press release contains forward-looking statements about U.S. Bancorp. Statements that are not historical or current facts, including statements about beliefs and expectations, are forward-looking statements and are based on the information available to, and assumptions and estimates made by, management as of the date hereof. These forward-looking statements cover, among other things, anticipated future revenue and expenses and the future plans and prospects of U.S. Bancorp. Forward-looking statements involve inherent risks and uncertainties, and important factors could cause actual results to differ materially from those anticipated. The COVID-19 pandemic is adversely affecting U.S. Bancorp, its customers, counterparties, employees, and third-party service providers, and the ultimate extent of the impacts on its business, financial position, results of operations, liquidity, and prospects is uncertain. Continued deterioration in general business and economic conditions or turbulence in domestic or global financial markets could adversely affect U.S. Bancorp’s revenues and the values of its assets and liabilities, reduce the availability of funding to certain financial institutions, lead to a tightening of credit, and increase stock price volatility. In addition, changes to statutes, regulations, or regulatory policies or practices could affect U.S. Bancorp in substantial and unpredictable ways. U.S. Bancorp’s results could also be adversely affected by changes in interest rates; further increases in unemployment rates; deterioration in the credit quality of its loan portfolios or in the value of the collateral securing those loans; deterioration in the value of its investment securities; legal and regulatory developments; litigation; increased competition from both banks and non-banks; civil unrest; changes in customer behavior and preferences; breaches in data security, including as a result of work-from-home arrangements; failures to safeguard personal information; effects of mergers and acquisitions and related integration; effects of critical accounting policies and judgments; and management’s ability to effectively manage credit risk, market risk, operational risk, compliance risk, strategic risk, interest rate risk, liquidity risk and reputation risk. In addition, U.S. Bancorp’s proposed acquisition of MUFG Union Bank presents risks and uncertainties, including, among others: the risk that the cost savings, any revenue synergies and other anticipated benefits of the proposed acquisition may not be realized or may take longer than anticipated to be realized; the possibility that the proposed acquisition, including the integration of MUFG Union Bank, may be more costly or difficult to complete than anticipated; delays in closing the proposed acquisition; and the failure of required governmental approvals to be obtained or any other closing conditions in the definitive purchase agreement to be satisfied.
12
|
|
U.S. Bancorp Third Quarter 2021 Results | |
For discussion of these and other risks that may cause actual results to differ from expectations, refer to U.S. Bancorp’s Annual Report on Form 10-K for the year ended December 31, 2020, on file with the Securities and Exchange Commission, including the sections entitled “Corporate Risk Profile” and “Risk Factors” contained in Exhibit 13, and all subsequent filings with the Securities and Exchange Commission under Sections 13(a), 13(c), 14 or 15(d) of the Securities Exchange Act of 1934. In addition, factors other than these risks also could adversely affect U.S. Bancorp’s results, and the reader should not consider these risks to be a complete set of all potential risks or uncertainties. Forward-looking statements speak only as of the date hereof, and U.S. Bancorp undertakes no obligation to update them in light of new information or future events.
| Non-GAAP Financial Measures |
In addition to capital ratios defined by banking regulators, the Company considers various other measures when evaluating capital utilization and adequacy, including:
| • | Tangible common equity to tangible assets |
| • | Tangible common equity to risk-weighted assets |
| • | Common equity tier 1 capital to risk-weighted assets, reflecting the full implementation of the current expected credit losses methodology, and |
| • | Return on tangible common equity. |
These capital measures are viewed by management as useful additional methods of evaluating the Company’s utilization of its capital held and the level of capital available to withstand unexpected negative market or economic conditions. Additionally, presentation of these measures allows investors, analysts and banking regulators to assess the Company’s capital position relative to other financial services companies. These capital measures are not defined in generally accepted accounting principles (“GAAP”), or are not currently effective or defined in banking regulations. In addition, certain of these measures differ from currently effective capital ratios defined by banking regulations principally in that the currently effective ratios, which are subject to certain transitional provisions, temporarily exclude the impact of the 2020 adoption of accounting guidance related to impairment of financial instruments based on the current expected credit losses methodology. As a result, these capital measures disclosed by the Company may be considered non-GAAP financial measures. Management believes this information helps investors assess trends in the Company’s capital adequacy.
The Company also discloses net interest income and related ratios and analysis on a taxable-equivalent basis, which may also be considered non-GAAP financial measures. The Company believes this presentation to be the preferred industry measurement of net interest income as it provides a relevant comparison of net interest income arising from taxable and tax-exempt sources. In addition, certain performance measures, including the efficiency ratio and net interest margin utilize net interest income on a taxable-equivalent basis.
There may be limits in the usefulness of these measures to investors. As a result, the Company encourages readers to consider the consolidated financial statements and other financial information contained in this press release in their entirety, and not to rely on any single financial measure. A table follows that shows the Company’s calculation of these non-GAAP financial measures.
13
|
|
| CONSOLIDATED STATEMENT OF INCOME | ||||||||||||||||
| (Dollars and Shares in Millions, Except Per Share Data) | Three Months Ended September 30, |
Nine Months Ended September 30, |
||||||||||||||
| (Unaudited) | 2021 | 2020 | 2021 | 2020 | ||||||||||||
| Interest Income |
||||||||||||||||
| Loans |
$2,711 | $2,892 | $8,112 | $9,152 | ||||||||||||
| Loans held for sale |
54 | 61 | 176 | 157 | ||||||||||||
| Investment securities |
606 | 586 | 1,741 | 1,908 | ||||||||||||
| Other interest income |
38 | 34 | 103 | 144 | ||||||||||||
| Total interest income |
3,409 | 3,573 | 10,132 | 11,361 | ||||||||||||
| Interest Expense |
||||||||||||||||
| Deposits |
78 | 130 | 245 | 849 | ||||||||||||
| Short-term borrowings |
18 | 19 | 52 | 124 | ||||||||||||
| Long-term debt |
142 | 197 | 464 | 738 | ||||||||||||
| Total interest expense |
238 | 346 | 761 | 1,711 | ||||||||||||
| Net interest income |
3,171 | 3,227 | 9,371 | 9,650 | ||||||||||||
| Provision for credit losses |
(163 | ) | 635 | (1,160 | ) | 3,365 | ||||||||||
| Net interest income after provision for credit losses |
3,334 | 2,592 | 10,531 | 6,285 | ||||||||||||
| Noninterest Income |
||||||||||||||||
| Credit and debit card revenue |
393 | 388 | 1,125 | 976 | ||||||||||||
| Corporate payment products revenue |
156 | 125 | 420 | 371 | ||||||||||||
| Merchant processing services |
392 | 347 | 1,084 | 950 | ||||||||||||
| Trust and investment management fees |
459 | 434 | 1,349 | 1,295 | ||||||||||||
| Deposit service charges |
194 | 170 | 531 | 512 | ||||||||||||
| Treasury management fees |
155 | 145 | 462 | 425 | ||||||||||||
| Commercial products revenue |
277 | 303 | 837 | 904 | ||||||||||||
| Mortgage banking revenue |
418 | 553 | 1,063 | 1,596 | ||||||||||||
| Investment products fees |
62 | 48 | 177 | 142 | ||||||||||||
| Securities gains (losses), net |
20 | 12 | 88 | 143 | ||||||||||||
| Other |
167 | 187 | 557 | 537 | ||||||||||||
| Total noninterest income |
2,693 | 2,712 | 7,693 | 7,851 | ||||||||||||
| Noninterest Expense |
||||||||||||||||
| Compensation |
1,847 | 1,687 | 5,448 | 4,992 | ||||||||||||
| Employee benefits |
336 | 335 | 1,057 | 1,001 | ||||||||||||
| Net occupancy and equipment |
259 | 276 | 780 | 823 | ||||||||||||
| Professional services |
126 | 102 | 332 | 307 | ||||||||||||
| Marketing and business development |
99 | 72 | 237 | 213 | ||||||||||||
| Technology and communications |
361 | 334 | 1,082 | 932 | ||||||||||||
| Postage, printing and supplies |
69 | 70 | 203 | 214 | ||||||||||||
| Other intangibles |
41 | 44 | 119 | 129 | ||||||||||||
| Other |
291 | 451 | 937 | 1,394 | ||||||||||||
| Total noninterest expense |
3,429 | 3,371 | 10,195 | 10,005 | ||||||||||||
| Income before income taxes |
2,598 | 1,933 | 8,029 | 4,131 | ||||||||||||
| Applicable income taxes |
564 | 347 | 1,722 | 671 | ||||||||||||
| Net income |
2,034 | 1,586 | 6,307 | 3,460 | ||||||||||||
| Net (income) loss attributable to noncontrolling interests |
(6 | ) | (6 | ) | (17 | ) | (20 | ) | ||||||||
| Net income attributable to U.S. Bancorp |
$2,028 | $1,580 | $6,290 | $3,440 | ||||||||||||
| Net income applicable to U.S. Bancorp common shareholders |
$1,934 | $1,494 | $6,023 | $3,196 | ||||||||||||
| Earnings per common share |
$1.30 | $.99 | $4.04 | $2.12 | ||||||||||||
| Diluted earnings per common share |
$1.30 | $.99 | $4.04 | $2.11 | ||||||||||||
| Dividends declared per common share |
$.46 | $.42 | $1.30 | $1.26 | ||||||||||||
| Average common shares outstanding |
1,483 | 1,506 | 1,491 | 1,510 | ||||||||||||
| Average diluted common shares outstanding |
1,484 | 1,507 | 1,492 | 1,511 | ||||||||||||
14
|
|
| CONSOLIDATED ENDING BALANCE SHEET |
|
|||||||||||
| (Dollars in Millions) | September 30, 2021 |
December 31, 2020 |
September 30, 2020 |
|||||||||
| Assets |
(Unaudited | ) | (Unaudited | ) | ||||||||
| Cash and due from banks |
$63,904 | $62,580 | $44,047 | |||||||||
| Available-for-sale investment securities |
149,376 | 136,840 | 134,032 | |||||||||
| Loans held for sale |
6,191 | 8,761 | 7,618 | |||||||||
| Loans |
||||||||||||
| Commercial |
101,013 | 102,871 | 110,764 | |||||||||
| Commercial real estate |
38,808 | 39,311 | 40,380 | |||||||||
| Residential mortgages |
74,954 | 76,155 | 76,789 | |||||||||
| Credit card |
22,137 | 22,346 | 21,898 | |||||||||
| Other retail |
60,696 | 57,024 | 57,154 | |||||||||
| Total loans |
297,608 | 297,707 | 306,985 | |||||||||
| Less allowance for loan losses |
(5,792 | ) | (7,314 | ) | (7,407 | ) | ||||||
| Net loans |
291,816 | 290,393 | 299,578 | |||||||||
| Premises and equipment |
3,262 | 3,468 | 3,516 | |||||||||
| Goodwill |
9,996 | 9,918 | 9,889 | |||||||||
| Other intangible assets |
3,528 | 2,864 | 2,654 | |||||||||
| Other assets |
39,422 | 39,081 | 39,121 | |||||||||
| Total assets |
$567,495 | $553,905 | $540,455 | |||||||||
| Liabilities and Shareholders’ Equity |
||||||||||||
| Deposits |
||||||||||||
| Noninterest-bearing |
135,549 | $118,089 | $114,583 | |||||||||
| Interest-bearing |
307,353 | 311,681 | 298,634 | |||||||||
| Total deposits |
442,902 | 429,770 | 413,217 | |||||||||
| Short-term borrowings |
16,088 | 11,766 | 13,723 | |||||||||
| Long-term debt |
35,671 | 41,297 | 42,443 | |||||||||
| Other liabilities |
18,456 | 17,347 | 17,877 | |||||||||
| Total liabilities |
513,117 | 500,180 | 487,260 | |||||||||
| Shareholders’ equity |
||||||||||||
| Preferred stock |
5,968 | 5,983 | 5,984 | |||||||||
| Common stock |
21 | 21 | 21 | |||||||||
| Capital surplus |
8,550 | 8,511 | 8,516 | |||||||||
| Retained earnings |
68,297 | 64,188 | 63,391 | |||||||||
| Less treasury stock |
(27,301 | ) | (25,930 | ) | (25,959 | ) | ||||||
| Accumulated other comprehensive income (loss) |
(1,792 | ) | 322 | 612 | ||||||||
| Total U.S. Bancorp shareholders’ equity |
53,743 | 53,095 | 52,565 | |||||||||
| Noncontrolling interests |
635 | 630 | 630 | |||||||||
| Total equity |
54,378 | 53,725 | 53,195 | |||||||||
| Total liabilities and equity |
$567,495 | $553,905 | $540,455 | |||||||||
15
|
|
| NON-GAAP FINANCIAL MEASURES |
| |||||||||||||||||||
| (Dollars in Millions, Unaudited) | September 30, 2021 |
June 30, 2021 |
March 31, 2021 |
December 31, 2020 |
September 30, 2020 |
|||||||||||||||
| Total equity |
$54,378 | $53,674 | $52,308 | $53,725 | $53,195 | |||||||||||||||
| Preferred stock |
(5,968 | ) | (5,968 | ) | (5,968 | ) | (5,983 | ) | (5,984 | ) | ||||||||||
| Noncontrolling interests |
(635 | ) | (635 | ) | (630 | ) | (630 | ) | (630 | ) | ||||||||||
| Goodwill (net of deferred tax liability) (1) |
(9,063 | ) | (8,987 | ) | (8,992 | ) | (9,014 | ) | (8,992 | ) | ||||||||||
| Intangible assets, other than mortgage servicing rights |
(618 | ) | (650 | ) | (675 | ) | (654 | ) | (676 | ) | ||||||||||
| Tangible common equity (a) |
38,094 | 37,434 | 36,043 | 37,444 | 36,913 | |||||||||||||||
| Common equity tier 1 capital, determined in accordance with transitional regulatory capital requirements related to the current expected credit losses methodology implementation |
41,014 | 39,691 | 39,103 | 38,045 | 37,485 | |||||||||||||||
| Adjustments (2) |
(1,733 | ) | (1,732 | ) | (1,732 | ) | (1,733 | ) | (1,733 | ) | ||||||||||
| Common equity tier 1 capital, reflecting the full implementation of the current expected credit losses methodology (b) |
39,281 | 37,959 | 37,371 | 36,312 | 35,752 | |||||||||||||||
| Total assets |
567,495 | 558,886 | 553,375 | 553,905 | 540,455 | |||||||||||||||
| Goodwill (net of deferred tax liability) (1) |
(9,063 | ) | (8,987 | ) | (8,992 | ) | (9,014 | ) | (8,992 | ) | ||||||||||
| Intangible assets, other than mortgage servicing rights |
(618 | ) | (650 | ) | (675 | ) | (654 | ) | (676 | ) | ||||||||||
| Tangible assets (c) |
557,814 | 549,249 | 543,708 | 544,237 | 530,787 | |||||||||||||||
| Risk-weighted assets, determined in accordance with prescribed regulatory capital requirements effective for the Company (d) |
404,021* | 401,301 | 396,351 | 393,648 | 397,657 | |||||||||||||||
| Adjustments (3) |
(684)* | (1,027 | ) | (1,440 | ) | (1,471 | ) | (1,449 | ) | |||||||||||
| Risk-weighted assets, reflecting the full implementation of the current expected credit
losses |
403,337* | 400,274 | 394,911 | 392,177 | 396,208 | |||||||||||||||
| Ratios* |
||||||||||||||||||||
| Tangible common equity to tangible assets (a)/(c) |
6.8 | % | 6.8 | % | 6.6 | % | 6.9 | % | 7.0 | % | ||||||||||
| Tangible common equity to risk-weighted assets (a)/(d) |
9.4 | 9.3 | 9.1 | 9.5 | 9.3 | |||||||||||||||
| Common equity tier 1 capital to risk-weighted assets, reflecting the full implementation of the current expected credit losses methodology (b)/(e) |
9.7 | 9.5 | 9.5 | 9.3 | 9.0 | |||||||||||||||
| Three Months Ended | ||||||||||||||||||||
| September 30, 2021 |
June 30, 2021 |
March 31, 2021 |
December 31, 2020 |
September 30, 2020 |
||||||||||||||||
| Net income applicable to U.S. Bancorp common shareholders |
$1,934 | $1,914 | $2,175 | $1,425 | $1,494 | |||||||||||||||
| Intangibles amortization (net-of-tax) |
32 | 32 | 30 | 37 | 35 | |||||||||||||||
| Net income applicable to U.S. Bancorp common shareholders, excluding intangibles amortization |
1,966 | 1,946 | 2,205 | 1,462 | 1,529 | |||||||||||||||
| Annualized net income applicable to U.S. Bancorp common shareholders, excluding intangible amortization (f) |
7,800 | 7,805 | 8,943 | 5,816 | 6,083 | |||||||||||||||
| Average total equity |
54,908 | 53,593 | 53,359 | 53,801 | 53,046 | |||||||||||||||
| Average preferred stock |
(5,968 | ) | (5,968 | ) | (6,213 | ) | (6,217 | ) | (5,984 | ) | ||||||||||
| Average noncontrolling interests |
(635 | ) | (631 | ) | (630 | ) | (630 | ) | (630 | ) | ||||||||||
| Average goodwill (net of deferred tax liability) (1) |
(9,019 | ) | (9,003 | ) | (9,010 | ) | (9,003 | ) | (8,975 | ) | ||||||||||
| Average intangible assets, other than mortgage servicing rights |
(632 | ) | (662 | ) | (649 | ) | (673 | ) | (711 | ) | ||||||||||
| Average tangible common equity (g) |
38,654 | 37,329 | 36,857 | 37,278 | 36,746 | |||||||||||||||
| Return on tangible common equity (f)/(g) |
20.2 | % | 20.9 | % | 24.3 | % | 15.6 | % | 16.6 | % | ||||||||||
| Net interest income |
$3,171 | $3,137 | $3,063 | $3,175 | $3,227 | |||||||||||||||
| Taxable-equivalent adjustment (4) |
26 | 27 | 26 | 26 | 25 | |||||||||||||||
| Net interest income, on a taxable-equivalent basis |
3,197 | 3,164 | 3,089 | 3,201 | 3,252 | |||||||||||||||
| Net interest income, on a taxable-equivalent basis (as calculated above) |
3,197 | 3,164 | 3,089 | 3,201 | 3,252 | |||||||||||||||
| Noninterest income |
2,693 | 2,619 | 2,381 | 2,550 | 2,712 | |||||||||||||||
| Less: Securities gains (losses), net |
20 | 43 | 25 | 34 | 12 | |||||||||||||||
| Total net revenue, excluding net securities gains (losses) (h) |
5,870 | 5,740 | 5,445 | 5,717 | 5,952 | |||||||||||||||
| Noninterest expense (i) |
3,429 | 3,387 | 3,379 | 3,364 | 3,371 | |||||||||||||||
| Efficiency ratio (i)/(h) |
58.4 | % | 59.0 | % | 62.1 | % | 58.8 | % | 56.6 | % | ||||||||||
| * | Preliminary data. Subject to change prior to filings with applicable regulatory agencies. |
| (1) | Includes goodwill related to certain investments in unconsolidated financial institutions per prescribed regulatory requirements. |
| (2) | Includes the estimated increase in the allowance for credit losses related to the adoption of the current expected credit losses methodology net of deferred taxes. |
| (3) | Includes the impact of the estimated increase in the allowance for credit losses related to the adoption of the current expected credit losses methodology. |
| (4) | Based on a federal income tax rate of 21 percent for those assets and liabilities whose income or expense is not included for federal income tax purposes. |
16

|
|
||
| LINE OF BUSINESS FINANCIAL PERFORMANCE (a) | ||||||||||||||||||||||||||||||||||
| ($ in millions) | Net Income Attributable | Net Income Attributable | ||||||||||||||||||||||||||||||||
| to U.S. Bancorp | Percent Change | to U.S. Bancorp | ||||||||||||||||||||||||||||||||
| Business Line | 3Q 2021 |
2Q 2021 |
3Q 2020 |
3Q21 vs 2Q21 |
3Q21 vs 3Q20 |
YTD 2021 |
YTD 2020 |
Percent Change |
||||||||||||||||||||||||||
| Corporate and Commercial Banking |
$403 | $429 | $447 | (6.1 | ) | (9.8 | ) | $1,291 | $1,230 | 5.0 | ||||||||||||||||||||||||
| Consumer and Business Banking |
628 | 632 | 649 | (.6 | ) | (3.2 | ) | 1,833 | 1,747 | 4.9 | ||||||||||||||||||||||||
| Wealth Management and Investment Services |
196 | 198 | 227 | (1.0 | ) | (13.7 | ) | 618 | 737 | (16.1 | ) | |||||||||||||||||||||||
| Payment Services |
409 | 442 | 322 | (7.5 | ) | 27.0 | 1,341 | 1,010 | 32.8 | |||||||||||||||||||||||||
| Treasury and Corporate Support |
392 | 281 | (65) | 39.5 | nm | 1,207 | (1,284 | ) | nm | |||||||||||||||||||||||||
| Consolidated Company |
$2,028 | $1,982 | $1,580 | 2.3 | 28.4 | $6,290 | $3,440 | 82.8 | ||||||||||||||||||||||||||
| (a) preliminary data
|
||||||||||||||||||||||||||||||||||
Lines of Business
The Company’s major lines of business are Corporate and Commercial Banking, Consumer and Business Banking, Wealth Management and Investment Services, Payment Services, and Treasury and Corporate Support. These operating segments are components of the Company about which financial information is prepared and is evaluated regularly by management in deciding how to allocate resources and assess performance. Business line results are derived from the Company’s business unit profitability reporting systems by specifically attributing managed balance sheet assets, deposits and other liabilities and their related income or expense. Designations, assignments and allocations change from time to time as management systems are enhanced, methods of evaluating performance or product lines change or business segments are realigned to better respond to the Company’s diverse customer base. During 2021, certain organization and methodology changes were made and, accordingly, prior period results were restated and presented on a comparable basis.
2
|
|
||
| CORPORATE AND COMMERCIAL BANKING (a) | ||||||||||||||||||||||||||||||||||
| ($ in millions) | Percent Change | |||||||||||||||||||||||||||||||||
| 3Q 2021 |
2Q 2021 |
3Q 2020 |
3Q21 vs 2Q21 |
3Q21 vs 3Q20 |
YTD 2021 |
YTD 2020 |
Percent Change |
|||||||||||||||||||||||||||
| Condensed Income Statement |
||||||||||||||||||||||||||||||||||
| Net interest income (taxable-equivalent basis) |
$717 | $734 | $852 | (2.3 | ) | (15.8 | ) | $2,172 | $2,623 | (17.2 | ) | |||||||||||||||||||||||
| Noninterest income |
253 | 265 | 267 | (4.5 | ) | (5.2 | ) | 786 | 899 | (12.6 | ) | |||||||||||||||||||||||
| Securities gains (losses), net |
-- | -- | -- | -- | -- | -- | -- | -- | ||||||||||||||||||||||||||
| Total net revenue |
970 | 999 | 1,119 | (2.9 | ) | (13.3 | ) | 2,958 | 3,522 | (16.0 | ) | |||||||||||||||||||||||
| Noninterest expense |
418 | 425 | 428 | (1.6 | ) | (2.3 | ) | 1,257 | 1,310 | (4.0 | ) | |||||||||||||||||||||||
| Other intangibles |
-- | -- | -- | -- | -- | -- | -- | -- | ||||||||||||||||||||||||||
| Total noninterest expense |
418 | 425 | 428 | (1.6 | ) | (2.3 | ) | 1,257 | 1,310 | (4.0 | ) | |||||||||||||||||||||||
| Income before provision and taxes |
552 | 574 | 691 | (3.8 | ) | (20.1 | ) | 1,701 | 2,212 | (23.1 | ) | |||||||||||||||||||||||
| Provision for credit losses |
15 | 2 | 95 | nm | (84.2 | ) | (20 | ) | 572 | nm | ||||||||||||||||||||||||
| Income before income taxes |
537 | 572 | 596 | (6.1 | ) | (9.9 | ) | 1,721 | 1,640 | 4.9 | ||||||||||||||||||||||||
| Income taxes and taxable-equivalent adjustment |
134 | 143 | 149 | (6.3 | ) | (10.1 | ) | 430 | 410 | 4.9 | ||||||||||||||||||||||||
| Net income |
403 | 429 | 447 | (6.1 | ) | (9.8 | ) | 1,291 | 1,230 | 5.0 | ||||||||||||||||||||||||
| Net (income) loss attributable to noncontrolling interests |
-- | -- | -- | -- | -- | -- | -- | -- | ||||||||||||||||||||||||||
| Net income attributable to U.S. Bancorp |
$403 | $429 | $447 | (6.1 | ) | (9.8 | ) | $1,291 | $1,230 | 5.0 | ||||||||||||||||||||||||
| Average Balance Sheet Data |
||||||||||||||||||||||||||||||||||
| Loans |
$102,431 | $102,024 | $115,547 | .4 | (11.4 | ) | $102,117 | $118,686 | (14.0 | ) | ||||||||||||||||||||||||
| Other earning assets |
4,722 | 4,409 | 4,110 | 7.1 | 14.9 | 4,485 | 4,170 | 7.6 | ||||||||||||||||||||||||||
| Goodwill |
1,650 | 1,647 | 1,647 | .2 | .2 | 1,648 | 1,647 | .1 | ||||||||||||||||||||||||||
| Other intangible assets |
5 | 5 | 6 | -- | (16.7 | ) | 5 | 6 | (16.7 | ) | ||||||||||||||||||||||||
| Assets |
114,629 | 113,904 | 128,369 | .6 | (10.7 | ) | 114,182 | 131,106 | (12.9 | ) | ||||||||||||||||||||||||
| Noninterest-bearing deposits |
62,642 | 60,554 | 48,058 | 3.4 | 30.3 | 59,841 | 41,091 | 45.6 | ||||||||||||||||||||||||||
| Interest-bearing deposits |
68,917 | 69,626 | 87,558 | (1.0 | ) | (21.3 | ) | 69,999 | 90,581 | (22.7 | ) | |||||||||||||||||||||||
| Total deposits |
131,559 | 130,180 | 135,616 | 1.1 | (3.0 | ) | 129,840 | 131,672 | (1.4 | ) | ||||||||||||||||||||||||
| Total U.S. Bancorp shareholders’ equity |
13,772 | 13,824 | 15,051 | (.4 | ) | (8.5 | ) | 13,995 | 15,201 | (7.9 | ) | |||||||||||||||||||||||
|
(a) preliminary data |
||||||||||||||||||||||||||||||||||
Corporate and Commercial Banking offers lending, equipment finance and small-ticket leasing, depository services, treasury management, capital markets services, international trade services and other financial services to middle market, large corporate, commercial real estate, financial institution, non-profit and public sector clients.
Corporate and Commercial Banking contributed $403 million of the Company’s net income in the third quarter of 2021, compared with $447 million in the third quarter of 2020. Total net revenue was $149 million (13.3 percent) lower due to a decrease of $135 million (15.8 percent) in net interest income and a decrease of $14 million (5.2 percent) in total noninterest income. Net interest income decreased primarily due to lower average loan and deposit balances as well as the impact of declining interest rates on the margin benefit from deposits, partially offset by favorable deposit mix with higher noninterest-bearing balances and slightly higher loan spreads. Average loans declined 11.4 percent as significant liquidity draws during the pandemic were paid down during the past several quarters. Total noninterest income decreased year-over-year primarily driven by lower capital markets activity and trading revenue, partially offset by continued stronger treasury management fees due to core growth driven by the economic recovery. Total noninterest expense decreased $10 million (2.3 percent) compared with a year ago primarily due to lower FDIC insurance expense, lower production incentives, and higher capitalized loan costs, partially offset by an increase in net shared services expense driven by investment in infrastructure and technology development. The provision for credit losses decreased $80 million (84.2 percent) compared with the third quarter of 2020 primarily due to a favorable change in the reserve allocation driven by improving portfolio credit quality in the current quarter, compared with deteriorating credit quality in the third quarter of 2020.
3
|
|
||
| CONSUMER AND BUSINESS BANKING (a) | ||||||||||||||||||||||||||||||||||
| ($ in millions) | Percent Change | |||||||||||||||||||||||||||||||||
| 3Q 2021 |
2Q 2021 |
3Q 2020 |
3Q21 vs 2Q21 |
3Q21 vs 3Q20 |
YTD 2021 |
YTD 2020 |
Percent Change |
|||||||||||||||||||||||||||
| Condensed Income Statement |
||||||||||||||||||||||||||||||||||
| Net interest income (taxable-equivalent basis) |
$1,551 | $1,537 | $1,474 | .9 | 5.2 | $4,603 | $4,239 | 8.6 | ||||||||||||||||||||||||||
| Noninterest income |
715 | 634 | 848 | 12.8 | (15.7 | ) | 1,918 | 2,433 | (21.2 | ) | ||||||||||||||||||||||||
| Securities gains (losses), net |
-- | -- | -- | -- | -- | -- | -- | -- | ||||||||||||||||||||||||||
| Total net revenue |
2,266 | 2,171 | 2,322 | 4.4 | (2.4 | ) | 6,521 | 6,672 | (2.3 | ) | ||||||||||||||||||||||||
| Noninterest expense |
1,450 | 1,394 | 1,383 | 4.0 | 4.8 | 4,210 | 4,061 | 3.7 | ||||||||||||||||||||||||||
| Other intangibles |
3 | 3 | 4 | -- | (25.0 | ) | 9 | 12 | (25.0 | ) | ||||||||||||||||||||||||
| Total noninterest expense |
1,453 | 1,397 | 1,387 | 4.0 | 4.8 | 4,219 | 4,073 | 3.6 | ||||||||||||||||||||||||||
| Income before provision and taxes |
813 | 774 | 935 | 5.0 | (13.0 | ) | 2,302 | 2,599 | (11.4 | ) | ||||||||||||||||||||||||
| Provision for credit losses |
(25 | ) | (69 | ) | 69 | 63.8 | nm | (143 | ) | 269 | nm | |||||||||||||||||||||||
| Income before income taxes |
838 | 843 | 866 | (.6 | ) | (3.2 | ) | 2,445 | 2,330 | 4.9 | ||||||||||||||||||||||||
| Income taxes and taxable-equivalent adjustment |
210 | 211 | 217 | (.5 | ) | (3.2 | ) | 612 | 583 | 5.0 | ||||||||||||||||||||||||
| Net income |
628 | 632 | 649 | (.6 | ) | (3.2 | ) | 1,833 | 1,747 | 4.9 | ||||||||||||||||||||||||
| Net (income) loss attributable to noncontrolling interests |
-- | -- | -- | -- | -- | -- | -- | -- | ||||||||||||||||||||||||||
| Net income attributable to U.S. Bancorp |
$628 | $632 | $649 | (.6 | ) | (3.2 | ) | $1,833 | $1,747 | 4.9 | ||||||||||||||||||||||||
| Average Balance Sheet Data |
||||||||||||||||||||||||||||||||||
| Loans |
$140,833 | $141,081 | $145,229 | (.2 | ) | (3.0 | ) | $141,220 | $139,981 | .9 | ||||||||||||||||||||||||
| Other earning assets |
7,645 | 8,022 | 8,195 | (4.7 | ) | (6.7 | ) | 8,606 | 6,578 | 30.8 | ||||||||||||||||||||||||
| Goodwill |
3,506 | 3,475 | 3,475 | .9 | .9 | 3,485 | 3,508 | (.7 | ) | |||||||||||||||||||||||||
| Other intangible assets |
2,754 | 2,827 | 1,942 | (2.6 | ) | 41.8 | 2,692 | 2,095 | 28.5 | |||||||||||||||||||||||||
| Assets |
160,882 | 161,948 | 164,246 | (.7 | ) | (2.0 | ) | 162,316 | 157,177 | 3.3 | ||||||||||||||||||||||||
| Noninterest-bearing deposits |
34,416 | 33,882 | 34,288 | 1.6 | .4 | 33,734 | 29,397 | 14.8 | ||||||||||||||||||||||||||
| Interest-bearing deposits |
160,271 | 158,792 | 133,095 | .9 | 20.4 | 156,821 | 126,934 | 23.5 | ||||||||||||||||||||||||||
| Total deposits |
194,687 | 192,674 | 167,383 | 1.0 | 16.3 | 190,555 | 156,331 | 21.9 | ||||||||||||||||||||||||||
| Total U.S. Bancorp shareholders’ equity |
12,277 | 12,359 | 13,562 | (.7 | ) | (9.5 | ) | 12,378 | 12,797 | (3.3 | ) | |||||||||||||||||||||||
| (a) preliminary data
|
||||||||||||||||||||||||||||||||||
Consumer and Business Banking delivers products and services through banking offices, telephone servicing and sales, on-line services, direct mail, ATM processing and mobile devices. It encompasses community banking, metropolitan banking and indirect lending, as well as mortgage banking.
Consumer and Business Banking contributed $628 million of the Company’s net income in the third quarter of 2021, compared with $649 million in the third quarter of 2020. Total net revenue was lower by $56 million (2.4 percent) due to a decrease in total noninterest income of $133 million (15.7 percent), partially offset by an increase of $77 million (5.2 percent) in net interest income. Net interest income reflected continued strong growth in deposit balances as well as favorable deposit mix, favorable loan spreads driven by growth in installment loans, and higher loan fees driven by PPP loan forgiveness. This was partially offset by lower deposit spreads. Total noninterest income decreased primarily due to lower mortgage banking revenue reflecting lower production volume and related gain on sale margins as refinancing activities decline, partially offset by the favorable net impact of the change in fair value of mortgage servicing rights, net of hedging activities, as well as gains on higher GNMA loan sales. Retail product fees were stronger driven by retail leasing end of term residual gains and deposit service charges increased as a result of customer activity and ATM processing revenue. Total noninterest expense increased $66 million (4.8 percent) primarily due to an increase in net shared services expense due to investments in digital capabilities and higher compensation expense from merit, business hiring related to mortgage forbearance loss mitigation and revenue-related compensation driven by business production. The provision for credit losses decreased $94 million due to a favorable change in the reserve allocation primarily reflecting lower delinquency rates in consumer portfolios and a reduction in end of period outstanding balances in the third quarter of 2021 compared with growth in the third quarter of 2020.
4
|
|
||
| WEALTH MANAGEMENT AND INVESTMENT SERVICES (a) | ||||||||||||||||||||||||||||||||||
| ($ in millions) | Percent Change | |||||||||||||||||||||||||||||||||
| 3Q 2021 |
2Q 2021 |
3Q 2020 |
3Q21 vs 2Q21 |
3Q21 vs 3Q20 |
YTD 2021 |
YTD 2020 |
Percent Change |
|||||||||||||||||||||||||||
| Condensed Income Statement |
||||||||||||||||||||||||||||||||||
| Net interest income (taxable-equivalent basis) |
$225 | $230 | $301 | (2.2 | ) | (25.2 | ) | $721 | $964 | (25.2 | ) | |||||||||||||||||||||||
| Noninterest income |
558 | 549 | 505 | 1.6 | 10.5 | 1,638 | 1,507 | 8.7 | ||||||||||||||||||||||||||
| Securities gains (losses), net |
-- | -- | -- | -- | -- | -- | -- | -- | ||||||||||||||||||||||||||
| Total net revenue |
783 | 779 | 806 | .5 | (2.9 | ) | 2,359 | 2,471 | (4.5 | ) | ||||||||||||||||||||||||
| Noninterest expense |
507 | 507 | 489 | -- | 3.7 | 1,499 | 1,445 | 3.7 | ||||||||||||||||||||||||||
| Other intangibles |
4 | 4 | 3 | -- | 33.3 | 10 | 9 | 11.1 | ||||||||||||||||||||||||||
| Total noninterest expense |
511 | 511 | 492 | -- | 3.9 | 1,509 | 1,454 | 3.8 | ||||||||||||||||||||||||||
| Income before provision and taxes |
272 | 268 | 314 | 1.5 | (13.4 | ) | 850 | 1,017 | (16.4 | ) | ||||||||||||||||||||||||
| Provision for credit losses |
11 | 4 | 11 | nm | -- | 26 | 34 | (23.5 | ) | |||||||||||||||||||||||||
| Income before income taxes |
261 | 264 | 303 | (1.1 | ) | (13.9 | ) | 824 | 983 | (16.2 | ) | |||||||||||||||||||||||
| Income taxes and taxable-equivalent adjustment |
65 | 66 | 76 | (1.5 | ) | (14.5 | ) | 206 | 246 | (16.3 | ) | |||||||||||||||||||||||
| Net income |
196 | 198 | 227 | (1.0 | ) | (13.7 | ) | 618 | 737 | (16.1 | ) | |||||||||||||||||||||||
| Net (income) loss attributable to noncontrolling interests |
-- | -- | -- | -- | -- | -- | -- | -- | ||||||||||||||||||||||||||
| Net income attributable to U.S. Bancorp |
$196 | $198 | $227 | (1.0 | ) | (13.7 | ) | $618 | $737 | (16.1 | ) | |||||||||||||||||||||||
| Average Balance Sheet Data |
||||||||||||||||||||||||||||||||||
| Loans |
$18,454 | $17,436 | $15,616 | 5.8 | 18.2 | $17,584 | $15,151 | 16.1 | ||||||||||||||||||||||||||
| Other earning assets |
225 | 237 | 288 | (5.1 | ) | (21.9 | ) | 247 | 285 | (13.3 | ) | |||||||||||||||||||||||
| Goodwill |
1,618 | 1,618 | 1,618 | -- | -- | 1,618 | 1,617 | .1 | ||||||||||||||||||||||||||
| Other intangible assets |
80 | 84 | 37 | (4.8 | ) | nm | 69 | 40 | 72.5 | |||||||||||||||||||||||||
| Assets |
21,566 | 20,396 | 18,708 | 5.7 | 15.3 | 20,676 | 18,324 | 12.8 | ||||||||||||||||||||||||||
| Noninterest-bearing deposits |
24,453 | 23,249 | 17,719 | 5.2 | 38.0 | 23,024 | 16,285 | 41.4 | ||||||||||||||||||||||||||
| Interest-bearing deposits |
71,841 | 73,107 | 73,857 | (1.7 | ) | (2.7 | ) | 76,098 | 76,736 | (.8 | ) | |||||||||||||||||||||||
| Total deposits |
96,294 | 96,356 | 91,576 | (.1 | ) | 5.2 | 99,122 | 93,021 | 6.6 | |||||||||||||||||||||||||
| Total U.S. Bancorp shareholders’ equity |
3,172 | 3,089 | 2,968 | 2.7 | 6.9 | 3,099 | 2,924 | 6.0 | ||||||||||||||||||||||||||
| (a) preliminary data
|
||||||||||||||||||||||||||||||||||
Wealth Management and Investment Services provides private banking, financial advisory services, investment management, retail brokerage services, insurance, trust, custody and fund servicing through four businesses: Wealth Management, Global Corporate Trust & Custody, U.S. Bancorp Asset Management and Fund Services.
Wealth Management and Investment Services contributed $196 million of the Company’s net income in the third quarter of 2021, compared with $227 million in the third quarter of 2020. Total net revenue was lower by $23 million (2.9 percent) year-over-year reflecting a decrease in net interest income of $76 million (25.2 percent), partially offset by an increase of $53 million (10.5 percent) in noninterest income. Net interest income decreased year-over-year primarily due to the declining margin benefit of deposits given lower interest rates, partially offset by higher noninterest-bearing deposits and favorable deposit mix as well as higher average loan balances. Total noninterest income increased primarily due to core business growth in trust and investment management fees and investment products fees both driven by favorable market conditions, partially offset by higher fee waivers related to money market funds. Total noninterest expense increased $19 million (3.9 percent) compared with the third quarter of 2020 reflecting higher compensation expense as a result of merit, performance-based incentives related to investment sales volumes and core business growth and an increase in net shared services expense, partially offset by lower other noninterest expense due to the allocation to the business line of previously reserved legal matters in the third quarter of 2020. The provision for credit losses was flat to the third quarter of 2020 reflecting stable credit quality in the current quarter, compared with credit quality deterioration in the third quarter of 2020 offset by stronger balance growth in the current period compared with the prior year quarter.
5
|
|
||
| PAYMENT SERVICES (a) | ||||||||||||||||||||||||||||||||||
| ($ in millions) | Percent Change | |||||||||||||||||||||||||||||||||
| 3Q 2021 |
2Q 2021 |
3Q 2020 |
3Q21 vs 2Q21 |
3Q21 vs 3Q20 |
YTD 2021 |
YTD 2020 |
Percent Change |
|||||||||||||||||||||||||||
| Condensed Income Statement |
||||||||||||||||||||||||||||||||||
| Net interest income (taxable-equivalent basis) |
$616 | $596 | $643 | 3.4 | (4.2 | ) | $1,841 | $1,910 | (3.6 | ) | ||||||||||||||||||||||||
| Noninterest income |
946 | 913 | 867 | 3.6 | 9.1 | 2,644 | 2,319 | 14.0 | ||||||||||||||||||||||||||
| Securities gains (losses), net |
-- | -- | -- | -- | -- | -- | -- | -- | ||||||||||||||||||||||||||
| Total net revenue |
1,562 | 1,509 | 1,510 | 3.5 | 3.4 | 4,485 | 4,229 | 6.1 | ||||||||||||||||||||||||||
| Noninterest expense |
817 | 796 | 797 | 2.6 | 2.5 | 2,381 | 2,296 | 3.7 | ||||||||||||||||||||||||||
| Other intangibles |
34 | 33 | 37 | 3.0 | (8.1 | ) | 100 | 108 | (7.4 | ) | ||||||||||||||||||||||||
| Total noninterest expense |
851 | 829 | 834 | 2.7 | 2.0 | 2,481 | 2,404 | 3.2 | ||||||||||||||||||||||||||
| Income before provision and taxes |
711 | 680 | 676 | 4.6 | 5.2 | 2,004 | 1,825 | 9.8 | ||||||||||||||||||||||||||
| Provision for credit losses |
166 | 91 | 246 | 82.4 | (32.5 | ) | 216 | 477 | (54.7 | ) | ||||||||||||||||||||||||
| Income before income taxes |
545 | 589 | 430 | (7.5 | ) | 26.7 | 1,788 | 1,348 | 32.6 | |||||||||||||||||||||||||
| Income taxes and taxable-equivalent adjustment |
136 | 147 | 108 | (7.5 | ) | 25.9 | 447 | 338 | 32.2 | |||||||||||||||||||||||||
| Net income |
409 | 442 | 322 | (7.5 | ) | 27.0 | 1,341 | 1,010 | 32.8 | |||||||||||||||||||||||||
| Net (income) loss attributable to noncontrolling interests |
-- | -- | -- | -- | -- | -- | -- | -- | ||||||||||||||||||||||||||
| Net income attributable to U.S. Bancorp |
$409 | $442 | $322 | (7.5 | ) | 27.0 | $1,341 | $1,010 | 32.8 | |||||||||||||||||||||||||
| Average Balance Sheet Data |
||||||||||||||||||||||||||||||||||
| Loans |
$31,378 | $30,030 | $31,168 | 4.5 | .7 | $30,353 | $31,725 | (4.3 | ) | |||||||||||||||||||||||||
| Other earning assets |
5 | 5 | 5 | -- | -- | 5 | 5 | -- | ||||||||||||||||||||||||||
| Goodwill |
3,168 | 3,177 | 3,123 | (.3 | ) | 1.4 | 3,174 | 3,027 | 4.9 | |||||||||||||||||||||||||
| Other intangible assets |
496 | 519 | 602 | (4.4 | ) | (17.6 | ) | 519 | 584 | (11.1 | ) | |||||||||||||||||||||||
| Assets |
37,173 | 35,620 | 36,191 | 4.4 | 2.7 | 35,972 | 36,497 | (1.4 | ) | |||||||||||||||||||||||||
| Noninterest-bearing deposits |
4,913 | 5,030 | 6,886 | (2.3 | ) | (28.7 | ) | 5,068 | 3,852 | 31.6 | ||||||||||||||||||||||||
| Interest-bearing deposits |
150 | 141 | 124 | 6.4 | 21.0 | 141 | 119 | 18.5 | ||||||||||||||||||||||||||
| Total deposits |
5,063 | 5,171 | 7,010 | (2.1 | ) | (27.8 | ) | 5,209 | 3,971 | 31.2 | ||||||||||||||||||||||||
| Total U.S. Bancorp shareholders’ equity |
7,561 | 7,413 | 7,716 | 2.0 | (2.0 | ) | 7,544 | 7,269 | 3.8 | |||||||||||||||||||||||||
| (a) preliminary data
|
||||||||||||||||||||||||||||||||||
Payment Services includes consumer and business credit cards, stored-value cards, debit cards, corporate, government and purchasing card services, consumer lines of credit and merchant processing.
Payment Services contributed $409 million of the Company’s net income in the third quarter of 2021, compared with $322 million in the third quarter of 2020. Total net revenue increased $52 million (3.4 percent) primarily due to higher noninterest income of $79 million (9.1 percent), partially offset by lower net interest income of $27 million (4.2 percent). Net interest income decreased primarily due to loan mix, higher credit card payment rates, slightly lower loan yields and lower deposit balances driven by lower prepaid card processing activities as government stimulus dissipates. Total noninterest income increased year-over-year mainly due to continued strengthening of consumer and business spending across most sectors driven by government stimulus, local jurisdictions reducing restrictions and consumer behaviors normalizing. As a result, there was strong growth in merchant processing services revenue driven by higher sales volume and higher merchant fees and equipment income, partially offset by higher rebates. There was also solid growth in corporate payment products revenue driven by improving business spending across all product groups. Total noninterest expense increased $17 million (2.0 percent) reflecting the timing of marketing campaigns and higher net shared services expense, partially offset by higher incremental costs related to the prepaid card business in the third quarter of 2020. The provision for credit losses decreased $80 million (32.5 percent) primarily due to a favorable change in the reserve allocation primarily driven by a combination of slower loan balance growth and improved credit quality relative to the third quarter of 2020.
6
|
|
||
| TREASURY AND CORPORATE SUPPORT (a) | ||||||||||||||||||||||||||||||||||
| ($ in millions) | Percent Change | |||||||||||||||||||||||||||||||||
| 3Q 2021 |
2Q 2021 |
3Q 2020 |
3Q21 vs 2Q21 |
3Q21 vs 3Q20 |
YTD 2021 |
YTD 2020 |
Percent Change |
|||||||||||||||||||||||||||
| Condensed Income Statement |
||||||||||||||||||||||||||||||||||
| Net interest income (taxable-equivalent basis) |
$88 | $67 | $(18) | 31.3 | nm | $113 | $(13 | ) | nm | |||||||||||||||||||||||||
| Noninterest income |
201 | 215 | 213 | (6.5 | ) | (5.6 | ) | 619 | 550 | 12.5 | ||||||||||||||||||||||||
| Securities gains (losses), net |
20 | 43 | 12 | (53.5 | ) | 66.7 | 88 | 143 | (38.5 | ) | ||||||||||||||||||||||||
| Total net revenue |
309 | 325 | 207 | (4.9 | ) | 49.3 | 820 | 680 | 20.6 | |||||||||||||||||||||||||
| Noninterest expense |
196 | 225 | 230 | (12.9 | ) | (14.8 | ) | 729 | 764 | (4.6 | ) | |||||||||||||||||||||||
| Other intangibles |
-- | -- | -- | -- | -- | -- | -- | -- | ||||||||||||||||||||||||||
| Total noninterest expense |
196 | 225 | 230 | (12.9 | ) | (14.8 | ) | 729 | 764 | (4.6 | ) | |||||||||||||||||||||||
| Income (loss) before provision and taxes |
113 | 100 | (23) | 13.0 | nm | 91 | (84 | ) | nm | |||||||||||||||||||||||||
| Provision for credit losses |
(330 | ) | (198 | ) | 214 | (66.7 | ) | nm | (1,239 | ) | 2,013 | nm | ||||||||||||||||||||||
| Income (loss) before income taxes |
443 | 298 | (237) | 48.7 | nm | 1,330 | (2,097 | ) | nm | |||||||||||||||||||||||||
| Income taxes and taxable-equivalent adjustment |
45 | 11 | (178) | nm | nm | 106 | (833 | ) | nm | |||||||||||||||||||||||||
| Net income (loss) |
398 | 287 | (59) | 38.7 | nm | 1,224 | (1,264 | ) | nm | |||||||||||||||||||||||||
| Net (income) loss attributable to noncontrolling interests |
(6 | ) | (6 | ) | (6) | -- | -- | (17 | ) | (20 | ) | 15.0 | ||||||||||||||||||||||
| Net income (loss) attributable to U.S. Bancorp |
$392 | $281 | $(65) | 39.5 | nm | $1,207 | $(1,284 | ) | nm | |||||||||||||||||||||||||
| Average Balance Sheet Data |
||||||||||||||||||||||||||||||||||
| Loans |
$3,643 | $3,713 | $3,458 | (1.9 | ) | 5.3 | $3,740 | $3,392 | 10.3 | |||||||||||||||||||||||||
| Other earning assets |
193,989 | 193,794 | 162,488 | .1 | 19.4 | 192,259 | 156,045 | 23.2 | ||||||||||||||||||||||||||
| Goodwill |
-- | -- | -- | -- | -- | -- | -- | -- | ||||||||||||||||||||||||||
| Other intangible assets |
-- | -- | -- | -- | -- | -- | -- | -- | ||||||||||||||||||||||||||
| Assets |
219,196 | 219,497 | 189,388 | (.1 | ) | 15.7 | 218,053 | 182,276 | 19.6 | |||||||||||||||||||||||||
| Noninterest-bearing deposits |
2,594 | 2,582 | 2,424 | .5 | 7.0 | 2,595 | 2,310 | 12.3 | ||||||||||||||||||||||||||
| Interest-bearing deposits |
1,290 | 2,247 | 1,514 | (42.6 | ) | (14.8 | ) | 1,718 | 3,293 | (47.8 | ) | |||||||||||||||||||||||
| Total deposits |
3,884 | 4,829 | 3,938 | (19.6 | ) | (1.4 | ) | 4,313 | 5,603 | (23.0 | ) | |||||||||||||||||||||||
| Total U.S. Bancorp shareholders’ equity |
17,491 | 16,277 | 13,119 | 7.5 | 33.3 | 16,311 | 13,745 | 18.7 | ||||||||||||||||||||||||||
| (a) preliminary data
|
||||||||||||||||||||||||||||||||||
Treasury and Corporate Support includes the Company’s investment portfolios, funding, capital management, interest rate risk management, income taxes not allocated to the business lines, including most investments in tax-advantaged projects, and the residual aggregate of those expenses associated with corporate activities that are managed on a consolidated basis.
Treasury and Corporate Support contributed $392 million of the Company’s net income in the third quarter of 2021, compared with a $65 million net loss in the third quarter of 2020. Total net revenue was higher by $102 million (49.3 percent) year-over-year due to an increase of $106 million in net interest income, partially offset by a decrease in noninterest income of $4 million (1.8 percent). Net interest income increased primarily due to favorable funding and deposit mix and lower premium amortization in the investment portfolio compared with a year ago. Total noninterest income decreased slightly reflecting lower other noninterest income driven by lower equity investment income in the third quarter of 2021. Total noninterest expense decreased $34 million (14.8 percent) primarily due to lower COVID-19 related accruals compared with the third quarter of 2020, including recognizing liabilities related to future delivery exposures for merchant and airline processing, lower net shared services expense and lower amortization related to tax-advantaged investments which were scaled back in 2020 during the pandemic. These decreases were partially offset by higher compensation expense as a result of merit and performance-based incentives. The provision for credit losses decreased $544 million reflecting the residual impact of changes in the allowance for credit losses being impacted by deteriorating economic conditions in the third quarter of 2020 compared with improving conditions in the current year quarter. Income taxes are assessed to each line of business at a managerial tax rate of 25.0 percent with the residual tax expense or benefit to arrive at the consolidated effective tax rate included in Treasury and Corporate Support.
7
U.S. Bancorp 3Q21 Earnings Conference Call October 14, 2021 Exhibit 99.2

Forward-looking Statements and Additional Information The following information appears in accordance with the Private Securities Litigation Reform Act of 1995: This presentation contains forward-looking statements about U.S. Bancorp. Statements that are not historical or current facts, including statements about beliefs and expectations, are forward-looking statements and are based on the information available to, and assumptions and estimates made by, management as of the date hereof. These forward-looking statements cover, among other things, anticipated future revenue and expenses and the future plans and prospects of U.S. Bancorp. Forward-looking statements involve inherent risks and uncertainties, and important factors could cause actual results to differ materially from those anticipated. The COVID-19 pandemic is adversely affecting U.S. Bancorp, its customers, counterparties, employees, and third-party service providers, and the ultimate extent of the impacts on its business, financial position, results of operations, liquidity, and prospects is uncertain. Continued deterioration in general business and economic conditions or turbulence in domestic or global financial markets could adversely affect U.S. Bancorp’s revenues and the values of its assets and liabilities, reduce the availability of funding to certain financial institutions, lead to a tightening of credit, and increase stock price volatility. In addition, changes to statutes, regulations, or regulatory policies or practices could affect U.S. Bancorp in substantial and unpredictable ways. U.S. Bancorp’s results could also be adversely affected by changes in interest rates; further increases in unemployment rates; deterioration in the credit quality of its loan portfolios or in the value of the collateral securing those loans; deterioration in the value of its investment securities; legal and regulatory developments; litigation; increased competition from both banks and non-banks; civil unrest; changes in customer behavior and preferences; breaches in data security, including as a result of work-from-home arrangements; failures to safeguard personal information; effects of mergers and acquisitions and related integration; effects of critical accounting policies and judgments; and management’s ability to effectively manage credit risk, market risk, operational risk, compliance risk, strategic risk, interest rate risk, liquidity risk and reputation risk. In addition, U.S. Bancorp’s proposed acquisition of MUFG Union Bank presents risks and uncertainties, including, among others: the risk that the cost savings, any revenue synergies and other anticipated benefits of the proposed acquisition may not be realized or may take longer than anticipated to be realized; the possibility that the proposed acquisition, including the integration of MUFG Union Bank, may be more costly or difficult to complete than anticipated; delays in closing the proposed acquisition; and the failure of required governmental approvals to be obtained or any other closing conditions in the definitive purchase agreement to be satisfied. For discussion of these and other risks that may cause actual results to differ from expectations, refer to U.S. Bancorp’s Annual Report on Form 10-K for the year ended December 31, 2020, on file with the Securities and Exchange Commission, including the sections entitled “Risk Factors” and “Corporate Risk Profile” contained in Exhibit 13, and all subsequent filings with the Securities and Exchange Commission under Sections 13(a), 13(c), 14 or 15(d) of the Securities Exchange Act of 1934. In addition, factors other than these risks also could adversely affect U.S. Bancorp’s results, and the reader should not consider these risks to be a complete set of all potential risks or uncertainties. Forward-looking statements speak only as of the date hereof, and U.S. Bancorp undertakes no obligation to update them in light of new information or future events. This presentation includes non-GAAP financial measures to describe U.S. Bancorp’s performance. The calculations of these measures are provided in the Appendix. These disclosures should not be viewed as a substitute for operating results determined in accordance with GAAP, nor are they necessarily comparable to non-GAAP performance measures that may be presented by other companies.

3Q21 Highlights * Taxable-equivalent basis; see slide 27 for calculation ** Common equity tier 1 capital to risk-weighted assets, reflecting the full implementation of the current expected credit losses methodology was 9.7% as of 9/30/21. *** Earnings returned (millions) = total common dividends paid and aggregate value of common shares repurchased
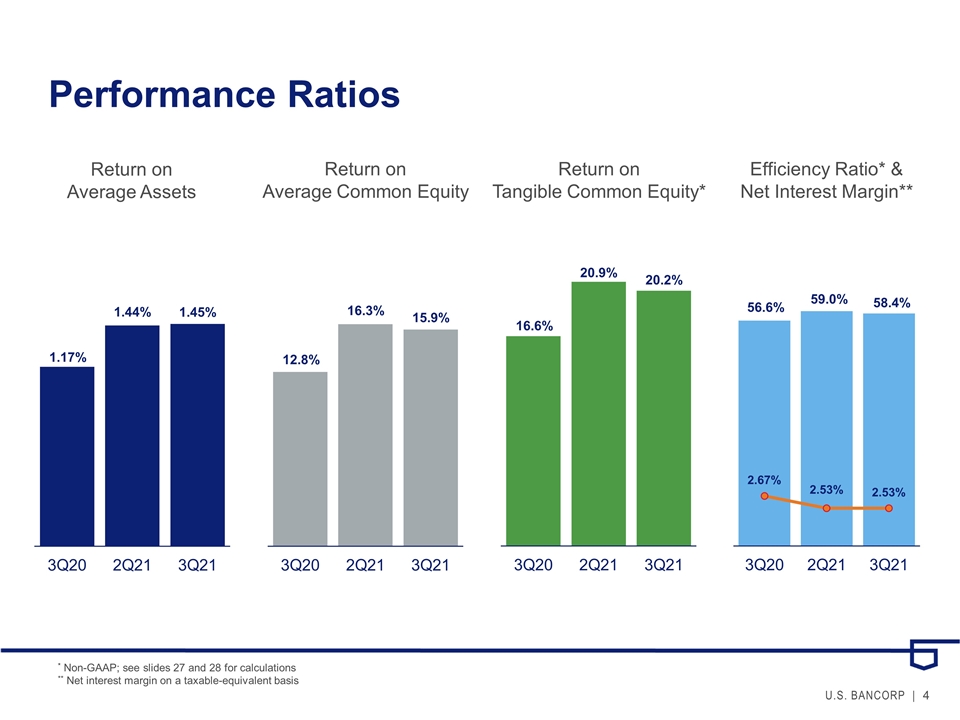
Performance Ratios Efficiency Ratio* & Net Interest Margin** Return on Average Common Equity Return on Tangible Common Equity* Return on Average Assets * Non-GAAP; see slides 27 and 28 for calculations ** Net interest margin on a taxable-equivalent basis

Digital Engagement Trends Three months ended * Represents core Consumer Banking customers active in at least one channel in the previous 90 days ** This chart reflects digital sales definitions aligned to Finalta, a benchmarking service Total Digital includes both online and mobile platforms

With 1.1 million business banking relationships**, there is a significant opportunity for us to deepen current relationships and acquire new customers Banking and Payments* Relationships Business Banking only Business Banking & Payments Payments only Business Banking & Payments * Payments includes Merchant Acquiring and card relationships within RPS ** As defined by businesses with under $25M in revenue Business Banking and Payments Trends

Average Loans +0.8% linked quarter -4.6% year-over-year On a linked quarter basis, average total loans were higher primarily driven by higher other retail loans, higher credit card loans, and higher residential mortgages, partially offset by lower total commercial loans. On a year-over-year basis, average total loans were lower primarily driven by a decline in total commercial loans, lower home equity and second mortgages, and lower commercial real estate loans as a result of paydowns, and lower residential mortgages. These decreases were partially offset by growth in other retail loans driven by growth in installment loans. $ in billions

Average Deposits +0.5% linked quarter +6.4% year-over-year Interest-bearing Deposits Average noninterest-bearing (NIB) deposits increased on both a linked quarter and year-over-year basis. On a linked quarter basis, the increase was driven by Corporate and Commercial Banking and Wealth Management and Investment Services, while the year-over-year increase was primarily driven by Corporate and Commercial Banking and Wealth Management and Investment Services, partially offset by a decrease in Payments Services. Average time deposits, which are managed based on funding needs, relative pricing and liquidity characteristics, were lower on both a linked quarter and year-over-year basis. The growth in average NIB deposits and total average savings deposits year-over-year was primarily a result of the actions by the federal government to increase liquidity in the financial system and government stimulus programs. $ in billions
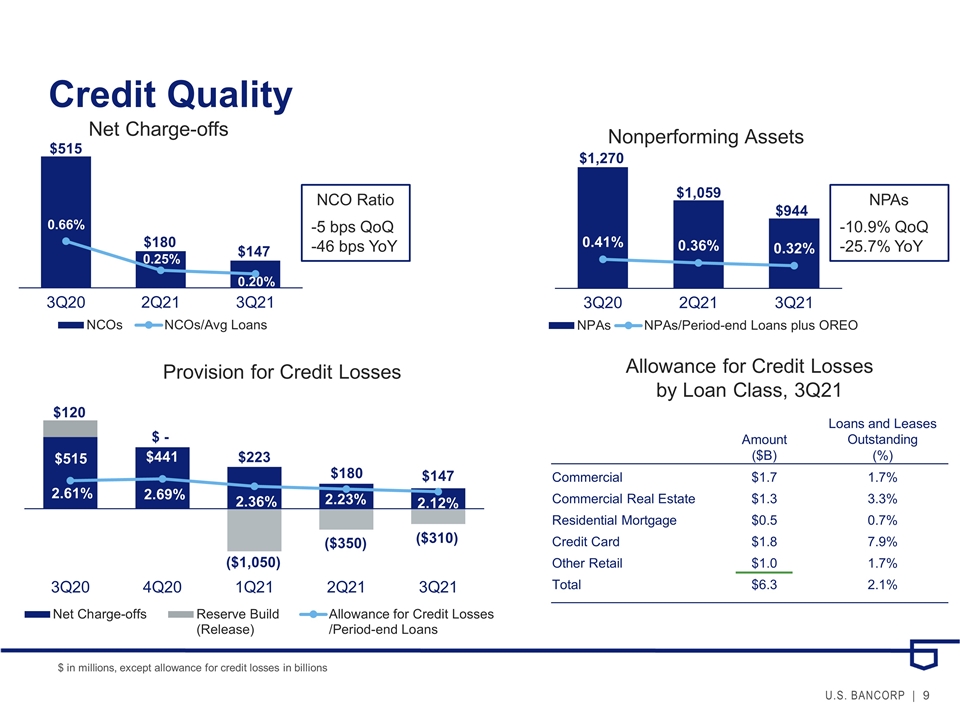
Credit Quality NCO Ratio -5 bps QoQ -46 bps YoY NPAs -10.9% QoQ -25.7% YoY $ in millions, except allowance for credit losses in billions Allowance for Credit Losses by Loan Class, 3Q21 Amount ($B) Loans and Leases Outstanding (%) Commercial $1.7 1.7% Commercial Real Estate $1.3 3.3% Residential Mortgage $0.5 0.7% Credit Card $1.8 7.9% Other Retail $1.0 1.7% Total $6.3 2.1%
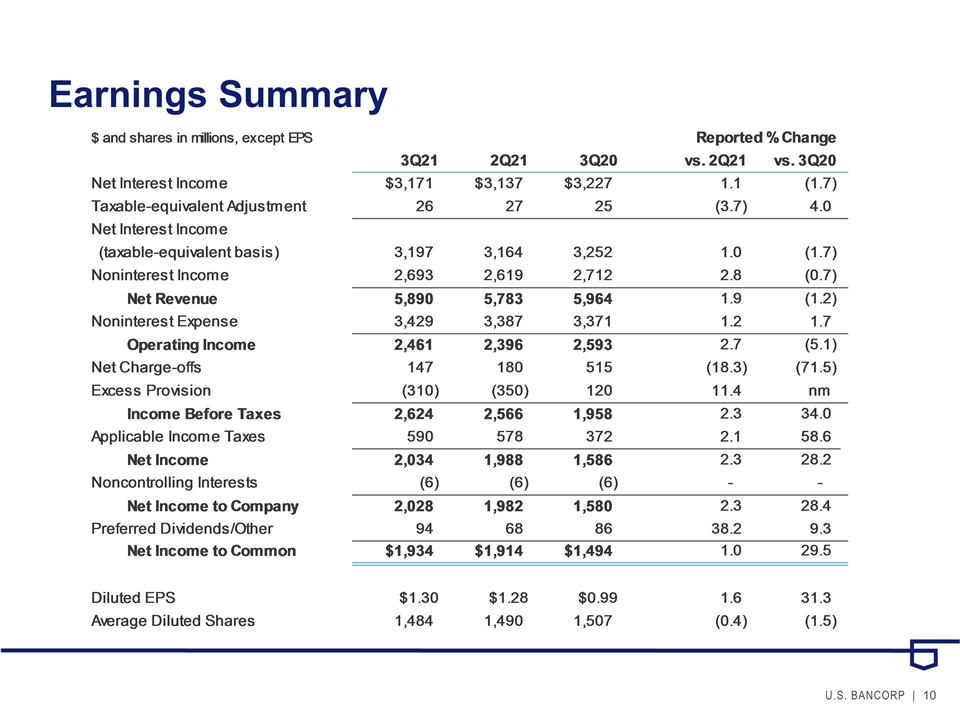
Earnings Summary
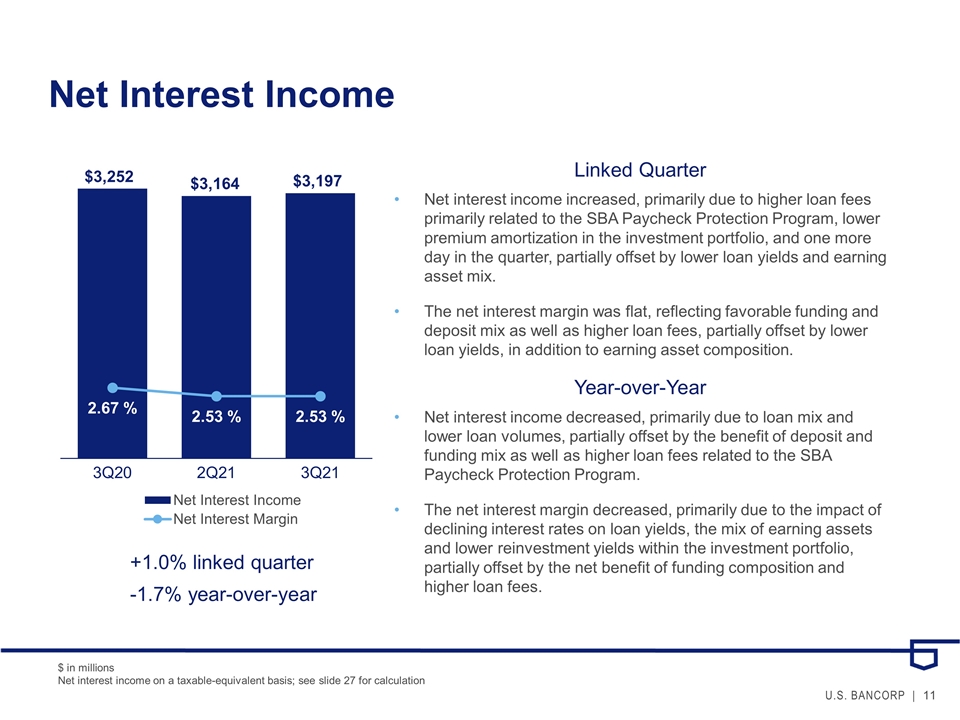
Net Interest Income Linked Quarter Net interest income increased, primarily due to higher loan fees primarily related to the SBA Paycheck Protection Program, lower premium amortization in the investment portfolio, and one more day in the quarter, partially offset by lower loan yields and earning asset mix. The net interest margin was flat, reflecting favorable funding and deposit mix as well as higher loan fees, partially offset by lower loan yields, in addition to earning asset composition. Year-over-Year Net interest income decreased, primarily due to loan mix and lower loan volumes, partially offset by the benefit of deposit and funding mix as well as higher loan fees related to the SBA Paycheck Protection Program. The net interest margin decreased, primarily due to the impact of declining interest rates on loan yields, the mix of earning assets and lower reinvestment yields within the investment portfolio, partially offset by the net benefit of funding composition and higher loan fees. +1.0% linked quarter -1.7% year-over-year $ in millions Net interest income on a taxable-equivalent basis; see slide 27 for calculation
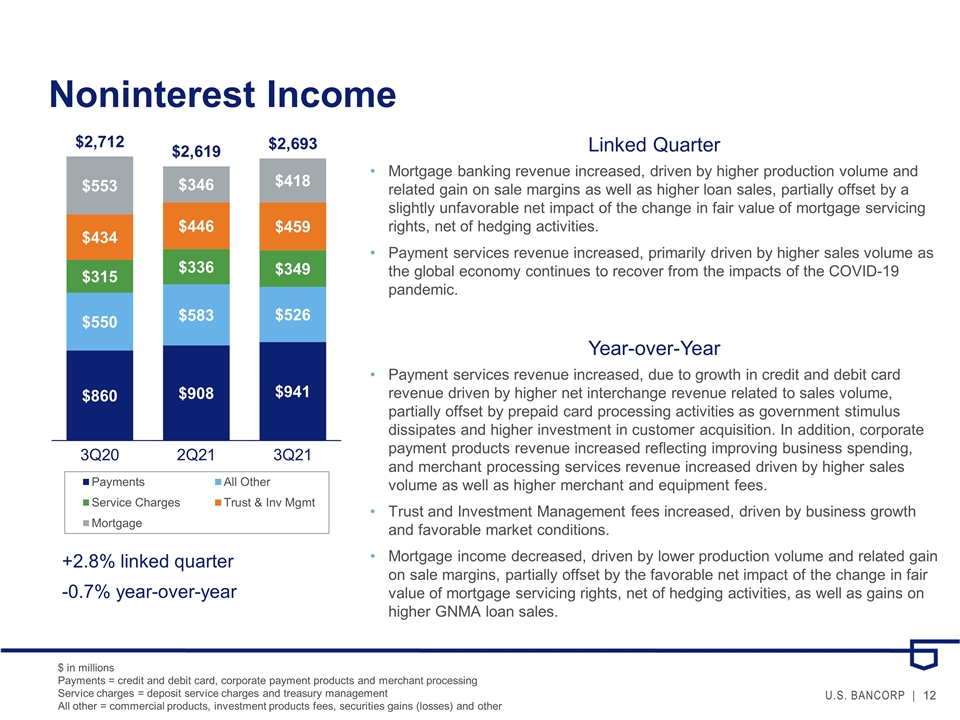
Noninterest Income +2.8% linked quarter -0.7% year-over-year Linked Quarter Mortgage banking revenue increased, driven by higher production volume and related gain on sale margins as well as higher loan sales, partially offset by a slightly unfavorable net impact of the change in fair value of mortgage servicing rights, net of hedging activities. Payment services revenue increased, primarily driven by higher sales volume as the global economy continues to recover from the impacts of the COVID-19 pandemic. Year-over-Year Payment services revenue increased, due to growth in credit and debit card revenue driven by higher net interchange revenue related to sales volume, partially offset by prepaid card processing activities as government stimulus dissipates and higher investment in customer acquisition. In addition, corporate payment products revenue increased reflecting improving business spending, and merchant processing services revenue increased driven by higher sales volume as well as higher merchant and equipment fees. Trust and Investment Management fees increased, driven by business growth and favorable market conditions. Mortgage income decreased, driven by lower production volume and related gain on sale margins, partially offset by the favorable net impact of the change in fair value of mortgage servicing rights, net of hedging activities, as well as gains on higher GNMA loan sales. $ in millions Payments = credit and debit card, corporate payment products and merchant processing Service charges = deposit service charges and treasury management All other = commercial products, investment products fees, securities gains (losses) and other
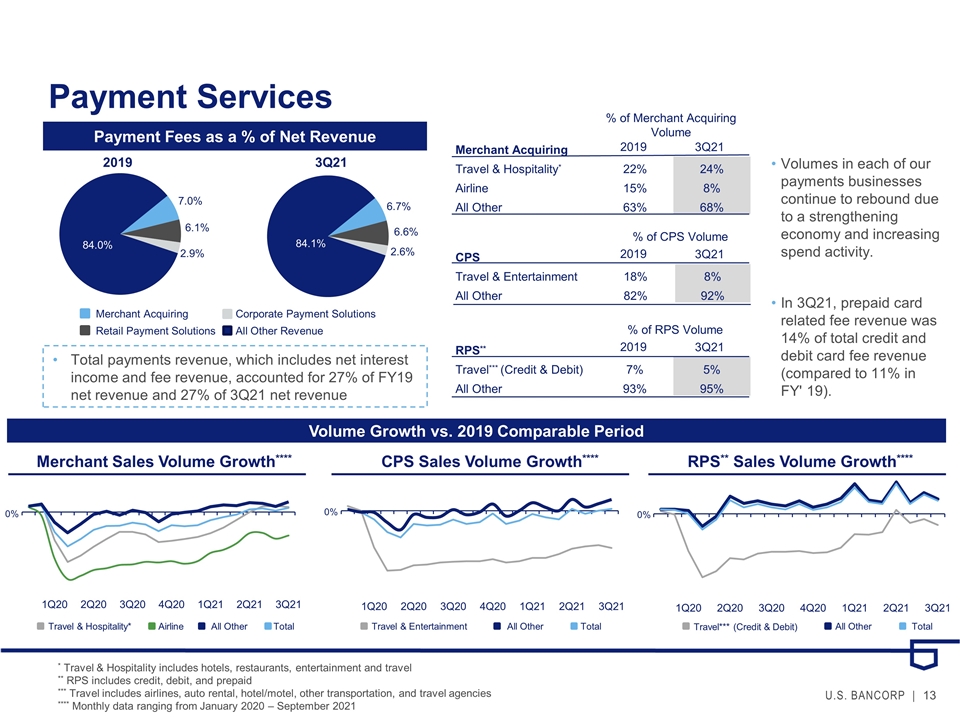
Payment Services Payment Fees as a % of Net Revenue 2019 3Q21 Merchant Acquiring Retail Payment Solutions Corporate Payment Solutions All Other Revenue Total payments revenue, which includes net interest income and fee revenue, accounted for 27% of FY19 net revenue and 27% of 3Q21 net revenue Merchant Acquiring Travel & Hospitality* 22% 24% Airline 15% 8% All Other 63% 68% CPS Travel & Entertainment 18% 8% All Other 82% 92% RPS** Travel*** (Credit & Debit) 7% 5% All Other 93% 95% % of Merchant Acquiring Volume 2019 3Q21 % of CPS Volume 2019 3Q21 % of RPS Volume 2019 3Q21 * Travel & Hospitality includes hotels, restaurants, entertainment and travel ** RPS includes credit, debit, and prepaid *** Travel includes airlines, auto rental, hotel/motel, other transportation, and travel agencies **** Monthly data ranging from January 2020 – September 2021 Merchant Sales Volume Growth**** 0% CPS Sales Volume Growth**** 0% RPS** Sales Volume Growth**** 0% Travel & Hospitality* All Other Total Airline Travel & Entertainment Total All Other Travel*** (Credit & Debit) All Other Total Volume Growth vs. 2019 Comparable Period Volumes in each of our payments businesses continue to rebound due to a strengthening economy and increasing spend activity. In 3Q21, prepaid card related fee revenue was 14% of total credit and debit card fee revenue (compared to 11% in FY' 19).
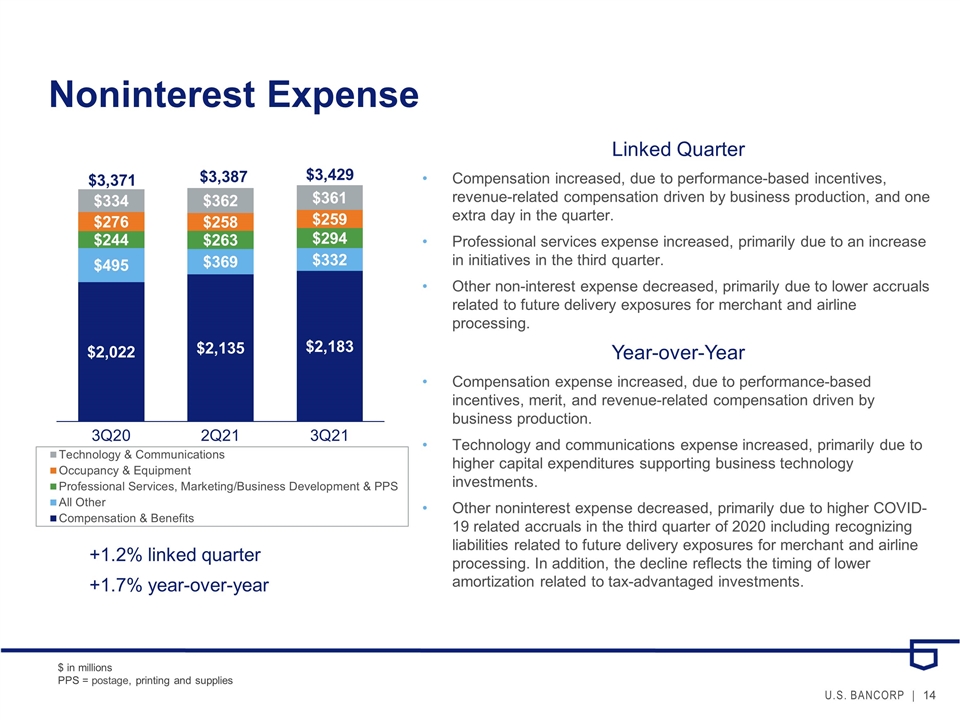
Noninterest Expense +1.2% linked quarter +1.7% year-over-year Linked Quarter Compensation increased, due to performance-based incentives, revenue-related compensation driven by business production, and one extra day in the quarter. Professional services expense increased, primarily due to an increase in initiatives in the third quarter. Other non-interest expense decreased, primarily due to lower accruals related to future delivery exposures for merchant and airline processing. Year-over-Year Compensation expense increased, due to performance-based incentives, merit, and revenue-related compensation driven by business production. Technology and communications expense increased, primarily due to higher capital expenditures supporting business technology investments. Other noninterest expense decreased, primarily due to higher COVID-19 related accruals in the third quarter of 2020 including recognizing liabilities related to future delivery exposures for merchant and airline processing. In addition, the decline reflects the timing of lower amortization related to tax-advantaged investments. $ in millions PPS = postage, printing and supplies
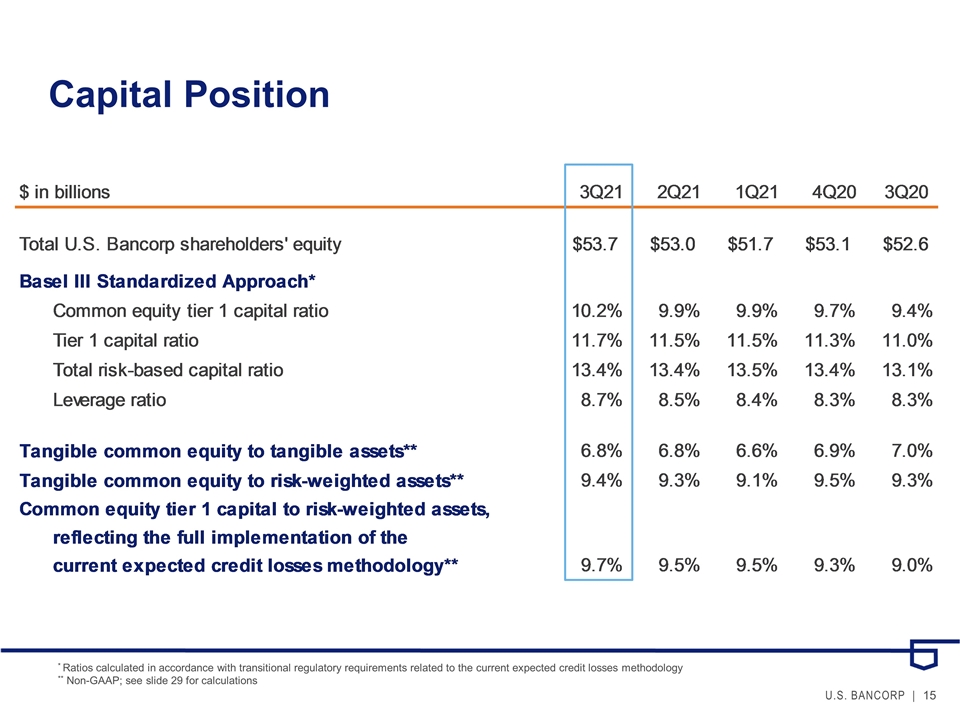
Capital Position * Ratios calculated in accordance with transitional regulatory requirements related to the current expected credit losses methodology ** Non-GAAP; see slide 29 for calculations
Appendix

Average Loans vs. 3Q20 Average total loans decreased by $14.3 billion, or 4.6% Average other retail loans increased $3.2 billion, or 5.7% Average commercial loans decreased by $13.7 billion, or 11.8% Average commercial real estate loans decreased by $2.0 billion, or 4.9% vs. 2Q21 Average total loans increased by $2.5 billion, or 0.8% Average other retail loans increased by $1.7 billion, or 2.9% Average residential mortgage loans increased by $0.8 billion, or 1.0% Average commercial loans decreased by $1.1 billion, or 1.1% Key Points Year-over-Year Growth 6.4% 2.5% (1.2%) (7.5%) (4.6%) Commercial CRE Res Mtg Retail Credit Card Average Loans ($bn)
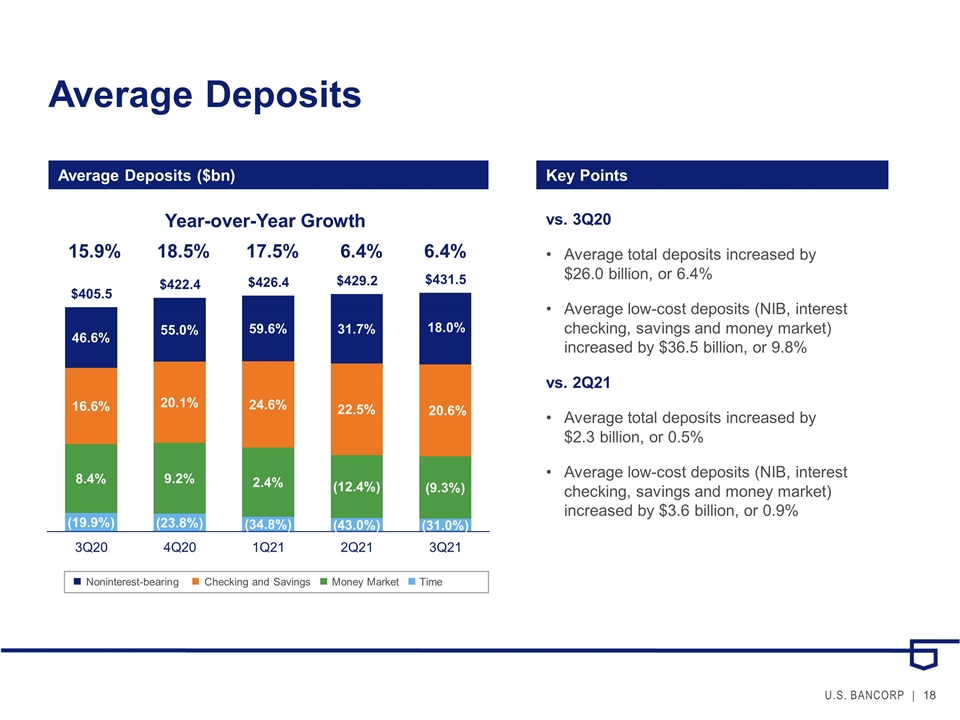
Year-over-Year Growth 15.9% 18.5% 17.5% 6.4% 6.4% Time Money Market Checking and Savings Noninterest-bearing Average Deposits Key Points Average Deposits ($bn) vs. 3Q20 Average total deposits increased by $26.0 billion, or 6.4% Average low-cost deposits (NIB, interest checking, savings and money market) increased by $36.5 billion, or 9.8% vs. 2Q21 Average total deposits increased by $2.3 billion, or 0.5% Average low-cost deposits (NIB, interest checking, savings and money market) increased by $3.6 billion, or 0.9%
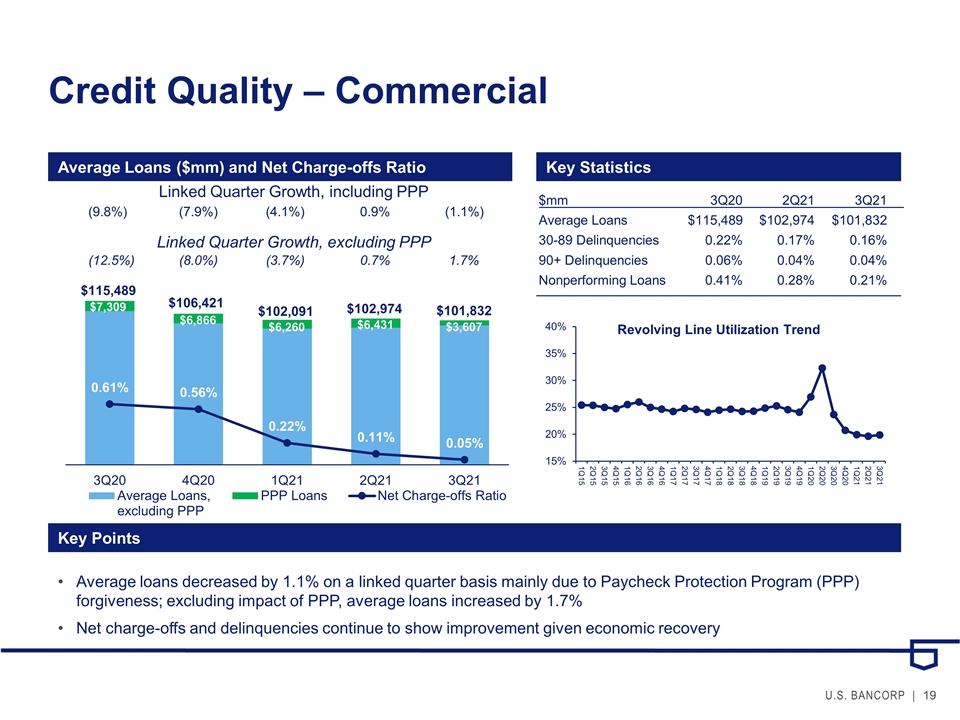
Credit Quality – Commercial Average Loans ($mm) and Net Charge-offs Ratio Key Statistics Key Points $mm3Q20 2Q21 3Q21 Average Loans$115,489 $102,974 $101,832 30-89 Delinquencies0.22% 0.17% 0.16% 90+ Delinquencies0.06% 0.04% 0.04% Nonperforming Loans0.41% 0.28% 0.21% Linked Quarter Growth, including PPP (9.8%) (7.9%) (4.1%) 0.9% (1.1%) Average loans decreased by 1.1% on a linked quarter basis mainly due to Paycheck Protection Program (PPP) forgiveness; excluding impact of PPP, average loans increased by 1.7% Net charge-offs and delinquencies continue to show improvement given economic recovery $115,489 $106,421 $102,091 $102,974 $101,832 Linked Quarter Growth, excluding PPP (12.5%) (8.0%) (3.7%) 0.7% 1.7%

A&D Const $144 Multi-family $3,674 Retail $199 Residential Construction $2,237 Office $1,099 Other $2,970 Residential Land $518 $mm3Q20 2Q21 3Q21 Average Loans$40,929 $38,564 $38,921 30-89 Delinquencies0.23% 0.08%0.08% 90+ Delinquencies- %0.01%0.05% Nonperforming Loans0.82% 0.80% 0.76% Credit Quality – Commercial Real Estate Average Loans ($mm) and Net Charge-offs Ratio Key Statistics Key Points Linked Quarter Growth (0.4%) (2.0%) (3.3%) (0.6%) 0.9% Average loans increased by 0.9% on a linked quarter basis Low net charge-offs reflect general economic recovery, partially offset by continued stress in certain COVID impacted sectors
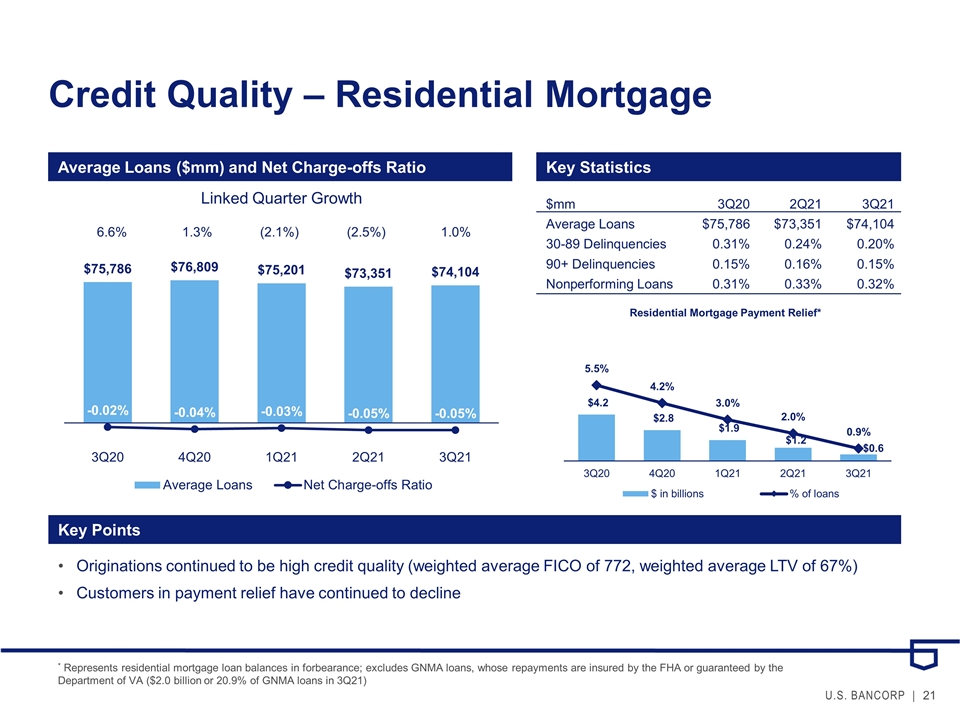
Credit Quality – Residential Mortgage Average Loans ($mm) and Net Charge-offs Ratio Key Statistics Key Points $mm3Q202Q213Q21 Average Loans$75,786 $73,351 $74,104 30-89 Delinquencies0.31%0.24%0.20% 90+ Delinquencies0.15% 0.16% 0.15% Nonperforming Loans0.31%0.33%0.32% Linked Quarter Growth 6.6% 1.3% (2.1%) (2.5%) 1.0% Originations continued to be high credit quality (weighted average FICO of 772, weighted average LTV of 67%) Customers in payment relief have continued to decline * Represents residential mortgage loan balances in forbearance; excludes GNMA loans, whose repayments are insured by the FHA or guaranteed by the Department of VA ($2.0 billion or 20.9% of GNMA loans in 3Q21)
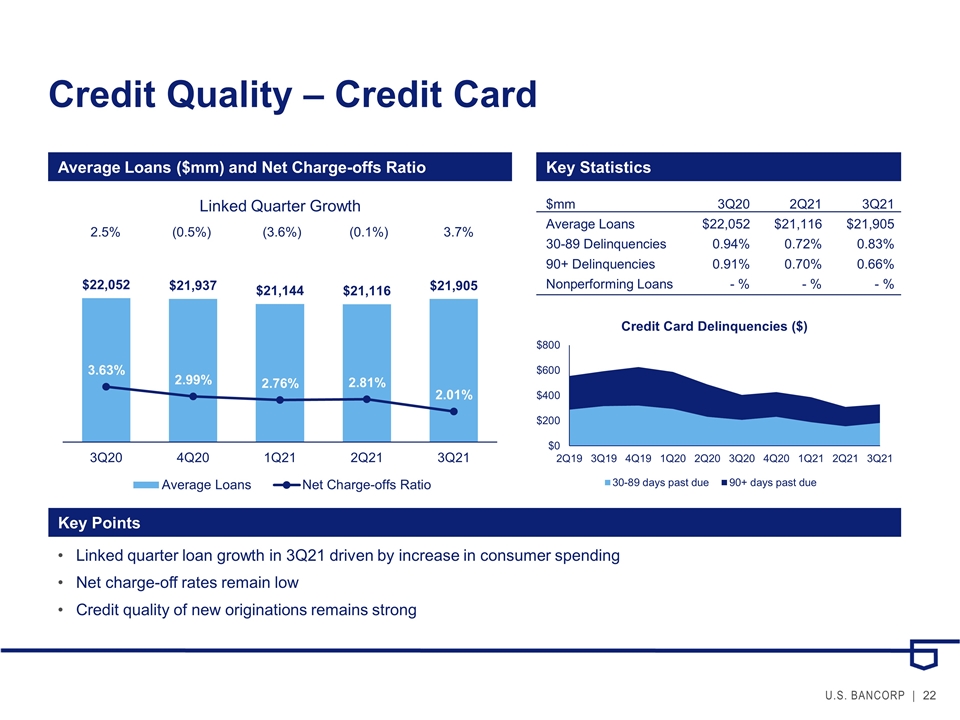
Credit Quality – Credit Card Average Loans ($mm) and Net Charge-offs Ratio Key Statistics Key Points $mm3Q202Q213Q21 Average Loans$22,052 $21,116$21,905 30-89 Delinquencies0.94% 0.72%0.83% 90+ Delinquencies0.91%0.70%0.66% Nonperforming Loans- %- %- % Linked Quarter Growth 2.5% (0.5%) (3.6%) (0.1%) 3.7% Linked quarter loan growth in 3Q21 driven by increase in consumer spending Net charge-off rates remain low Credit quality of new originations remains strong
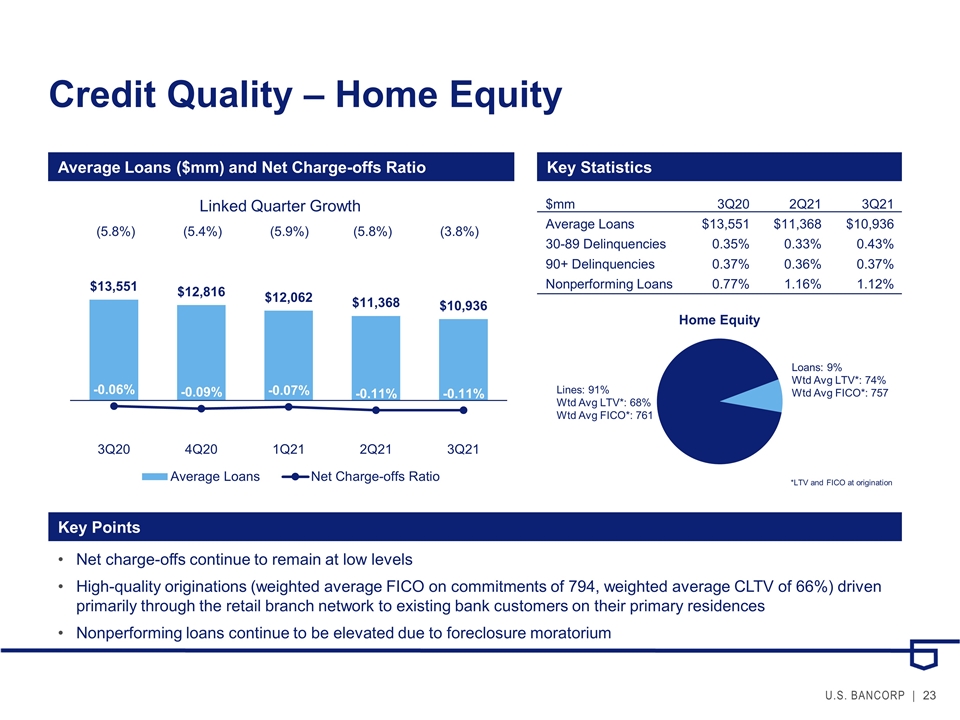
Credit Quality – Home Equity Average Loans ($mm) and Net Charge-offs Ratio Key Points Linked Quarter Growth (5.8%) (5.4%) (5.9%) (5.8%) (3.8%) Key Statistics Key Statistics $mm3Q202Q213Q21 Average Loans$13,551 $11,368 $10,936 30-89 Delinquencies0.35%0.33%0.43% 90+ Delinquencies0.37%0.36%0.37% Nonperforming Loans0.77%1.16%1.12% Loans: 9% Wtd Avg LTV*: 74% Wtd Avg FICO*: 757 Lines: 91% Wtd Avg LTV*: 68% Wtd Avg FICO*: 761 *LTV and FICO at origination Net charge-offs continue to remain at low levels High-quality originations (weighted average FICO on commitments of 794, weighted average CLTV of 66%) driven primarily through the retail branch network to existing bank customers on their primary residences Nonperforming loans continue to be elevated due to foreclosure moratorium
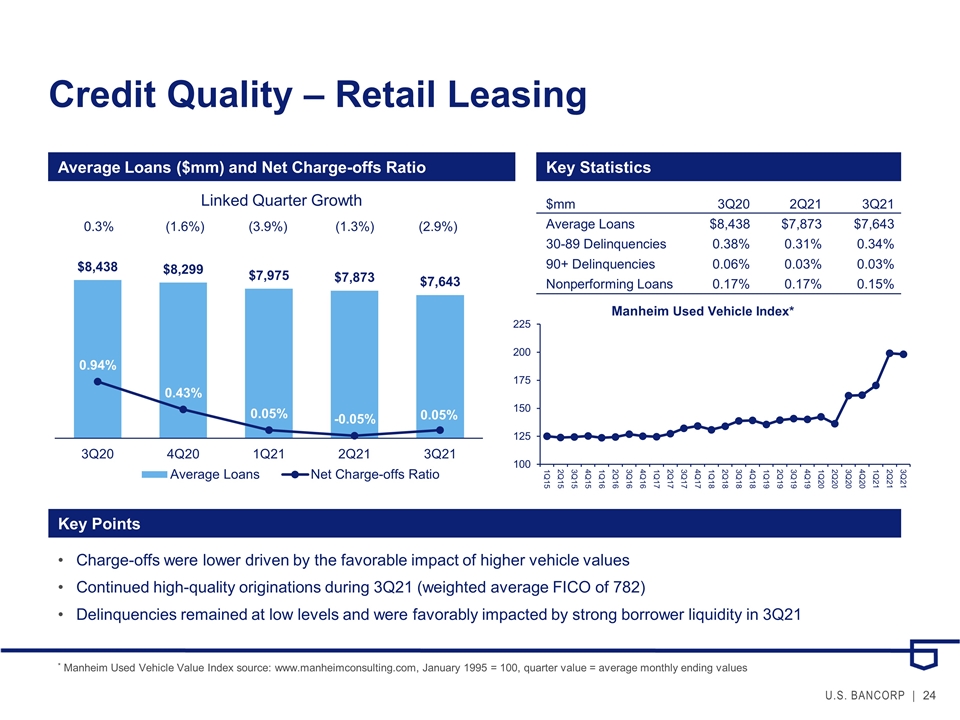
Credit Quality – Retail Leasing Average Loans ($mm) and Net Charge-offs Ratio Key Statistics Key Points $mm3Q202Q213Q21 Average Loans$8,438 $7,873 $7,643 30-89 Delinquencies0.38%0.31%0.34% 90+ Delinquencies0.06%0.03%0.03% Nonperforming Loans0.17%0.17%0.15% Linked Quarter Growth 0.3% (1.6%) (3.9%) (1.3%) (2.9%) Charge-offs were lower driven by the favorable impact of higher vehicle values Continued high-quality originations during 3Q21 (weighted average FICO of 782) Delinquencies remained at low levels and were favorably impacted by strong borrower liquidity in 3Q21 * Manheim Used Vehicle Value Index source: www.manheimconsulting.com, January 1995 = 100, quarter value = average monthly ending values
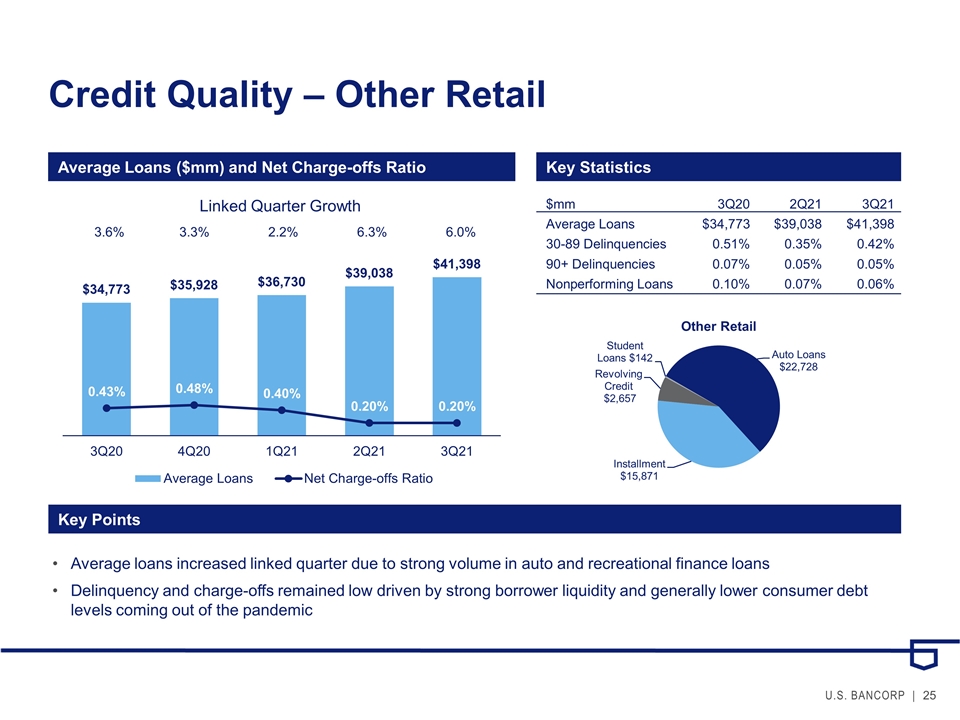
Credit Quality – Other Retail Average Loans ($mm) and Net Charge-offs Ratio Key Statistics Key Points $mm3Q202Q213Q21 Average Loans$34,773 $39,038 $41,398 30-89 Delinquencies0.51%0.35%0.42% 90+ Delinquencies0.07%0.05%0.05% Nonperforming Loans0.10%0.07%0.06% Linked Quarter Growth 3.6% 3.3% 2.2% 6.3% 6.0% Average loans increased linked quarter due to strong volume in auto and recreational finance loans Delinquency and charge-offs remained low driven by strong borrower liquidity and generally lower consumer debt levels coming out of the pandemic
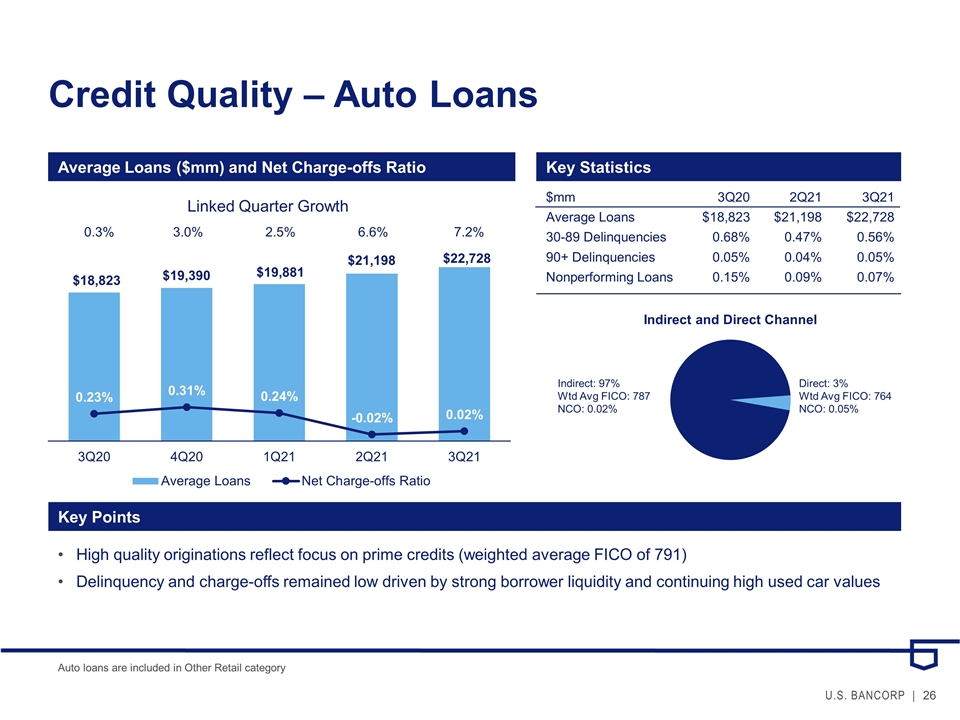
Credit Quality – Auto Loans Average Loans ($mm) and Net Charge-offs Ratio Key Statistics Key Points $mm3Q202Q213Q21 Average Loans$18,823 $21,198 $22,728 30-89 Delinquencies0.68%0.47%0.56% 90+ Delinquencies0.05%0.04%0.05% Nonperforming Loans0.15%0.09%0.07% Direct: 3% Wtd Avg FICO: 764 NCO: 0.05% Indirect: 97% Wtd Avg FICO: 787 NCO: 0.02% Linked Quarter Growth 0.3% 3.0% 2.5% 6.6% 7.2% High quality originations reflect focus on prime credits (weighted average FICO of 791) Delinquency and charge-offs remained low driven by strong borrower liquidity and continuing high used car values Auto loans are included in Other Retail category
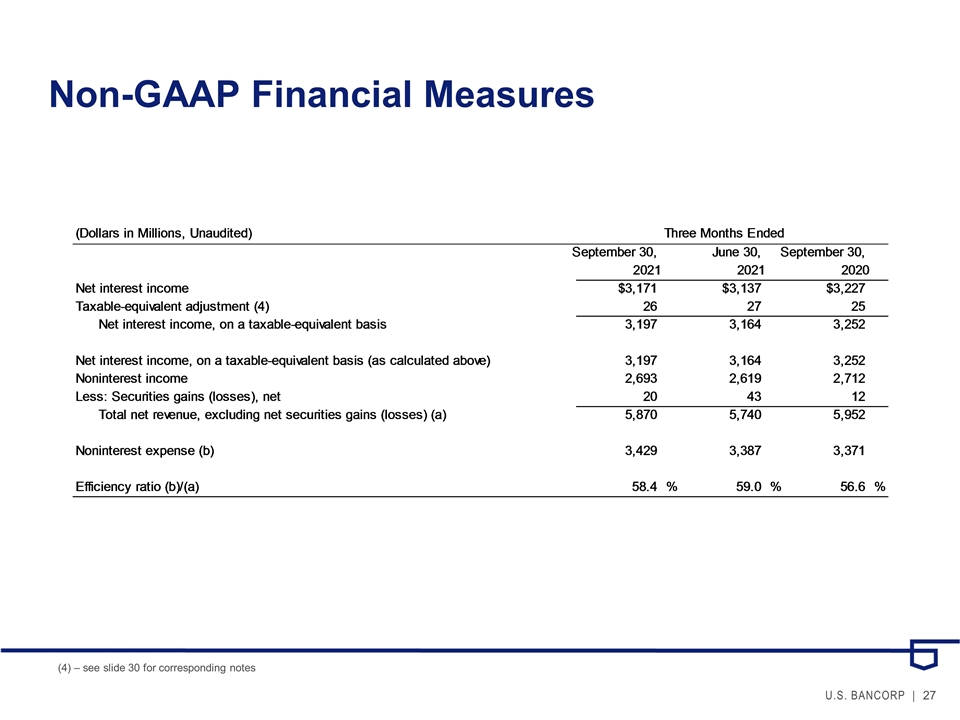
Non-GAAP Financial Measures (4) – see slide 30 for corresponding notes
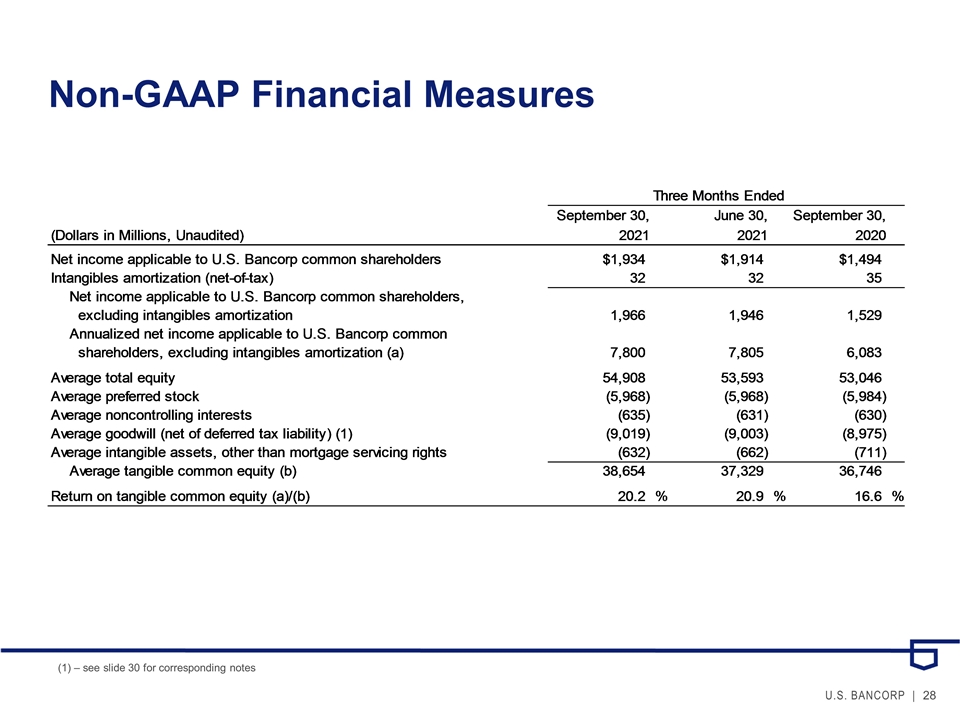
Non-GAAP Financial Measures (1) – see slide 30 for corresponding notes
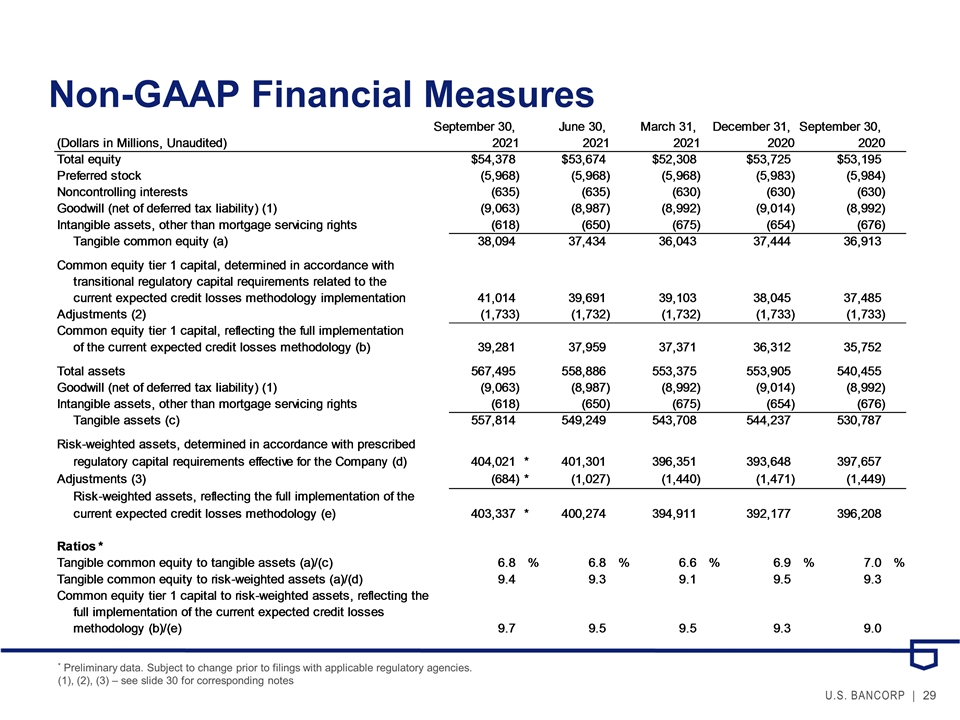
Non-GAAP Financial Measures * Preliminary data. Subject to change prior to filings with applicable regulatory agencies. (1), (2), (3) – see slide 30 for corresponding notes
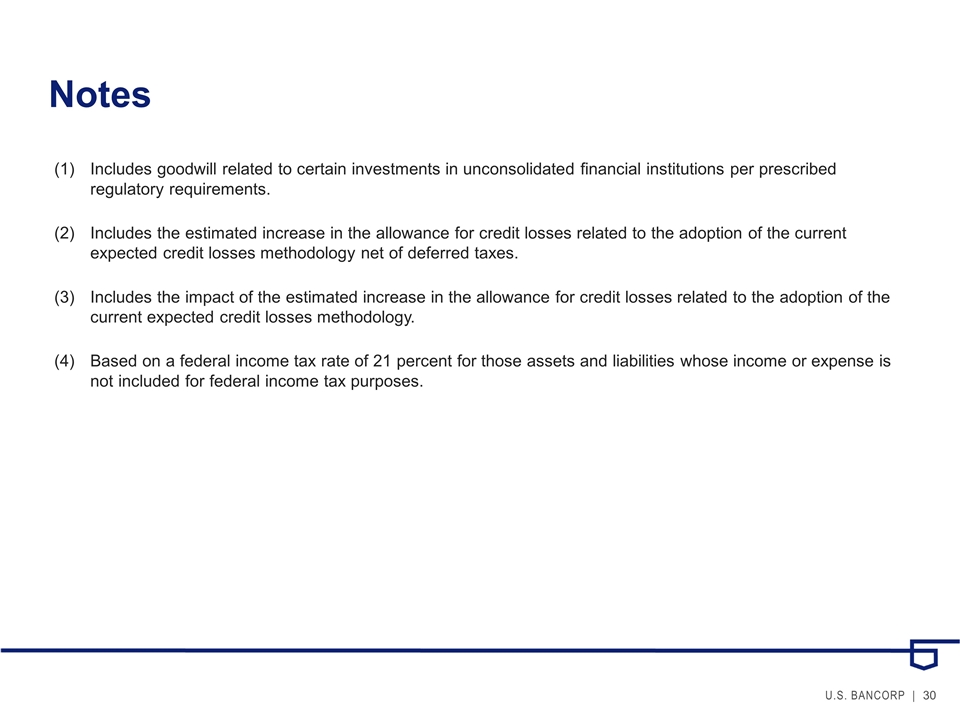
Notes Includes goodwill related to certain investments in unconsolidated financial institutions per prescribed regulatory requirements. Includes the estimated increase in the allowance for credit losses related to the adoption of the current expected credit losses methodology net of deferred taxes. Includes the impact of the estimated increase in the allowance for credit losses related to the adoption of the current expected credit losses methodology. Based on a federal income tax rate of 21 percent for those assets and liabilities whose income or expense is not included for federal income tax purposes.

U.S. Bancorp 3Q21 Earnings Conference Call October 14, 2021