
WTFC 8-K
Wintrust Financial Corp (WTFC)
8-K
2022-10-18
For: 2022-10-18
View Original
Added on
April 06, 2026
UNITED STATES
SECURITIES AND EXCHANGE COMMISSION
Washington, D.C. 20549
FORM 8-K
Current Report
Pursuant to Section 13 or 15(d) of The
Securities Exchange Act of 1934
Date of Report (Date of earliest event reported): October 18, 2022
WINTRUST FINANCIAL CORPORATION
(Exact name of registrant as specified in its charter)
| Illinois | 001-35077 | 36-3873352 | ||||||||||||||||||
| (State or other jurisdiction of Incorporation) | (Commission File Number) | (I.R.S. Employer Identification No.) | ||||||||||||||||||
| 9700 W. Higgins Road, Suite 800 | Rosemont | Illinois | 60018 | |||||||||||||||||
| (Address of principal executive offices) | (Zip Code) | |||||||||||||||||||
Registrant’s telephone number, including area code (847) 939-9000
Not Applicable
(Former name or former address, if changed since last year)
Check the appropriate box below if the Form 8-K filing is intended to simultaneously satisfy the filing obligation of the registrant under any of the following provisions:
| ☐ | Written communications pursuant to Rule 425 under the Securities Act (17 CFR 230.425) | ||||
| ☐ | Soliciting material pursuant to Rule 14a-12 under the Exchange Act (17 CFR 240.14a-12) | ||||
| ☐ | Pre-commencement communications pursuant to Rule 14d-2(b) under the Exchange Act (17 CFR 240.14d-2(b)) | ||||
| ☐ | Pre-commencement communications pursuant to Rule 13e-4(c) under the Exchange Act (17 CFR 240.13e-4(c)) | ||||
| Title of Each Class | Ticker Symbol | Name of Each Exchange on Which Registered | ||||||
| Common Stock, no par value | WTFC | The NASDAQ Global Select Market | ||||||
| Fixed-to-Floating Rate Non-Cumulative Perpetual Preferred Stock, Series D, no par value | WTFCM | The NASDAQ Global Select Market | ||||||
Depositary Shares, Each Representing a 1/1,000th Interest in a Share of | WTFCP | The NASDAQ Global Select Market | ||||||
| 6.875% Fixed-Rate Reset Non-Cumulative Perpetual Preferred Stock, Series E, no par value | ||||||||
Indicate by check mark whether the registrant is an emerging growth company as defined in Rule 405 of the Securities Act of 1933 (§230.405 of this chapter) or Rule 12b-2 of the Securities Exchange Act of 1934 (§240.12b-2 of this chapter).
Emerging growth company ☐
If an emerging growth company, indicate by check mark if the registrant has elected not to use the extended transition period for complying with any new or revised financial accounting standards provided pursuant to Section 13(a) of the Exchange Act. ☐
Item 2.02. Results of Operations and Financial Condition
The information in this Current Report is being furnished and shall not be deemed “filed” for the purposes of Section 18 of the Securities Exchange Act of 1934, as amended, or otherwise subject to the liabilities of that Section. The information in this Current Report shall not be incorporated by reference into any registration statement or other document pursuant to the Securities Act of 1933, as amended.
On October 18, 2022, Wintrust Financial Corporation (the “Company”) announced earnings for the third quarter of 2022 and posted on its website the Third Quarter 2022 Earnings Release Presentation. Copies of the press release relating to the Company’s earnings results and the related presentation are attached hereto as Exhibit 99.1 and Exhibit 99.2, respectively. Certain supplemental information relating to non-GAAP financial measures reported in the attached press release and presentation is included on pages 34 through 36 of Exhibit 99.1 and pages 22 through 23 of Exhibit 99.2.
Item 9.01. Financial Statements and Exhibits
(d) Exhibits
| Exhibit | |||||
2
Signature
Pursuant to the requirements of the Securities Exchange Act of 1934, the registrant has duly caused this report to be signed on its behalf by the undersigned hereunto duly authorized.
| WINTRUST FINANCIAL CORPORATION (Registrant) | ||||||||
| By: | /s/ David L. Stoehr | |||||||
| David L. Stoehr Executive Vice President and Chief Financial Officer | ||||||||
Date: October 18, 2022
3
INDEX TO EXHIBITS
| Exhibit | |||||
4
Exhibit 99.1
Wintrust Financial Corporation
9700 W. Higgins Road, Suite 800, Rosemont, Illinois 60018
News Release
| FOR IMMEDIATE RELEASE | October 18, 2022 | |||||||
FOR MORE INFORMATION CONTACT:
Edward J. Wehmer, Founder & Chief Executive Officer
David A. Dykstra, Vice Chairman & Chief Operating Officer
(847) 939-9000
Web site address: www.wintrust.com
Wintrust Financial Corporation Reports Third Quarter 2022 Results
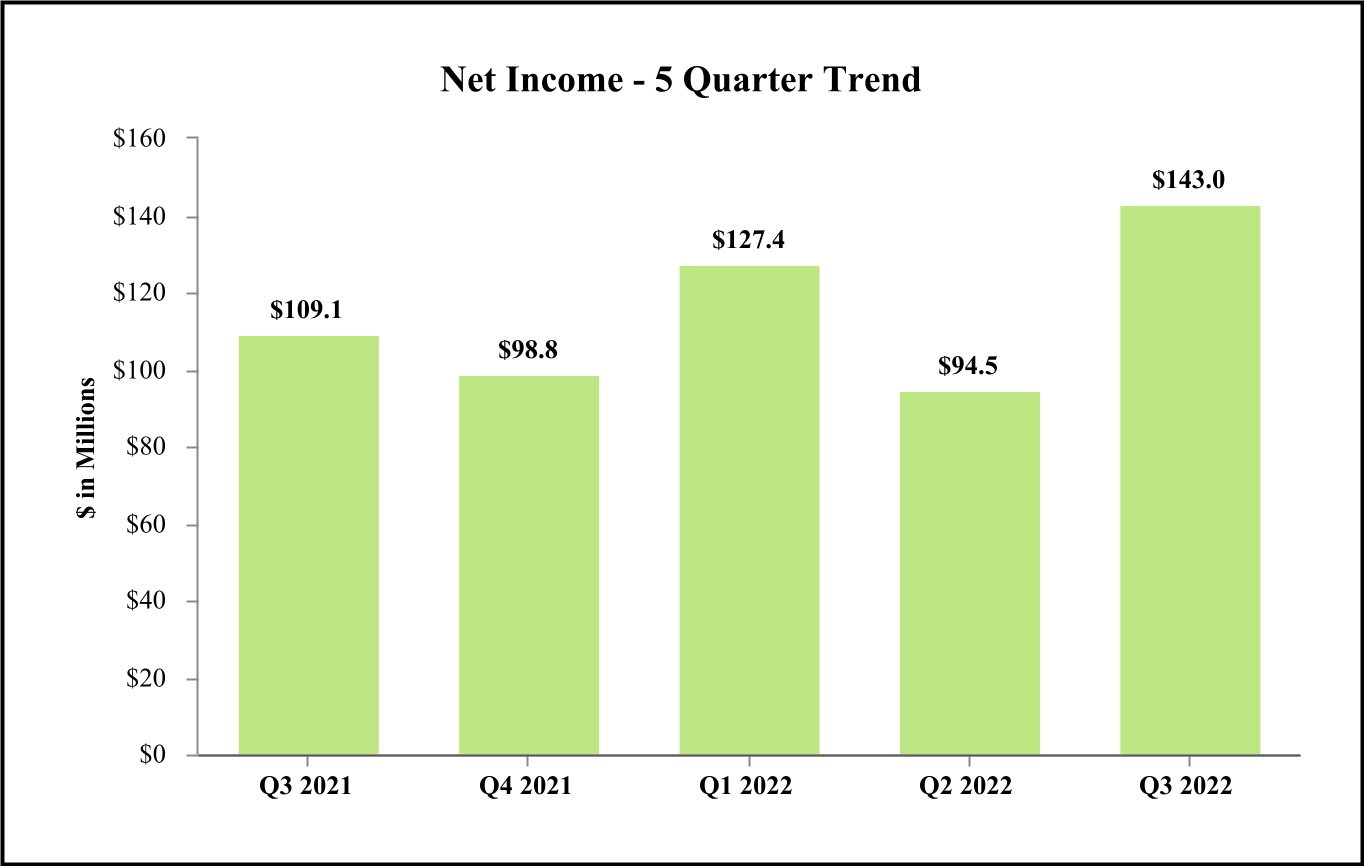
ROSEMONT, ILLINOIS – Wintrust Financial Corporation (“Wintrust”, “the Company”, “we” or “our”) (Nasdaq: WTFC) announced net income of $143.0 million or $2.21 per diluted common share for the third quarter of 2022, an increase in diluted earnings per common share of 48% compared to the second quarter of 2022. The Company recorded net income of $364.9 million or $5.78 per diluted common share for the first nine months of 2022 compared to net income of $367.4 million or $6.00 per diluted common share for the same period of 2021.
Edward J. Wehmer, Founder and Chief Executive Officer, commented, “I am very pleased with our third quarter results as we reported strong net income and record quarterly pre-tax, pre-provision income (non-GAAP). By design, we were able to benefit significantly from the recent rise in interest rates as net interest income and net interest margin showed substantial growth. We expect that momentum to continue as we remain asset sensitive to changes in interest rates. In addition, we added strong loan growth in the third quarter, which paired with margin expansion, is expected to drive meaningful revenue growth in future quarters."
Highlights of the Third Quarter of 2022:
Comparative information to the second quarter of 2022
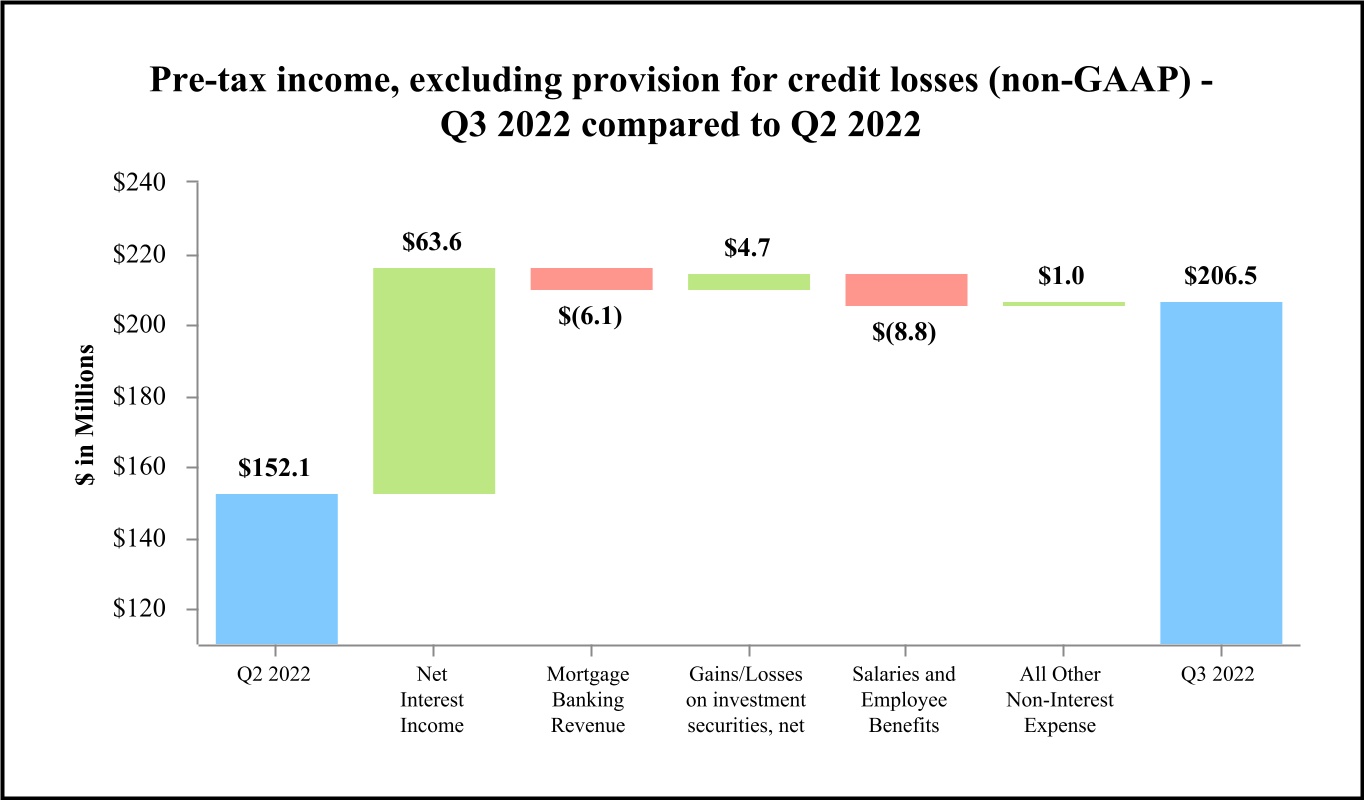
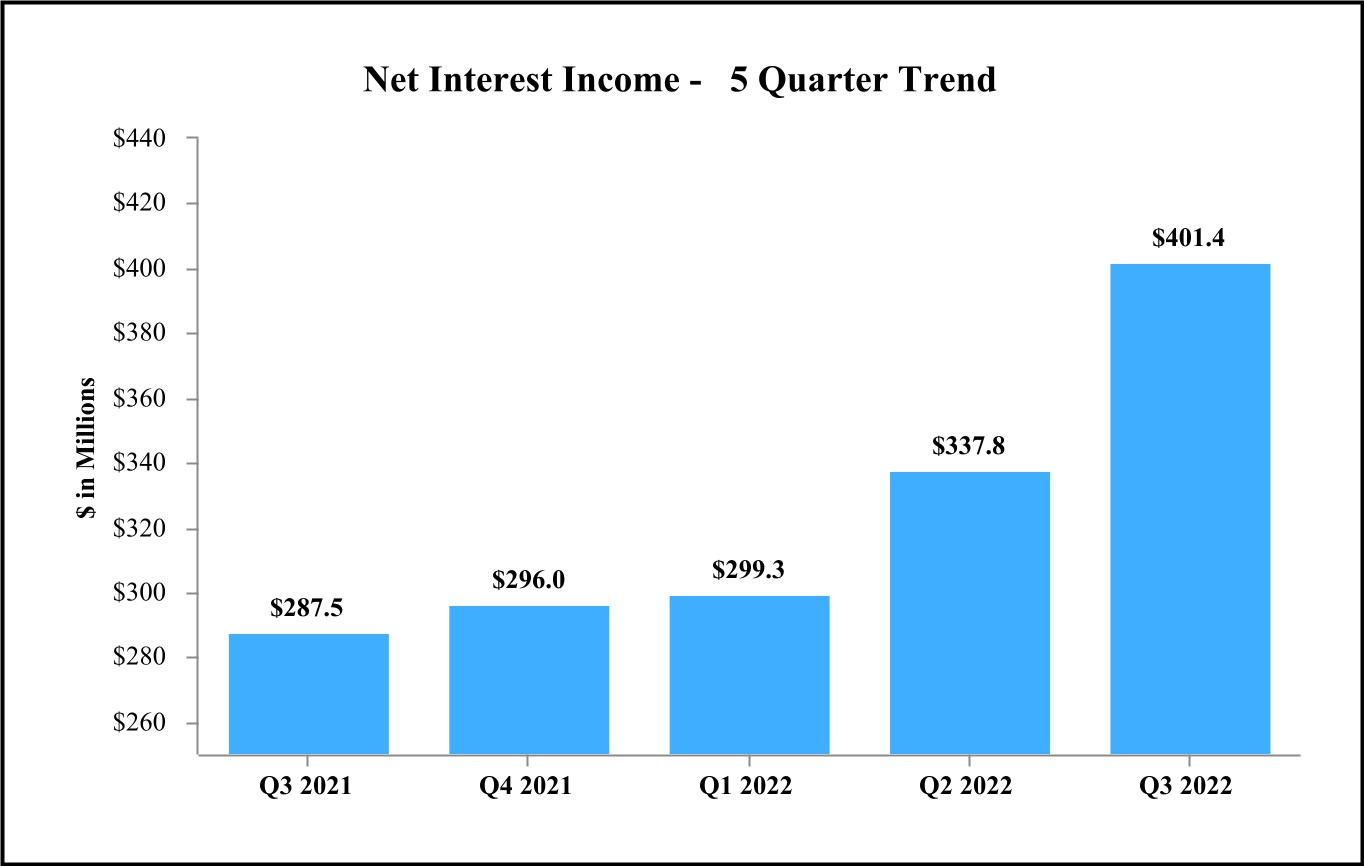
•Net interest income increased by $63.6 million or by 19% as compared to the second quarter of 2022 primarily due to improvement in net interest margin and loan growth.
◦Net interest margin increased by 42 basis points as the upward repricing of earning assets significantly outpaced increases in deposit costs.
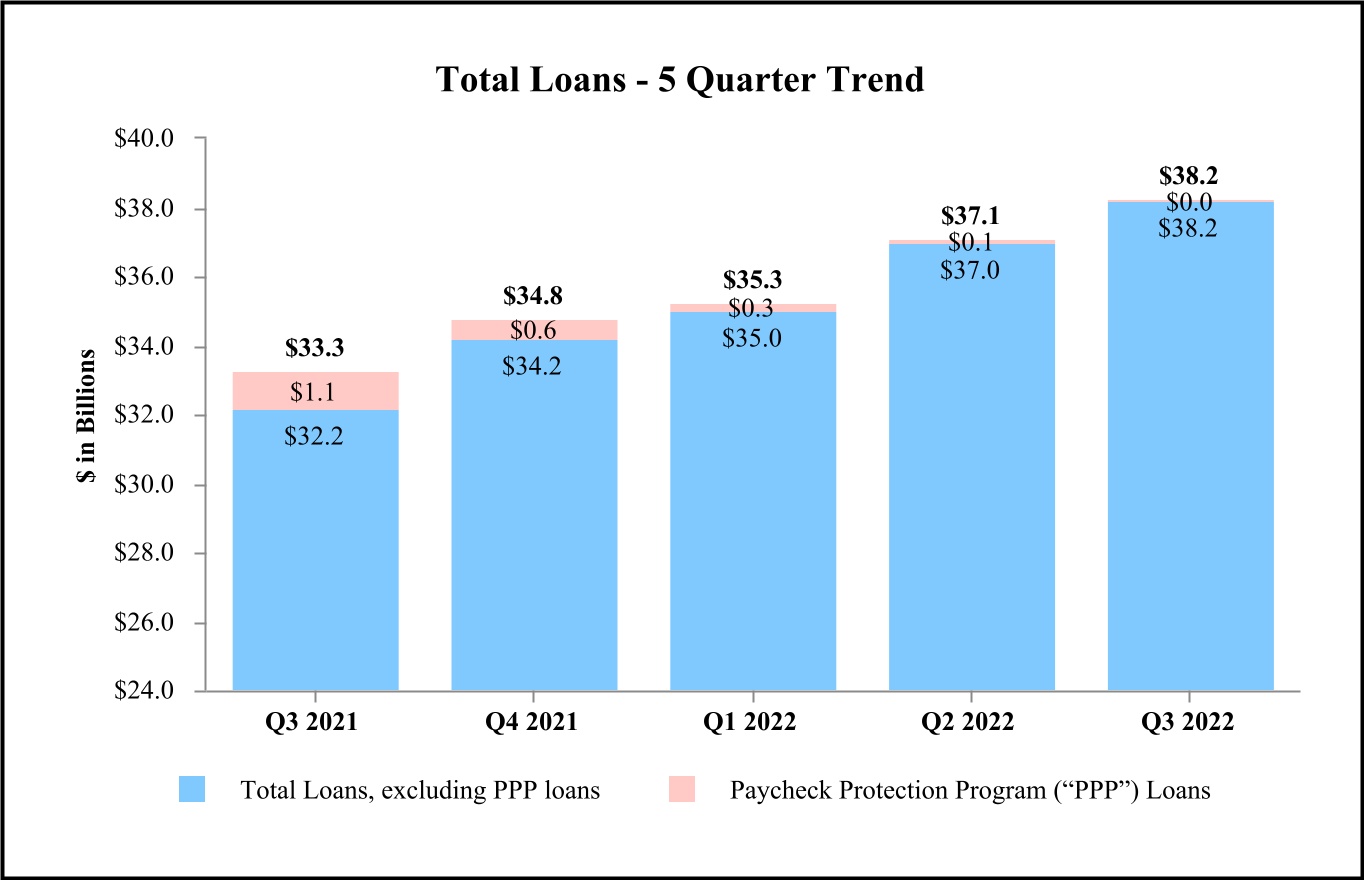
•Total loans increased by $1.1 billion, or 12% on an annualized basis. In addition, total loans as of September 30, 2022 were $736 million higher than average total loans in the third quarter of 2022 which is expected to benefit future quarters.
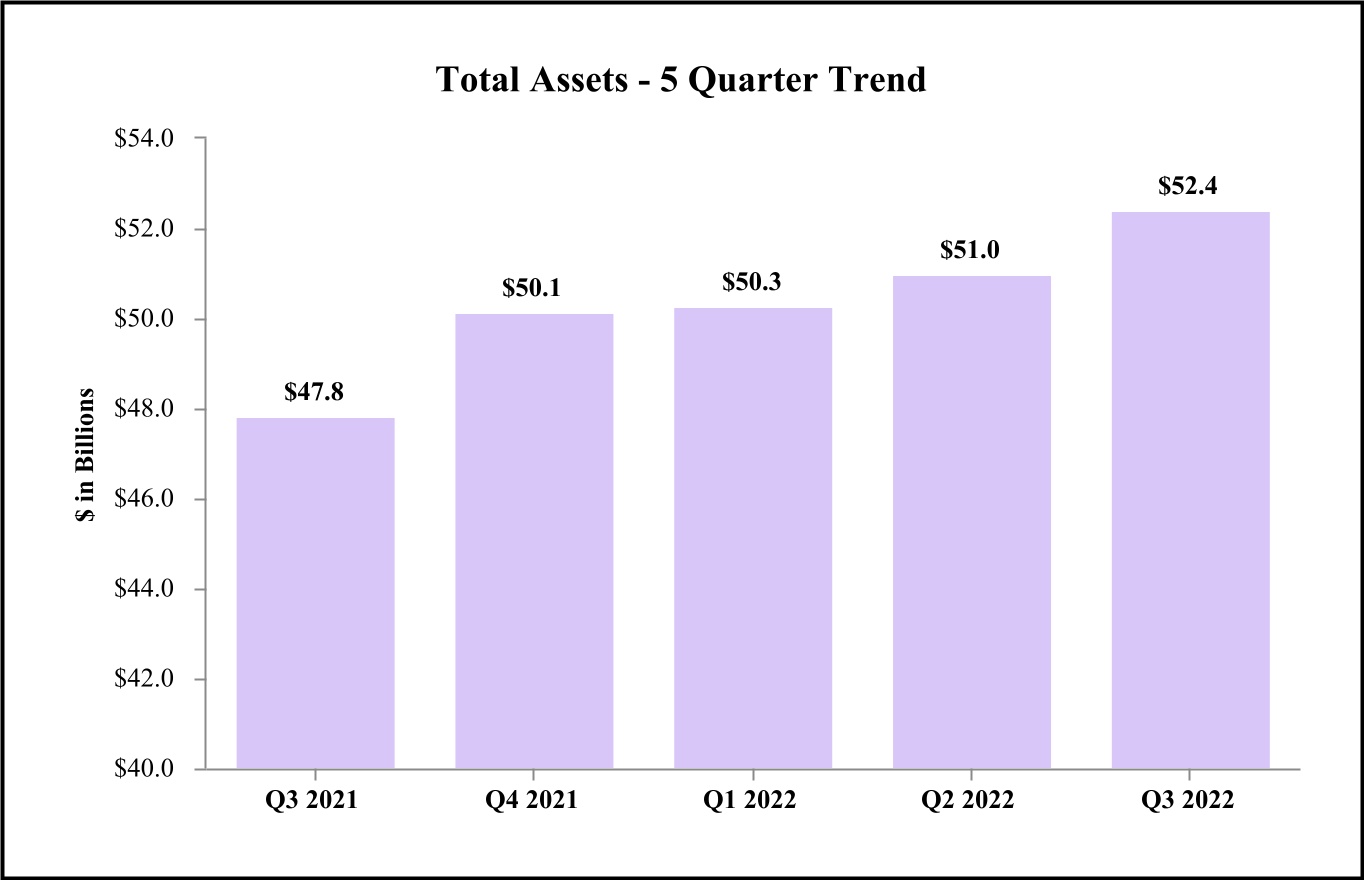
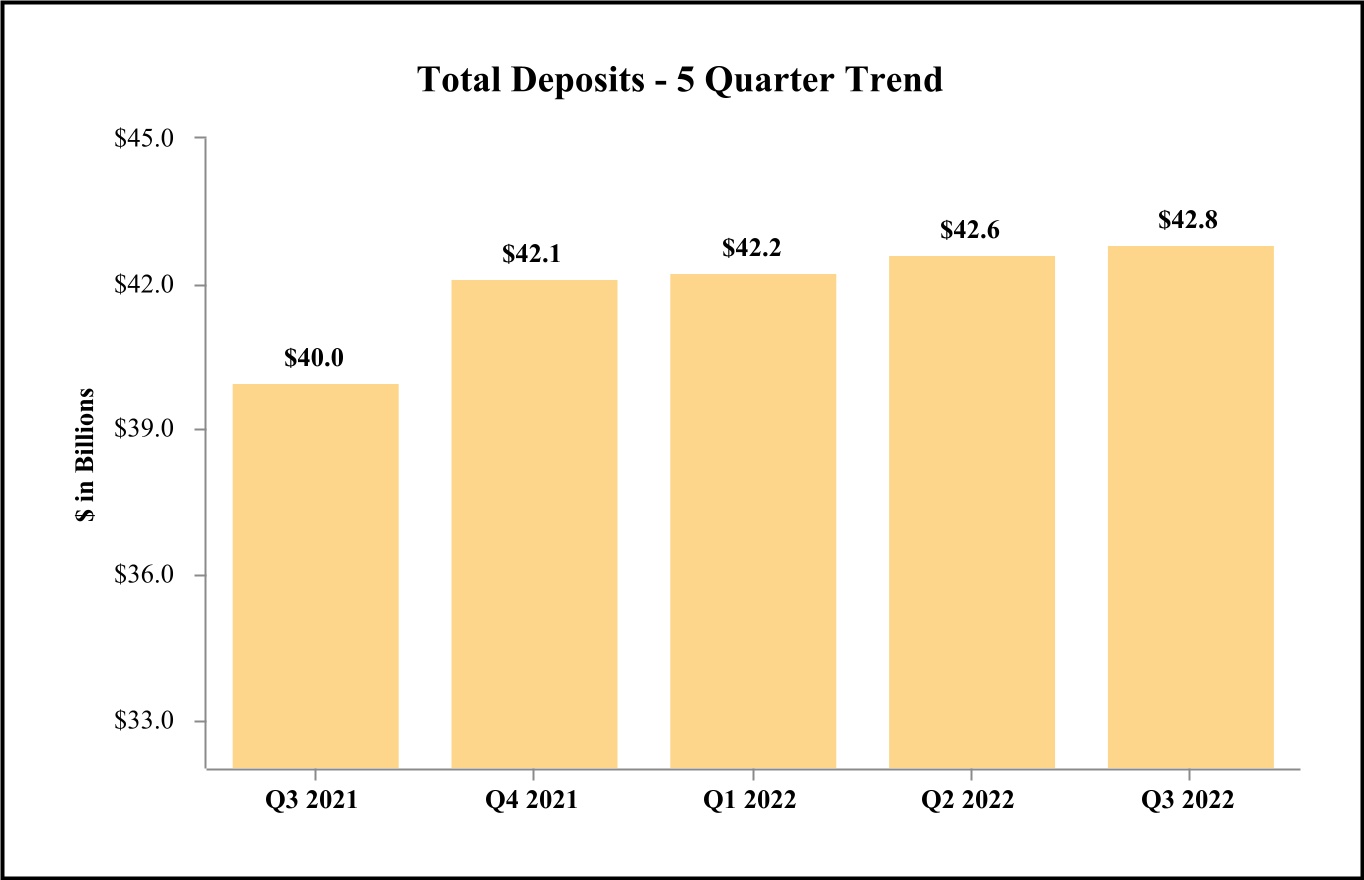
•Total assets increased by $1.4 billion totaling $52.4 billion as of September 30, 2022 and total deposits increased by $204 million.
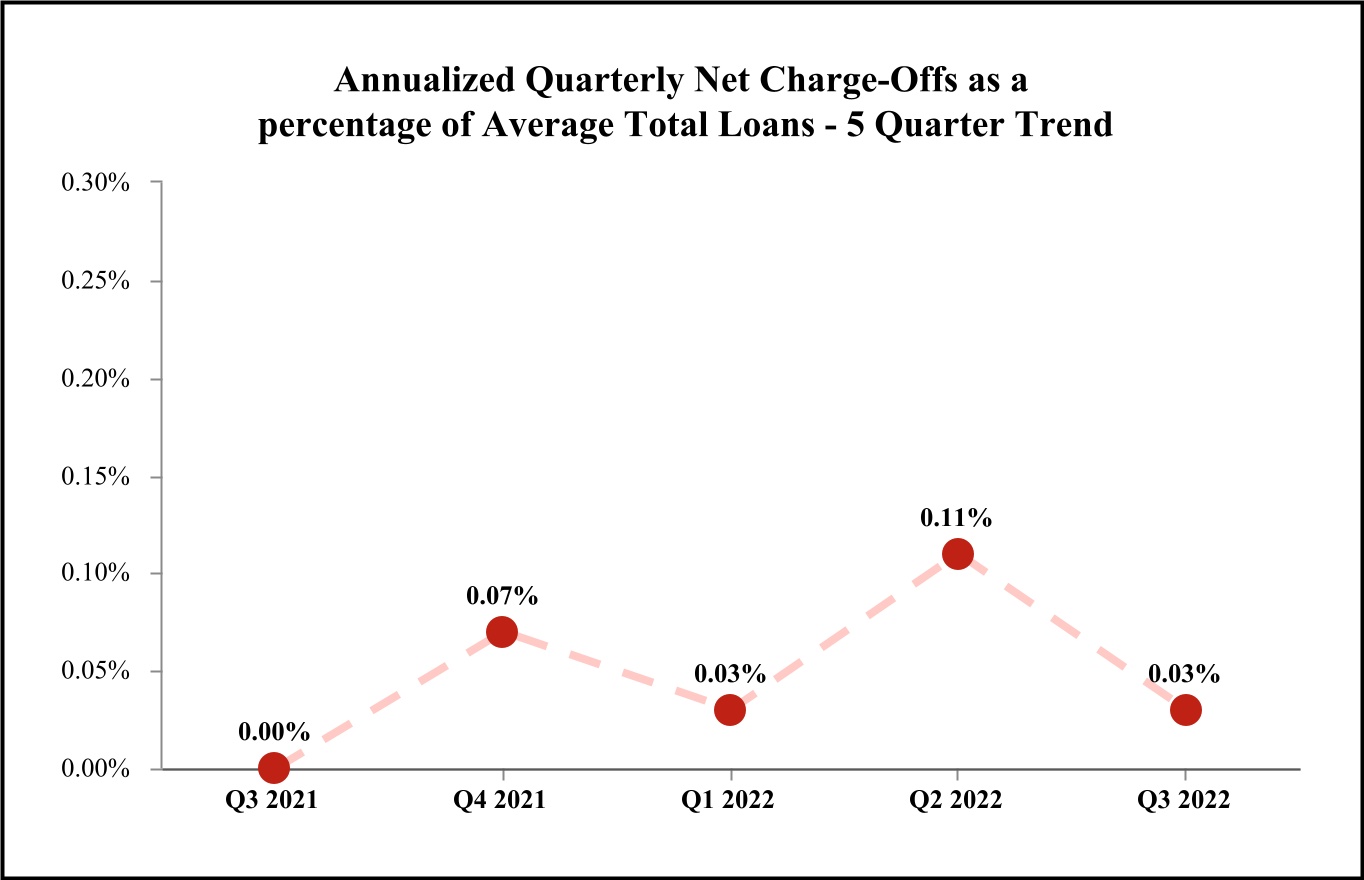
•Recorded a provision for credit losses of $6.4 million in the third quarter of 2022 primarily related to loan growth and $3.2 million of net charge-offs or three basis points of average total loans on an annualized basis.
•The allowance for credit losses on our core loan portfolio is approximately 1.26% of the outstanding balance as of September 30, 2022 down from 1.31% as of June 30, 2022. See Table 12 for more information.
•Non-performing loans remained low but increased to 0.26% of total loans, as of September 30, 2022, from 0.20% as of June 30, 2022. See “Asset Quality” section for more information.
•Mortgage banking revenue decreased to $27.2 million for the third quarter of 2022 as compared to $33.3 million in the second quarter of 2022, primarily due to lower production revenue as a result of declining mortgage origination volume in the current rising rate environment.
Other items of note from the Third Quarter of 2022
•The Company recorded net negative fair value adjustments of $2.5 million in the third quarter of 2022 related to fair value changes in certain mortgage assets, see “Non-Interest Income” section for more information.
•Net losses on investment securities totaled $3.1 million in the third quarter of 2022 related to changes in the value of equity securities as compared to net losses of $7.8 million in the second quarter of 2022.
•The effective tax rate increased as the Company recorded approximately $2.0 million of additional income tax expense related to earnings at its Canadian subsidiary. See “Income Taxes” section for more information.
Mr. Wehmer continued, "The Company experienced robust loan growth as loans increased by $1.1 billion, or 12% on an annualized basis, in the third quarter of 2022. Once again, the loan growth was spread across all of our material loan portfolios as we experienced growth in core commercial, commercial real estate, commercial insurance premium finance receivables and life insurance premium finance receivables. This is the sixth quarter in a row in which all of these portfolios individually increased in balance relative to the prior quarter end. We believe our diversified loan portfolio provides many levers for growth and we remain prudent in our review of credit prospects ensuring our loan growth stays within our conservative credit standards. In addition, in the third quarter we continued to grow unfunded loan commitments which we expect to drive funded loan growth in future quarters. Our loans to deposits ratio ended the quarter at 89.2%, within our preferred operating range."
Mr. Wehmer commented, "Net interest income increased by $63.6 million in the third quarter of 2022 primarily due to improvement in net interest margin as well as an increase in earning assets. Net interest margin increased by 42 basis points as the upward repricing of earning assets significantly outpaced deposit rate changes. We remain asset sensitive to interest rates and believe that in the near term loan yields will continue to reprice at a greater magnitude than deposit costs. Further, we believe, subject to no material change in the consensus projection of interest rates as of this release date, that our net interest margin will continue to expand and should approach 4.00% during the first quarter of 2023.”
Commenting on credit quality, Mr. Wehmer stated, "While uncertain economic conditions may persist in the coming quarters, Wintrust is confident in our ability to navigate such conditions especially given our current credit quality metrics. Non-performing loans comprise only 0.26% of total loans as of September 30, 2022 increasing to $97.6 million as compared to $72.4 million as of June 30, 2022. The Company recorded a provision for credit losses of $6.4 million in the third quarter of 2022, in part related to $3.2 million of net charge-offs and strong loan growth recorded in the quarter. The allowance for credit losses on our core loan portfolio as of September 30, 2022 is approximately 1.26% of the outstanding balance. We believe that the Company’s reserves remain appropriate and we remain diligent in our review of credit."
Mr. Wehmer concluded, “Our third quarter of 2022 results continued to demonstrate the multi-faceted nature of our business model which we believe uniquely positions us to be successful. We expect to leverage our differentiated, diversified loan portfolio to outperform peers with respect to loan growth which should allow us to continue to expand net interest income. We are focused on taking advantage of market opportunities to prudently deploy liquidity into earning assets including core and niche loans and investment securities while maintaining an interest rate sensitive asset portfolio. We are closely watching our expenses and believe our efficiency ratio will continue to improve. We are opportunistically evaluating the acquisition market for both banks and business lines of various sizes. Of course, we remain diligent in our consideration of acquisition targets and intend to be prudent in our decision making, always seeking to minimize dilution.”
2
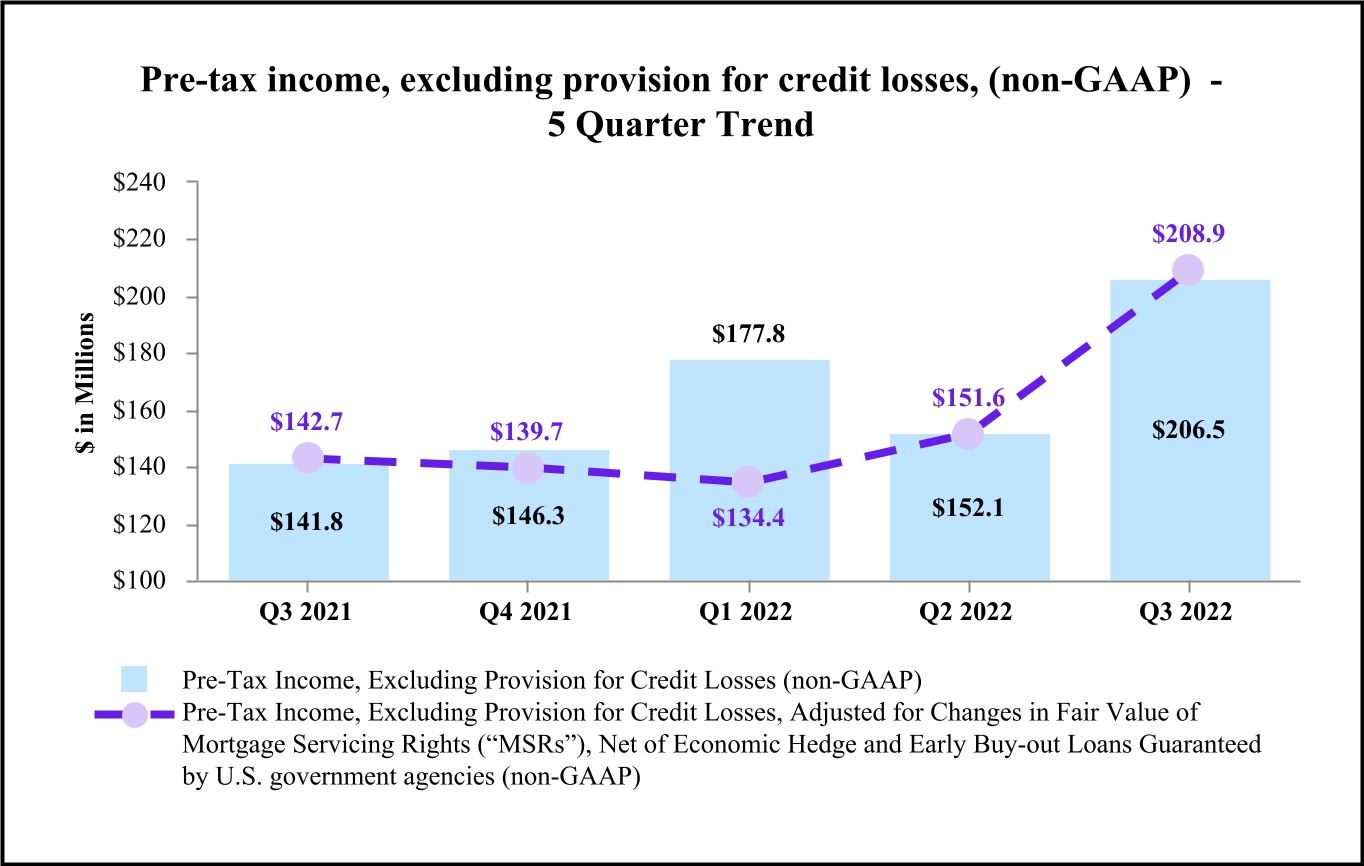
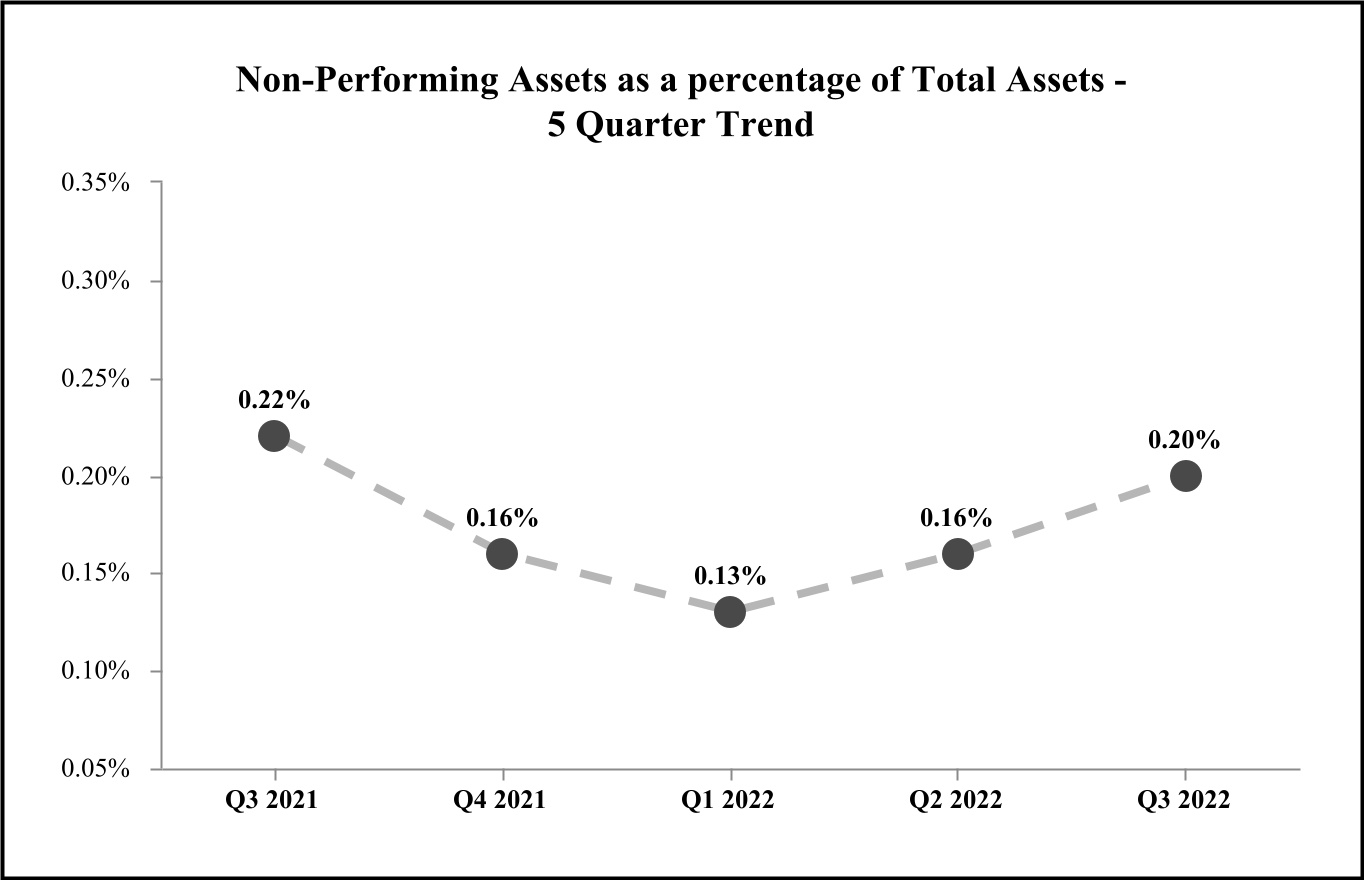
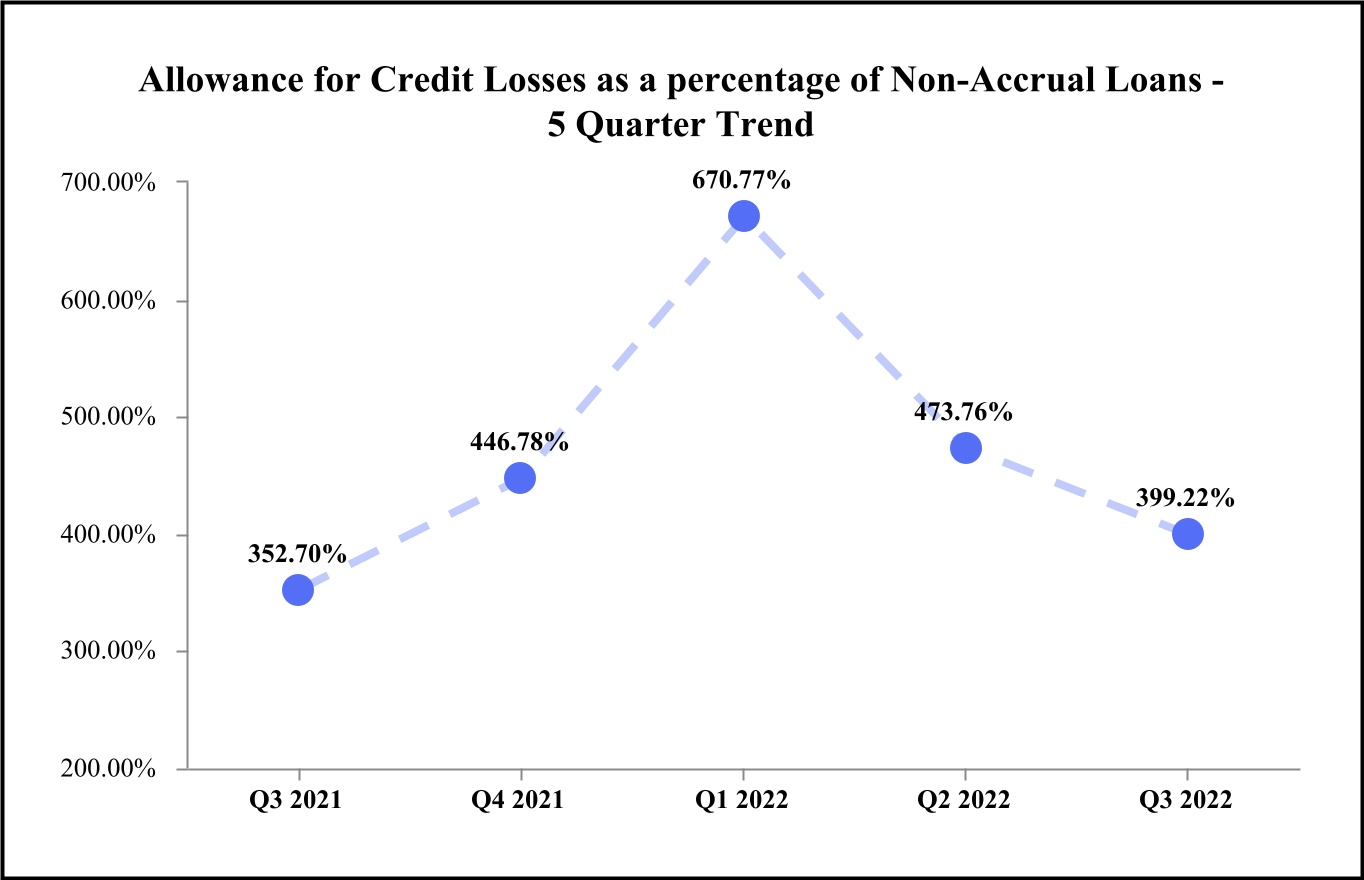
The graphs below illustrate certain financial highlights of the third quarter of 2022 as well as historical financial performance. See “Supplemental Non-GAAP Financial Measures/Ratios” at Table 18 for additional information with respect to non-GAAP financial measures/ratios, including the reconciliations to the corresponding GAAP financial measures/ratios.
3
4
5
6
7
SUMMARY OF RESULTS:
BALANCE SHEET
Total loans increased by $1.1 billion as core loans increased by $703 million and niche loans increased by $450 million. See Table 1 for more information. As of September 30, 2022, virtually all of the PPP loan balances were forgiven with only $44 million remaining on balance sheet.
Total liabilities increased $1.5 billion in the third quarter of 2022 resulting primarily from a $1.1 billion increase in Federal Home Loan Bank advances and a $204 million increase in total deposits. The Company utilized $1.0 billion of this funding to purchase investment securities which settled early in the fourth quarter of 2022. The Company's loans to deposits ratio ended the quarter at 89.2%. Management believes in substantially funding the Company's balance sheet with core deposits and utilizes brokered or wholesale funding sources on a limited basis to manage its liquidity position as well as for interest rate risk management purposes.
For more information regarding changes in the Company’s balance sheet, see Consolidated Statements of Condition and Tables 1 through 3 in this report.
NET INTEREST INCOME
For the third quarter of 2022, net interest income totaled $401.4 million, an increase of $63.6 million as compared to the second quarter of 2022. The $63.6 million increase in net interest income in the third quarter of 2022 compared to the second quarter of 2022 was primarily due to loan growth and improvement in net interest margin. The Company recognized $463,000 of PPP fee accretion in the third quarter of 2022 as compared to $4.5 million in the second quarter of 2022. As of September 30, 2022, the Company had approximately $1.7 million of net PPP loan fees that have yet to be recognized in income.
Net interest margin was 3.34% (3.35% on a fully taxable-equivalent basis, non-GAAP) during the third quarter of 2022 compared to 2.92% (2.93% on a fully taxable-equivalent basis, non-GAAP) during the second quarter of 2022. The net interest margin increase as compared to the second quarter of 2022 was due to a 67 basis point increase in yield on earning assets and a 12 basis point increase in net free funds contribution. These improvements were partially offset by a 37 basis point increase in the rate paid on interest-bearing liabilities. The 67 basis point increase in the yield on earning assets in the third quarter of 2022 as compared to the second quarter of 2022 was primarily due to a 69 basis point improvement on loan yields and a higher liquidity management asset yield as the Company earned higher yields on interest-bearing deposits with banks. The 37 basis point increase in the rate paid on interest-bearing liabilities in the third quarter of 2022 as compared to the second quarter of 2022 is primarily due to a 36 basis point increase in the rate paid on interest-bearing deposits primarily related to the increasing rate environment.
Wintrust remains in an asset-sensitive interest rate position. Based on modeled contractual cash flows, including prepayment assumptions, approximately 80% of our current loan balances are projected to reprice or mature in the next 12 months.
For more information regarding net interest income, see Tables 4 through 8 in this report.
ASSET QUALITY
The allowance for credit losses totaled $315.3 million as of September 30, 2022, an increase of $3.1 million as compared to $312.2 million as of June 30, 2022. A provision for credit losses totaling $6.4 million was recorded for the third quarter of 2022 as compared to $20.4 million recorded in the second quarter of 2022. For more information regarding the provision for credit losses, see Table 11 in this report.
Management believes the allowance for credit losses is appropriate to account for expected credit losses. The Current Expected Credit Losses (“CECL”) accounting standard requires the Company to estimate expected credit losses over the life of the Company’s financial assets as of the reporting date. There can be no assurances, however, that future losses will not significantly exceed the amounts provided for, thereby affecting future results of operations. A summary of the allowance for credit losses calculated for the loan components in each portfolio as of September 30, 2022, June 30, 2022, and March 31, 2022 is shown on Table 12 of this report.
Net charge-offs totaled $3.2 million in the third quarter of 2022, as compared to $9.5 million of net charge-offs in the second quarter of 2022. Net charge-offs as a percentage of average total loans were reported as three basis points in the third quarter of
8
2022 on an annualized basis compared to 11 basis points on an annualized basis in the second quarter of 2022. For more information regarding net charge-offs, see Table 10 in this report.
The Company’s delinquency rates remain low and manageable. For more information regarding past due loans, see Table 13 in this report.
The ratio of non-performing assets to total assets was 0.20% as of September 30, 2022, compared to 0.16% at June 30, 2022. Non-performing assets totaled $104.3 million at September 30, 2022, compared to $79.2 million at June 30, 2022. Non-performing loans totaled $97.6 million, or 0.26% of total loans, at September 30, 2022 compared to $72.4 million, or 0.20% of total loans, at June 30, 2022. The increase in non-performing loans in the third quarter of 2022 is primarily driven by one commercial loan credit that moved to a non-accrual status and an increase in administrative 90-day past due premium finance receivables. For more information regarding non-performing assets, see Table 14 in this report.
NON-INTEREST INCOME
Wealth management revenue increased $1.8 million in the third quarter of 2022 as compared to the second quarter of 2022 primarily due to increased fees relating to the Company’s tax-deferred like-kind exchange services. Wealth management revenue is comprised of the trust and asset management revenue of The Chicago Trust Company and Great Lakes Advisors, the brokerage commissions, managed money fees and insurance product commissions at Wintrust Investments and fees from tax-deferred like-kind exchange services provided by the Chicago Deferred Exchange Company.
Mortgage banking revenue decreased by $6.1 million in the third quarter of 2022 as compared to the second quarter of 2022 primarily due to lower production revenue as a result of declining mortgage origination volume in the current rising rate environment. The Company also recorded a net loss of $2.5 million in the third quarter of 2022 relating to fair value changes in certain mortgage assets. This included a $7.5 million increase in the value of mortgage servicing rights related to changes in fair value model assumptions net of economic hedges and a negative $8.0 million valuation related adjustment on the Company’s held-for-sale portfolio of early buy-out exercised loans guaranteed by U.S. government agencies which are held at fair value. In addition, the Company recorded a $2.0 million negative valuation adjustment in other income on the Company’s held-for-investment portfolio of early buy-out exercised loans guaranteed by U.S. government agencies which are held at fair value. The Company intends to monitor the relationship of these assets and will seek to minimize the earnings impact of fair value changes in future quarters.
Loans originated for sale were $661 million in the third quarter of 2022, a decrease of $160 million as compared to the second quarter of 2022. The percentage of origination volume from refinancing activities was 18% in the third quarter of 2022 as compared to 22% in the second quarter of 2022. Mortgage banking revenue includes revenue from activities related to originating, selling and servicing residential real estate loans for the secondary market.
The Company recognized net losses on investment securities of $3.1 million in the third quarter of 2022 as compared to net losses of $7.8 million recognized in the second quarter of 2022.
Net operating lease income decreased $2.4 million in the third quarter of 2022 as compared to the second quarter of 2022 due to lower gains on sale of lease assets recognized in the third quarter of 2022 as compared to the second quarter of 2022.
Other non-interest income increased $2.0 million in the third quarter of 2022 as compared to the second quarter of 2022 primarily due to $2.5 million of losses recognized in the second quarter of 2022 relating to the sale of a property no longer considered for future expansion and the anticipated sale of a former data processing facility.
For more information regarding non-interest income, see Tables 15 and 16 in this report.
NON-INTEREST EXPENSE
Salaries and employee benefits expense increased by $8.8 million in the third quarter of 2022 as compared to the second quarter of 2022. The $8.8 million increase is primarily related to increased salary and incentive compensation expense. Salary expense increased $5.0 million in the third quarter of 2022 as compared to the second quarter of 2022 primarily due to mid-year compensation increases which included raising the Company’s minimum wage. Commission and incentive compensation increased $4.3 million in the third quarter of 2022 as compared to the second quarter of 2022 primarily due to increased incentive compensation related to the Company’s performance offset somewhat by a lower level of mortgage banking commissions due to the declining mortgage loan origination volumes.
9
Advertising and marketing expenses in the third quarter of 2022 totaled $16.6 million, relatively unchanged as compared to the second quarter of 2022. Marketing costs are incurred to promote the Company's brand, commercial banking capabilities and the Company's various products, to attract loans and deposits and to announce new branch openings as well as the expansion of the Company's non-bank businesses. The level of marketing expenditures depends on the timing of sponsorship programs utilized which are determined based on the market area, targeted audience, competition and various other factors.
Miscellaneous expense in the third quarter of 2022 decreased by $1.7 million as compared to the second quarter of 2022. Miscellaneous expense includes ATM expenses, correspondent bank charges, directors fees, telephone, postage, corporate insurance, dues and subscriptions, problem loan expenses and other miscellaneous operational losses and costs.
For more information regarding non-interest expense, see Table 17 in this report.
INCOME TAXES
The Company recorded income tax expense of $57.1 million in the third quarter of 2022 compared to $37.1 million in the second quarter of 2022. The effective tax rates were 28.53% in the third quarter of 2022 compared to 28.21% in the second quarter of 2022. The effective tax rate increased as the Company recorded approximately $2.0 million of additional income tax expense related to earnings at its Canadian subsidiary. The tax, known as GILTI (“Global Intangible Low-taxed Income”) is a U.S. minimum tax on global profits. During the quarter, the impact of the rapid and significant strengthening of the U.S. dollar relative to the Canadian dollar caused the GILTI tax to be applicable.
BUSINESS UNIT SUMMARY
Community Banking
Through its community banking unit, the Company provides banking and financial services primarily to individuals, small to mid-sized businesses, local governmental units and institutional clients residing primarily in the local areas the Company services. In the third quarter of 2022, this unit expanded its loan portfolio. The segment’s net interest income increased in the third quarter of 2022 as compared to the second quarter of 2022 due to loan growth and an increased net interest margin.
Mortgage banking revenue was $27.2 million for the third quarter of 2022, a decrease of $6.1 million as compared to the second quarter of 2022, primarily due to lower production revenue as a result of declining mortgage origination volume in the current rising rate environment. Service charges on deposit accounts totaled $14.3 million in the third quarter of 2022, a decrease of $1.5 million as compared to the second quarter of 2022 primarily due to lower fees associated with commercial account activity. The Company’s gross commercial and commercial real estate loan pipelines remained robust as of September 30, 2022 indicating momentum for continued loan growth in the fourth quarter of 2022.
Specialty Finance
Through its specialty finance unit, the Company offers financing of insurance premiums for businesses and individuals, equipment financing through structured loans and lease products to customers in a variety of industries, accounts receivable financing and value-added, out-sourced administrative services and other services. Originations within the insurance premium financing receivables portfolio were $4.1 billion during the third quarter of 2022 and average balances increased by $866.3 million as compared to the second quarter of 2022. The Company’s leasing portfolio balance increased in the third quarter of 2022, with its portfolio of assets, including capital leases, loans and equipment on operating leases, totaling $2.7 billion as of September 30, 2022 as compared to $2.6 billion as of June 30, 2022. Revenues from the Company’s out-sourced administrative services business were $1.5 million in the third quarter of 2022, a decrease of $58,000 from the second quarter of 2022.
Wealth Management
Through four separate subsidiaries within its wealth management unit, the Company offers a full range of wealth management services, including trust and investment services, tax-deferred like-kind exchange services, asset management, securities brokerage services and 401(k) and retirement plan services. Wealth management revenue totaled $33.1 million in the third quarter of 2022, an increase of $1.8 million compared to the second quarter of 2022. At September 30, 2022, the Company’s wealth management subsidiaries had approximately $32.8 billion of assets under administration, which included $6.9 billion of assets owned by the Company and its subsidiary banks, representing a slight decrease from the $32.9 billion of assets under administration at June 30, 2022.
10
ITEMS IMPACTING COMPARATIVE FINANCIAL RESULTS
Common Stock Offering
In June 2022, the Company sold through a public offering a total of 3,450,000 shares of its common stock. Net proceeds to the Company totaled approximately $285.7 million, net of estimated issuance costs.
Insurance Agency Loan Portfolio
On November 15, 2021, the Company completed its acquisition of certain assets from The Allstate Corporation (“Allstate”). Through this business combination, the Company acquired approximately $581.6 million of loans, net of allowance for credit losses measured on the acquisition date. The loan portfolio was comprised of approximately 1,800 loans to Allstate agents nationally. In addition to acquiring the loans, the Company became the national preferred provider of loans to Allstate agents. In connection with the loan acquisition, a team of Allstate agency lending specialists joined the Company, to augment and expand Wintrust’s existing insurance agency finance business. As the transaction was determined to be a business combination, the Company recorded goodwill of approximately $9.3 million on the purchase.
11
WINTRUST FINANCIAL CORPORATION
Key Operating Measures
Wintrust’s key operating measures and growth rates for the third quarter of 2022, as compared to the second quarter of 2022 (sequential quarter) and third quarter of 2021 (linked quarter), are shown in the table below:
% or(1) basis point (bp) change from 2nd Quarter 2022 | % or basis point (bp) change from 3rd Quarter 2021 | ||||||||||||||||||||||||||||||||||
| Three Months Ended | |||||||||||||||||||||||||||||||||||
| (Dollars in thousands, except per share data) | Sep 30, 2022 | Jun 30, 2022 | Sep 30, 2021 | ||||||||||||||||||||||||||||||||
| Net income | $ | 142,961 | $ | 94,513 | $ | 109,137 | 51 | % | 31 | % | |||||||||||||||||||||||||
Pre-tax income, excluding provision for credit losses (non-GAAP) (2) | 206,461 | 152,078 | 141,826 | 36 | 46 | ||||||||||||||||||||||||||||||
| Net income per common share – diluted | 2.21 | 1.49 | 1.77 | 48 | 25 | ||||||||||||||||||||||||||||||
| Cash dividends declared per common share | 0.34 | 0.34 | 0.31 | — | 10 | ||||||||||||||||||||||||||||||
Net revenue (3) | 502,930 | 440,746 | 423,970 | 14 | 19 | ||||||||||||||||||||||||||||||
| Net interest income | 401,448 | 337,804 | 287,496 | 19 | 40 | ||||||||||||||||||||||||||||||
| Net interest margin | 3.34 | % | 2.92 | % | 2.58 | % | 42 | bps | 76 | bps | |||||||||||||||||||||||||
Net interest margin – fully taxable-equivalent (non-GAAP) (2) | 3.35 | 2.93 | 2.59 | 42 | 76 | ||||||||||||||||||||||||||||||
Net overhead ratio (4) | 1.53 | 1.51 | 1.22 | 2 | 31 | ||||||||||||||||||||||||||||||
| Return on average assets | 1.12 | 0.77 | 0.92 | 35 | 20 | ||||||||||||||||||||||||||||||
| Return on average common equity | 12.31 | 8.53 | 10.31 | 378 | 200 | ||||||||||||||||||||||||||||||
Return on average tangible common equity (non-GAAP) (2) | 14.68 | 10.36 | 12.62 | 432 | 206 | ||||||||||||||||||||||||||||||
| At end of period | |||||||||||||||||||||||||||||||||||
| Total assets | $ | 52,382,939 | $ | 50,969,332 | $ | 47,832,271 | 11 | % | 10 | % | |||||||||||||||||||||||||
Total loans (5) | 38,167,613 | 37,053,103 | 33,264,043 | 12 | 15 | ||||||||||||||||||||||||||||||
| Total deposits | 42,797,191 | 42,593,326 | 39,952,558 | 2 | 7 | ||||||||||||||||||||||||||||||
| Total shareholders’ equity | 4,637,980 | 4,727,623 | 4,410,317 | (8) | 5 | ||||||||||||||||||||||||||||||
(1)Period-end balance sheet percentage changes are annualized.
(2)See “Supplemental Non-GAAP Financial Measures/Ratios” at Table 18 for additional information on this performance measure/ratio.
(3)Net revenue is net interest income plus non-interest income.
(4)The net overhead ratio is calculated by netting total non-interest expense and total non-interest income, annualizing this amount, and dividing by that period’s average total assets. A lower ratio indicates a higher degree of efficiency.
(5)Excludes mortgage loans held-for-sale.
Certain returns, yields, performance ratios, or quarterly growth rates are “annualized” in this presentation to represent an annual time period. This is done for analytical purposes to better discern, for decision-making purposes, underlying performance trends when compared to full-year or year-over-year amounts. For example, a 5% growth rate for a quarter would represent an annualized 20% growth rate. Additional supplemental financial information showing quarterly trends can be found on the Company’s website at www.wintrust.com by choosing “Financial Reports” under the “Investor Relations” heading, and then choosing “Financial Highlights.”
12
WINTRUST FINANCIAL CORPORATION
Selected Financial Highlights
| Three Months Ended | Nine Months Ended | ||||||||||||||||||||||||||||||||||||||||
| (Dollars in thousands, except per share data) | Sep 30, 2022 | Jun 30, 2022 | Mar 31, 2022 | Dec 31, 2021 | Sep 30, 2021 | Sep 30, 2022 | Sep 30, 2021 | ||||||||||||||||||||||||||||||||||
| Selected Financial Condition Data (at end of period): | |||||||||||||||||||||||||||||||||||||||||
| Total assets | $ | 52,382,939 | $ | 50,969,332 | $ | 50,250,661 | $ | 50,142,143 | $ | 47,832,271 | |||||||||||||||||||||||||||||||
Total loans (1) | 38,167,613 | 37,053,103 | 35,280,547 | 34,789,104 | 33,264,043 | ||||||||||||||||||||||||||||||||||||
| Total deposits | 42,797,191 | 42,593,326 | 42,219,322 | 42,095,585 | 39,952,558 | ||||||||||||||||||||||||||||||||||||
| Total shareholders’ equity | 4,637,980 | 4,727,623 | 4,492,256 | 4,498,688 | 4,410,317 | ||||||||||||||||||||||||||||||||||||
| Selected Statements of Income Data: | |||||||||||||||||||||||||||||||||||||||||
| Net interest income | $ | 401,448 | $ | 337,804 | $ | 299,294 | $ | 295,976 | $ | 287,496 | $ | 1,038,546 | $ | 828,981 | |||||||||||||||||||||||||||
Net revenue (2) | 502,930 | 440,746 | 462,084 | 429,743 | 423,970 | 1,405,760 | 1,281,334 | ||||||||||||||||||||||||||||||||||
| Net income | 142,961 | 94,513 | 127,391 | 98,757 | 109,137 | 364,865 | 367,394 | ||||||||||||||||||||||||||||||||||
Pre-tax income, excluding provision for credit losses (non-GAAP) (3) | 206,461 | 152,078 | 177,786 | 146,344 | 141,826 | 536,325 | 432,189 | ||||||||||||||||||||||||||||||||||
| Net income per common share – Basic | 2.24 | 1.51 | 2.11 | 1.61 | 1.79 | 5.86 | 6.08 | ||||||||||||||||||||||||||||||||||
| Net income per common share – Diluted | 2.21 | 1.49 | 2.07 | 1.58 | 1.77 | 5.78 | 6.00 | ||||||||||||||||||||||||||||||||||
| Cash dividends declared per common share | 0.34 | 0.34 | 0.34 | 0.31 | 0.31 | 1.02 | 0.93 | ||||||||||||||||||||||||||||||||||
| Selected Financial Ratios and Other Data: | |||||||||||||||||||||||||||||||||||||||||
| Performance Ratios: | |||||||||||||||||||||||||||||||||||||||||
| Net interest margin | 3.34 | % | 2.92 | % | 2.60 | % | 2.54 | % | 2.58 | % | 2.96 | % | 2.58 | % | |||||||||||||||||||||||||||
Net interest margin – fully taxable-equivalent (non-GAAP) (3) | 3.35 | 2.93 | 2.61 | 2.55 | 2.59 | 2.97 | 2.59 | ||||||||||||||||||||||||||||||||||
| Non-interest income to average assets | 0.79 | 0.84 | 1.33 | 1.08 | 1.15 | 0.98 | 1.31 | ||||||||||||||||||||||||||||||||||
| Non-interest expense to average assets | 2.32 | 2.35 | 2.33 | 2.29 | 2.37 | 2.33 | 2.47 | ||||||||||||||||||||||||||||||||||
Net overhead ratio (4) | 1.53 | 1.51 | 1.00 | 1.21 | 1.22 | 1.35 | 1.15 | ||||||||||||||||||||||||||||||||||
| Return on average assets | 1.12 | 0.77 | 1.04 | 0.80 | 0.92 | 0.98 | 1.07 | ||||||||||||||||||||||||||||||||||
| Return on average common equity | 12.31 | 8.53 | 11.94 | 9.05 | 10.31 | 10.96 | 12.05 | ||||||||||||||||||||||||||||||||||
Return on average tangible common equity (non-GAAP) (3) | 14.68 | 10.36 | 14.48 | 11.04 | 12.62 | 13.21 | 14.82 | ||||||||||||||||||||||||||||||||||
| Average total assets | $ | 50,722,694 | $ | 49,353,426 | $ | 49,501,844 | $ | 49,118,777 | $ | 47,192,510 | $ | 49,863,793 | $ | 46,050,737 | |||||||||||||||||||||||||||
| Average total shareholders’ equity | 4,795,387 | 4,526,110 | 4,500,460 | 4,433,953 | 4,343,915 | 4,608,399 | 4,255,851 | ||||||||||||||||||||||||||||||||||
| Average loans to average deposits ratio | 88.8 | % | 86.8 | % | 83.8 | % | 81.7 | % | 83.8 | % | 86.5 | % | 85.8 | % | |||||||||||||||||||||||||||
| Period-end loans to deposits ratio | 89.2 | 87.0 | 83.6 | 82.6 | 83.3 | ||||||||||||||||||||||||||||||||||||
| Common Share Data at end of period: | |||||||||||||||||||||||||||||||||||||||||
| Market price per common share | $ | 81.55 | $ | 80.15 | $ | 92.93 | $ | 90.82 | $ | 80.37 | |||||||||||||||||||||||||||||||
| Book value per common share | 69.56 | 71.06 | 71.26 | 71.62 | 70.19 | ||||||||||||||||||||||||||||||||||||
Tangible book value per common share (non-GAAP) (3) | 58.42 | 59.87 | 59.34 | 59.64 | 58.32 | ||||||||||||||||||||||||||||||||||||
| Common shares outstanding | 60,743,335 | 60,721,889 | 57,253,214 | 57,054,091 | 56,956,026 | ||||||||||||||||||||||||||||||||||||
| Other Data at end of period: | |||||||||||||||||||||||||||||||||||||||||
Tier 1 leverage ratio (5) | 8.8 | % | 8.8 | % | 8.1 | % | 8.0 | % | 8.1 | % | |||||||||||||||||||||||||||||||
| Risk-based capital ratios: | |||||||||||||||||||||||||||||||||||||||||
Tier 1 capital ratio (5) | 9.9 | 9.9 | 9.6 | 9.6 | 9.9 | ||||||||||||||||||||||||||||||||||||
Common equity tier 1 capital ratio (5) | 8.9 | 9.0 | 8.6 | 8.6 | 8.9 | ||||||||||||||||||||||||||||||||||||
Total capital ratio (5) | 11.7 | 11.9 | 11.6 | 11.6 | 12.1 | ||||||||||||||||||||||||||||||||||||
Allowance for credit losses (6) | $ | 315,338 | $ | 312,192 | $ | 301,327 | $ | 299,731 | $ | 296,138 | |||||||||||||||||||||||||||||||
| Allowance for loan and unfunded lending-related commitment losses to total loans | 0.83 | % | 0.84 | % | 0.85 | % | 0.86 | % | 0.89 | % | |||||||||||||||||||||||||||||||
| Number of: | |||||||||||||||||||||||||||||||||||||||||
| Bank subsidiaries | 15 | 15 | 15 | 15 | 15 | ||||||||||||||||||||||||||||||||||||
| Banking offices | 174 | 173 | 174 | 173 | 172 | ||||||||||||||||||||||||||||||||||||
(1)Excludes mortgage loans held-for-sale.
(2)Net revenue is net interest income and non-interest income.
(3)See “Supplemental Non-GAAP Financial Measures/Ratios” at Table 18 for additional information on this performance measure/ratio.
(4)The net overhead ratio is calculated by netting total non-interest expense and total non-interest income, annualizing this amount, and dividing by that period’s average total assets. A lower ratio indicates a higher degree of efficiency.
(5)Capital ratios for current quarter-end are estimated.
(6)The allowance for credit losses includes the allowance for loan losses, the allowance for unfunded lending-related commitments and the allowance for held-to-maturity securities losses.
13
WINTRUST FINANCIAL CORPORATION AND SUBSIDIARIES
CONSOLIDATED STATEMENTS OF CONDITION
| (Unaudited) | (Unaudited) | (Unaudited) | (Unaudited) | |||||||||||||||||||||||||||||
| Sep 30, | Jun 30, | Mar 31, | Dec 31, | Sep 30, | ||||||||||||||||||||||||||||
| (In thousands) | 2022 | 2022 | 2022 | 2021 | 2021 | |||||||||||||||||||||||||||
| Assets | ||||||||||||||||||||||||||||||||
| Cash and due from banks | $ | 489,590 | $ | 498,891 | $ | 462,516 | $ | 411,150 | $ | 462,244 | ||||||||||||||||||||||
| Federal funds sold and securities purchased under resale agreements | 57 | 475,056 | 700,056 | 700,055 | 55 | |||||||||||||||||||||||||||
| Interest-bearing deposits with banks | 3,968,605 | 3,266,541 | 4,013,597 | 5,372,603 | 5,232,315 | |||||||||||||||||||||||||||
| Available-for-sale securities, at fair value | 2,923,653 | 2,970,121 | 2,998,898 | 2,327,793 | 2,373,478 | |||||||||||||||||||||||||||
| Held-to-maturity securities, at amortized cost | 3,389,842 | 3,413,469 | 3,435,729 | 2,942,285 | 2,736,722 | |||||||||||||||||||||||||||
| Trading account securities | 179 | 1,010 | 852 | 1,061 | 1,103 | |||||||||||||||||||||||||||
| Equity securities with readily determinable fair value | 114,012 | 93,295 | 92,689 | 90,511 | 88,193 | |||||||||||||||||||||||||||
| Federal Home Loan Bank and Federal Reserve Bank stock | 178,156 | 136,138 | 136,163 | 135,378 | 135,408 | |||||||||||||||||||||||||||
| Brokerage customer receivables | 20,327 | 21,527 | 22,888 | 26,068 | 26,378 | |||||||||||||||||||||||||||
| Mortgage loans held-for-sale | 376,160 | 513,232 | 606,545 | 817,912 | 925,312 | |||||||||||||||||||||||||||
| Loans, net of unearned income | 38,167,613 | 37,053,103 | 35,280,547 | 34,789,104 | 33,264,043 | |||||||||||||||||||||||||||
| Allowance for loan losses | (246,110) | (251,769) | (250,539) | (247,835) | (248,612) | |||||||||||||||||||||||||||
| Net loans | 37,921,503 | 36,801,334 | 35,030,008 | 34,541,269 | 33,015,431 | |||||||||||||||||||||||||||
| Premises, software and equipment, net | 763,029 | 762,381 | 761,213 | 766,405 | 748,872 | |||||||||||||||||||||||||||
| Lease investments, net | 244,822 | 223,813 | 240,656 | 242,082 | 243,933 | |||||||||||||||||||||||||||
| Accrued interest receivable and other assets | 1,316,305 | 1,112,697 | 1,066,750 | 1,084,115 | 1,166,917 | |||||||||||||||||||||||||||
| Goodwill | 653,079 | 654,709 | 655,402 | 655,149 | 645,792 | |||||||||||||||||||||||||||
| Other acquisition-related intangible assets | 23,620 | 25,118 | 26,699 | 28,307 | 30,118 | |||||||||||||||||||||||||||
| Total assets | $ | 52,382,939 | $ | 50,969,332 | $ | 50,250,661 | $ | 50,142,143 | $ | 47,832,271 | ||||||||||||||||||||||
| Liabilities and Shareholders’ Equity | ||||||||||||||||||||||||||||||||
| Deposits: | ||||||||||||||||||||||||||||||||
| Non-interest-bearing | $ | 13,529,277 | $ | 13,855,844 | $ | 13,748,918 | $ | 14,179,980 | $ | 13,255,417 | ||||||||||||||||||||||
| Interest-bearing | 29,267,914 | 28,737,482 | 28,470,404 | 27,915,605 | 26,697,141 | |||||||||||||||||||||||||||
| Total deposits | 42,797,191 | 42,593,326 | 42,219,322 | 42,095,585 | 39,952,558 | |||||||||||||||||||||||||||
| Federal Home Loan Bank advances | 2,316,071 | 1,166,071 | 1,241,071 | 1,241,071 | 1,241,071 | |||||||||||||||||||||||||||
| Other borrowings | 447,215 | 482,787 | 482,516 | 494,136 | 504,527 | |||||||||||||||||||||||||||
| Subordinated notes | 437,260 | 437,162 | 437,033 | 436,938 | 436,811 | |||||||||||||||||||||||||||
| Junior subordinated debentures | 253,566 | 253,566 | 253,566 | 253,566 | 253,566 | |||||||||||||||||||||||||||
| Trade date securities payable | — | — | 437 | — | 1,348 | |||||||||||||||||||||||||||
| Accrued interest payable and other liabilities | 1,493,656 | 1,308,797 | 1,124,460 | 1,122,159 | 1,032,073 | |||||||||||||||||||||||||||
| Total liabilities | 47,744,959 | 46,241,709 | 45,758,405 | 45,643,455 | 43,421,954 | |||||||||||||||||||||||||||
| Shareholders’ Equity: | ||||||||||||||||||||||||||||||||
| Preferred stock | 412,500 | 412,500 | 412,500 | 412,500 | 412,500 | |||||||||||||||||||||||||||
| Common stock | 60,743 | 60,722 | 59,091 | 58,892 | 58,794 | |||||||||||||||||||||||||||
| Surplus | 1,891,621 | 1,880,913 | 1,698,093 | 1,685,572 | 1,674,062 | |||||||||||||||||||||||||||
| Treasury stock | — | — | (109,903) | (109,903) | (109,903) | |||||||||||||||||||||||||||
| Retained earnings | 2,731,844 | 2,616,525 | 2,548,474 | 2,447,535 | 2,373,447 | |||||||||||||||||||||||||||
| Accumulated other comprehensive (loss) income | (458,728) | (243,037) | (115,999) | 4,092 | 1,417 | |||||||||||||||||||||||||||
| Total shareholders’ equity | 4,637,980 | 4,727,623 | 4,492,256 | 4,498,688 | 4,410,317 | |||||||||||||||||||||||||||
| Total liabilities and shareholders’ equity | $ | 52,382,939 | $ | 50,969,332 | $ | 50,250,661 | $ | 50,142,143 | $ | 47,832,271 | ||||||||||||||||||||||
14
WINTRUST FINANCIAL CORPORATION AND SUBSIDIARIES
CONSOLIDATED STATEMENTS OF INCOME (UNAUDITED)
| Three Months Ended | Nine Months Ended | |||||||||||||||||||||||||||||||||||||
| (In thousands, except per share data) | Sep 30, 2022 | Jun 30, 2022 | Mar 31, 2022 | Dec 31, 2021 | Sep 30, 2021 | Sep 30, 2022 | Sep 30, 2021 | |||||||||||||||||||||||||||||||
| Interest income | ||||||||||||||||||||||||||||||||||||||
| Interest and fees on loans | $ | 402,689 | $ | 320,501 | $ | 285,698 | $ | 289,140 | $ | 285,587 | $ | 1,008,888 | $ | 844,388 | ||||||||||||||||||||||||
| Mortgage loans held-for-sale | 5,371 | 5,740 | 6,087 | 7,234 | 7,716 | 17,198 | 24,935 | |||||||||||||||||||||||||||||||
| Interest-bearing deposits with banks | 15,621 | 5,790 | 1,687 | 2,254 | 2,000 | 23,098 | 4,352 | |||||||||||||||||||||||||||||||
| Federal funds sold and securities purchased under resale agreements | 1,845 | 1,364 | 431 | 173 | — | 3,640 | — | |||||||||||||||||||||||||||||||
| Investment securities | 38,569 | 36,541 | 32,398 | 27,210 | 25,189 | 107,508 | 68,076 | |||||||||||||||||||||||||||||||
| Trading account securities | 7 | 4 | 5 | 4 | 3 | 16 | 6 | |||||||||||||||||||||||||||||||
| Federal Home Loan Bank and Federal Reserve Bank stock | 2,109 | 1,823 | 1,772 | 1,776 | 1,777 | 5,704 | 5,291 | |||||||||||||||||||||||||||||||
| Brokerage customer receivables | 267 | 205 | 174 | 188 | 185 | 646 | 457 | |||||||||||||||||||||||||||||||
| Total interest income | 466,478 | 371,968 | 328,252 | 327,979 | 322,457 | 1,166,698 | 947,505 | |||||||||||||||||||||||||||||||
| Interest expense | ||||||||||||||||||||||||||||||||||||||
| Interest on deposits | 45,916 | 18,985 | 14,854 | 16,572 | 19,305 | 79,755 | 71,547 | |||||||||||||||||||||||||||||||
| Interest on Federal Home Loan Bank advances | 6,812 | 4,878 | 4,816 | 4,923 | 4,931 | 16,506 | 14,658 | |||||||||||||||||||||||||||||||
| Interest on other borrowings | 4,008 | 2,734 | 2,239 | 2,250 | 2,501 | 8,981 | 7,678 | |||||||||||||||||||||||||||||||
| Interest on subordinated notes | 5,485 | 5,517 | 5,482 | 5,514 | 5,480 | 16,484 | 16,469 | |||||||||||||||||||||||||||||||
| Interest on junior subordinated debentures | 2,809 | 2,050 | 1,567 | 2,744 | 2,744 | 6,426 | 8,172 | |||||||||||||||||||||||||||||||
| Total interest expense | 65,030 | 34,164 | 28,958 | 32,003 | 34,961 | 128,152 | 118,524 | |||||||||||||||||||||||||||||||
| Net interest income | 401,448 | 337,804 | 299,294 | 295,976 | 287,496 | 1,038,546 | 828,981 | |||||||||||||||||||||||||||||||
| Provision for credit losses | 6,420 | 20,417 | 4,106 | 9,299 | (7,916) | 30,943 | (68,562) | |||||||||||||||||||||||||||||||
| Net interest income after provision for credit losses | 395,028 | 317,387 | 295,188 | 286,677 | 295,412 | 1,007,603 | 897,543 | |||||||||||||||||||||||||||||||
| Non-interest income | ||||||||||||||||||||||||||||||||||||||
| Wealth management | 33,124 | 31,369 | 31,394 | 32,489 | 31,531 | 95,887 | 91,530 | |||||||||||||||||||||||||||||||
| Mortgage banking | 27,221 | 33,314 | 77,231 | 53,138 | 55,794 | 137,766 | 219,872 | |||||||||||||||||||||||||||||||
| Service charges on deposit accounts | 14,349 | 15,888 | 15,283 | 14,734 | 14,149 | 45,520 | 39,434 | |||||||||||||||||||||||||||||||
| (Losses) gains on investment securities, net | (3,103) | (7,797) | (2,782) | (1,067) | (2,431) | (13,682) | 8 | |||||||||||||||||||||||||||||||
| Fees from covered call options | 1,366 | 1,069 | 3,742 | 1,128 | 1,157 | 6,177 | 2,545 | |||||||||||||||||||||||||||||||
| Trading (losses) gains, net | (7) | 176 | 3,889 | 206 | 58 | 4,058 | 39 | |||||||||||||||||||||||||||||||
| Operating lease income, net | 12,644 | 15,007 | 15,475 | 14,204 | 12,807 | 43,126 | 39,487 | |||||||||||||||||||||||||||||||
| Other | 15,888 | 13,916 | 18,558 | 18,935 | 23,409 | 48,362 | 59,438 | |||||||||||||||||||||||||||||||
| Total non-interest income | 101,482 | 102,942 | 162,790 | 133,767 | 136,474 | 367,214 | 452,353 | |||||||||||||||||||||||||||||||
| Non-interest expense | ||||||||||||||||||||||||||||||||||||||
| Salaries and employee benefits | 176,095 | 167,326 | 172,355 | 167,131 | 170,912 | 515,776 | 524,538 | |||||||||||||||||||||||||||||||
| Software and equipment | 24,126 | 24,250 | 22,810 | 23,708 | 22,029 | 71,186 | 63,807 | |||||||||||||||||||||||||||||||
| Operating lease equipment depreciation | 9,448 | 8,774 | 9,708 | 10,147 | 10,013 | 27,930 | 30,733 | |||||||||||||||||||||||||||||||
| Occupancy, net | 17,727 | 17,651 | 17,824 | 18,343 | 18,158 | 53,202 | 55,841 | |||||||||||||||||||||||||||||||
| Data processing | 7,767 | 8,010 | 7,505 | 7,207 | 7,104 | 23,282 | 20,072 | |||||||||||||||||||||||||||||||
| Advertising and marketing | 16,600 | 16,615 | 11,924 | 13,981 | 13,443 | 45,139 | 33,294 | |||||||||||||||||||||||||||||||
| Professional fees | 7,544 | 7,876 | 8,401 | 7,551 | 7,052 | 23,821 | 21,943 | |||||||||||||||||||||||||||||||
| Amortization of other acquisition-related intangible assets | 1,492 | 1,579 | 1,609 | 1,811 | 1,877 | 4,680 | 5,923 | |||||||||||||||||||||||||||||||
| FDIC insurance | 7,186 | 6,949 | 7,729 | 7,317 | 6,750 | 21,864 | 19,713 | |||||||||||||||||||||||||||||||
| OREO expense, net | 229 | 294 | (1,032) | (641) | (1,531) | (509) | (1,013) | |||||||||||||||||||||||||||||||
| Other | 28,255 | 29,344 | 25,465 | 26,844 | 26,337 | 83,064 | 74,294 | |||||||||||||||||||||||||||||||
| Total non-interest expense | 296,469 | 288,668 | 284,298 | 283,399 | 282,144 | 869,435 | 849,145 | |||||||||||||||||||||||||||||||
| Income before taxes | 200,041 | 131,661 | 173,680 | 137,045 | 149,742 | 505,382 | 500,751 | |||||||||||||||||||||||||||||||
| Income tax expense | 57,080 | 37,148 | 46,289 | 38,288 | 40,605 | 140,517 | 133,357 | |||||||||||||||||||||||||||||||
| Net income | $ | 142,961 | $ | 94,513 | $ | 127,391 | $ | 98,757 | $ | 109,137 | $ | 364,865 | $ | 367,394 | ||||||||||||||||||||||||
| Preferred stock dividends | 6,991 | 6,991 | 6,991 | 6,991 | 6,991 | 20,973 | 20,973 | |||||||||||||||||||||||||||||||
| Net income applicable to common shares | $ | 135,970 | $ | 87,522 | $ | 120,400 | $ | 91,766 | $ | 102,146 | $ | 343,892 | $ | 346,421 | ||||||||||||||||||||||||
| Net income per common share - Basic | $ | 2.24 | $ | 1.51 | $ | 2.11 | $ | 1.61 | $ | 1.79 | $ | 5.86 | $ | 6.08 | ||||||||||||||||||||||||
| Net income per common share - Diluted | $ | 2.21 | $ | 1.49 | $ | 2.07 | $ | 1.58 | $ | 1.77 | $ | 5.78 | $ | 6.00 | ||||||||||||||||||||||||
| Cash dividends declared per common share | $ | 0.34 | $ | 0.34 | $ | 0.34 | $ | 0.31 | $ | 0.31 | $ | 1.02 | $ | 0.93 | ||||||||||||||||||||||||
| Weighted average common shares outstanding | 60,738 | 58,063 | 57,196 | 57,022 | 57,000 | 58,679 | 56,985 | |||||||||||||||||||||||||||||||
| Dilutive potential common shares | 837 | 775 | 862 | 976 | 753 | 814 | 728 | |||||||||||||||||||||||||||||||
| Average common shares and dilutive common shares | 61,575 | 58,838 | 58,058 | 57,998 | 57,753 | 59,493 | 57,713 | |||||||||||||||||||||||||||||||
15
TABLE 1: LOAN PORTFOLIO MIX AND GROWTH RATES
% Growth From (2) | ||||||||||||||||||||||||||||||||||||||
| (Dollars in thousands) | Sep 30, 2022 | Jun 30, 2022 | Mar 31, 2022 | Dec 31, 2021 | Sep 30, 2021 | Dec 31, 2021 (1) | Sep 30, 2021 | |||||||||||||||||||||||||||||||
| Balance: | ||||||||||||||||||||||||||||||||||||||
| Mortgage loans held-for-sale, excluding early buy-out exercised loans guaranteed by U.S. government agencies | $ | 216,062 | $ | 294,688 | $ | 296,548 | $ | 473,102 | $ | 570,663 | (73) | % | (62) | % | ||||||||||||||||||||||||
| Mortgage loans held-for-sale, early buy-out exercised loans guaranteed by U.S. government agencies | 160,098 | 218,544 | 309,997 | 344,810 | 354,649 | (72) | (55) | |||||||||||||||||||||||||||||||
| Total mortgage loans held-for-sale | $ | 376,160 | $ | 513,232 | $ | 606,545 | $ | 817,912 | $ | 925,312 | (72) | % | (59) | % | ||||||||||||||||||||||||
| Core loans: | ||||||||||||||||||||||||||||||||||||||
| Commercial | ||||||||||||||||||||||||||||||||||||||
| Commercial and industrial | $ | 5,818,959 | $ | 5,502,584 | $ | 5,348,266 | $ | 5,346,084 | $ | 4,953,769 | 12 | % | 17 | % | ||||||||||||||||||||||||
| Asset-based lending | 1,545,038 | 1,552,033 | 1,365,297 | 1,299,869 | 1,066,376 | 25 | 45 | |||||||||||||||||||||||||||||||
| Municipal | 608,234 | 535,586 | 533,357 | 536,498 | 524,192 | 18 | 16 | |||||||||||||||||||||||||||||||
| Leases | 1,582,359 | 1,592,329 | 1,481,368 | 1,454,099 | 1,365,281 | 12 | 16 | |||||||||||||||||||||||||||||||
| Commercial real estate | ||||||||||||||||||||||||||||||||||||||
| Residential construction | 66,957 | 55,941 | 57,037 | 51,464 | 49,754 | 40 | 35 | |||||||||||||||||||||||||||||||
| Commercial construction | 1,176,407 | 1,145,602 | 1,055,972 | 1,034,988 | 1,038,034 | 18 | 13 | |||||||||||||||||||||||||||||||
| Land | 282,147 | 304,775 | 283,397 | 269,752 | 255,927 | 6 | 10 | |||||||||||||||||||||||||||||||
| Office | 1,269,729 | 1,321,745 | 1,273,705 | 1,285,686 | 1,269,746 | (2) | — | |||||||||||||||||||||||||||||||
| Industrial | 1,777,658 | 1,746,280 | 1,668,516 | 1,585,808 | 1,490,358 | 16 | 19 | |||||||||||||||||||||||||||||||
| Retail | 1,331,316 | 1,331,059 | 1,395,021 | 1,429,567 | 1,462,101 | (9) | (9) | |||||||||||||||||||||||||||||||
| Multi-family | 2,305,433 | 2,171,583 | 2,175,875 | 2,043,754 | 2,038,526 | 17 | 13 | |||||||||||||||||||||||||||||||
| Mixed use and other | 1,368,537 | 1,330,220 | 1,325,551 | 1,289,267 | 1,281,268 | 8 | 7 | |||||||||||||||||||||||||||||||
| Home equity | 328,822 | 325,826 | 321,435 | 335,155 | 347,662 | (3) | (5) | |||||||||||||||||||||||||||||||
| Residential real estate | ||||||||||||||||||||||||||||||||||||||
| Residential real estate loans for investment | 2,086,795 | 1,965,051 | 1,749,889 | 1,606,271 | 1,520,750 | 40 | 37 | |||||||||||||||||||||||||||||||
| Residential mortgage loans, early buy-out eligible loans guaranteed by U.S. government agencies | 57,161 | 34,764 | 13,520 | 22,707 | 18,847 | NM | NM | |||||||||||||||||||||||||||||||
| Residential mortgage loans, early buy-out exercised loans guaranteed by U.S. government agencies | 91,503 | 79,092 | 36,576 | 8,121 | 8,139 | NM | NM | |||||||||||||||||||||||||||||||
| Total core loans | $ | 21,697,055 | $ | 20,994,470 | $ | 20,084,782 | $ | 19,599,090 | $ | 18,690,730 | 14 | % | 16 | % | ||||||||||||||||||||||||
| Niche loans: | ||||||||||||||||||||||||||||||||||||||
| Commercial | ||||||||||||||||||||||||||||||||||||||
| Franchise | $ | 1,118,478 | $ | 1,136,929 | $ | 1,181,761 | $ | 1,227,234 | $ | 1,176,569 | (12) | % | (5) | % | ||||||||||||||||||||||||
| Mortgage warehouse lines of credit | 297,374 | 398,085 | 261,847 | 359,818 | 468,162 | (23) | (36) | |||||||||||||||||||||||||||||||
| Community Advantage - homeowners association | 365,967 | 341,095 | 324,383 | 308,286 | 291,153 | 25 | 26 | |||||||||||||||||||||||||||||||
| Insurance agency lending | 879,183 | 906,375 | 833,720 | 813,897 | 260,482 | 11 | NM | |||||||||||||||||||||||||||||||
| Premium Finance receivables | ||||||||||||||||||||||||||||||||||||||
| U.S. property & casualty insurance | 4,983,795 | 4,781,042 | 4,271,828 | 4,178,474 | 3,921,289 | 26 | 27 | |||||||||||||||||||||||||||||||
| Canada property & casualty insurance | 729,545 | 760,405 | 665,580 | 677,013 | 695,688 | 10 | 5 | |||||||||||||||||||||||||||||||
| Life insurance | 8,004,856 | 7,608,433 | 7,354,163 | 7,042,810 | 6,655,453 | 18 | 20 | |||||||||||||||||||||||||||||||
| Consumer and other | 47,702 | 44,180 | 48,519 | 24,199 | 22,529 | NM | NM | |||||||||||||||||||||||||||||||
| Total niche loans | $ | 16,426,900 | $ | 15,976,544 | $ | 14,941,801 | $ | 14,631,731 | $ | 13,491,325 | 16 | % | 22 | % | ||||||||||||||||||||||||
| Commercial PPP loans: | ||||||||||||||||||||||||||||||||||||||
| Originated in 2020 | $ | 8,724 | $ | 18,547 | $ | 40,016 | $ | 74,412 | $ | 172,849 | NM | (95) | % | |||||||||||||||||||||||||
| Originated in 2021 | 34,934 | 63,542 | 213,948 | 483,871 | 909,139 | NM | (96) | |||||||||||||||||||||||||||||||
| Total commercial PPP loans | $ | 43,658 | $ | 82,089 | $ | 253,964 | $ | 558,283 | $ | 1,081,988 | NM | (96) | % | |||||||||||||||||||||||||
| Total loans, net of unearned income | $ | 38,167,613 | $ | 37,053,103 | $ | 35,280,547 | $ | 34,789,104 | $ | 33,264,043 | 13 | % | 15 | % | ||||||||||||||||||||||||
(1)Annualized.
(2)NM - Not meaningful.
16
TABLE 2: DEPOSIT PORTFOLIO MIX AND GROWTH RATES
| % Growth From | ||||||||||||||||||||||||||||||||||||||
| (Dollars in thousands) | Sep 30, 2022 | Jun 30, 2022 | Mar 31, 2022 | Dec 31, 2021 | Sep 30, 2021 | Jun 30, 2022 (1) | Sep 30, 2021 | |||||||||||||||||||||||||||||||
| Balance: | ||||||||||||||||||||||||||||||||||||||
| Non-interest-bearing | $ | 13,529,277 | $ | 13,855,844 | $ | 13,748,918 | $ | 14,179,980 | $ | 13,255,417 | (9) | % | 2 | % | ||||||||||||||||||||||||
| NOW and interest-bearing demand deposits | 5,676,122 | 5,918,908 | 5,089,724 | 4,646,944 | 4,255,940 | (16) | 33 | |||||||||||||||||||||||||||||||
Wealth management deposits (2) | 2,988,195 | 3,182,407 | 2,542,995 | 2,612,759 | 2,300,818 | (24) | 30 | |||||||||||||||||||||||||||||||
| Money market | 12,538,489 | 12,273,350 | 13,012,460 | 12,840,432 | 12,148,541 | 9 | 3 | |||||||||||||||||||||||||||||||
| Savings | 3,988,790 | 3,686,596 | 4,089,230 | 3,846,681 | 3,861,296 | 33 | 3 | |||||||||||||||||||||||||||||||
| Time certificates of deposit | 4,076,318 | 3,676,221 | 3,735,995 | 3,968,789 | 4,130,546 | 43 | (1) | |||||||||||||||||||||||||||||||
| Total deposits | $ | 42,797,191 | $ | 42,593,326 | $ | 42,219,322 | $ | 42,095,585 | $ | 39,952,558 | 2 | % | 7 | % | ||||||||||||||||||||||||
| Mix: | ||||||||||||||||||||||||||||||||||||||
| Non-interest-bearing | 32 | % | 33 | % | 32 | % | 34 | % | 33 | % | ||||||||||||||||||||||||||||
| NOW and interest-bearing demand deposits | 13 | 13 | 12 | 11 | 11 | |||||||||||||||||||||||||||||||||
Wealth management deposits (2) | 7 | 7 | 6 | 6 | 6 | |||||||||||||||||||||||||||||||||
| Money market | 29 | 29 | 31 | 31 | 30 | |||||||||||||||||||||||||||||||||
| Savings | 9 | 9 | 10 | 9 | 10 | |||||||||||||||||||||||||||||||||
| Time certificates of deposit | 10 | 9 | 9 | 9 | 10 | |||||||||||||||||||||||||||||||||
| Total deposits | 100 | % | 100 | % | 100 | % | 100 | % | 100 | % | ||||||||||||||||||||||||||||
(1)Annualized.
(2)Represents deposit balances of the Company’s subsidiary banks from brokerage customers of Wintrust Investments, Chicago Deferred Exchange Company, LLC (“CDEC”), trust and asset management customers of the Company.
TABLE 3: TIME CERTIFICATES OF DEPOSIT MATURITY/RE-PRICING ANALYSIS
As of September 30, 2022
| (Dollars in thousands) | Total Time Certificates of Deposit | Weighted-Average Rate of Maturing Time Certificates of Deposit (1) | ||||||||||||
| 1-3 months | $ | 1,057,147 | 1.15 | % | ||||||||||
| 4-6 months | 631,633 | 0.56 | ||||||||||||
| 7-9 months | 608,612 | 0.51 | ||||||||||||
| 10-12 months | 674,541 | 1.01 | ||||||||||||
| 13-18 months | 686,225 | 1.26 | ||||||||||||
| 19-24 months | 164,543 | 0.81 | ||||||||||||
| 24+ months | 253,617 | 1.81 | ||||||||||||
| Total | $ | 4,076,318 | 0.99 | % | ||||||||||
(1)Weighted-average rate excludes the impact of purchase accounting fair value adjustments.
17
TABLE 4: QUARTERLY AVERAGE BALANCES
| Average Balance for three months ended, | ||||||||||||||||||||||||||||||||
| Sep 30, | Jun 30, | Mar 31, | Dec 31, | Sep 30, | ||||||||||||||||||||||||||||
| (In thousands) | 2022 | 2022 | 2022 | 2021 | 2021 | |||||||||||||||||||||||||||
Interest-bearing deposits with banks, securities purchased under resale agreements and cash equivalents (1) | $ | 3,039,907 | $ | 3,265,607 | $ | 4,563,726 | $ | 6,148,165 | $ | 5,112,720 | ||||||||||||||||||||||
Investment securities (2) | 6,655,215 | 6,589,947 | 6,378,022 | 5,317,351 | 5,065,593 | |||||||||||||||||||||||||||
| FHLB and FRB stock | 142,304 | 136,930 | 135,912 | 135,414 | 136,001 | |||||||||||||||||||||||||||
Liquidity management assets (3) | 9,837,426 | 9,992,484 | 11,077,660 | 11,600,930 | 10,314,314 | |||||||||||||||||||||||||||
Other earning assets (3)(4) | 21,805 | 24,059 | 25,192 | 28,298 | 28,238 | |||||||||||||||||||||||||||
| Mortgage loans held-for-sale | 455,342 | 560,707 | 664,019 | 827,672 | 871,824 | |||||||||||||||||||||||||||
Loans, net of unearned income (3)(5) | 37,431,126 | 35,860,329 | 34,830,520 | 33,677,777 | 32,985,445 | |||||||||||||||||||||||||||
Total earning assets (3) | 47,745,699 | 46,437,579 | 46,597,391 | 46,134,677 | 44,199,821 | |||||||||||||||||||||||||||
| Allowance for loan and investment security losses | (260,270) | (260,547) | (253,080) | (254,874) | (269,963) | |||||||||||||||||||||||||||
| Cash and due from banks | 458,263 | 476,741 | 481,634 | 468,331 | 425,000 | |||||||||||||||||||||||||||
| Other assets | 2,779,002 | 2,699,653 | 2,675,899 | 2,770,643 | 2,837,652 | |||||||||||||||||||||||||||
Total assets | $ | 50,722,694 | $ | 49,353,426 | $ | 49,501,844 | $ | 49,118,777 | $ | 47,192,510 | ||||||||||||||||||||||
| NOW and interest-bearing demand deposits | $ | 5,789,368 | $ | 5,230,702 | $ | 4,788,272 | $ | 4,439,242 | $ | 4,147,436 | ||||||||||||||||||||||
| Wealth management deposits | 3,078,764 | 2,835,267 | 2,505,800 | 2,646,879 | 2,353,721 | |||||||||||||||||||||||||||
| Money market accounts | 12,037,412 | 11,892,948 | 12,773,805 | 12,665,167 | 11,956,346 | |||||||||||||||||||||||||||
| Savings accounts | 3,862,579 | 3,882,856 | 3,904,299 | 3,766,037 | 3,851,523 | |||||||||||||||||||||||||||
| Time deposits | 3,675,930 | 3,687,778 | 3,861,371 | 4,058,282 | 4,236,317 | |||||||||||||||||||||||||||
| Interest-bearing deposits | 28,444,053 | 27,529,551 | 27,833,547 | 27,575,607 | 26,545,343 | |||||||||||||||||||||||||||
| Federal Home Loan Bank advances | 1,403,573 | 1,197,390 | 1,241,071 | 1,241,073 | 1,241,073 | |||||||||||||||||||||||||||
| Other borrowings | 478,909 | 489,779 | 494,267 | 501,933 | 512,785 | |||||||||||||||||||||||||||
| Subordinated notes | 437,191 | 437,084 | 436,966 | 436,861 | 436,746 | |||||||||||||||||||||||||||
| Junior subordinated debentures | 253,566 | 253,566 | 253,566 | 253,566 | 253,566 | |||||||||||||||||||||||||||
Total interest-bearing liabilities | 31,017,292 | 29,907,370 | 30,259,417 | 30,009,040 | 28,989,513 | |||||||||||||||||||||||||||
| Non-interest-bearing deposits | 13,731,219 | 13,805,128 | 13,734,064 | 13,640,270 | 12,834,084 | |||||||||||||||||||||||||||
| Other liabilities | 1,178,796 | 1,114,818 | 1,007,903 | 1,035,514 | 1,024,998 | |||||||||||||||||||||||||||
| Equity | 4,795,387 | 4,526,110 | 4,500,460 | 4,433,953 | 4,343,915 | |||||||||||||||||||||||||||
Total liabilities and shareholders’ equity | $ | 50,722,694 | $ | 49,353,426 | $ | 49,501,844 | $ | 49,118,777 | $ | 47,192,510 | ||||||||||||||||||||||
Net free funds/contribution (6) | $ | 16,728,407 | $ | 16,530,209 | $ | 16,337,974 | $ | 16,125,637 | $ | 15,210,308 | ||||||||||||||||||||||
(1)Includes interest-bearing deposits from banks and securities purchased under resale agreements with original maturities of greater than three months. Cash equivalents include federal funds sold and securities purchased under resale agreements with original maturities of three months or less.
(2)Investment securities includes investment securities classified as available-for-sale and held-to-maturity, and equity securities with readily determinable fair values. Equity securities without readily determinable fair values are included within other assets.
(3)See “Supplemental Non-GAAP Financial Measures/Ratios” at Table 18 for additional information on this performance measure/ratio.
(4)Other earning assets include brokerage customer receivables and trading account securities.
(5)Loans, net of unearned income, include non-accrual loans.
(6)Net free funds are the difference between total average earning assets and total average interest-bearing liabilities. The estimated contribution to net interest margin from net free funds is calculated using the rate paid for total interest-bearing liabilities.
18
TABLE 5: QUARTERLY NET INTEREST INCOME
| Net Interest Income for three months ended, | ||||||||||||||||||||||||||||||||
| Sep 30, | Jun 30, | Mar 31, | Dec 31, | Sep 30, | ||||||||||||||||||||||||||||
| (In thousands) | 2022 | 2022 | 2022 | 2021 | 2021 | |||||||||||||||||||||||||||
| Interest income: | ||||||||||||||||||||||||||||||||
| Interest-bearing deposits with banks, securities purchased under resale agreements and cash equivalents | $ | 17,466 | $ | 7,154 | $ | 2,118 | $ | 2,427 | $ | 2,000 | ||||||||||||||||||||||
| Investment securities | 39,071 | 37,013 | 32,863 | 27,696 | 25,681 | |||||||||||||||||||||||||||
| FHLB and FRB stock | 2,109 | 1,823 | 1,772 | 1,776 | 1,777 | |||||||||||||||||||||||||||
Liquidity management assets (1) | 58,646 | 45,990 | 36,753 | 31,899 | 29,458 | |||||||||||||||||||||||||||
Other earning assets (1) | 275 | 210 | 181 | 194 | 188 | |||||||||||||||||||||||||||
| Mortgage loans held-for-sale | 5,371 | 5,740 | 6,087 | 7,234 | 7,716 | |||||||||||||||||||||||||||
Loans, net of unearned income (1) | 403,719 | 321,069 | 286,125 | 289,557 | 285,998 | |||||||||||||||||||||||||||
| Total interest income | $ | 468,011 | $ | 373,009 | $ | 329,146 | $ | 328,884 | $ | 323,360 | ||||||||||||||||||||||
| Interest expense: | ||||||||||||||||||||||||||||||||
| NOW and interest-bearing demand deposits | $ | 8,041 | $ | 2,553 | $ | 1,990 | $ | 1,913 | $ | 1,916 | ||||||||||||||||||||||
| Wealth management deposits | 11,068 | 3,685 | 918 | 1,402 | 1,176 | |||||||||||||||||||||||||||
| Money market accounts | 18,916 | 8,559 | 7,648 | 7,658 | 7,905 | |||||||||||||||||||||||||||
| Savings accounts | 2,130 | 347 | 336 | 345 | 406 | |||||||||||||||||||||||||||
| Time deposits | 5,761 | 3,841 | 3,962 | 5,254 | 7,902 | |||||||||||||||||||||||||||
| Interest-bearing deposits | 45,916 | 18,985 | 14,854 | 16,572 | 19,305 | |||||||||||||||||||||||||||
| Federal Home Loan Bank advances | 6,812 | 4,878 | 4,816 | 4,923 | 4,931 | |||||||||||||||||||||||||||
| Other borrowings | 4,008 | 2,734 | 2,239 | 2,250 | 2,501 | |||||||||||||||||||||||||||
| Subordinated notes | 5,485 | 5,517 | 5,482 | 5,514 | 5,480 | |||||||||||||||||||||||||||
| Junior subordinated debentures | 2,809 | 2,050 | 1,567 | 2,744 | 2,744 | |||||||||||||||||||||||||||
| Total interest expense | $ | 65,030 | $ | 34,164 | $ | 28,958 | $ | 32,003 | $ | 34,961 | ||||||||||||||||||||||
| Less: Fully taxable-equivalent adjustment | (1,533) | (1,041) | (894) | (905) | (903) | |||||||||||||||||||||||||||
Net interest income (GAAP) (2) | 401,448 | 337,804 | 299,294 | 295,976 | 287,496 | |||||||||||||||||||||||||||
| Fully taxable-equivalent adjustment | 1,533 | 1,041 | 894 | 905 | 903 | |||||||||||||||||||||||||||
Net interest income, fully taxable-equivalent (non-GAAP) (2) | $ | 402,981 | $ | 338,845 | $ | 300,188 | $ | 296,881 | $ | 288,399 | ||||||||||||||||||||||
(1)Interest income on tax-advantaged loans, trading securities and investment securities reflects a taxable-equivalent adjustment based on the marginal federal corporate tax rate in effect as of the applicable period.
(2)See “Supplemental Non-GAAP Financial Measures/Ratios” at Table 18 for additional information on this performance measure/ratio.
19
TABLE 6: QUARTERLY NET INTEREST MARGIN
| Net Interest Margin for three months ended, | ||||||||||||||||||||||||||||||||
| Sep 30, 2022 | Jun 30, 2022 | Mar 31, 2022 | Dec 31, 2021 | Sep 30, 2021 | ||||||||||||||||||||||||||||
| Yield earned on: | ||||||||||||||||||||||||||||||||
| Interest-bearing deposits with banks, securities purchased under resale agreements and cash equivalents | 2.28 | % | 0.88 | % | 0.19 | % | 0.16 | % | 0.16 | % | ||||||||||||||||||||||
| Investment securities | 2.33 | 2.25 | 2.09 | 2.07 | 2.01 | |||||||||||||||||||||||||||
| FHLB and FRB stock | 5.88 | 5.34 | 5.29 | 5.20 | 5.18 | |||||||||||||||||||||||||||
| Liquidity management assets | 2.37 | 1.85 | 1.35 | 1.09 | 1.13 | |||||||||||||||||||||||||||
| Other earning assets | 5.01 | 3.49 | 2.91 | 2.71 | 2.64 | |||||||||||||||||||||||||||
| Mortgage loans held-for-sale | 4.68 | 4.11 | 3.72 | 3.47 | 3.51 | |||||||||||||||||||||||||||
| Loans, net of unearned income | 4.28 | 3.59 | 3.33 | 3.41 | 3.44 | |||||||||||||||||||||||||||
| Total earning assets | 3.89 | % | 3.22 | % | 2.86 | % | 2.83 | % | 2.90 | % | ||||||||||||||||||||||
| Rate paid on: | ||||||||||||||||||||||||||||||||
| NOW and interest-bearing demand deposits | 0.55 | % | 0.20 | % | 0.17 | % | 0.17 | % | 0.18 | % | ||||||||||||||||||||||
| Wealth management deposits | 1.43 | 0.52 | 0.15 | 0.21 | 0.20 | |||||||||||||||||||||||||||
| Money market accounts | 0.62 | 0.29 | 0.24 | 0.24 | 0.26 | |||||||||||||||||||||||||||
| Savings accounts | 0.22 | 0.04 | 0.03 | 0.04 | 0.04 | |||||||||||||||||||||||||||
| Time deposits | 0.62 | 0.42 | 0.42 | 0.51 | 0.74 | |||||||||||||||||||||||||||
| Interest-bearing deposits | 0.64 | 0.28 | 0.22 | 0.24 | 0.29 | |||||||||||||||||||||||||||
| Federal Home Loan Bank advances | 1.93 | 1.63 | 1.57 | 1.57 | 1.58 | |||||||||||||||||||||||||||
| Other borrowings | 3.32 | 2.24 | 1.84 | 1.78 | 1.94 | |||||||||||||||||||||||||||
| Subordinated notes | 5.02 | 5.05 | 5.02 | 5.05 | 5.02 | |||||||||||||||||||||||||||
| Junior subordinated debentures | 4.33 | 3.20 | 2.47 | 4.23 | 4.23 | |||||||||||||||||||||||||||
| Total interest-bearing liabilities | 0.83 | % | 0.46 | % | 0.39 | % | 0.42 | % | 0.48 | % | ||||||||||||||||||||||
Interest rate spread (1)(2) | 3.06 | % | 2.76 | % | 2.47 | % | 2.41 | % | 2.42 | % | ||||||||||||||||||||||
| Less: Fully taxable-equivalent adjustment | (0.01) | (0.01) | (0.01) | (0.01) | (0.01) | |||||||||||||||||||||||||||
Net free funds/contribution (3) | 0.29 | 0.17 | 0.14 | 0.14 | 0.17 | |||||||||||||||||||||||||||
Net interest margin (GAAP) (2) | 3.34 | % | 2.92 | % | 2.60 | % | 2.54 | % | 2.58 | % | ||||||||||||||||||||||
| Fully taxable-equivalent adjustment | 0.01 | 0.01 | 0.01 | 0.01 | 0.01 | |||||||||||||||||||||||||||
Net interest margin, fully taxable-equivalent (non-GAAP) (2) | 3.35 | % | 2.93 | % | 2.61 | % | 2.55 | % | 2.59 | % | ||||||||||||||||||||||
(1)Interest rate spread is the difference between the yield earned on earning assets and the rate paid on interest-bearing liabilities.
(2)See “Supplemental Non-GAAP Financial Measures/Ratios” at Table 18 for additional information on this performance measure/ratio.
(3)Net free funds are the difference between total average earning assets and total average interest-bearing liabilities. The estimated contribution to net interest margin from net free funds is calculated using the rate paid for total interest-bearing liabilities.
20
TABLE 7: YEAR-TO-DATE AVERAGE BALANCES, AND NET INTEREST INCOME AND MARGIN
Average Balance for nine months ended, | Interest for nine months ended, | Yield/Rate for nine months ended, | |||||||||||||||||||||||||||
| (Dollars in thousands) | Sep 30, 2022 | Sep 30, 2021 | Sep 30, 2022 | Sep 30, 2021 | Sep 30, 2022 | Sep 30, 2021 | |||||||||||||||||||||||
Interest-bearing deposits with banks, securities purchased under resale agreements and cash equivalents (1) | $ | 3,617,498 | $ | 4,399,217 | $ | 26,738 | $ | 4,352 | 0.99 | % | 0.13 | % | |||||||||||||||||
Investment securities (2) | 6,542,077 | 4,597,997 | 108,947 | 69,562 | 2.23 | 2.02 | |||||||||||||||||||||||
| FHLB and FRB stock | 138,405 | 136,028 | 5,704 | 5,291 | 5.51 | 5.20 | |||||||||||||||||||||||
Liquidity management assets (3)(4) | $ | 10,297,980 | $ | 9,133,242 | $ | 141,389 | $ | 79,205 | 1.84 | % | 1.16 | % | |||||||||||||||||
Other earning assets (3)(4)(5) | 23,673 | 24,016 | 666 | 463 | 3.76 | 2.59 | |||||||||||||||||||||||
| Mortgage loans held-for-sale | 559,258 | 1,003,868 | 17,198 | 24,935 | 4.11 | 3.32 | |||||||||||||||||||||||
Loans, net of unearned income (3)(4)(6) | 36,050,185 | 32,839,837 | 1,010,913 | 845,598 | 3.75 | 3.44 | |||||||||||||||||||||||
Total earning assets (4) | $ | 46,931,096 | $ | 43,000,963 | $ | 1,170,166 | $ | 950,201 | 3.33 | % | 2.95 | % | |||||||||||||||||
| Allowance for loan and investment security losses | (257,992) | (294,033) | |||||||||||||||||||||||||||
| Cash and due from banks | 472,127 | 420,874 | |||||||||||||||||||||||||||
| Other assets | 2,718,562 | 2,922,933 | |||||||||||||||||||||||||||
Total assets | $ | 49,863,793 | $ | 46,050,737 | |||||||||||||||||||||||||
| NOW and interest-bearing demand deposits | $ | 5,273,115 | $ | 3,891,634 | $ | 12,584 | $ | 5,826 | 0.32 | % | 0.20 | % | |||||||||||||||||
| Wealth management deposits | 2,808,709 | 2,265,212 | 15,671 | 3,133 | 0.75 | 0.18 | |||||||||||||||||||||||
| Money market accounts | 12,232,024 | 11,510,832 | 35,123 | 24,372 | 0.38 | 0.28 | |||||||||||||||||||||||
| Savings accounts | 3,883,092 | 3,723,420 | 2,813 | 1,238 | 0.10 | 0.04 | |||||||||||||||||||||||
| Time deposits | 3,741,014 | 4,579,161 | 13,564 | 36,978 | 0.48 | 1.08 | |||||||||||||||||||||||
| Interest-bearing deposits | $ | 27,937,954 | $ | 25,970,259 | $ | 79,755 | $ | 71,547 | 0.38 | % | 0.37 | % | |||||||||||||||||
| Federal Home Loan Bank advances | 1,281,273 | 1,234,929 | 16,506 | 14,658 | 1.72 | 1.59 | |||||||||||||||||||||||
| Other borrowings | 487,595 | 518,946 | 8,981 | 7,678 | 2.46 | 1.98 | |||||||||||||||||||||||
| Subordinated notes | 437,081 | 436,641 | 16,484 | 16,469 | 5.03 | 5.03 | |||||||||||||||||||||||
| Junior subordinated debentures | 253,566 | 253,566 | 6,426 | 8,172 | 3.34 | 4.25 | |||||||||||||||||||||||
Total interest-bearing liabilities | $ | 30,397,469 | $ | 28,414,341 | $ | 128,152 | $ | 118,524 | 0.56 | % | 0.56 | % | |||||||||||||||||
| Non-interest-bearing deposits | 13,756,793 | 12,300,931 | |||||||||||||||||||||||||||
| Other liabilities | 1,101,132 | 1,079,614 | |||||||||||||||||||||||||||
| Equity | 4,608,399 | 4,255,851 | |||||||||||||||||||||||||||
Total liabilities and shareholders’ equity | $ | 49,863,793 | $ | 46,050,737 | |||||||||||||||||||||||||
Interest rate spread (4)(7) | 2.77 | % | 2.39 | % | |||||||||||||||||||||||||
| Less: Fully taxable-equivalent adjustment | (3,468) | (2,696) | (0.01) | (0.01) | |||||||||||||||||||||||||
Net free funds/contribution (8) | $ | 16,533,627 | $ | 14,586,622 | 0.20 | 0.20 | |||||||||||||||||||||||
Net interest income/margin (GAAP) (4) | $ | 1,038,546 | $ | 828,981 | 2.96 | % | 2.58 | % | |||||||||||||||||||||
| Fully taxable-equivalent adjustment | 3,468 | 2,696 | 0.01 | 0.01 | |||||||||||||||||||||||||
Net interest income/margin, fully taxable-equivalent (non-GAAP) (4) | $ | 1,042,014 | $ | 831,677 | 2.97 | % | 2.59 | % | |||||||||||||||||||||
(1)Includes interest-bearing deposits from banks and securities purchased under resale agreements with original maturities of greater than three months. Cash equivalents include federal funds sold and securities purchased under resale agreements with original maturities of three months or less.
(2)Investment securities includes investment securities classified as available-for-sale and held-to-maturity, and equity securities with readily determinable fair values. Equity securities without readily determinable fair values are included within other assets.
(3)Interest income on tax-advantaged loans, trading securities and investment securities reflects a taxable-equivalent adjustment based on the marginal federal corporate tax rate in effect as of the applicable period.
(4)See “Supplemental Non-GAAP Financial Measures/Ratios” at Table 18 for additional information on this performance measure/ratio.
(5)Other earning assets include brokerage customer receivables and trading account securities.
(6)Loans, net of unearned income, include non-accrual loans.
(7)Interest rate spread is the difference between the yield earned on earning assets and the rate paid on interest-bearing liabilities.
(8)Net free funds are the difference between total average earning assets and total average interest-bearing liabilities. The estimated contribution to net interest margin from net free funds is calculated using the rate paid for total interest-bearing liabilities.
21
TABLE 8: INTEREST RATE SENSITIVITY
As an ongoing part of its financial strategy, the Company attempts to manage the impact of fluctuations in market interest rates on net interest income. Management measures its exposure to changes in interest rates by modeling many different interest rate scenarios.
The following interest rate scenarios display the percentage change in net interest income over a one-year time horizon assuming increases of 100 and 200 basis points and a decrease of 100 basis points. The Static Shock Scenario results incorporate actual cash flows and repricing characteristics for balance sheet instruments following an instantaneous, parallel change in market rates based upon a static (i.e. no growth or constant) balance sheet. Conversely, the Ramp Scenario results incorporate management’s projections of future volume and pricing of each of the product lines following a gradual, parallel change in market rates over twelve months. Actual results may differ from these simulated results due to timing, magnitude, and frequency of interest rate changes as well as changes in market conditions and management strategies. The interest rate sensitivity for both the Static Shock and Ramp Scenario is as follows:
| Static Shock Scenario | +200 Basis Points | +100 Basis Points | -100 Basis Points | |||||||||||||||||
| Sep 30, 2022 | 12.9 | % | 7.1 | % | (8.7) | % | ||||||||||||||
| Jun 30, 2022 | 17.0 | 9.0 | (12.6) | |||||||||||||||||
| Mar 31, 2022 | 21.4 | 11.0 | (11.3) | |||||||||||||||||
| Dec 31, 2021 | 25.3 | 12.4 | (8.5) | |||||||||||||||||
| Sep 30, 2021 | 24.3 | 11.5 | (7.8) | |||||||||||||||||
| Ramp Scenario | +200 Basis Points | +100 Basis Points | -100 Basis Points | ||||||||||||||
| Sep 30, 2022 | 6.5 | % | 3.6 | % | (3.9) | % | |||||||||||
| Jun 30, 2022 | 10.2 | 5.3 | (6.9) | ||||||||||||||
| Mar 31, 2022 | 11.2 | 5.8 | (7.1) | ||||||||||||||
| Dec 31, 2021 | 13.9 | 6.9 | (5.6) | ||||||||||||||
| Sep 30, 2021 | 10.8 | 5.4 | (3.8) | ||||||||||||||
22
TABLE 9: MATURITIES AND SENSITIVITIES TO CHANGES IN INTEREST RATES
| Loans repricing or maturity period | |||||||||||||||||||||||||||||
| As of September 30, 2022 | One year or less | From one to five years | From five to fifteen years | After fifteen years | Total | ||||||||||||||||||||||||
| (In thousands) | |||||||||||||||||||||||||||||
| Commercial | |||||||||||||||||||||||||||||
| Fixed rate | $ | 469,049 | $ | 2,301,483 | $ | 1,516,860 | $ | 15,458 | $ | 4,302,850 | |||||||||||||||||||
| Fixed rate - PPP | — | 43,658 | — | — | 43,658 | ||||||||||||||||||||||||
| Variable rate | 7,909,538 | 3,153 | 51 | — | 7,912,742 | ||||||||||||||||||||||||
| Total commercial | $ | 8,378,587 | $ | 2,348,294 | $ | 1,516,911 | $ | 15,458 | $ | 12,259,250 | |||||||||||||||||||
| Commercial real estate | |||||||||||||||||||||||||||||
| Fixed rate | 428,391 | 2,595,594 | 580,355 | 41,737 | 3,646,077 | ||||||||||||||||||||||||
| Variable rate | 5,905,174 | 26,933 | — | — | 5,932,107 | ||||||||||||||||||||||||
| Total commercial real estate | $ | 6,333,565 | $ | 2,622,527 | $ | 580,355 | $ | 41,737 | $ | 9,578,184 | |||||||||||||||||||
| Home equity | |||||||||||||||||||||||||||||
| Fixed rate | 12,768 | 3,278 | 13,250 | 37 | 29,333 | ||||||||||||||||||||||||
| Variable rate | 299,489 | — | — | — | 299,489 | ||||||||||||||||||||||||
| Total home equity | $ | 312,257 | $ | 3,278 | $ | 13,250 | $ | 37 | $ | 328,822 | |||||||||||||||||||
| Residential real estate | |||||||||||||||||||||||||||||
| Fixed rate | 13,424 | 4,647 | 30,725 | 1,024,557 | 1,073,353 | ||||||||||||||||||||||||
| Variable rate | 58,622 | 223,238 | 880,246 | — | 1,162,106 | ||||||||||||||||||||||||
| Total residential real estate | $ | 72,046 | $ | 227,885 | $ | 910,971 | $ | 1,024,557 | $ | 2,235,459 | |||||||||||||||||||
| Premium finance receivables - property & casualty | |||||||||||||||||||||||||||||
| Fixed rate | 5,535,087 | 178,253 | — | — | 5,713,340 | ||||||||||||||||||||||||
| Variable rate | — | — | — | — | — | ||||||||||||||||||||||||
| Total premium finance receivables - property & casualty | $ | 5,535,087 | $ | 178,253 | $ | — | $ | — | $ | 5,713,340 | |||||||||||||||||||
| Premium finance receivables - life insurance | |||||||||||||||||||||||||||||
| Fixed rate | 25,766 | 511,333 | 22,271 | — | 559,370 | ||||||||||||||||||||||||
| Variable rate | 7,445,486 | — | — | — | 7,445,486 | ||||||||||||||||||||||||
| Total premium finance receivables - life insurance | $ | 7,471,252 | $ | 511,333 | $ | 22,271 | $ | — | $ | 8,004,856 | |||||||||||||||||||
| Consumer and other | |||||||||||||||||||||||||||||
| Fixed rate | 8,424 | 5,017 | 12 | 486 | 13,939 | ||||||||||||||||||||||||
| Variable rate | 33,763 | — | — | — | 33,763 | ||||||||||||||||||||||||
| Total consumer and other | $ | 42,187 | $ | 5,017 | $ | 12 | $ | 486 | $ | 47,702 | |||||||||||||||||||
| Total per category | |||||||||||||||||||||||||||||
| Fixed rate | 6,492,909 | 5,599,605 | 2,163,473 | 1,082,275 | 15,338,262 | ||||||||||||||||||||||||
| Fixed rate - PPP | — | 43,658 | — | — | 43,658 | ||||||||||||||||||||||||
| Variable rate | 21,652,072 | 253,324 | 880,297 | — | 22,785,693 | ||||||||||||||||||||||||
| Total loans, net of unearned income | $ | 28,144,981 | $ | 5,896,587 | $ | 3,043,770 | $ | 1,082,275 | $ | 38,167,613 | |||||||||||||||||||
| Variable Rate Loan Pricing by Index: | |||||||||||||||||||||||||||||
| Prime | $ | 3,971,147 | |||||||||||||||||||||||||||
| One- month LIBOR | 5,057,295 | ||||||||||||||||||||||||||||
| Three- month LIBOR | 197,233 | ||||||||||||||||||||||||||||
| Twelve- month LIBOR | 5,701,876 | ||||||||||||||||||||||||||||
| One- year CMT | 1,578,086 | ||||||||||||||||||||||||||||
| Other U.S. Treasury tenors | 142,857 | ||||||||||||||||||||||||||||
| SOFR tenors | 5,385,527 | ||||||||||||||||||||||||||||
| Ameribor tenors | 334,478 | ||||||||||||||||||||||||||||
| BSBY tenors | 38,138 | ||||||||||||||||||||||||||||
| Other | 379,056 | ||||||||||||||||||||||||||||
| Total variable rate | $ | 22,785,693 | |||||||||||||||||||||||||||
LIBOR - London Interbank Offered Rate.
SOFR - Secured Overnight Financing Rate.
CMT - Constant Maturity Treasury Rate.
Ameribor - American Interbank Offered Rate.
BSBY - Bloomberg Short Term Bank Yield Index.
23
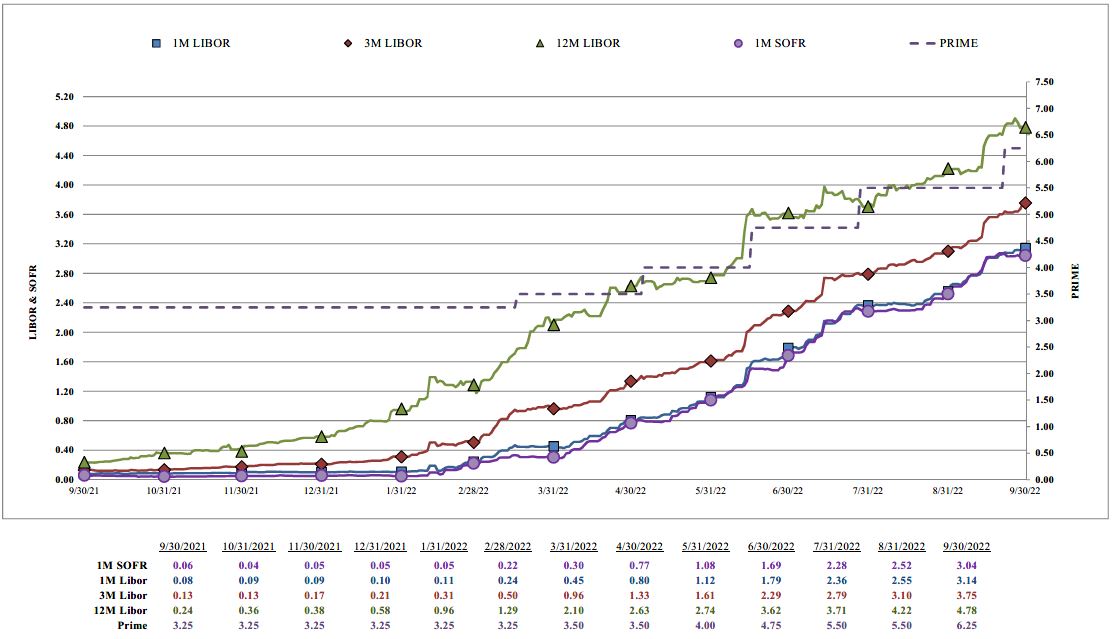
Source: Bloomberg
As noted in the table on the previous page, the majority of the Company’s portfolio is tied to LIBOR and SOFR indices which, as shown in the table above, do not mirror the same changes as the Prime rate which has historically moved when the Federal Reserve raises or lowers interest rates. Specifically, the Company has variable rate loans of $5.1 billion tied to one-month LIBOR, $5.7 billion tied to twelve-month LIBOR and $4.6 billion tied to one-month SOFR. The above chart shows:
| Basis Point (bp) Change in | |||||||||||||||||||||||||||||
| Prime | 1-month LIBOR | 12-month LIBOR | 1-month SOFR | ||||||||||||||||||||||||||
| Third Quarter 2022 | 150 | bps | 135 | bps | 116 | bps | 135 | bps | |||||||||||||||||||||
| Second Quarter 2022 | 125 | 134 | 152 | 139 | |||||||||||||||||||||||||
| First Quarter 2022 | 25 | 35 | 152 | 25 | |||||||||||||||||||||||||
| Fourth Quarter 2021 | 0 | 2 | 34 | -1 | |||||||||||||||||||||||||
| Third Quarter 2021 | 0 | -2 | -1 | 1 | |||||||||||||||||||||||||
24
TABLE 10: ALLOWANCE FOR CREDIT LOSSES
| Three Months Ended | Nine Months Ended | ||||||||||||||||||||||||||||||||||||||||
| Sep 30, | Jun 30, | Mar 31, | Dec 31, | Sep 30, | Sep 30, | Sep 30, | |||||||||||||||||||||||||||||||||||
| (Dollars in thousands) | 2022 | 2022 | 2022 | 2021 | 2021 | 2022 | 2021 | ||||||||||||||||||||||||||||||||||
| Allowance for credit losses at beginning of period | $ | 312,192 | $ | 301,327 | $ | 299,731 | $ | 296,138 | $ | 304,121 | $ | 299,731 | $ | 379,969 | |||||||||||||||||||||||||||
| Provision for credit losses | 6,420 | 20,417 | 4,106 | 9,299 | (7,916) | 30,943 | (68,562) | ||||||||||||||||||||||||||||||||||
Initial allowance for credit losses recognized on PCD assets acquired during the period (1) | — | — | — | 470 | — | — | — | ||||||||||||||||||||||||||||||||||
| Other adjustments | (105) | (56) | 22 | 5 | (65) | (139) | — | ||||||||||||||||||||||||||||||||||
| Charge-offs: | |||||||||||||||||||||||||||||||||||||||||
| Commercial | 780 | 8,928 | 1,414 | 4,431 | 1,352 | 11,122 | 16,370 | ||||||||||||||||||||||||||||||||||
| Commercial real estate | 24 | 40 | 777 | 495 | 406 | 841 | 2,798 | ||||||||||||||||||||||||||||||||||
| Home equity | 43 | 192 | 197 | 135 | 59 | 432 | 201 | ||||||||||||||||||||||||||||||||||
| Residential real estate | 5 | — | 466 | 1,067 | 10 | 471 | 15 | ||||||||||||||||||||||||||||||||||
| Premium finance receivables - property & casualty | 6,037 | 2,903 | 1,671 | 2,314 | 1,390 | 10,611 | 6,706 | ||||||||||||||||||||||||||||||||||
| Premium finance receivables - life insurance | — | — | 7 | — | — | 7 | — | ||||||||||||||||||||||||||||||||||
| Consumer and other | 635 | 253 | 193 | 157 | 112 | 1,081 | 330 | ||||||||||||||||||||||||||||||||||
| Total charge-offs | 7,524 | 12,316 | 4,725 | 8,599 | 3,329 | 24,565 | 26,420 | ||||||||||||||||||||||||||||||||||
| Recoveries: | |||||||||||||||||||||||||||||||||||||||||
| Commercial | 2,523 | 996 | 538 | 389 | 816 | 4,057 | 2,170 | ||||||||||||||||||||||||||||||||||
| Commercial real estate | 55 | 553 | 32 | 217 | 373 | 640 | 1,087 | ||||||||||||||||||||||||||||||||||
| Home equity | 38 | 123 | 93 | 461 | 313 | 254 | 742 | ||||||||||||||||||||||||||||||||||
| Residential real estate | 60 | 6 | 5 | 85 | 5 | 71 | 245 | ||||||||||||||||||||||||||||||||||
| Premium finance receivables - property & casualty | 1,648 | 1,119 | 1,476 | 1,240 | 1,728 | 4,243 | 6,749 | ||||||||||||||||||||||||||||||||||
| Premium finance receivables - life insurance | — | — | — | — | — | — | — | ||||||||||||||||||||||||||||||||||
| Consumer and other | 31 | 23 | 49 | 26 | 92 | 103 | 158 | ||||||||||||||||||||||||||||||||||
| Total recoveries | 4,355 | 2,820 | 2,193 | 2,418 | 3,327 | 9,368 | 11,151 | ||||||||||||||||||||||||||||||||||
| Net charge-offs | (3,169) | (9,496) | (2,532) | (6,181) | (2) | (15,197) | (15,269) | ||||||||||||||||||||||||||||||||||
| Allowance for credit losses at period end | $ | 315,338 | $ | 312,192 | $ | 301,327 | $ | 299,731 | $ | 296,138 | $ | 315,338 | $ | 296,138 | |||||||||||||||||||||||||||
| Annualized net charge-offs (recoveries) by category as a percentage of its own respective category’s average: | |||||||||||||||||||||||||||||||||||||||||
| Commercial | (0.06) | % | 0.27 | % | 0.03 | % | 0.14 | % | 0.02 | % | 0.08 | % | 0.16 | % | |||||||||||||||||||||||||||
| Commercial real estate | 0.00 | (0.02) | 0.03 | 0.01 | 0.00 | 0.00 | 0.03 | ||||||||||||||||||||||||||||||||||
| Home equity | 0.01 | 0.09 | 0.13 | (0.38) | (0.28) | 0.07 | (0.19) | ||||||||||||||||||||||||||||||||||
| Residential real estate | (0.01) | 0.00 | 0.11 | 0.25 | 0.00 | 0.03 | (0.02) | ||||||||||||||||||||||||||||||||||
| Premium finance receivables - property & casualty | 0.30 | 0.14 | 0.02 | 0.09 | (0.03) | 0.16 | 0.00 | ||||||||||||||||||||||||||||||||||
| Premium finance receivables - life insurance | — | — | 0.00 | — | — | 0.00 | — | ||||||||||||||||||||||||||||||||||
| Consumer and other | 4.02 | 1.31 | 1.19 | 0.95 | 0.26 | 2.19 | 0.54 | ||||||||||||||||||||||||||||||||||
| Total loans, net of unearned income | 0.03 | % | 0.11 | % | 0.03 | % | 0.07 | % | 0.00 | % | 0.06 | % | 0.06 | % | |||||||||||||||||||||||||||
| Loans at period end | $ | 38,167,613 | $ | 37,053,103 | $ | 35,280,547 | $ | 34,789,104 | $ | 33,264,043 | |||||||||||||||||||||||||||||||
| Allowance for loan losses as a percentage of loans at period end | 0.64 | % | 0.68 | % | 0.71 | % | 0.71 | % | 0.75 | % | |||||||||||||||||||||||||||||||
| Allowance for loan and unfunded lending-related commitment losses as a percentage of loans at period end | 0.83 | 0.84 | 0.85 | 0.86 | 0.89 | ||||||||||||||||||||||||||||||||||||
| Allowance for loan and unfunded lending-related commitment losses as a percentage of loans at period end, excluding PPP loans | 0.83 | 0.84 | 0.86 | 0.88 | 0.92 | ||||||||||||||||||||||||||||||||||||
(1)The initial allowance for credit losses on purchased credit deteriorated (“PCD”) loans acquired during the period measured approximately $2.8 million, of which approximately $2.3 million was charged-off related to PCD loans that met the Company’s charge-off policy at the time of acquisition. After considering these loans that were immediately charged-off, the net impact of PCD allowance for credit losses at the acquisition date was approximately $470,000.
25
TABLE 11: ALLOWANCE AND PROVISION FOR CREDIT LOSSES BY COMPONENT
| Three Months Ended | Nine Months Ended | ||||||||||||||||||||||||||||||||||||||||
| Sep 30, | Jun 30, | Mar 31, | Dec 31, | Sep 30, | Sep 30, | Sep 30, | |||||||||||||||||||||||||||||||||||
| (In thousands) | 2022 | 2022 | 2022 | 2021 | 2021 | 2022 | 2021 | ||||||||||||||||||||||||||||||||||
| Provision for loan losses | $ | (2,385) | $ | 10,782 | $ | 5,214 | $ | 4,929 | $ | (12,410) | $ | 13,611 | $ | (55,492) | |||||||||||||||||||||||||||
| Provision for unfunded lending-related commitments losses | 8,578 | 9,711 | (1,189) | 4,375 | 4,501 | 17,100 | (13,092) | ||||||||||||||||||||||||||||||||||
| Provision for held-to-maturity securities losses | 227 | (76) | 81 | (5) | (7) | 232 | 22 | ||||||||||||||||||||||||||||||||||
| Provision for credit losses | $ | 6,420 | $ | 20,417 | $ | 4,106 | $ | 9,299 | $ | (7,916) | $ | 30,943 | $ | (68,562) | |||||||||||||||||||||||||||
| Allowance for loan losses | $ | 246,110 | $ | 251,769 | $ | 250,539 | $ | 247,835 | $ | 248,612 | |||||||||||||||||||||||||||||||
| Allowance for unfunded lending-related commitments losses | 68,918 | 60,340 | 50,629 | 51,818 | 47,443 | ||||||||||||||||||||||||||||||||||||
| Allowance for loan losses and unfunded lending-related commitments losses | 315,028 | 312,109 | 301,168 | 299,653 | 296,055 | ||||||||||||||||||||||||||||||||||||
| Allowance for held-to-maturity securities losses | 310 | 83 | 159 | 78 | 83 | ||||||||||||||||||||||||||||||||||||
| Allowance for credit losses | $ | 315,338 | $ | 312,192 | $ | 301,327 | $ | 299,731 | $ | 296,138 | |||||||||||||||||||||||||||||||
26
TABLE 12: ALLOWANCE BY LOAN PORTFOLIO
The table below summarizes the calculation of allowance for loan losses and allowance for unfunded lending-related commitments losses for the Company’s loan portfolios as well as core and niche portfolios, as of September 30, 2022, June 30, 2022 and March 31, 2022.
| As of Sep 30, 2022 | As of Jun 30, 2022 | As of Mar 31, 2022 | |||||||||||||||||||||||||||||||||||||||||||||
| (Dollars in thousands) | Recorded Investment | Calculated Allowance | % of its category’s balance | Recorded Investment | Calculated Allowance | % of its category’s balance | Recorded Investment | Calculated Allowance | % of its category’s balance | ||||||||||||||||||||||||||||||||||||||
| Commercial: | |||||||||||||||||||||||||||||||||||||||||||||||
| Commercial, industrial and other, excluding PPP loans | $ | 12,215,592 | $ | 135,315 | 1.11 | % | $ | 11,965,016 | $ | 142,916 | 1.19 | % | $ | 11,329,999 | $ | 120,910 | 1.07 | % | |||||||||||||||||||||||||||||
| Commercial PPP loans | 43,658 | 1 | 0.00 | 82,089 | 3 | 0.00 | 253,964 | 1 | 0.00 | ||||||||||||||||||||||||||||||||||||||
| Commercial real estate: | |||||||||||||||||||||||||||||||||||||||||||||||
| Construction and development | 1,525,511 | 51,389 | 3.37 | 1,506,318 | 45,522 | 3.02 | 1,396,406 | 34,206 | 2.45 | ||||||||||||||||||||||||||||||||||||||
| Non-construction | 8,052,673 | 99,329 | 1.23 | 7,900,887 | 98,210 | 1.24 | 7,838,668 | 110,700 | 1.41 | ||||||||||||||||||||||||||||||||||||||
| Home equity | 328,822 | 7,055 | 2.15 | 325,826 | 6,990 | 2.15 | 321,435 | 10,566 | 3.29 | ||||||||||||||||||||||||||||||||||||||
| Residential real estate | 2,235,459 | 11,023 | 0.49 | 2,078,907 | 10,479 | 0.50 | 1,799,985 | 9,429 | 0.52 | ||||||||||||||||||||||||||||||||||||||
| Premium finance receivables | |||||||||||||||||||||||||||||||||||||||||||||||
| Commercial insurance loans | 5,713,340 | 9,736 | 0.17 | 5,541,447 | 6,840 | 0.12 | 4,937,408 | 14,082 | 0.29 | ||||||||||||||||||||||||||||||||||||||
| Life insurance loans | 8,004,856 | 696 | 0.01 | 7,608,433 | 662 | 0.01 | 7,354,163 | 640 | 0.01 | ||||||||||||||||||||||||||||||||||||||
| Consumer and other | 47,702 | 484 | 1.01 | 44,180 | 487 | 1.10 | 48,519 | 634 | 1.31 | ||||||||||||||||||||||||||||||||||||||
| Total loans, net of unearned income | $ | 38,167,613 | $ | 315,028 | 0.83 | % | $ | 37,053,103 | $ | 312,109 | 0.84 | % | $ | 35,280,547 | $ | 301,168 | 0.85 | % | |||||||||||||||||||||||||||||
| Total loans, net of unearned income, excluding PPP loans | $ | 38,123,955 | $ | 315,027 | 0.83 | % | $ | 36,971,014 | $ | 312,106 | 0.84 | % | $ | 35,026,583 | $ | 301,167 | 0.86 | % | |||||||||||||||||||||||||||||
Total core loans (1) | $ | 21,697,055 | $ | 273,947 | 1.26 | % | $ | 20,994,470 | $ | 275,188 | 1.31 | % | $ | 20,084,782 | $ | 262,447 | 1.31 | % | |||||||||||||||||||||||||||||
Total niche loans (1) | 16,426,900 | 41,080 | 0.25 | 15,976,544 | 36,918 | 0.23 | 14,941,801 | 38,720 | 0.26 | ||||||||||||||||||||||||||||||||||||||
| Total PPP loans | 43,658 | 1 | 0.00 | 82,089 | 3 | 0.00 | 253,964 | 1 | 0.00 | ||||||||||||||||||||||||||||||||||||||
(1)See Table 1 for additional detail on core and niche loans.
27
TABLE 13: LOAN PORTFOLIO AGING
| (In thousands) | Sep 30, 2022 | Jun 30, 2022 | Mar 31, 2022 | Dec 31, 2021 | Sep 30, 2021 | |||||||||||||||||||||||||||
| Loan Balances: | ||||||||||||||||||||||||||||||||
| Commercial | ||||||||||||||||||||||||||||||||
| Nonaccrual | $ | 44,293 | $ | 32,436 | $ | 16,878 | $ | 20,399 | $ | 26,468 | ||||||||||||||||||||||
| 90+ days and still accruing | 237 | — | — | 15 | — | |||||||||||||||||||||||||||
| 60-89 days past due | 24,641 | 16,789 | 1,294 | 24,262 | 9,768 | |||||||||||||||||||||||||||
| 30-59 days past due | 34,917 | 14,120 | 31,889 | 43,861 | 25,224 | |||||||||||||||||||||||||||
| Current | 12,155,162 | 11,983,760 | 11,533,902 | 11,815,531 | 11,126,512 | |||||||||||||||||||||||||||
| Total commercial | $ | 12,259,250 | $ | 12,047,105 | $ | 11,583,963 | $ | 11,904,068 | $ | 11,187,972 | ||||||||||||||||||||||
| Commercial real estate | ||||||||||||||||||||||||||||||||
| Nonaccrual | $ | 10,477 | $ | 10,718 | $ | 12,301 | $ | 21,746 | $ | 23,706 | ||||||||||||||||||||||
| 90+ days and still accruing | — | — | — | — | — | |||||||||||||||||||||||||||
| 60-89 days past due | 6,041 | 6,771 | 2,648 | 284 | 5,395 | |||||||||||||||||||||||||||
| 30-59 days past due | 29,971 | 34,220 | 30,141 | 40,443 | 79,818 | |||||||||||||||||||||||||||
| Current | 9,531,695 | 9,355,496 | 9,189,984 | 8,927,813 | 8,776,795 | |||||||||||||||||||||||||||
| Total commercial real estate | $ | 9,578,184 | $ | 9,407,205 | $ | 9,235,074 | $ | 8,990,286 | $ | 8,885,714 | ||||||||||||||||||||||
| Home equity | ||||||||||||||||||||||||||||||||
| Nonaccrual | $ | 1,320 | $ | 1,084 | $ | 1,747 | $ | 2,574 | $ | 3,449 | ||||||||||||||||||||||
| 90+ days and still accruing | — | — | — | — | 164 | |||||||||||||||||||||||||||
| 60-89 days past due | 125 | 154 | 199 | — | 340 | |||||||||||||||||||||||||||
| 30-59 days past due | 848 | 930 | 545 | 1,120 | 867 | |||||||||||||||||||||||||||
| Current | 326,529 | 323,658 | 318,944 | 331,461 | 342,842 | |||||||||||||||||||||||||||
| Total home equity | $ | 328,822 | $ | 325,826 | $ | 321,435 | $ | 335,155 | $ | 347,662 | ||||||||||||||||||||||
| Residential real estate | ||||||||||||||||||||||||||||||||
Early buy-out loans guaranteed by U.S. government agencies (1) | $ | 148,664 | $ | 113,856 | 50,096 | $ | 30,828 | $ | 26,986 | |||||||||||||||||||||||
| Nonaccrual | 9,787 | 8,330 | 7,262 | 16,440 | 22,633 | |||||||||||||||||||||||||||
| 90+ days and still accruing | — | — | — | — | — | |||||||||||||||||||||||||||
| 60-89 days past due | 2,149 | 534 | 293 | 982 | 1,540 | |||||||||||||||||||||||||||
| 30-59 days past due | 15 | 147 | 18,808 | 12,145 | 1,076 | |||||||||||||||||||||||||||
| Current | 2,074,844 | 1,956,040 | 1,723,526 | 1,576,704 | 1,495,501 | |||||||||||||||||||||||||||
| Total residential real estate | $ | 2,235,459 | $ | 2,078,907 | $ | 1,799,985 | $ | 1,637,099 | $ | 1,547,736 | ||||||||||||||||||||||
| Premium finance receivables - property & casualty | ||||||||||||||||||||||||||||||||
| Nonaccrual | $ | 13,026 | $ | 13,303 | $ | 6,707 | $ | 5,433 | $ | 7,300 | ||||||||||||||||||||||
| 90+ days and still accruing | 16,624 | 6,447 | 12,363 | 7,210 | 5,811 | |||||||||||||||||||||||||||
| 60-89 days past due | 15,301 | 15,299 | 8,890 | 15,490 | 10,642 | |||||||||||||||||||||||||||
| 30-59 days past due | 21,128 | 23,313 | 21,278 | 22,419 | 14,614 | |||||||||||||||||||||||||||
| Current | 5,647,261 | 5,483,085 | 4,888,170 | 4,804,935 | 4,578,610 | |||||||||||||||||||||||||||
| Total Premium finance receivables - property & casualty | $ | 5,713,340 | $ | 5,541,447 | $ | 4,937,408 | $ | 4,855,487 | $ | 4,616,977 | ||||||||||||||||||||||
| Premium finance receivables - life insurance | ||||||||||||||||||||||||||||||||
| Nonaccrual | $ | — | $ | — | $ | — | $ | — | $ | — | ||||||||||||||||||||||
| 90+ days and still accruing | 1,831 | — | — | 7 | — | |||||||||||||||||||||||||||
| 60-89 days past due | 13,628 | 1,796 | 22,401 | 12,614 | 5,162 | |||||||||||||||||||||||||||
| 30-59 days past due | 44,954 | 65,155 | 15,522 | 66,651 | 7,040 | |||||||||||||||||||||||||||
| Current | 7,944,443 | 7,541,482 | 7,316,240 | 6,963,538 | 6,643,251 | |||||||||||||||||||||||||||
| Total Premium finance receivables - life insurance | $ | 8,004,856 | $ | 7,608,433 | $ | 7,354,163 | $ | 7,042,810 | $ | 6,655,453 | ||||||||||||||||||||||
| Consumer and other | ||||||||||||||||||||||||||||||||
| Nonaccrual | $ | 7 | $ | 8 | $ | 4 | $ | 477 | $ | 384 | ||||||||||||||||||||||
| 90+ days and still accruing | 31 | 25 | 43 | 137 | 126 | |||||||||||||||||||||||||||
| 60-89 days past due | 26 | 8 | 5 | 34 | 16 | |||||||||||||||||||||||||||
| 30-59 days past due | 343 | 119 | 221 | 509 | 125 | |||||||||||||||||||||||||||
| Current | 47,295 | 44,020 | 48,246 | 23,042 | 21,878 | |||||||||||||||||||||||||||
| Total consumer and other | $ | 47,702 | $ | 44,180 | $ | 48,519 | $ | 24,199 | $ | 22,529 | ||||||||||||||||||||||
| Total loans, net of unearned income | ||||||||||||||||||||||||||||||||
Early buy-out loans guaranteed by U.S. government agencies (1) | $ | 148,664 | $ | 113,856 | $ | 50,096 | $ | 30,828 | $ | 26,986 | ||||||||||||||||||||||
| Nonaccrual | 78,910 | 65,879 | 44,899 | 67,069 | 83,940 | |||||||||||||||||||||||||||
| 90+ days and still accruing | 18,723 | 6,472 | 12,406 | 7,369 | 6,101 | |||||||||||||||||||||||||||
| 60-89 days past due | 61,911 | 41,351 | 35,730 | 53,666 | 32,863 | |||||||||||||||||||||||||||
| 30-59 days past due | 132,176 | 138,004 | 118,404 | 187,148 | 128,764 | |||||||||||||||||||||||||||
| Current | 37,727,229 | 36,687,541 | 35,019,012 | 34,443,024 | 32,985,389 | |||||||||||||||||||||||||||
| Total loans, net of unearned income | $ | 38,167,613 | $ | 37,053,103 | $ | 35,280,547 | $ | 34,789,104 | $ | 33,264,043 | ||||||||||||||||||||||
(1)Early buy-out loans are insured or guaranteed by the Federal Housing Administration or the U.S. Department of Veterans Affairs, subject to indemnifications and insurance limits for certain loans.
28
TABLE 14: NON-PERFORMING ASSETS(1) AND TROUBLED DEBT RESTRUCTURINGS (“TDRs”)
| Sep 30, | Jun 30, | Mar 31, | Dec 31, | Sep 30, | |||||||||||||||||||||||||
| (Dollars in thousands) | 2022 | 2022 | 2022 | 2021 | 2021 | ||||||||||||||||||||||||
Loans past due greater than 90 days and still accruing (2): | |||||||||||||||||||||||||||||
| Commercial | $ | 237 | $ | — | $ | — | $ | 15 | $ | — | |||||||||||||||||||
| Commercial real estate | — | — | — | — | — | ||||||||||||||||||||||||
| Home equity | — | — | — | — | 164 | ||||||||||||||||||||||||
| Residential real estate | — | — | — | — | — | ||||||||||||||||||||||||
| Premium finance receivables - property & casualty | 16,624 | 6,447 | 12,363 | 7,210 | 5,811 | ||||||||||||||||||||||||
| Premium finance receivables - life insurance | 1,831 | — | — | 7 | — | ||||||||||||||||||||||||
| Consumer and other | 31 | 25 | 43 | 137 | 126 | ||||||||||||||||||||||||
| Total loans past due greater than 90 days and still accruing | 18,723 | 6,472 | 12,406 | 7,369 | 6,101 | ||||||||||||||||||||||||
| Non-accrual loans: | |||||||||||||||||||||||||||||
| Commercial | 44,293 | 32,436 | 16,878 | 20,399 | 26,468 | ||||||||||||||||||||||||
| Commercial real estate | 10,477 | 10,718 | 12,301 | 21,746 | 23,706 | ||||||||||||||||||||||||
| Home equity | 1,320 | 1,084 | 1,747 | 2,574 | 3,449 | ||||||||||||||||||||||||
| Residential real estate | 9,787 | 8,330 | 7,262 | 16,440 | 22,633 | ||||||||||||||||||||||||
| Premium finance receivables - property & casualty | 13,026 | 13,303 | 6,707 | 5,433 | 7,300 | ||||||||||||||||||||||||
| Premium finance receivables - life insurance | — | — | — | — | — | ||||||||||||||||||||||||
| Consumer and other | 7 | 8 | 4 | 477 | 384 | ||||||||||||||||||||||||
| Total non-accrual loans | 78,910 | 65,879 | 44,899 | 67,069 | 83,940 | ||||||||||||||||||||||||
| Total non-performing loans: | |||||||||||||||||||||||||||||
| Commercial | 44,530 | 32,436 | 16,878 | 20,414 | 26,468 | ||||||||||||||||||||||||
| Commercial real estate | 10,477 | 10,718 | 12,301 | 21,746 | 23,706 | ||||||||||||||||||||||||
| Home equity | 1,320 | 1,084 | 1,747 | 2,574 | 3,613 | ||||||||||||||||||||||||
| Residential real estate | 9,787 | 8,330 | 7,262 | 16,440 | 22,633 | ||||||||||||||||||||||||
| Premium finance receivables - property & casualty | 29,650 | 19,750 | 19,070 | 12,643 | 13,111 | ||||||||||||||||||||||||
| Premium finance receivables - life insurance | 1,831 | — | — | 7 | — | ||||||||||||||||||||||||
| Consumer and other | 38 | 33 | 47 | 614 | 510 | ||||||||||||||||||||||||
| Total non-performing loans | $ | 97,633 | $ | 72,351 | $ | 57,305 | $ | 74,438 | $ | 90,041 | |||||||||||||||||||
| Other real estate owned | 5,376 | 5,574 | 4,978 | 1,959 | 9,934 | ||||||||||||||||||||||||
| Other real estate owned - from acquisitions | 1,311 | 1,265 | 1,225 | 2,312 | 3,911 | ||||||||||||||||||||||||
| Other repossessed assets | — | — | — | — | — | ||||||||||||||||||||||||
| Total non-performing assets | $ | 104,320 | $ | 79,190 | $ | 63,508 | $ | 78,709 | $ | 103,886 | |||||||||||||||||||
| Accruing TDRs not included within non-performing assets | $ | 34,238 | $ | 36,184 | $ | 35,922 | $ | 37,486 | $ | 38,468 | |||||||||||||||||||
| Total non-performing loans by category as a percent of its own respective category’s period-end balance: | |||||||||||||||||||||||||||||
| Commercial | 0.36 | % | 0.27 | % | 0.15 | % | 0.17 | % | 0.24 | % | |||||||||||||||||||
| Commercial real estate | 0.11 | 0.11 | 0.13 | 0.24 | 0.27 | ||||||||||||||||||||||||
| Home equity | 0.40 | 0.33 | 0.54 | 0.77 | 1.04 | ||||||||||||||||||||||||
| Residential real estate | 0.44 | 0.40 | 0.40 | 1.00 | 1.46 | ||||||||||||||||||||||||
| Premium finance receivables - property & casualty | 0.52 | 0.36 | 0.39 | 0.26 | 0.28 | ||||||||||||||||||||||||
| Premium finance receivables - life insurance | 0.02 | — | — | 0.00 | — | ||||||||||||||||||||||||
| Consumer and other | 0.08 | 0.07 | 0.10 | 2.54 | 2.26 | ||||||||||||||||||||||||
| Total loans, net of unearned income | 0.26 | % | 0.20 | % | 0.16 | % | 0.21 | % | 0.27 | % | |||||||||||||||||||
| Total non-performing assets as a percentage of total assets | 0.20 | % | 0.16 | % | 0.13 | % | 0.16 | % | 0.22 | % | |||||||||||||||||||
| Allowance for loan losses and unfunded lending-related commitments losses as a percentage of non-accrual loans | 399.22 | % | 473.76 | % | 670.77 | % | 446.78 | % | 352.70 | % | |||||||||||||||||||
(1)Excludes early buy-out loans guaranteed by U.S. government agencies. Early buy-out loans are insured or guaranteed by the Federal Housing Administration or the U.S. Department of Veterans Affairs, subject to indemnifications and insurance limits for certain loans.
(2)As of September 30, 2022, June 30, 2022, March 31, 2022, December 31, 2021, and September 30, 2021, approximately $1.1 million, $541,000, $320,000, $320,000 and $445,000, respectively, of TDRs were past due greater than 90 days and still accruing interest.
29
Non-performing Loans Rollforward, excluding early buy-out loans guaranteed by U.S. government agencies
| Three Months Ended | Nine Months Ended | |||||||||||||||||||||||||||||||||||||
| Sep 30, | Jun 30, | Mar 31, | Dec 31, | Sep 30, | Sep 30, | Sep 30, | ||||||||||||||||||||||||||||||||
| (In thousands) | 2022 | 2022 | 2022 | 2021 | 2021 | 2022 | 2021 | |||||||||||||||||||||||||||||||
| Balance at beginning of period | $ | 72,351 | $ | 57,305 | $ | 74,438 | $ | 90,041 | $ | 87,690 | $ | 74,438 | $ | 127,513 | ||||||||||||||||||||||||
| Additions from becoming non-performing in the respective period | 35,234 | 22,841 | 4,141 | 6,851 | 9,341 | 62,216 | 31,997 | |||||||||||||||||||||||||||||||
| Return to performing status | (154) | (1,000) | (729) | (6,616) | (3,322) | (1,883) | (3,976) | |||||||||||||||||||||||||||||||
| Payments received | (20,417) | (4,029) | (20,139) | (13,212) | (5,568) | (44,585) | (40,611) | |||||||||||||||||||||||||||||||
| Transfer to OREO and other repossessed assets | (185) | (1,611) | (4,377) | (275) | (720) | (6,173) | (5,752) | |||||||||||||||||||||||||||||||
| Charge-offs, net | (341) | (1,969) | (2,354) | (5,167) | (548) | (4,664) | (8,184) | |||||||||||||||||||||||||||||||
Net change for niche loans (1) | 11,145 | 814 | 6,325 | 2,816 | 3,168 | 18,284 | (10,946) | |||||||||||||||||||||||||||||||
| Balance at end of period | $ | 97,633 | $ | 72,351 | $ | 57,305 | $ | 74,438 | $ | 90,041 | $ | 97,633 | $ | 90,041 | ||||||||||||||||||||||||
(1)This includes activity for premium finance receivables and indirect consumer loans.
TDRs
| Sep 30, | Jun 30, | Mar 31, | Dec 31, | Sep 30, | |||||||||||||||||||||||||
| (In thousands) | 2022 | 2022 | 2022 | 2021 | 2021 | ||||||||||||||||||||||||
| Accruing TDRs: | |||||||||||||||||||||||||||||
| Commercial | $ | 2,254 | $ | 2,456 | $ | 2,773 | $ | 4,131 | $ | 4,532 | |||||||||||||||||||
| Commercial real estate | 8,967 | 9,659 | 10,068 | 8,421 | 8,385 | ||||||||||||||||||||||||
| Residential real estate and other | 23,017 | 24,069 | 23,081 | 24,934 | 25,551 | ||||||||||||||||||||||||
| Total accrual | $ | 34,238 | $ | 36,184 | $ | 35,922 | $ | 37,486 | $ | 38,468 | |||||||||||||||||||
Non-accrual TDRs: (1) | |||||||||||||||||||||||||||||
| Commercial | $ | 4,599 | $ | 4,786 | $ | 4,935 | $ | 6,746 | $ | 3,079 | |||||||||||||||||||
| Commercial real estate | 1,880 | 1,955 | 2,050 | 2,050 | 3,239 | ||||||||||||||||||||||||
| Residential real estate and other | 2,516 | 2,453 | 1,964 | 3,027 | 3,685 | ||||||||||||||||||||||||
| Total non-accrual | $ | 8,995 | $ | 9,194 | $ | 8,949 | $ | 11,823 | $ | 10,003 | |||||||||||||||||||
| Total TDRs: | |||||||||||||||||||||||||||||
| Commercial | $ | 6,853 | $ | 7,242 | $ | 7,708 | $ | 10,877 | $ | 7,611 | |||||||||||||||||||
| Commercial real estate | 10,847 | 11,614 | 12,118 | 10,471 | 11,624 | ||||||||||||||||||||||||
| Residential real estate and other | 25,533 | 26,522 | 25,045 | 27,961 | 29,236 | ||||||||||||||||||||||||
| Total TDRs | $ | 43,233 | $ | 45,378 | $ | 44,871 | $ | 49,309 | $ | 48,471 | |||||||||||||||||||
(1)Included in total non-performing loans.
Other Real Estate Owned
| Three Months Ended | |||||||||||||||||||||||||||||
| Sep 30, | Jun 30, | Mar 31, | Dec 31, | Sep 30, | |||||||||||||||||||||||||
| (In thousands) | 2022 | 2022 | 2022 | 2021 | 2021 | ||||||||||||||||||||||||
| Balance at beginning of period | $ | 6,839 | $ | 6,203 | $ | 4,271 | $ | 13,845 | $ | 15,572 | |||||||||||||||||||
| Disposals/resolved | (133) | (1,172) | (2,497) | (9,664) | (1,949) | ||||||||||||||||||||||||
| Transfers in at fair value, less costs to sell | 134 | 2,090 | 4,429 | 275 | 315 | ||||||||||||||||||||||||
| Fair value adjustments | (153) | (282) | — | (185) | (93) | ||||||||||||||||||||||||
| Balance at end of period | $ | 6,687 | $ | 6,839 | $ | 6,203 | $ | 4,271 | $ | 13,845 | |||||||||||||||||||
| Period End | |||||||||||||||||||||||||||||
| Sep 30, | Jun 30, | Mar 31, | Dec 31, | Sep 30, | |||||||||||||||||||||||||
| Balance by Property Type: | 2022 | 2022 | 2022 | 2021 | 2021 | ||||||||||||||||||||||||
| Residential real estate | $ | 1,585 | $ | 1,630 | $ | 1,127 | $ | 1,310 | $ | 1,592 | |||||||||||||||||||
| Residential real estate development | — | 133 | — | — | 934 | ||||||||||||||||||||||||
| Commercial real estate | 5,102 | 5,076 | 5,076 | 2,961 | 11,319 | ||||||||||||||||||||||||
| Total | $ | 6,687 | $ | 6,839 | $ | 6,203 | $ | 4,271 | $ | 13,845 | |||||||||||||||||||
30
TABLE 15: NON-INTEREST INCOME
| Three Months Ended | Q3 2022 compared to Q2 2022 | Q3 2022 compared to Q3 2021 | |||||||||||||||||||||||||||||||||||||||||||||||||||
| Sep 30, | Jun 30, | Mar 31, | Dec 31, | Sep 30, | |||||||||||||||||||||||||||||||||||||||||||||||||
| (Dollars in thousands) | 2022 | 2022 | 2022 | 2021 | 2021 | $ Change | % Change | $ Change | % Change | ||||||||||||||||||||||||||||||||||||||||||||
| Brokerage | $ | 4,587 | $ | 4,272 | $ | 4,632 | $ | 5,292 | $ | 5,230 | $ | 315 | 7 | % | $ | (643) | (12) | % | |||||||||||||||||||||||||||||||||||
| Trust and asset management | 28,537 | 27,097 | 26,762 | 27,197 | 26,301 | 1,440 | 5 | 2,236 | 9 | ||||||||||||||||||||||||||||||||||||||||||||
| Total wealth management | 33,124 | 31,369 | 31,394 | 32,489 | 31,531 | 1,755 | 6 | 1,593 | 5 | ||||||||||||||||||||||||||||||||||||||||||||
| Mortgage banking | 27,221 | 33,314 | 77,231 | 53,138 | 55,794 | (6,093) | (18) | (28,573) | (51) | ||||||||||||||||||||||||||||||||||||||||||||
| Service charges on deposit accounts | 14,349 | 15,888 | 15,283 | 14,734 | 14,149 | (1,539) | (10) | 200 | 1 | ||||||||||||||||||||||||||||||||||||||||||||
| Losses on investment securities, net | (3,103) | (7,797) | (2,782) | (1,067) | (2,431) | 4,694 | (60) | (672) | 28 | ||||||||||||||||||||||||||||||||||||||||||||
| Fees from covered call options | 1,366 | 1,069 | 3,742 | 1,128 | 1,157 | 297 | 28 | 209 | 18 | ||||||||||||||||||||||||||||||||||||||||||||
| Trading (losses) gains, net | (7) | 176 | 3,889 | 206 | 58 | (183) | NM | (65) | NM | ||||||||||||||||||||||||||||||||||||||||||||
| Operating lease income, net | 12,644 | 15,007 | 15,475 | 14,204 | 12,807 | (2,363) | (16) | (163) | (1) | ||||||||||||||||||||||||||||||||||||||||||||
| Other: | |||||||||||||||||||||||||||||||||||||||||||||||||||||
| Interest rate swap fees | 1,997 | 3,300 | 4,569 | 3,526 | 4,868 | (1,303) | (39) | (2,871) | (59) | ||||||||||||||||||||||||||||||||||||||||||||
| BOLI | 248 | (884) | 48 | 1,192 | 2,154 | 1,132 | NM | (1,906) | (88) | ||||||||||||||||||||||||||||||||||||||||||||
| Administrative services | 1,533 | 1,591 | 1,853 | 1,846 | 1,359 | (58) | (4) | 174 | 13 | ||||||||||||||||||||||||||||||||||||||||||||
| Foreign currency remeasurement (losses) gains | (93) | 97 | 11 | 111 | 77 | (190) | NM | (170) | NM | ||||||||||||||||||||||||||||||||||||||||||||
| Early pay-offs of capital leases | 138 | 160 | 265 | 249 | 209 | (22) | (14) | (71) | (34) | ||||||||||||||||||||||||||||||||||||||||||||
| Miscellaneous | 12,065 | 9,652 | 11,812 | 12,011 | 14,742 | 2,413 | 25 | (2,677) | (18) | ||||||||||||||||||||||||||||||||||||||||||||
| Total Other | 15,888 | 13,916 | 18,558 | 18,935 | 23,409 | 1,972 | 14 | (7,521) | (32) | ||||||||||||||||||||||||||||||||||||||||||||
| Total Non-Interest Income | $ | 101,482 | $ | 102,942 | $ | 162,790 | $ | 133,767 | $ | 136,474 | $ | (1,460) | (1) | % | $ | (34,992) | (26) | % | |||||||||||||||||||||||||||||||||||
NM - Not meaningful.
BOLI - Bank-owned life insurance
| Nine Months Ended | |||||||||||||||||||||||
| Sep 30, | Sep 30, | $ | % | ||||||||||||||||||||
| (Dollars in thousands) | 2022 | 2021 | Change | Change | |||||||||||||||||||
| Brokerage | $ | 13,491 | $ | 15,418 | $ | (1,927) | (12) | % | |||||||||||||||
| Trust and asset management | 82,396 | 76,112 | 6,284 | 8 | |||||||||||||||||||
| Total wealth management | 95,887 | 91,530 | 4,357 | 5 | |||||||||||||||||||
| Mortgage banking | 137,766 | 219,872 | (82,106) | (37) | |||||||||||||||||||
| Service charges on deposit accounts | 45,520 | 39,434 | 6,086 | 15 | |||||||||||||||||||
| (Losses) gains on investment securities, net | (13,682) | 8 | (13,690) | NM | |||||||||||||||||||
| Fees from covered call options | 6,177 | 2,545 | 3,632 | 143 | |||||||||||||||||||
| Trading gains, net | 4,058 | 39 | 4,019 | NM | |||||||||||||||||||
| Operating lease income, net | 43,126 | 39,487 | 3,639 | 9 | |||||||||||||||||||
| Other: | |||||||||||||||||||||||
| Interest rate swap fees | 9,866 | 10,176 | (310) | (3) | |||||||||||||||||||
| BOLI | (588) | 4,620 | (5,208) | NM | |||||||||||||||||||
| Administrative services | 4,977 | 3,843 | 1,134 | 30 | |||||||||||||||||||
| Foreign currency remeasurement gains (losses) | 15 | (606) | 621 | NM | |||||||||||||||||||
| Early pay-offs of leases | 563 | 352 | 211 | 60 | |||||||||||||||||||
| Miscellaneous | 33,529 | 41,053 | (7,524) | (18) | |||||||||||||||||||
| Total Other | 48,362 | 59,438 | (11,076) | (19) | |||||||||||||||||||
| Total Non-Interest Income | $ | 367,214 | $ | 452,353 | $ | (85,139) | (19) | % | |||||||||||||||
NM - Not meaningful.
BOLI - Bank-owned life insurance
31
TABLE 16: MORTGAGE BANKING
| Three Months Ended | Nine Months Ended | |||||||||||||||||||||||||||||||||||||
| (Dollars in thousands) | Sep 30, 2022 | Jun 30, 2022 | Mar 31, 2022 | Dec 31, 2021 | Sep 30, 2021 | Sep 30, 2022 | Sep 30, 2021 | |||||||||||||||||||||||||||||||
| Originations: | ||||||||||||||||||||||||||||||||||||||
| Retail originations | $ | 448,846 | $ | 595,601 | $ | 647,785 | $ | 980,627 | $ | 1,153,265 | $ | 1,692,232 | $ | 4,123,650 | ||||||||||||||||||||||||
| Veterans First originations | 211,901 | 225,378 | 247,738 | 318,244 | 405,663 | 685,017 | 1,381,256 | |||||||||||||||||||||||||||||||
| Total originations for sale (A) | $ | 660,747 | $ | 820,979 | $ | 895,523 | $ | 1,298,871 | $ | 1,558,928 | $ | 2,377,249 | $ | 5,504,906 | ||||||||||||||||||||||||
| Originations for investment | 199,701 | 297,713 | 274,628 | 177,676 | 181,886 | 772,042 | 753,493 | |||||||||||||||||||||||||||||||
| Total originations | $ | 860,448 | $ | 1,118,692 | $ | 1,170,151 | $ | 1,476,547 | $ | 1,740,814 | $ | 3,149,291 | $ | 6,258,399 | ||||||||||||||||||||||||
| Retail originations as a percentage of originations for sale | 68 | % | 73 | % | 72 | % | 75 | % | 74 | % | 71 | % | 75 | % | ||||||||||||||||||||||||
| Veterans First originations as a percentage of originations for sale | 32 | 27 | 28 | 25 | 26 | 29 | 25 | |||||||||||||||||||||||||||||||
| Purchases as a percentage of originations for sale | 82 | % | 78 | % | 53 | % | 52 | % | 56 | % | 69 | % | 43 | % | ||||||||||||||||||||||||
| Refinances as a percentage of originations for sale | 18 | 22 | 47 | 48 | 44 | 31 | 57 | |||||||||||||||||||||||||||||||
| Production Margin: | ||||||||||||||||||||||||||||||||||||||
Production revenue (B) (1) | $ | 9,084 | $ | 17,511 | $ | 14,585 | $ | 28,182 | $ | 39,247 | $ | 41,180 | $ | 148,060 | ||||||||||||||||||||||||
| Total originations for sale (A) | $ | 660,747 | $ | 820,979 | $ | 895,523 | $ | 1,298,871 | $ | 1,558,928 | $ | 2,377,249 | $ | 5,504,906 | ||||||||||||||||||||||||
Add: Current period end mandatory interest rate lock commitments to fund originations for sale (2) | 179,468 | 301,322 | 330,196 | 353,509 | 510,982 | 179,468 | 510,982 | |||||||||||||||||||||||||||||||
Less: Prior period end mandatory interest rate lock commitments to fund originations for sale (2) | 301,322 | 330,196 | 353,509 | 510,982 | 605,400 | 353,509 | 1,072,717 | |||||||||||||||||||||||||||||||
| Total mortgage production volume (C) | $ | 538,893 | $ | 792,105 | $ | 872,210 | $ | 1,141,398 | $ | 1,464,510 | $ | 2,203,208 | $ | 4,943,171 | ||||||||||||||||||||||||
| Production margin (B / C) | 1.69 | % | 2.21 | % | 1.67 | % | 2.47 | % | 2.68 | % | 1.87 | % | 3.00 | % | ||||||||||||||||||||||||
| Mortgage Servicing: | ||||||||||||||||||||||||||||||||||||||
| Loans serviced for others (D) | $ | 13,925,755 | $ | 13,643,623 | $ | 13,426,535 | $ | 13,126,254 | $ | 12,720,126 | ||||||||||||||||||||||||||||
| MSRs, at fair value (E) | 229,671 | 212,664 | 199,146 | 147,571 | 133,552 | |||||||||||||||||||||||||||||||||
| Percentage of MSRs to loans serviced for others (E / D) | 1.65 | % | 1.56 | % | 1.48 | % | 1.12 | % | 1.05 | % | ||||||||||||||||||||||||||||
| Servicing income | $ | 11,435 | $ | 10,979 | $ | 10,851 | $ | 10,766 | $ | 10,454 | $ | 33,265 | $ | 29,920 | ||||||||||||||||||||||||
| Components of MSR: | ||||||||||||||||||||||||||||||||||||||
| MSR - current period capitalization | $ | 13,260 | $ | 11,210 | $ | 14,401 | $ | 15,080 | $ | 15,546 | $ | 38,871 | $ | 57,674 | ||||||||||||||||||||||||
| MSR - collection of expected cash flows - paydowns | (1,644) | (1,598) | (1,215) | (1,101) | (1,036) | (4,457) | (2,755) | |||||||||||||||||||||||||||||||
| MSR - collection of expected cash flows - payoffs | (4,397) | (5,240) | (4,801) | (6,385) | (7,558) | (14,438) | (24,547) | |||||||||||||||||||||||||||||||
| MSR - changes in fair value model assumptions | 9,788 | 9,147 | 43,365 | 6,656 | (888) | 62,300 | 11,617 | |||||||||||||||||||||||||||||||
| Changes in fair value of derivative contract held as an economic hedge, net | (2,318) | — | — | — | — | (2,318) | — | |||||||||||||||||||||||||||||||
| MSR valuation adjustment, net of changes in fair value of derivative contract held as an economic hedge | $ | 7,470 | $ | 9,147 | $ | 43,365 | $ | 6,656 | $ | (888) | $ | 59,982 | $ | 11,617 | ||||||||||||||||||||||||
| Summary of Mortgage Banking Revenue: | ||||||||||||||||||||||||||||||||||||||
Production revenue (1) | $ | 9,084 | $ | 17,511 | $ | 14,585 | $ | 28,182 | $ | 39,247 | $ | 41,180 | $ | 148,060 | ||||||||||||||||||||||||
| Servicing income | 11,435 | 10,979 | 10,851 | 10,766 | 10,454 | 33,265 | 29,920 | |||||||||||||||||||||||||||||||
| MSR activity | 14,689 | 13,519 | 51,750 | 14,250 | 6,064 | 79,958 | 41,989 | |||||||||||||||||||||||||||||||
Changes in fair value of early buy-out loans guaranteed by U.S. government agencies and other revenue | (7,987) | (8,695) | 45 | (60) | 29 | (16,637) | (97) | |||||||||||||||||||||||||||||||
| Total mortgage banking revenue | $ | 27,221 | $ | 33,314 | $ | 77,231 | $ | 53,138 | $ | 55,794 | $ | 137,766 | $ | 219,872 | ||||||||||||||||||||||||
(1)Production revenue represents revenue earned from the origination and subsequent sale of mortgages, including gains on loans sold and fees from originations, changes in other related financial instruments carried at fair value, processing and other related activities, and excludes servicing fees, changes in the fair value of servicing rights and changes to the mortgage recourse obligation and other non-production revenue.
(2)Certain volume adjusted for the estimated pull-through rate of the loan, which represents the Company’s best estimate of the likelihood that a committed loan will ultimately fund.
32
TABLE 17: NON-INTEREST EXPENSE
| Three Months Ended | Q3 2022 compared to Q2 2022 | Q3 2022 compared to Q3 2021 | |||||||||||||||||||||||||||||||||||||||||||||||||||
| Sep 30, | Jun 30, | Mar 31, | Dec 31, | Sep 30, | |||||||||||||||||||||||||||||||||||||||||||||||||
| (Dollars in thousands) | 2022 | 2022 | 2022 | 2021 | 2021 | $ Change | % Change | $ Change | % Change | ||||||||||||||||||||||||||||||||||||||||||||
| Salaries and employee benefits: | |||||||||||||||||||||||||||||||||||||||||||||||||||||
| Salaries | $ | 97,419 | $ | 92,414 | $ | 92,116 | $ | 91,612 | $ | 88,161 | $ | 5,005 | 5 | % | $ | 9,258 | 11 | % | |||||||||||||||||||||||||||||||||||
| Commissions and incentive compensation | 50,403 | 46,131 | 51,793 | 49,923 | 57,026 | 4,272 | 9 | (6,623) | (12) | ||||||||||||||||||||||||||||||||||||||||||||
| Benefits | 28,273 | 28,781 | 28,446 | 25,596 | 25,725 | (508) | (2) | 2,548 | 10 | ||||||||||||||||||||||||||||||||||||||||||||
| Total salaries and employee benefits | 176,095 | 167,326 | 172,355 | 167,131 | 170,912 | 8,769 | 5 | 5,183 | 3 | ||||||||||||||||||||||||||||||||||||||||||||
| Software and equipment | 24,126 | 24,250 | 22,810 | 23,708 | 22,029 | (124) | (1) | 2,097 | 10 | ||||||||||||||||||||||||||||||||||||||||||||
| Operating lease equipment depreciation | 9,448 | 8,774 | 9,708 | 10,147 | 10,013 | 674 | 8 | (565) | (6) | ||||||||||||||||||||||||||||||||||||||||||||
| Occupancy, net | 17,727 | 17,651 | 17,824 | 18,343 | 18,158 | 76 | 0 | (431) | (2) | ||||||||||||||||||||||||||||||||||||||||||||
| Data processing | 7,767 | 8,010 | 7,505 | 7,207 | 7,104 | (243) | (3) | 663 | 9 | ||||||||||||||||||||||||||||||||||||||||||||
| Advertising and marketing | 16,600 | 16,615 | 11,924 | 13,981 | 13,443 | (15) | 0 | 3,157 | 23 | ||||||||||||||||||||||||||||||||||||||||||||
| Professional fees | 7,544 | 7,876 | 8,401 | 7,551 | 7,052 | (332) | (4) | 492 | 7 | ||||||||||||||||||||||||||||||||||||||||||||
| Amortization of other acquisition-related intangible assets | 1,492 | 1,579 | 1,609 | 1,811 | 1,877 | (87) | (6) | (385) | (21) | ||||||||||||||||||||||||||||||||||||||||||||
| FDIC insurance | 7,186 | 6,949 | 7,729 | 7,317 | 6,750 | 237 | 3 | 436 | 6 | ||||||||||||||||||||||||||||||||||||||||||||
| OREO expense, net | 229 | 294 | (1,032) | (641) | (1,531) | (65) | (22) | 1,760 | NM | ||||||||||||||||||||||||||||||||||||||||||||
| Other: | |||||||||||||||||||||||||||||||||||||||||||||||||||||
| Lending expenses, net of deferred origination costs | 4,533 | 4,270 | 6,821 | 5,525 | 5,999 | 263 | 6 | (1,466) | (24) | ||||||||||||||||||||||||||||||||||||||||||||
| Travel and entertainment | 4,252 | 3,897 | 2,676 | 3,782 | 3,668 | 355 | 9 | 584 | 16 | ||||||||||||||||||||||||||||||||||||||||||||
| Miscellaneous | 19,470 | 21,177 | 15,968 | 17,537 | 16,670 | (1,707) | (8) | 2,800 | 17 | ||||||||||||||||||||||||||||||||||||||||||||
| Total other | 28,255 | 29,344 | 25,465 | 26,844 | 26,337 | (1,089) | (4) | 1,918 | 7 | ||||||||||||||||||||||||||||||||||||||||||||
| Total Non-Interest Expense | $ | 296,469 | $ | 288,668 | $ | 284,298 | $ | 283,399 | $ | 282,144 | $ | 7,801 | 3 | % | $ | 14,325 | 5 | % | |||||||||||||||||||||||||||||||||||
NM - Not meaningful.
| Nine Months Ended | |||||||||||||||||||||||
| Sep 30, | Sep 30, | $ | % | ||||||||||||||||||||
| (Dollars in thousands) | 2022 | 2021 | Change | Change | |||||||||||||||||||
| Salaries and employee benefits: | |||||||||||||||||||||||
| Salaries | $ | 281,949 | $ | 270,303 | $ | 11,646 | 4 | % | |||||||||||||||
| Commissions and incentive compensation | 148,327 | 172,144 | (23,817) | (14) | |||||||||||||||||||
| Benefits | 85,500 | 82,091 | 3,409 | 4 | |||||||||||||||||||
| Total salaries and employee benefits | 515,776 | 524,538 | (8,762) | (2) | |||||||||||||||||||
| Software and equipment | 71,186 | 63,807 | 7,379 | 12 | |||||||||||||||||||
| Operating lease equipment depreciation | 27,930 | 30,733 | (2,803) | (9) | |||||||||||||||||||
| Occupancy, net | 53,202 | 55,841 | (2,639) | (5) | |||||||||||||||||||
| Data processing | 23,282 | 20,072 | 3,210 | 16 | |||||||||||||||||||
| Advertising and marketing | 45,139 | 33,294 | 11,845 | 36 | |||||||||||||||||||
| Professional fees | 23,821 | 21,943 | 1,878 | 9 | |||||||||||||||||||
| Amortization of other acquisition-related intangible assets | 4,680 | 5,923 | (1,243) | (21) | |||||||||||||||||||
| FDIC insurance | 21,864 | 19,713 | 2,151 | 11 | |||||||||||||||||||
| OREO expense, net | (509) | (1,013) | 504 | (50) | |||||||||||||||||||
| Other: | |||||||||||||||||||||||
| Lending expenses, net of deferred origination costs | 15,624 | 17,269 | (1,645) | (10) | |||||||||||||||||||
| Travel and entertainment | 10,825 | 6,266 | 4,559 | 73 | |||||||||||||||||||
| Miscellaneous | 56,615 | 50,759 | 5,856 | 12 | |||||||||||||||||||
| Total other | 83,064 | 74,294 | 8,770 | 12 | |||||||||||||||||||
| Total Non-Interest Expense | $ | 869,435 | $ | 849,145 | $ | 20,290 | 2 | % | |||||||||||||||
33
TABLE 18: SUPPLEMENTAL NON-GAAP FINANCIAL MEASURES/RATIOS
The accounting and reporting policies of Wintrust conform to generally accepted accounting principles (“GAAP”) in the United States and prevailing practices in the banking industry. However, certain non-GAAP performance measures and ratios are used by management to evaluate and measure the Company’s performance. These include taxable-equivalent net interest income (including its individual components), taxable-equivalent net interest margin (including its individual components), the taxable-equivalent efficiency ratio, tangible common equity ratio, tangible book value per common share, return on average tangible common equity, pre-tax income, excluding provision for credit losses, and pre-tax income, excluding provision for credit losses, adjusted for changes in fair value of MSRs, net of economic hedge and early buy-out loans guaranteed by U.S. government agencies. Management believes that these measures and ratios provide users of the Company’s financial information a more meaningful view of the performance of the Company’s interest-earning assets and interest-bearing liabilities and of the Company’s operating efficiency. Other financial holding companies may define or calculate these measures and ratios differently.
Management reviews yields on certain asset categories and the net interest margin of the Company and its banking subsidiaries on a fully taxable-equivalent basis. In this non-GAAP presentation, net interest income is adjusted to reflect tax-exempt interest income on an equivalent before-tax basis using tax rates effective as of the end of the period. This measure ensures comparability of net interest income arising from both taxable and tax-exempt sources. Net interest income on a fully taxable-equivalent basis is also used in the calculation of the Company’s efficiency ratio. The efficiency ratio, which is calculated by dividing non-interest expense by total taxable-equivalent net revenue (less securities gains or losses), measures how much it costs to produce one dollar of revenue. Securities gains or losses are excluded from this calculation to better match revenue from daily operations to operational expenses. Management considers the tangible common equity ratio and tangible book value per common share as useful measurements of the Company’s equity. The Company references the return on average tangible common equity as a measurement of profitability. Management considers pre-tax income, excluding provision for credit losses, and pre-tax income, excluding provision for credit losses, adjusted for changes in fair value of MSRs, net of economic hedge and early buy-out loans guaranteed by U.S. government agencies, as useful measurements of the Company’s core net income.
34
| Three Months Ended | Nine Months Ended | |||||||||||||||||||||||||||||||||||||
| Sep 30, | Jun 30, | Mar 31, | Dec 31, | Sep 30, | Sep 30, | Sep 30, | ||||||||||||||||||||||||||||||||
| (Dollars and shares in thousands) | 2022 | 2022 | 2022 | 2021 | 2021 | 2022 | 2021 | |||||||||||||||||||||||||||||||
| Reconciliation of Non-GAAP Net Interest Margin and Efficiency Ratio: | ||||||||||||||||||||||||||||||||||||||
| (A) Interest Income (GAAP) | $ | 466,478 | $ | 371,968 | $ | 328,252 | $ | 327,979 | $ | 322,457 | $ | 1,166,698 | $ | 947,505 | ||||||||||||||||||||||||
| Taxable-equivalent adjustment: | ||||||||||||||||||||||||||||||||||||||
- Loans | 1,030 | 568 | 427 | 417 | 411 | 2,025 | 1,210 | |||||||||||||||||||||||||||||||
| - Liquidity Management Assets | 502 | 472 | 465 | 486 | 492 | 1,439 | 1,486 | |||||||||||||||||||||||||||||||
| - Other Earning Assets | 1 | 1 | 2 | 2 | — | 4 | — | |||||||||||||||||||||||||||||||
| (B) Interest Income (non-GAAP) | $ | 468,011 | $ | 373,009 | $ | 329,146 | $ | 328,884 | $ | 323,360 | $ | 1,170,166 | $ | 950,201 | ||||||||||||||||||||||||
| (C) Interest Expense (GAAP) | 65,030 | 34,164 | 28,958 | 32,003 | 34,961 | 128,152 | 118,524 | |||||||||||||||||||||||||||||||
| (D) Net Interest Income (GAAP) (A minus C) | $ | 401,448 | $ | 337,804 | $ | 299,294 | $ | 295,976 | $ | 287,496 | $ | 1,038,546 | $ | 828,981 | ||||||||||||||||||||||||
| (E) Net Interest Income (non-GAAP) (B minus C) | $ | 402,981 | $ | 338,845 | $ | 300,188 | $ | 296,881 | $ | 288,399 | $ | 1,042,014 | $ | 831,677 | ||||||||||||||||||||||||
| Net interest margin (GAAP) | 3.34 | % | 2.92 | % | 2.60 | % | 2.54 | % | 2.58 | % | 2.96 | % | 2.58 | % | ||||||||||||||||||||||||
| Net interest margin, fully taxable-equivalent (non-GAAP) | 3.35 | 2.93 | 2.61 | 2.55 | 2.59 | 2.97 | 2.59 | |||||||||||||||||||||||||||||||
| (F) Non-interest income | $ | 101,482 | $ | 102,942 | $ | 162,790 | $ | 133,767 | $ | 136,474 | $ | 367,214 | $ | 452,353 | ||||||||||||||||||||||||
| (G) (Losses) gains on investment securities, net | (3,103) | (7,797) | (2,782) | (1,067) | (2,431) | (13,682) | 8 | |||||||||||||||||||||||||||||||
| (H) Non-interest expense | 296,469 | 288,668 | 284,298 | 283,399 | 282,144 | 869,435 | 849,145 | |||||||||||||||||||||||||||||||
| Efficiency ratio (H/(D+F-G)) | 58.59 | % | 64.36 | % | 61.16 | % | 65.78 | % | 66.17 | % | 61.25 | % | 66.27 | % | ||||||||||||||||||||||||
| Efficiency ratio (non-GAAP) (H/(E+F-G)) | 58.41 | 64.21 | 61.04 | 65.64 | 66.03 | 61.10 | 66.13 | |||||||||||||||||||||||||||||||
| Reconciliation of Non-GAAP Tangible Common Equity Ratio: | ||||||||||||||||||||||||||||||||||||||
| Total shareholders’ equity (GAAP) | $ | 4,637,980 | $ | 4,727,623 | $ | 4,492,256 | $ | 4,498,688 | $ | 4,410,317 | ||||||||||||||||||||||||||||
| Less: Non-convertible preferred stock (GAAP) | (412,500) | (412,500) | (412,500) | (412,500) | (412,500) | |||||||||||||||||||||||||||||||||
| Less: Intangible assets (GAAP) | (676,699) | (679,827) | (682,101) | (683,456) | (675,910) | |||||||||||||||||||||||||||||||||
| (I) Total tangible common shareholders’ equity (non-GAAP) | $ | 3,548,781 | $ | 3,635,296 | $ | 3,397,655 | $ | 3,402,732 | $ | 3,321,907 | ||||||||||||||||||||||||||||
| (J) Total assets (GAAP) | $ | 52,382,939 | $ | 50,969,332 | $ | 50,250,661 | $ | 50,142,143 | $ | 47,832,271 | ||||||||||||||||||||||||||||
| Less: Intangible assets (GAAP) | (676,699) | (679,827) | (682,101) | (683,456) | (675,910) | |||||||||||||||||||||||||||||||||
| (K) Total tangible assets (non-GAAP) | $ | 51,706,240 | $ | 50,289,505 | $ | 49,568,560 | $ | 49,458,687 | $ | 47,156,361 | ||||||||||||||||||||||||||||
| Common equity to assets ratio (GAAP) (L/J) | 8.1 | % | 8.5 | % | 8.1 | % | 8.1 | % | 8.4 | % | ||||||||||||||||||||||||||||
| Tangible common equity ratio (non-GAAP) (I/K) | 6.9 | 7.2 | 6.9 | 6.9 | 7.0 | |||||||||||||||||||||||||||||||||
35
| Three Months Ended | Nine Months Ended | |||||||||||||||||||||||||||||||||||||
| Sep 30, | Jun 30, | Mar 31, | Dec 31, | Sep 30, | Sep 30, | Sep 30, | ||||||||||||||||||||||||||||||||
| (Dollars and shares in thousands) | 2022 | 2022 | 2022 | 2021 | 2021 | 2022 | 2021 | |||||||||||||||||||||||||||||||
| Reconciliation of Non-GAAP Tangible Book Value per Common Share: | ||||||||||||||||||||||||||||||||||||||
| Total shareholders’ equity | $ | 4,637,980 | $ | 4,727,623 | $ | 4,492,256 | $ | 4,498,688 | $ | 4,410,317 | ||||||||||||||||||||||||||||
| Less: Preferred stock | (412,500) | (412,500) | (412,500) | (412,500) | (412,500) | |||||||||||||||||||||||||||||||||
| (L) Total common equity | $ | 4,225,480 | $ | 4,315,123 | $ | 4,079,756 | $ | 4,086,188 | $ | 3,997,817 | ||||||||||||||||||||||||||||
| (M) Actual common shares outstanding | 60,743 | 60,722 | 57,253 | 57,054 | 56,956 | |||||||||||||||||||||||||||||||||
| Book value per common share (L/M) | $ | 69.56 | $ | 71.06 | $ | 71.26 | $ | 71.62 | $ | 70.19 | ||||||||||||||||||||||||||||
| Tangible book value per common share (non-GAAP) (I/M) | 58.42 | 59.87 | 59.34 | 59.64 | 58.32 | |||||||||||||||||||||||||||||||||
| Reconciliation of Non-GAAP Return on Average Tangible Common Equity: | ||||||||||||||||||||||||||||||||||||||
| (N) Net income applicable to common shares | $ | 135,970 | $ | 87,522 | $ | 120,400 | $ | 91,766 | $ | 102,146 | $ | 343,892 | $ | 346,421 | ||||||||||||||||||||||||
| Add: Intangible asset amortization | 1,492 | 1,579 | 1,609 | 1,811 | 1,877 | 4,680 | 5,923 | |||||||||||||||||||||||||||||||
| Less: Tax effect of intangible asset amortization | (425) | (445) | (430) | (505) | (509) | (1,301) | (1,576) | |||||||||||||||||||||||||||||||
| After-tax intangible asset amortization | $ | 1,067 | $ | 1,134 | $ | 1,179 | $ | 1,306 | $ | 1,368 | $ | 3,379 | $ | 4,347 | ||||||||||||||||||||||||
| (O) Tangible net income applicable to common shares (non-GAAP) | $ | 137,037 | $ | 88,656 | $ | 121,579 | $ | 93,072 | $ | 103,514 | $ | 347,271 | $ | 350,768 | ||||||||||||||||||||||||
| Total average shareholders’ equity | $ | 4,795,387 | $ | 4,526,110 | $ | 4,500,460 | $ | 4,433,953 | $ | 4,343,915 | $ | 4,608,399 | $ | 4,255,851 | ||||||||||||||||||||||||
| Less: Average preferred stock | (412,500) | (412,500) | (412,500) | (412,500) | (412,500) | (412,500) | (412,500) | |||||||||||||||||||||||||||||||
| (P) Total average common shareholders’ equity | $ | 4,382,887 | $ | 4,113,610 | $ | 4,087,960 | $ | 4,021,453 | $ | 3,931,415 | $ | 4,195,899 | $ | 3,843,351 | ||||||||||||||||||||||||
| Less: Average intangible assets | (678,953) | (681,091) | (682,603) | (677,470) | (677,201) | (680,869) | (679,167) | |||||||||||||||||||||||||||||||
| (Q) Total average tangible common shareholders’ equity (non-GAAP) | $ | 3,703,934 | $ | 3,432,519 | $ | 3,405,357 | $ | 3,343,983 | $ | 3,254,214 | $ | 3,515,030 | $ | 3,164,184 | ||||||||||||||||||||||||
| Return on average common equity, annualized (N/P) | 12.31 | % | 8.53 | % | 11.94 | % | 9.05 | % | 10.31 | % | 10.96 | % | 12.05 | % | ||||||||||||||||||||||||
| Return on average tangible common equity, annualized (non-GAAP) (O/Q) | 14.68 | 10.36 | 14.48 | 11.04 | 12.62 | 13.21 | 14.82 | |||||||||||||||||||||||||||||||
| Reconciliation of Non-GAAP Pre-Tax, Pre-Provision Income, Adjusted for Changes in Fair Value of MSRs, net of economic hedge and Early Buy-out Loans Guaranteed by U.S. Government Agencies: | ||||||||||||||||||||||||||||||||||||||
| Income before taxes | $ | 200,041 | $ | 131,661 | $ | 173,680 | $ | 137,045 | $ | 149,742 | $ | 505,382 | $ | 500,751 | ||||||||||||||||||||||||
| Add: Provision for credit losses | 6,420 | 20,417 | 4,106 | 9,299 | (7,916) | 30,943 | (68,562) | |||||||||||||||||||||||||||||||
| Pre-tax income, excluding provision for credit losses (non-GAAP) | $ | 206,461 | $ | 152,078 | $ | 177,786 | $ | 146,344 | $ | 141,826 | $ | 536,325 | $ | 432,189 | ||||||||||||||||||||||||
| Less: Changes in fair value of MSRs, net of economic hedge and early buy-out loans guaranteed by U.S. government agencies | 2,472 | (445) | (43,365) | (6,656) | 888 | (41,338) | (11,617) | |||||||||||||||||||||||||||||||
| Pre-tax income, excluding provision for credit losses, adjusted for changes in fair value of MSRs, net of economic hedge and early buy-out loans guaranteed by U.S. government agencies (non-GAAP) | $ | 208,933 | $ | 151,633 | $ | 134,421 | $ | 139,688 | $ | 142,714 | $ | 494,987 | $ | 420,572 | ||||||||||||||||||||||||
36
WINTRUST SUBSIDIARIES AND LOCATIONS
Wintrust is a financial holding company whose common stock is traded on the Nasdaq Global Select Market (Nasdaq: WTFC). Its 15 community bank subsidiaries are: Lake Forest Bank & Trust Company, N.A., Hinsdale Bank & Trust Company, N.A., Wintrust Bank, N.A., in Chicago, Libertyville Bank & Trust Company, N.A., Barrington Bank & Trust Company, N.A., Crystal Lake Bank & Trust Company, N.A., Northbrook Bank & Trust Company, N.A., Schaumburg Bank & Trust Company, N.A., Village Bank & Trust, N.A., in Arlington Heights, Beverly Bank & Trust Company, N.A. in Chicago, Wheaton Bank & Trust Company, N.A., State Bank of The Lakes, N.A., in Antioch, Old Plank Trail Community Bank, N.A., in New Lenox, St. Charles Bank & Trust Company, N.A. and Town Bank, N.A., in Hartland, Wisconsin.
In addition to the locations noted above, the banks also operate facilities in Illinois in Addison, Algonquin, Aurora, Bloomingdale, Bolingbrook, Buffalo Grove, Burbank, Cary, Clarendon Hills, Crete, Countryside, Darien, Deerfield, Des Plaines, Downers Grove, Elgin, Elk Grove Village, Elmhurst, Evanston, Evergreen Park, Frankfort, Geneva, Glen Ellyn, Glencoe, Glenview, Gurnee, Grayslake, Hanover Park, Highland Park, Highwood, Hoffman Estates, Homer Glen, Itasca, Joliet, Lake Bluff, Lake Villa, Lansing, Lemont, Lindenhurst, Lombard, Lynwood, Markham, Maywood, McHenry, Mokena, Mount Prospect, Mundelein, Naperville, Northfield, Norridge, Oak Lawn, Oak Park, Orland Park, Palatine, Park Ridge, Prospect Heights, Riverside, Rockford, Rolling Meadows, Round Lake Beach, Shorewood, Skokie, South Holland, Spring Grove, Steger, Stone Park, Vernon Hills, Wauconda, Waukegan, Western Springs, Willowbrook, Wilmette, Winnetka and Wood Dale, and in Wisconsin in Burlington, Clinton, Delafield, Delavan, Elm Grove, Genoa City, Kenosha, Lake Geneva, Madison, Menomonee Falls, Milwaukee, Pewaukee, Racine, Wales, Walworth, Whitefish Bay and Wind Lake, and in Dyer, Indiana and in Naples, Florida.
Additionally, the Company operates various non-bank business units:
•FIRST Insurance Funding and Wintrust Life Finance, each a division of Lake Forest Bank & Trust Company, N.A., serve commercial and life insurance loan customers, respectively, throughout the United States.
•First Insurance Funding of Canada serves commercial insurance loan customers throughout Canada.
•Tricom, Inc. of Milwaukee provides high-yielding, short-term accounts receivable financing and value-added out-sourced administrative services, such as data processing of payrolls, billing and cash management services, to temporary staffing service clients located throughout the United States.
•Wintrust Mortgage, a division of Barrington Bank & Trust Company, N.A., engages primarily in the origination and purchase of residential mortgages for sale into the secondary market through origination offices located throughout the United States. Loans are also originated nationwide through relationships with wholesale and correspondent offices.
•Wintrust Investments, LLC is a broker-dealer providing a full range of private client and brokerage services to clients and correspondent banks located primarily in the Midwest.
•Great Lakes Advisors LLC provides money management services and advisory services to individual accounts.
•The Chicago Trust Company, N.A., a trust subsidiary, allows Wintrust to service customers’ trust and investment needs at each banking location.
•Wintrust Asset Finance offers direct leasing opportunities.
•CDEC provides Qualified Intermediary services (as defined by U.S. Treasury regulations) for taxpayers seeking to structure tax-deferred like-kind exchanges under Internal Revenue Code Section 1031.
FORWARD-LOOKING STATEMENTS
This document contains forward-looking statements within the meaning of federal securities laws. Forward-looking information can be identified through the use of words such as “intend,” “plan,” “project,” “expect,” “anticipate,” “believe,” “estimate,” “contemplate,” “possible,” “will,” “may,” “should,” “would” and “could.” Forward-looking statements and information are not historical facts, are premised on many factors and assumptions, and represent only management’s expectations, estimates and projections regarding future events. Similarly, these statements are not guarantees of future performance and involve certain risks and uncertainties that are difficult to predict, such as the impacts of the COVID-19 pandemic (including the continued emergence of variant strains), and which may include, but are not limited to, those listed below and the Risk Factors discussed under Item 1A of the Company’s 2021 Annual Report on Form 10-K and in any of the Company’s subsequent SEC filings. The Company intends such forward-looking statements to be covered by the safe harbor provisions for forward-looking statements contained in the Private Securities Litigation Reform Act of 1995, and is including this statement for purposes of invoking these safe harbor provisions. Such forward-looking statements may be deemed to include, among other things, statements relating to the Company’s future financial performance, the performance of its loan portfolio, the expected amount of future credit reserves and charge-offs, delinquency trends, growth plans, regulatory developments, securities that the Company may offer from time to time, and management’s long-term performance goals, as well as statements relating to the anticipated effects on financial condition and results of operations from expected developments or events, the Company’s business and growth strategies, including future acquisitions of banks, specialty finance or wealth management businesses, internal growth and plans to form
37
additional de novo banks or branch offices. Actual results could differ materially from those addressed in the forward-looking statements as a result of numerous factors, including the following:
•the severity, magnitude and duration of the COVID-19 pandemic, including the continued emergence of variant strains, and the direct and indirect impact of such pandemic, as well as responses to the pandemic by the government, businesses and consumers, on our operations and personnel, commercial activity and demand across our business and our customers’ businesses;
•the disruption of global, national, state and local economies associated with the COVID-19 pandemic, which could affect the Company’s liquidity and capital positions, impair the ability of our borrowers to repay outstanding loans, impair collateral values and further increase our allowance for credit losses;
•the impact of the COVID-19 pandemic on our financial results, including possible lost revenue and increased expenses (including the cost of capital), as well as possible goodwill impairment charges;
•economic conditions and events that affect the economy, housing prices, the job market and other factors that may adversely affect the Company’s liquidity and the performance of its loan portfolios, particularly in the markets in which it operates;
•negative effects suffered by us or our customers resulting from changes in U.S. trade policies;
•the extent of defaults and losses on the Company’s loan portfolio, which may require further increases in its allowance for credit losses;
•estimates of fair value of certain of the Company’s assets and liabilities, which could change in value significantly from period to period;
•the financial success and economic viability of the borrowers of our commercial loans;
•commercial real estate market conditions in the Chicago metropolitan area and southern Wisconsin;
•the extent of commercial and consumer delinquencies and declines in real estate values, which may require further increases in the Company’s allowance for credit losses;
•inaccurate assumptions in our analytical and forecasting models used to manage our loan portfolio;
•changes in the level and volatility of interest rates, the capital markets and other market indices (including developments and volatility arising from or related to the COVID-19 pandemic) that may affect, among other things, the Company’s liquidity and the value of its assets and liabilities;
•the interest rate environment, including a prolonged period of low interest rates or rising interest rates, either broadly or for some types of instruments, which may affect the Company’s net interest income and net interest margin, and which could materially adversely affect the Company’s profitability;
•competitive pressures in the financial services business which may affect the pricing of the Company’s loan and deposit products as well as its services (including wealth management services), which may result in loss of market share and reduced income from deposits, loans, advisory fees and income from other products;
•failure to identify and complete favorable acquisitions in the future or unexpected difficulties or developments related to the integration of the Company’s recent or future acquisitions;
•unexpected difficulties and losses related to FDIC-assisted acquisitions;
•harm to the Company’s reputation;
•any negative perception of the Company’s financial strength;
•ability of the Company to raise additional capital on acceptable terms when needed;
•disruption in capital markets, which may lower fair values for the Company’s investment portfolio;
•ability of the Company to use technology to provide products and services that will satisfy customer demands and create efficiencies in operations and to manage risks associated therewith;
•failure or breaches of our security systems or infrastructure, or those of third parties;
•security breaches, including denial of service attacks, hacking, social engineering attacks, malware intrusion or data corruption attempts and identity theft;
•adverse effects on our information technology systems resulting from failures, human error or cyberattacks (including ransomware);
•adverse effects of failures by our vendors to provide agreed upon services in the manner and at the cost agreed, particularly our information technology vendors;
•increased costs as a result of protecting our customers from the impact of stolen debit card information;
•accuracy and completeness of information the Company receives about customers and counterparties to make credit decisions;
•ability of the Company to attract and retain senior management experienced in the banking and financial services industries;
•environmental liability risk associated with lending activities;
•the impact of any claims or legal actions to which the Company is subject, including any effect on our reputation;
•losses incurred in connection with repurchases and indemnification payments related to mortgages and increases in reserves associated therewith;
38
•the loss of customers as a result of technological changes allowing consumers to complete their financial transactions without the use of a bank;
•the soundness of other financial institutions;
•the expenses and delayed returns inherent in opening new branches and de novo banks;
•liabilities, potential customer loss or reputational harm related to closings of existing branches;
•examinations and challenges by tax authorities, and any unanticipated impact of the Tax Act;
•changes in accounting standards, rules and interpretations, and the impact on the Company’s financial statements;
•the ability of the Company to receive dividends from its subsidiaries;
•uncertainty about the discontinued use of LIBOR and transition to an alternative rate;
•a decrease in the Company’s capital ratios, including as a result of declines in the value of its loan portfolios, or otherwise;
•legislative or regulatory changes, particularly changes in regulation of financial services companies and/or the products and services offered by financial services companies, including those changes that are in response to the COVID-19 pandemic, including without limitation the Coronavirus Aid, Relief, and Economic Security Act, the Economic Aid to Hard-Hit Small Businesses, Nonprofits and Venues Act, and the rules and regulations that may be promulgated thereunder;
•a lowering of our credit rating;
•changes in U.S. monetary policy and changes to the Federal Reserve’s balance sheet, including changes in response to the COVID-19 pandemic, persistent inflation or otherwise;
•regulatory restrictions upon our ability to market our products to consumers and limitations on our ability to profitably operate our mortgage business;
•increased costs of compliance, heightened regulatory capital requirements and other risks associated with changes in regulation and the regulatory environment;
•the impact of heightened capital requirements;
•increases in the Company’s FDIC insurance premiums, or the collection of special assessments by the FDIC;
•delinquencies or fraud with respect to the Company’s premium finance business;
•credit downgrades among commercial and life insurance providers that could negatively affect the value of collateral securing the Company’s premium finance loans;
•the Company’s ability to comply with covenants under its credit facility;
•fluctuations in the stock market, which may have an adverse impact on the Company’s wealth management business and brokerage operation; and
•widespread outages of operational, communication, or other systems, whether internal or provided by third parties, natural or other disasters (including acts of terrorism, armed hostilities and pandemics), and the effects of climate change could have an adverse effect on the Company’s financial condition and results of operations, lead to material disruption of the Company’s operations or the ability or willingness of clients to access the Company’s products and services.
Therefore, there can be no assurances that future actual results will correspond to these forward-looking statements. The reader is cautioned not to place undue reliance on any forward-looking statement made by the Company. Any such statement speaks only as of the date the statement was made or as of such date that may be referenced within the statement. The Company undertakes no obligation to update any forward-looking statement to reflect the impact of circumstances or events after the date of the press release. Persons are advised, however, to consult further disclosures management makes on related subjects in its reports filed with the Securities and Exchange Commission and in its press releases.
CONFERENCE CALL, WEBCAST AND REPLAY
The Company will hold a conference call on Wednesday, October 19, 2022 at 10:00 a.m. (CDT) regarding third quarter and year-to-date 2022 earnings results. Individuals interested in participating in the call by addressing questions to management should register for the call to receive the dial-in numbers and unique PIN at the link included within the Company’s press release dated September 29, 2022 available at the Investor Relations, Investor News and Events, Press Releases link on its website at https://www.wintrust.com. A separate simultaneous audio-only webcast link is included within the press release referenced above. Registration for and a replay of the audio-only webcast with an accompanying slide presentation will be available at https://www.wintrust.com, Investor Relations, Investor News and Events, Presentations & Conference Calls. The text of the third quarter and year-to-date 2022 earnings press release will also be available on the home page of the Company’s website at https://www.wintrust.com and at the Investor Relations, Investor News and Events, Press Releases link on its website.
39
Earnings Release Presentation Q3 2022 Wintrust Financial Corporation
2 This document contains forward-looking statements within the meaning of federal securities laws. Forward-looking information can be identified through the use of words such as “intend,” “plan,” “project,” “expect,” “anticipate,” “believe,” “estimate,” “contemplate,” “possible,” “will,” “may,” “should,” “would” and “could.” Forward-looking statements and information are not historical facts, are premised on many factors and assumptions, and represent only management’s expectations, estimates and projections regarding future events. Similarly, these statements are not guarantees of future performance and involve certain risks and uncertainties that are difficult to predict, such as the impacts of the COVID-19 pandemic (including the continued emergence of variant strains), and which may include, but are not limited to, those listed below and the Risk Factors discussed under Item 1A of the Company’s 2021 Annual Report on Form 10-K and in any of the Company’s subsequent SEC filings. The Company intends such forward-looking statements to be covered by the safe harbor provisions for forward- looking statements contained in the Private Securities Litigation Reform Act of 1995, and is including this statement for purposes of invoking these safe harbor provisions. Such forward- looking statements may be deemed to include, among other things, statements relating to the Company’s future financial performance, the performance of its loan portfolio, the expected amount of future credit reserves and charge-offs, delinquency trends, growth plans, regulatory developments, securities that the Company may offer from time to time, and management’s long-term performance goals, as well as statements relating to the anticipated effects on financial condition and results of operations from expected developments or events, the Company’s business and growth strategies, including future acquisitions of banks, specialty finance or wealth management businesses, internal growth and plans to form additional de novo banks or branch offices. Actual results could differ materially from those addressed in the forward-looking statements as a result of numerous factors, including the following: • the severity, magnitude and duration of the COVID-19 pandemic, including the continued emergence of variant strains, and the direct and indirect impact of such pandemic, as well as responses to the pandemic by the government, businesses and consumers, on our operations and personnel, commercial activity and demand across our business and our customers’ businesses; • the disruption of global, national, state and local economies associated with the COVID-19 pandemic, which could affect the Company’s liquidity and capital positions, impair the ability of our borrowers to repay outstanding loans, impair collateral values and further increase our allowance for credit losses; • the impact of the COVID-19 pandemic on our financial results, including possible lost revenue and increased expenses (including the cost of capital), as well as possible goodwill impairment charges; • economic conditions that affect the economy, housing prices, the job market and other factors that may adversely affect the Company’s liquidity and the performance of its loan portfolios, particularly in the markets in which it operates; • negative effects suffered by us or our customers resulting from changes in U.S. trade policies; • the extent of defaults and losses on the Company’s loan portfolio, which may require further increases in its allowance for credit losses; • estimates of fair value of certain of the Company’s assets and liabilities, which could change in value significantly from period to period; • the financial success and economic viability of the borrowers of our commercial loans; • commercial real estate market conditions in the Chicago metropolitan area and southern Wisconsin; • the extent of commercial and consumer delinquencies and declines in real estate values, which may require further increases in the Company’s allowance for credit losses; • inaccurate assumptions in our analytical and forecasting models used to manage our loan portfolio; • changes in the level and volatility of interest rates, the capital markets and other market indices (including developments and volatility arising from or related to the COVID-19 pandemic) that may affect, among other things, the Company’s liquidity and the value of its assets and liabilities; • the interest rate environment, including a prolonged period of low interest rates or rising interest rates, either broadly or for some types of instruments, which may affect the Company’s net interest income and net interest margin, and which could materially adversely affect the Company’s profitability; • competitive pressures in the financial services business which may affect the pricing of the Company’s loan and deposit products as well as its services (including wealth management services), which may result in loss of market share and reduced income from deposits, loans, advisory fees and income from other products; • failure to identify and complete favorable acquisitions in the future or unexpected difficulties or developments related to the integration of the Company’s recent or future acquisitions; • unexpected difficulties and losses related to FDIC-assisted acquisitions; • harm to the Company’s reputation; • any negative perception of the Company’s financial strength; • ability of the Company to raise additional capital on acceptable terms when needed; • disruption in capital markets, which may lower fair values for the Company’s investment portfolio; Forward-Looking Statements
3 • ability of the Company to use technology to provide products and services that will satisfy customer demands and create efficiencies in operations and to manage risks associated therewith; • failure or breaches of our security systems or infrastructure, or those of third parties; • security breaches, including denial of service attacks, hacking, social engineering attacks, malware intrusion or data corruption attempts and identity theft; • adverse effects on our information technology systems resulting from failures, human error or cyberattacks (including ransomware); • adverse effects of failures by our vendors to provide agreed upon services in the manner and at the cost agreed, particularly our information technology vendors; • increased costs as a result of protecting our customers from the impact of stolen debit card information; • accuracy and completeness of information the Company receives about customers and counterparties to make credit decisions; • ability of the Company to attract and retain senior management experienced in the banking and financial services industries; • environmental liability risk associated with lending activities; • the impact of any claims or legal actions to which the Company is subject, including any effect on our reputation; • losses incurred in connection with repurchases and indemnification payments related to mortgages and increases in reserves associated therewith; • the loss of customers as a result of technological changes allowing consumers to complete their financial transactions without the use of a bank; • the soundness of other financial institutions; • the expenses and delayed returns inherent in opening new branches and de novo banks; • liabilities, potential customer loss or reputational harm related to closings of existing branches; • examinations and challenges by tax authorities, and any unanticipated impact of the Tax Act; • changes in accounting standards, rules and interpretations, and the impact on the Company’s financial statements; • the ability of the Company to receive dividends from its subsidiaries; • uncertainty about the discontinued use of LIBOR and transition to an alternative rate; • a decrease in the Company’s capital ratios, including as a result of declines in the value of its loan portfolios, or otherwise; • legislative or regulatory changes, particularly changes in regulation of financial services companies and/or the products and services offered by financial services companies, including those changes that are in response to the COVID-19 pandemic, including without limitation the Coronavirus Aid, Relief, and Economic Security Act (the “CARES Act”), the Economic Aid to Hard-Hit Small Businesses, Nonprofits and Venues Act, and the rules and regulations that may be promulgated thereunder; • a lowering of our credit rating; • changes in U.S. monetary policy and changes to the Federal Reserve’s balance sheet, including changes in response to the COVID-19 pandemic, persistent inflation or otherwise; • regulatory restrictions upon our ability to market our products to consumers and limitations on our ability to profitably operate our mortgage business; • increased costs of compliance, heightened regulatory capital requirements and other risks associated with changes in regulation and the regulatory environment; • the impact of heightened capital requirements; • increases in the Company’s FDIC insurance premiums, or the collection of special assessments by the FDIC; • delinquencies or fraud with respect to the Company’s premium finance business; • credit downgrades among commercial and life insurance providers that could negatively affect the value of collateral securing the Company’s premium finance loans; • the Company’s ability to comply with covenants under its credit facility; • fluctuations in the stock market, which may have an adverse impact on the Company’s wealth management business and brokerage operation; and • widespread outages of operational, communication, or other systems, whether internal or provided by third parties, natural or other disasters (including acts of terrorism, armed hostilities and pandemics), and the effects of climate change could have an adverse effect on the Company’s financial condition and results of operations, lead to material disruption of the Company’s operations or the ability or willingness of clients to access the Company’s products and services. Therefore, there can be no assurances that future actual results will correspond to these forward-looking statements. The reader is cautioned not to place undue reliance on any forward- looking statement made by the Company. Any such statement speaks only as of the date the statement was made or as of such date that may be referenced within the statement. The Company undertakes no obligation to update any forward-looking statement to reflect the impact of circumstances or events after the date of the press release and this presentation. Persons are advised, however, to consult further disclosures management makes on related subjects in its reports filed with the Securities and Exchange Commission and in its press releases and presentations. Forward-Looking Statements
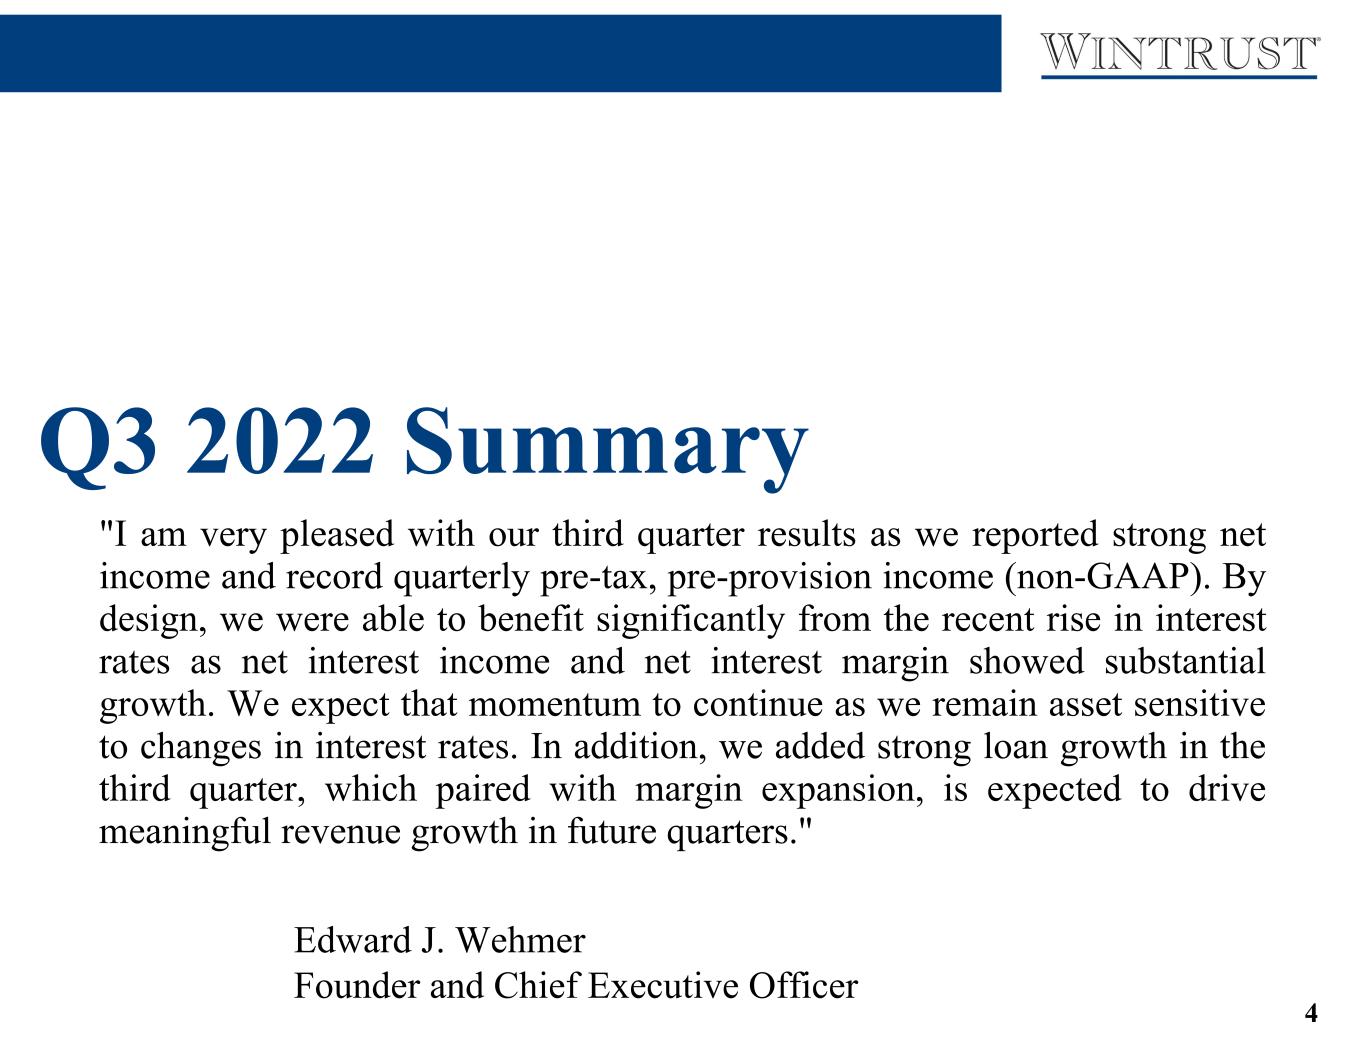
4 "I am very pleased with our third quarter results as we reported strong net income and record quarterly pre-tax, pre-provision income (non-GAAP). By design, we were able to benefit significantly from the recent rise in interest rates as net interest income and net interest margin showed substantial growth. We expect that momentum to continue as we remain asset sensitive to changes in interest rates. In addition, we added strong loan growth in the third quarter, which paired with margin expansion, is expected to drive meaningful revenue growth in future quarters." Q3 2022 Summary Edward J. Wehmer Founder and Chief Executive Officer
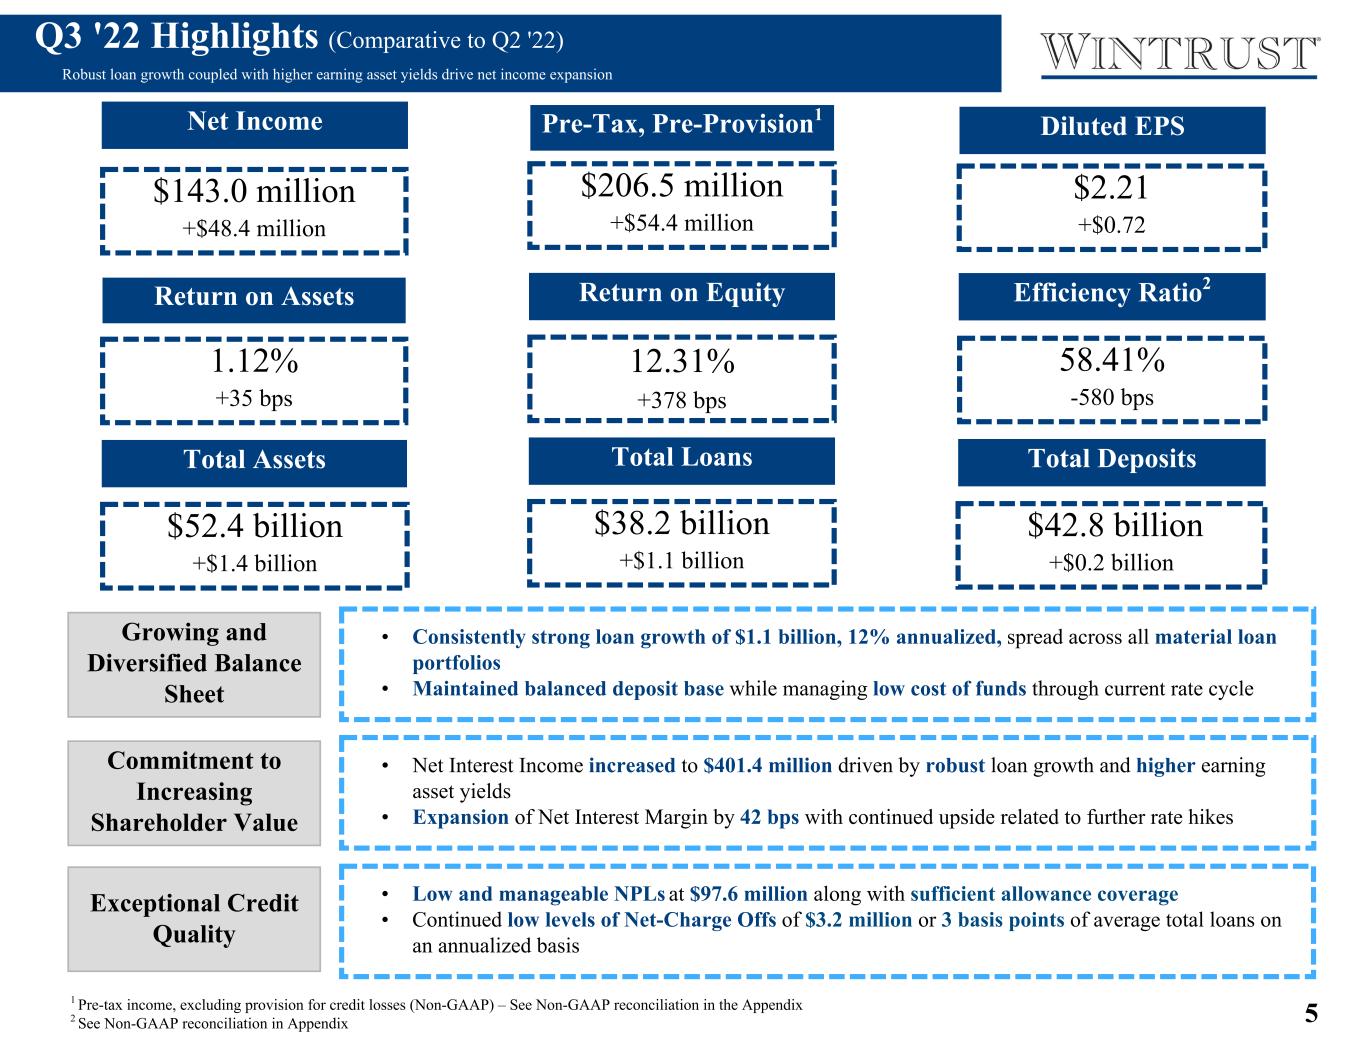
5 Pre-Tax, Pre-Provision1 Growing and Diversified Balance Sheet Future Outlook • Wintrust continues to monitor the interest rate environment to reduce the asset sensitivity of its balance sheet given the recent increase in rates. • Pressure on net interest margin is expected in upcoming quarter. • Growing low cost deposits in our market area remains a significant focus of the Company, which we believe will be the key to mitigating net interest margin compression. Strong Balance Sheet Total Loans +$2.2B / 9.7% Mid to High Single Digit Growth Average Loan to Deposit Ratio 93.7% 85% - 90% Total Deposits +$2.9B / 12.6% High Single Digit Growth Income Net Income +$85.5MM 10% - 15% Growth NIM Net Interest Margin +17 bps 3.60% - 3.70% NII Non-Interest Income +$36.6MM PENDING NIE Non-Interest Expense +$94.3MM 1.50% - 1.60% Net Overhead Ratio Credit & Capital Net Charge-Off Ratio +2 bps Diligently Monitoring to Maintain Pristine Credit Quality Total Risk-Based Capital Ratio -39 bps May Consider Capital Increase Pending Acquisition Pipeline Q3 '22 Highlights (Comparative to Q2 '22) Robust loan growth coupled with higher earning asset yields drive net income expansion Total DepositsTotal Assets Total Loans Net Income $52.4 billion +$1.4 billion $38.2 billion +$1.1 billion $42.8 billion +$0.2 billion $143.0 million +$48.4 million Exceptional Credit Quality Awards/Non- Recurring Items • Net Interest Income increased to $401.4 million driven by robust loan growth and higher earning asset yields • Expansion of Net Interest Margin by 42 bps with continued upside related to further rate hikes • Low and manageable NPLs at $97.6 million along with sufficient allowance coverage • Continued low levels of Net-Charge Offs of $3.2 million or 3 basis points of average total loans on an annualized basis • Ranked Top Workplace in Chicago 2021 • Swap Sale expected in 2022 Update Format second box Efficiency Ratio2Return on Assets Return on Equity 1.12% +35 bps 12.31% +378 bps 58.41% -580 bps $206.5 million +$54.4 million • Consistently strong loan growth of $1.1 billion, 12% annualized, spread across all material loan portfolios • Maintained balanced deposit base while managing low cost of funds through current rate cycle 1 Pre-tax income, excluding provision for credit losses (Non-GAAP) – See Non-GAAP reconciliation in the Appendix 2 See Non-GAAP reconciliation in Appendix Diluted EPS $2.21 +$0.72 Current EPS Prior EPS $ 2.21 1.49 $ 0.72 PPNI Prior PPNI $ 206.5 152.1 $54.38 54400000 206,461 152,078 3 Bps: Basis Points 4 See Non-GAAP reconciliation in the Appendix 5 NPLs: Non-Performing Loans Commitment to Increasing Shareholder Value Net Overhead Ratio 1.53% +2 bps
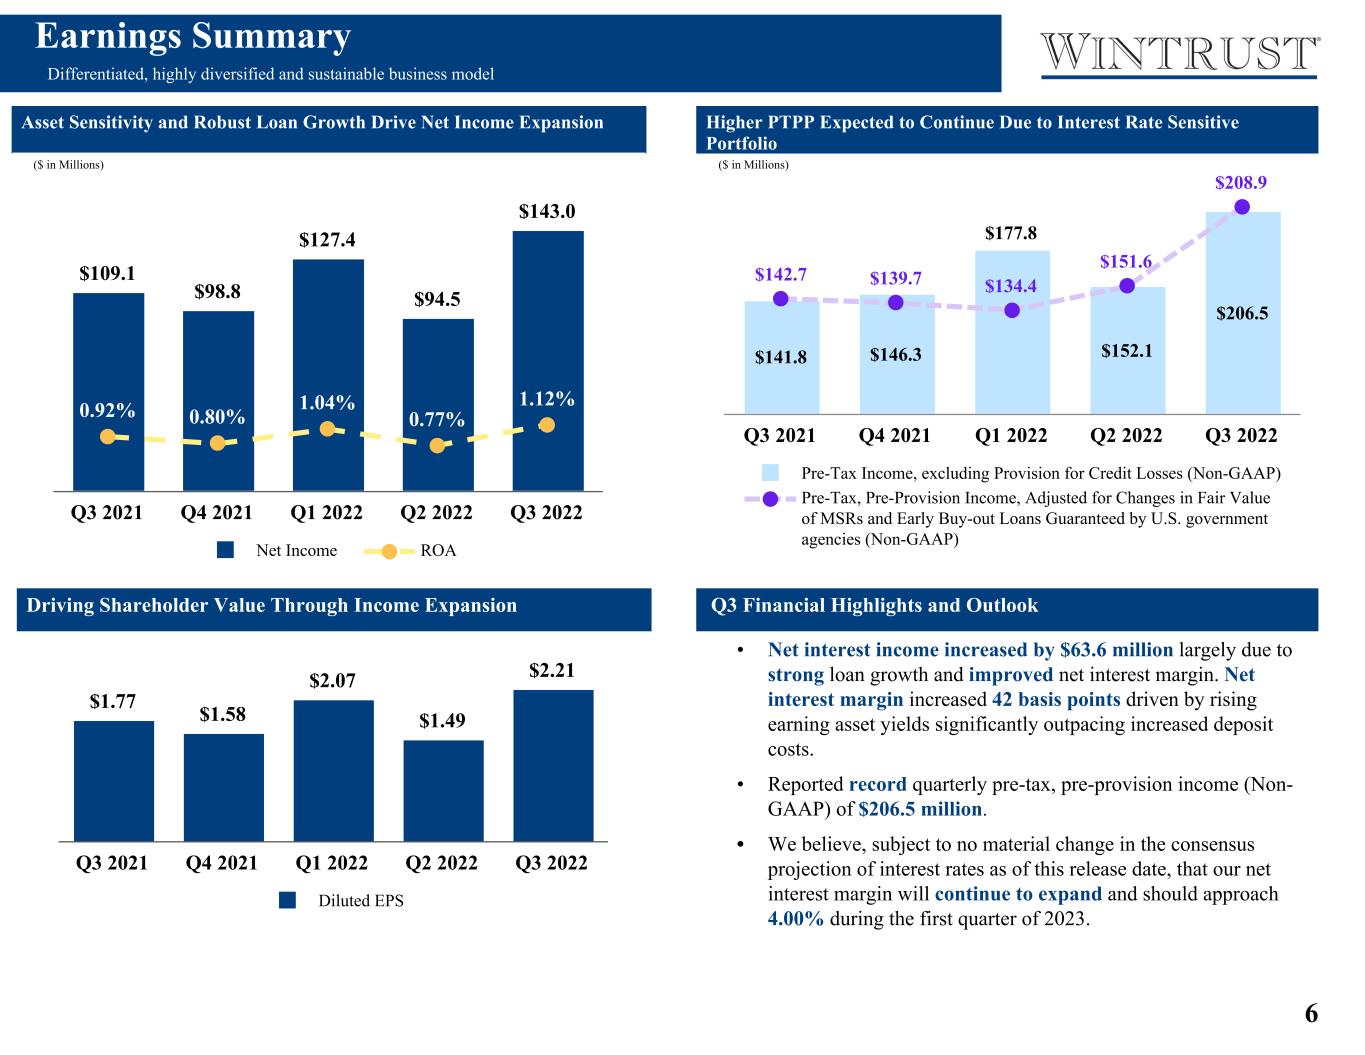
6 • Net losses on investment securities totaled $3.1 million in the third quarter of 2022 related to changes in the value of equity securities as compared to net losses of $7.8 million in the second quarter of 2022. • SAME CHANGE AS Q1 PG "INCREASED SHAREHOLDER VALUE" CHANGE • Net interest income increased by $63.6 million largely due to strong loan growth and improved net interest margin. Net interest margin increased 42 basis points driven by rising earning asset yields significantly outpacing increased deposit costs. • Reported record quarterly pre-tax, pre-provision income (Non- GAAP) of $206.5 million. • We believe, subject to no material change in the consensus projection of interest rates as of this release date, that our net interest margin will continue to expand and should approach 4.00% during the first quarter of 2023. Earnings Summary Differentiated, highly diversified and sustainable business model Asset Sensitivity and Robust Loan Growth Drive Net Income Expansion Key Observations Condensed Income Statement Current Q Difference vs.Current Q $109.1 $98.8 $127.4 $94.5 $143.0 0.92% 0.80% 1.04% 0.77% 1.12% Net Income ROA Q3 2021 Q4 2021 Q1 2022 Q2 2022 Q3 2022 $1.77 $1.58 $2.07 $1.49 $2.21 Diluted EPS Q3 2021 Q4 2021 Q1 2022 Q2 2022 Q3 2022 $141.8 $146.3 $177.8 $152.1 $206.5 $142.7 $139.7 $134.4 $151.6 $208.9 Pre-Tax Income, excluding Provision for Credit Losses (Non-GAAP) Pre-Tax, Pre-Provision Income, Adjusted for Changes in Fair Value of MSRs and Early Buy-out Loans Guaranteed by U.S. government agencies (Non-GAAP) Q3 2021 Q4 2021 Q1 2022 Q2 2022 Q3 2022 1 EBO: Early Buy-out Loans Guaranteed by U.S. government agencies 2 See Non-GAAP reconciliation in the Appendix Thousands ($) Q4 2021 Q3 2021 Q4 2020 Net Interest Income $295,976 $8,480 $36,579 Non-Interest Income $133,767 $(2,707) $(24,594) Net Revenue $429,743 $5,773 $11,985 Non-Interest Expense $283,399 $1,255 $1,532 Pre-Provision Net Revenue $146,344 $4,518 $10,453 Provision For Credit Losses $9,299 $17,215 $8,119 Income Before Taxes $137,045 $(12,697) $2,334 Income Tax Expense $38,288 $(2,317) $4,781 Net Income $98,757 $(10,380) $(2,447) Preferred Stock Dividends $6,991 $— $— Net Income Available to Common Shares $91,766 $(10,380) $(2,447) Diluted EPS $1.58 $(0.19) $(0.05) ROA 0.80% -12 bps -12 bps ROE 9.05% -126 bps -125 bps 2 ### 1 Q3 2020 had a $9.0 million state income tax benefit. ($ in Millions) ($ in Millions) Higher PTPP Expected to Continue Due to Interest Rate Sensitive Portfolio $287.50 $295.98 $299.29 $337.80 $401.45 $136.47 $133.77 $162.79 $102.94 101,482 $282.14 $283.40 $284.30 $288.67 296,469 Net Interest Income Non-Interest Income Non- Interest Expense Q3 2021 Q4 2021 Q1 2022 Q2 2022 Q3 2022 $0.00 $100.00 $200.00 $300.00 $400.00 $500.00 Q3 Financial Highlights and OutlookDriving Shareholder Value Through Income Expansion • Net losses on investment securities totaled $3.1 million in the third quarter of 2022 related to changes in the value of equity securities as compared to net losses of $7.8 million in the second quarter of 2022. • Recorded a net benefit of $445,000 related to essentially offsetting changes in the value of two mortgage assets in the second quarter of 2022. This consisted of a $7.5 million increase in the value of mortgage servicing rights (“MSR”) related to changes in fair value model assumptions and a negative $8.7 million valuation related adjustment on the Company’s portfolio of early buy-out exercised loans guaranteed by U.S. government agencies which are held at fair value. The change in value recorded in the first quarter of 2022 related to these two mortgage assets was a $9.1 million increase in value. • Recorded $2.5 million of losses in other non-interest income related to sale of a property no longer considered for future expansion and the anticipated sale of a former data processing facility. • Net interest income increased by $63.6 million largely due to strong loan growth and improved net interest margin . Net interest margin increased 42 basis points driven by rising earning asset yields significantly outpacing increased deposit costs. • We believe, subject to a material change in the consensus projection of interest rates as of this release date, that our net interest margin will continue to expand in the third and fourth quarters of 2022 and could approach 3.50% by the end of 2022. • Completed a common stock offering of 3,450,000 shares generating net proceeds of $285.7 million.
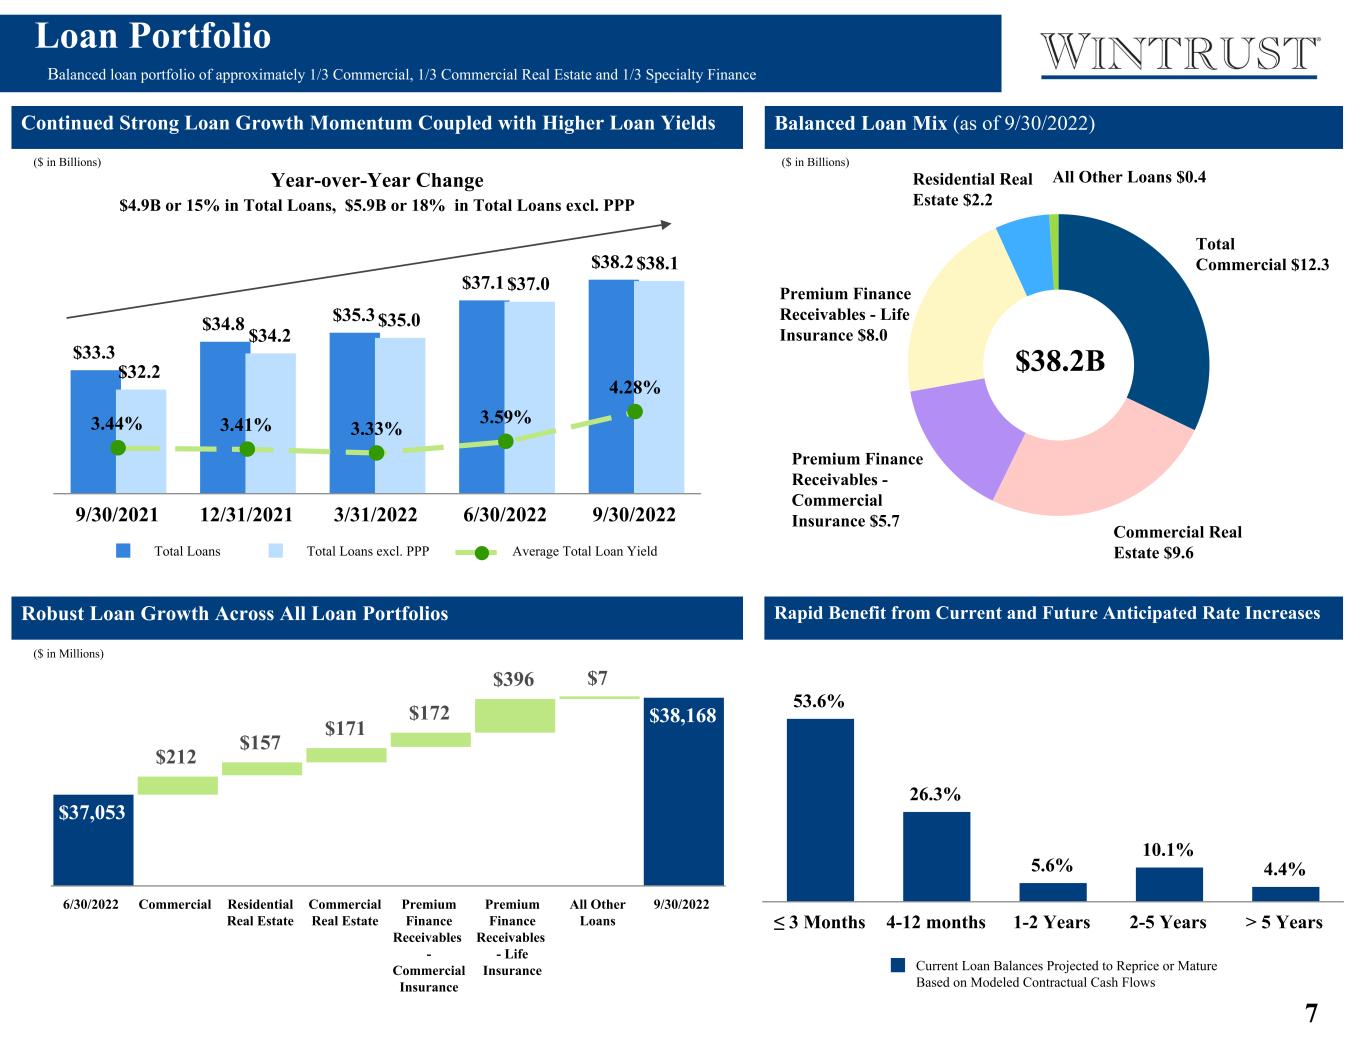
7 32% 0% 25% 1% 6% 15% 21% Commercial excl. PPP Commercial PPP Commercial Real Estate Home Equity Residential Real Estate Premium Finance Receivables - Commercial Premium Finance Receivables - Life Insurance • Before the impact of scheduled payments and prepayments, gross commercial and commercial real estate loan pipelines were estimated to be approximately $1.3 billion to $1.4 billion at September 30, 2022, as compared to $1.3 billion to $1.4 billion at June 30, 2022. When adjusted for the probability of closing, the pipelines were estimated to be approximately $878 million to $970 million at September 30, 2022, as compared to $874 million to $1.0 billion at June 30, 2022. • Total loans, excluding Paycheck Protection Program ("PPP") loans, increased by $2.0 billion, as compared to June 30, 2022, • Total period end loans as of September 30, 2022 were $1.1 billion higher than average total loans in the third quarter of 2022. $37,053 $212 $157 $171 $172 $396 $7 $38,168 6/30/2022 Commercial Residential Real Estate Commercial Real Estate Premium Finance Receivables - Commercial Insurance Premium Finance Receivables - Life Insurance All Other Loans 9/30/2022 Loan Portfolio Balanced loan portfolio of approximately 1/3 Commercial, 1/3 Commercial Real Estate and 1/3 Specialty Finance Continued Strong Loan Growth Momentum Coupled with Higher Loan Yields QoQ Growth Lead by Commercial & Acquired Loan Portfolio $33.3 $34.8 $35.3 $37.1 $38.2 $32.2 $34.2 $35.0 $37.0 $38.1 3.44% 3.41% 3.33% 3.59% 4.28% Total Loans Total Loans excl. PPP Average Total Loan Yield 9/30/2021 12/31/2021 3/31/2022 6/30/2022 9/30/2022 Year-over-Year Change $4.9B or 15% in Total Loans, $5.9B or 18% in Total Loans excl. PPP Balanced Loan Mix (as of 9/30/2022) Total Commercial $12.3 Commercial Real Estate $9.6 Premium Finance Receivables - Commercial Insurance $5.7 Premium Finance Receivables - Life Insurance $8.0 Residential Real Estate $2.2 All Other Loans $0.4 ($ in Billions) ($ in Millions) Key Observations Rapid Benefit from Current and Future Anticipated Rate Increases 53.6% 26.3% 5.6% 10.1% 4.4% Current Loan Balances Projected to Reprice or Mature Based on Modeled Contractual Cash Flows ≤ 3 Months 4-12 months 1-2 Years 2-5 Years > 5 Years $38.2B DONE Commercial excl. PPP $11.7 PPP $0.3 Commercial Real Estate $9.2 Premium Finance Receivables - Commercial Insurance $4.9 Premium Finance Receivables - Life Insurance $7.2 All Other Loans $3.2 Presentation draft doughnut chart left ($ in Billions) $37,053 $37,403 6/30/2022 Commercial PPP All Other Commercial Loans Commercial Real Estate Premium Finance Receivables - Commercial Insurance Premium Finance Receivables - Life Insurance All Other Loans 9/30/2022 Draft waterfall below 1 1 1 RELINK TEXT BOX TOT LOANS Robust Loan Growth Across All Loan Portfolios Pending from Mark B.
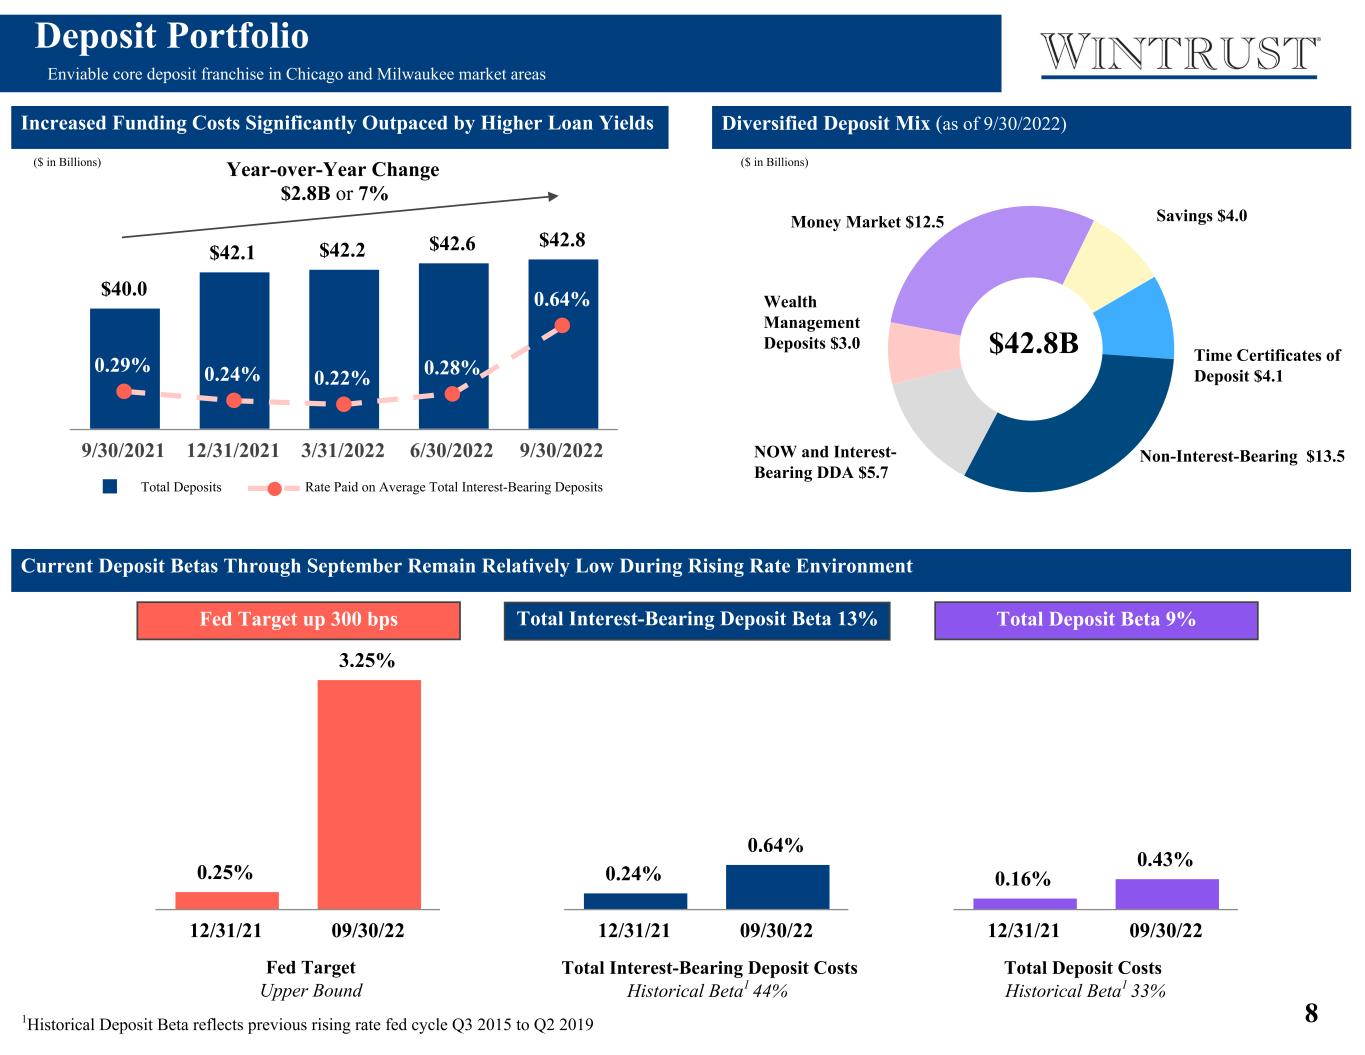
8 1 "Prior Fed Cycle" defined as Q3 2015 to Q2 2019 and "Current Fed Cycle" begins in Q3 2019 to present Current Deposit Betas Through September Remain Relatively Low During Rising Rate Environment • Total deposits increased by $0.2 billion from the prior quarter end. • Non-interest bearing deposits comprise 32% of total deposits as of September 30, 2022. • Rate paid on average interest-bearing deposits increased 36 basis points from the prior quarter. • The loans to deposits ratio ended the current quarter at 89.2% as compared to 87.0% at prior quarter end. $42,593 $(327) $(243) $(194) $265 $302 $400 $42,797 6/30/2022 Non-Interest-B earing NOW and Interest-B earing DDA Wealth Management Deposits Money Market Savings Time Certific ates of Deposit 9/30/2022 Deposit Portfolio Enviable core deposit franchise in Chicago and Milwaukee market areas Increased Funding Costs Significantly Outpaced by Higher Loan Yields Diversified Deposit Mix (as of 9/30/2022) Focused on low-cost deposit mix to drive margin expansion $40.0 $42.1 $42.2 $42.6 $42.8 0.29% 0.24% 0.22% 0.28% 0.64% Total Deposits Rate Paid on Average Total Interest-Bearing Deposits 9/30/2021 12/31/2021 3/31/2022 6/30/2022 9/30/2022 32% 13% 7% 29% 9% 10% Non-Interest-Bearing NOW and Interest-Bearing DDA Wealth Management Deposits Money Market Savings Time Certificates of Deposit Year-over-Year Change $2.8B or 7% Non-Interest-Bearing $13.5NOW and Interest- Bearing DDA $5.7 Wealth Management Deposits $3.0 Money Market $12.5 Savings $4.0 Time Certificates of Deposit $4.1 ($ in Billions) ($ in Billions) $42.8B 53% 44% Q3 2019 to Q4 2021 (–225 bps) Q3 2015 to Q2 2019 (+225 bps) Historical Interest-Bearing Deposit Betas Through Previous Fed Cycles Non Interest Bearing $12.6 NOW and Interest- Bearing DDA $19.9 Wealth Management Deposits $3.5 Money Market $2.1 Savings $2.5 Time Certificate of Deposits $2.2 Draft graph to left $42,593 $150 $(75) $100 $(50) $150 $100 $42,968 6/30/2022 Non-Interest-B earing NOW and Interest-B earing DDA Wealth Management Deposits Money Market Savings Time Certific ates of Deposit 9/30/2022 Draft waterfall below 1 55.6% 59.8% 20.0% 8.6% 24.4% 31.5% Non-Interest-Bearing Time Certificates of Deposit ("CD's") Interest-Bearing excl. CD's Q2 2019 Q3 2022 Deposit Growth Coupled with Decreasing Funding Costs 0.25% 3.25% 0.24% 0.64%0.46% 0.83% Fed Target Total Interest-Bearing Deposit Costs Total Deposit Costs 12/31/21 09/30/22 Total Interest-Bearing Beta 5% Total Deposit Beta 4% Fed Target up 300 bps Historical Interest-Bearing Beta1 44% 1Historical Deposit Beta reflects previous rising rate fed cycle Q3 2015 to Q2 2019 Fed Target up 300 bps 0.25% 3.25% 12/31/21 09/30/22 Total Interest-Bearing Deposit Beta 13% 0.24% 0.64% 12/31/21 09/30/22 Total Deposit Beta 9% 0.16% 0.43% 12/31/21 09/30/22 Fed Target Upper Bound Total Interest-Bearing Deposit Costs Historical Beta1 44% Total Deposit Costs Historical Beta1 33%
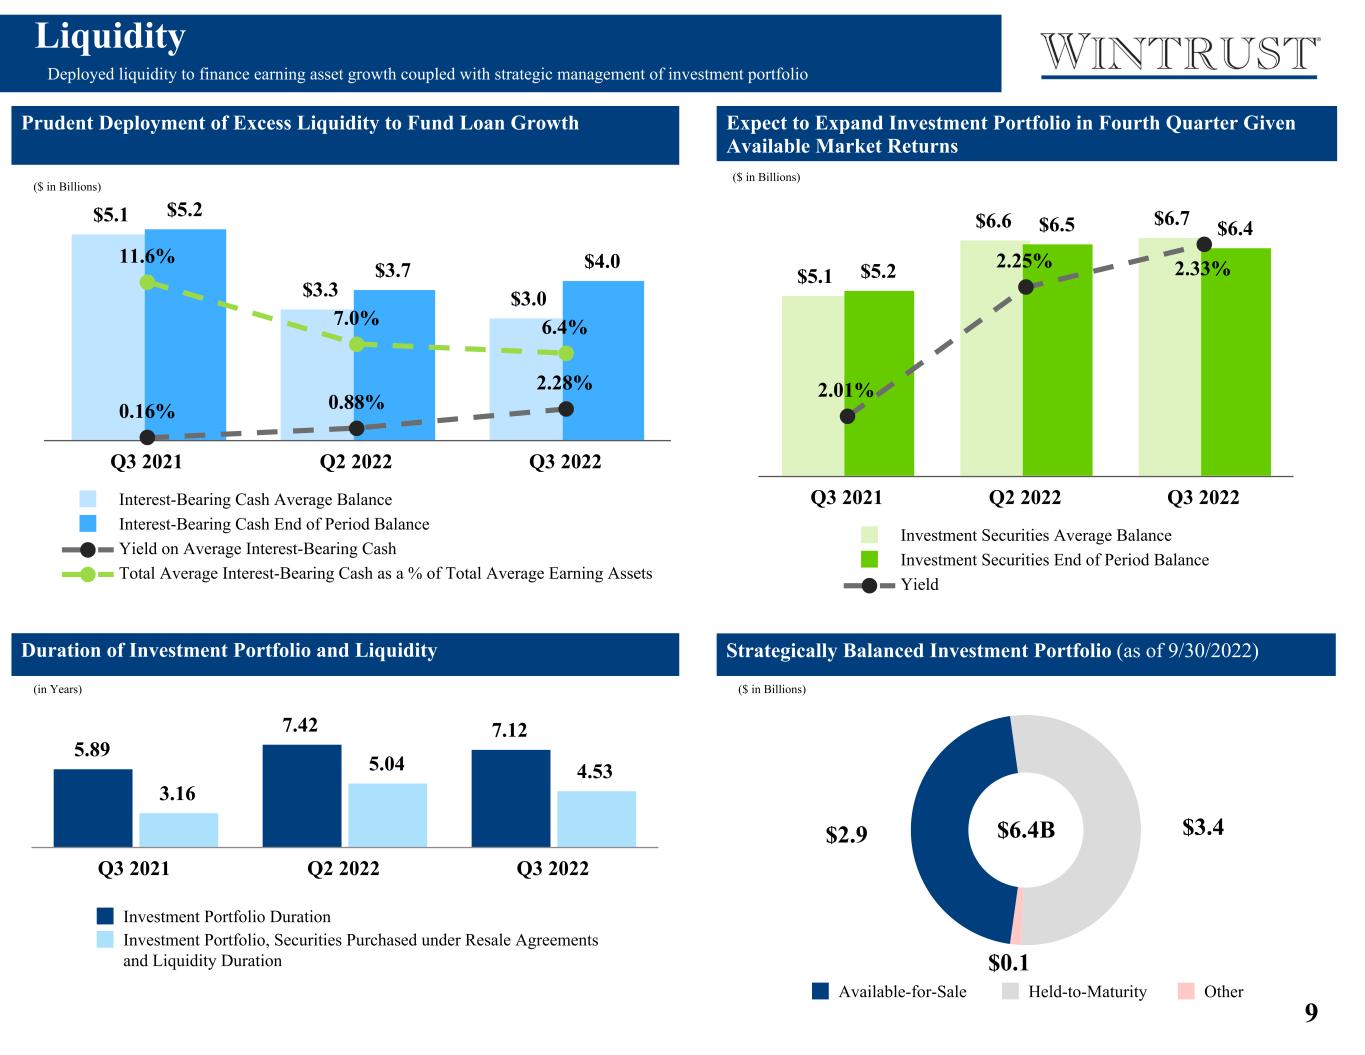
9 $5.1 $6.6 $6.7 $5.2 $6.5 $6.4 2.01% 2.25% 2.33% Investment Securities Average Balance Investment Securities End of Period Balance Yield Q3 2021 Q2 2022 Q3 2022 $5.1 $3.3 $3.0 $5.2 $3.7 $4.0 0.16% 0.88% 2.28% 11.6% 7.0% 6.4% Interest-Bearing Cash Average Balance Interest-Bearing Cash End of Period Balance Yield on Average Interest-Bearing Cash Total Average Interest-Bearing Cash as a % of Total Average Earning Assets Q3 2021 Q2 2022 Q3 2022 $2.9 $3.4 $0.1 Available-for-Sale Held-to-Maturity Other Prudent Deployment of Excess Liquidity to Fund Loan Growth Q1 21; Q4 21 ; Q1 22- remove 2020 period (All three graphics) Liquidity Deployed liquidity to finance earning asset growth coupled with strategic management of investment portfolio • We continue to maintain excess liquidity and believe that deploying such liquidity could potentially increase our net interest margin and net interest income. • We remain well positioned to benefit from a higher rate environment and are monitoring the available market returns on investments. We intend to be prudent in our decision making. Strategically Balanced Investment Portfolio (as of 9/30/2022) $2.2 $5.1 $3.0 $— $5.2 $4.0 1.68% 0.16% Average Balance End of Period Balance Yield Q1 2020 Q3 2021 Q3 2022 Duration of Investment Portfolio and Liquidity $32.7 $44.2 $47.7 $2.2 $5.1 $3.0 6.7% 11.5% 6.3% Total Average Earning Assets Total Average Interest-Bearing Cash Total Average Interest-Bearing Cash as a % of Total Average Earning... Q1 2020 Q3 2021 Q3 2022 Expect to Expand Investment Portfolio in Fourth Quarter Given Available Market Returns 1 Total Interest-Bearing Deposits with Banks, Securities Purchased under Resale Agreements and Cash Equivalents 1 1 ($ in Billions) ($ in Billions) ($ in Billions) Liquidity Focused on taking advantage of market opportunities to prudently deploy excess liquidity ($ in Billions) $6.4B 44.23% 55.77% Available for Sale Held-to-Maturity Sustained Earning Asset Growth while Maintaining adequate levels of Interest-Bearing Cash1 Interest-Bearing Cash1 Intentionally Maintained to Limit Locking in Low Interest Rates 5.89 7.42 7.12 3.16 5.04 4.53 Investment Portfolio Duration Investment Portfolio, Securities Purchased under Resale Agreements and Liquidity Duration Q3 2021 Q2 2022 Q3 2022 (in Years) subnotes look weird but print ok Focused on taking advantage of market opportunities to prudently deploy excess liquidity
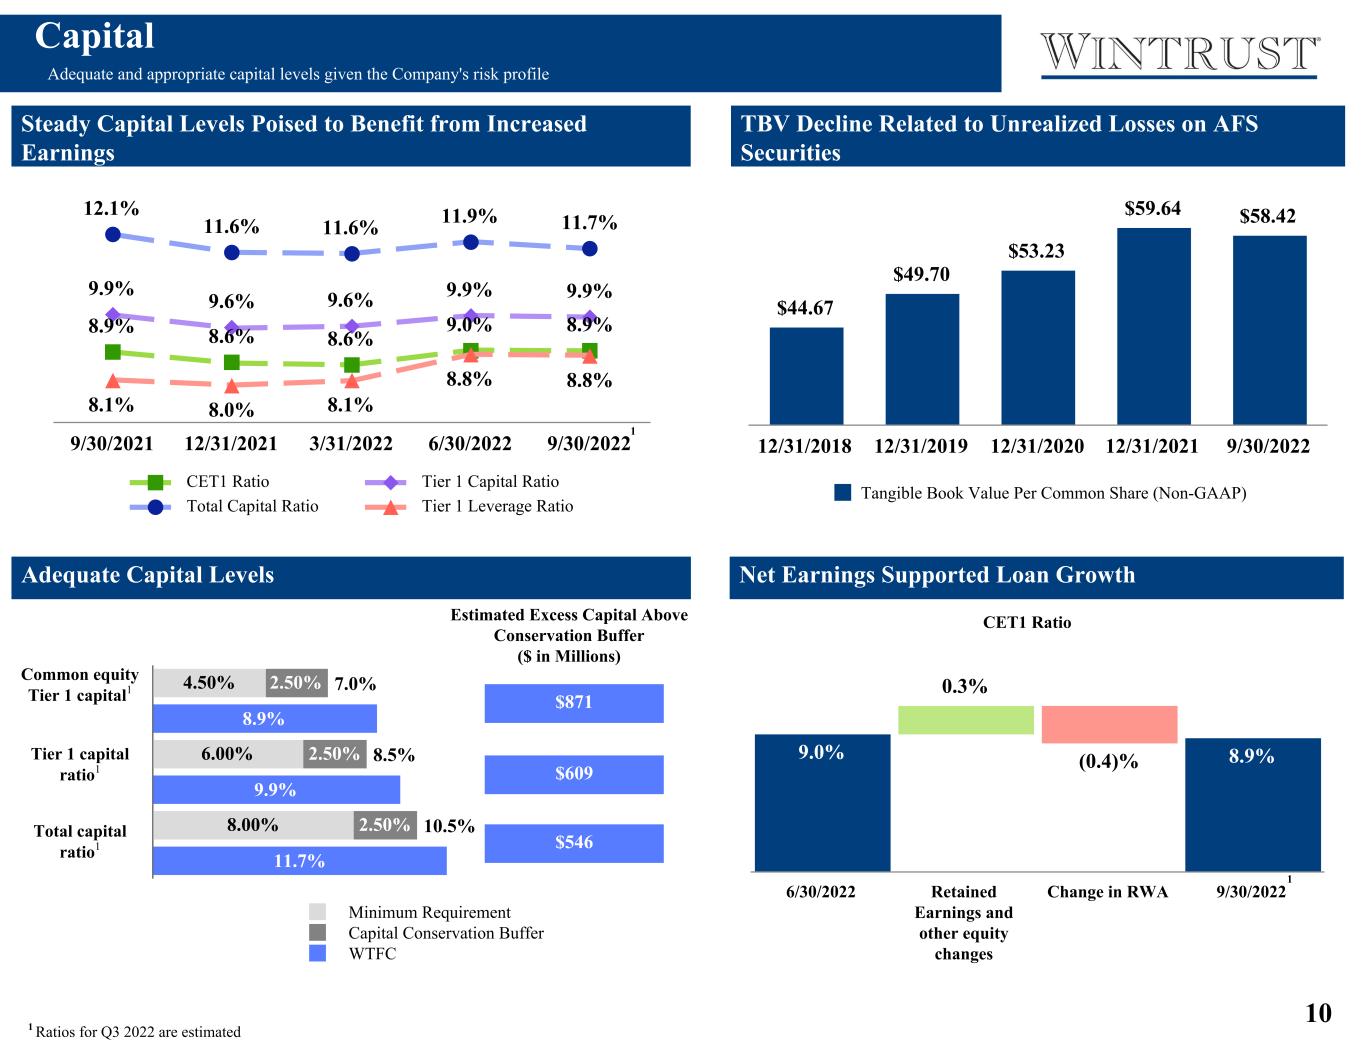
10 9.0% 0.3% (0.4)% 8.9% 6/30/2022 Retained Earnings and other equity changes Change in RWA 9/30/2022 No. 3 footnote prints correctly as is 7.0% 8.5% 10.5% 4.50% 6.00% 8.00% 2.50% 2.50% 2.50% 8.9% 9.9% 11.7% Minimum Requirement Capital Conservation Buffer WTFC 11.9% 0.2% (0.4)% 11.7% 6/30/2022 Retained Earnings and other equity changes Change in RWA 9/30/2022 Capital Adequate and appropriate capital levels given the Company's risk profile Q3 2022 Key Observations Adequate Capital Levels • Common Equity Tier 1 Capital and Total Capital ratios decreased primarily due to risk-weighted asset growth in Q4 2021. • Q3 2022 dividend of $0.31 per common share increased 11% from Q3 2021. • Tangible book value per common share decreased $-1.45 from the prior quarter-end and decreased $0.10 or 0.2% from Q3 2021. Steady Capital Levels Poised to Benefit from Increased Earnings Q3 2021 Q4 2021 Q1 2022 Q2 2022 Q3 2022 Common equity tier 1 capital ratio1 8.9% 8.6% 8.6% 9.0% 8.9% Tier 1 capital ratio1 9.9% 9.6% 9.6% 9.9% 9.9% Total capital ratio1 12.1% 11.6% 11.6% 11.9% 11.7% Tier 1 leverage ratio1 8.1% 8.0% 8.1% 8.8% 8.8% Tangible book value per common share (Non-GAAP2) $58.32 $59.64 $59.34 $59.87 $58.42 Estimated Excess Capital Above Conservation Buffer ($ in Millions) Common equity Tier 1 capital1 Tier 1 capital ratio1 Total capital ratio1 $871 $609 $546 1 Ratios for Q3 2022 are estimated 8.9% 8.6% 8.6% 9.0% 8.9% 9.9% 9.6% 9.6% 9.9% 9.9% 12.1% 11.6% 11.6% 11.9% 11.7% 8.1% 8.0% 8.1% 8.8% 8.8% CET1 Ratio Tier 1 Capital Ratio Total Capital Ratio Tier 1 Leverage Ratio 9/30/2021 12/31/2021 3/31/2022 6/30/2022 9/30/2022 Net Earnings Supported Loan Growth Q3 2021 Q4 2021 Q1 2022 Q2 2022 Q3 2022 Tangible book value per common share (Non-GAAP2) $58.32 $59.64 $59.34 $59.87 $58.42 1 5 5 RWA: Risk-Weighted Assets $58.32 $59.64 $59.34 $59.87 $58.42 7.0% 6.9% 6.9% 7.2% 6.9% Tangible Book Value Per Share (Non-GAAP ) Tangible Common Equity Ratio (Non-GAAP ) 9/30/2021 12/31/2021 3/31/2022 6/30/2022 9/30/2022 TBV Decline Related to Unrealized Losses on AFS Securities 5 TCE: Tangible Common Equity (Non-GAAP) 6 See Non-GAAP reconciliation on pg. 26 6 63 TBV: Tangible Book Value per Common Share (Non-GAAP) – See Non-GAAP reconciliation in the Appendix 4 RWA: Risk-Weighted Assets Linked chart below Capital Risk-Weighted Assets are inflated by Premium Finance Life portfolio; 100% risk rated with no historical losses $59.34 $1.65 $(2.01) $(0.46) $1.35 $59.87 6/30/2022 Earnings Change in OCI Dividends Stock Issuance & Other 9/30/2022 4 Add "Total Risk Based Capital" CET1 Ratio $44.67 $49.70 $53.23 $59.64 $58.42 Tangible Book Value Per Common Share (Non-GAAP) 12/31/2018 12/31/2019 12/31/2020 12/31/2021 9/30/2022 1
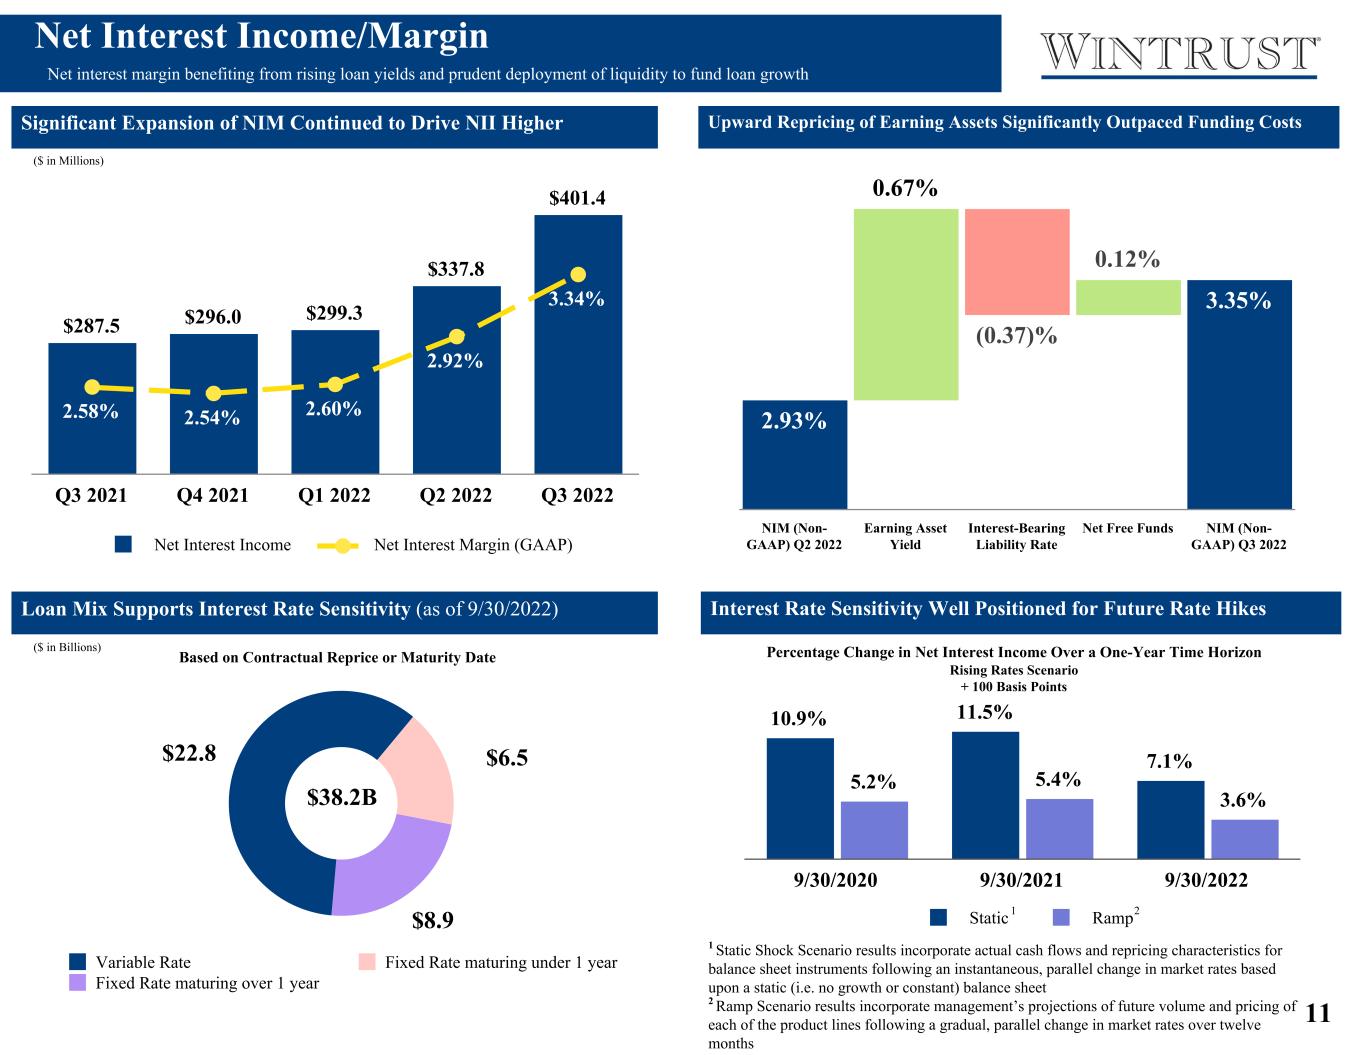
11 2.93% 0.67% (0.37)% 0.12% 3.35% NIM (Non- GAAP) Q2 2022 Earning Asset Yield Interest-Bearing Liability Rate Net Free Funds NIM (Non- GAAP) Q3 2022 $22.8 $6.5 $8.9 Variable Rate Fixed Rate maturing under 1 year Fixed Rate maturing over 1 year 10.9% 11.5% 7.1% 5.2% 5.4% 3.6% Static Ramp 9/30/2020 9/30/2021 9/30/2022 2.58% 2.54% 2.60% 2.92% 3.34%2.59% 2.55% 2.61% 2.93% Net Interest Margin (GAAP) Net Interest Margin, Fully Taxable-Equivalent (Non-GAAP ) Q3 2021 Q4 2021 Q1 2022 Q2 2022 Q3 2022 Net Interest Income/Margin Net interest margin benefiting from rising loan yields and prudent deployment of liquidity to fund loan growth Upward Repricing of Earning Assets Significantly Outpaced Funding Costs Significant Expansion of NIM Continued to Drive NII Higher Net Interest Margin (Quarterly Trends) 2.93% 3.35% Q2 2022 Earning Asset Yield Interest B earing Liability Rate Net Free Funds Q3 2022 • Q3 2022 net interest income totaled $401.4 million. ◦ A decrease of $63.6 million as compared to Q2 2022 and a decrease of $114.0 million as compared to Q3 2021. • Net interest margin (Non-GAAP1) increased by 42 bps from the prior quarter: ◦ Earning assets yield up 67 bps. ◦ Interest bearing liability rate up 37 bps. ◦ Net free funds up 12 bps. • Net interest income increased by $63.6 million###### • Net interest margin increased by 42 basis points primarily due to increasing loan yields and the deployment of liquidity to fund loan growth.. ◦ The rate on interest bearing deposits declined by five basis points which more than offset a three basis point decline in loan yields. • As of December 31, 2021, the Company had approximately $12.7 million of net PPP loan fees that have yet to be recognized in income. $287.50 $295.98 $299.29 $337.80 $401.45 2.58% 2.54% 2.60% 2.92% 3.34% Net Interest Income Net Interest Margin (GAAP) Q3 2021 Q4 2021 Q1 2022 Q2 2022 Q3 2022 Interest Rate Sensitivity Well Positioned for Future Rate Hikes $287.5 $296.0 $299.3 $337.8 $401.4 $266.3 $281.8 $291.8 $332.9 $400.8 $21.2 $14.2 $7.4 2.58% 2.54% 2.60% 2.92% 3.34% Net Interest Income excl. PPP PPP Interest Income Net Interest Margin (GAAP) Q3 2021 Q4 2021 Q1 2022 Q2 2022 Q3 2022 Linked graph left 2.58% 2.54% 2.60% 2.92% 2.56% 2.59% 2.55% 2.61% 2.93% 2.57% Net Interest Margin (GAAP) Net Interest Margin, Fully Taxable-Equivalent (Non-GAAP ) Q3 2021 Q4 2021 Q1 2022 Q2 2022 Q3 2022 2.93% 2.98% Q2 2022 Earning Asset Yield Interest B earing Liability Rate Net Free Funds Q3 2022 Trending floating of variable, or snapshot of where we are today NEW CHART pie var vs fixed Donut prints weird middle needs to be higher 1 Static Shock Scenario results incorporate actual cash flows and repricing characteristics for balance sheet instruments following an instantaneous, parallel change in market rates based upon a static (i.e. no growth or constant) balance sheet 2 Ramp Scenario results incorporate management’s projections of future volume and pricing of each of the product lines following a gradual, parallel change in market rates over twelve months 1 2 Loan Mix Supports Interest Rate Sensitivity (as of 9/30/2022) Use Table 9 for doughnut to link $38.2B ($ in Millions) ($ in Billions) (Rising Rates Scenario + 100 Basis Points ) footnotes print correct as is Percentage Change in Net Interest Income Over a One-Year Time Horizon Rising Rates Scenario + 100 Basis Points Based on Contractual Reprice or Maturity Date 1 See Non-GAAP reconciliation in the Appendix $0.6 $4.9 $287.5 $296.0 $299.3 $337.8 $401.4 2.58% 2.54% 2.60% 2.92% 3.34% Net Interest Income Net Interest Margin (GAAP) Q3 2021 Q4 2021 Q1 2022 Q2 2022 Q3 2022
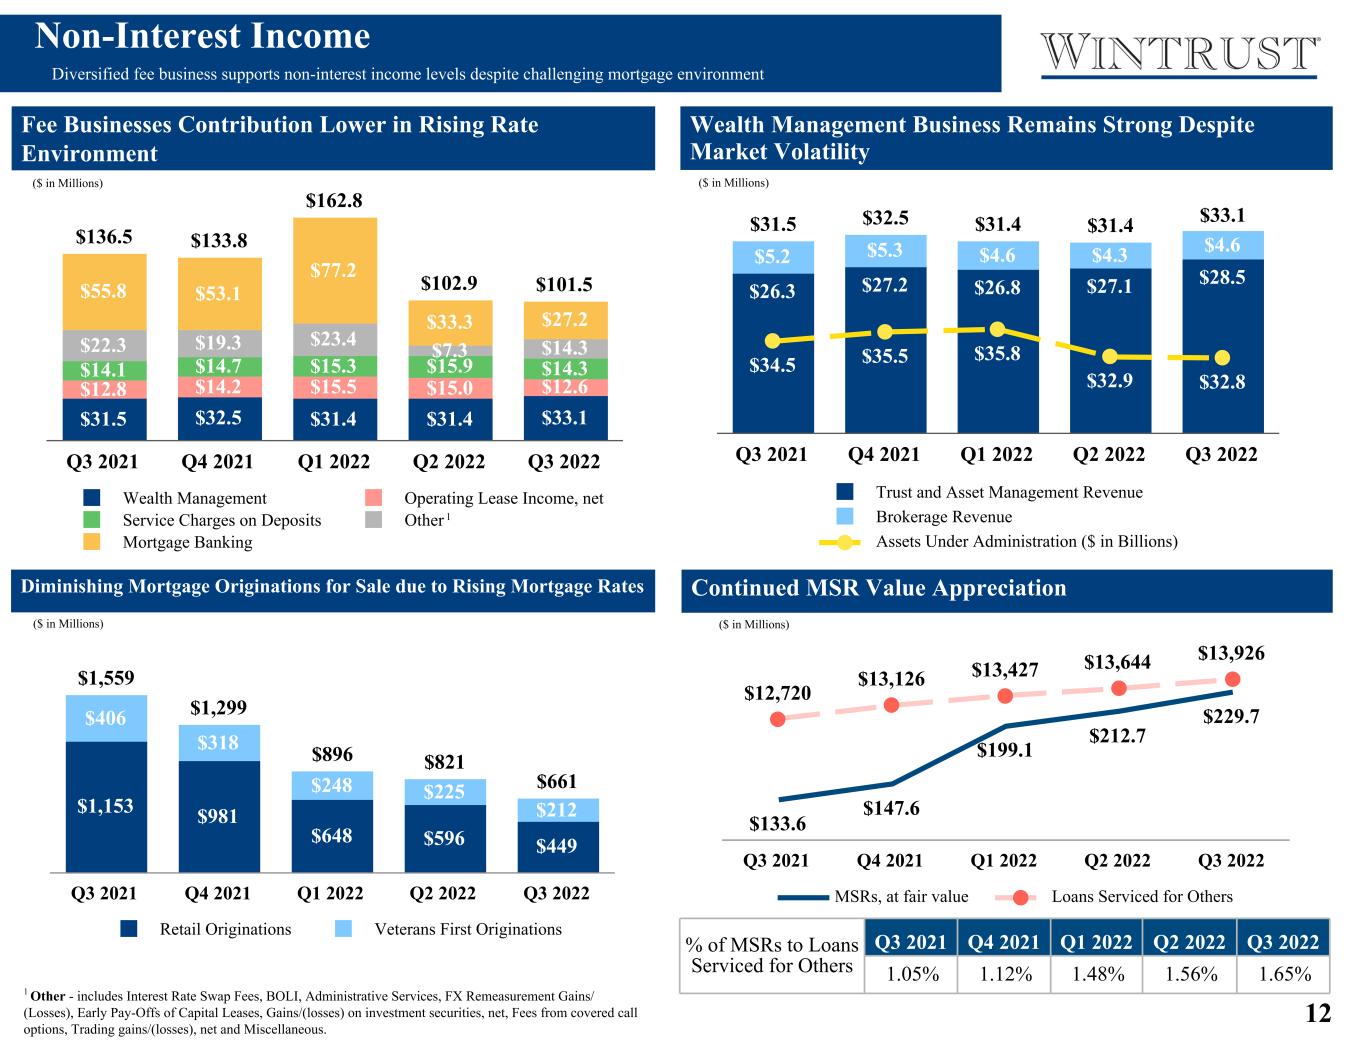
12 $136.5 $133.8 $162.8 $102.9 $101.5 $31.5 $32.5 $31.4 $31.4 $33.1 $12.8 $14.2 $15.5 $15.0 $12.6 $14.1 $14.7 $15.3 $15.9 $14.3 $22.3 $19.3 $23.4 $7.3 $14.3 $55.8 $53.1 $77.2 $33.3 $27.2 Wealth Management Operating Lease Income, net Service Charges on Deposits Other Mortgage Banking Q3 2021 Q4 2021 Q1 2022 Q2 2022 Q3 2022 Diminishing Mortgage Originations for Sale due to Rising Mortgage Rates Fee Businesses Contribution Lower in Rising Rate Environment Growing Wealth Management Business • Non-interest income totaled $101.5 million. ◦ A decrease of $1.5 million as compared to Q2 2022 and a decrease of $35.0 million as compared to Q3 2021. • Mortgage banking revenue decreased by $6.1 million in Q3 2022 as compared to Q2 2022. See detail on Slide 13. • Wealth management income increased $1,755,000 as compared to Q2 2022. 1 Other - includes Interest Rate Swap Fees, BOLI, Administrative Services, FX Remeasurement Gains/ (Losses), Early Pay-Offs of Capital Leases, Gains/(losses) on investment securities, net, Fees from covered call options, Trading gains/(losses), net and Miscellaneous. 1 $31.5 $32.5 $31.4 $31.4 $33.1 $26.3 $27.2 $26.8 $27.1 $28.5 $5.2 $5.3 $4.6 $4.3 $4.6 $34.5 $35.5 $35.8 $32.9 $32.8 Trust and Asset Management Revenue Brokerage Revenue Assets Under Administration ($ in Billions) Q3 2021 Q4 2021 Q1 2022 Q2 2022 Q3 2022 Operating Lease Portfolio Contributes Meaningful Fee Income $12.8 $14.2 $15.5 $15.0 $12.6 $243.9 $242.1 $240.7 $223.8 $244.8 Operating Lease Income, Net Lease Investments, Net (Period-End Balance) Q3 2021 Q4 2021 Q1 2022 Q2 2022 Q3 2022 • primarily due to increased trust and asset management fees and brokerage commissions Confirm AUM correct for all periods. Non-Interest Income Diversified fee business supports non-interest income levels despite challenging mortgage environment ($ in Millions) ($ in Millions) ($ in Millions) $14.1 $14.7 $15.3 $15.9 $14.3 $12.9 $13.2 $13.6 $14.3 $12.6 $1.2 $1.5 $1.7 $1.6 $1.7 Commercial Service Charges on Deposits Consumer Service Charges on Deposits Q3 2021 Q4 2021 Q1 2022 Q2 2022 Q3 2022 Year-over-Year Change $(0.2)M or (2)% ($ in Millions) Split into business and consumer? Wealth Management Business Remains Strong Despite Market Volatility Continued MSR Value Appreciation % of MSRs to Loans Serviced for Others Q3 2021 Q4 2021 Q1 2022 Q2 2022 Q3 2022 1.05% 1.12% 1.48% 1.56% 1.65% $133.6 $147.6 $199.1 $212.7 $229.7 $12,720 $13,126 $13,427 $13,644 $13,926 MSRs, at fair value Loans Serviced for Others Q3 2021 Q4 2021 Q1 2022 Q2 2022 Q3 2022 ($ in Millions) $1,559 $1,299 $896 $821 $661 $1,153 $981 $648 $596 $449 $406 $318 $248 $225 $212 Retail Originations Veterans First Originations Q3 2021 Q4 2021 Q1 2022 Q2 2022 Q3 2022 ($ in Millions)
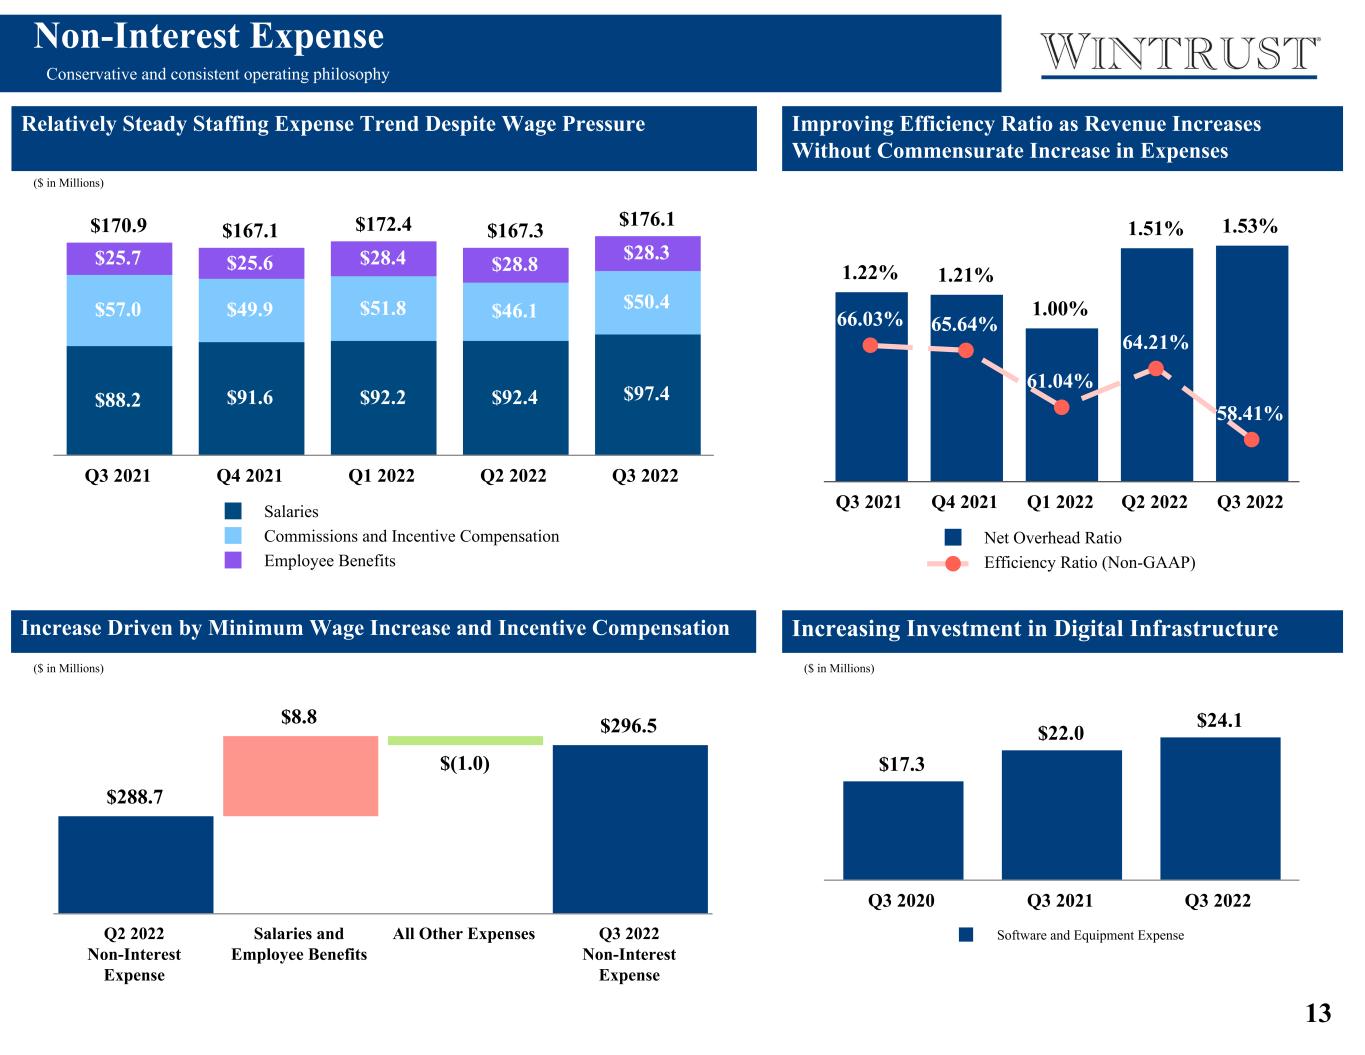
13 $170.9 $167.1 $172.4 $167.3 $176.1 $88.2 $91.6 $92.2 $92.4 $97.4 $57.0 $49.9 $51.8 $46.1 $50.4 $25.7 $25.6 $28.4 $28.8 $28.3 Salaries Commissions and Incentive Compensation Employee Benefits Q3 2021 Q4 2021 Q1 2022 Q2 2022 Q3 2022 1.22% 1.21% 1.00% 1.51% 1.53% 66.03% 65.64% 61.04% 64.21% 58.41% Net Overhead Ratio Efficiency Ratio (Non-GAAP) Q3 2021 Q4 2021 Q1 2022 Q2 2022 Q3 2022 Non-Interest Expense Conservative and consistent operating philosophy Relatively Steady Staffing Expense Trend Despite Wage Pressure Items Impacting Quarterly Comparability • Salaries and employee benefits expense decreased by $3.8 million in the fourth quarter of 2021 as compared to the third quarter of the year. ◦ ### • Software and equipment expense increase of $1.7 million is primarily due to accelerated depreciation in the quarter related to the reduction in the useful life of a software asset that is planned to be replaced as we continue to make upgrades to our digital customer experience. 1 Other NIE - includes Professional Fees, Data Processing, amortization of other intangible assets, FDIC insurance, OREO expense, net, Commissions (3rd Party Brokers), Postage and Miscellaneous $288.7 $8.8 $(1.0) $296.5 Q2 2022 Non-Interest Expense Salaries and Employee Benefits All Other Expenses Q3 2022 Non-Interest Expense 1 1 Net Overhead Ratio - The net overhead ratio is calculated by netting total non-interest expense and total non-interest income, annualizing this amount, and dividing by that period's average total assets. A lower ratio indicates a higher degree of efficiency. 2 See Non-GAAP reconciliation in the Appendix Salaries and employee benefits expense decreased by $1.9 million in the third quarter of 2021 as compared to the second quarter of the year. The $1.9 million decline is primarily related to $6.3 million of lower compensation expense associated with the mortgage banking operation offset somewhat by higher incentive compensation expense for annual bonus and long-term incentive compensation plans during the third quarter relative to the second quarter. • Salaries and employee benefits decrease comprised of: ◦ ### increase in commissions and incentive compensation. ◦ ### decrease in employee benefits expense. ◦ ### decrease in salaries. • Advertising and marketing increase of ### ###. ($ in Millions) $286.9 $286.9 $280.1 $282.1 $0.0 $180.8 $180.8 $172.8 $170.9 $— $20.9 $20.9 $20.9 $22.0 $20.0 $20.0 $17.7 $18.2 $8.5 $8.5 $11.3 $13.4 $10.8 $10.8 $9.9 $10.0 $45.9 $45.9 $47.5 $47.6 Salaries and Employee Benefits Software and Equipment Occupancy, net Advertising and Marketing Operating Lease Equipment Other Q1 2021 Q2 2021 Q3 2021 Q4 2021 Q1 2022 $17.3 $22.0 $24.1 Software and Equipment Expense Q3 2020 Q3 2021 Q3 2022 Increasing Investment in Digital Infrastructure ($ in Millions) 1 FTE - Full-Time Equivalent Employees 1 ($ in Millions) Update title Increase Driven by Minimum Wage Increase and Incentive Compensation Improving Efficiency Ratio as Revenue Increases Without Commensurate Increase in Expenses
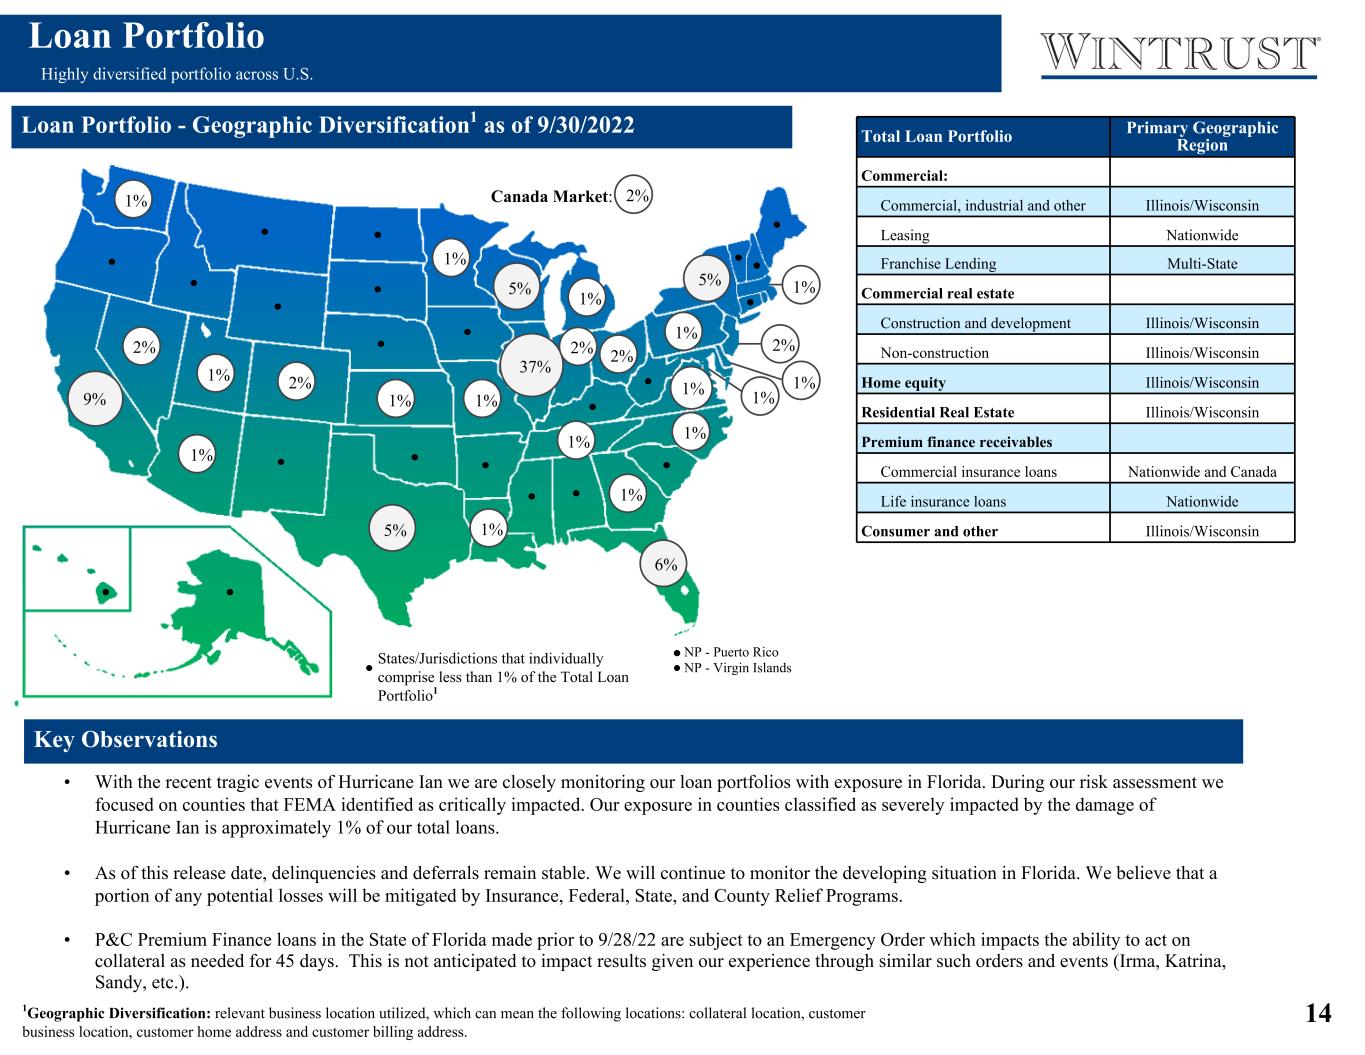
14 Canada Market: Loan Portfolio - Geographic Diversification1 as of 9/30/2022 Total Loan Portfolio Primary Geographic Region Commercial: Commercial, industrial and other Illinois/Wisconsin Leasing Nationwide Franchise Lending Multi-State Commercial real estate Construction and development Illinois/Wisconsin Non-construction Illinois/Wisconsin Home equity Illinois/Wisconsin Residential Real Estate Illinois/Wisconsin Premium finance receivables Commercial insurance loans Nationwide and Canada Life insurance loans Nationwide Consumer and other Illinois/Wisconsin 1Geographic Diversification: relevant business location utilized, which can mean the following locations: collateral location, customer business location, customer home address and customer billing address. Key Observations • Primarily focused in the Midwest with a presence in Western and Southern U.S. markets. • National niche lending businesses create a diversified loan portfolio. States/Jurisdictions that individually comprise less than 1% of the Total Loan Portfolio1 2% 9% 6% 37% 2% 2% 5% 2% 5% NP - Puerto Rico NP - Virgin Islands 1% 1% 1% 2% 1% 2% 5% 1% 1% 1% 1% 1% 1% 1% 1% 1% 1% 1% 1% 1% Loan Portfolio Highly diversified portfolio across U.S. • With the recent tragic events of Hurricane Ian we are closely monitoring our loan portfolios with exposure in Florida. During our risk assessment we focused on counties that FEMA identified as critically impacted. Our exposure in counties classified as severely impacted by the damage of Hurricane Ian is approximately 1% of our total loans. • As of this release date, delinquencies and deferrals remain stable. We will continue to monitor the developing situation in Florida. We believe that a portion of any potential losses will be mitigated by Insurance, Federal, State, and County Relief Programs. • P&C Premium Finance loans in the State of Florida made prior to 9/28/22 are subject to an Emergency Order which impacts the ability to act on collateral as needed for 45 days. This is not anticipated to impact results given our experience through similar such orders and events (Irma, Katrina, Sandy, etc.). • With the recent tragic events of Hurricane Ian we are closely monitoring our loan portfolios with exposure in Florida. During our risk assessment we focused on counties that FEMA identified as critically impacted. Our Exposure in counties classified as severely impacted by the damage of Hurricane Ian are as follows: ◦ Residential: 56% of Total Florida Mortgage Loans ◦ Specialty Finance Portfolio: 40% of Total Florida Equipment Leases • As of this release date, delinquencies and deferrals remain stable. We will continue to monitor the developing situation in Florida.We believe that a portion of any potential losses will be offset by Insurance, Federal, State, and County Relief Programs.
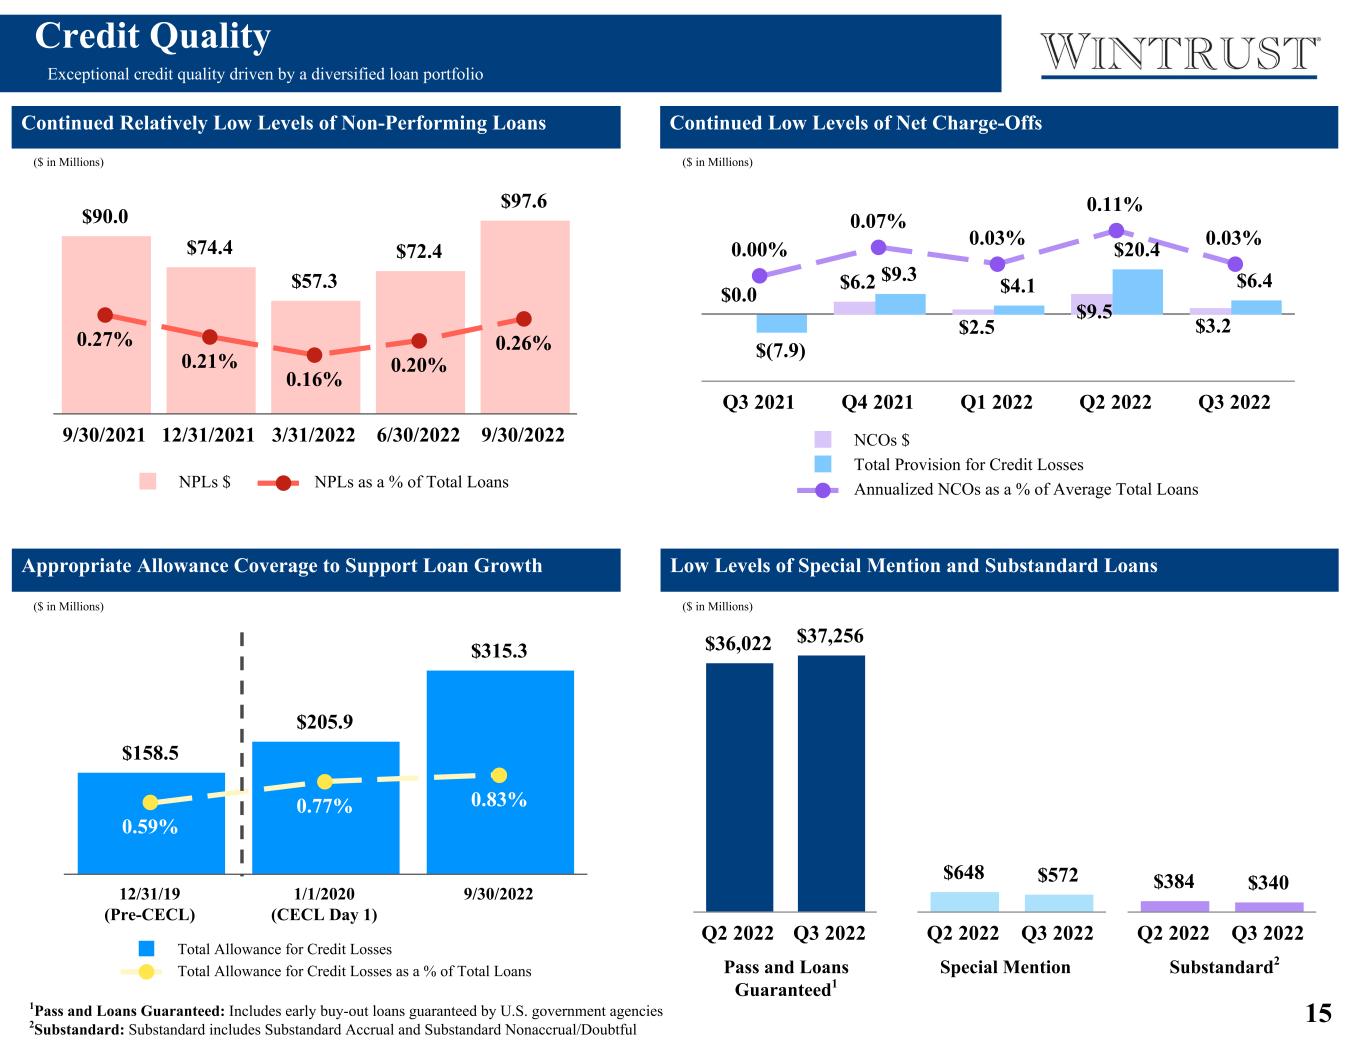
15 $158.5 $205.9 $315.3 0.59% 0.77% 0.83% Total Allowance for Credit Losses Total Allowance for Credit Losses as a % of Total Loans 12/31/19 (Pre-CECL) 1/1/2020 (CECL Day 1) 9/30/2022 Credit Quality Exceptional credit quality driven by a diversified loan portfolio • The Company estimates an increase to the allowance for credit losses of approximately 30% to 50% at adoption related to its loan portfolios and related lending commitments. Approximately 80% of the estimated increase is related to: ◦ Additions to existing reserves for unfunded lending-related commitments due to the consideration under CECL of expected utilization by the Company's borrowers over the life of such commitments. ◦ Establishment of reserves for acquired loans which previously considered credit discounts. The Company estimates an insignificant impact at adoption of measuring an allowance for credit losses for other in-scope assets (e.g. held-to-maturity debt securities). Continued Relatively Low Levels of Non-Performing Loans Continued Low Levels of Net Charge-Offs $90.0 $74.4 $57.3 $72.4 $97.6 0.27% 0.21% 0.16% 0.20% 0.26% NPLs $ NPLs as a % of Total Loans 9/30/2021 12/31/2021 3/31/2022 6/30/2022 9/30/2022 $0.0 $6.2 $2.5 $9.5 $3.2 $(7.9) $9.3 $4.1 $20.4 $6.4 0.00% 0.07% 0.03% 0.11% 0.03% NCOs $ Total Provision for Credit Losses Annualized NCOs as a % of Average Total Loans Q3 2021 Q4 2021 Q1 2022 Q2 2022 Q3 2022 $(7.9) $9.3 $4.1 $20.4 $6.4 63.27% 61.67% 46.51% 49.36% Total Provision for Credit Losses Net Charge-Offs as a % of the Provision for Credit Losses 9/30/2021 12/31/2021 3/31/2022 6/30/2022 9/30/2022 $7.8 $52.97 $135.1 $0 $0 $— $0.5 $— $0.0 $0.0$7.8 $52.5 $135.1 — — 63.3% 61.7% 46.5% 49.4% Provision for credit losses - PCD Provision for credit losses - non PCD Net charge-offs as a percentage of the provision for credit losses Q3 2021 Q4 2021 Q1 2022 Q2 2022 Q3 2022 Incurred Loss Method CECL Incurred Loss Method CECL Q3 2022 Q2 2022 Increase/ (Decrease) Pass $ 33,700,724 $ 32,045,349 $ 1,655,375 Special Mention 755,859 794,238 (38,379) Substandard Accrual 265,452 340,516 (75,064) Substandard Nonaccrual/Doubtful 67,069 83,940 (16,871) Total Loans $ 34,789,104 $ 33,264,043 $ 1,525,061 Q3 2022 Key Observations During the fourth quarter of 2021, we continued our practice of pursuing the resolution of non-performing credits and executed a loan sale that reduced non-performing loans by approximately $10 million resulting in $1.8 million of net charge-offs. The key drivers of the shift in credit quality mix include: • Risk rating upgrades as a result of improved credit performance. • Increase in pass rated credits was driven by commercial loan growth and higher utilization on existing lines partially offset by decline in PPP Loans. ($ in Millions) ($ in Millions) ($ in Millions) Appropriate Allowance Coverage to Support Loan Growth $36,022 $37,256 Q2 2022 Q3 2022 $648 $572 Q2 2022 Q3 2022 $384 $340 Q2 2022 Q3 2022 $83.94 $67.07 Q4 2021 Q1 2022 Q4 2021 Pass Special Mention Substandard Accrual Substandard nonaccrual Q1 2022 $340.52 $265.45 Q4 2021 Q1 2022 Pass and Loans Guaranteed1 ($ in Millions) Special Mention Substandard2 $158.5 $205.9 $296.1 $315.3 0.59% 0.77% 0.89% 0.83% Total Allowance for Credit Losses Total Allowance for Credit Losses as a % of Total Loans 12/31/19 (Pre-CECL) 1/1/2020 (CECL Day 1) 9/30/2021 9/30/2022 Low Levels of Special Mention and Substandard Loans 1Pass and Loans Guaranteed: Includes early buy-out loans guaranteed by U.S. government agencies 2Substandard: Substandard includes Substandard Accrual and Substandard Nonaccrual/Doubtful
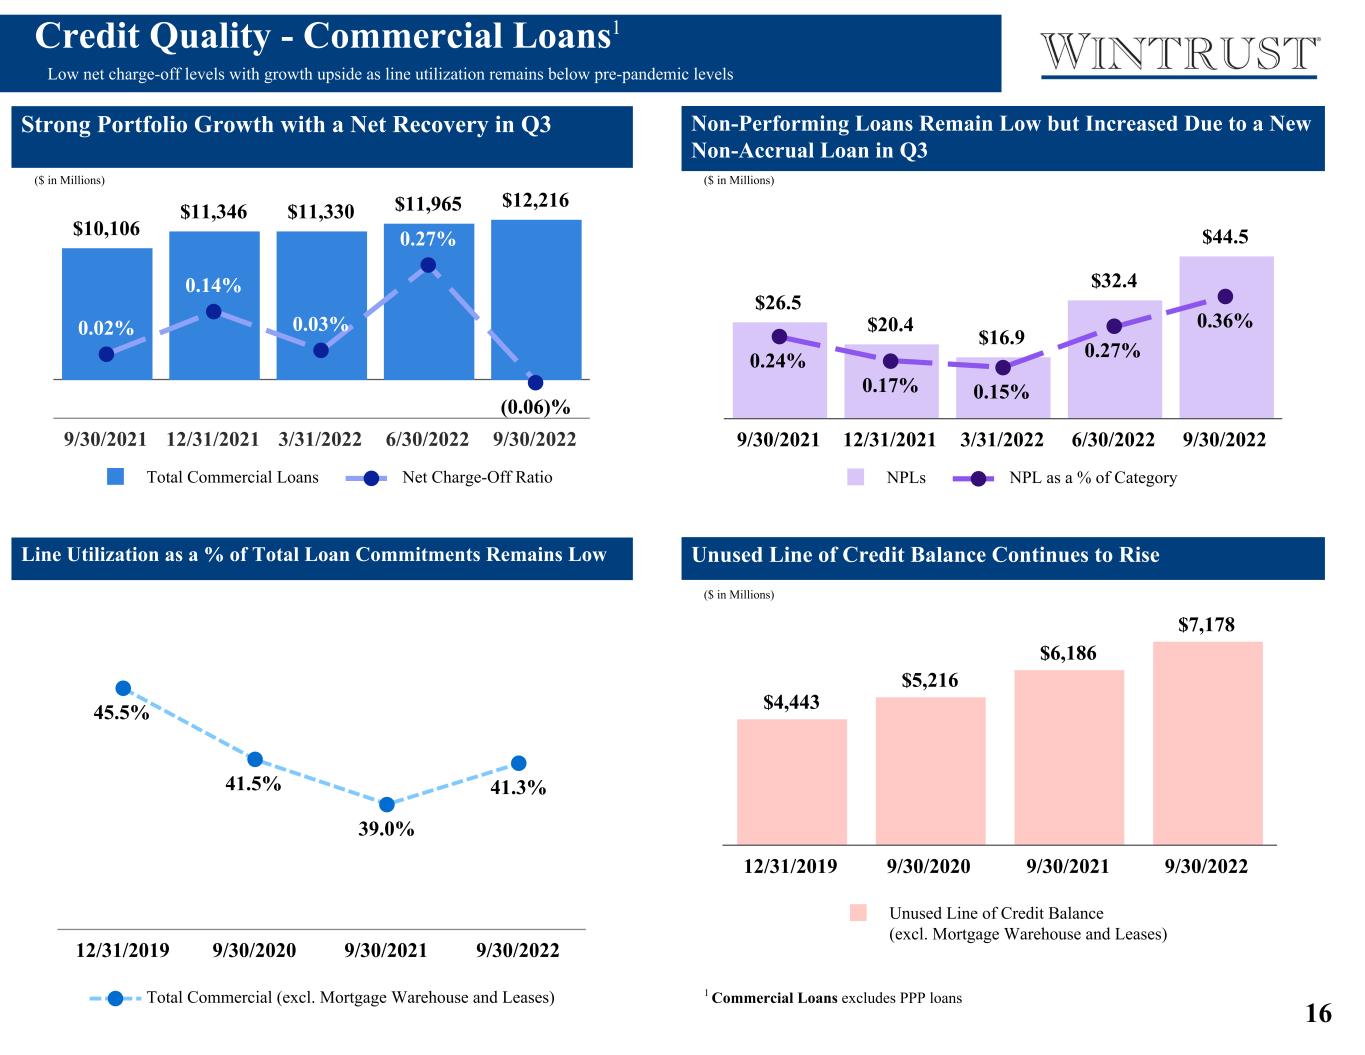
16 $4,443 $5,216 $6,186 $7,178 Unused Line of Credit Balance (excl. Mortgage Warehouse and Leases) 12/31/2019 9/30/2020 9/30/2021 9/30/2022 $10,106 $11,346 $11,330 $11,965 $12,216 0.02% 0.14% 0.03% 0.27% (0.06)% Total Commercial Loans Net Charge-Off Ratio 9/30/2021 12/31/2021 3/31/2022 6/30/2022 9/30/2022 Credit Quality - Commercial Loans1 Low net charge-off levels with growth upside as line utilization remains below pre-pandemic levels Strong Portfolio Growth with a Net Recovery in Q3 Non-Performing Loans Remain Low but Increased Due to a New Non-Accrual Loan in Q3 $4,384 $5,513 $5,583 $6,141 $6,236 $6,489 $6,832 $7,243 46.1% 50.8% 41.4% 43.0% 39.7% 38.9% 38.4% 39.3% 39.6%45.5% 50.6% 40.6% 41.5% 37.7% 36.7% 37.0% 39.0% 40.5% Unused Line of Credit Balance Total Commercial (excl. PPP and Leases) Total Commercial (excl. PPP, Mortgage Warehouse and Leases) 9/30/2020 12/31/2020 3/31/2021 6/30/2021 9/30/2021 12/31/2021 3/31/2022 6/30/2022 9/30/2022 $26.5 $20.4 $16.9 $32.4 $44.5 0.24% 0.17% 0.15% 0.27% 0.36% NPLs NPL as a % of Category 9/30/2021 12/31/2021 3/31/2022 6/30/2022 9/30/2022 Q3 2022 Key Observations • Significant loan growth in Q4 2021 of $1.2 billion of which $578 million is attributed to acquired loans. • Net charge-offs in Q4 2021 were consistent with historical levels. • The proportion of Commercial non-performing loans remains relatively low as pandemic-driven circumstances continue to improve. • Line utilization increased slightly in Q4 2021 but remains historically low as a result of factors such as excess liquidity in the market as well as suspension of capital expenditures and other non- working capital payments. 1 Commercial Loans excludes PPP loans 2 Net Charge-Off Ratio is calculated as a percentage of average loans ($ in Millions) ($ in Millions) Line Utilization as a % of Commercial Loans remains low due to excess liquidity in the market and suspension of capital expenditures Line Utilization as a % of Total Loan Commitments Remains Low Unused Line of Credit Balance Continues to Rise ($ in Millions) 45.5% 41.5% 39.0% 41.3% Total Commercial (excl. Mortgage Warehouse and Leases) 12/31/2019 9/30/2020 9/30/2021 9/30/2022 $4,687 $4,384 $6,236 $7,260 Unused Line of Credit Balance 12/31/2019 9/30/2020 9/30/2021 9/30/2022 $4,687 $4,384 $6,236 $7,260 $4,443 $4,105 $5,837 $6,481 $244 $278 $398 $779 Unused Line of Credit Balance excluding Mortgage Warehouse Mortgage Warehouse 12/31/2019 9/30/2020 9/30/2021 9/30/2022 1 Commercial Loans excludes PPP loans
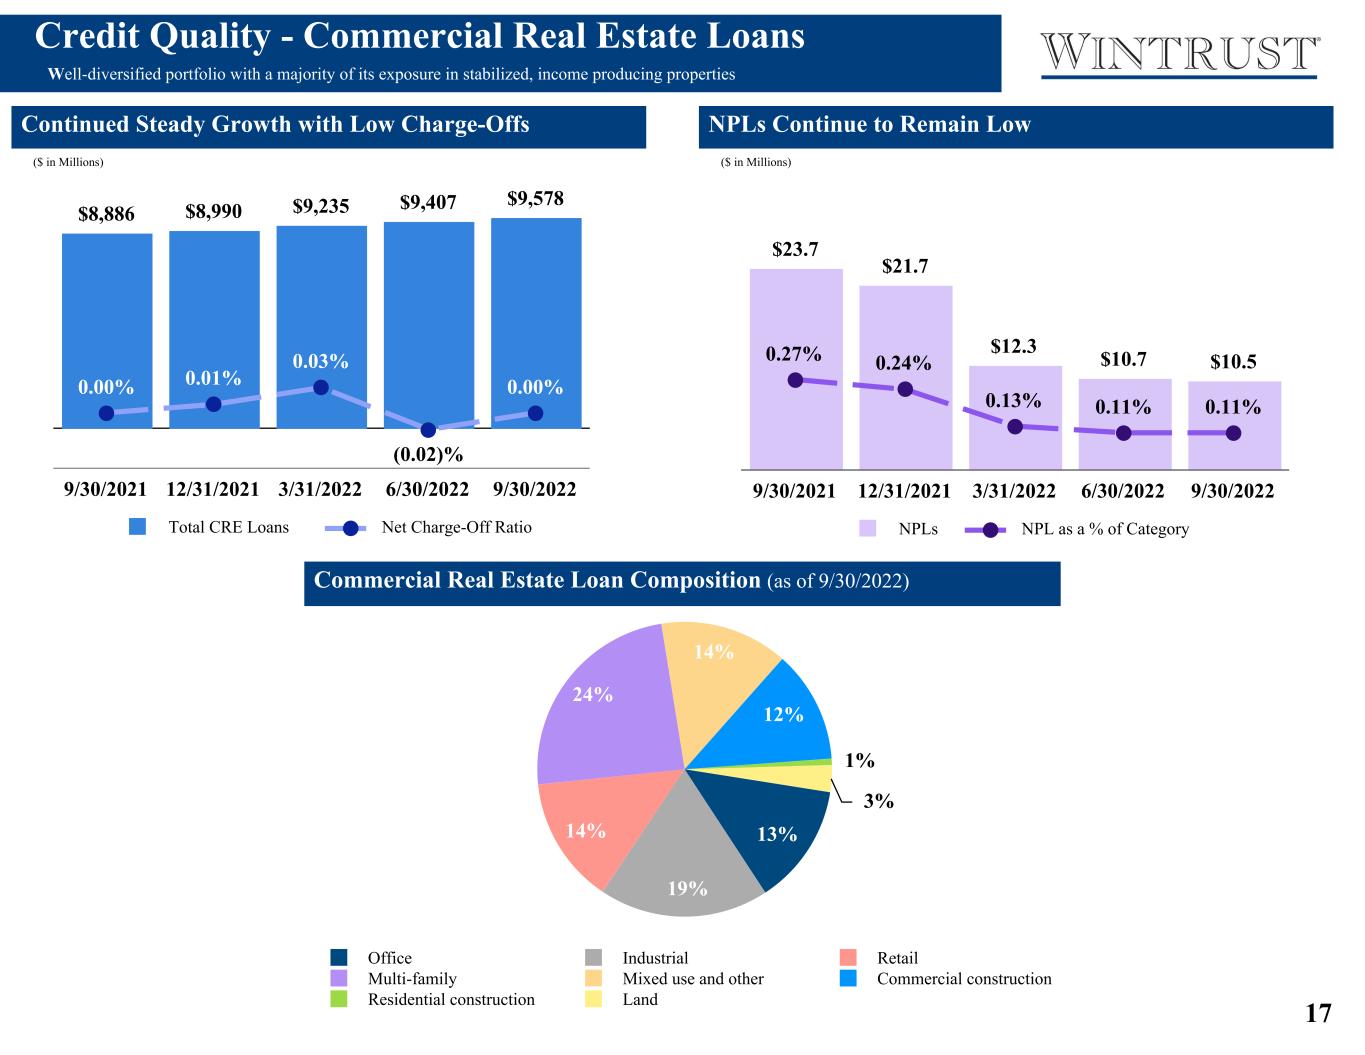
17 13% 19% 14% 24% 14% 12% 1% 3% Office Industrial Retail Multi-family Mixed use and other Commercial construction Residential construction Land $8,886 $8,990 $9,235 $9,407 $9,578 0.00% 0.01% 0.03% (0.02)% 0.00% Total CRE Loans Net Charge-Off Ratio 9/30/2021 12/31/2021 3/31/2022 6/30/2022 9/30/2022 Credit Quality - Commercial Real Estate Loans Well-diversified portfolio with a majority of its exposure in stabilized, income producing properties Continued Steady Growth with Low Charge-Offs NPLs Continue to Remain Low $23.7 $21.7 $12.3 $10.7 $10.50.27% 0.24% 0.13% 0.11% 0.11% NPLs NPL as a % of Category 9/30/2021 12/31/2021 3/31/2022 6/30/2022 9/30/2022 Q3 2022 Key Observations • The CRE portfolio continues a steady growth trend while non-performing loans continue to decline. • Charge-offs have generally remained low and reflect the conservative underwriting standards the Company employs. • The CRE portfolio is well-diversified with a majority of its exposure in stabilized, income producing properties. 17% 22% 17% 27% 17% Office Industrial Retail Multi-family Mixed use and other 76% 4% 20% Commercial construction Residential construction Land ($ in Millions) ($ in Millions) $1,084 $1,071 $1,203 $1,335 $1,391 68.8% 69.1% 67.5% 65.8% 66.5% Unused Line of Credit Balance Line Utilization as a % of Total CRE 9/30/2021 12/31/2021 3/31/2022 6/30/2022 9/30/2022 Line Utilization as a % Commercial Real Estate Loans ("CRE") Commercial Real Estate Loan Composition (as of 9/30/2022) Well Diversified with Majority of Portfolio in Stabilized Income Producing Properties($ in Millions) 1 Net Charge-off Ratio is calculated as a percentage of average loans 2 As a result of a review of the composition of borrowers within the mixed use and other loan portfolio, the Company identified certain loans that would be more precisely classified within a separate class of non-construction commercial real estate. This change in classification was based on related collateral and source of repayment of the underlying loan 1 Net Charge-Off Ratio is calculated as a percentage of average loans
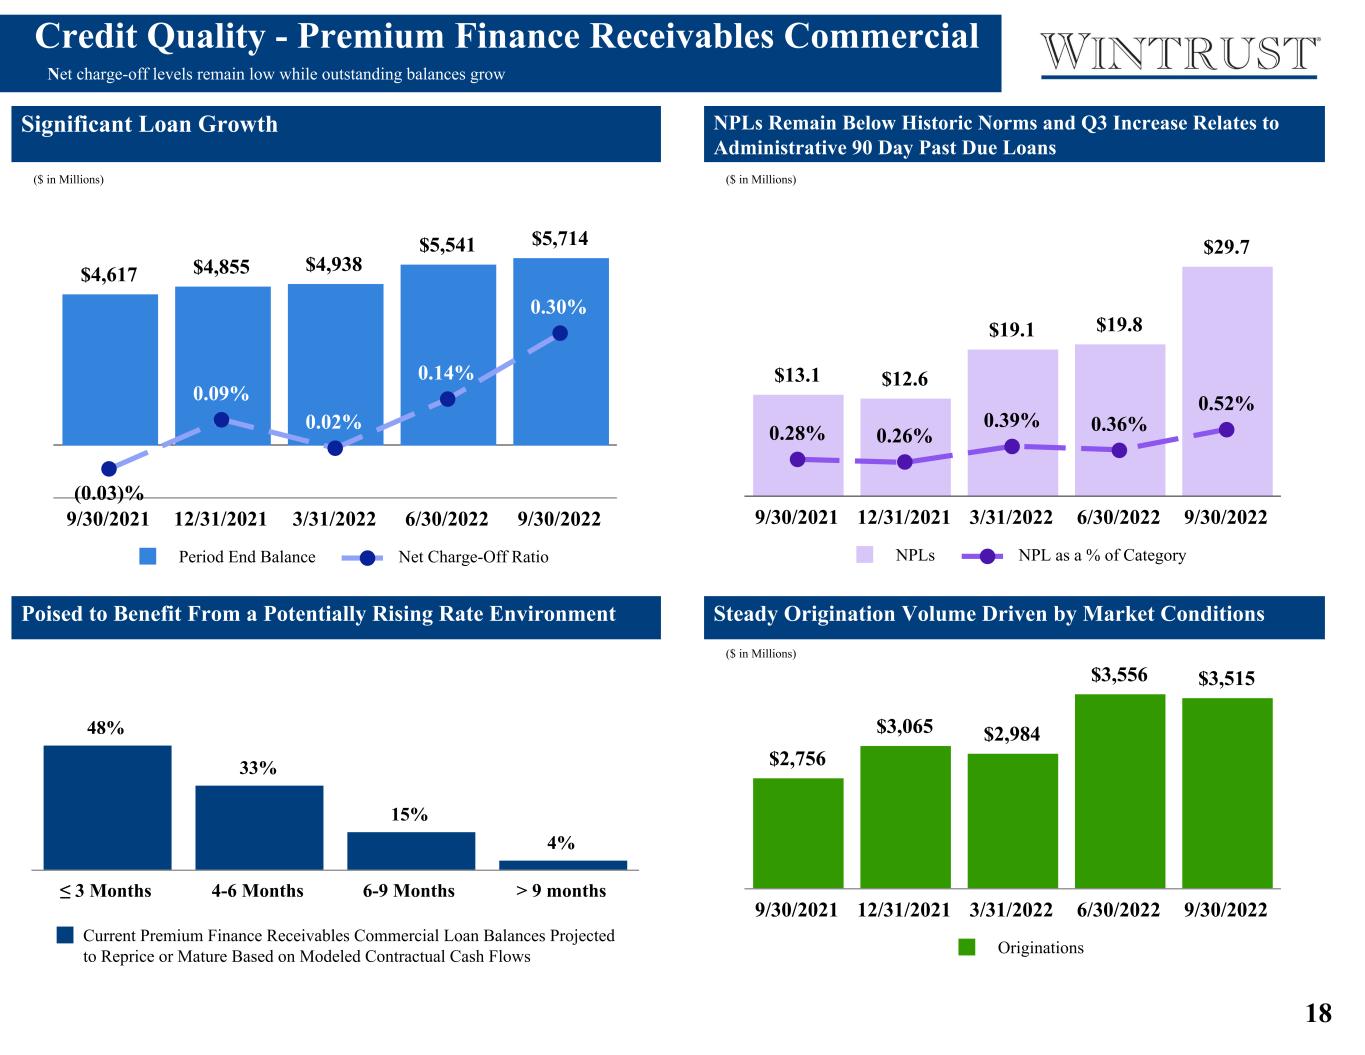
18 $4,617 $4,855 $4,938 $5,541 $5,714 (0.03)% 0.09% 0.02% 0.14% 0.30% Period End Balance Net Charge-Off Ratio 9/30/2021 12/31/2021 3/31/2022 6/30/2022 9/30/2022 Credit Quality - Premium Finance Receivables Commercial Net charge-off levels remain low while outstanding balances grow Steady Origination Volume Driven by Market Conditions Average Balances & Quarterly Yields ($ in Millions) $3,724.6 $4,134.0 $4,010.5 $3,952.9 5.05% 4.60% 4.60% 4.42% Average Balance Yield Q3 2021 Q4 2021 Q1 2022 Q2 2022 Q3 2022 Q3 2022 Key Observations • At the beginning of the pandemic, Premium Finance Receivables ("PFR") - Commercial experienced an increase in NPLs as a result of borrower delinquency, which was exacerbated by state emergency orders delaying cancellation of insurance policies which generate return premiums, the collateral for this portfolio. This caused NPLs to be elevated in 2020 and has subsequently returned to normalized levels in 2021. • Despite the pandemic and state emergency orders, net charge-off levels remained low and characteristic of the low loss levels expected of this portfolio, with the portfolio experiencing net recoveries in Q2 2021 and Q3 2021. • Strong origination volumes in 2021 a result of businesses seeking financing opportunities during the pandemic, hardening insurance markets, additions of new relationships and a low rate environment. 1 Net Charge-Off Ratio is calculated as a percentage of average loans $2,756 $3,065 $2,984 $3,556 $3,515 Originations 9/30/2021 12/31/2021 3/31/2022 6/30/2022 9/30/2022 NPLs Remain Below Historic Norms and Q3 Increase Relates to Administrative 90 Day Past Due Loans $13.1 $12.6 $19.1 $19.8 $29.7 0.28% 0.26% 0.39% 0.36% 0.52% NPLs NPL as a % of Category 9/30/2021 12/31/2021 3/31/2022 6/30/2022 9/30/2022 ($ in Millions) ($ in Millions) ($ in Millions) $9,478 $10,182 $10,588 $11,231 $28 $38 $39 $48 Risk Rating 1-5 Risk Rating 6-10 09/30/21 12/31/21 03/31/22 06/30/22 09/30/22 Poised to Benefit From a Potentially Rising Rate Environment 48% 33% 15% 4% Current Premium Finance Receivables Commercial Loan Balances Projected to Reprice or Mature Based on Modeled Contractual Cash Flows ≤ 3 Months 4-6 Months 6-9 Months > 9 months Current Loan Balances Projected to Reprice or Mature Based on Modeled Contractual Cash Flows Significant Loan Growth
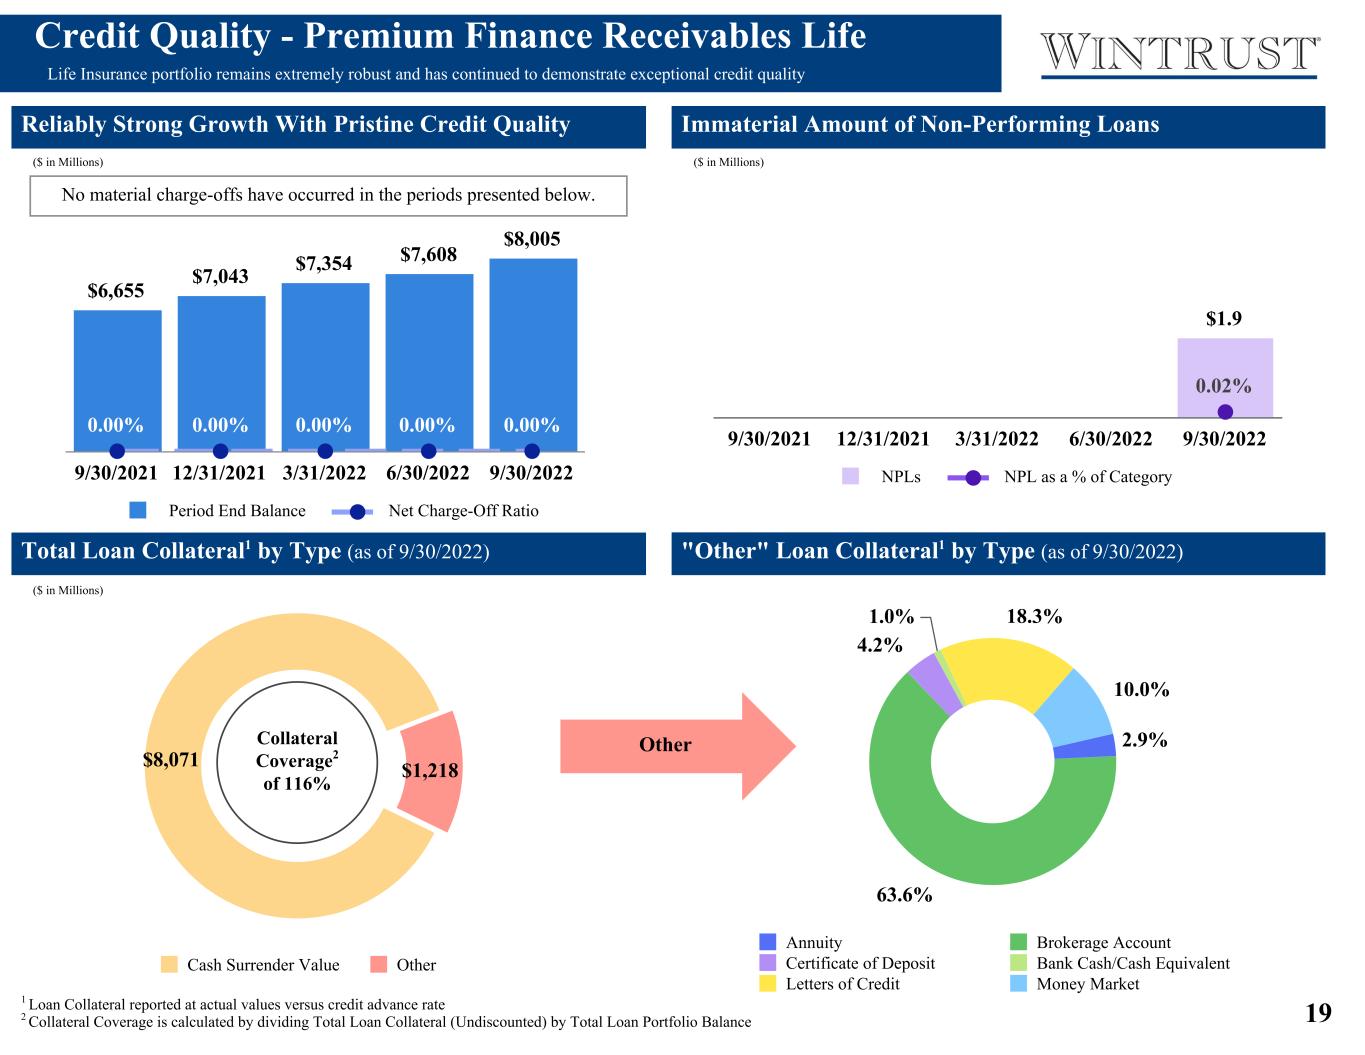
19 $8,071 $1,218 Cash Surrender Value Other $6,655 $7,043 $7,354 $7,608 $8,005 0.00% 0.00% 0.00% 0.00% 0.00% Period End Balance Net Charge-Off Ratio 9/30/2021 12/31/2021 3/31/2022 6/30/2022 9/30/2022 Credit Quality - Premium Finance Receivables Life Life Insurance portfolio remains extremely robust and has continued to demonstrate exceptional credit quality Immaterial Amount of Non-Performing LoansReliably Strong Growth With Pristine Credit Quality Average Balances & Quarterly Yields ($ in Millions) $5,290.1 $5,462.8 $5,636.3 $5,957.5 3.71% 3.38% 3.74% 2.89% Average Balance Yield Q3 2021 Q4 2021 Q1 2022 Q2 2022 Q3 2022 Q3 2022 Key Observations • Throughout the pandemic, the Premium Finance Receivables ("PFR") - Life Insurance portfolio has remained extremely resilient and has continued to demonstrate exceptional credit quality, as shown by the characteristically low net charge-off and NPL levels. • Origination levels have remained strong. Some of the primary drivers of growth in 2021 include: ◦ increased mortality awareness in response to the pandemic. ◦ realized or anticipated changes in tax laws including changes to allowable maximum premium amounts relative to death benefit. ◦ low interest rate environment has made leveraging insurance products attractive to consumers. • Collateral as a percentage of outstanding balance is 117% as of Q3 2022. 1 Loan Collateral reported at actual values versus credit advance rate 2 Collateral Coverage is calculated by dividing Total Loan Collateral (Undiscounted) by Total Loan Portfolio Balance $315.4 $442.7 $330.3 $360.0 $371.9 Originations 9/30/2021 12/31/2021 3/31/2022 6/30/2022 9/30/2022 Total Loan Collateral1 by Type (as of 9/30/2022) $1.9 0.02% NPLs NPL as a % of Category 9/30/2021 12/31/2021 3/31/2022 6/30/2022 9/30/2022 2.9% 63.6% 4.2% 1.0% 18.3% 10.0% Annuity Brokerage Account Certificate of Deposit Bank Cash/Cash Equivalent Letters of Credit Money Market "Other" Loan Collateral1 by Type (as of 9/30/2022) Other ($ in Millions) ($ in Millions) Period-End Balances & Annualized Net Charge-off Ratio1 ($ in Millions) Collateral Coverage2 of 116% No material charge-offs have occurred in the periods presented below.
20 Appendix

21 Glossary Abbreviation Definition AFS Available For Sale BP Basis Point CECL Current Expected Credit Losses CET1 Ratio Common Equity Tier 1 Capital Ratio CRE Commercial Real Estate DDA Demand Deposit Account Diluted EPS Net Income per Common Share - Diluted FEMA Federal Emergency Management Agency GAAP Generally Accepted Accounting Principles Interest Bearing Cash Total Interest-Bearing Deposits with Banks, Securities Purchased under Resale Agreements and Cash Equivalents MSR Mortgage Servicing Right NCO Net Charge Off Net Overhead Ratio The net overhead ratio is calculated by netting total non-interest expense and total non-interest income, annualizing this amount, and dividing by that period's average total assets. A lower ratio indicates a higher degree of efficiency. NII Net Interest Income NIM Net Interest Margin Non-GAAP For Non-GAAP metrics, see the reconciliation in the Appendix NP Not Pictured NPL Non-Performing Loan PPP Paycheck Protection Program PTPP Pre-Tax, Pre-Provision Income ROA Return on Assets RWA Risk-Weighted Asset TBV Tangible Book Value per Common Share
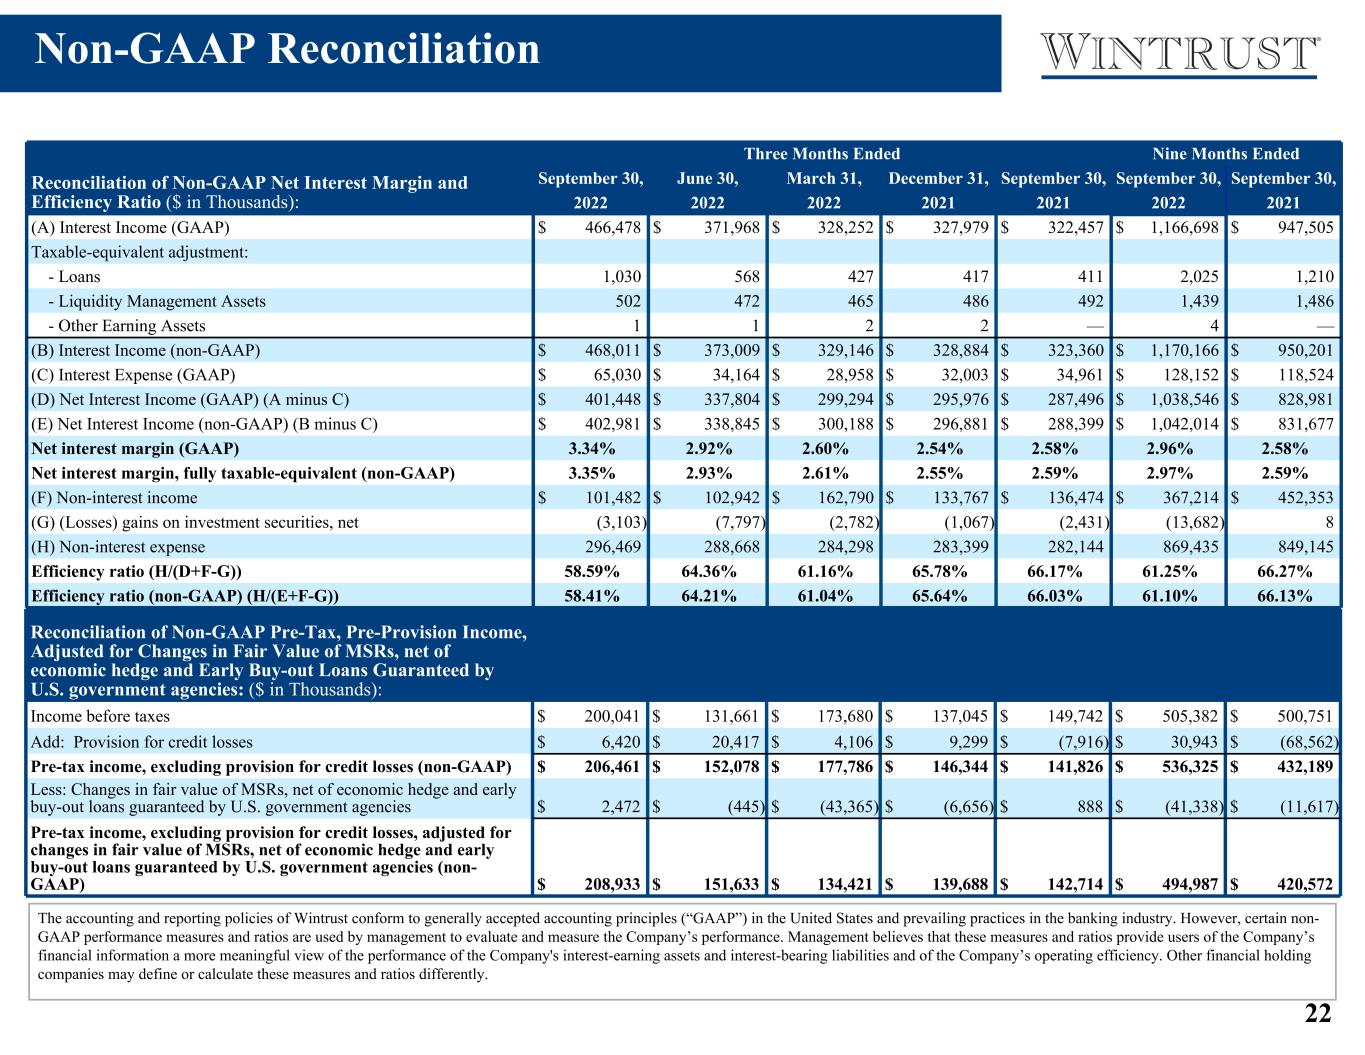
22 Three Months Ended Nine Months Ended Reconciliation of Non-GAAP Net Interest Margin and Efficiency Ratio ($ in Thousands): September 30, June 30, March 31, December 31, September 30, September 30, September 30, 2022 2022 2022 2021 2021 2022 2021 (A) Interest Income (GAAP) $ 466,478 $ 371,968 $ 328,252 $ 327,979 $ 322,457 $ 1,166,698 $ 947,505 Taxable-equivalent adjustment: - Loans 1,030 568 427 417 411 2,025 1,210 - Liquidity Management Assets 502 472 465 486 492 1,439 1,486 - Other Earning Assets 1 1 2 2 — 4 — (B) Interest Income (non-GAAP) $ 468,011 $ 373,009 $ 329,146 $ 328,884 $ 323,360 $ 1,170,166 $ 950,201 (C) Interest Expense (GAAP) $ 65,030 $ 34,164 $ 28,958 $ 32,003 $ 34,961 $ 128,152 $ 118,524 (D) Net Interest Income (GAAP) (A minus C) $ 401,448 $ 337,804 $ 299,294 $ 295,976 $ 287,496 $ 1,038,546 $ 828,981 (E) Net Interest Income (non-GAAP) (B minus C) $ 402,981 $ 338,845 $ 300,188 $ 296,881 $ 288,399 $ 1,042,014 $ 831,677 Net interest margin (GAAP) 3.34% 2.92% 2.60% 2.54% 2.58% 2.96% 2.58% Net interest margin, fully taxable-equivalent (non-GAAP) 3.35% 2.93% 2.61% 2.55% 2.59% 2.97% 2.59% (F) Non-interest income $ 101,482 $ 102,942 $ 162,790 $ 133,767 $ 136,474 $ 367,214 $ 452,353 (G) (Losses) gains on investment securities, net (3,103) (7,797) (2,782) (1,067) (2,431) (13,682) 8 (H) Non-interest expense 296,469 288,668 284,298 283,399 282,144 869,435 849,145 Efficiency ratio (H/(D+F-G)) 58.59% 64.36% 61.16% 65.78% 66.17% 61.25% 66.27% Efficiency ratio (non-GAAP) (H/(E+F-G)) 58.41% 64.21% 61.04% 65.64% 66.03% 61.10% 66.13% Non-GAAP Reconciliation The accounting and reporting policies of Wintrust conform to generally accepted accounting principles (“GAAP”) in the United States and prevailing practices in the banking industry. However, certain non- GAAP performance measures and ratios are used by management to evaluate and measure the Company’s performance. Management believes that these measures and ratios provide users of the Company’s financial information a more meaningful view of the performance of the Company's interest-earning assets and interest-bearing liabilities and of the Company’s operating efficiency. Other financial holding companies may define or calculate these measures and ratios differently. Reconciliation of Non-GAAP Pre-Tax, Pre-Provision Income, Adjusted for Changes in Fair Value of MSRs, net of economic hedge and Early Buy-out Loans Guaranteed by U.S. government agencies: ($ in Thousands): Income before taxes $ 200,041 $ 131,661 $ 173,680 $ 137,045 $ 149,742 $ 505,382 $ 500,751 Add: Provision for credit losses $ 6,420 $ 20,417 $ 4,106 $ 9,299 $ (7,916) $ 30,943 $ (68,562) Pre-tax income, excluding provision for credit losses (non-GAAP) $ 206,461 $ 152,078 $ 177,786 $ 146,344 $ 141,826 $ 536,325 $ 432,189 Less: Changes in fair value of MSRs, net of economic hedge and early buy-out loans guaranteed by U.S. government agencies $ 2,472 $ (445) $ (43,365) $ (6,656) $ 888 $ (41,338) $ (11,617) Pre-tax income, excluding provision for credit losses, adjusted for changes in fair value of MSRs, net of economic hedge and early buy-out loans guaranteed by U.S. government agencies (non- GAAP) $ 208,933 $ 151,633 $ 134,421 $ 139,688 $ 142,714 $ 494,987 $ 420,572
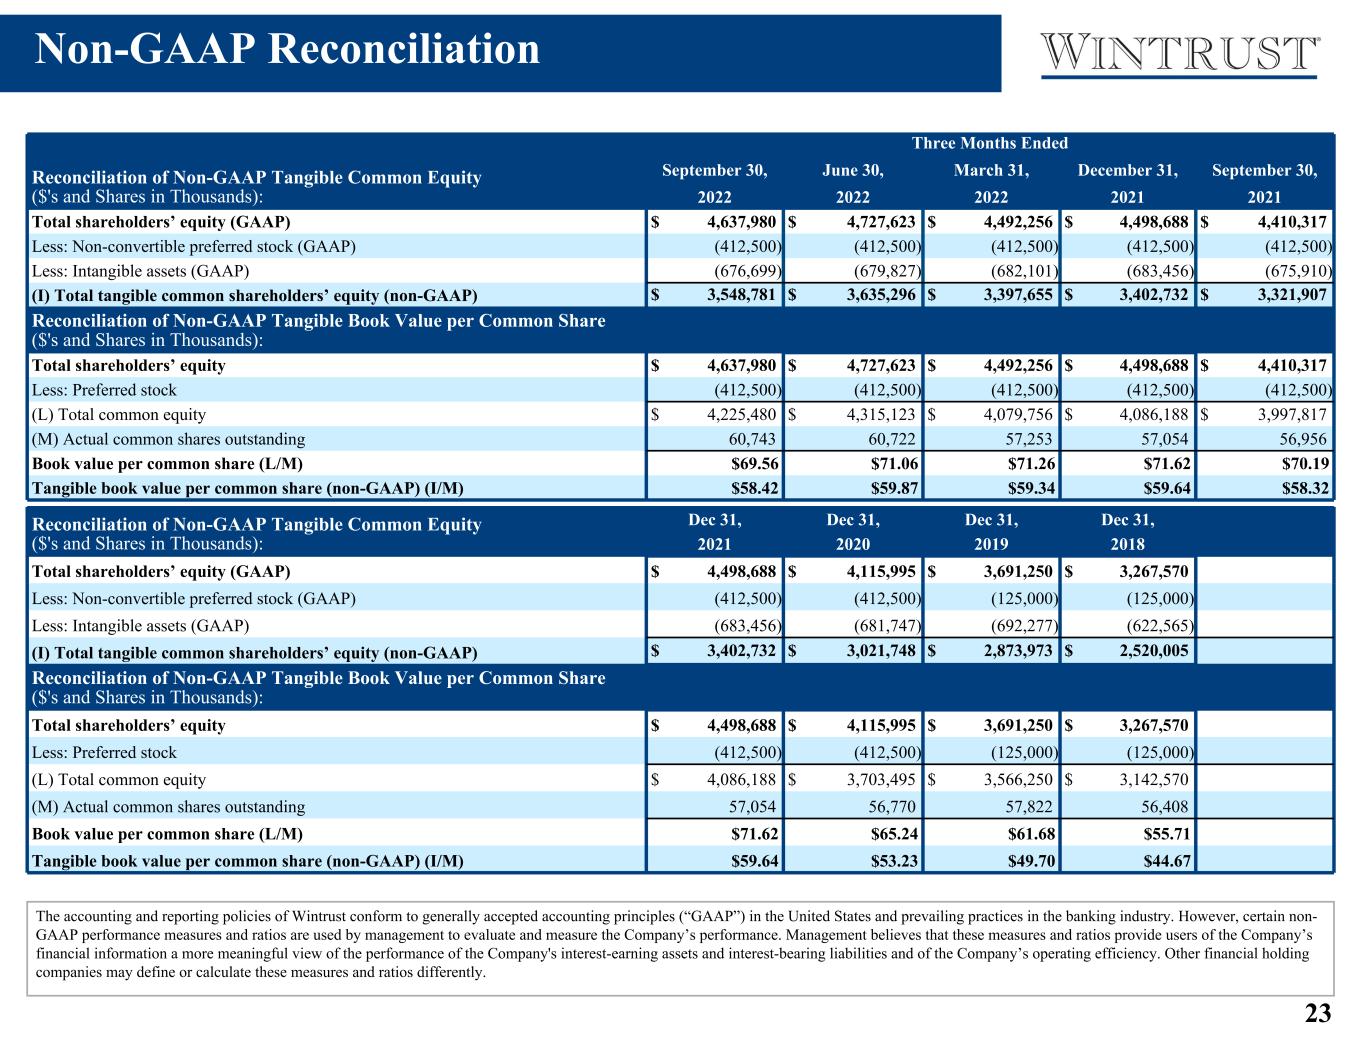
23 Three Months Ended Reconciliation of Non-GAAP Tangible Common Equity ($'s and Shares in Thousands): September 30, June 30, March 31, December 31, September 30, 2022 2022 2022 2021 2021 Total shareholders’ equity (GAAP) $ 4,637,980 $ 4,727,623 $ 4,492,256 $ 4,498,688 $ 4,410,317 Less: Non-convertible preferred stock (GAAP) (412,500) (412,500) (412,500) (412,500) (412,500) Less: Intangible assets (GAAP) (676,699) (679,827) (682,101) (683,456) (675,910) (I) Total tangible common shareholders’ equity (non-GAAP) $ 3,548,781 $ 3,635,296 $ 3,397,655 $ 3,402,732 $ 3,321,907 Reconciliation of Non-GAAP Tangible Book Value per Common Share ($'s and Shares in Thousands): Total shareholders’ equity $ 4,637,980 $ 4,727,623 $ 4,492,256 $ 4,498,688 $ 4,410,317 Less: Preferred stock (412,500) (412,500) (412,500) (412,500) (412,500) (L) Total common equity $ 4,225,480 $ 4,315,123 $ 4,079,756 $ 4,086,188 $ 3,997,817 (M) Actual common shares outstanding 60,743 60,722 57,253 57,054 56,956 Book value per common share (L/M) $69.56 $71.06 $71.26 $71.62 $70.19 Tangible book value per common share (non-GAAP) (I/M) $58.42 $59.87 $59.34 $59.64 $58.32 Non-GAAP Reconciliation The accounting and reporting policies of Wintrust conform to generally accepted accounting principles (“GAAP”) in the United States and prevailing practices in the banking industry. However, certain non- GAAP performance measures and ratios are used by management to evaluate and measure the Company’s performance. Management believes that these measures and ratios provide users of the Company’s financial information a more meaningful view of the performance of the Company's interest-earning assets and interest-bearing liabilities and of the Company’s operating efficiency. Other financial holding companies may define or calculate these measures and ratios differently. Reconciliation of Non-GAAP Pre-Tax, Pre-Provision Income ($ in Thousands): Income before taxes $ 200,041 $ 131,661 $ 173,680 $ 137,045 $ 149,742 $ 505,382 $ 500,751 Add: Provision for credit losses 6,420 20,417 4,106 9,299 (7,916) 30,943 (68,562) Pre-tax income, excluding provision for credit losses (non-GAAP) $ 206,461 $ 152,078 $ 177,786 $ 146,344 $ 141,826 $ 536,325 $ 432,189 Reconciliation of Non-GAAP Tangible Common Equity ($'s and Shares in Thousands): Dec 31, Dec 31, Dec 31, Dec 31, 2021 2020 2019 2018 Total shareholders’ equity (GAAP) $ 4,498,688 $ 4,115,995 $ 3,691,250 $ 3,267,570 Less: Non-convertible preferred stock (GAAP) (412,500) (412,500) (125,000) (125,000) Less: Intangible assets (GAAP) (683,456) (681,747) (692,277) (622,565) (I) Total tangible common shareholders’ equity (non-GAAP) $ 3,402,732 $ 3,021,748 $ 2,873,973 $ 2,520,005 Reconciliation of Non-GAAP Tangible Book Value per Common Share ($'s and Shares in Thousands): Total shareholders’ equity $ 4,498,688 $ 4,115,995 $ 3,691,250 $ 3,267,570 Less: Preferred stock (412,500) (412,500) (125,000) (125,000) (L) Total common equity $ 4,086,188 $ 3,703,495 $ 3,566,250 $ 3,142,570 (M) Actual common shares outstanding 57,054 56,770 57,822 56,408 Book value per common share (L/M) $71.62 $65.24 $61.68 $55.71 Tangible book value per common share (non-GAAP) (I/M) $59.64 $53.23 $49.70 $44.67