
ZD 8-K
Ziff Davis, Inc. (ZD)
8-K
2021-11-04
For: 2021-11-04
View Original
Added on
April 09, 2026
UNITED STATES
SECURITIES AND EXCHANGE COMMISSION
Washington, D.C. 20549
FORM 8-K
CURRENT REPORT
Pursuant to Section 13 OR 15(d) of The Securities Exchange Act of 1934
Date of Report (date of earliest event reported) November 4, 2021
(Exact name of registrant as specified in its charter)
(State or other jurisdiction of incorporation or organization) | (Commission File Number) | (I.R.S. Employer Identification No.) | |||||||||||||||
(Address of principal executive offices)
(212 ) 503-3500
Registrant's telephone number, including area code
J2 Global, Inc., 700 S. Flower Street, 15th Floor, Los Angeles, California 90017
(Registrant’s former name, former address)
Check the appropriate box below if the Form 8-K filing is intended to simultaneously satisfy the filing obligation of the registrant under any of the following provisions (see General Instruction A.2. below):
Securities registered pursuant to Section 12(b) of the Act:
| Title of each class | Trading Symbol(s) | Name of each exchange on which registered | ||||||
Indicate by check mark whether the registrant is an emerging growth company as defined in Rule 405 of the Securities Act of 1933 (§230.405 of this chapter) or Rule 12b-2 of the Securities Exchange Act of 1934 (§240.12b-2 of this chapter).
Emerging growth company ☐
If an emerging growth company, indicate by check mark if the registrant has elected not to use the extended transition period for complying with any new or revised financial accounting standards provided pursuant to Section 13(a) of the Exchange Act. o
Item 2.02. Results of Operations and Financial Condition
On November 3, 2021, Ziff Davis, Inc. (the “Company”) issued a press release (the “Press Release”) announcing its financial results for the third quarter of fiscal 2021 and reaffirming its previously issued financial guidance for fiscal year 2021.
A copy of the Press Release is furnished as Exhibit 99.1 to this Form 8-K.
Item 7.01. Regulation FD Disclosure
On November 4, 2021, at 8:30 a.m. Eastern Time, the Company will host its third quarter 2021 earnings conference call and Webcast. Via the Webcast, the Company will present portions of its November 2021 Investor Presentation, which contains a summary of the Company’s financial results for the fiscal quarter ended September 30, 2021, and certain other financial and operating information regarding the Company. A copy of this presentation is furnished as Exhibit 99.2 to this Form 8-K.
NOTE: The information in this Item 7.01 is being furnished and shall not be deemed "filed" for purposes of Section 18 of the Securities Exchange Act of 1934, as amended (the “Exchange Act”), or incorporated by reference in any filing under the Securities Act of 1933, as amended (the “Securities Act”) or the Exchange Act, except as shall be expressly set forth by specific reference in such a filing.
Item 9.01. Financial Statements and Exhibits
(d) Exhibits
| Exhibit Number | Description | |||||||
| 104 | Cover Page Interactive Data File (embedded within the Inline XBRL document) | |||||||
This Current Report on Form 8-K contains forward-looking statements within the meaning of Section 27A of the Securities Act and Section 21E of the Exchange Act. Such forward-looking statements are subject to numerous assumptions, risks and uncertainties that could cause actual results to differ materially from those described in such statements. Such forward-looking statements are based on management’s expectations or beliefs as of November 3, 2021. Factors that might cause such differences include, but are not limited to, a variety of economic, competitive, and regulatory factors, many of which are beyond the Company’s control and are described in the Company’s Annual Report on Form 10-K filed by the Company on March 1, 2021 with the Securities and Exchange Commission (the “SEC”) and the other reports the Company files from time to time with the SEC. The Company undertakes no obligation to revise or publicly release any updates to such statements based on future information or actual results.
SIGNATURES
Pursuant to the requirements of the Securities Exchange Act of 1934, the registrant has duly caused this report to be signed on its behalf by the undersigned hereunto duly authorized.
Ziff Davis, Inc. (Registrant) | |||||||||||
| Date: | November 4, 2021 | By: | /s/ Jeremy Rossen | ||||||||
| Jeremy Rossen Executive Vice President, General Counsel | |||||||||||
Ziff Davis Reports Record Third Quarter 2021 Results & Reaffirms Full Year 2021 Guidance
NEW YORK, NY -- Ziff Davis, Inc. (formerly known as J2 Global, Inc.) (NASDAQ: ZD) today reported financial results for the third quarter ended September 30, 2021. On October 7, 2021, the Consensus business was spun-off as a separate public company (NASDAQ: CCSI). These third quarter results include Consensus, except where otherwise noted.
“There’s great enthusiasm and excitement at Ziff Davis as we embark on our new chapter,” said Vivek Shah, CEO of Ziff Davis. “Our portfolio of digital media and internet brands are very well-positioned to thrive in some of the highest-value verticals in the marketplace.”
THIRD QUARTER 2021 RESULTS
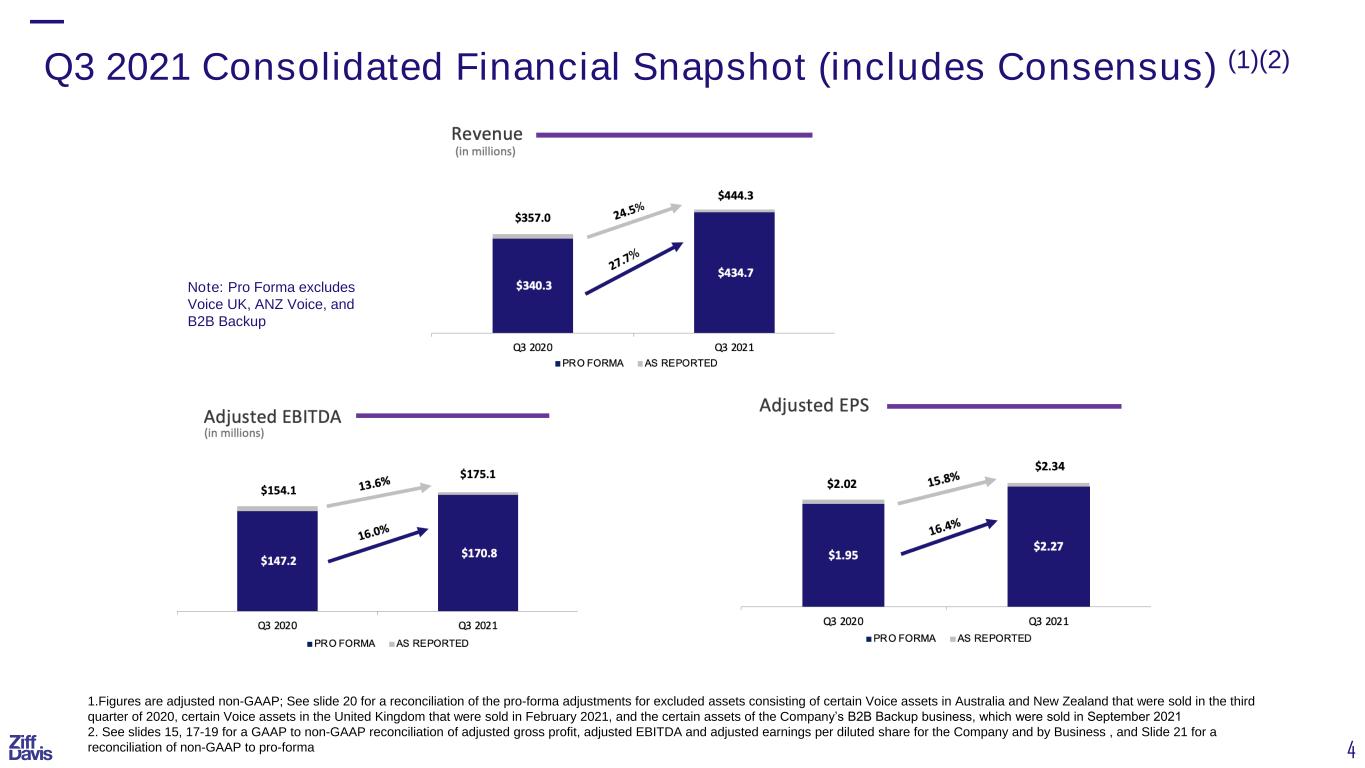
Q3 2021 quarterly revenues increased 24.5% to a Q3 record of $444.3 million as compared to $357.0 million for Q3 2020. On a pro-forma(6) basis, Q3 2021 quarterly revenues increased 27.7% to $434.7 million as compared to $340.3 million for Q3 2020.
Net cash provided by operating activities increased to $140.2 million as compared to $114.4 million for Q3 2020. Q3 2021 free cash flow(2) increased 17.9% to $110.5 million as compared to $93.7 million for Q3 2020.
GAAP earnings per diluted share(3) decreased to $0.88 in Q3 2021 compared to $1.31 for Q3 2020. Earnings decrease was primarily due a loss on the sale of the B2B Backup business unit of $19.2 million, net of tax.
Adjusted non-GAAP earnings per diluted share(3)(4) for the quarter increased 15.8% to $2.34 as compared to $2.02 for Q3 2020. On a pro-forma(6) basis, Adjusted non-GAAP earnings per diluted share(3)(4) for the quarter increased 16.4% to $2.27 as compared to $1.95 for Q3 2020.
GAAP net income decreased to $42.6 million as compared to $60.9 million for Q3 2020 primarily due to a loss on the sale of the B2B back-up business unit of $19.2 million, net of tax.
Adjusted non-GAAP net income increased by 17.4% to $110.2 million as compared to $93.9 million for Q3 2020. On a pro-forma(6) basis, Adjusted non-GAAP net income increased by 18.7% to $107.1 million as compared to $90.2 million for Q3 2020.
Adjusted EBITDA(5) for the quarter increased 13.6% to $175.1 million compared to $154.1 million for Q3 2020. On a pro-forma(6) basis, Adjusted EBITDA(5) for the quarter increased 16.0% to $170.8 million compared to $147.2 million for Q3 2020.
The company ended the quarter with approximately $657.2 million in cash, cash equivalents, and investments after deploying approximately $23.4 million during the quarter for current and prior year acquisitions.
Key unaudited financial results for Q3 2021 versus Q3 2020 are set forth in the following table (in millions, except per share amounts). Reconciliations of Adjusted non-GAAP earnings per diluted share, Adjusted EBITDA and free cash flow to their nearest comparable GAAP financial measures are attached to this Press Release.
The following table reflects Actual and Pro-Forma Results for the third quarter of 2021 (in millions). Pro-Forma Results below exclude Voice assets in Australia, New Zealand, and the United Kingdom that were sold in 2020 and 2021, respectively, and the Company’s B2B Backup business that was sold during the third quarter of 2021.
Pro-Forma Results(6) | ||||||||||||||||||||
| Q3 2021 | Q3 2020 | % Change | Q3 2021 | Q3 2020 | % Change | |||||||||||||||
| Revenues | ||||||||||||||||||||
| Cloud Services | $182.1 | $170.2 | 7.0% | $172.5 | $153.6 | 12.3% | ||||||||||||||
| Digital Media | $262.2 | $186.7 | 40.4% | $262.2 | $186.7 | 40.4% | ||||||||||||||
Total Revenue: (1) | $444.3 | $357.0 | 24.5% | $434.7 | $340.3 | 27.7% | ||||||||||||||
| Operating Income | $96.1 | $77.4 | 24.2% | |||||||||||||||||
| Net Cash Provided by Operating Activities | $140.2 | $114.4 | 22.6% | |||||||||||||||||
Free Cash Flow (2) | $110.5 | $93.7 | 17.9% | |||||||||||||||||
GAAP Earnings per Diluted Share (3) | $0.88 | $1.31 | (32.8)% | |||||||||||||||||
Adjusted Non-GAAP Earnings per Diluted Share (3) (4) | $2.34 | $2.02 | 15.8% | $2.27 | $1.95 | 16.4% | ||||||||||||||
| GAAP Net Income | $42.6 | $60.9 | (30.0)% | |||||||||||||||||
| Adjusted Non-GAAP Net Income | $110.2 | $93.9 | 17.4% | $107.1 | $90.2 | 18.7% | ||||||||||||||
Adjusted EBITDA (5) | $175.1 | $154.1 | 13.6% | $170.8 | $147.2 | 16.0% | ||||||||||||||
Adjusted EBITDA Margin (5) | 39.4% | 43.2% | (3.8)% | 39.3% | 43.3% | (4.0)% | ||||||||||||||
The following table reflects Actual and Pro-Forma Results for the nine months ended September 30, 2021 (in millions). Pro-Forma Results below exclude Voice assets in Australia, New Zealand, and the United Kingdom that were sold in 2020 and 2021, respectively, and the Company’s B2B Backup business that was sold during the third quarter of 2021.
| YTD | YTD | YTD Pro-Forma Results(6) | ||||||||||||||||||
| Q3 2021 | Q3 2020 | % Change | Q3 2021 | Q3 2020 | % Change | |||||||||||||||
| Revenues | ||||||||||||||||||||
| Cloud Services | $528.8 | $507.1 | 4.3% | $495.3 | $452.8 | 9.4% | ||||||||||||||
| Digital Media | $742.7 | $513.3 | 44.7% | $742.7 | $513.3 | 44.7% | ||||||||||||||
Total Revenue: (1) | $1,271.5 | $1,020.4 | 24.6% | $1,238.0 | $966.1 | 28.1% | ||||||||||||||
| Operating Income | $236.3 | $205.7 | 14.9% | |||||||||||||||||
| Net Cash Provided by Operating Activities | $430.3 | $356.0 | 20.9% | |||||||||||||||||
Free Cash Flow (2) | $343.4 | $304.8 | 12.7% | |||||||||||||||||
GAAP Earnings per Diluted Share (3) | $2.86 | $1.93 | 48.2% | |||||||||||||||||
Adjusted Non-GAAP Earnings per Diluted Share (3) (4) | $6.92 | $5.13 | 34.9% | $6.68 | $4.87 | 37.2% | ||||||||||||||
| GAAP Net Income | $136.2 | $92.6 | 47.1% | |||||||||||||||||
| Adjusted Non-GAAP Net Income | $315.2 | $242.0 | 30.2% | $304.4 | $229.8 | 32.5% | ||||||||||||||
Adjusted EBITDA (5) | $503.4 | $403.8 | 24.7% | $489.5 | $383.0 | 27.8% | ||||||||||||||
Adjusted EBITDA Margin (5) | 39.6% | 39.6% | —% | 39.5% | 39.6% | (0.1)% | ||||||||||||||
ZIFF DAVIS RESULTS AND BUSINESS OUTLOOK
The following table reflects Ziff Davis revenue, Adjusted EBITDA and Adjusted EBITDA margin, which excludes Consensus and the B2B Backup business and Voice assets (in millions).
| QTD | YTD | |||||||||||||||||||
| Q3 2021 | Q3 2020 | % Change | Q3 2021 | Q3 2020 | % Change | |||||||||||||||
| Revenue | $345.6 | $256.3 | 34.8% | $974.6 | $720.5 | 35.3% | ||||||||||||||
| Adjusted EBITDA | $117.2 | $95.1 | 23.2% | $329.6 | $233.5 | 41.2% | ||||||||||||||
| Adjusted EBITDA Margin | 33.9% | 37.1% | (3.2)% | 33.8% | 32.4% | 1.4% | ||||||||||||||
The Company reaffirms its guidance that was presented at its investor day on September 9, 2021 and provides Q4 2021 guidance below which reflects its pro forma position following the separation of Consensus (in millions, except per share amounts):
| Revenue | Adjusted EBITDA | Adjusted EPS | ||||||||||||
FY 2021 Range of Estimates (A) | $1,375 - $1,389 | $484 - $492 | ||||||||||||
Q4 2021 Range of Estimates (A) | $400 - $414 | $154 - $162 | $2.00 - $2.14 | |||||||||||
(A) Balances are in millions and represent pro forma 2021 results as if the spin-off of Consensus and the sales of the B2B Backup business and UK Voice assets had occurred on January 1, 2021.
The Company has not reconciled the non-GAAP Business Outlook for 2021 Adjusted EBITDA, Q4 2021 Adjusted EBITDA or Q4 2021 Adjusted non-GAAP EPS to the most directly comparable GAAP measure because this cannot be done without unreasonable effort due to the variability with respect to forecasted revenues and costs primarily related to acquisitions and taxation, which are potential adjustments to future earnings. We expect the variability of forecasted revenues and costs to have a potentially unpredictable and significant impact on our future GAAP financial results.
Notes:
| (1) | The revenues associated with each of the businesses may not foot precisely since each is presented independently. | |||||||
| (2) | Free cash flow is defined as net cash provided by operating activities, less purchases of property and equipment, plus contingent consideration. Free cash flow amounts are not meant as a substitute for GAAP, but are solely for informational purposes. | |||||||
| (3) | The estimated GAAP effective tax rates were approximately 23.0% for Q3 2021 and 28.3% for Q3 2020. The estimated Adjusted non-GAAP effective tax rates were approximately 16.6% for Q3 2021 and 21.8% for Q3 2020. | |||||||
| (4) | Adjusted non-GAAP earnings per diluted share excludes certain non-GAAP items, as defined in the Reconciliation of GAAP to Adjusted non-GAAP Financial Measures, for the three months ended September 30, 2021 and 2020 totaled $1.46 and $0.71 per diluted share, respectively. | |||||||
| (5) | Adjusted EBITDA is defined as earnings before interest; gain on sale of businesses; goodwill impairment of business; loss on investments, net; other income (expense), net; income tax expense; income (loss) from equity method investment, net; depreciation and amortization; and the items used to reconcile EPS to Adjusted non-GAAP EPS, as defined in the Reconciliation of GAAP to Adjusted non-GAAP Financial Measures. Adjusted EBITDA amounts are not meant as a substitute for GAAP, but are solely for informational purposes. | |||||||
| (6) | Pro-forma figures are provided taking into consideration the sale of certain Voice assets in Australia, New Zealand, and the United Kingdom as well as the sale of the Company’s B2B Backup business as if they had occurred January 1, 2020. | |||||||
About Ziff Davis (formerly J2 Global)
Ziff Davis, Inc. (NASDAQ: ZD) is a vertically focused digital media and internet company whose portfolio includes leading brands in technology, entertainment, shopping, health, cybersecurity, and martech. For more information, visit www.ziffdavis.com.
Contact:
Rebecca Wright
Ziff Davis, Inc.
800-577-1790
“Safe Harbor” Statement Under the Private Securities Litigation Reform Act of 1995: Certain statements in this Press Release are “forward-looking statements” within the meaning of The Private Securities Litigation Reform Act of 1995, including those contained in Vivek Shah’s quote and the “Business Outlook” portion regarding the Company’s expected fiscal 2021 financial performance. These forward-looking statements are based on management’s current expectations or beliefs and are subject to numerous assumptions, risks and uncertainties that could cause actual results to differ materially from those described in the forward-looking statements. These factors and uncertainties include, among other items: the Company’s ability to grow non-fax revenues, profitability and cash flows; the Company’s ability to identify, close and successfully transition acquisitions; subscriber growth and retention; variability of the Company’s revenue based on changing conditions in particular industries and the economy generally; protection of the Company’s proprietary technology or infringement by the Company of intellectual property of others; the risk of adverse changes in the U.S. or international regulatory environments, including but not limited to the imposition or increase of taxes or regulatory-related fees; and the numerous other factors set forth in Ziff Davis’s (formerly J2 Global, Inc.) filings with the Securities and Exchange Commission (“SEC”). For a more detailed description of the risk factors and uncertainties affecting Ziff Davis, refer to the 2020 Annual Report on Form 10-K filed by Ziff Davis on March 1, 2021, and the other reports filed by Ziff Davis from time-to-time with the SEC, each of which is available at www.sec.gov. The forward-looking statements provided in this press release, including those contained in Vivek Shah’s quote and in the “Business Outlook” portion regarding the Company’s expected fiscal 2021 financial performance are based on limited information available to the Company at this time, which is subject to change. Although management’s expectations may change after the date of this press release, the Company undertakes no obligation to revise or update these statements.
About Non-GAAP Financial Measures
To supplement our consolidated financial statements, which are prepared and presented in accordance with GAAP, we use the following Adjusted non-GAAP financial measures: Adjusted non-GAAP net income, Adjusted non-GAAP earnings per diluted share, Adjusted EBITDA and free cash flow. The presentation of this financial information is not intended to be considered in isolation or as a substitute for, or superior to, the financial information prepared and presented in accordance with GAAP.
We use these Adjusted non-GAAP financial measures for financial and operational decision-making and as a means to evaluate period-to-period comparisons. Our management believes that these Adjusted non-GAAP financial measures provide meaningful supplemental information regarding our performance and liquidity by excluding certain expenses and expenditures that may not be indicative of our recurring core business operating results. We believe that both management and investors benefit from referring to these Adjusted non-GAAP financial measures in assessing our performance and when planning, forecasting, and analyzing future periods. These Adjusted non-GAAP financial measures also facilitate management’s internal comparisons to our historical performance and liquidity. We believe these Adjusted non-GAAP financial measures are useful to investors both because (1) they allow for greater transparency with respect to key metrics used by management in its financial and operational decision-making and (2) they are used by our institutional investors and the analyst community to help them analyze the health of our business.
For more information on these Adjusted non-GAAP financial measures, please see the appropriate GAAP to Adjusted non-GAAP reconciliation tables included within the attached Exhibit to this release.
ZIFF DAVIS, INC. AND SUBSIDIARIES
CONDENSED CONSOLIDATED BALANCE SHEETS
(UNAUDITED, IN THOUSANDS)
| September 30, 2021 | December 31, 2020 | ||||||||||
| ASSETS | |||||||||||
| Cash and cash equivalents | $ | 546,467 | $ | 242,652 | |||||||
| Short-term investments | — | 663 | |||||||||
| Accounts receivable, net of allowances of $14,417 and $16,018, respectively | 268,349 | 325,619 | |||||||||
| Prepaid expenses and other current assets | 73,457 | 53,909 | |||||||||
| Total current assets | 888,273 | 622,843 | |||||||||
| Long-term investments | 110,718 | 97,495 | |||||||||
| Property and equipment, net | 183,179 | 156,577 | |||||||||
| Operating lease right-of-use assets | 88,331 | 105,845 | |||||||||
| Goodwill | 1,861,332 | 1,867,430 | |||||||||
| Other purchased intangibles, net | 641,162 | 741,569 | |||||||||
| Deferred income taxes, noncurrent | 37,761 | 56,545 | |||||||||
| Other assets | 19,901 | 17,027 | |||||||||
| TOTAL ASSETS | $ | 3,830,657 | $ | 3,665,331 | |||||||
| LIABILITIES AND STOCKHOLDERS’ EQUITY | |||||||||||
| Accounts payable and accrued expenses | $ | 228,977 | $ | 230,651 | |||||||
| Income taxes payable, current | 1,793 | 31,753 | |||||||||
| Deferred revenue, current | 197,901 | 190,644 | |||||||||
| Operating lease liabilities, current | 31,636 | 32,211 | |||||||||
| Current portion of long-term debt | 568,054 | 396,801 | |||||||||
| Other current liabilities | 36 | 497 | |||||||||
| Total current liabilities | 1,028,397 | 882,557 | |||||||||
| Long-term debt | 1,110,699 | 1,182,220 | |||||||||
| Deferred revenue, noncurrent | 15,189 | 14,440 | |||||||||
| Operating lease liabilities, noncurrent | 84,519 | 99,177 | |||||||||
| Income taxes payable, noncurrent | 11,675 | 11,675 | |||||||||
| Liability for uncertain tax positions | 54,178 | 57,081 | |||||||||
| Deferred income taxes, noncurrent | 112,482 | 162,700 | |||||||||
| Other long-term liabilities | 44,259 | 44,463 | |||||||||
| TOTAL LIABILITIES | 2,461,398 | 2,454,313 | |||||||||
| Commitments and contingencies | — | — | |||||||||
| Preferred stock | — | — | |||||||||
| Common stock | 478 | 443 | |||||||||
| Additional paid-in capital | 508,493 | 456,274 | |||||||||
| Retained earnings | 931,477 | 809,107 | |||||||||
| Accumulated other comprehensive loss | (71,189) | (54,806) | |||||||||
| TOTAL STOCKHOLDERS’ EQUITY | 1,369,259 | 1,211,018 | |||||||||
| TOTAL LIABILITIES AND STOCKHOLDERS’ EQUITY | $ | 3,830,657 | $ | 3,665,331 | |||||||
ZIFF DAVIS, INC. AND SUBSIDIARIES
CONDENSED CONSOLIDATED STATEMENTS OF OPERATIONS
(UNAUDITED, IN THOUSANDS EXCEPT SHARE AND PER SHARE DATA)
| Three Months Ended September 30, | Nine Months Ended September 30, | ||||||||||||||||||||||
| 2021 | 2020 | 2021 | 2020 | ||||||||||||||||||||
| Total revenues | $ | 444,252 | $ | 356,976 | $ | 1,271,480 | $ | 1,020,353 | |||||||||||||||
Cost of revenues (1) | 64,302 | 55,822 | 185,462 | 171,755 | |||||||||||||||||||
| Gross profit | 379,950 | 301,154 | 1,086,018 | 848,598 | |||||||||||||||||||
| Operating expenses: | |||||||||||||||||||||||
Sales and marketing (1) | 139,693 | 95,074 | 394,981 | 287,317 | |||||||||||||||||||
Research, development and engineering (1) | 21,639 | 14,261 | 62,634 | 43,273 | |||||||||||||||||||
General and administrative (1) | 122,477 | 114,381 | 359,498 | 312,283 | |||||||||||||||||||
| Goodwill impairment on business | — | — | 32,629 | — | |||||||||||||||||||
| Total operating expenses | 283,809 | 223,716 | 849,742 | 642,873 | |||||||||||||||||||
| Income from operations | 96,141 | 77,438 | 236,276 | 205,725 | |||||||||||||||||||
| Interest expense, net | (19,862) | (22,712) | (62,832) | (65,879) | |||||||||||||||||||
| (Loss) gain on sale of businesses | (24,600) | 17,122 | (21,798) | 17,122 | |||||||||||||||||||
| Loss on investments, net | — | (156) | (16,677) | (20,991) | |||||||||||||||||||
| Other income, net | 1,660 | 14,230 | 1,367 | 16,413 | |||||||||||||||||||
| Income before income taxes and (loss) income from equity method investment, net | 53,339 | 85,922 | 136,336 | 152,390 | |||||||||||||||||||
| Income tax expense | 8,847 | 24,330 | 16,723 | 49,011 | |||||||||||||||||||
| (Loss) income from equity method investment, net | (1,923) | (709) | 16,596 | (10,799) | |||||||||||||||||||
| Net income | $ | 42,569 | $ | 60,883 | $ | 136,209 | $ | 92,580 | |||||||||||||||
| Basic net income per common share: | |||||||||||||||||||||||
| Net income attributable to common shareholders | $ | 0.91 | $ | 1.31 | $ | 3.01 | $ | 1.96 | |||||||||||||||
| Diluted net income per common share: | |||||||||||||||||||||||
| Net income attributable to common shareholders | $ | 0.88 | $ | 1.31 | $ | 2.86 | $ | 1.93 | |||||||||||||||
| Basic weighted average shares outstanding | 46,738,073 | 46,279,515 | 45,258,819 | 46,914,750 | |||||||||||||||||||
| Diluted weighted average shares outstanding | 48,582,585 | 46,309,072 | 47,565,062 | 47,620,308 | |||||||||||||||||||
(1) Includes share-based compensation expense as follows: | |||||||||||||||||||||||
| Cost of revenues | $ | 108 | $ | 136 | $ | 357 | $ | 413 | |||||||||||||||
| Sales and marketing | 427 | 321 | 1,160 | 1,135 | |||||||||||||||||||
| Research, development and engineering | 613 | 425 | 1,690 | 1,340 | |||||||||||||||||||
| General and administrative | 5,607 | 4,918 | 15,912 | 15,755 | |||||||||||||||||||
| Total | $ | 6,755 | $ | 5,800 | $ | 19,119 | $ | 18,643 | |||||||||||||||
ZIFF DAVIS, INC. AND SUBSIDIARIES
CONDENSED CONSOLIDATED STATEMENTS OF CASH FLOWS
(UNAUDITED, IN THOUSANDS)
| Nine Months Ended September 30, | |||||||||||
| Cash flows from operating activities: | 2021 | 2020 | |||||||||
| Net income | $ | 136,209 | $ | 92,580 | |||||||
| Adjustments to reconcile net income to net cash provided by operating activities: | |||||||||||
| Depreciation and amortization | 196,443 | 163,680 | |||||||||
| Amortization of financing costs and discounts | 21,295 | 21,393 | |||||||||
| Non-cash operating lease costs | 8,366 | 15,686 | |||||||||
| Share-based compensation | 19,119 | 18,643 | |||||||||
| Provision for doubtful accounts | 7,934 | 9,508 | |||||||||
| Deferred income taxes, net | 2,537 | 7,815 | |||||||||
| (Loss) gain on sale of businesses | 21,798 | (17,122) | |||||||||
| Lease asset impairments | 9,410 | 9,786 | |||||||||
| Goodwill impairment on business | 32,629 | — | |||||||||
| Changes in fair value of contingent consideration | (567) | (243) | |||||||||
| Foreign currency remeasurement gain | 181 | (15,919) | |||||||||
| (Income) loss from equity method investments | (16,596) | 10,799 | |||||||||
| Loss on equity and debt investments | 16,677 | 20,826 | |||||||||
| Decrease (increase) in: | |||||||||||
| Accounts receivable | 49,888 | 57,560 | |||||||||
| Prepaid expenses and other current assets | (10,610) | (3,279) | |||||||||
| Other assets | (2,378) | 543 | |||||||||
| Increase (decrease) in: | |||||||||||
| Accounts payable and accrued expenses | (1,409) | (26,430) | |||||||||
| Income taxes payable | (37,863) | (496) | |||||||||
| Deferred revenue | 4,774 | (10,494) | |||||||||
| Operating lease liabilities | (19,346) | (12,857) | |||||||||
| Liability for uncertain tax positions | (2,903) | 7,746 | |||||||||
| Other long-term liabilities | (5,336) | 6,284 | |||||||||
| Net cash provided by operating activities | 430,252 | 356,009 | |||||||||
| Cash flows from investing activities: | |||||||||||
| Proceeds on sale of available-for-sale investments | 663 | — | |||||||||
| Distribution from equity method investment | 15,327 | — | |||||||||
| Purchases of equity method investment | (22,249) | (29,979) | |||||||||
| Purchases of equity investments | (999) | (843) | |||||||||
| Purchases of property and equipment | (87,495) | (71,266) | |||||||||
| Acquisition of businesses, net of cash received | (112,444) | (27,156) | |||||||||
| Proceeds from sale of businesses, net of cash divested | 48,876 | 24,353 | |||||||||
| Proceeds from sale of assets | — | 507 | |||||||||
| Purchases of intangible assets | (1,255) | (2,902) | |||||||||
| Net cash used in investing activities | (159,576) | (107,286) | |||||||||
| Cash flows from financing activities: | |||||||||||
| Payment of debt | (402,414) | — | |||||||||
| Payment of note payable | — | (400) | |||||||||
| Proceeds from bridge loan | 485,000 | — | |||||||||
| Repurchase of common stock | (29,855) | (238,905) | |||||||||
| Issuance of common stock under employee stock purchase plan | 4,232 | 3,303 | |||||||||
| Exercise of stock options | 2,880 | 952 | |||||||||
| Deferred payments for acquisitions | (13,387) | (20,427) | |||||||||
| Other | (6,619) | (1,377) | |||||||||
| Net cash provided by (used in) financing activities | 39,837 | (256,854) | |||||||||
| Effect of exchange rate changes on cash and cash equivalents | (6,698) | 446 | |||||||||
| Net change in cash and cash equivalents | 303,815 | (7,685) | |||||||||
| Cash and cash equivalents at beginning of period | 242,652 | 575,615 | |||||||||
| Cash and cash equivalents at end of period | $ | 546,467 | $ | 567,930 | |||||||
ZIFF DAVIS, INC. AND SUBSIDIARIES
RECONCILIATION OF GAAP TO ADJUSTED NON-GAAP FINANCIAL MEASURES
THREE MONTHS ENDED SEPTEMBER 30, 2021 AND 2020
(UNAUDITED, IN THOUSANDS, EXCEPT PER SHARE AMOUNTS)
Adjusted non-GAAP net income is GAAP net income with the following modifications: (1) elimination of share-based compensation; (2) elimination of certain acquisition related integration costs; (3) elimination of interest costs in excess of the coupon rate associated with outstanding debt; (4) elimination of amortization of patents and intangible assets that we acquired; (5) elimination of change in value on investment; (6) elimination of additional tax expense/benefit from prior years; (7) elimination of gain/loss on sale of assets; (8) elimination of intra-entity transfers; (9) elimination of lease asset impairments and other charges; (10) elimination of disposal related costs; (11) elimination of goodwill impairment on business and (12) elimination of dilutive effect of the convertible debt.
| Three Months Ended September 30, | |||||||||||||||||
| 2021 | Per Diluted Share * | 2020 | Per Diluted Share * | ||||||||||||||
| Net income | $ | 42,569 | $ | 0.88 | $ | 60,883 | $ | 1.31 | |||||||||
| Plus: | |||||||||||||||||
Share based compensation (1) | 4,043 | 0.09 | 4,552 | 0.10 | |||||||||||||
Acquisition related integration costs (2) | 2,908 | 0.06 | 1,177 | 0.03 | |||||||||||||
Interest costs (3) | 2,774 | 0.06 | 4,784 | 0.10 | |||||||||||||
Amortization (4) | 35,327 | 0.75 | 32,314 | 0.70 | |||||||||||||
Investments (5) | 1,947 | 0.04 | 687 | 0.01 | |||||||||||||
Tax expense from prior years (6) | — | — | 2,551 | 0.06 | |||||||||||||
Sale of assets (7) | 19,249 | 0.41 | (9,936) | (0.21) | |||||||||||||
Intra-entity transfers (8) | — | — | (13,447) | (0.29) | |||||||||||||
Lease asset impairments and other charges (9) | 1,271 | 0.03 | 7,566 | 0.16 | |||||||||||||
Leasehold improvement impairments (10) | — | — | 2,777 | 0.06 | |||||||||||||
Disposal related costs (10) | 133 | — | — | — | |||||||||||||
Convertible debt dilution (12) | — | 0.03 | — | — | |||||||||||||
| Adjusted non-GAAP net income | $ | 110,221 | $ | 2.34 | $ | 93,908 | $ | 2.02 | |||||||||
* The reconciliation of net income per share from GAAP to Adjusted non-GAAP may not foot since each is calculated independently.
ZIFF DAVIS, INC. AND SUBSIDIARIES
RECONCILIATION OF GAAP TO ADJUSTED NON-GAAP FINANCIAL MEASURES
NINE MONTHS ENDED SEPTEMBER 30, 2021 AND 2020
(UNAUDITED, IN THOUSANDS, EXCEPT PER SHARE AMOUNTS)
Adjusted non-GAAP net income is GAAP net income with the following modifications: (1) elimination of share-based compensation; (2) elimination of certain acquisition related integration costs; (3) elimination of interest costs in excess of the coupon rate associated with outstanding debt; (4) elimination of amortization of patents and intangible assets that we acquired; (5) elimination of change in value on investment; (6) elimination of additional tax expense/benefit from prior years; (7) elimination of gain/loss on sale of assets; (8) elimination of intra-entity transfers; (9) elimination of lease asset impairments and other charges; (10) elimination of disposal related costs; (11) elimination of goodwill impairment on business and (12) elimination of dilutive effect of the convertible debt.
| Nine Months Ended September 30, | |||||||||||||||||
| 2021 | Per Diluted Share * | 2020 | Per Diluted Share * | ||||||||||||||
| Net income | $ | 136,209 | $ | 2.86 | $ | 92,580 | $ | 1.93 | |||||||||
| Plus: | |||||||||||||||||
Share based compensation (1) | 10,668 | 0.23 | 14,350 | 0.31 | |||||||||||||
Acquisition related integration costs (2) | 5,904 | 0.13 | 2,771 | 0.06 | |||||||||||||
Interest costs (3) | 12,460 | 0.27 | 13,929 | 0.30 | |||||||||||||
Amortization (4) | 105,827 | 2.32 | 89,398 | 1.91 | |||||||||||||
Investments (5) | (5,008) | (0.11) | 35,495 | 0.75 | |||||||||||||
Tax expense from prior years (6) | — | — | 4,916 | 0.11 | |||||||||||||
Sale of assets (7) | 16,551 | 0.37 | (10,271) | (0.22) | |||||||||||||
Intra-entity transfers (8) | — | — | (13,316) | (0.29) | |||||||||||||
Lease asset impairments and other charges (9) | 7,816 | 0.17 | 9,391 | 0.20 | |||||||||||||
Leasehold improvement impairments (10) | — | — | 2,777 | 0.06 | |||||||||||||
Disposal related costs (10) | 178 | — | — | — | |||||||||||||
Goodwill impairment on business (11) | 24,635 | 0.54 | — | — | |||||||||||||
Convertible debt dilution (12) | — | 0.12 | — | 0.03 | |||||||||||||
| Adjusted non-GAAP net income | $ | 315,240 | $ | 6.92 | $ | 242,020 | $ | 5.13 | |||||||||
* The reconciliation of net income per share from GAAP to Adjusted non-GAAP may not foot since each is calculated independently.
ZIFF DAVIS, INC. AND SUBSIDIARIES
RECONCILIATION OF GAAP TO ADJUSTED NON-GAAP FINANCIAL MEASURES
THREE MONTHS ENDED SEPTEMBER 30, 2021 AND 2020
(UNAUDITED, IN THOUSANDS, EXCEPT PER SHARE AMOUNTS)
Adjusted non-GAAP net income is GAAP net income with the following modifications: (1) elimination of share-based compensation; (2) elimination of certain acquisition related integration costs; (3) elimination of interest costs in excess of the coupon rate associated with outstanding debt; (4) elimination of amortization of patents and intangible assets that we acquired; (5) elimination of change in value on investment; (6) elimination of additional tax expense/benefit from prior years; (7) elimination of gain/loss on sale of assets; (8) elimination of intra-entity transfers; (9) elimination of lease asset impairments and other charges; (10) elimination of disposal related costs; (11) elimination of goodwill impairment on business and (12) elimination of dilutive effect of the convertible debt.
| Three Months Ended September 30, | ||||||||||||||
| 2021 | 2020 | |||||||||||||
| Cost of revenues | $ | 64,302 | $ | 55,822 | ||||||||||
| Plus: | ||||||||||||||
Share based compensation (1) | (108) | (136) | ||||||||||||
Acquisition related integration costs (2) | (209) | (60) | ||||||||||||
Amortization (4) | (356) | (908) | ||||||||||||
| Adjusted non-GAAP cost of revenues | $ | 63,629 | $ | 54,718 | ||||||||||
| Sales and marketing | $ | 139,693 | $ | 95,074 | ||||||||||
| Plus: | ||||||||||||||
Share based compensation (1) | (427) | (321) | ||||||||||||
Acquisition related integration costs (2) | (882) | (5) | ||||||||||||
| Adjusted non-GAAP sales and marketing | $ | 138,384 | $ | 94,748 | ||||||||||
| Research, development and engineering | $ | 21,639 | $ | 14,261 | ||||||||||
| Plus: | ||||||||||||||
Share based compensation (1) | (613) | (425) | ||||||||||||
Acquisition related integration costs (2) | (597) | (5) | ||||||||||||
| Adjusted non-GAAP research, development and engineering | $ | 20,429 | $ | 13,831 | ||||||||||
| General and administrative | $ | 122,477 | $ | 114,381 | ||||||||||
| Plus: | ||||||||||||||
Share based compensation (1) | (5,607) | (4,918) | ||||||||||||
Acquisition related integration costs (2) | (2,265) | (1,428) | ||||||||||||
Amortization (4) | (48,093) | (39,995) | ||||||||||||
Lease asset impairments and other charges (9) | (1,685) | (9,786) | ||||||||||||
Leasehold improvement impairments (10) | — | (3,605) | ||||||||||||
Disposal related costs (10) | (344) | — | ||||||||||||
| Adjusted non-GAAP general and administrative | $ | 64,483 | $ | 54,649 | ||||||||||
| Interest expense, net | $ | (19,862) | $ | (22,712) | ||||||||||
| Plus: | ||||||||||||||
Interest costs (3) | 4,007 | 6,140 | ||||||||||||
| Adjusted non-GAAP interest expense, net | $ | (15,855) | $ | (16,572) | ||||||||||
| (Loss) gain on sale of businesses | $ | (24,600) | $ | 17,122 | ||||||||||
| Plus: | ||||||||||||||
Sale of assets (7) | 24,600 | (17,122) | ||||||||||||
| Adjusted non-GAAP gain on sale of businesses | $ | — | $ | — | ||||||||||
| Loss on investments, net | $ | — | $ | (156) | ||||||||||
| Plus: | ||||||||||||||
Sale of assets (7) | — | 165 | ||||||||||||
| Adjusted non-GAAP loss on investments, net | $ | — | $ | 9 | ||||||||||
| Other income (expense), net | $ | 1,660 | $ | 14,230 | ||||||||||
| Plus: | ||||||||||||||
Sale of assets (7) | — | (211) | ||||||||||||
Intra-entity transfers (8) | — | (16,421) | ||||||||||||
| Adjusted non-GAAP other income (expense), net | $ | 1,660 | $ | (2,402) | ||||||||||
| Income tax provision | $ | 8,847 | $ | 24,330 | ||||||||||
| Plus: | ||||||||||||||
Share based compensation (1) | 2,712 | 1,248 | ||||||||||||
Acquisition related integration costs (2) | 1,045 | 321 | ||||||||||||
Interest costs (3) | 1,233 | 1,356 | ||||||||||||
Amortization (4) | 13,122 | 8,589 | ||||||||||||
Investments (5) | (24) | 22 | ||||||||||||
Tax benefit from prior years (6) | — | (2,551) | ||||||||||||
Sale of assets (7) | 5,351 | (7,232) | ||||||||||||
Intra-entity transfers (8) | — | (2,974) | ||||||||||||
Lease asset impairments and other charges (9) | — | 2,220 | ||||||||||||
Leasehold improvement impairments (10) | 414 | 828 | ||||||||||||
Disposal related costs (10) | 211 | — | ||||||||||||
| Adjusted non-GAAP income tax provision | $ | 32,911 | $ | 26,157 | ||||||||||
| Loss from equity method investment, net | $ | (1,923) | $ | (709) | ||||||||||
| Plus: | ||||||||||||||
Investments (5) | 1,923 | 709 | ||||||||||||
| Adjusted non-GAAP income (loss) from equity method investment, net | $ | — | $ | — | ||||||||||
| Total adjustments | $ | (67,652) | $ | (33,025) | ||||||||||
| GAAP earnings per diluted share | $ | 0.88 | $ | 1.31 | ||||||||||
| Adjustments * | $ | 1.46 | $ | 0.71 | ||||||||||
| Adjusted non-GAAP earnings per diluted share | $ | 2.34 | $ | 2.02 | ||||||||||
* The reconciliation of net income per share from GAAP to Adjusted non-GAAP may not foot since each is calculated independently.
The Company discloses Adjusted non-GAAP Earnings Per Share (“EPS”) as a supplemental Non-GAAP financial performance measure, as it believes it is a useful metric by which to compare the performance of its business from period to period. The Company also understands that this Adjusted non-GAAP measure is broadly used by analysts, rating agencies and investors in assessing the Company’s performance. Accordingly, the Company believes that the presentation of this Adjusted non-GAAP financial measure provides useful information to investors.
Adjusted non-GAAP EPS is not in accordance with, or an alternative to, net income per share and may be different from Non-GAAP measures with similar or even identical names used by other companies. In addition, this Adjusted non-GAAP measure is not based on any comprehensive set of accounting rules or principles. This Adjusted non-GAAP measure has limitations in that it does not reflect all of the amounts associated with the Company’s results of operations determined in accordance with GAAP.
ZIFF DAVIS, INC. AND SUBSIDIARIES
RECONCILIATION OF GAAP TO ADJUSTED NON-GAAP FINANCIAL MEASURES
NINE MONTHS ENDED SEPTEMBER 30, 2021 AND 2020
(UNAUDITED, IN THOUSANDS, EXCEPT PER SHARE AMOUNTS)
Adjusted non-GAAP net income is GAAP net income with the following modifications: (1) elimination of share-based compensation; (2) elimination of certain acquisition related integration costs; (3) elimination of interest costs in excess of the coupon rate associated with outstanding debt; (4) elimination of amortization of patents and intangible assets that we acquired; (5) elimination of change in value on investment; (6) elimination of additional tax expense/benefit from prior years; (7) elimination of gain/loss on sale of assets; (8) elimination of intra-entity transfers; (9) elimination of lease asset impairments and other charges; (10) elimination of disposal related costs; (11) elimination of goodwill impairment on business and (12) elimination of dilutive effect of the convertible debt.
| Nine Months Ended September 30, | ||||||||||||||
| 2021 | 2020 | |||||||||||||
| Cost of revenues | $ | 185,462 | $ | 171,755 | ||||||||||
| Plus: | ||||||||||||||
Share based compensation (1) | (357) | (413) | ||||||||||||
Acquisition related integration costs (2) | (286) | (170) | ||||||||||||
Amortization (4) | (1,301) | (1,806) | ||||||||||||
| Adjusted non-GAAP cost of revenues | $ | 183,518 | $ | 169,366 | ||||||||||
| Sales and marketing | $ | 394,981 | $ | 287,317 | ||||||||||
| Plus: | ||||||||||||||
Share based compensation (1) | (1,160) | (1,135) | ||||||||||||
Acquisition related integration costs (2) | (1,696) | (686) | ||||||||||||
| Adjusted non-GAAP sales and marketing | $ | 392,125 | $ | 285,496 | ||||||||||
| Research, development and engineering | $ | 62,634 | $ | 43,273 | ||||||||||
| Plus: | ||||||||||||||
Share based compensation (1) | (1,690) | (1,340) | ||||||||||||
Acquisition related integration costs (2) | (1,127) | 21 | ||||||||||||
| Adjusted non-GAAP research, development and engineering | $ | 59,817 | $ | 41,954 | ||||||||||
| General and administrative | $ | 359,498 | $ | 312,283 | ||||||||||
| Plus: | ||||||||||||||
Share based compensation (1) | (15,912) | (15,755) | ||||||||||||
Acquisition related integration costs (2) | (5,050) | (2,762) | ||||||||||||
Amortization (4) | (144,403) | (114,147) | ||||||||||||
Sale of assets (7) | 490 | |||||||||||||
Lease asset impairments and other charges (9) | (10,336) | (12,191) | ||||||||||||
Leasehold improvement impairments (10) | — | (3,605) | ||||||||||||
Disposal related costs (10) | (472) | — | ||||||||||||
| Adjusted non-GAAP general and administrative | $ | 183,815 | $ | 163,823 | ||||||||||
| Interest expense, net | $ | (62,832) | $ | (65,879) | ||||||||||
| Plus: | ||||||||||||||
Interest costs (3) | 16,503 | 18,092 | ||||||||||||
Tax expense from prior years (6) | — | — | ||||||||||||
| Adjusted non-GAAP interest expense, net | $ | (46,329) | $ | (47,787) | ||||||||||
| (Loss) gain on sale of businesses | $ | (21,798) | $ | 17,122 | ||||||||||
| Plus: | ||||||||||||||
Sale of assets (7) | 22,288 | (17,122) | ||||||||||||
| Adjusted non-GAAP gain on sale of businesses | $ | 490 | $ | — | ||||||||||
| Goodwill impairment on business | (32,629) | — | ||||||||||||
| Plus: | ||||||||||||||
Goodwill impairment on business (11) | 32,629 | — | ||||||||||||
| Adjusted non-GAAP goodwill impairment on business | $ | — | $ | — | ||||||||||
| Loss on investments, net | $ | (16,677) | $ | (20,991) | ||||||||||
| Plus: | ||||||||||||||
Investments (5) | 16,677 | 20,825 | ||||||||||||
Sale of assets (7) | — | 165 | ||||||||||||
| Adjusted non-GAAP loss on investments, net | $ | — | $ | (1) | ||||||||||
| Other income (expense), net | $ | 1,367 | $ | 16,413 | ||||||||||
| Plus: | ||||||||||||||
Sale of assets (7) | 200 | (650) | ||||||||||||
Intra-entity transfers (8) | — | (17,986) | ||||||||||||
| Adjusted non-GAAP other income (expense), net | $ | 1,567 | $ | (2,223) | ||||||||||
| Income tax provision | $ | 16,723 | $ | 49,011 | ||||||||||
| Plus: | ||||||||||||||
Share based compensation (1) | 8,451 | 4,293 | ||||||||||||
Acquisition related integration costs (2) | 2,255 | 826 | ||||||||||||
Interest costs (3) | 4,043 | 4,163 | ||||||||||||
Amortization (4) | 39,877 | 26,555 | ||||||||||||
Investments (5) | 5,089 | (3,871) | ||||||||||||
Tax (benefit) expense from prior years (6) | — | (4,916) | ||||||||||||
Sale of assets (7) | 5,447 | (7,336) | ||||||||||||
Intra-entity transfers (8) | — | (4,670) | ||||||||||||
Lease asset impairments and other charges (9) | 2,520 | 2,800 | ||||||||||||
Leasehold improvement impairments (10) | — | 828 | ||||||||||||
Disposal related costs (10) | 294 | — | ||||||||||||
Goodwill impairment on business (11) | 7,994 | — | ||||||||||||
| Adjusted non-GAAP income tax provision | $ | 92,693 | $ | 67,683 | ||||||||||
| Income (loss) from equity method investment, net | $ | 16,596 | $ | (10,799) | ||||||||||
| Plus: | ||||||||||||||
Investments (5) | (16,596) | 10,799 | ||||||||||||
| Adjusted non-GAAP income (loss) from equity method investment, net | $ | — | $ | — | ||||||||||
| Total adjustments | $ | (179,031) | $ | (149,440) | ||||||||||
| GAAP earnings per diluted share | $ | 2.86 | $ | 1.93 | ||||||||||
| Adjustments * | $ | 4.06 | $ | 3.20 | ||||||||||
| Adjusted non-GAAP earnings per diluted share | $ | 6.92 | $ | 5.13 | ||||||||||
* The reconciliation of net income per share from GAAP to Adjusted non-GAAP may not foot since each is calculated independently.
The Company discloses Adjusted non-GAAP Earnings Per Share (“EPS”) as a supplemental Non-GAAP financial performance measure, as it believes it is a useful metric by which to compare the performance of its business from period to period. The Company also understands that this Adjusted non-GAAP measure is broadly used by analysts, rating agencies and investors in assessing the Company’s performance. Accordingly, the Company believes that the presentation of this Adjusted non-GAAP financial measure provides useful information to investors.
Adjusted non-GAAP EPS is not in accordance with, or an alternative to, net income per share and may be different from Non-GAAP measures with similar or even identical names used by other companies. In addition, this Adjusted non-GAAP measure
is not based on any comprehensive set of accounting rules or principles. This Adjusted non-GAAP measure has limitations in that it does not reflect all of the amounts associated with the Company’s results of operations determined in accordance with GAAP.
Non-GAAP Financial Measures
To supplement its condensed consolidated financial statements, which are prepared and presented in accordance with US GAAP, the Company uses the following Non-GAAP financial measures: Adjusted EBITDA, Adjusted non-GAAP Net Income, and Adjusted non-GAAP Diluted EPS (collectively the “Non-GAAP financial measures”). The presentation of this financial information is not intended to be considered in isolation or as a substitute for, or superior to, the financial information prepared and presented in accordance with U.S. GAAP. The Company uses these Non-GAAP financial measures for financial and operational decision making and as a means to evaluate period-to-period comparisons. The Company believes that they provide useful information about core operating results, enhance the overall understanding of past financial performance and future prospects, and allow for greater transparency with respect to key metrics used by management in its financial and operational decision making.
(1) Share Based Compensation. The Company excludes stock-based compensation because it is non-cash in nature and because the Company believes that the Non-GAAP financial measures excluding this item provide meaningful supplemental information regarding operational performance. The Company further believes this measure is useful to investors in that it allows for greater transparency to certain line items in its financial statements. In addition, excluding this item from the Non-GAAP measures facilitates comparisons to historical operating results and comparisons to peers, many of which similarly exclude this item.
(2) Acquisition Related Integration Costs. The Company excludes certain acquisition and related integration costs such as adjustments to contingent consideration, severance, lease terminations, retention bonuses and other acquisition-specific items. The Company believes that the Non-GAAP financial measures excluding this item provide meaningful supplemental information regarding operational performance. In addition, excluding this item from the Non-GAAP measures facilitates comparisons to historical operating results and comparisons to peers, many of which similarly exclude this item.
(3) Interest Costs. In June 2014, the Company issued $402.5 million aggregate principal amount of 3.25% convertible senior notes and in November 2019, the Company issued $550.0 million aggregate principal amount of 1.75% convertible senior notes. In accordance with GAAP, the Company separately accounts for the value of the liability and equity features of its outstanding convertible senior notes in a manner that reflects the Company’s non-convertible debt borrowing rate. The value of the conversion feature, reflected as a debt discount, is amortized to interest expense over time. Accordingly, the Company recognizes imputed interest expense on its 3.25% and 1.75% convertible senior notes of approximately 5.8% and 5.5%, respectively, in its statement of operations. The Company excludes the difference between the imputed interest expense and the coupon interest expense of 3.25% and 1.75%, respectively, because it is non-cash in nature and because the Company believes that the Non-GAAP financial measures excluding this item provide meaningful supplemental information regarding core operational performance. In addition, the Company has excluded the difference between the imputed and coupon interest expense associated with the 4.625% Senior Notes. The Company has determined excluding these items from the Non-GAAP measures facilitates comparisons to historical operating results and comparisons to peers, many of which similarly exclude this item.
(4) Amortization. The Company excludes amortization of patents and acquired intangible assets because it is non-cash in nature and because the Company believes that the Non-GAAP financial measures excluding this item provide meaningful supplemental information regarding operational performance. In addition, excluding this item from the Non-GAAP measures facilitates comparisons to historical operating results and comparisons to peers, many of which similarly exclude this item.
(5) Change in Value on Investments. The Company excludes the change in value on its investments. The Company believes that the Non-GAAP financial measures excluding this item provide meaningful supplemental information regarding operational performance. In addition, excluding this item from the Non-GAAP measures facilitates comparisons to historical operating results.
(6) Tax Expense/Benefit from Prior Years. The Company excludes certain income tax-related items in respect of income tax audit settlements and their related reversals of income tax reserves accounted for through ASC 740-10. The Company believes that the Non-GAAP financial measures excluding these items provide meaningful supplemental information regarding operational performance. In addition, excluding these items from the Non-GAAP measures facilitates comparisons to historical operating results.
(7) Gain (Loss) on Sale of Assets. The Company excludes the gain (loss) on sale of certain of its assets. The Company believes that the Non-GAAP financial measures excluding this item provide meaningful supplemental information regarding operational performance. In addition, excluding this item from the Non-GAAP measures facilitates comparisons to historical operating results.
(8) Intra-Entity Transfers. The Company excludes certain effects of intra-entity transfers to the extent the related tax asset or liability in the financial statement is not recovered or settled, respectively during the year. During December 2019, the Company entered into an intra-entity asset transfer that resulted in the recording of a tax benefit and related tax asset representing tax deductible amounts to be realized in future years which is expected to be recovered over a period of up to 20 years and related foreign currency fluctuations. The Company believes that the Non-GAAP financial measures excluding the cumulative future unrealized benefit of the assets transferred and including the tax benefit in the year of realization provides meaningful supplemental information regarding operational performance. In addition, excluding this item from the Non-GAAP measures facilitates comparisons to historical operating results.
(9) Lease Asset Impairments and Other Charges. The Company excludes lease asset impairments and other charges as they are non-cash in nature and because the Company believes that the Non-GAAP financial measures excluding this item provide meaningful supplemental information regarding operational performance. In addition, excluding this item from the Non-GAAP measures facilitates comparisons to historical operating results.
(10) Disposal related Costs. The Company excludes expenses associated with the disposal of certain businesses. The Company believes that the Non-GAAP financial measures excluding this item provide meaningful supplemental information regarding operational performance. In addition, excluding this item from the Non-GAAP measures facilitates comparisons to historical operating results.
(11) Goodwill Impairment on Business. The Company excludes the goodwill impairment on business because it is non-cash in nature and the Company believes that the Non-GAAP financial measures excluding this item provide meaningful supplemental information regarding operational performance. In addition, excluding this item from the Non-GAAP measures facilitates comparisons to historical operating results.
(12) Convertible Debt Dilution. The Company excludes convertible debt dilution from diluted EPS. The Company believes that the Non-GAAP financial measures excluding this item provide meaningful supplemental information regarding operational performance. In addition, excluding this item from the Non-GAAP measures facilitates comparisons to historical operating results.
The Company presents Adjusted non-GAAP Cost of Revenues, Adjusted non-GAAP Research, Development and Engineering, Adjusted non-GAAP Sales and Marketing, Adjusted non-GAAP General and Administrative, Adjusted non-GAAP Interest Expense, Adjusted Gain on Sale of Businesses, Adjusted non-GAAP Loss on Investments, Adjusted non-GAAP Other (Income) Expense, Adjusted non-GAAP Income Tax Provision, Adjusted non-GAAP (Income) Loss from Equity Method Investment, Net and Adjusted non-GAAP Net Income because the Company believes that these provide useful information about our operating results and enhance the overall understanding of past financial performance and future prospects.
Pro-Forma Financial Results
Key pro-forma financial results for the three and nine months ended September 30, 2021 and 2020, are set forth in the following table (in millions, except per share amounts). The financial results below reflect the Company’s results, on a pro-forma basis, taking into consideration the sale of certain Voice assets in Australia, New Zealand, and the United Kingdom as well as the sale of the Company’s B2B Backup business as if they had occurred January 1, 2020.
| Three Months Ended | Nine Months Ended | ||||||||||||||||
| Q3 2021 | Q3 2020 | Q3 2021 | Q3 2020 | ||||||||||||||
| Total Revenues | $444.3 million | $357.0 million | $1,271.5 million | $1,020.4 million | |||||||||||||
| Pro-Forma Revenue Adjustments | $(9.6) million | $(16.7) million | $(33.5) million | $(54.3) million | |||||||||||||
Pro-Forma Total Revenue: (1) | $434.7 million | $340.3 million | $1,238.0 million | $966.1 million | |||||||||||||
Adjusted Non-GAAP Earnings per Diluted Share (1) | $2.34 | $2.02 | $6.92 | $5.13 | |||||||||||||
| Pro-Forma Earnings per Diluted Share Adjustments | $(0.07) | $(0.07) | $(0.24) | $(0.26) | |||||||||||||
Adjusted Pro Forma Earnings per Diluted Share (1) | $2.27 | $1.95 | $6.68 | $4.87 | |||||||||||||
| GAAP Net Income | $42.6 million | $60.9 million | $136.2 million | $92.6 million | |||||||||||||
| Pro-Forma Net Income Adjustments | $64.5 million | $29.3 million | $168.2 million | $137.2 million | |||||||||||||
| Adjusted Pro-Forma Net Income | $107.1 million | $90.2million | $304.4 million | $229.8 million | |||||||||||||
Adjusted EBITDA (1) | $175.1 million | $154.1 million | $503.4 million | $403.8 million | |||||||||||||
| Pro-Forma EBITDA Adjustments | $(4.3) million | $(6.9) million | $(13.9) million | $(20.8) million | |||||||||||||
Adjusted Pro-Forma EBITDA (1) | $170.8 million | $147.2 million | $489.5 million | $383.0 million | |||||||||||||
Adjusted EBITDA Margin (1) | 39.4% | 43.2% | 39.6% | 39.6% | |||||||||||||
| Pro-Forma EBITDA Margin Adjustments | (0.1)% | 0.1% | (0.1)% | 0.1% | |||||||||||||
Adjusted Pro-Forma EBITDA Margin (1) | 39.3% | 43.3% | 39.5% | 39.6% | |||||||||||||
(1) Refer to the notes earlier in this Release.
ZIFF DAVIS, INC. AND SUBSIDIARIES
NET INCOME TO ADJUSTED EBITDA RECONCILIATION
THREE AND NINE MONTHS ENDED SEPTEMBER 30, 2021 AND 2020
(UNAUDITED, IN THOUSANDS)
The following table sets forth a reconciliation of net income, the most directly comparable GAAP financial measure, to Adjusted EBITDA.
| Three Months Ended September 30, | Nine Months Ended September 30, | ||||||||||||||||||||||
| 2021 | 2020 | 2021 | 2020 | ||||||||||||||||||||
| Net income | $ | 42,569 | $ | 60,883 | $ | 136,209 | $ | 92,580 | |||||||||||||||
| Plus: | |||||||||||||||||||||||
| Interest expense, net | 19,862 | 22,712 | 62,832 | 65,879 | |||||||||||||||||||
| Loss (gain) on sale of businesses | 24,600 | (17,122) | 21,798 | (17,122) | |||||||||||||||||||
| Loss on investments, net | — | 156 | 16,677 | 20,991 | |||||||||||||||||||
| Other (income) expense, net | (1,660) | (14,230) | (1,367) | (16,413) | |||||||||||||||||||
| Income tax expense | 8,847 | 24,330 | 16,723 | 49,011 | |||||||||||||||||||
| (Income) loss from equity method investment, net | 1,923 | 709 | (16,596) | 10,799 | |||||||||||||||||||
| Depreciation and amortization | 66,217 | 59,612 | 196,443 | 163,680 | |||||||||||||||||||
| Reconciliation of GAAP to Adjusted non-GAAP financial measures: | |||||||||||||||||||||||
| Share-based compensation | 6,755 | 5,800 | 19,119 | 18,643 | |||||||||||||||||||
| Acquisition-related integration costs | 3,953 | 1,498 | 8,159 | 3,597 | |||||||||||||||||||
| Lease asset impairments and other charges | 1,685 | 9,786 | 10,336 | 12,191 | |||||||||||||||||||
| Disposal related costs | 345 | — | 472 | — | |||||||||||||||||||
| Goodwill impairment on business | — | — | 32,629 | — | |||||||||||||||||||
| Adjusted EBITDA | $ | 175,096 | $ | 154,134 | $ | 503,434 | $ | 403,836 | |||||||||||||||
Adjusted EBITDA as calculated above represents earnings before interest, gain on sale of businesses, goodwill impairment of business, loss on investments, net, other (income) expense, net, income tax expense, (income) loss from equity method investments, net, depreciation and amortization and the items used to reconcile GAAP to Adjusted non-GAAP financial measures, including (1) share-based compensation, (2) certain acquisition-related integration costs, and (3) lease asset impairments and other charges. We disclose Adjusted EBITDA as a supplemental Non-GAAP financial performance measure as we believe it is a useful metric by which to compare the performance of our business from period to period. We understand that measures similar to Adjusted EBITDA are broadly used by analysts, rating agencies and investors in assessing our performance. Accordingly, we believe that the presentation of Adjusted EBITDA provides useful information to investors.
Adjusted EBITDA is not in accordance with, or an alternative to, net income, and may be different from Non-GAAP measures used by other companies. In addition, Adjusted EBITDA is not based on any comprehensive set of accounting rules or principles. This Adjusted non-GAAP measure has limitations in that it does not reflect all of the amounts associated with the Company’s results of operations determined in accordance with GAAP.
ZIFF DAVIS, INC. AND SUBSIDIARIES
NON-GAAP FINANCIAL MEASURES
(UNAUDITED, IN THOUSANDS)
| Q1 | Q2 | Q3 | Q4 | YTD | |||||||||||||||||||||||||
| 2021 | |||||||||||||||||||||||||||||
| Net cash provided by operating activities | $ | 178,724 | $ | 111,298 | $ | 140,230 | $ | — | $ | 430,252 | |||||||||||||||||||
| Less: Purchases of property and equipment | (26,269) | (31,497) | (29,729) | — | (87,495) | ||||||||||||||||||||||||
| Add: Contingent consideration* | — | 685 | — | — | 685 | ||||||||||||||||||||||||
| Free cash flows | $ | 152,455 | $ | 80,486 | $ | 110,501 | $ | — | $ | 343,442 | |||||||||||||||||||
| Q1 | Q2 | Q3 | Q4 | YTD | |||||||||||||||||||||||||
| 2020 | |||||||||||||||||||||||||||||
| Net cash provided by operating activities | $ | 102,036 | $ | 139,591 | $ | 114,382 | $ | 124,070 | $ | 480,079 | |||||||||||||||||||
| Less: Purchases of property and equipment | (26,885) | (23,652) | (20,729) | (21,286) | (92,552) | ||||||||||||||||||||||||
| Add: Contingent consideration* | 20,054 | — | 49 | 99 | 20,202 | ||||||||||||||||||||||||
| Free cash flows | $ | 95,205 | $ | 115,939 | $ | 93,702 | $ | 102,883 | $ | 407,729 | |||||||||||||||||||
| * Free Cash Flows of $80.5 million for Q2 2021, $95.2 million for Q1 2020, $93.7 million for Q3 2020 and $102.9 million for Q4 2020 is before the effect of payments associated with certain contingent consideration associated with recent acquisitions. | |||||||||||||||||||||||||||||
The Company discloses free cash flows as supplemental Non-GAAP financial performance measure, as it believes it is a useful metric by which to compare the performance of its business from period to period. The Company also understands that this Non-GAAP measure is broadly used by analysts, rating agencies and investors in assessing the Company’s performance. Accordingly, the Company believes that the presentation of this Non-GAAP financial measure provides useful information to investors.
Free cash flows is not in accordance with, or an alternative to, Cash Flows from Operating Activities, and may be different from Non-GAAP measures with similar or even identical names used by other companies. In addition, the Non-GAAP measure is not based on any comprehensive set of accounting rules or principles. This Non-GAAP measure has limitations in that it does not reflect all of the amounts associated with the Company’s results of operations determined in accordance with GAAP.
ZIFF DAVIS, INC. AND SUBSIDIARIES
RECONCILIATION OF GAAP TO ADJUSTED NON-GAAP FINANCIAL MEASURES
THREE MONTHS ENDED SEPTEMBER 30, 2021
(UNAUDITED, IN THOUSANDS)
| Cloud | Digital | ||||||||||||||||||||||
| Services | Media | Corporate | Total | ||||||||||||||||||||
| Revenues | |||||||||||||||||||||||
| GAAP revenues | $ | 182,090 | $ | 262,162 | $ | — | $ | 444,252 | |||||||||||||||
| Gross profit | |||||||||||||||||||||||
| GAAP gross profit | $ | 141,388 | $ | 238,562 | $ | — | $ | 379,950 | |||||||||||||||
| Non-GAAP adjustments: | |||||||||||||||||||||||
| Share-based compensation | 104 | 4 | — | 108 | |||||||||||||||||||
| Acquisition related integration costs | 188 | 21 | — | 209 | |||||||||||||||||||
| Amortization | 356 | — | — | 356 | |||||||||||||||||||
| Adjusted non-GAAP gross profit | $ | 142,036 | $ | 238,587 | $ | — | $ | 380,623 | |||||||||||||||
| Operating profit | |||||||||||||||||||||||
| GAAP operating profit (loss) | $ | 61,685 | $ | 49,822 | $ | (15,366) | $ | 96,141 | |||||||||||||||
| Non-GAAP adjustments: | |||||||||||||||||||||||
| Share-based compensation | 1,451 | 2,125 | 3,179 | 6,755 | |||||||||||||||||||
| Acquisition related integration costs | 3,511 | 416 | 26 | 3,953 | |||||||||||||||||||
| Amortization | 11,040 | 37,333 | 77 | 48,450 | |||||||||||||||||||
| Lease asset impairments and other charges | 1,033 | 652 | — | 1,685 | |||||||||||||||||||
| Disposal related costs | — | — | 345 | 345 | |||||||||||||||||||
| Adjusted non-GAAP operating profit (loss) | $ | 78,720 | $ | 90,348 | $ | (11,739) | $ | 157,329 | |||||||||||||||
| Depreciation | 4,996 | 12,771 | — | 17,767 | |||||||||||||||||||
| Adjusted EBITDA | $ | 83,716 | $ | 103,119 | $ | (11,739) | $ | 175,096 | |||||||||||||||
NOTE 1: Table above excludes certain intercompany allocations | |||||||||||||||||||||||
ZIFF DAVIS, INC. AND SUBSIDIARIES
RECONCILIATION OF GAAP TO ADJUSTED NON-GAAP FINANCIAL MEASURES
THREE MONTHS ENDED SEPTEMBER 30, 2020
(UNAUDITED, IN THOUSANDS)
| Cloud | Digital | ||||||||||||||||||||||
| Services | Media | Corporate | Total | ||||||||||||||||||||
| Revenues | |||||||||||||||||||||||
| GAAP revenues | $ | 170,248 | $ | 186,728 | $ | — | $ | 356,976 | |||||||||||||||
| Gross profit | |||||||||||||||||||||||
| GAAP gross profit | $ | 131,827 | $ | 169,338 | $ | (11) | $ | 301,154 | |||||||||||||||
| Non-GAAP adjustments: | |||||||||||||||||||||||
| Share-based compensation | 133 | 3 | — | 136 | |||||||||||||||||||
| Acquisition related integration costs | 60 | — | — | 60 | |||||||||||||||||||
| Amortization | 908 | — | — | 908 | |||||||||||||||||||
| Adjusted non-GAAP gross profit | $ | 132,928 | $ | 169,341 | $ | (11) | $ | 302,258 | |||||||||||||||
| Operating profit | |||||||||||||||||||||||
| GAAP operating profit (loss) | $ | 65,813 | $ | 26,027 | $ | (14,402) | $ | 77,438 | |||||||||||||||
| Non-GAAP adjustments: | |||||||||||||||||||||||
| Share-based compensation | 1,388 | 1,356 | 3,056 | 5,800 | |||||||||||||||||||
| Acquisition related integration costs | 123 | 1,220 | 155 | 1,498 | |||||||||||||||||||
| Amortization | 16,114 | 22,352 | 2,437 | 40,903 | |||||||||||||||||||
| Lease asset impairments and other charges | — | 9,786 | — | 9,786 | |||||||||||||||||||
| Adjusted non-GAAP operating profit (loss) | $ | 83,438 | $ | 60,741 | $ | (8,754) | $ | 135,425 | |||||||||||||||
| Depreciation | 4,410 | 14,299 | — | 18,709 | |||||||||||||||||||
| Adjusted EBITDA | $ | 87,848 | $ | 75,040 | $ | (8,754) | $ | 154,134 | |||||||||||||||
NOTE 1: Table above excludes certain intercompany allocations | |||||||||||||||||||||||
NOTE 2: Table above has been recast to remove the impact of certain expenses associated with the Corporate entity that were previously allocated to the Cloud Services and Digital Media businesses. | |||||||||||||||||||||||
www.ziffdavis.com©2021 Ziff Davis. All rights reserved. THIRD QUARTER 2021 RESULTS November 3, 2021
2 Certain statements in this presentation are “forward-looking statements” within the meaning of the Private Securities Litigation Reform Act of 1995, particularly those regarding our 2021 Financial Guidance. Such forward-looking statements are subject to numerous assumptions, risks and uncertainties that could cause actual results to differ materially from those described in those statements. Readers should carefully review the Risk Factors slide of this presentation. These forward- looking statements are based on management’s expectations or beliefs as of November 3, 2021 as well as those set forth in our Annual Report on Form 10-K filed by us on March 1, 2021 with the Securities and Exchange Commission (“SEC”) and the other reports we file from time to time with the SEC. We undertake no obligation to revise or publicly release any updates to such statements based on future information or actual results. Such forward-looking statements address the following subjects, among others: • Future operating results • Ability to acquire businesses on acceptable terms and integrate and recognize synergies from acquired businesses • Deployment of cash and investment balances to grow the company • Subscriber growth, retention, usage levels and average revenue per account • Cloud service and digital media growth • International growth • New products, services, features and technologies • Corporate spending including stock repurchases • Intellectual property and related licensing revenues • Liquidity and ability to repay or refinance indebtedness • Systems capacity, coverage, reliability and security • Regulatory developments and taxes All information in this presentation speaks as of November 3, 2021 and any redistribution or rebroadcast of this presentation after that date is not intended and will not be construed as updating or confirming such information. Industry, Market and Other Data Certain information contained in this presentation concerning our industry and the markets in which we operate, including our general expectations and market position, market opportunity and market size, is based on reports from various sources. Because this information involves a number of assumptions and limitations, you are cautioned not to give undue weight to such information. We have not independently verified market data and industry forecasts provided by any of these or any other third-party sources referred to in this presentation. In addition, projections, assumptions and estimates of our future performance and the future performance of the industry in which we operate are necessarily subject to a high degree of uncertainty and risk due to a variety of factors. These and other factors could cause results to differ materially from those expressed in the estimates made by third parties and by us. Pro Forma Financial Information Unless otherwise specified, all financial data and operating metrics presented herein for Ziff Davis are presented on a pro forma (“PF”) basis giving effect to the reorganization and the separation of Consensus Cloud Solutions, Inc. as described in the Form 10 filed by Consensus with the Securities and Exchange Commission. Non-GAAP Financial information Included in this presentation are certain financial measures that are not calculated in accordance with U.S. generally accepted accounting principles ("GAAP") designed to supplement, and not substitute, Ziff Davis’s financial information presented in accordance with GAAP. The non-GAAP measures as defined by Ziff Davis may not be comparable to similar non-GAAP measures presented by other companies. The presentation of such measures, which may include adjustments to exclude unusual or non-recurring items, should not be construed as an inference that Ziff Davis’s future results or leverage will be unaffected by other unusual or non-recurring items. Please see the appendix to this presentation for how we define these non-GAAP measures, a discussion of why we believe they are useful to investors and certain limitations thereof, and reconciliations thereof to the most directly comparable GAAP measures. Third Party Information All third-party trademarks, including names, logos and brands, referenced by the Company in this presentation are property of their respective owners. All references to third-party trademarks are for identification purposes only and shall be considered nominative fair use under trademark law. Safe Harbor for Forward-looking Statements
3 The following factors, among others, could cause our business, prospects, financial condition, operating results and cash flows to be materially adversely affected: • Inability to continue to expand our business and operations internationally • Inability to maintain required services on acceptable terms with financially stable telecom, co-location and other critical vendors; and inability to obtain telephone numbers in sufficient quantities on acceptable terms and in desired locations • Level of debt limiting availability of cash flow to reinvest in the business; inability to repay or refinance debt when due; and restrictive covenants relating to debt imposing operating and financial restrictions on business activities or plans • Inability to maintain and increase our customer base or average revenue per user • Inability to achieve business or financial results in light of burdensome telecommunications, internet, advertising, health care, consumer, privacy or other regulations, or being subject to existing regulations • Inability to adapt to technological change and diversify services and related revenues at acceptable levels of financial return • Loss of services of executive officers and other key employees • Other factors set forth in our Annual Report on Form 10-K filed by us on March 1, 2021 with the SEC and the other reports we file from time to time with the SEC • Inability to sustain growth or profitability, and any related impact of U.S. or worldwide economic issues on customer acquisition, retention and usage levels, advertising spend and credit and debit card payment declines • Inability to acquire businesses on acceptable terms or successfully integrate and realize anticipated synergies • Failure to offer compelling digital media content causing reduced traffic and advertising levels; loss of advertisers or reduction in advertising spend; increased prevalence or effectiveness of advertising blocking technologies; inability to monetize handheld devices and handheld traffic supplanting monetized traffic; and changes by our vendors or partners that impact our traffic or publisher audience acquisition and/or monetization • New or unanticipated costs and/or fees or tax liabilities, including those relating to federal and state income tax and indirect taxes, such as sales, value-added and telecommunications taxes • Inability to manage certain risks inherent to our business, such as fraudulent activity, system failure or a security breach; inability to manage reputational risks associated with our businesses • Competition from others with regard to price, service, content and functionality • Inadequate intellectual property (IP) protection, expiration, invalidity or loss of key patents, violations of 3rd party IP rights or inability or significant delay in monetizing IP Risk Factors
4 Q3 2021 Consolidated Financial Snapshot (includes Consensus) (1)(2) 1.Figures are adjusted non-GAAP; See slide 20 for a reconciliation of the pro-forma adjustments for excluded assets consisting of certain Voice assets in Australia and New Zealand that were sold in the third quarter of 2020, certain Voice assets in the United Kingdom that were sold in February 2021, and the certain assets of the Company’s B2B Backup business, which were sold in September 2021 2. See slides 15, 17-19 for a GAAP to non-GAAP reconciliation of adjusted gross profit, adjusted EBITDA and adjusted earnings per diluted share for the Company and by Business , and Slide 21 for a reconciliation of non-GAAP to pro-forma Note: Pro Forma excludes Voice UK, ANZ Voice, and B2B Backup
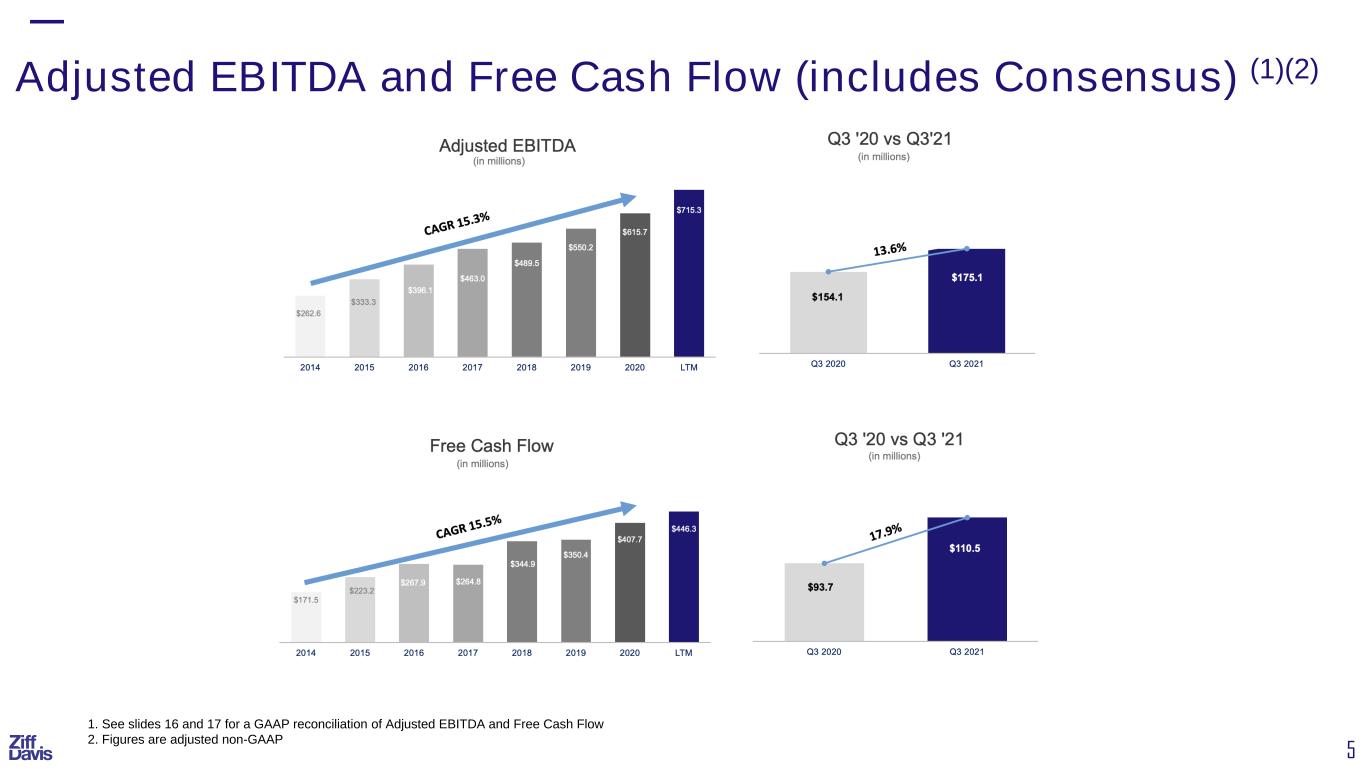
5 Adjusted EBITDA and Free Cash Flow (includes Consensus) (1)(2) 1. See slides 16 and 17 for a GAAP reconciliation of Adjusted EBITDA and Free Cash Flow 2. Figures are adjusted non-GAAP
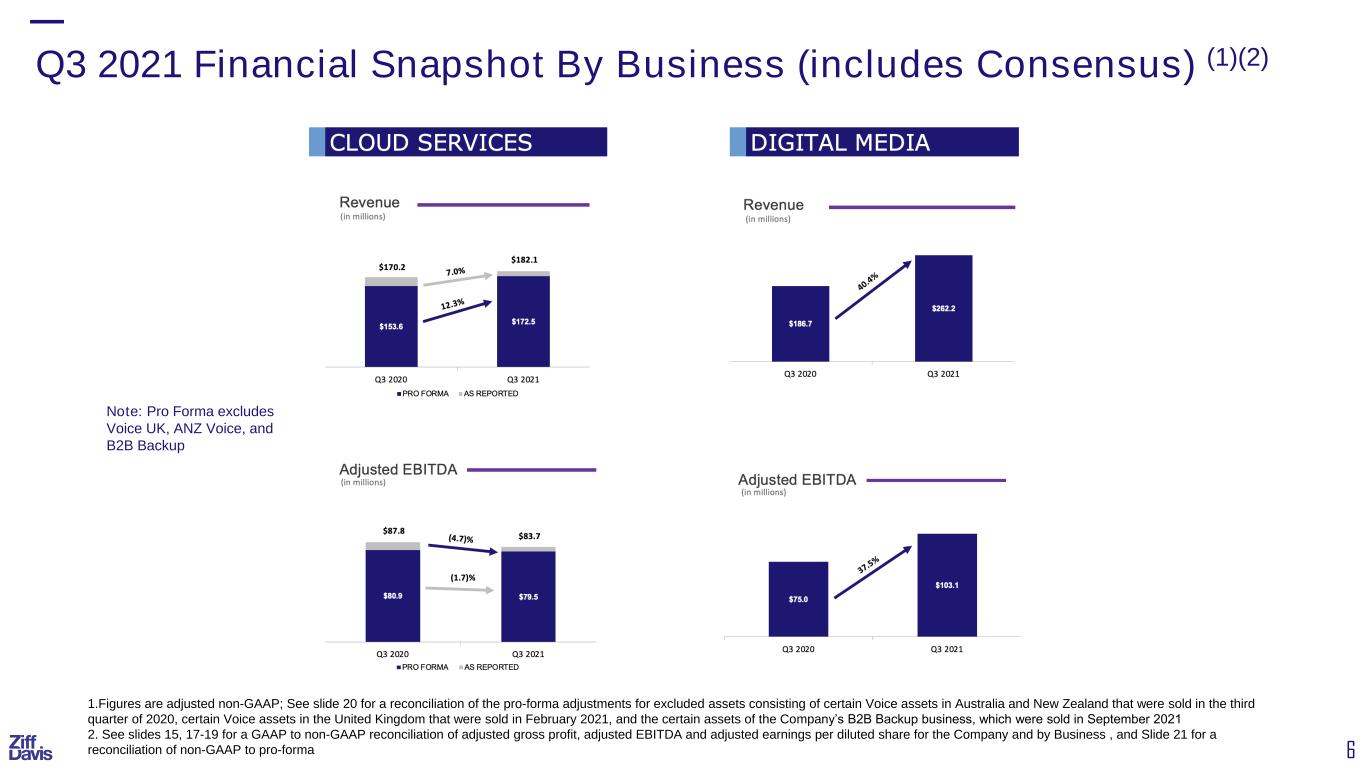
6 Q3 2021 Financial Snapshot By Business (includes Consensus) (1)(2) 1.Figures are adjusted non-GAAP; See slide 20 for a reconciliation of the pro-forma adjustments for excluded assets consisting of certain Voice assets in Australia and New Zealand that were sold in the third quarter of 2020, certain Voice assets in the United Kingdom that were sold in February 2021, and the certain assets of the Company’s B2B Backup business, which were sold in September 2021 2. See slides 15, 17-19 for a GAAP to non-GAAP reconciliation of adjusted gross profit, adjusted EBITDA and adjusted earnings per diluted share for the Company and by Business , and Slide 21 for a reconciliation of non-GAAP to pro-forma Note: Pro Forma excludes Voice UK, ANZ Voice, and B2B Backup
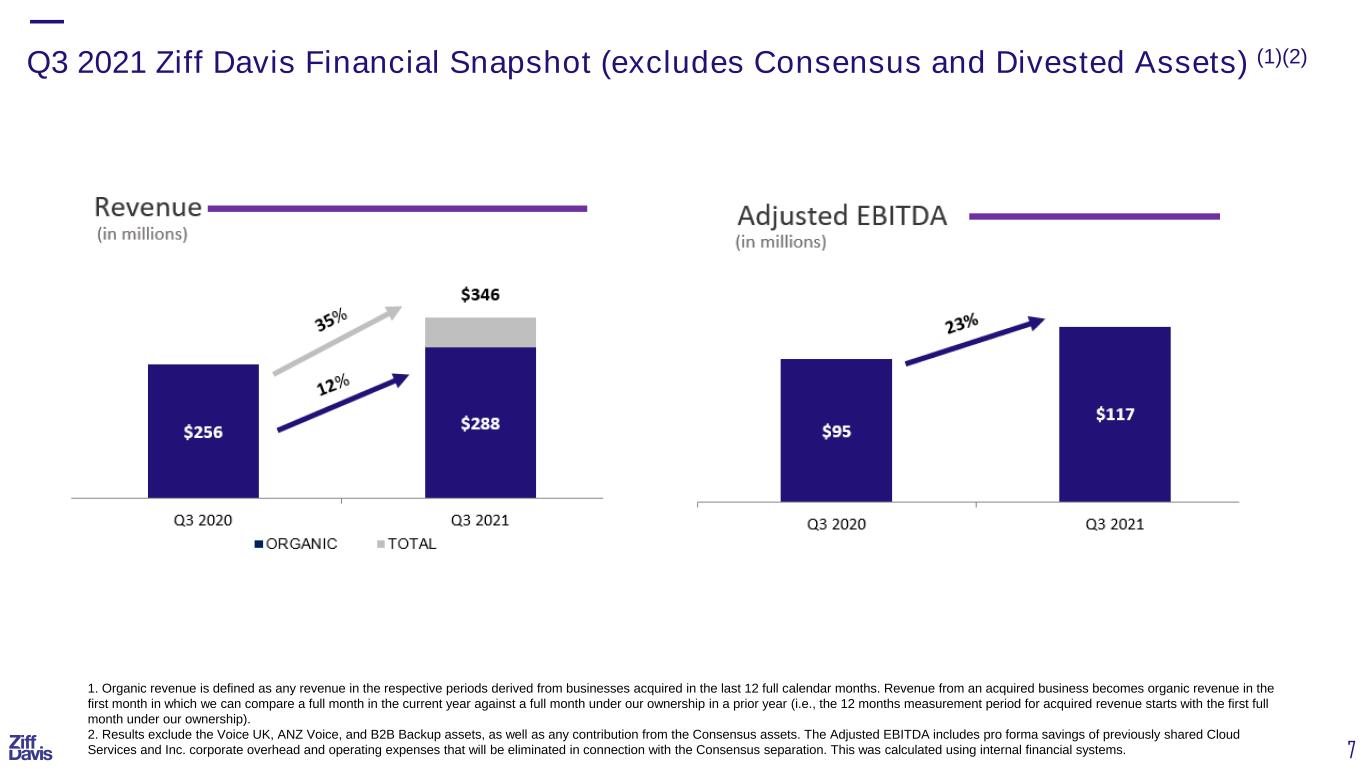
7 Q3 2021 Ziff Davis Financial Snapshot (excludes Consensus and Divested Assets) (1)(2) 1. Organic revenue is defined as any revenue in the respective periods derived from businesses acquired in the last 12 full calendar months. Revenue from an acquired business becomes organic revenue in the first month in which we can compare a full month in the current year against a full month under our ownership in a prior year (i.e., the 12 months measurement period for acquired revenue starts with the first full month under our ownership). 2. Results exclude the Voice UK, ANZ Voice, and B2B Backup assets, as well as any contribution from the Consensus assets. The Adjusted EBITDA includes pro forma savings of previously shared Cloud Services and Inc. corporate overhead and operating expenses that will be eliminated in connection with the Consensus separation. This was calculated using internal financial systems.
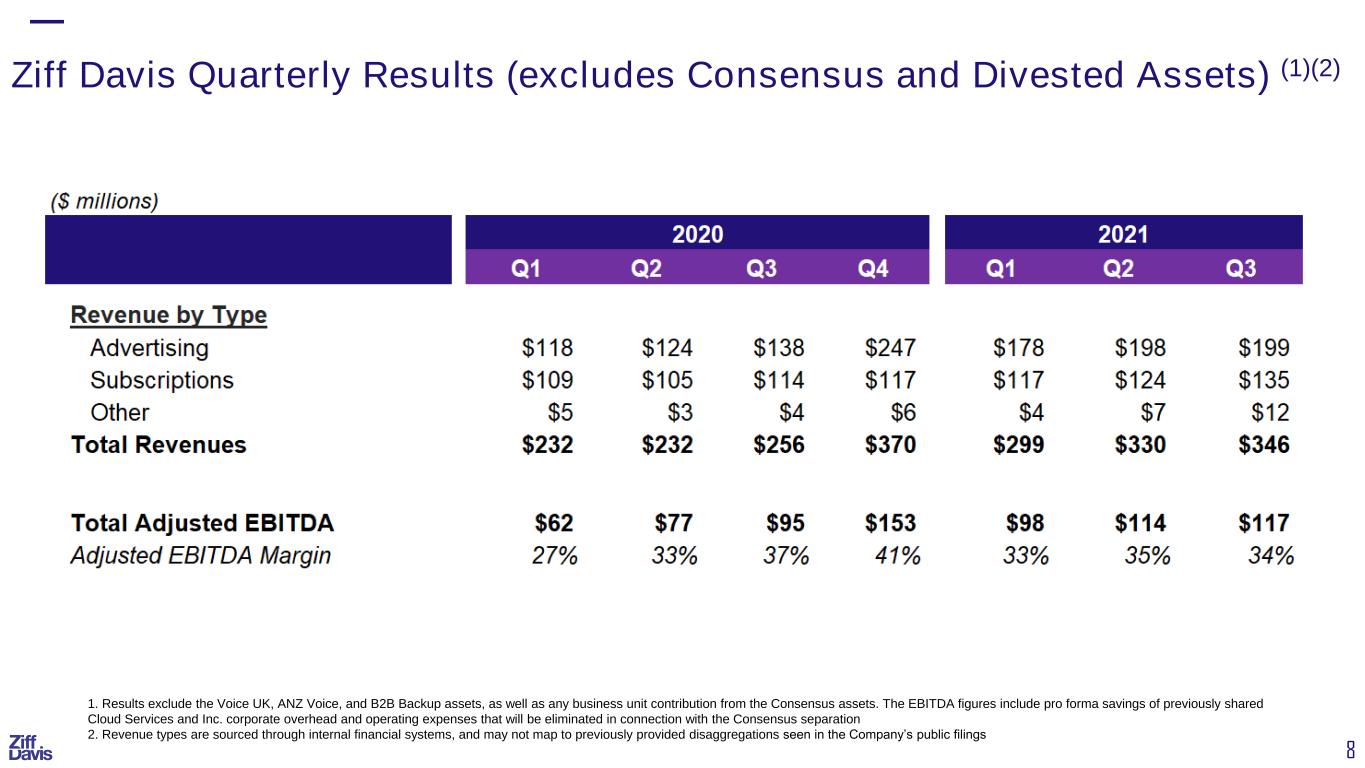
8 Ziff Davis Quarterly Results (excludes Consensus and Divested Assets) (1)(2) 1. Results exclude the Voice UK, ANZ Voice, and B2B Backup assets, as well as any business unit contribution from the Consensus assets. The EBITDA figures include pro forma savings of previously shared Cloud Services and Inc. corporate overhead and operating expenses that will be eliminated in connection with the Consensus separation 2. Revenue types are sourced through internal financial systems, and may not map to previously provided disaggregations seen in the Company’s public filings
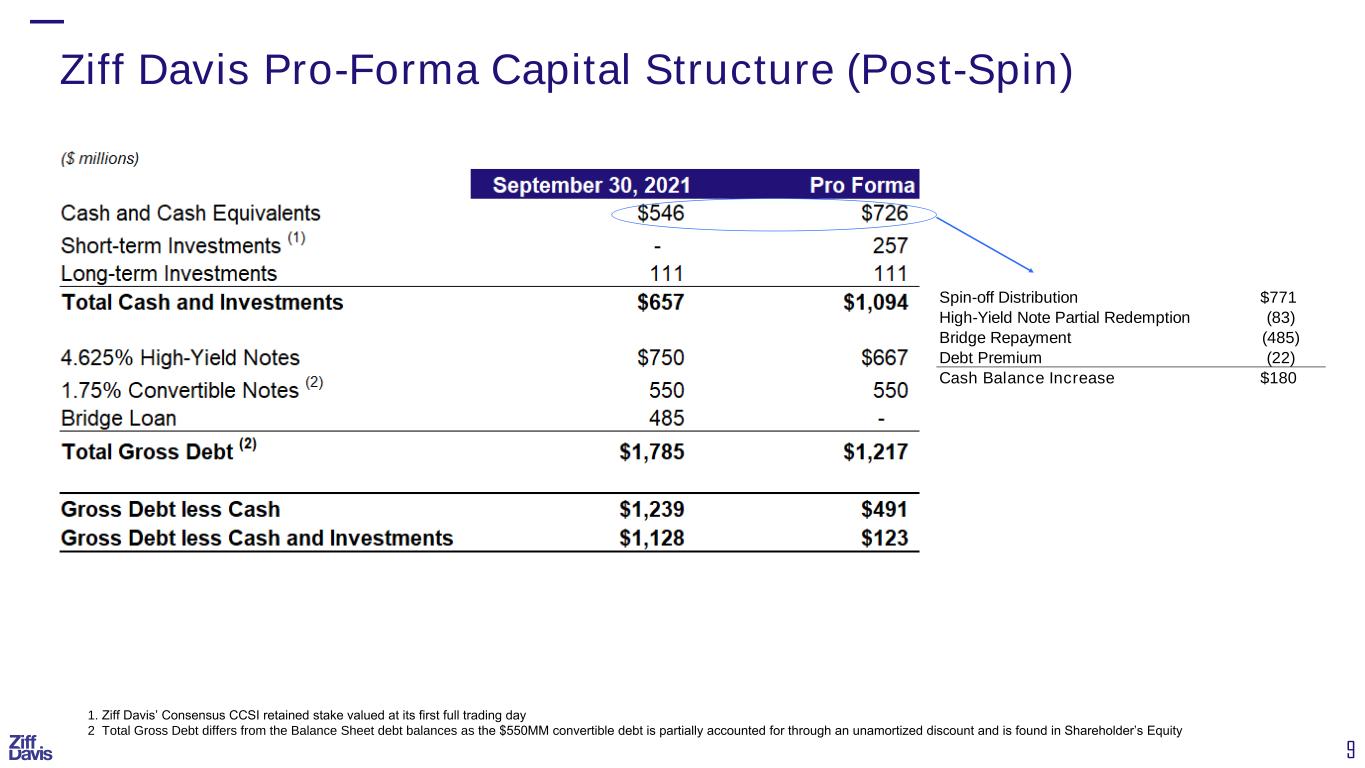
9 Ziff Davis Pro-Forma Capital Structure (Post-Spin) 1. Ziff Davis’ Consensus CCSI retained stake valued at its first full trading day 2 Total Gross Debt differs from the Balance Sheet debt balances as the $550MM convertible debt is partially accounted for through an unamortized discount and is found in Shareholder’s Equity Spin-off Distribution $771 High-Yield Note Partial Redemption (83) Bridge Repayment (485) Debt Premium (22) Cash Balance Increase $180

2021 FINANCIAL GUIDANCE
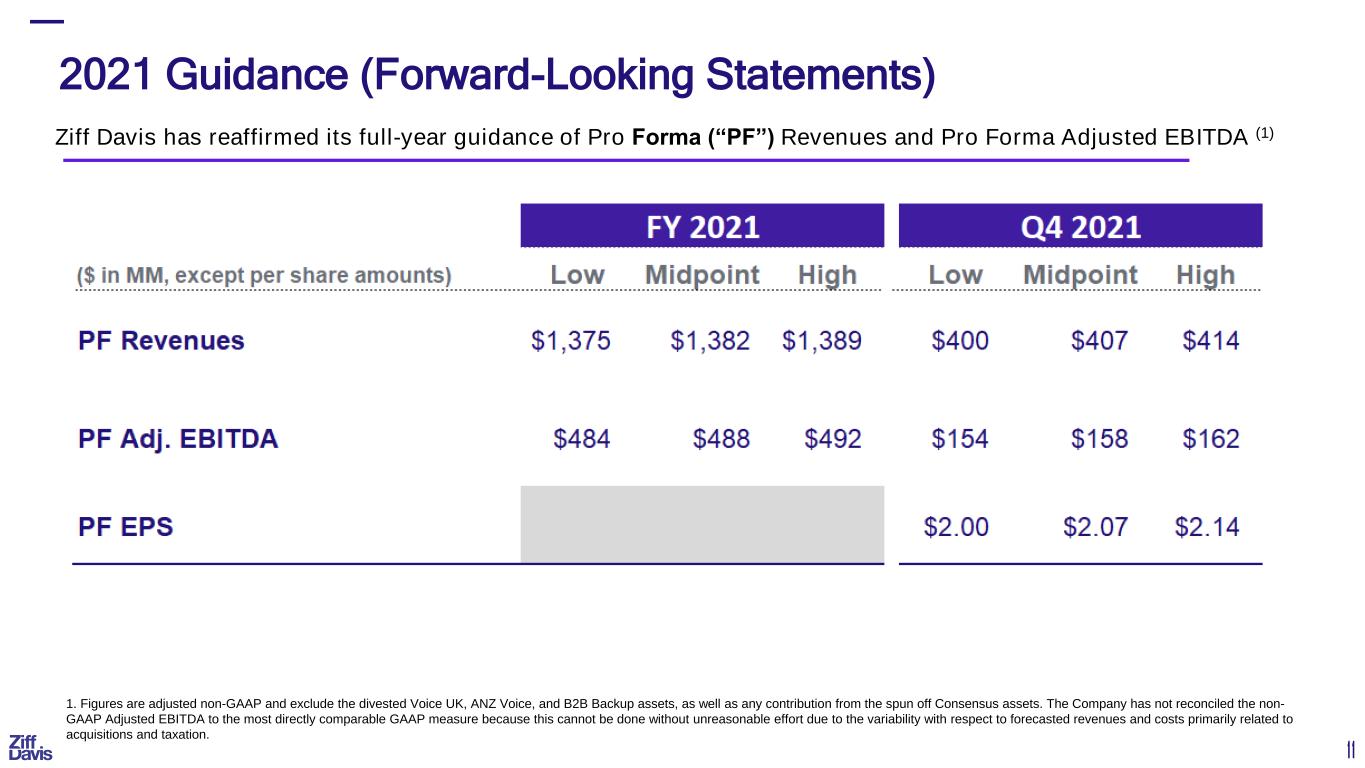
11 2021 Guidance (Forward-Looking Statements) Ziff Davis has reaffirmed its full-year guidance of Pro Forma (“PF”) Revenues and Pro Forma Adjusted EBITDA (1) 1. Figures are adjusted non-GAAP and exclude the divested Voice UK, ANZ Voice, and B2B Backup assets, as well as any contribution from the spun off Consensus assets. The Company has not reconciled the non- GAAP Adjusted EBITDA to the most directly comparable GAAP measure because this cannot be done without unreasonable effort due to the variability with respect to forecasted revenues and costs primarily related to acquisitions and taxation.

SUPPLEMENTAL INFORMATION
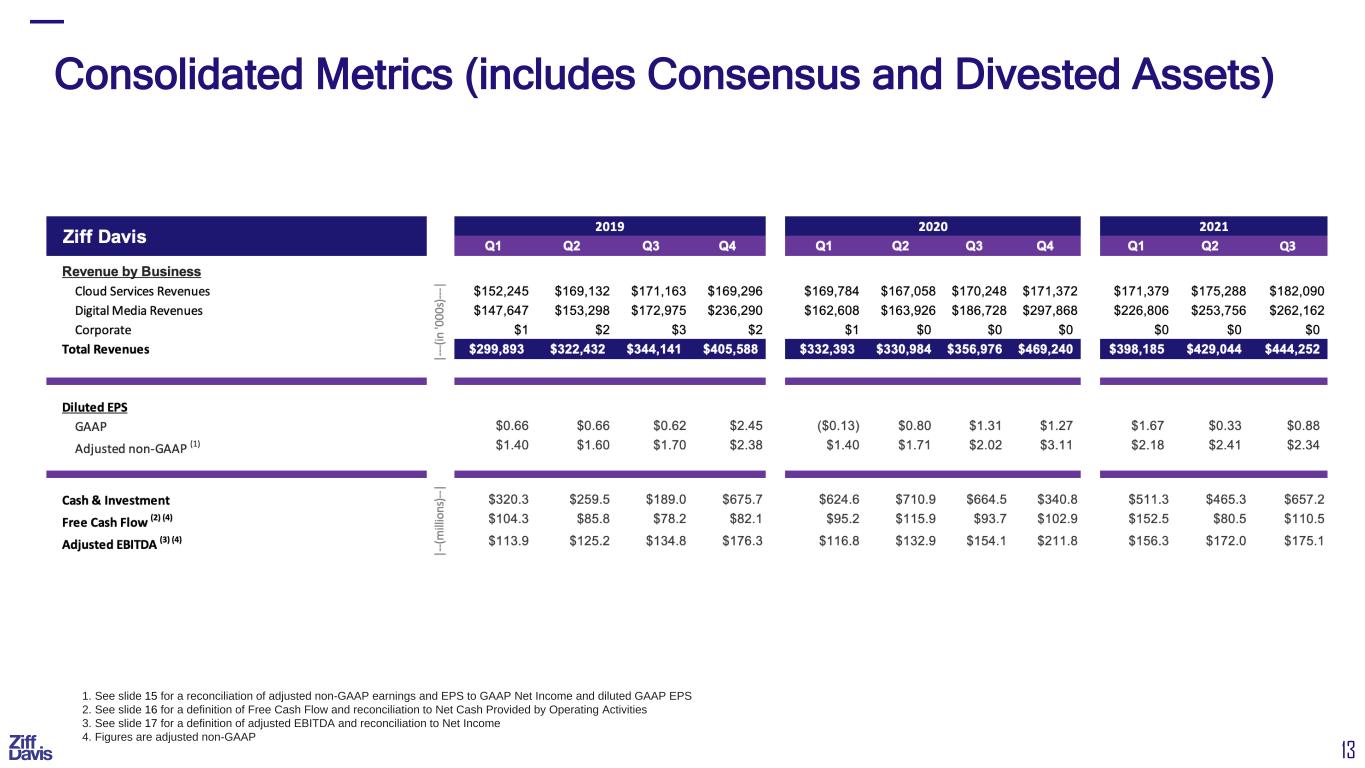
13 Consolidated Metrics (includes Consensus and Divested Assets) 1. See slide 15 for a reconciliation of adjusted non-GAAP earnings and EPS to GAAP Net Income and diluted GAAP EPS 2. See slide 16 for a definition of Free Cash Flow and reconciliation to Net Cash Provided by Operating Activities 3. See slide 17 for a definition of adjusted EBITDA and reconciliation to Net Income 4. Figures are adjusted non-GAAP
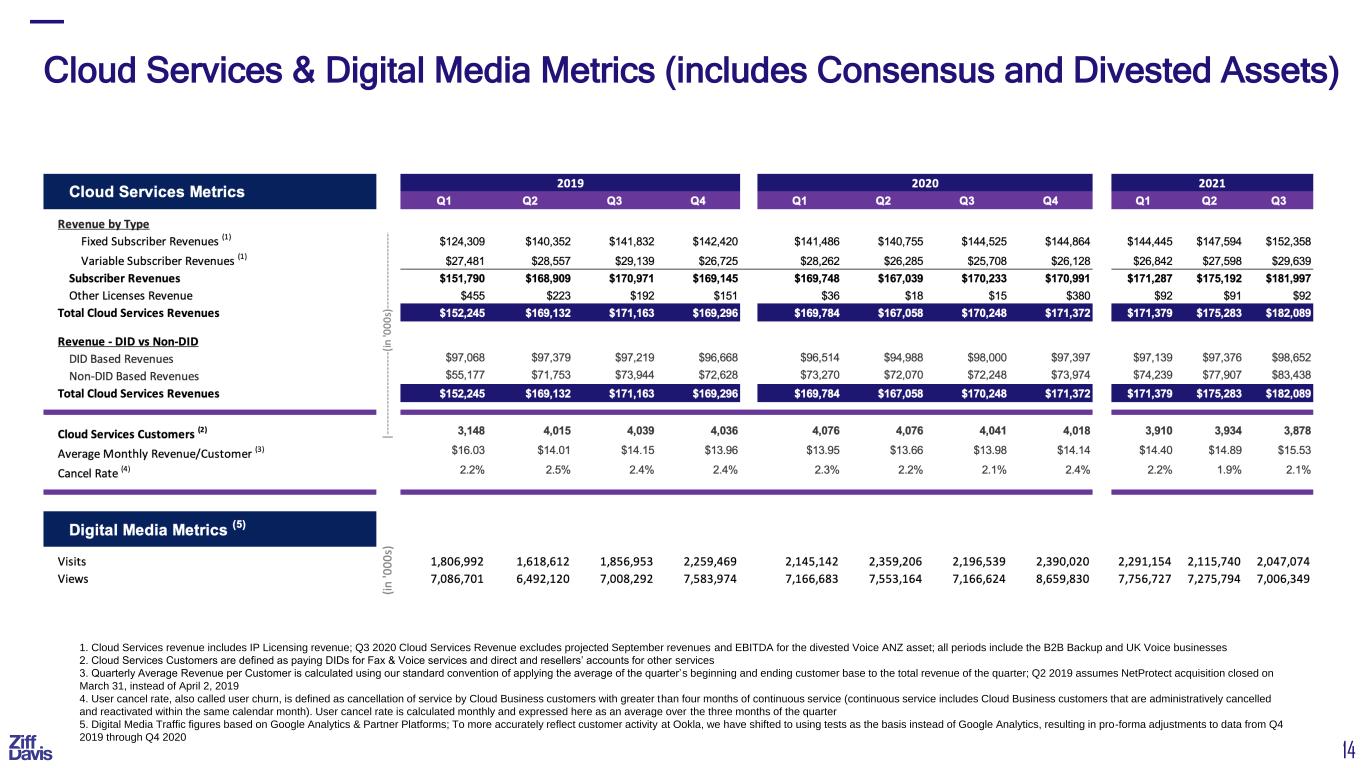
14 Cloud Services & Digital Media Metrics (includes Consensus and Divested Assets) 1. Cloud Services revenue includes IP Licensing revenue; Q3 2020 Cloud Services Revenue excludes projected September revenues and EBITDA for the divested Voice ANZ asset; all periods include the B2B Backup and UK Voice businesses 2. Cloud Services Customers are defined as paying DIDs for Fax & Voice services and direct and resellers’ accounts for other services 3. Quarterly Average Revenue per Customer is calculated using our standard convention of applying the average of the quarter’s beginning and ending customer base to the total revenue of the quarter; Q2 2019 assumes NetProtect acquisition closed on March 31, instead of April 2, 2019 4. User cancel rate, also called user churn, is defined as cancellation of service by Cloud Business customers with greater than four months of continuous service (continuous service includes Cloud Business customers that are administratively cancelled and reactivated within the same calendar month). User cancel rate is calculated monthly and expressed here as an average over the three months of the quarter 5. Digital Media Traffic figures based on Google Analytics & Partner Platforms; To more accurately reflect customer activity at Ookla, we have shifted to using tests as the basis instead of Google Analytics, resulting in pro-forma adjustments to data from Q4 2019 through Q4 2020
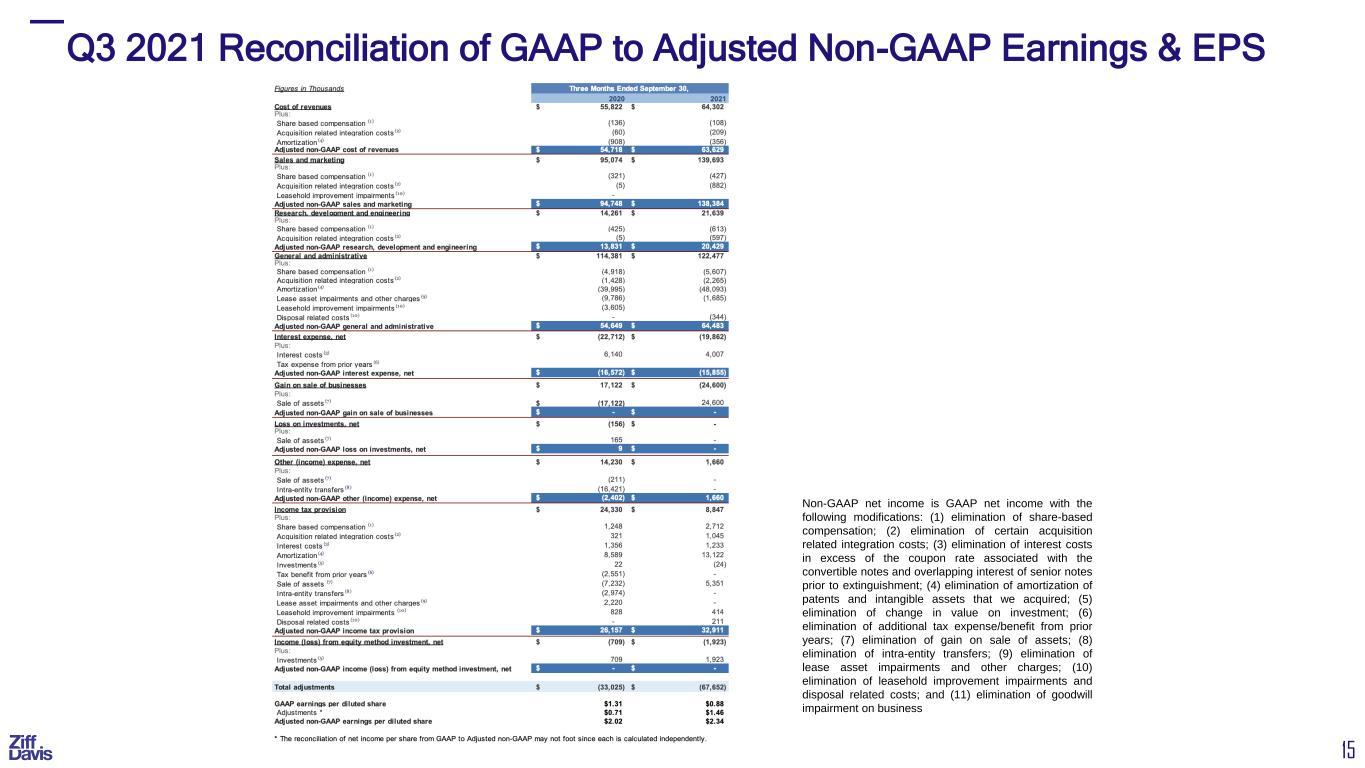
15 Q3 2021 Reconciliation of GAAP to Adjusted Non-GAAP Earnings & EPS Non-GAAP net income is GAAP net income with the following modifications: (1) elimination of share-based compensation; (2) elimination of certain acquisition related integration costs; (3) elimination of interest costs in excess of the coupon rate associated with the convertible notes and overlapping interest of senior notes prior to extinguishment; (4) elimination of amortization of patents and intangible assets that we acquired; (5) elimination of change in value on investment; (6) elimination of additional tax expense/benefit from prior years; (7) elimination of gain on sale of assets; (8) elimination of intra-entity transfers; (9) elimination of lease asset impairments and other charges; (10) elimination of leasehold improvement impairments and disposal related costs; and (11) elimination of goodwill impairment on business
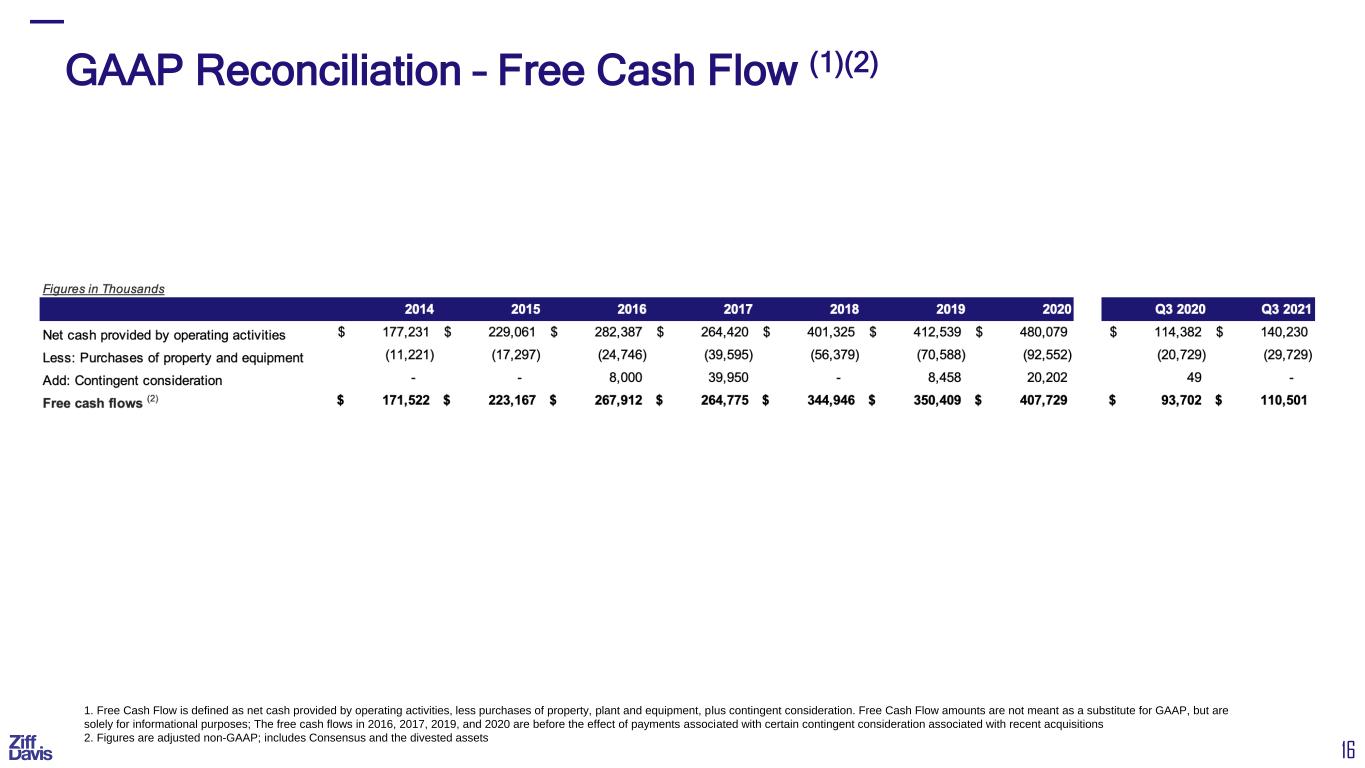
16 GAAP Reconciliation – Free Cash Flow (1)(2) 1. Free Cash Flow is defined as net cash provided by operating activities, less purchases of property, plant and equipment, plus contingent consideration. Free Cash Flow amounts are not meant as a substitute for GAAP, but are solely for informational purposes; The free cash flows in 2016, 2017, 2019, and 2020 are before the effect of payments associated with certain contingent consideration associated with recent acquisitions 2. Figures are adjusted non-GAAP; includes Consensus and the divested assets
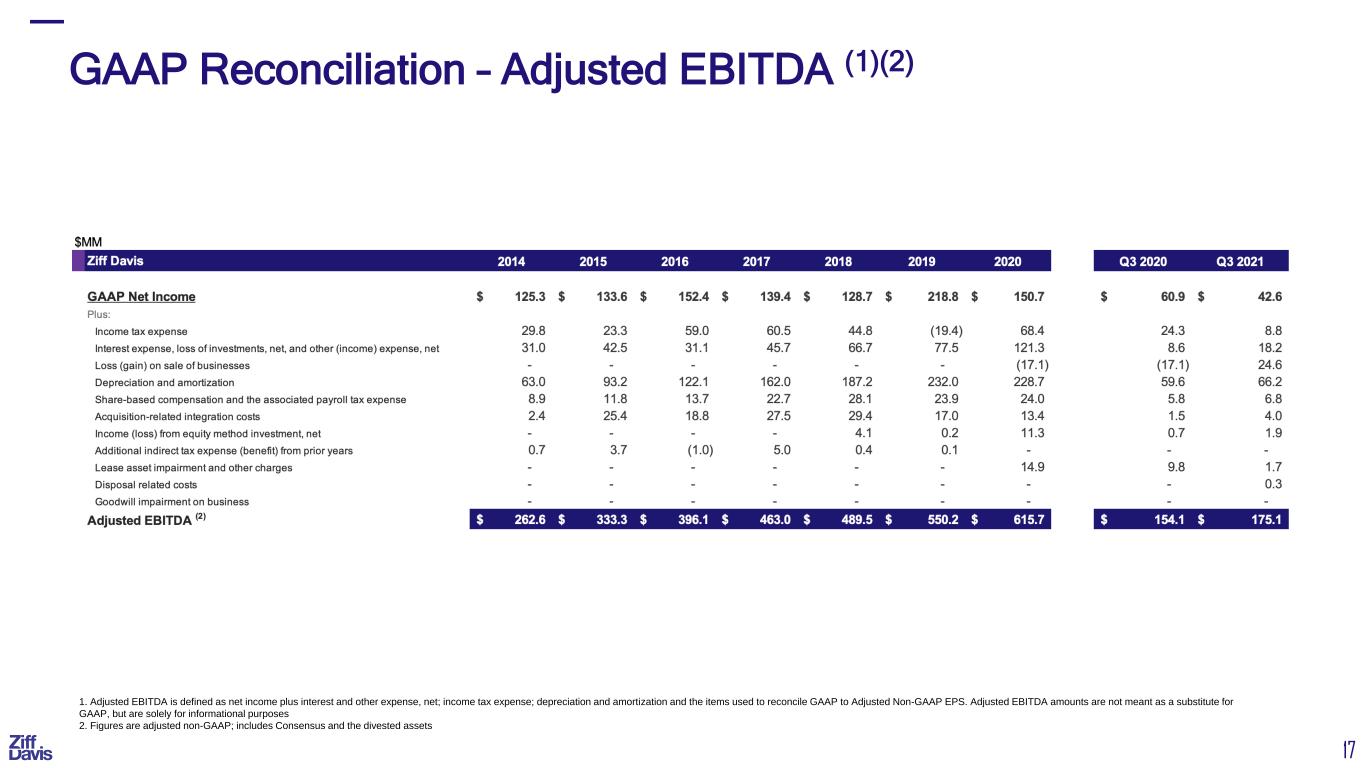
17 GAAP Reconciliation – Adjusted EBITDA (1)(2) 1. Adjusted EBITDA is defined as net income plus interest and other expense, net; income tax expense; depreciation and amortization and the items used to reconcile GAAP to Adjusted Non-GAAP EPS. Adjusted EBITDA amounts are not meant as a substitute for GAAP, but are solely for informational purposes 2. Figures are adjusted non-GAAP; includes Consensus and the divested assets
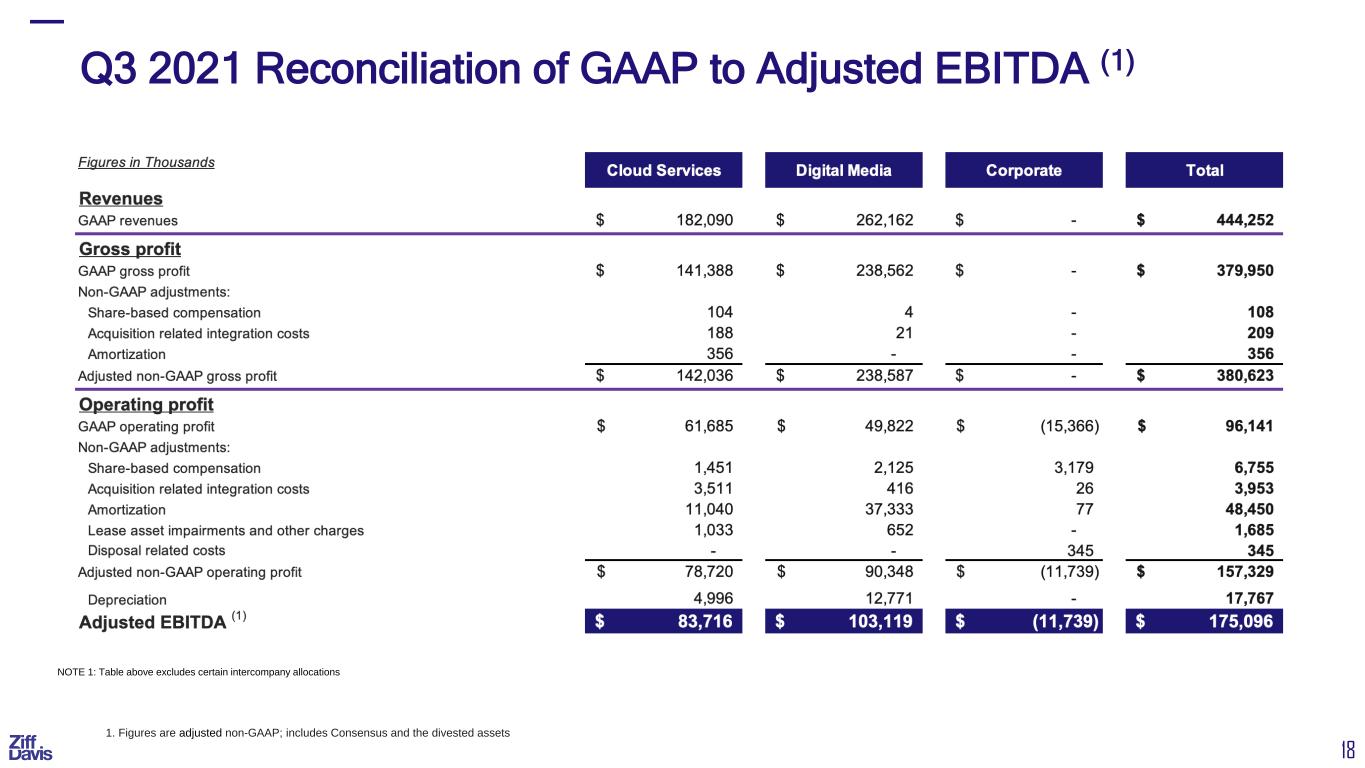
18 Q3 2021 Reconciliation of GAAP to Adjusted EBITDA (1) NOTE 1: Table above excludes certain intercompany allocations 1. Figures are adjusted non-GAAP; includes Consensus and the divested assets
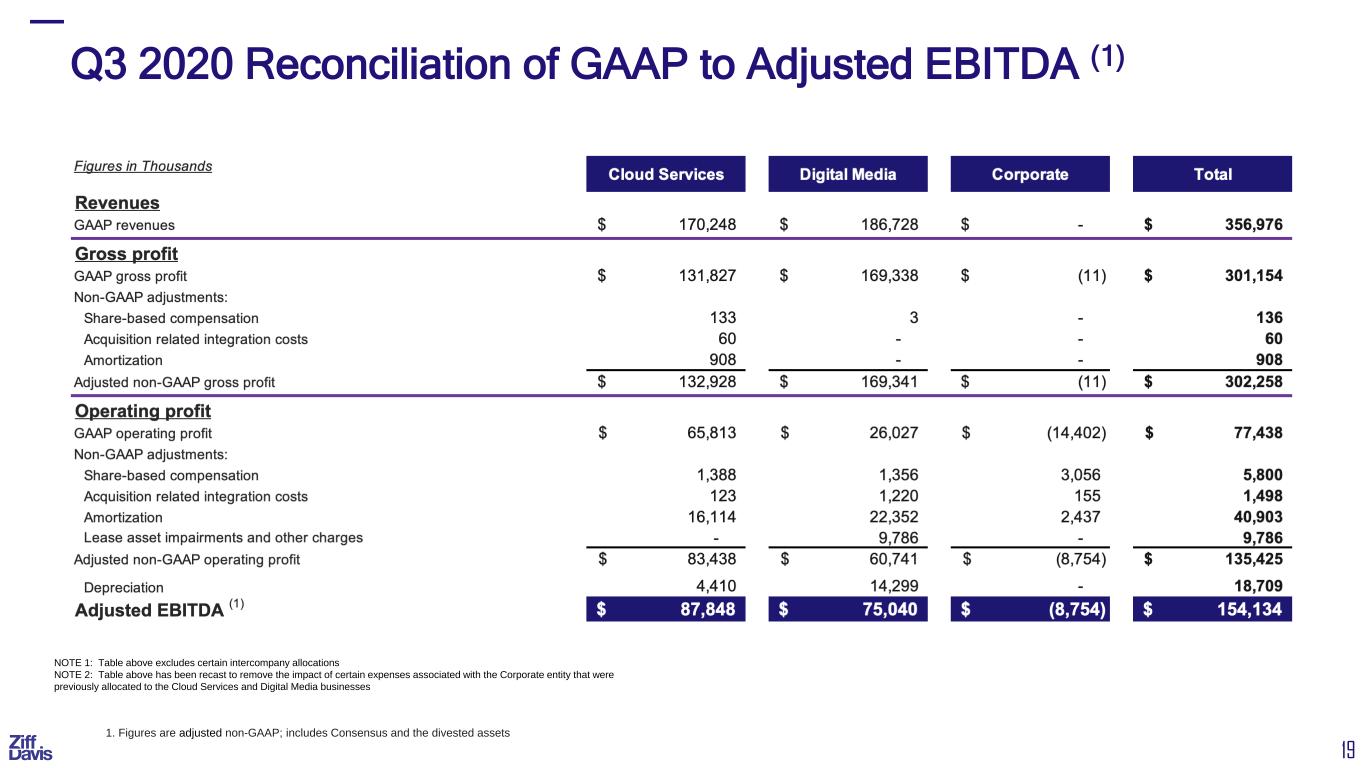
19 Q3 2020 Reconciliation of GAAP to Adjusted EBITDA (1) NOTE 1: Table above excludes certain intercompany allocations NOTE 2: Table above has been recast to remove the impact of certain expenses associated with the Corporate entity that were previously allocated to the Cloud Services and Digital Media businesses 1. Figures are adjusted non-GAAP; includes Consensus and the divested assets
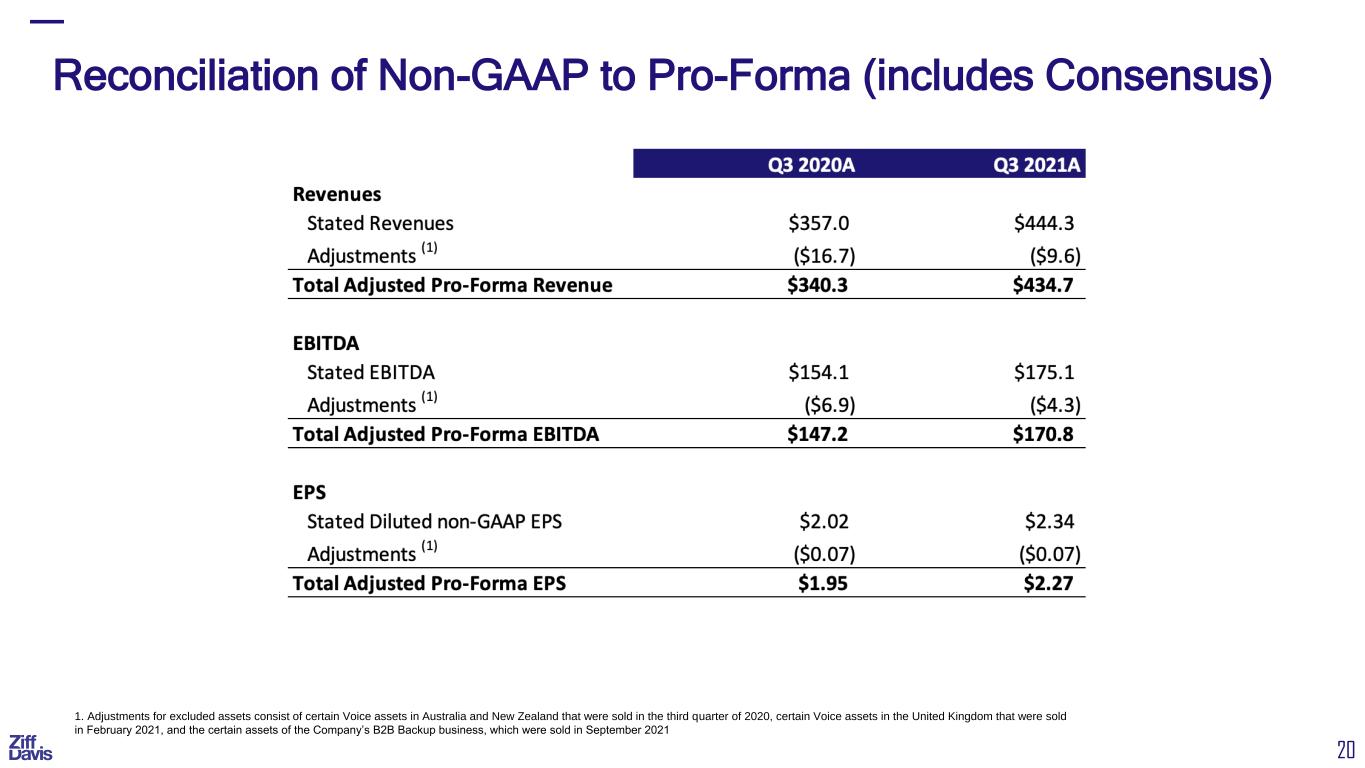
20 Reconciliation of Non-GAAP to Pro-Forma (includes Consensus) 1. Adjustments for excluded assets consist of certain Voice assets in Australia and New Zealand that were sold in the third quarter of 2020, certain Voice assets in the United Kingdom that were sold in February 2021, and the certain assets of the Company’s B2B Backup business, which were sold in September 2021