
FMX 6-K
Mexican Economic Development Inc (FMX)
SECURITIES AND EXCHANGE COMMISSION
WASHINGTON, DC 20549
FORM 6-K
REPORT OF FOREIGN PRIVATE ISSUER
PURSUANT TO RULE 13a-16 OR 15d-16 UNDER
THE SECURITIES EXCHANGE ACT OF 1934
For the month of July 2025
FOMENTO ECONÓMICO MEXICANO, S.A.B. DE C.V.
(Exact name of Registrant as specified in its charter)
Mexican Economic Development, Inc.
(Translation of Registrant’s name into English)
United Mexican States
(Jurisdiction of incorporation or organization)
General Anaya No. 601 Pte.
Colonia Bella Vista
Monterrey, Nuevo León 64410
México
(Address of principal executive offices)
Indicate by check mark whether the registrant files or will file annual reports
under cover of Form 20-F or Form 40-F:
Form 20-F x Form 40-F ¨
Indicate by check mark if the registrant is submitting the Form 6-K in paper as
permitted by Regulation S-T Rule 101(b)(1): ¨
Indicate by check mark if the registrant is submitting the Form 6-K in paper as
permitted by Regulation S-T Rule 101(b)(7): ¨
Indicate by check mark whether by furnishing the information contained in this
Form, the registrant is also thereby furnishing the information to the
Commission pursuant to Rule 12g3-2(b) under the Securities Exchange Act of 1934.
Yes ¨ No x
If "Yes" is marked, indicate below the file number assigned to the registrant in
connection with Rule 12g3-2(b): 82-_____________
SIGNATURES
Pursuant to the requirements of the Securities Exchange Act of 1934, the
registrant has duly caused this report to be signed on its behalf of the
undersigned, thereunto duly authorized.
| FOMENTO ECONÓMICO MEXICANO, S.A. DE C.V. | ||
| By: | /s/ Martin Felipe Arias Yaniz | |
| Martin Felipe Arias Yaniz | ||
| Director of Finance and Corporate Development | ||
| Date: July, 28, 2025 | ||
Exhibit 99.1

2Q 2025
Results
July 28, 2025
Investor Contact
(52) 818-328-6167
investor@femsa.com.mx
femsa.gcs-web.com
Media Contact
(52) 555-249-6843
comunicacion@femsa.com.mx
femsa.com
HIGHLIGHTS
Monterrey, Mexico, July 28, 2025 — Fomento Económico Mexicano, S.A.B. de C.V. (“FEMSA”) (NYSE: FMX; BMV: FEMSAUBD, FEMSAUB) announced today its operational and financial results for the second quarter of 2025.
| · | FEMSA: Total Consolidated Revenues grew 6.3% and Income from Operations increased 1.2% compared to 2Q24. |
| · | FEMSA Retail1: Proximity Americas total Revenues grew 6.9% and Income from operations decreased 2.8% versus 2Q24. |
(A) Please refer to page 13 for our definition of “comparable” and a description of the factors affecting the comparability of our financial and operating performance.
1 FEMSA Retail: Proximity Americas & Europe, Fuel and FEMSA Health.

| April 28, 2025 | Page 1 |
| · | SPIN: Spin by OXXO had 9.4 million active users2 representing 18.8% growth compared to 2Q24 while Spin Premia had 26.6 million active loyalty users2 representing 16.9% growth compared to 2Q24, and an average tender2 at OXXO Mexico of 45.8% which increased from 36.1% tender in 2Q24. |
| · | COCA-COLA FEMSA: Total Revenues and Income from Operations grew 5.0% and 0.2%, respectively against 2Q24. |
Financial Summary for the Second Quarter 2025
Change vs. comparable period
| Total Revenues | Gross Profit | Income from Operations | Same-Store Sales | |||||||||||||||||||||
| As Reported | 2Q25 | YTD25 | 2Q25 | YTD25 | 2Q25 | YTD25 | 2Q25 | YTD25 | ||||||||||||||||
| FEMSA Consolidated | 6.3 | % | 8.3 | % | 4.2 | % | 9.2 | % | 1.2 | % | 2.6 | % | ||||||||||||
| Proximity Americas | 6.9 | % | 6.9 | % | 6.9 | % | 8.3 | % | (2.8 | )% | (6.3 | )% | (0.4 | )% | (1.1 | ) | ||||||||
| Proximity Europe | 31.4 | % | 24.9 | % | 25.6 | % | 20.3 | % | 54.4 | % | 22.3 | % | N.A. | N.A. | ||||||||||
| Health | 15.6 | % | 18.3 | % | 13.6 | % | 18.3 | % | 5.7 | % | 15.2 | % | 13.1 | % | 14.3 | % | ||||||||
| Fuel | 0.6 | % | 1.2 | % | 6.6 | % | 5.6 | % | 13.6 | % | 1.8 | % | 4.9 | % | 5.2 | % | ||||||||
| Coca-Cola FEMSA | 5.0 | % | 6.7 | % | 3.4 | % | 6.9 | % | 0.2 | % | 3.3 | % | ||||||||||||
| Comparable(A) | ||||||||||||||||||||||||
| FEMSA Consolidated | 2.2 | % | 2.7 | % | 0.0 | % | 4.5 | % | (1.5 | )% | (3.9 | )% | ||||||||||||
| Proximity Americas | 2.0 | % | 1.7 | % | 4.3 | % | 5.7 | % | (3.1 | )% | (10.8 | )% | (0.6 | )% | N.A. | |||||||||
| Proximity Europe | 5.9 | % | 3.5 | % | 1.2 | % | (0.3 | )% | 24.0 | % | 0.6 | % | N.A. | N.A. | ||||||||||
| Health | 6.7 | % | 6.8 | % | 4.5 | % | 6.5 | % | (5.2 | )% | 2.2 | % | 4.8 | % | N.A. | |||||||||
| Fuel | 0.6 | % | 1.2 | % | 6.6 | % | 5.6 | % | 13.6 | % | 1.8 | % | 4.9 | % | N.A. | |||||||||
| Coca-Cola FEMSA | 2.4 | % | 3.3 | % | 0.9 | % | 3.5 | % | (2.6 | )% | 0.3 | % | ||||||||||||
José Antonio Fernandez Carbajal, FEMSA’s Chief Executive Officer, commented:
“During the second quarter, we delivered a mixed set of results. In our core operations in Mexico, we faced a challenging combination of a soft consumer environment and very adverse weather that put pressure on retail operations and beverage volumes. On the positive side, several of our proximity and beverage operations outside of Mexico delivered strong results, which combined with currency tailwinds, helped to mitigate the impact. The retail operations outside of Mexico provided encouraging signs that they are firing on all cylinders as they fine-tune their value propositions and increase their scale.
At Proximity Americas Mexico, weak traffic numbers stood out against an otherwise largely positive set of trends outside of Mexico, reflecting an environment in which convenience categories such as soft drinks, beer and tobacco underperformed other categories across channels. We are working hard together with our supplier partners to ensure we can adjust our assortment and price-package architecture to remain competitive in addressing our customers’ needs as we advance through the summer and approach the key selling season in the fourth quarter. For its part, Valora delivered a solid result, as did our Health operations outside of Mexico. Finally, Coca-Cola FEMSA navigated the same challenging environment in Mexico which it is aggressively addressing with highly targeted and segmented packaging strategies, promotional activity, and expense control. Outside of Mexico, KOF continued to improve its competitive position and delivered strong results, particularly led by certain markets in South America, further reinforced by currency tailwinds.
We remain confident of the initiatives being implemented across businesses, and we are focused on reversing the traffic and volume trends and on managing costs and expenses in the second half of the year. Our businesses have repeatedly proven their resilience, and we believe we have the right strategy and team for the task.”
QUARTERLY RESULTS
Results are compared to the same period of previous year
FEMSA CONSOLIDATED
2Q25 Financial Summary
Amounts expressed in millions of Mexican Pesos (Ps.)
| 2Q25 | 2Q24 | Var. | Comp.(A) | |||||||||||||
| Total Revenues | 211,364 | 198,744 | 6.3 | % | 2.2 | % | ||||||||||
| Gross Profit | 85,922 | 82,440 | 4.2 | % | 0.0 | % | ||||||||||
| Gross Profit Margin (%) | 40.7 | 41.5 | (80 bps | ) | ||||||||||||
| Income from Operations | 17,832 | 17,626 | 1.2 | % | (1.5 | )% | ||||||||||
| Operating Margin (%) | 8.4 | 8.9 | (50 bps | ) | ||||||||||||
| Adjusted EBITDA1 | 29,589 | 28,614 | 3.4 | % | (0.3 | )% | ||||||||||
| EBITDA Margin (%) | 14.0 | 14.4 | (40 bps | ) | ||||||||||||
| Consolidated Net Income | 5,593 | 15,669 | (64.3 | )% |
Net Debt2 ex-KOF3
Amounts expressed in millions of Mexican Pesos (Ps.)
| As of June 30, 2025 | Ps. | US$4 | ||||||
| Cash and Investments | 125,171 | 6,648 | ||||||
| Financial Debt | 74,040 | 3,932 | ||||||
| Lease Liabilities | 106,940 | 5,679 | ||||||
| Net debt | 55,809 | 2,964 | ||||||
| ND / Adjusted EBITDA | 0.93 | x | - | |||||
1 Active User for Spin by OXXO: Any user with a balance or that has transacted within the last 56 days.
Active User for Spin Premia: User that has transacted at least once with OXXO Premia within the last 90 days.
2 Tender: OXXO MXN sales with Spin Premia redemption or accrual / Total OXXO MXN Sales, during the period.
(A) Please refer to page 13 for our definition of “comparable” and a description of the factors affecting the comparability of our financial and operating performance.
| July 28, 2025 | Page 2 |
Total revenues increased 6.3% in 2Q25 compared to 2Q24, driven by growth across our business units outside of Mexico and reflecting the benefit from favorable exchange rate effects due to the depreciation of the Mexican peso against most of our foreign operating currencies. After accounting for currency effects and M&A, revenues grew 2.2%.
Gross profit increased 4.2%. Gross margin decreased 80 basis points, mainly reflecting margin contractions in Proximity Europe, Coca-Cola FEMSA and Health, as well as a greater mix of operations outside of Mexico in Proximity Americas including acquisitions, partially offset by a margin expansion in Fuel and Oxxo Mexico. After accounting for currency effects and M&A, gross profit remained flat.
Income from operations increased 1.2%, mainly explained by favorable exchange rate effects. The consolidated operating margin was 8.4% as a percentage of total sales, representing a contraction of 50 basis points, reflecting margin contractions in Proximity Americas, Health and Coca-Cola FEMSA, particularly in our higher margin businesses in Mexico. This was partially offset by margin expansion in our Proximity Europe and Fuel Divisions. After accounting for currency effects and M&A, income from operations decreased 1.5%.
The effective income tax rate was higher at 40.0% in 2Q25 vs. 2Q24. Our income tax provision was Ps. 4,339 million in 2Q25, impacted by currently non-deductible tax losses from Spin and non-deductible labor related expenses in Mexico, both of which weighed more heavily given the lower pre-tax profits caused by FX losses relating to our US dollar cash balances. As we have expanded our labor force in Mexico retail and beverages, and labor expenses have increased generally, the non-deductible portion of such expenses has grown relatively faster as a percentage of the total. These factors contributed to a higher tax rate during the period.
Net consolidated income was Ps. 5,593 million, compared to Ps. 15,669 million in 2Q24, reflecting: i) a non-cash foreign exchange loss of Ps. 4,102 million, compared to a gain of Ps. 6,131 million in 2Q24, related to our U.S. dollar-denominated cash position negatively impacted by the appreciation of the Mexican peso during the quarter and reflecting a Ps.10 billion shift; and a ii) lower interest income of Ps. 2,051 million compared to a Ps. 4,136 million in 2Q24, impacted by lower interest rates.
Net majority income was Ps. 0.78 per FEMSA Unit5 and US$0.42 per FEMSA ADS4.
Net Debt / EBITDA. As of June 30, 2025, cash and investments were Ps. 125,171 million and total debt was Ps. 180,980 million, resulting in net debt of Ps. 55,809 million. Our Net Debt / EBITDA ratio ex-KOF was 0.93x up from 0.64x in 2Q24.
Capital expenditures amounted to Ps. 9,203 million, 4.4% as a percentage of total sales, and a decrease of 13.8% compared to 2Q24, reflecting lower CAPEX at Proximity Americas, mainly reflecting lower investments given the pause in the expansion strategy in OXXO Chile and Peru, as well as in Health Mexico. This was partially offset by stable CAPEX at Coca-Cola FEMSA, mainly deployed to increase our production and distribution capacity. While Proximity Americas had lower CAPEX, our efforts remain in more targeted new store openings, including less capex-intensive OXXO Nicho Stores, and the remodeling and optimization of existing stores going forward.
|
PROXIMITY AMERICAS OXXO (Mexico, USA & Latam1) |
 |
2Q25 Financial Summary – Proximity Americas
Amounts expressed in millions of Mexican Pesos (Ps.)
| 2Q25 | 2Q24 | Var. | Comp.(A) | |||||||||||||
| Same-store sales (thousands of Ps.)2 | 1,023.5 | 1,028.0 | (0.4 | )% | (0.6 | )% | ||||||||||
| Total Revenues | 83,958 | 78,526 | 6.9 | % | 2.0 | % | ||||||||||
| Gross Profit | 37,014 | 34,627 | 6.9 | % | 4.3 | % | ||||||||||
| Gross Profit Margin (%) | 44.1 | 44.1 | 0 bps | |||||||||||||
| Income from Operations | 7,540 | 7,757 | (2.8 | )% | (3.1 | )% | ||||||||||
| Income from Operations Margin (%) | 9.0 | 9.9 | (90 bps | ) | ||||||||||||
| Adjusted EBITDA | 11,809 | 11,746 | 0.5 | % | (0.4 | )% | ||||||||||
| Adjusted EBITDA Margin (%) | 14.1 | 15.0 | (90 bps | ) |
1 Adjusted EBITDA: Operating Income + Depreciation + Amortizations + other non-cash charges.
Adjusted EBITDA ex-KOF: FEMSA Consolidated Adjusted EBITDA as described above – Coca-Cola FEMSA’s Consolidated Adjusted EBITDA + Dividends received by FEMSA from Coca-Cola FEMSA and other investments.
2 All Net Debt calculations are shown on an Ex-KOF basis. For a detailed reconciliation of this metric please see table on page 16 of this document.
3 ex-KOF: FEMSA Consolidated reported information – Coca-Cola FEMSA Consolidated reported information.
4 The exchange rate published by the Federal Reserve Bank of New York for June 30, 2025 was 18.8292 MXN per USD.
5 FEMSA Units consist of FEMSA BD Units and FEMSA B Units. Each FEMSA BD Unit is comprised of one Series B Share, two Series D-B Shares and two Series D-L Shares. Each FEMSA B Unit is comprised of five Series B Shares. The number of FEMSA Units outstanding as of June 30, 2025 was 3,469,469,527, equivalent to the total number of FEMSA Shares outstanding as of the same date, divided by 5.
(A) Please refer to page 13 for our definition of “comparable” and a description of the factors affecting the comparability of our financial and operating performance.
1 OXXO Latam: OXXO Colombia, Chile and Peru.
2 Same-store Sales including OXXO Mexico and Latam, this does not include our USA operations.
| July 28, 2025 | Page 3 |
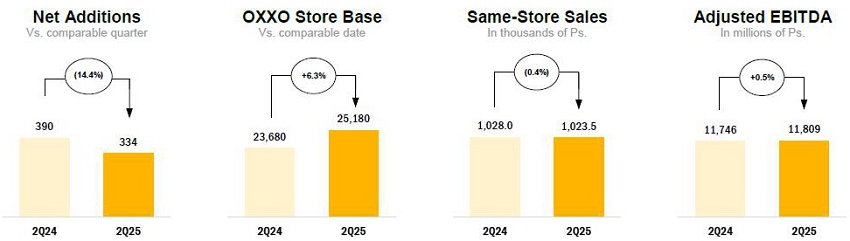
Total revenues increased 6.9% in 2Q25 compared to 2Q24 reflecting 0.4% decline in same-store sales, offset by a 6.3% store expansion and currency tailwinds relative to the US and South American currencies, as well as the consolidation of the US operation into the results. The decline in same-store sales was driven by an increase of 6.6% in average ticket, and a decrease of 6.6% in store traffic. On a comparable basis, total revenues increased 2.0%. These figures reflect a challenging quarter In Mexico, which was marked by adverse weather conditions and a persistently soft consumer environment, partially offset by a higher average ticket driven partly by higher ticket size related to the calendar shift of the Holy Week into this quarter. Furthermore, Proximity Americas, particularly in Mexico, again saw lackluster results from the Thirst and Gathering consumption occasions, two of the most important categories for OXXO, with decreases in the beer and soft drinks categories, as well as tobacco. During the quarter, the OXXO store base in Mexico, USA and Latam expanded by 334 stores. This division had 1,500 total net store additions for the last twelve months, which includes 249 stores from our acquisition of Delek’s retail operations in the USA. As of June 30, 2025, Proximity Americas had a total of 25,180 stores. Despite the challenging environment in Mexico, OXXO Latam showed very strong results with same-store sales growth in the high teens on a currency neutral basis.
Gross profit reached 44.1% of total revenues, reflecting a stable margin for the Proximity Americas Division. This performance was supported by continued growth in commercial income and financial services at OXXO Mexico, partially offset by the lower margin of the US operation, which carries a lower margin structure due in part to gasoline, and the Latam region, which remains in a development phase.
Income from operations declined by 2.8% compared to 2Q24 and represented 9.0% of total revenues, which is a 90-basis point contraction. The decline and margin contraction are mainly explained by an increase in selling expenses at a higher rate than revenues due to higher labor costs and administrative expenses related to our continued investment in commercial capabilities such as segmentation, revenue management, and data analytics. Notwithstanding, the growth in selling expenses, the most important expense line item, was lower than prior quarters, reflecting continued efforts to make more efficient use of labor through technology and variable shift policies.
|
PROXIMITY AMERICAS Other formats |
 |
Bara1
Total revenues increased by 28.0% in 2Q25 compared to 2Q24, reflecting an average same-store sales increase of 8.9%, with a strong performance in the grocery, dairy and frozen food categories, and the addition of 144 net new Bara stores during the last twelve months. Growth was negatively impacted by the convenience categories, which are being affected by tougher weather conditions and a slow consumer environment. Without the effect on convenience categories, the same-store sales growth would have been in the low double digits. During the quarter, the Bara store base expanded by 23 units reaching a total of 533 Bara stores as of June 30, 2025.
Grupo Nós2
Total revenues of OXXO Brazil in 2Q25 grew 33.8%3 year-over-year. This figure reflects the successful evolution and expansion of the OXXO value proposition in the country, which resulted in same-store sales growth of 12.8%3, as well as the addition of 78 net new OXXO stores for the last twelve months. During the quarter, the store base contracted by 12 units. As of June 30, 2025, Grupo Nós had a total of 603 OXXO stores.
1 Bara store count and results are not consolidated within the Proximity Americas reported figures.
2 OXXO’s non-consolidated joint-venture with Raízen in Brazil.
3 In local currency, BRL
| July 28, 2025 | Page 4 |
|
PROXIMITY EUROPE Valora |
2Q25 Financial Summary – Proximity Europe
Amounts expressed in millions of Mexican Pesos (Ps.)
| 2Q25 | 2Q24 | Var. | Comp.(A) | |||||||||||||
| Total Revenues | 15,065 | 11,466 | 31.4 | % | 5.9 | % | ||||||||||
| Gross Profit | 6,233 | 4,964 | 25.6 | % | 1.2 | % | ||||||||||
| Gross Profit Margin (%) | 41.4 | 43.3 | (190 bps | ) | ||||||||||||
| Income from Operations | 688 | 445 | 54.4 | % | 24.0 | % | ||||||||||
| Income from Operations Margin (%) | 4.6 | 3.9 | 70 bps | |||||||||||||
| Adjusted EBITDA | 2,179 | 1,666 | 30.8 | % | 5.2 | % | ||||||||||
| Adjusted EBITDA Margin (%) | 14.5 | 14.5 | 0 bps |
Total revenues increased 31.4% in 2Q25 compared to 2Q24, reflecting a relevant favorable effect from the appreciation of the Euro and the Swiss Franc against the Mexican peso. Excluding currency effects, total revenues grew 5.9%, reflecting increased retail sales, particularly in Switzerland, which were partially offset by lower sales in B2B and B2C foodservice, which faced continued consumer headwinds.
Gross profit reached 41.4% of total revenues, reflecting a 190 basis-point margin contraction explained by lower B2C foodservice sales, which have a structurally higher margin, and to a lesser extent, a product-mix effect that relates to higher tobacco sales, as well as the impact of changes to the operating model within our retail operations. Gross profit grew 25.6% compared to 2Q24, but grew 1.2% on a currency-neutral basis.
Income from operations increased 54.4% versus the 2Q24 and represented 4.6% of total revenues, a 70 basis-point increase year-on-year, reflecting growth in retail sales, coupled with effective cost management. On a comparable basis, income from operations increased 24.0%. Although operating expenses rose by 22.7% to Ps. 5,546 million, on a currency-neutral basis the expense growth slowed down to around 1%, reflecting the effect of cost management initiatives and operational efficiencies.
(A) Please refer to page 13 for our definition of “comparable” and a description of the factors affecting the comparability of our financial and operating performance.
| July 28, 2025 | Page 5 |
| HEALTH |  |
2Q25 Financial Summary - Health
Amounts expressed in millions of Mexican Pesos (Ps.) except same-store sales
| 2Q25 | 2Q24 | Var. | Comp.(A) | |||||||||||||
| Same-store sales (thousands of Ps.) | 1,029.0 | 909.6 | 13.1 | % | 4.8 | % | ||||||||||
| Total Revenues | 21,850 | 18,894 | 15.6 | % | 6.7 | % | ||||||||||
| Gross Profit | 6,496 | 5,719 | 13.6 | % | 4.5 | % | ||||||||||
| Gross Profit Margin (%) | 29.7 | 30.3 | (60 bps | ) | ||||||||||||
| Income from Operations | 819 | 775 | 5.7 | % | (5.2 | )% | ||||||||||
| Income from Operations Margin (%) | 3.8 | 4.1 | (30 bps | ) | ||||||||||||
| Adjusted EBITDA | 1,981 | 1,696 | 16.9 | % | 3.7 | % | ||||||||||
| Adjusted EBITDA Margin (%) | 9.1 | 9.0 | 10 bps |
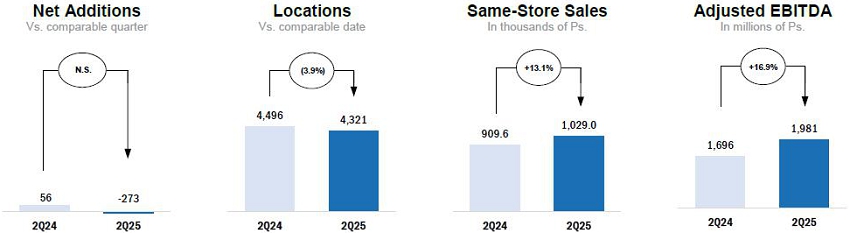
Total revenues increased 15.6% in 2Q25 compared to 2Q24, helped by the appreciation of currencies against the Mexican peso, but they grew 6.7% on a currency-neutral basis, reflecting a positive performance in Colombia and, Ecuador, more than offsetting the negative results in Mexico. During the quarter, the net store base decreased by 273 units, including the closing of 311 net locations in Mexico, reaching a total of 4,321 locations across our territories, as of June 30, 2025. During the last twelve months, there were 175 net closing. Same-store sales increased by an average of 13.1% in Mexican pesos and 4.8% on a currency-neutral basis despite the negative performance of the stores in Mexico, reflecting the strong results of Ecuador and Colombia in particular.
(A) Please refer to page 13 for our definition of “comparable” and a description of the factors affecting the comparability of our financial and operating performance.
| July 28, 2025 | Page 6 |
Gross profit was 29.7% of total revenues, representing a 60-basis point contraction year on year, mainly reflecting the challenging environment in Mexico, including the closure of stores, resulting in lower sales, coupled with the result of a more disciplined procurement process. This was partially offset by higher retail sales in Colombia.
Income from operations amounted to 3.8% of total revenues, a contraction of 30 basis points, resulting in an increase of 5.7%, reflecting tailwinds from a relatively weaker Mexican peso against other operating currencies. On a comparable basis, however, income from operations declined 5.2%, mainly explained by gross margin contraction and higher operating expenses which rose 14.8% to Ps. 5,677 million, or 6.1% on a comparable basis. This increase was related to the ongoing restructuring in Mexico, as well as expenses associated with the reduction of the division’s overhead. These effects were partially offset by positive performance in Colombia and Ecuador.
| FUEL |  |
2Q25 Financial Summary – Fuel
Amounts expressed in millions of Mexican Pesos (Ps.) except same-station sales
| 2Q25 | 2Q24 | Var. | ||||||||||
| Same-station sales (thousands of Ps.) | 9,209.5 | 8,778.5 | 4.9 | % | ||||||||
| Total Revenues | 17,100 | 16,996 | 0.6 | % | ||||||||
| Gross Profit | 2,147 | 2,014 | 6.6 | % | ||||||||
| Gross Profit Margin (%) | 12.6 | 11.9 | 70 bps | |||||||||
| Income from Operations | 800 | 704 | 13.6 | % | ||||||||
| Income from Operations Margin (%) | 4.7 | 4.1 | 60 bps | |||||||||
| Adjusted EBITDA | 1,141 | 1,027 | 11.1 | % | ||||||||
| Adjusted EBITDA Margin (%) | 6.7 | 6.0 | 70 bps |
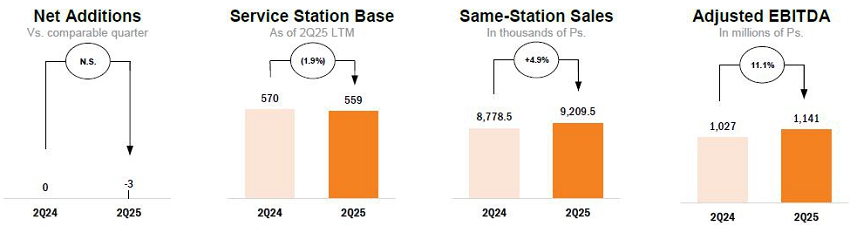
Total revenues increased 0.6% in 2Q25 compared to 2Q24, reflecting a 4.9% average same-station sales increase, driven by 4.2% growth in average volume and 0.6% increase in the average price per liter, offset by a decline in volume in our wholesale business. The OXXO Gas retail network had 559 points of sale as of June 30, 2025.
Gross profit was 12.6% of total revenues, representing a 70-basis point year-on-year expansion, reflecting a slight contraction in cost of sales and the decline in our lower margin wholesale business.
Income from operations represented 4.7% of total revenues and a 13.6% increase, due to higher efficiencies and cost controls. Operating expenses increased 2.8% to Ps. 1,348 million, mainly reflecting lower expenses resulting from ongoing efforts to drive efficiencies and operate with a leaner organization to face the voluntary industry-wide price commitments.
| July 28, 2025 | Page 7 |
FEMSA Retail Operations Summary
Total Revenue Growth (% vs year ago)
| 2Q25 | ||||
| Proximity Americas | ||||
| OXXO1 | 2.0 | % | ||
| Mexico | 1.4 | % | ||
| OXXO Latam2 | 36.8 | % | ||
| Other Proximity Americas formats | ||||
| Bara | 28.0 | % | ||
| OXXO Brazil3 | 33.8 | % | ||
| Proximity Europe4 | 5.9 | % | ||
| OXXO Gas | 0.6 | % | ||
| FEMSA Health5 | 6.7 | % | ||
| Chile6 | 6.3 | % | ||
| Colombia7 | 15.3 | % | ||
| Ecuador8 | 10.1 | % | ||
| Mexico | (16.8 | )% |
| 1 | OXXO
Consolidated figures shown in a local currency weighted average. Excludes OXXO US operations |
| 2 | Includes OXXO Colombia, Chile and Peru, figure shown in MXN |
| 3 | Local
currency (BRL). Operated through Grupo Nós, our joint-venture with Raízen. |
| 4 | Local currency (CHF). |
| 5 | Local currency weighted average. |
| 6 | Local currency (CLP). |
| 7 | Local currency (COP). |
| 8 | Local currency (USD). |
Total Unit Growth (% vs year ago)
| 2Q25 | ||||
| Proximity Americas | ||||
| OXXO1 | 6.3 | % | ||
| Mexico | 5.4 | % | ||
| OXXO Latam2 | 3.2 | % | ||
| Other Proximity Americas formats | ||||
| Bara | 37.0 | % | ||
| OXXO Brazil3 | 14.9 | % | ||
| Proximity Europe4 | (0.3 | )% | ||
| OXXO Gas | (1.9 | ) | ||
| FEMSA Health | (3.9 | )% | ||
| Chile | 5.6 | % | ||
| Colombia | 15.7 | % | ||
| Ecuador | 7.4 | % | ||
| Mexico | (24.8 | )% |
| 1 | Includes Mexico, Latam and US operations. |
| 2 | Includes OXXO Colombia, Chile and Perú. |
| 3 | Operated through Grupo Nós, our joint-venture with Raízen. |
| 4 | Includes company owned and franchised units. |
Same-Store Sales
| 2Q25 | ||||
| Proximity Americas | ||||
| OXXO1 | (0.6 | )% | ||
| Mexico | (1.2 | )% | ||
| OXXO Latam2 | 19.3 | % | ||
| Other Proximity Americas formats | ||||
| Bara | 8.9 | % | ||
| OXXO Brazil3 | 12.8 | % | ||
| Proximity Europe4 | N.A. | |||
| OXXO Gas | 4.9 | % | ||
| FEMSA Health5 | 4.8 | % | ||
| Chile6 | 4.6 | % | ||
| Colombia7 | 24.4 | % | ||
| Ecuador8 | 4.2 | % | ||
| Mexico | (8.7 | )% |
| 1 | OXXO Consolidated figures shown in a local currency weighted average. Excludes OXXO US operations |
| 2 | Includes OXXO Colombia, Chile and Peru. |
| 3 | Local currency (BRL). Operated through Grupo Nós, our joint-venture with Raízen. |
| 4 | Local currency (CHF). |
| 5 | Local currency weighted average. Only includes retail sales. FEMSA Health Include franchised stores in Ecuador. |
| 6 | Local currency (CLP). Only Includes retail sales. |
| 7 | Local currency (COP). Includes retail sales. |
| 8 | Local currency (USD). Includes retail sales. |
| April 28, 2025 | Page 8 |
| SPIN1 |  |
Spin by OXXO
Spin by OXXO acquired 0.7 million users during the quarter to reach 14.5 million total acquired users in 2Q25, compared to 11.8 million users in 2Q24. This represents an increase of 22.9% YoY and a 1.7% compound monthly growth rate. Active users2 represented 64.7% of the total acquired user base representing 18.8% growth YoY and reaching 9.4 million. Total transactions per month increased 28.9%3 during the quarter to reach an average of 73.7 million per month in 2Q25, reflecting an increase in user engagement.
Spin Premia
Spin Premia acquired 2.6 million users during the quarter to reach 58.3 million total acquired users in 2Q25, compared to 47.2 million users in 2Q24. This represents an increase of 23.5% YoY and a 1.8% compound monthly growth rate. Active users4 represented 45.7% of the total acquired user base representing 16.9% growth YoY and reaching 26.6 million. The average tender during the quarter was 45.8%.
| COCA-COLA FEMSA |  |
Coca-Cola FEMSA’s financial results and discussion thereof are incorporated by reference from Coca-Cola FEMSA’s press release, which is attached to this press release or may be accessed by visiting coca-colafemsa.com.
1 Digital@FEMSA’s results are included within the Other business segment
2 Active User for Spin by OXXO: Any user with a balance or that has transacted within the last 56 days.
3 Represents the growth of average monthly transactions in 2Q25 compared to average monthly transactions in 2Q24.
4 Active User for Spin Premia: User that has transacted at least once with OXXO Premia within the last 90 days.
| April 28, 2025 | Page 9 |
RESULTS FOR THE FIRST SIX MONTHS OF 2025
Results are compared to the same period of previous year
| FEMSA CONSOLIDATED |
Financial Summary for the First Six Months
Amounts expressed in millions of Mexican Pesos (Ps.)
| 2025 | 2024 | Var. | Comp. (A) | |||||||||||||
| Total Revenues | 406,812 | 375,507 | 8.3 | % | 2.7 | % | ||||||||||
| Gross Profit | 164,686 | 150,779 | 9.2 | % | 4.5 | % | ||||||||||
| Gross Profit Margin (%) | 40.5 | % | 40.2 | % | 30 bps | |||||||||||
| Income from Operations | 31,368 | 30,582 | 2.6 | % | (3.9 | )% | ||||||||||
| Operating Margin (%) | 7.7 | 8.1 | (40 bps | ) | ||||||||||||
| Adjusted EBITDA1 | 54,832 | 51,919 | 5.6 | % | 1.5 | % | ||||||||||
| Adjusted EBITDA Margin (%) | 13.5 | 13.8 | (30 bps) | |||||||||||||
| Consolidated Net Income | 14,533 | 21,450 | N.S. | |||||||||||||
Total revenues increased 8.3%, reflecting growth across all our business units, currency tailwinds, and the consolidation of the results of our US operations.
Gross profit rose by 9.2%. Gross margin increased by 30 basis points to 40.5% of total revenues, reflecting a gross margin expansion at the Proximity Americas and Fuel Divisions. This was partially offset by a margin contraction at the Proximity Europe Division and stable margins at Coca-Cola FEMSA and the Health Division.
Income from operations increased 2.6%. Our consolidated operating margin decreased 40 basis points to 7.7% of total revenues, reflecting margin contractions at Coca-Cola FEMSA and Proximity Americas Division, while the Health, Fuel and Proximity Europe Divisions had stable margins.
Our effective income tax rate was 41.1% for the first six months of 2025, compared to 31.9% in 2024. Our income tax provision was Ps. 9,100 million for the first six months of 2025, reflecting: i) non-deductible tax losses from Spin and non-deductible labor related expenses in Mexico, both of which weighed more heavily given the lower pre-tax profits caused by FX losses relating to our US dollar cash balances; and ii) a one-time non-recurrent payment related to a contingency from 2018. As we have expanded our labor force in Mexico retail and beverages and labor expenses have increased generally, the non-deductible portion of such expenses have grown relatively faster as a percentage of the total. These factors contributed to a higher tax rate during the period.
Net consolidated income was Ps. 14,533 million reflecting a decline of 32.2% compared to 2024 explained by; i) a higher base from the first six months of 2024, which reflected: i) a non-cash foreign exchange gain of Ps. 5,008 million compared to a loss in 2025 of Ps. 3,660 million, related to FEMSA’s U.S. dollar-denominated cash position negatively impacted by the appreciation of the Mexican peso, ii) a higher net interest expense of Ps. 6,281 million, compared to Ps. 3,434 million in 2024 due to lower interest income, and iii) an increase in income taxes as explained above. This result was despite a higher other financial income of Ps. 1,817 million compared to a 337 million expense in the first six months of 2024, reflecting a financial instrument gain of Ps. 1,107 million related to our remaining position in Heineken and a gain in net income from discontinued operations of Ps. 2,333 million from the divestment of our plastics solutions operations.
Net majority income per FEMSA Unit2 was Ps. 2.45 (US$1.30 per ADS).
Capital expenditures amounted to Ps. 17,987 million, a decrease of 1.4% compared to 2024, reflecting lower CAPEX at Proximity Americas, mainly due to reduced investments following the pause in our expansion strategy in Chile and Peru. To a lesser extent, CAPEX was also lower in the Health and Fuel divisions, reflecting the current operating environment in those businesses. These effects were partially offset by higher investments at Coca-Cola FEMSA to expand production and distribution capacity, as well as sustained store expansion in Proximity Americas, particularly in Mexico and Colombia, along with continued investments in core capabilities across our business units.
RECENT DEVELOPMENTS
| · | On May 19, 2025, FEMSA announced that, as part of its ongoing efforts and consistent with its capital allocation framework and commitment to enhance capital returns to shareholders, it had entered into a derivative instrument known as an accelerated share repurchase (“ASR”) agreement with a financial institution in the United States of America to repurchase Company’s shares through the acquisition of American Depositary Shares (“ADS”). Under the terms of the ASR agreement, FEMSA agreed to repurchase from such financial institution an aggregate amount of USD $250 million of its ADS. The ASR contemplated an initial delivery of 483,559 FEMSA ADSs on May 20, 2025. |
The total number of shares ultimately repurchased under the ASR agreement was based on the daily volume-weighted average price of the Company’s ADS during the term of the agreement, less a discount. The ASR was completed with the final delivery of shares received on July 21 and 22. The Company repurchased a total of 2,439,936 ADSs at an average price of USD $102.46 per ADR, for a total amount of USD $250 million.
(A) Please refer to page 13 for our definition of “comparable” and a description of the factors affecting the comparability of our financial and operating performance
1 Adjusted EBITDA: Operating Income + Depreciation + Amortizations.
2 FEMSA Units consist of FEMSA BD Units and FEMSA B Units. Each FEMSA BD Unit is comprised of one Series B Share, two Series D-B Shares and two Series D-L Shares. Each FEMSA B Unit is comprised of five Series B Shares. The number of FEMSA Units outstanding as of June 30, 2025 was 3,469,469,527, equivalent to the total number of FEMSA Shares outstanding as of the same date, divided by 5.
| July 28, 2025 | Page 10 |
| · | On July 1, 2025, FEMSA announced the closing of its divestiture, previously announced on October 10, 2024, of certain of its logistics operations doing business as Solistica, to Grupo Traxión, S.A.B. de C.V. (BMV: TRAXIONA), a transportation and logistics company based in Mexico. The transaction includes FEMSA’s transportation management operations in Mexico, as well as its contract logistics operations in Mexico, Colombia, and Brazil. The transaction does not include FEMSA’s LTL (less-than-truckload) operations in Brazil. |
Total consideration for this transaction was $4,040 million Mexican pesos, on a cash-free, debt-free basis.
CONFERENCE CALL INFORMATION
Our Second quarter 2025 Conference Call will be held on: Monday, July 28, 2025, 11:00 AM Eastern Time (9:00 AM Mexico City Time). The conference call will be webcast live through streaming audio.
| Telephone: | Toll Free US: | (866) 580 3963 |
| International: | +1 (786) 697 3501 | |
| Webcast: | https://edge.media-server.com/mmc/p/5pc7rawp/ | |
| Conference ID: | FEMSA | |
If you are unable to participate live, the conference call audio will be available on https://femsa.gcs-web.com/financial-reports/quarterly-results
ABOUT FEMSA
FEMSA is a company that creates economic and social value through companies and institutions and strives to be the best employer and neighbor to the communities in which it operates. It participates in the retail industry through a Proximity Americas Division operating OXXO, a small-format store chain, and other related retail formats, and Proximity Europe which includes Valora, our European retail unit which operates convenience and foodvenience formats. In the retail industry it also participates though a Health Division, which includes drugstores and related activities and Spin, which includes Spin by OXXO and Spin Premia, among other digital financial services initiatives. In the beverage industry, it participates through Coca-Cola FEMSA, the largest franchise bottler of Coca-Cola products in the world by volume. Across its business units, FEMSA has more than 392,000 employees in 18 countries. FEMSA is a member of the Dow Jones Best-in-Class World Index & Dow Jones Best-in-Class MILA Pacific Alliance Index, both from S&P Global; FTSE4Good Emerging Index; MSCI EM Latin America ESG Leaders Index; S&P/BMV Total México ESG, among other indexes.
| July 28, 2025 | Page 11 |
The translations of Mexican pesos into US dollars are included solely for the convenience of the reader, using the noon buying rate for Mexican pesos as published by the Federal Reserve Bank of New York on June 30, 2025, which was 18.8292 Mexican pesos per US dollar.
FORWARD-LOOKING STATEMENTS
This report may contain certain forward-looking statements concerning our future performance that should be considered as good faith estimates made by us. These forward-looking statements reflect management’s expectations and are based upon currently available data. Actual results are subject to future events and uncertainties, which could materially impact our actual performance.
Our consolidated financial statements as of and for the year ended December 31, 2025, are not yet available, and the independent audit of those financial statements is ongoing and has not yet been completed. The unaudited preliminary financial information as of and for the year ended December 31, 2025, presented herein, is preliminary and subject to change as we complete our financial closing procedures and prepare our consolidated financial statements, and as our independent registered public accounting firm completes its audit of such consolidated financial statements. As of the date of this release, our independent registered public accounting firm has not expressed an opinion or any other form of assurance on any financial information as of or for the year ended December 31, 2025, or on our internal control over financial reporting as of December 31, 2025. Our audited consolidated financial statements may differ materially from this preliminary information and will also include notes providing additional disclosures.
COMPARABILITY
Our “comparable” term means, with respect to a year-over-year comparison, the change of a given measure excluding the effects of: (i) mergers, acquisitions, and divestitures; and (ii) translation effects resulting from exchange rate movements. In preparing this measure, management has used its best judgment, estimates, and assumptions to maintain comparability.
Ten pages of tables to follow
| July 28, 2025 | Page 12 |
FEMSA – Consolidated Income Statement
Amounts expressed in millions of Mexican Pesos (Ps.)
| For the second quarter of: | For the six months of: | |||||||||||||||||||||||||||||||||||
| 2025 | % of rev. |
2024 | % of rev. |
% Var. |
% Comp.(A) |
2025 | % of rev. |
2024 | % of rev. |
% Var. |
% Comp.(A) |
|||||||||||||||||||||||||
| Total revenues | 211,364 | 100.0 | 198,744 | 100.0 | 6.3 | 2.2 | 406,812 | 100.0 | 375,507 | 100.0 | 8.3 | 2.7 | ||||||||||||||||||||||||
| Cost of sales | 125,442 | 59.3 | 116,305 | 58.5 | 7.9 | 242,126 | 59.5 | 224,728 | 59.8 | 7.7 | ||||||||||||||||||||||||||
| Gross profit | 85,922 | 40.7 | 82,440 | 41.5 | 4.2 | 0.0 | 164,686 | 40.5 | 150,779 | 40.2 | 9.2 | 4.5 | ||||||||||||||||||||||||
| Administrative expenses | 10,262 | 4.9 | 9,476 | 4.8 | 8.3 | 20,214 | 5.0 | 17,840 | 4.8 | 13.3 | ||||||||||||||||||||||||||
| Selling expenses | 58,147 | 27.5 | 55,170 | 27.8 | 5.4 | 113,460 | 27.9 | 101,969 | 27.2 | 11.3 | ||||||||||||||||||||||||||
| Other operating expenses (income), net (1) | (318 | ) | (0.2 | ) | 168 | 0.1 | N.S. | (356 | ) | (0.1 | ) | 388 | 0.1 | N.S. | ||||||||||||||||||||||
| Income from operations (2) | 17,832 | 8.4 | 17,626 | 8.9 | 1.2 | (1.5 | ) | 31,368 | 7.7 | 30,582 | 8.1 | 2.6 | (3.9) | |||||||||||||||||||||||
| Other non-operating expenses (income) | 269 | 137 | 96.4 | 1,100 | 624 | 76.3 | ||||||||||||||||||||||||||||||
| Interest expense | 5,301 | 5,599 | (5.3 | ) | 10,464 | 10,271 | 1.9 | |||||||||||||||||||||||||||||
| Interest income | 2,051 | 4,136 | (50.4 | ) | 4,183 | 6,837 | (38.8 | ) | ||||||||||||||||||||||||||||
| Interest expense, net | 3,250 | 1,463 | N.S. | 6,281 | 3,434 | N.S. | ||||||||||||||||||||||||||||||
| Foreign exchange loss (gain) | 4,102 | (6,131 | ) | N.S. | 3,660 | (5,008 | ) | N.S. | ||||||||||||||||||||||||||||
| Other financial expenses (income), net | (633 | ) | 46 | N.S. | (1,817 | ) | 337 | N.S. | ||||||||||||||||||||||||||||
| Financing expenses, net | 6,719 | (4,622 | ) | N.S. | 8,124 | (1,237 | ) | N.S. | ||||||||||||||||||||||||||||
| Income before income tax and participation in associates results | 10,844 | 22,110 | (51.0 | ) | 22,144 | 31,195 | (29.0 | ) | ||||||||||||||||||||||||||||
| Income tax | 4,339 | 6,555 | (33.8 | ) | 9,100 | 9,936 | (8.4 | ) | ||||||||||||||||||||||||||||
| Participation in associates results (3) | (756 | ) | (300 | ) | N.S. | (844 | ) | (334 | ) | N.S. | ||||||||||||||||||||||||||
| Continued Operations net income (Loss) | 5,749 | 15,255 | (62.3 | ) | 12,200 | 20,925 | (41.7 | ) | ||||||||||||||||||||||||||||
| Discontinued Operations net income (Loss) | (157 | ) | 414 | N.S | 2,333 | 525 | N.S. | |||||||||||||||||||||||||||||
| Consolidated net income (Loss) | 5,593 | 15,669 | (64.3 | ) | 14,533 | 21,450 | (32.2 | ) | ||||||||||||||||||||||||||||
| Net majority income | 2,712 | 10,283 | (73.6 | ) | 8,516 | 15,457 | (44.9 | ) | ||||||||||||||||||||||||||||
| Net minority income | 2,881 | 5,386 | (46.5 | ) | 6,017 | 5,993 | 0.4 | |||||||||||||||||||||||||||||
| Operative Cash Flow & CAPEX | 2025 | % of rev. | 2024 | % of rev. | % Var. | % Comp.(A) | 2025 | % of rev. | 2024 | % of rev. | % Var. | % Comp.(A) | ||||||||||||||||||||||||
| Income from operations | 17,832 | 8.4 | 17,626 | 8.9 | 1.2 | (1.5 | ) | 31,368 | 7.7 | 30,582 | 8.1 | 2.6 | (3.9 | ) | ||||||||||||||||||||||
| Depreciation | 9,893 | 4.7 | 8,496 | 4.3 | 16.4 | 19,609 | 4.8 | 16,827 | 4.5 | 16.5 | ||||||||||||||||||||||||||
| Amortization & other non-cash charges | 1,864 | 0.9 | 2,492 | 1.3 | (25.2 | ) | 3,855 | 0.9 | 4,509 | 1.2 | (14.5 | ) | ||||||||||||||||||||||||
| Adjusted EBITDA | 29,589 | 14.0 | 28,614 | 14.4 | 3.4 | (0.3 | ) | 54,832 | 13.5 | 51,919 | 13.8 | 5.6 | 1.5 | |||||||||||||||||||||||
| CAPEX | 9,203 | 10,672 | (13.8 | ) | 17,987 | 18,242 | (1.4 | ) |
(A) Please refer to page 13 for our definition of “comparable” and a description of the factors affecting the comparability of our financial and operating performance.
(1) Other operating expenses (income), net = other operating expenses (income) +(-) equity method from operated associates.
(2) Income from operations = gross profit – administrative and selling expenses – other operating expenses (income), net.
(3) Mainly represents the results of our joint-venture with Raízen, Grupo Nós, net of taxes.
| July 28, 2025 | Page 13 |
FEMSA – Consolidated Balance Sheet
Amounts expressed in millions of Mexican Pesos (Ps.)
| ASSETS | Jun-25 | Dec-24 | % Inc. | |||||||||
| Cash and cash equivalents | 129,825 | 139,834 | (7.2 | ) | ||||||||
| Investments | 32,485 | 43,212 | (24.8 | ) | ||||||||
| Accounts receivable | 42,083 | 43,192 | (2.6 | ) | ||||||||
| Inventories | 66,606 | 67,464 | (1.3 | ) | ||||||||
| Other current assets | 39,426 | 34,214 | 15.2 | |||||||||
| Current Assets Available for sale | 12,834 | 14,395 | (10.8 | ) | ||||||||
| Total current assets | 323,259 | 342,311 | (5.6 | ) | ||||||||
| Investments in shares | 27,088 | 28,697 | (5.6 | ) | ||||||||
| Property, plant and equipment, net | 182,186 | 177,511 | 2.6 | |||||||||
| Right of use | 99,367 | 97,960 | 1.4 | |||||||||
| Intangible assets (1) | 146,503 | 146,336 | 0.1 | |||||||||
| Other assets | 52,639 | 58,721 | (10.4 | ) | ||||||||
| TOTAL ASSETS | 831,042 | 851,536 | (2.4 | )% | ||||||||
| LIABILITIES & STOCKHOLDERS’ EQUITY | Jun-25 | Dec-24 | % Inc. | |||||||||
| Bank loans | 5,885 | 3,775 | 55.9 | |||||||||
| Current maturities of long-term debt | 13,464 | 2,947 | N.S. | |||||||||
| Interest payable | 1,606 | 1,802 | (10.9 | ) | ||||||||
| Current maturities of long-term leases | 15,462 | 13,796 | 12.1 | |||||||||
| Operating liabilities | 198,290 | 173,658 | 14.2 | |||||||||
| Short term liabilities available for sale | 6,665 | 6,952 | (4.1 | ) | ||||||||
| Total current liabilities | 241,372 | 202,930 | 18.9 | |||||||||
| Long-term debt (2) | 136,215 | 141,482 | (3.7 | ) | ||||||||
| Long-term leases | 94,455 | 94,299 | 0.2 | |||||||||
| Laboral obligations | 9,121 | 8,968 | 1.7 | |||||||||
| Other liabilities | 24,829 | 22,726 | 9.3 | |||||||||
| Total liabilities | 505,992 | 470,405 | 7.6 | |||||||||
| Total stockholders’ equity | 325,050 | 381,131 | (14.7 | ) | ||||||||
| TOTAL LIABILITIES AND STOCKHOLERS’ EQUITY | 831,042 | 851,536 | (2.4 | ) | ||||||||
| June 30, 2025 | ||||||||
| DEBT MIX (2) | % of Total | Average Rate | ||||||
| Denominated in: | ||||||||
| Mexican pesos | 49.0 | % | 9.1 | % | ||||
| U.S. Dollars | 30.9 | % | 3.5 | % | ||||
| Euros | 7.2 | % | 2.6 | % | ||||
| Swiss Francs | 0.0 | % | 0.0 | % | ||||
| Colombian pesos | 2.0 | % | 9.2 | % | ||||
| Argentine pesos | 0.3 | % | 40.8 | % | ||||
| Brazilian reais | 9.5 | % | 10.9 | % | ||||
| Chilean pesos | 1.1 | % | 6.4 | % | ||||
| Total debt | 100.0 | % | 7.1 | % | ||||
| Fixed rate (2) | 81.8 | % | ||||||
| Variable rate (2) | 18.2 | % | ||||||
| DEBT MATURITY PROFILE | 2025 | 2026 | 2027 | 2028 | 2029 | 2030+ | ||||||||||||||||||
| % of Total Debt | 4.5 | % | 10.7 | % | 7.8 | % | 10.7 | % | 3.7 | % | 62.6 | % | ||||||||||||
(1) Includes mainly the intangible assets generated by acquisitions.
(2) Includes the effect of derivative financial instruments on long-term debt.
July 28, 2025 | Page 14
Net Debt & Adjusted EBITDA ex-KOF
Amounts expressed in millions of US Dollars (US.)
| Twelve months ended June 30, 2025 | ||||||||||||
| Reported Adj. EBITDA | Adjustments | Adj. EBITDA Ex-KOF | ||||||||||
| Proximity Americas & Europe | 2,675 | - | 2,675 | |||||||||
| Fuel | 211 | - | 211 | |||||||||
| Health Division | 415 | - | 415 | |||||||||
| Envoy Solutions | - | - | - | |||||||||
| Coca-Cola FEMSA1 | 2,830 | (2,830 | ) | - | ||||||||
| Other2 | (448 | ) | - | (448 | ) | |||||||
| FEMSA Consolidated | 5,683 | (2,830 | ) | 2,853 | ||||||||
| Dividends Received3 | - | 326 | 326 | |||||||||
| FEMSA Consolidated ex-KOF | 5,683 | (2,505 | ) | 3,179 | ||||||||
| As of June 30, 2025 | ||||||||||||
| Reported | Adjustments | Ex-KOF | ||||||||||
| Cash & Equivalents | 6,648 | - | 6,648 | |||||||||
| Coca-Cola FEMSA Cash & Equivalents | 1,972 | (1,972 | ) | - | ||||||||
| Cash & Equivalents | 8,620 | (1,972 | ) | 6,648 | ||||||||
| Financial Debt4 | 3,932 | - | 3,932 | |||||||||
| Coca-Cola FEMSA Financial Debt | 4,330 | (4,330 | ) | - | ||||||||
| Lease Liabilities | 5,679 | - | 5,679 | |||||||||
| Coca-Cola FEMSA Lease Liabilities | 158 | (158 | ) | - | ||||||||
| Debt | 14,099 | (4,488 | ) | 9,612 | ||||||||
| FEMSA Net Debt | 5,479 | (2,515 | ) | 2,964 | ||||||||
Translated to USD for readers’ convenience using the exchange rate published by the Federal Reserve Bank of New York for June 30, 2025 which was 18.8292 MXN per USD.
1 Coca-Cola FEMSA adjustment represents 100% of its LTM EBITDA.
2 Includes FEMSA Other Businesses (including Bara and Spin), FEMSA corporate expenses, and the effects of consolidation adjustments
3 Reflects cash dividends received from Coca-Cola FEMSA for approximately US$322 mm and EUR$3 mm from Heineken during the last twelve months.
4 Includes EUR€ 500.0 mm in notes convertible to Heineken Holding N.V. shares.
July 28, 2025 | Page 15
EPS with Repurchased Shares
Amounts expressed in millions of Mexican Pesos (Ps.)
| As Reported | ||||
| Total Shares Outstanding(1) | ||||
| FEMSA Units Outstanding(1) | 3,469,469,527 | |||
| YTD | 2Q25 | |||||||
| Net majority income | 8,516 | 2,712 | ||||||
| # FEMSA Units Outstanding(1) | 3,469,469,527 | |||||||
| EPS (Mxn Ps. / Unit) | 2.45 | 0.78 | ||||||
| Proforma | ||||
| Total Shares Excluding Shares in Treasury | ||||
| FEMSA Units Outstanding(1) | 3,469,469,527 | |||
| Shares in Treasury | ||||
| FEMSA Units Outstanding(1) | 10,184,748 | |||
| YTD | 2Q25 | |||||||
| Net majority income | 8,516 | 2,712 | ||||||
| # FEMSA Units Outstanding | 3,459,284,779 | |||||||
| EPS (Mxn Ps. / Unit) | 2.46 | 0.78 | ||||||
(1) FEMSA Units Outstanding consist of FEMSA BD Units
and FEMSA B Units. The number of FEMSA Units outstanding is equivalent to the total number of FEMSA Shares outstanding as of the same
date, divided by 5.
(2) At our Shareholders meeting held on April 11 of 2025, the cancellation of the shares acquired from the stock
repurchase program during the period from November 2023 to March 2025 was approved. The total FEMSA Units Cancelled are for
the amount of 108,756,743 units. This includes 102,201,323 from November 2023 to December 2024, as well as 6.555,420 units bought
during the current year from January 2025 to March 2025.
July 28, 2025 | Page 16
Proximity Americas – Results of Operations
Amounts expressed in millions of Mexican Pesos (Ps.)
| For the second quarter of: | For the six months of: | |||||||||||||||||||||||||||||||||||||||||||||||
| 2025 | %
of rev. | 2024 | %
of rev. | % Var. | % Comp.(A) | 2025 | %
of rev. | 2024 | %
of rev. | % Var. | % Comp.(A) | |||||||||||||||||||||||||||||||||||||
| Total revenues | 83,958 | 100.0 | 78,526 | 100.0 | 6.9 | 2.0 | 158,844 | 100.0 | 148,611 | 100.0 | 6.9 | 1.7 | ||||||||||||||||||||||||||||||||||||
| Cost of sales | 46,944 | 55.9 | 43,899 | 55.9 | 6.9 | 89,450 | 56.3 | 84,562 | 56.9 | 5.8 | ||||||||||||||||||||||||||||||||||||||
| Gross profit | 37,014 | 44.1 | 34,627 | 44.1 | 6.9 | 4.3 | 69,394 | 43.7 | 64,049 | 43.1 | 8.3 | 5.7 | ||||||||||||||||||||||||||||||||||||
| Administrative expenses | 2,514 | 3.0 | 2,082 | 2.7 | 20.7 | 4,849 | 3.1 | 3,772 | 2.5 | 28.5 | ||||||||||||||||||||||||||||||||||||||
| Selling expenses | 26,867 | 32.0 | 24,691 | 31.4 | 8.8 | 52,396 | 33.0 | 47,355 | 31.9 | 10.6 | ||||||||||||||||||||||||||||||||||||||
| Other operating expenses (income), net | 94 | 0.1 | 96 | 0.1 | (2.9 | ) | 221 | 0.1 | 186 | 0.1 | 18.3 | |||||||||||||||||||||||||||||||||||||
| Income from operations | 7,540 | 9.0 | 7,757 | 9.9 | (2.8 | ) | (3.1 | ) | 11,929 | 7.5 | 12,735 | 8.6 | (6.3 | ) | (10.8 | ) | ||||||||||||||||||||||||||||||||
| Depreciation | 3,879 | 4.6 | 3,440 | 4.4 | 12.8 | 7,700 | 4.8 | 6,772 | 4.6 | 13.7 | ||||||||||||||||||||||||||||||||||||||
| Amortization & other non-cash charges | 389 | 0.5 | 549 | 0.7 | (29.0 | ) | 803 | 0.5 | 936 | 0.6 | (14.2 | ) | ||||||||||||||||||||||||||||||||||||
| Adjusted EBITDA | 11,809 | 14.1 | 11,746 | 15.0 | 0.5 | (0.4 | ) | 20,432 | 12.9 | 20,443 | 13.8 | (0.1 | ) | (4.0 | ) | |||||||||||||||||||||||||||||||||
| CAPEX | 3,722 | 4,749 | (21.6 | ) | 6,681 | 8,020 | (16.7 | ) | ||||||||||||||||||||||||||||||||||||||||
| Information of OXXO Stores | ||||||||||||||||||||||||||||||||||||||||||||||||
| Total stores | 25,180 | 23,680 | 6.3 | % | ||||||||||||||||||||||||||||||||||||||||||||
| Stores Mexico | 23,876 | 22,658 | 5.4 | % | ||||||||||||||||||||||||||||||||||||||||||||
| Stores LATAM | 1,055 | 1,022 | 3.2 | % | ||||||||||||||||||||||||||||||||||||||||||||
| Stores USA | 249 | - | - | |||||||||||||||||||||||||||||||||||||||||||||
| Net new convenience stores: | ||||||||||||||||||||||||||||||||||||||||||||||||
| vs. Last quarter | 334 | 390 | (14.4 | ) | ||||||||||||||||||||||||||||||||||||||||||||
| Year-to-date | 718 | 814 | (11.8 | ) | ||||||||||||||||||||||||||||||||||||||||||||
| Last-twelve-months | 1,500 | 1,621 | (7.5 | ) | ||||||||||||||||||||||||||||||||||||||||||||
| Same-store data: (1) | ||||||||||||||||||||||||||||||||||||||||||||||||
| Sales (thousands of pesos) | 1,023.5 | 1,028.0 | (0.4 | ) | 971.5 | 982.3 | (1.1 | ) | ||||||||||||||||||||||||||||||||||||||||
| Traffic (thousands of transactions) | 17.1 | 18.3 | (6.6 | ) | 16.6 | 17.7 | (6.6 | ) | ||||||||||||||||||||||||||||||||||||||||
| Ticket (pesos) | 59.7 | 56.0 | 6.6 | 58.7 | 55.4 | (5.9 | ) | |||||||||||||||||||||||||||||||||||||||||
(A) Please refer to page 13 for our definition of “comparable” and a description of the factors affecting the comparability of our financial and operating performance.
(1) Monthly average information per store, considering same stores with more than twelve months of operations, income from services are included.
July 28, 2025 | Page 17
Proximity Europe – Results of Operations
Amounts expressed in millions of Mexican Pesos (Ps.)
| For the second quarter of: | For the six months of: | |||||||||||||||||||||||||||||||||||||||||||||||
| 2025 | %
of rev. | 2024 | %
of rev. | % Var. | %
Comp.(A) | 2025 | %
of rev. | 2024 | %
of rev. | % Var. | %
Comp.(A) | |||||||||||||||||||||||||||||||||||||
| Total revenues | 15,065 | 100.0 | 11,466 | 100.0 | 31.4 | 5.9 | 27,974 | 100.0 | 22,405 | 100.0 | 24.9 | 3.5 | ||||||||||||||||||||||||||||||||||||
| Cost of sales | 8,832 | 58.6 | 6,502 | 56.7 | 35.8 | 16,310 | 58.3 | 12,711 | 56.7 | 28.3 | ||||||||||||||||||||||||||||||||||||||
| Gross profit | 6,233 | 41.4 | 4,964 | 43.3 | 25.6 | 1.2 | 11,664 | 41.7 | 9,694 | 43.3 | 20.3 | (0.3 | ) | |||||||||||||||||||||||||||||||||||
| Administrative expenses | 961 | 6.4 | 826 | 7.2 | 16.3 | 1,863 | 6.7 | 1,675 | 7.5 | 11.2 | ||||||||||||||||||||||||||||||||||||||
| Selling expenses | 4,628 | 30.7 | 3,700 | 32.3 | 25.1 | 8,832 | 31.6 | 7,220 | 32.2 | 22.3 | ||||||||||||||||||||||||||||||||||||||
| Other operating expenses (income), net | (43 | ) | (0.3 | ) | (8 | ) | (0.1 | ) | 475.6 | (50 | ) | (0.2 | ) | (34 | ) | (0.2 | ) | 47.6 | ||||||||||||||||||||||||||||||
| Income from operations | 688 | 4.6 | 445 | 3.9 | 54.4 | 24.0 | 1,019 | 3.6 | 833 | 3.7 | 22.3 | 0.6 | ||||||||||||||||||||||||||||||||||||
| Depreciation | 1,384 | 9.2 | 1,108 | 9.7 | 24.9 | 2,703 | 9.7 | 2,228 | 9.9 | 21.4 | ||||||||||||||||||||||||||||||||||||||
| Amortization & other non-cash charges | 107 | 0.7 | 112 | 1.0 | (4.9 | ) | 207 | 0.7 | 275 | 1.2 | (24.8 | ) | ||||||||||||||||||||||||||||||||||||
| Adjusted EBITDA | 2,179 | 14.5 | 1,666 | 14.5 | 30.8 | 5.2 | 3,929 | 14.0 | 3,336 | 14.9 | 17.8 | (2.4 | ) | |||||||||||||||||||||||||||||||||||
| CAPEX | 356 | 288 | 23.4 | 611 | 669 | (8.7 | ) | |||||||||||||||||||||||||||||||||||||||||
(A) refer to page 13 for our definition of “comparable” and a description of the factors affecting the comparability of our financial and operating performance.
July 28, 2025 | Page 18
Health – Results of Operations
Amounts expressed in millions of Mexican Pesos (Ps.)
| For the second quarter of: | For the six months of: | |||||||||||||||||||||||||||||||||||||||||||||||
| 2025 | % of rev. |
2024 | % of rev. |
% Var. | % Comp.(A) |
2025 | % of rev. |
2024 | % of rev. |
% Var. | % Comp.(A) |
|||||||||||||||||||||||||||||||||||||
| Total revenues | 21,850 | 100.0 | 18,894 | 100.0 | 15.6 | 6.7 | 43,822 | 100.0 | 37,048 | 100.0 | 18.3 | 6.8 | ||||||||||||||||||||||||||||||||||||
| Cost of sales | 15,354 | 70.3 | 13,175 | 69.7 | 16.5 | 30,873 | 70.5 | 26,103 | 70.5 | 18.3 | ||||||||||||||||||||||||||||||||||||||
| Gross profit | 6,496 | 29.7 | 5,719 | 30.3 | 13.6 | 4.5 | 12,949 | 29.5 | 10,945 | 29.5 | 18.3 | 6.5 | ||||||||||||||||||||||||||||||||||||
| Administrative expenses | 953 | 4.4 | 1,181 | 6.2 | (19.3 | ) | 2,096 | 4.8 | 2,125 | 5.7 | (1.4 | ) | ||||||||||||||||||||||||||||||||||||
| Selling expenses | 4,734 | 21.7 | 3,773 | 20.0 | 25.5 | 9,279 | 21.2 | 7,442 | 20.1 | 24.7 | ||||||||||||||||||||||||||||||||||||||
| Other operating expenses (income), net | (10 | ) | (0.0 | ) | (10 | ) | (0.1 | ) | (2.8 | ) | (13 | ) | (0.0 | ) | 1 | 0.0 | N.S, | |||||||||||||||||||||||||||||||
| Income from operations | 819 | 3.8 | 775 | 4.1 | 5.7 | (5.2 | ) | 1,585 | 3.6 | 1,376 | 3.7 | 15.2 | 2.2 | |||||||||||||||||||||||||||||||||||
| Depreciation | 895 | 4.1 | 686 | 3.6 | 30.6 | 1,834 | 4.2 | 1,532 | 4.1 | 19.7 | ||||||||||||||||||||||||||||||||||||||
| Amortization & other non-cash charges | 267 | 1.2 | 235 | 1.2 | 13.6 | 542 | 1.2 | 517 | 1.4 | 4.9 | ||||||||||||||||||||||||||||||||||||||
| Adjusted EBITDA | 1,981 | 9.1 | 1,696 | 9.0 | 16.9 | 3.7 | 3,962 | 9.0 | 3,425 | 9.2 | 15.7 | 2.8 | ||||||||||||||||||||||||||||||||||||
| CAPEX | 356 | 391 | (8.9 | ) | 613 | 559 | 9.6 | |||||||||||||||||||||||||||||||||||||||||
| Information of Stores | ||||||||||||||||||||||||||||||||||||||||||||||||
| Total stores | 4,321 | 4,496 | -3.9 | |||||||||||||||||||||||||||||||||||||||||||||
| Stores Mexico | 1,311 | 1,743 | -24.8 | |||||||||||||||||||||||||||||||||||||||||||||
| Stores South America | 3,010 | 2,753 | 9.3 | |||||||||||||||||||||||||||||||||||||||||||||
| Net new stores: | ||||||||||||||||||||||||||||||||||||||||||||||||
| vs. Last quarter | (273 | ) | 56 | N.S. | ||||||||||||||||||||||||||||||||||||||||||||
| Year-to-date | (340 | ) | 22 | N.S. | ||||||||||||||||||||||||||||||||||||||||||||
| Last-twelve-months | (175 | ) | 229 | N.S. | ||||||||||||||||||||||||||||||||||||||||||||
| Same-store data: (1) | ||||||||||||||||||||||||||||||||||||||||||||||||
| Sales (thousands of pesos) | 1,029.0 | 909.6 | 13.1 | 1,002.6 | 877.0 | 14.3 | ||||||||||||||||||||||||||||||||||||||||||
| Same-store data(2) | ||||||||||||||||||||||||||||||||||||||||||||||||
| Sales (currency-neutral) | 4.8 | |||||||||||||||||||||||||||||||||||||||||||||||
| Mexico | (8.7 | ) | ||||||||||||||||||||||||||||||||||||||||||||||
| Chile | 4.6 | |||||||||||||||||||||||||||||||||||||||||||||||
| Colombia | 24.4 | |||||||||||||||||||||||||||||||||||||||||||||||
| Ecuador | 4.2 | |||||||||||||||||||||||||||||||||||||||||||||||
(A) Please refer to page 13 for our definition of “comparable” and a description of the factors affecting the comparability of our financial and operating performance.
(1) Monthly average information per location, considering same locations with more than twelve months of all the operations of the Health Division.
(2) Currency Neutral monthly average information per location, considering same locations with more than twelve months of all the operations of the Health Division.
July 28, 2025 | Page 19
Fuel – Results of Operations
Amounts expressed in millions of Mexican Pesos (Ps.)
| For the second quarter of: | For the six months of: | |||||||||||||||||||||||||||||||||||||||||||||||
| 2025 | % of rev. |
2024 | % of rev. |
% Var. | % Comp.(A) |
2025 | % of rev. |
2024 | % of rev. |
% Var. | % Comp.(A) |
|||||||||||||||||||||||||||||||||||||
| Total revenues | 17,100 | 100.0 | 16,996 | 100.0 | 0.6 | N.A. | 32,338 | 100.0 | 31,959 | 100.0 | 1.2 | N.A. | ||||||||||||||||||||||||||||||||||||
| Cost of sales | 14,953 | 87.4 | 14,981 | 88.1 | (0.2 | ) | 28,374 | 87.7 | 28,205 | 88.3 | 0.6 | |||||||||||||||||||||||||||||||||||||
| Gross profit | 2,147 | 12.6 | 2,014 | 11.9 | 6.6 | N.A. | 3,964 | 12.3 | 3,754 | 11.7 | 5.6 | N.A. | ||||||||||||||||||||||||||||||||||||
| Administrative expenses | 57 | 0.3 | 82 | 0.5 | (30.5 | ) | 169 | 0.5 | 187 | 0.6 | (9.5 | ) | ||||||||||||||||||||||||||||||||||||
| Selling expenses | 1,283 | 7.5 | 1,234 | 7.3 | 4.0 | 2,525 | 7.8 | 2,349 | 7.4 | 7.5 | ||||||||||||||||||||||||||||||||||||||
| Other operating expenses (income), net | 8 | 0.0 | (5 | ) | (0.0 | ) | (250.0 | ) | 13 | 0.0 | (17 | ) | (0.1 | ) | (176.1 | ) | ||||||||||||||||||||||||||||||||
| Income from operations | 800 | 4.7 | 704 | 4.1 | 13.6 | N.A. | 1,256 | 3.9 | 1,234 | 3.9 | 1.8 | N.A. | ||||||||||||||||||||||||||||||||||||
| Depreciation | 259 | 1.5 | 249 | 1.5 | 4.2 | 519 | 1.6 | 492 | 1.5 | 5.7 | ||||||||||||||||||||||||||||||||||||||
| Amortization & other non-cash charges | 82 | 0.5 | 74 | 0.4 | 11.0 | 165 | 0.5 | 140 | 0.4 | 17.8 | ||||||||||||||||||||||||||||||||||||||
| Adjusted EBITDA | 1,141 | 6.7 | 1,027 | 6.0 | 11.1 | 1,941 | 6.0 | 1,866 | 5.8 | 4.0 | ||||||||||||||||||||||||||||||||||||||
| CAPEX | 10 | 86 | (88.6 | ) | 56 | 94 | (41.0 | ) | ||||||||||||||||||||||||||||||||||||||||
| Information of OXXO GAS Service Stations | ||||||||||||||||||||||||||||||||||||||||||||||||
| Total service stations | 559 | 570 | (1.9 | ) | ||||||||||||||||||||||||||||||||||||||||||||
| Net new service stores: | ||||||||||||||||||||||||||||||||||||||||||||||||
| vs. Last quarter | (3 | ) | 0 | N.S. | ||||||||||||||||||||||||||||||||||||||||||||
| Year-to-date | (12 | ) | (1 | ) | N.S. | |||||||||||||||||||||||||||||||||||||||||||
| Last-twelve-months | (11 | ) | 0 | N.S. | ||||||||||||||||||||||||||||||||||||||||||||
| Volume (millions of liters) total stations | 689 | 662 | 3.9 | |||||||||||||||||||||||||||||||||||||||||||||
| Same-station data: (1) | ||||||||||||||||||||||||||||||||||||||||||||||||
| Sales (thousands of pesos) | 9,209.5 | 8,778.5 | 4.9 | 8,740.0 | 8,308.3 | 5.2 | % | |||||||||||||||||||||||||||||||||||||||||
| Volume (thousands of liters) | 419.3 | 402.3 | 4.2 | 393.8 | 386.0 | 2.0 | % | |||||||||||||||||||||||||||||||||||||||||
| Average price per liter | 22.0 | 21.8 | 0.6 | 22.2 | 21.5 | 3.1 | % | |||||||||||||||||||||||||||||||||||||||||
(1) Monthly average information per station, considering same stations with more than twelve months of operations.
July 28, 2025 | Page 20
Coca-Cola FEMSA – Results of Operations
Amounts expressed in millions of Mexican Pesos (Ps.)
| For the second quarter of: | For the six months of: | |||||||||||||||||||||||||||||||||||||||||||||||
| 2025 | % of rev. | 2024 | % of rev. | % Var. | % Comp.(A) | 2025 | % of rev. | 2024 | % of rev. | % Var. | % Comp.(A) | |||||||||||||||||||||||||||||||||||||
| Total revenues | 72,917 | 100.0 | 69,456 | 100.0 | 5.0 | 2.4 | 142,703 | 100.0 | 133,685 | 100.0 | 6.7 | 3.3 | ||||||||||||||||||||||||||||||||||||
| Cost of sales | 39,875 | 54.7 | 37,495 | 54.0 | 6.3 | 77,987 | 54.6 | 73,124 | 54.7 | 6.6 | ||||||||||||||||||||||||||||||||||||||
| Gross profit | 33,042 | 45.3 | 31,961 | 46.0 | 3.4 | 0.9 | 64,716 | 45.4 | 60,561 | 45.3 | 6.9 | 3.5 | ||||||||||||||||||||||||||||||||||||
| Administrative expenses | 3,957 | 5.4 | 3,539 | 5.1 | 11.8 | 7,549 | 5.3 | 6,703 | 5.0 | 12.6 | ||||||||||||||||||||||||||||||||||||||
| Selling expenses | 19,722 | 27.0 | 18,081 | 26.0 | 9.1 | 38,480 | 27.0 | 34,735 | 26.0 | 10.8 | ||||||||||||||||||||||||||||||||||||||
| Other operating expenses (income), net | (404 | ) | (0.6 | ) | 595 | 0.9 | (167.9 | ) | (299 | ) | (0.2 | ) | 742 | 0.6 | (140.3 | ) | ||||||||||||||||||||||||||||||||
| Income from operations | 9,767 | 13.4 | 9,746 | 14.0 | 0.2 | (2.6 | ) | 18,986 | 13.3 | 18,380 | 13.7 | 3.3 | 0.3 | |||||||||||||||||||||||||||||||||||
| Depreciation | 3,160 | 4.3 | 2,657 | 3.8 | 18.9 | 6,259 | 4.4 | 5,219 | 3.9 | 19.9 | ||||||||||||||||||||||||||||||||||||||
| Amortization & other non-cash charges | 461 | 0.6 | 1,519 | 2.2 | (69.7 | ) | 1,339 | 0.9 | 2,349 | 1.8 | (43.0 | ) | ||||||||||||||||||||||||||||||||||||
| Adjusted EBITDA | 13,388 | 18.4 | 13,922 | 20.0 | (3.8 | ) | (6.3 | ) | 26,584 | 18.6 | 25,949 | 19.4 | 2.4 | (0.5 | ) | |||||||||||||||||||||||||||||||||
| CAPEX | 5,419 | 5,410 | 0.2 | 9,640 | 8,733 | 10.4 | 3.3 | |||||||||||||||||||||||||||||||||||||||||
| Sales Volumes | ||||||||||||||||||||||||||||||||||||||||||||||||
| (Millions of unit cases) | ||||||||||||||||||||||||||||||||||||||||||||||||
| Mexico and Central America | 636.9 | 61.5 | 695.6 | 63.5 | (8.4 | ) | 1,190.2 | 58.9 | 1,275.4 | 60.6 | (6.7 | ) | ||||||||||||||||||||||||||||||||||||
| South America | 133.1 | 12.9 | 130.8 | 11.9 | 1.8 | 271.0 | 13.4 | 271.4 | 12.9 | (0.2 | ) | |||||||||||||||||||||||||||||||||||||
| Brazil | 265.3 | 25.6 | 269.4 | 24.6 | (1.5 | ) | 560.6 | 27.7 | 557.6 | 26.5 | 0.5 | |||||||||||||||||||||||||||||||||||||
| Total | 1,035.3 | 100.0 | 1,095.8 | 100.0 | (5.5 | ) | 2,021.8 | 100.0 | 2,104.4 | 100.0 | (3.9 | ) | ||||||||||||||||||||||||||||||||||||
(A) Please refer to page 13 for our definition of “comparable” and a description of the factors affecting the comparability of our financial and operating performance.
July 28, 2025 | Page 21
FEMSA Macroeconomic Information
| Inflation | End-of-period Exchange Rates | |||||||||||||||||||||||
| 2Q 2025 | LTM (1) Jun-25 | Jun-25 | Jun-24 | |||||||||||||||||||||
| Per USD | Per MXN | Per USD | Per MXN | |||||||||||||||||||||
| Mexico | 0.99 | % | 4.51 | % | 18.89 | 1.0000 | 18.38 | 1.0000 | ||||||||||||||||
| Colombia | 0.98 | % | 5.08 | % | 4,069.67 | 0.0046 | 4,148.04 | 0.0044 | ||||||||||||||||
| Brazil | 0.43 | % | 5.35 | % | 5.46 | 3.4621 | 5.56 | 3.3059 | ||||||||||||||||
| Argentina | 2.73 | % | 39.63 | % | 1,205.00 | 0.0157 | 912.00 | 0.0202 | ||||||||||||||||
| Chile | 0.35 | % | 4.43 | % | 933.42 | 0.0202 | 944.34 | 0.0195 | ||||||||||||||||
| Euro Zone | -0.14 | % | 1.63 | % | 0.86 | 22.0808 | 0.93 | 19.6711 | ||||||||||||||||
(1) LTM = Last twelve months.
July 28, 2025 | Page 22
INVESTOR RELATIONS Jorge Collazo | jorge.collazo@kof.com Lorena Martin | lorena.martinl@kof.com Bryan Silva | bryan.silva@kof.com Agustin Bolio | agustin.bolio@kof.com kofmxinves@kof.com |  |
Información de uso interno
Mexico City, July 23, 2025, Coca-Cola FEMSA, S.A.B. de C.V. (BMV: KOFUBL, NYSE: KOF) (“Coca-Cola FEMSA,” “KOF” or the “Company”), the largest Coca-Cola franchise bottler in the world by sales volume, announces results for the second quarter of 2025.
SECOND QUARTER HIGHLIGHTS
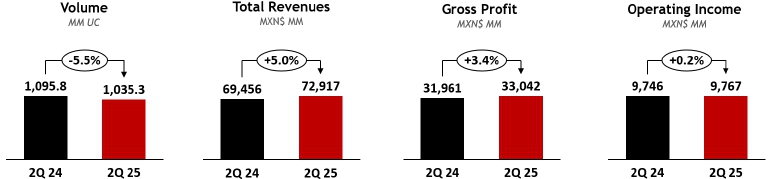
| · | Volume declined 5.5%. | |
| · | Revenue increased 5.0%, on a currency neutral basis revenue grew 2.4%. | |
| · | Operating income remained flat; on a currency neutral basis operating income decreased 2.6%. | |
| · | Majority net income decreased 5.3%. | |
| · | Earnings per share1 were Ps. 0.32 (Earnings per unit were Ps. 2.53 and per ADS were Ps. 25.29.). | |
| · | Reached 8 times more active users in the latest version of Juntos+ v 4.0, versus the previous year. | |
| · | The Company issued a successful transaction of senior notes for a total amount of US$500 million due 2035. These notes were priced at attractive spreads and coupon reflecting strong international investment grade dedicated investor demand, confirming Coca-Cola FEMSA’s financial discipline and strong credit profile. |
FIRST SIX MONTHS HIGHLIGHTS
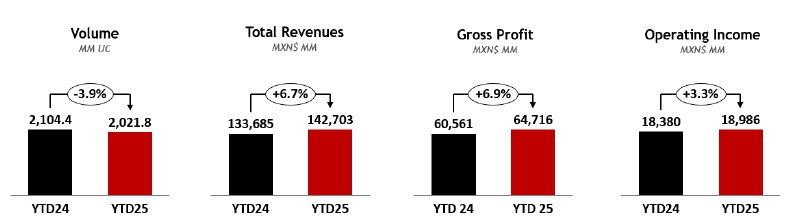
| · | Volume declined 3.9%. | |
| · | Revenue increased 6.7%, on a currency neutral basis revenue grew 5.4%. | |
| · | Operating income increased 3.3%, on a currency neutral basis operating income grew 0.7%. | |
| · | Majority net income decreased 1.4%. | |
| · | Earnings per share1 were Ps. 0.62 (Earnings per unit were Ps. 4.97 and per ADS were Ps. 49.74.). |
FINANCIAL SUMMARY FOR THE SECOND QUARTER RESULTS
Change vs. same period of last year
| Total Revenues | Gross Profit | Operating Income | Majority Net Income | |||||||||||||||||||||||||||||||
| 2Q25 | YTD 2025 | 2Q25 | YTD 2025 | 2Q25 | YTD 2025 | 2Q25 | YTD 2025 | |||||||||||||||||||||||||||
| Consolidated | 5.0 | % | 6.7 | % | 3.4 | % | 6.9 | % | 0.2 | % | 3.3 | % | (5.3 | )% | (1.4 | )% | ||||||||||||||||||
| As Reported | Mexico & Central America | 0.5 | % | 2.5 | % | (2.5 | )% | 1.1 | % | (6.3 | )% | (5.7 | )% | |||||||||||||||||||||
| South America | 13.2 | % | 13.7 | % | 16.2 | % | 17.9 | % | 19.6 | % | 24.9 | % | ||||||||||||||||||||||
| Consolidated | 2.4 | % | 5.4 | % | 0.9 | % | 5.3 | % | (2.6 | )% | 0.7 | % | ||||||||||||||||||||||
| Comparable (2) | Mexico & Central America | (1.9 | )% | (0.7 | )% | (4.8 | )% | (1.9 | )% | (8.6 | )% | (8.8 | )% | |||||||||||||||||||||
| South America | 10.3 | % | 15.7 | % | 13.1 | % | 19.7 | % | 14.9 | % | 24.0 | % | ||||||||||||||||||||||
Ian Craig, Coca-Cola FEMSA’s CEO, commented:
“During the second quarter, we navigated a challenging environment marked by a softer macroeconomic backdrop in Mexico and adverse weather conditions in Mexico and Brazil. However, despite a tougher than expected first half of the year, we are encouraged by our improved competitive position, and we maintain our long-term perspectives unchanged. As we look ahead to the second half of the year, we will make learnings and adjustments to our plans that will deliver long-term value. Importantly, we will continue investing in capacity and capabilities to support our future growth.
While the current operating environment remains complex, we are confident in our resilient profile and in the several initiatives we are implementing across our markets—from commercial, financial, and supply chain. We are leveraging our capabilities and our strong partnership with The Coca-Cola Company to deliver long-term sustainable growth for all our stakeholders.”
| (1) | Quarterly earnings / outstanding shares. Earnings per share (EPS) were calculated using 16,806.7 million shares outstanding. For the convenience of the reader, as a KOFUBL Unit is comprised of 8 shares (3 Series B shares and 5 Series L shares), earnings per unit are equal to EPS multiplied by 8. Each ADS represents 10 KOFUBL Units. |
| (2) | Please refer to page 10 for our definition of “comparable” and a description of the factors affecting the comparability of our financial and operating performance. |
| Coca-Cola FEMSA Reports 2Q25 Results Información de uso interno | Page 2 of 17 |  |
| July 23, 2025 |
RECENT DEVELOPMENTS
| · | On May 1, 2025, Coca-Cola FEMSA issued senior notes for a total amount of US$500 million principal amount of senior notes due 2035. The Company priced the notes at US 10 Year Treasury +93 basis points and a coupon of 5.100%. The transaction was closed on May 6, 2025, and received broad participation from investment grade dedicated investors, confirming Coca-Cola FEMSA’s financial discipline and strong credit profile. KOF intends to use the net proceeds from the sale of the Notes for general corporate purposes, which may include the funding of working capital and capital expenditures, and the repayment of indebtedness |
| · | On July 16, 2025, Coca-Cola FEMSA paid the second installment of the ordinary dividend approved for Ps. 0.23 per share, for a total cash distribution of Ps. 3,865.5 million. |
| · | Coca-Cola FEMSA has been included in the FTSE4Good sustainability indices for the tenth consecutive year, achieving a score of 3.9 out of 5.0—an improvement from last reported score of 2.9. This performance demonstrates progress across all evaluated categories and enhanced transparency in our integrated report, positioning the company above the consumer goods industry and beverage subsector averages. |
CONFERENCE CALL INFORMATION
| Coca-Cola FEMSA Reports 2Q25 Results Información de uso interno | Page 3 of 17 | |
| July 23, 2025 |
CONSOLIDATED SECOND QUARTER RESULTS
CONSOLIDATED SECOND QUARTER RESULTS
| As Reported | Comparable (1) | |||||||||||||||
| Expressed in millions of Mexican pesos | 2Q 2025 | 2Q 2024 | Δ% | Δ% | ||||||||||||
| Total revenues | 72,917 | 69,456 | 5.0 | % | 2.4 | % | ||||||||||
| Gross profit | 33,042 | 31,961 | 3.4 | % | 0.9 | % | ||||||||||
| Operating income | 9,767 | 9,746 | 0.2 | % | (2.6 | )% | ||||||||||
| Adj. EBITDA (2) | 13,388 | 13,922 | (3.8 | )% | (6.3 | )% | ||||||||||
Volume decreased 5.5% to 1,035.3 million unit cases, driven mainly by volume declines in Mexico, Brazil, Colombia, and Panama. These declines were partially offset by volume increases in Argentina, Uruguay, Guatemala, and Nicaragua.
Total revenues increased 5.0% to Ps. 72,917 million. This increase was driven mainly by revenue management initiatives and favorable currency translation effects from most of our operating currencies into Mexican pesos. Excluding currency translation effects, total revenues increased 2.4%.
Gross profit increased 3.4% to Ps. 33,042 million, and gross margin contracted 70 basis points to 45.3%. This contraction was driven mainly by lower operating leverage, unfavorable mix effects, and higher fixed costs such as labor, coupled with the depreciation of most of our operating currencies as applied to our U.S. dollar-denominated raw material costs. These effects were partially offset by lower sweetener costs and raw material hedging initiatives. Excluding currency translation effects, gross profit increased 0.9%.
Operating income increased 0.2% to Ps. 9,767 million, and operating margin contracted 60 basis points to 13.4%. This margin contraction was driven mainly by higher operating expenses such as labor and maintenance, coupled with an increase in marketing and depreciation. These effects were partially offset by cost and expense efficiencies, an operating foreign exchange gain, and lower freight expenses. Excluding currency translation effects, operating income decreased 2.6%.
| (1) | Please refer to page 10 for our definition of “comparable” and a description of the factors affecting the comparability of our financial and operating performance. |
| (2) | Adjusted EBITDA = operating income + depreciation + amortization & other operating non-cash charges. |
| Coca-Cola FEMSA Reports 2Q25 Results Información de uso interno | Page 4 of 17 | |
| July 23, 2025 |
Comprehensive financing result recorded an expense of Ps. 1,189 million, compared to an expense of Ps. 885 million in the previous year. This increase was driven mainly by a higher interest expense, net, of Ps. 1,475 million as compared to Ps. 1,157 million in the same period of the previous year driven by higher interest expenses mainly related to the U.S. dollar-denominated bond due 2035 issued during the second quarter, coupled with an increase in interest rates in Brazil and new financing in Colombia.
In addition, we recognized a lower foreign exchange gain of Ps. 55 million in the second quarter of 2025 as compared to a gain of Ps. 177 million in the same period of the previous year. The gain this year was driven mainly by the quarterly appreciation of the Mexican Peso as applied to our U.S. dollar-denominated net debt position. This effect was partially offset by the quarterly appreciation of the Brazilian Real as applied to our U.S. dollar-denominated cash position in Brazil.
On the other hand, we recorded a higher gain in financial instruments of Ps. 154 million, as compared to Ps. 61 million recorded in the same period of the previous year, and a higher gain in monetary positions in inflationary subsidiaries related to Argentina for Ps. 77 million as compared to a gain of Ps. 34 million recorded in the same period of the previous year.
Income tax as a percentage of income before taxes was 36.2% as compared to 34.9% during the same period of 2024. This increase was driven mainly by non-recurring effects from previous fiscal years coupled with non-creditable taxes.
Net income attributable to equity holders of the company was Ps. 5,312 million as compared to Ps. 5,608 million during the same period of the previous year. This decrease was driven mainly by the increase in the comprehensive financing results. Earnings per share1 were Ps. 0.32 (Earnings per unit were Ps. 2.53 and per ADS were Ps. 25.29.).
| (1) | Quarterly earnings / outstanding shares. Earnings per share (EPS) were calculated using 16,806.7 million shares outstanding. For the convenience of the reader, as a KOFUBL Unit is comprised of 8 shares (3 Series B shares and 5 Series L shares), earnings per unit are equal to EPS multiplied by 8. Each ADS represents 10 KOFUBL Units. |
| Coca-Cola FEMSA Reports 2Q25 Results Información de uso interno | Page 5 of 17 | |
| July 23, 2025 |
CONSOLIDATED FIRST SIX MONTHS RESULTS
CONSOLIDATED FIRST SIX MONTHS RESULTS
| As Reported | Comparable (1) | |||||||||||||||
| Expressed in millions of Mexican pesos | YTD 2025 | YTD 2024 | Δ% | Δ% | ||||||||||||
| Total revenues | 142,703 | 133,685 | 6.7 | % | 5.4 | % | ||||||||||
| Gross profit | 64,716 | 60,561 | 6.9 | % | 5.3 | % | ||||||||||
| Operating income | 18,986 | 18,380 | 3.3 | % | 0.7 | % | ||||||||||
| Adj. EBITDA (2) | 26,584 | 25,949 | 2.4 | % | 1.3 | % | ||||||||||
Volume decreased 3.9% to 2,021.8 million unit cases, driven mainly by volume declines in Mexico and Colombia. These declines were partially offset by increases in Argentina, Uruguay, and Guatemala and a flattish performance in Brazil.
Total revenues increased 6.7% to Ps. 142,703 million. This increase was driven mainly by revenue management initiatives and favorable currency translation effects from most of our operating currencies into Mexican pesos. Excluding currency translation effects, total revenues increased 5.4%.
Gross profit increased 6.9% to Ps. 64,716 million, and gross margin expanded 10 basis points to 45.4%. This performance was driven mainly by lower sweetener costs, top-line growth, and raw material hedging initiatives. These effects were partially offset by higher fixed costs, such as labor, and the depreciation of most of our operating currencies as applied to our U.S. dollar-denominated raw material costs. Excluding currency translation effects, gross profit increased 5.3%.
Operating income increased 3.3% to Ps. 18,986 million, and operating margin contracted 40 basis points to 13.3%. This margin contraction was driven mainly by lower operating leverage, driven by an increase in expenses such as labor, maintenance, marketing, and depreciation. These effects were partially offset by lower freight expenses. Excluding currency translation effects, operating income increased 0.7%.
| (1) | Please refer to page 10 for our definition of “comparable” and a description of the factors affecting the comparability of our financial and operating performance. |
| (2) | Adjusted EBITDA = operating income + depreciation + amortization & other operating non-cash charges. |
| Coca-Cola FEMSA Reports 2Q25 Results Información de uso interno | Page 6 of 17 | |
| July 23, 2025 |
Comprehensive financing result recorded an expense of Ps. 2,308 million, compared to an expense of Ps. 2,080 million in the same period of the previous year. This increase was driven mainly by a higher interest expense, net, of Ps. 2,749 million as compared to Ps. 2,341 million in the same period of the previous year as a result of higher interest expense mainly driven by our U.S. dollar-denominated bond due 2035 issued during the second quarter, coupled with an increase in interest rates in Brazil and new financing in Argentina and Colombia.
In addition, we recognized a foreign exchange loss of Ps. 1 million as compared to a gain of Ps. 204 million in the same period of the previous year, this gain in the previous year was driven mainly by the appreciation of the Brazilian Real and the Mexican Peso as applied to our U.S. dollar-denominated cash position during the same period of the previous year.
These effects were partially offset by a higher gain in financial instruments of Ps. 288 million as compared to a gain of Ps. 15 million in the same period of the previous year, resulting from a decrease in the floating interest rate as compared to the previous year.
Finally, we recognized a higher gain in monetary positions in inflationary subsidiaries related to Argentina for Ps. 154 million as compared to a gain of Ps. 42 million in the same period of the previous year.
Income tax as a percentage of income before taxes was 34.8% as compared to 32.9% during the same period of 2024. This increase was driven mainly by non-recurring effects from previous fiscal years coupled with non-creditable taxes and inflationary effects.
Net income attributable to equity holders of the company was Ps. 10,450 million as compared to Ps 10,598 million during the same period of the previous year. This decrease was driven mainly by higher comprehensive financing result and higher income taxes that were partially offset by a slight increase in our operating income. Earnings per share1 were Ps. 0.62 (Earnings per unit were Ps. 4.97 and per ADS were Ps. 49.74).
| (1) | Quarterly earnings / outstanding shares. Earnings per share (EPS) were calculated using 16,806.7 million shares outstanding. For the convenience of the reader, as a KOFUBL Unit is comprised of 8 shares (3 Series B shares and 5 Series L shares), earnings per unit are equal to EPS multiplied by 8. Each ADS represents 10 KOFUBL Units. |
| Coca-Cola FEMSA Reports 2Q25 Results Información de uso interno | Page 7 of 17 | |
| July 23, 2025 |
MEXICO & CENTRAL AMERICA DIVISION SECOND QUARTER RESULTS
| (Mexico, Guatemala, Costa Rica, Panama, and Nicaragua) |  |
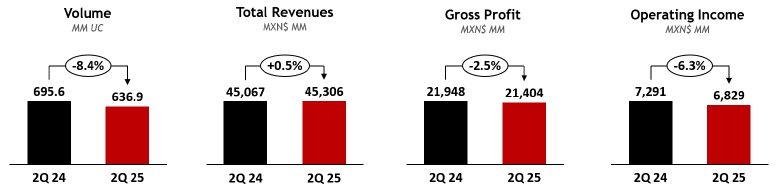
MEXICO & CENTRAL AMERICA DIVISION RESULTS
| As Reported | Comparable (1) | |||||||||||||||
| Expressed in millions of Mexican pesos | 2Q 2025 | 2Q 2024 | Δ% | Δ% | ||||||||||||
| Total revenues | 45,306 | 45,067 | 0.5 | % | (1.9 | )% | ||||||||||
| Gross profit | 21,404 | 21,948 | (2.5 | )% | (4.8 | )% | ||||||||||
| Operating income | 6,829 | 7,291 | (6.3 | )% | (8.6 | )% | ||||||||||
| Adj. EBITDA (2) | 8,926 | 9,882 | (9.7 | )% | (11.8 | )% | ||||||||||
Volume declined 8.4%, driven by volume decreases in Mexico and Panama that were partially offset by volume growth in Guatemala, Nicaragua, and Costa Rica. This volume decline was driven mainly by unfavorable weather conditions and a challenging comparison base from the previous year.
Total revenues increased 0.5% to Ps. 45,306 million. This performance was driven mainly by revenue management initiatives and the favorable currency translation effect from all our operating currencies into Mexican pesos, which were offset by a volume decline. Excluding currency translation effects, total revenues decreased 1.9%.
Gross profit decreased 2.5% to Ps. 21,404 million, and gross margin contracted 150 basis points to 47.2%. This margin contraction was driven mainly by unfavorable mix effects and higher fixed costs such as labor, coupled with the depreciation of the Mexican Peso as applied to our U.S. dollar-denominated raw material costs. These effects were partially offset by lower sweetener costs and raw material hedging initiatives. Excluding currency translation effects, gross profit decreased 4.8%.
Operating income decreased 6.3% to Ps. 6,829 million, and operating margin contracted 110 basis points to 15.1%. This margin contraction was driven mainly by lower operating leverage, coupled with an increase in expenses such as labor, maintenance, marketing, and depreciation. These effects were partially offset by a decrease in freight expenses and operating foreign exchange gain. Excluding currency translation effects, operating income decreased 8.6%.
| (1) | Please refer to page 10 for our definition of “comparable” and a description of the factors affecting the comparability of our financial and operating performance. |
| (2) | Adjusted EBITDA = operating income + depreciation + amortization & other operating non-cash charges. |
| Coca-Cola FEMSA Reports 2Q25 Results Información de uso interno | Page 8 of 17 | |
| July 23, 2025 |
SOUTH AMERICA DIVISION Second QUARTER RESULTS
| (Brazil, Argentina, Colombia, and Uruguay) |  |
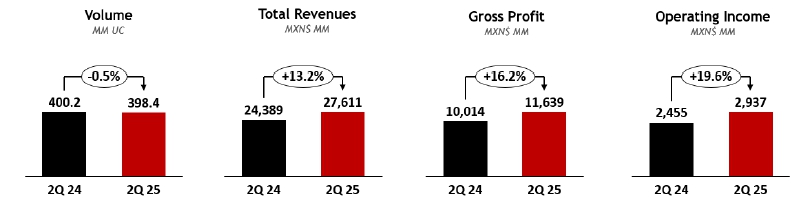
SOUTH AMERICA DIVISION RESULTS
| As Reported | Comparable (1) | |||||||||||||||
| Expressed in millions of Mexican pesos | 2Q 2025 | 2Q 2024 | Δ% | Δ% | ||||||||||||
| Total revenues | 27,611 | 24,389 | 13.2 | % | 10.3 | % | ||||||||||
| Gross profit | 11,639 | 10,014 | 16.2 | % | 13.1 | % | ||||||||||
| Operating income | 2,937 | 2,455 | 19.6 | % | 14.9 | % | ||||||||||
| Adj. EBITDA (2) | 4,462 | 4,040 | 10.4 | % | 7.3 | % | ||||||||||
Volume declined 0.5% to 398.4 million unit cases, driven mainly by volume declines in Brazil and Colombia that were partially offset by volume growth in Argentina and Uruguay.
Total revenues increased 13.2% to Ps. 27,611 million. This increase was driven mainly by revenue management initiatives, a favorable mix, and a favorable currency translation effect into Mexican pesos. Excluding currency translation effects, total revenues increased 10.3%.
Gross profit increased 16.2% to Ps. 11,639 million, and gross margin expanded 110 basis points to 42.2%. This expansion was driven mainly by top-line growth, coupled with a decrease in raw material costs, such as sweeteners, and cost efficiencies, which were partially offset by the currency depreciation in all our operating currencies as compared to the U.S. dollar. Excluding currency translation effects, gross profit increased 13.1%.
Operating income increased 19.6% to Ps. 2,937 million, resulting in an operating margin expansion of 50 basis points to 10.6%. This increase was driven mainly by an increase in our gross profit, partially offset by higher expenses such as labor and marketing. Excluding currency translation effects, operating income increased 14.9%.
| (1) | Please refer to page 10 for our definition of “comparable” and a description of the factors affecting the comparability of our financial and operating performance. |
| (2) | Adjusted EBITDA = operating income + depreciation + amortization & other operating non-cash charges. |
| Coca-Cola FEMSA Reports 2Q25 Results Información de uso interno | Page 9 of 17 | |
| July 23, 2025 |
DEFINITIONS
Volume is expressed in unit cases. Unit case refers to 192 ounces of finished beverage product (24 eight-ounce servings) and, when applied to soda fountains, refers to the volume of syrup, powders, and concentrate that is required to produce 192 ounces of finished beverage product.
Transactions refers to the number of single units (e.g., a can or a bottle) sold, regardless of their size or volume or whether they are sold individually or in multipacks, except for soda fountains, which represent multiple transactions based on a standard 12 oz. serving.
Operating income is a non-GAAP financial measure computed as “gross profit – operating expenses – other operating expenses, net + operative equity method (gain) loss in associates.”
Adjusted EBITDA is a non-GAAP financial measure computed as “operating income + depreciation + amortization & other operating non-cash charges.”
Earnings per share are equal to “quarterly earnings / outstanding shares.” Earnings per share (EPS) for all periods are adjusted to give effect to the stock split resulting in 16,806,658,096 shares outstanding. For the convenience of the reader, as a KOFUBL Unit is comprised of 8 shares (3 Series B shares and 5 Series L shares), earnings per unit are equal to EPS multiplied by 8. Each ADS represents 10 KOFUBL Units.
COMPARABILITY
Our “comparable” term means, with respect to a year-over-year comparison, the change of a given measure excluding translation effects resulting from exchange rate movements. In preparing this measure, management has used its best judgment, estimates, and assumptions to maintain comparability.
Due to the average appreciation of most of the currencies used in our main operations relative to the Mexican peso in the second quarter of 2025, as compared to the same period of 2024, we had a favorable currency translation effect into Mexican pesos. Please see page 17 for exchange rate fluctuations.
| Coca-Cola FEMSA Reports 2Q25 Results Información de uso interno | Page 10 of 17 | |
| July 23, 2025 |
ABOUT THE COMPANY
Stock listing information: Mexican Stock Exchange, Ticker: KOFUBL | NYSE (ADS), Ticker: KOF | Ratio of KOFUBL to KOF = 10:1
Coca-Cola FEMSA files reports, including annual reports and other information, with the U.S. Securities and Exchange Commission, or the “SEC,” and the Mexican Stock Exchange (Bolsa Mexicana de Valores, or the “BMV”) pursuant to the rules and regulations of the SEC (that apply to foreign private issuers) and of the BMV. Filings we make electronically with the SEC and the BMV are available to the public on the Internet at the SEC’s website at www.sec.gov, the BMV’s website at www.bmv.com.mx, and our website at www.coca-colafemsa.com.
Coca-Cola FEMSA, S.A.B. de C.V. is the largest franchise bottler in the world by sales volume. The Company produces and distributes trademark beverages of The Coca-Cola Company, offering a wide portfolio to more than 276 million consumers. With over 93,000 employees, the Company markets and sells approximately 4.2-billion-unit cases through approximately 2.2 million points of sale a year. Operating 56 manufacturing plants and 256 distribution centers, Coca-Cola FEMSA is committed to generating economic, social, and environmental value for all its stakeholders across the value chain. The Company is a member of the Dow Jones Sustainability MILA Pacific Alliance Index, FTSE4Good Emerging Index, and the S&P/BMV Total Mexico ESG Index, among others. Its operations encompass certain territories in Mexico, Brazil, Guatemala, Colombia, and Argentina and, nationwide, in Costa Rica, Nicaragua, Panama, Uruguay and, in Venezuela, through an investment in KOF Venezuela. For further information, please visit www.coca-colafemsa.com

ADDITIONAL INFORMATION
All the financial information presented in this report was prepared under International Financial Reporting Standards (IFRS).
This news release may contain forward-looking statements concerning Coca-Cola FEMSA’s future performance, which should be considered as good faith estimates by Coca-Cola FEMSA. These forward-looking statements reflect management’s expectations and are based upon currently available data. Actual results are subject to future events and uncertainties, many of which are outside Coca-Cola FEMSA’s control, which could materially impact the Company’s actual performance. References herein to “US$” are to United States dollars. This news release contains translations of certain Mexican peso amounts into U.S. dollars for the convenience of the reader. These translations should not be construed as representations that Mexican peso amounts represent such U.S. dollar amounts or could be converted into U.S. dollars at the rate indicated.
(6 pages of tables to follow)
| Coca-Cola FEMSA Reports 2Q25 Results Información de uso interno | Page 11 of 17 | |
| July 23, 2025 |
COCA-COLA FEMSA
CONSOLIDATED INCOME STATEMENT
Millions of Pesos (1)
| For the Second Quarter of: | For the first Six Months of: | |||||||||||||||||||||||||||||||||||
| 2025 | % of Rev. | 2024 | % of Rev. | Δ% Reported | Δ% Comparable (7) | 2025 | % of Rev. | 2024 | % of Rev. | Δ% Reported | Δ% Comparable (7) | |||||||||||||||||||||||||
| Transactions (million transactions) | 6,131.9 | 6,372.8 | -3.8 | % | -3.8 | % | 12,053.7 | 12,330.8 | -2.2 | % | -2.2 | % | ||||||||||||||||||||||||
| Volume (million unit cases) | 1,035.3 | 1,095.8 | -5.5 | % | -5.5 | % | 2,021.8 | 2,104.4 | -3.9 | % | -3.9 | % | ||||||||||||||||||||||||
| Average price per unit case | 68.65 | 61.89 | 10.9 | % | 68.63 | 61.77 | 11.1 | % | ||||||||||||||||||||||||||||
| Net revenues | 72,852 | 69,297 | 5.1 | % | 142,556 | 133,359 | 6.9 | % | ||||||||||||||||||||||||||||
| Other operating revenues | 65 | 159 | -59.2 | % | 147 | 326 | -55.0 | % | ||||||||||||||||||||||||||||
| Total revenues (2) | 72,917 | 100.0 | % | 69,456 | 100.0 | % | 5.0 | % | 2.4 | % | 142,703 | 100.0 | % | 133,685 | 100.0 | % | 6.7 | % | 5.4 | % | ||||||||||||||||
| Cost of goods sold | 39,875 | 54.7 | % | 37,495 | 54.0 | % | 6.3 | % | 77,987 | 54.6 | % | 73,124 | 54.7 | % | 6.6 | % | ||||||||||||||||||||
| Gross profit | 33,042 | 45.3 | % | 31,961 | 46.0 | % | 3.4 | % | 0.9 | % | 64,716 | 45.4 | % | 60,561 | 45.3 | % | 6.9 | % | 5.3 | % | ||||||||||||||||
| Operating expenses | 23,679 | 32.5 | % | 21,621 | 31.1 | % | 9.5 | % | 46,029 | 32.3 | % | 41,438 | 31.0 | % | 11.1 | % | ||||||||||||||||||||
| Other operative expenses, net | (291 | ) | -0.4 | % | 672 | 1.0 | % | NA | (109 | ) | -0.1 | % | 864 | 0.6 | % | NA | ||||||||||||||||||||
| Operative equity method (gain) loss in associates(3) | (112 | ) | -0.2 | % | (78 | ) | -0.1 | % | 43.8 | % | (190 | ) | -0.1 | % | (122 | ) | -0.1 | % | 56.1 | % | ||||||||||||||||
| Operating income (5) | 9,767 | 13.4 | % | 9,746 | 14.0 | % | 0.2 | % | -2.6 | % | 18,986 | 13.3 | % | 18,380 | 13.7 | % | 3.3 | % | 0.7 | % | ||||||||||||||||
| Other non operative expenses, net | 99 | 0.1 | % | 63 | 0.1 | % | 56.6 | % | 125 | 0.1 | % | (27 | ) | 0.0 | % | NA | ||||||||||||||||||||
| Non Operative equity method (gain) loss in associates (4) | (54 | ) | -0.1 | % | 45 | 0.1 | % | NA | (130 | ) | -0.1 | % | 58 | 0.0 | % | NA | ||||||||||||||||||||
| Interest expense | 2,101 | 1,836 | 14.5 | % | 3,963 | 3,648 | 8.6 | % | ||||||||||||||||||||||||||||
| Interest income | 626 | 678 | -7.7 | % | 1,214 | 1,307 | -7.1 | % | ||||||||||||||||||||||||||||
| Interest expense, net | 1,475 | 1,157 | 27.5 | % | 2,749 | 2,341 | 17.5 | % | ||||||||||||||||||||||||||||
| Foreign exchange loss (gain) | (55 | ) | (177 | ) | -68.8 | % | 1 | (204 | ) | NA | ||||||||||||||||||||||||||
| Loss (gain) on monetary position in inflationary subsidiaries | (77 | ) | (34 | ) | 125.6 | % | (154 | ) | (42 | ) | 267.5 | % | ||||||||||||||||||||||||
| Market value (gain) loss on financial instruments | (154 | ) | (61 | ) | 151.3 | % | (288 | ) | (15 | ) | 1860.7 | % | ||||||||||||||||||||||||
| Comprehensive financing result | 1,189 | 885 | 34.4 | % | 2,308 | 2,080 | 11.0 | % | ||||||||||||||||||||||||||||
| Income before taxes | 8,532 | 8,752 | -2.5 | % | 16,684 | 16,269 | 2.5 | % | ||||||||||||||||||||||||||||
| Income taxes | 3,029 | 3,044 | -0.5 | % | 5,691 | 5,329 | 6.8 | % | ||||||||||||||||||||||||||||
| Result of discontinued operations | - | - | NA | - | - | NA | ||||||||||||||||||||||||||||||
| Consolidated net income | 5,503 | 5,709 | -3.6 | % | 10,993 | 10,941 | 0.5 | % | ||||||||||||||||||||||||||||
| Net income attributable to equity holders of the company | 5,312 | 7.3 | % | 5,608 | 8.1 | % | -5.3 | % | -8.1 | % | 10,450 | 7.3 | % | 10,598 | 7.9 | % | -1.4 | % | -5.9 | % | ||||||||||||||||
| Non-controlling interest | 191 | 0.3 | % | 101 | 0.1 | % | 89.2 | % | 543 | 0.4 | % | 342 | 0.3 | % | 58.7 | % | ||||||||||||||||||||
| Adj. EBITDA & CAPEX | 2025 | % of Rev. | 2024 | % of Rev. | Δ% | Δ% Comparable (7) | 2025 | % of Rev. | 2024 | % of Rev. | Δ% Reported | Δ% Comparable (7) | ||||||||||||||||||||||||
| Operating income (5) | 9,767 | 13.4 | % | 9,746 | 14.0 | % | 0.2 | % | -2.6 | % | 18,986 | 13.3 | % | 18,380 | 13.7 | % | 3.3 | % | 0.7 | % | ||||||||||||||||
| Depreciation | 3,160 | 2,657 | 18.9 | % | 6,259 | 5,219 | 19.9 | % | ||||||||||||||||||||||||||||
| Amortization and other operative non-cash charges | 461 | 1,519 | -69.6 | % | 1,339 | 2,349 | -43.0 | % | ||||||||||||||||||||||||||||
| Adj. EBITDA (5)(6) | 13,388 | 18.4 | % | 13,922 | 20.0 | % | -3.8 | % | -6.3 | % | 26,584 | 18.6 | % | 25,949 | 19.4 | % | 2.4 | % | 1.3 | % | ||||||||||||||||
| CAPEX(8) | 5,404 | 5,512 | -2.0 | % | 9,632 | 8,693 | 10.8 | % | ||||||||||||||||||||||||||||
| (1) | Except volume and average price per unit case figures. |
| (2) | Please refer to page 15 and 16 for revenue breakdown. |
| (3) | Includes equity method in Jugos del Valle and Leão Alimentos, among others. |
| (4) | Includes equity method in PIASA, IEQSA, Beta San Miguel, IMER, and KSP Participacoes, among others. |
| (5) | The operating income and adjusted EBITDA lines are presented as non-GAAP measures for the convenience of the reader. |
| (6) | Adjusted EBITDA = operating income + depreciation, amortization & other operating non-cash charges. |
| (7) | Please refer to page 10 for our definition of “comparable” and a description of the factors affecting the comparability of our financial and operating performance. |
| (8) | As of June 30, 2025, the investment in fixed assets effectively paid is equivalent to Ps. 9,985 million. |
| Coca-Cola FEMSA Reports 2Q25 Results Información de uso interno | Page 12 of 17 | |
| July 23, 2025 |
MEXICO & CENTRAL AMERICA DIVISION
RESULTS OF OPERATIONS
Millions of Pesos (1)
| For the Second Quarter of: | For the First Six Months of: | |||||||||||||||||||||||||||||||||||
| 2025 | % of Rev. | 2024 | % of Rev. | Δ% Reported | Δ% Comparable (6) | 2025 | % of Rev. | 2024 | % of Rev. | Δ% Reported | Δ% Comparable (6) | |||||||||||||||||||||||||
| Transactions (million transactions) | 3,279.8 | 3,565.3 | -8.0 | % | -8.0 | % | 6,182.9 | 6,584.4 | -6.1 | % | -6.1 | % | ||||||||||||||||||||||||
| Volume (million unit cases) | 636.9 | 695.6 | -8.4 | % | -8.4 | % | 1,190.2 | 1,275.4 | -6.7 | % | -6.7 | % | ||||||||||||||||||||||||
| Average price per unit case | 70.42 | 64.48 | 9.2 | % | 70.73 | 64.68 | 9.4 | % | ||||||||||||||||||||||||||||
| Net revenues | 45,297 | 45,078 | 84,959 | 82,922 | ||||||||||||||||||||||||||||||||
| Other operating revenues | 9 | (11 | ) | 16 | (11 | ) | ||||||||||||||||||||||||||||||
| Total Revenues (2) | 45,306 | 100.0 | % | 45,067 | 100.0 | % | 0.5 | % | -1.9 | % | 84,975 | 100.0 | % | 82,911 | 100.0 | % | 2.5 | % | -0.7 | % | ||||||||||||||||
| Cost of goods sold | 23,902 | 52.8 | % | 23,119 | 51.3 | % | 44,686 | 52.6 | % | 43,075 | 52.0 | % | ||||||||||||||||||||||||
| Gross profit | 21,404 | 47.2 | % | 21,948 | 48.7 | % | -2.5 | % | -4.8 | % | 40,289 | 47.4 | % | 39,836 | 48.0 | % | 1.1 | % | -1.9 | % | ||||||||||||||||
| Operating expenses | 14,973 | 33.0 | % | 14,241 | 31.6 | % | 28,334 | 33.3 | % | 26,354 | 31.8 | % | ||||||||||||||||||||||||
| Other operative expenses, net | (320 | ) | -0.7 | % | 478 | -0.1 | % | (163 | ) | -0.2 | % | 597 | 0.7 | % | ||||||||||||||||||||||
| Operative equity method (gain) loss in associates (3) | (79 | ) | -0.2 | % | (62 | ) | -0.1 | % | (110 | ) | -0.1 | % | (88 | ) | -0.1 | % | ||||||||||||||||||||
| Operating income (4) | 6,829 | 15.1 | % | 7,291 | 16.2 | % | -6.3 | % | -8.6 | % | 12,229 | 14.4 | % | 12,972 | 15.6 | % | -5.7 | % | -8.8 | % | ||||||||||||||||
| Depreciation, amortization & other operating non-cash charges | 2,096 | 4.6 | % | 2,591 | 5.8 | % | 4,605 | 5.4 | % | 4,654 | 5.6 | % | ||||||||||||||||||||||||
| Adj. EBITDA (4)(5) | 8,926 | 19.7 | % | 9,882 | 21.9 | % | -9.7 | % | -11.8 | % | 16,834 | 19.8 | % | 17,626 | 21.3 | % | -4.5 | % | -7.6 | % | ||||||||||||||||
| (1) | Except volume and average price per unit case figures. |
| (2) | Please refer to page 15 and 16 for revenue breakdown. |
| (3) | Includes equity method in Jugos del Valle, among others. |
| (4) | The operating income and adjusted EBITDA lines are presented as non-GAAP measures for the convenience of the reader. |
| (5) | Adjusted EBITDA = operating income + depreciation, amortization & other operating non-cash charges. |
| (6) | Please refer to page 10 for our definition of “comparable” and a description of the factors affecting the comparability of our financial and operating performance. |
SOUTH AMERICA DIVISION
RESULTS OF OPERATIONS
Millions of Pesos (1)
| For the Second Quarter of: | For the First Six Months of: | |||||||||||||||||||||||||||||||||||
| 2025 | % of Rev. | 2024 | % of Rev. | Δ% Reported | Δ% Comparable (6) | 2025 | % of Rev. | 2024 | % of Rev. | Δ% Reported | Δ% Comparable (6) | |||||||||||||||||||||||||
| Transactions (million transactions) | 2,852.1 | 2,807.5 | 1.6 | % | 1.6 | % | 5,870.8 | 5,746.4 | 2.2 | % | 2.2 | % | ||||||||||||||||||||||||
| Volume (million unit cases) | 398.4 | 400.2 | -0.5 | % | -0.5 | % | 831.6 | 829.0 | 0.3 | % | 0.3 | % | ||||||||||||||||||||||||
| Average price per unit case | 65.81 | 57.39 | 14.7 | % | 65.63 | 57.29 | 14.6 | % | ||||||||||||||||||||||||||||
| Net revenues | 27,554 | 24,219 | 57,596 | 50,437 | ||||||||||||||||||||||||||||||||
| Other operating revenues | 56 | 171 | 131 | 337 | ||||||||||||||||||||||||||||||||
| Total Revenues (2) | 27,611 | 100.0 | % | 24,389 | 100.0 | % | 13.2 | % | 10.3 | % | 57,727 | 100.0 | % | 50,774 | 100.0 | % | 13.7 | % | 15.7 | % | ||||||||||||||||
| Cost of goods sold | 15,972 | 57.8 | % | 14,375 | 58.9 | % | 33,301 | 57.7 | % | 30,049 | 59.2 | % | ||||||||||||||||||||||||
| Gross profit | 11,639 | 42.2 | % | 10,014 | 41.1 | % | 16.2 | % | 13.1 | % | 24,427 | 42.3 | % | 20,725 | 40.8 | % | 17.9 | % | 19.7 | % | ||||||||||||||||
| Operating expenses | 8,705 | 31.5 | % | 7,380 | 30.3 | % | 17,695 | 30.7 | % | 15,083 | 29.7 | % | ||||||||||||||||||||||||
| Other operative expenses, net | 28 | 0.1 | % | 195 | 0.8 | % | 54 | 0.1 | % | 267 | 0.5 | % | ||||||||||||||||||||||||
| Operative equity method (gain) loss in associates (3) | (32 | ) | -0.1 | % | (16 | ) | -0.1 | % | (80 | ) | -0.1 | % | (34 | ) | -0.1 | % | ||||||||||||||||||||
| Operating income (4) | 2,937 | 10.6 | % | 2,455 | 10.1 | % | 19.6 | % | 14.9 | % | 6,757 | 11.7 | % | 5,408 | 10.7 | % | 24.9 | % | 24.0 | % | ||||||||||||||||
| Depreciation, amortization & other operating non-cash charges | 1,525 | 5.5 | % | 1,585 | 6.5 | % | 2,993 | 5.2 | % | 2,915 | 5.7 | % | ||||||||||||||||||||||||
| Adj. EBITDA (4)(5) | 4,462 | 16.2 | % | 4,040 | 16.6 | % | 10.4 | % | 7.3 | % | 9,750 | 16.9 | % | 8,323 | 16.4 | % | 17.1 | % | 21.3 | % | ||||||||||||||||
| (1) | Except volume and average price per unit case figures. |
| (2) | Please refer to page 15 and 16 for revenue breakdown. |
| (3) | Includes equity method in Leão Alimentos, among others. |
| (4) | The operating income and adjusted EBITDA lines are presented as non-GAAP measures for the convenience of the reader. |
| (5) | Adjusted EBITDA = operating income + depreciation, amortization & other operating non-cash charges. |
| (6) | Please refer to page 10 for our definition of “comparable” and a description of the factors affecting the comparability of our financial and operating performance. |
| Coca-Cola FEMSA Reports 2Q25 Results Información de uso interno | Page 13 of 17 | |
| July 23, 2025 |
COCA-COLA FEMSA
CONSOLIDATED BALANCE SHEET
Millions of Pesos
| Assets | Jun-25 | Dec-24 | % Var. | |||||||||
| Current Assets | ||||||||||||
| Cash, cash equivalents and marketable securities | 37,139 | 32,779 | 13 | % | ||||||||
| Total accounts receivable | 15,943 | 18,620 | -14 | % | ||||||||
| Inventories | 14,985 | 14,059 | 7 | % | ||||||||
| Other current assets | 10,465 | 9,675 | 8 | % | ||||||||
| Total current assets | 78,531 | 75,132 | 5 | % | ||||||||
| Non-Current Assets | - | - | ||||||||||
| Property, plant and equipment | 166,786 | 161,785 | 3 | % | ||||||||
| Accumulated depreciation | (64,237 | ) | (62,404 | ) | 3 | % | ||||||
| Total property, plant and equipment, net | 102,549 | 99,381 | 3 | % | ||||||||
| Right of use assets | 2,746 | 2,989 | -8 | % | ||||||||
| Investment in shares | 10,738 | 10,233 | 5 | % | ||||||||
| Intangible assets and other assets | 103,142 | 101,876 | 1 | % | ||||||||
| Other non-current assets | 16,155 | 18,375 | -12 | % | ||||||||
| Total Assets | 313,860 | 307,986 | 2 | % | ||||||||
| Liabilities & Equity | Jun-25 | Dec-24 | % Var. | |||||||||
| Current Liabilities | ||||||||||||
| Short-term bank loans and notes payable | 3,755 | 3,314 | 13 | % | ||||||||
| Suppliers | 29,271 | 33,773 | -13 | % | ||||||||
| Short-term leasing Liabilities | 876 | 889 | -1 | % | ||||||||
| Other current liabilities | 36,489 | 29,195 | 25 | % | ||||||||
| Total current liabilities | 70,391 | 67,171 | 5 | % | ||||||||
| Non-Current Liabilities | - | - | ||||||||||
| Long-term bank loans and notes payable | 77,769 | 70,383 | 10 | % | ||||||||
| Long Term Leasing Liabilities | 2,101 | 2,295 | -8 | % | ||||||||
| Other long-term liabilities | 18,855 | 17,595 | 7 | % | ||||||||
| Total liabilities | 169,116 | 157,445 | 7 | % | ||||||||
| Equity | - | - | ||||||||||
| Non-controlling interest | 7,806 | 7,113 | 10 | % | ||||||||
| Total controlling interest | 136,938 | 143,428 | -5 | % | ||||||||
| Total equity | 144,744 | 150,542 | -4 | % | ||||||||
| Total Liabilities and Equity | 313,860 | 307,986 | 2 | % | ||||||||
| June 30, 2025 | ||||||||||||
| Debt Mix | % Total Debt (1) | % Interest Rate Floating (1) (2) | Average Rate | |||||||||
| Currency | ||||||||||||
| Mexican Pesos | 51.6 | % | 2.3 | % | 8.5 | % | ||||||
| U.S. Dollars | 26.3 | % | 20.7 | % | 4.2 | % | ||||||
| Colombian Pesos | 3.8 | % | 58.3 | % | 9.2 | % | ||||||
| Brazilian Reals | 17.7 | % | 13.1 | % | 10.9 | % | ||||||
| Argentine Pesos | 0.6 | % | 0.0 | % | 40.8 | % | ||||||
| Total Debt | 100 | % | 14.6 | % | 8.0 | % | ||||||
(1) After giving effect to swaps.
(2) Calculated based on the weighting of the outstanding debt mix for each year.
Debt Maturity Profile
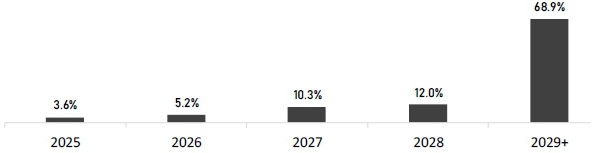
| Financial Ratios | 2Q 2025 | FY 2024 | Δ% | |||||||||
| Net debt including effect of hedges (1)(3) | 44,824 | 38,329 | 16.9 | % | ||||||||
| Net debt including effect of hedges / Adj. EBITDA (1)(3) | 0.79 | 0.68 | ||||||||||
| Adj. EBITDA/ Interest expense, net (1) | 9.67 | 12.51 | ||||||||||
| Capitalization (2) | 36.6 | % | 33.3 | % | ||||||||
| (1) Net debt = total debt - cash |
| (2) Total debt / (total debt + shareholders' equity) |
| (3) After giving effect to swaps. |
| Coca-Cola FEMSA Reports 2Q25 Results Información de uso interno | Page 14 of 17 | |
| July 23, 2025 |
COCA-COLA FEMSA
QUARTERLY- VOLUME, TRANSACTIONS & REVENUES
Volume
| 2Q 2025 | 2Q 2024 | YoY | |||||||||||||||||||||||||||||||
| Sparkling | Water (1) | Bulk (2) | Stills | Total | Sparkling | Water (1) | Bulk (2) | Stills | Total | Δ % | |||||||||||||||||||||||
| Mexico | 359.7 | 37.7 | 98.5 | 43.5 | 539.4 | 402.3 | 44.1 | 108.1 | 45.0 | 599.5 | -10.0 | % | |||||||||||||||||||||
| Guatemala | 46.1 | 2.2 | 0.8 | 2.3 | 51.3 | 45.2 | 2.8 | - | 2.6 | 50.5 | 1.6 | % | |||||||||||||||||||||
| CAM South | 38.0 | 2.2 | 0.2 | 5.9 | 46.2 | 37.4 | 1.5 | 1.0 | 5.7 | 45.6 | 1.2 | % | |||||||||||||||||||||
| Mexico and Central America | 443.7 | 42.1 | 99.4 | 51.7 | 636.9 | 484.8 | 48.3 | 109.1 | 53.3 | 695.6 | -8.4 | % | |||||||||||||||||||||
| Colombia | 63.5 | 9.6 | 3.5 | 5.9 | 82.6 | 64.5 | 9.4 | 4.0 | 7.1 | 85.0 | -2.8 | % | |||||||||||||||||||||
| Brazil (3) | 223.2 | 17.7 | 1.8 | 22.7 | 265.3 | 224.0 | 18.9 | 2.4 | 24.2 | 269.4 | -1.5 | % | |||||||||||||||||||||
| Argentina | 29.1 | 5.0 | 1.4 | 3.8 | 39.3 | 26.8 | 4.2 | 1.7 | 2.5 | 35.1 | 11.9 | % | |||||||||||||||||||||
| Uruguay | 9.0 | 1.5 | - | 0.7 | 11.2 | 8.7 | 1.4 | - | 0.6 | 10.7 | 4.9 | % | |||||||||||||||||||||
| South America | 324.7 | 33.9 | 6.7 | 33.1 | 398.4 | 324.0 | 33.8 | 8.1 | 34.3 | 400.2 | -0.5 | % | |||||||||||||||||||||
| TOTAL | 768.4 | 76.0 | 106.1 | 84.8 | 1,035.3 | 808.8 | 82.2 | 117.2 | 87.7 | 1,095.8 | -5.5 | % | |||||||||||||||||||||
(1) Excludes water presentations larger than 5.0 Lt ; includes flavored water.
(2) Bulk Water = Still bottled water in 5.0, 19.0 and 20.0 - liter packaging presentations; includes flavored water
Transactions
| 2Q 2025 | 2Q 2024 | YoY | |||||||||||||||||||||||||
| Sparkling | Water | Stills | Total | Sparkling | Water | Stills | Total | Δ % | |||||||||||||||||||
| Mexico | 1,978.1 | 265.1 | 298.5 | 2,541.7 | 2,230.1 | 297.6 | 313.2 | 2,840.9 | -10.5 | % | |||||||||||||||||
| Guatemala | 346.8 | 21.3 | 24.5 | 392.6 | 334.4 | 19.0 | 27.0 | 380.4 | 3.2 | % | |||||||||||||||||
| CAM South | 273.6 | 14.2 | 57.7 | 345.5 | 271.2 | 15.0 | 57.9 | 344.1 | 0.4 | % | |||||||||||||||||
| Mexico and Central America | 2,598.5 | 300.6 | 380.7 | 3,279.8 | 2,835.7 | 331.5 | 398.1 | 3,565.3 | -8.0 | % | |||||||||||||||||
| Colombia | 470.8 | 96.9 | 45.8 | 613.5 | 475.2 | 95.7 | 58.7 | 629.6 | -2.6 | % | |||||||||||||||||
| Brazil (3) | 1,547.0 | 154.6 | 266.2 | 1,967.8 | 1,498.6 | 163.5 | 277.3 | 1,939.4 | 1.5 | % | |||||||||||||||||
| Argentina | 152.0 | 30.1 | 32.0 | 214.0 | 138.0 | 26.1 | 21.9 | 185.9 | 15.1 | % | |||||||||||||||||
| Uruguay | 45.3 | 5.9 | 5.6 | 56.8 | 42.2 | 5.5 | 4.7 | 52.5 | 8.3 | % | |||||||||||||||||
| South America | 2,215.0 | 287.4 | 349.6 | 2,852.1 | 2,154.0 | 290.7 | 362.7 | 2,807.5 | 1.6 | % | |||||||||||||||||
| TOTAL | 4,813.5 | 588.0 | 730.4 | 6,131.9 | 4,989.7 | 622.2 | 760.8 | 6,372.8 | -3.8 | % | |||||||||||||||||
Revenues
| Expressed in million Mexican Pesos | 2Q 2025 | 2Q 2024 | Δ % | ||||||
| Mexico | 36,629 | 37,474 | -2.3 | % | |||||
| Guatemala | 4,458 | 3,846 | 15.9 | % | |||||
| CAM South | 4,218 | 3,746 | 12.6 | % | |||||
| Mexico and Central America | 45,306 | 45,067 | 0.5 | % | |||||
| Colombia | 5,384 | 4,785 | 12.5 | % | |||||
| Brazil (4) | 18,359 | 16,443 | 11.7 | % | |||||
| Argentina | 2,653 | 2,154 | 23.1 | % | |||||
| Uruguay | 1,215 | 1,007 | 20.6 | % | |||||
| South America | 27,611 | 24,389 | 13.2 | % | |||||
| TOTAL | 72,917 | 69,456 | 5.0 | % |
(3) Volume and transactions in Brazil do not include beer
(4) Brazil includes beer revenues of Ps. 1,343.1 million for the second quarter of 2025 and Ps. 1,033.1 million for the same period of the previous year.
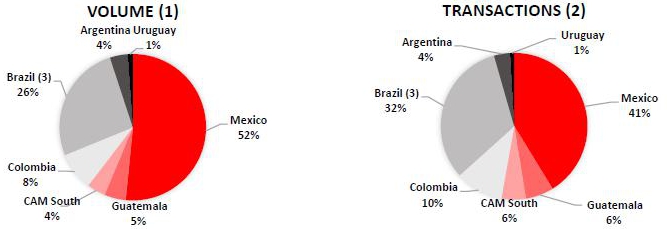
| (1) | Volume is expressed in unit cases. Unit case refers to 192 ounces of finished beverage product (24 eight-ounce servings) and, when applied to soda fountains, refers to the volume of syrup, powders, and concentrate that is required to produce 192 ounces of finished beverage product. |
| (2) | Transactions refers to the number of single units (e.g., a can or a bottle) sold, regardless of their size or volume or whether they are sold individually or in multipacks, except for soda fountains, which represent multiple transactions based on a standard 12 oz. serving. |
| Coca-Cola FEMSA Reports 2Q25 Results Información de uso interno | Page 15 of 17 | |
| July 23, 2025 |
COCA-COLA FEMSA
YTD- VOLUME, TRANSACTIONS & REVENUES
Volume
| YTD 2025 | YTD 2024 | YoY | |||||||||||||||||||||||||||||||
| Sparkling | Water (1) | Bulk (2) | Stills | Total | Sparkling | Water (1) | Bulk (2) | Stills | Total | Δ % | |||||||||||||||||||||||
| Mexico | 667.6 | 68.1 | 185.6 | 82.0 | 1,003.3 | 734.7 | 75.4 | 197.9 | 81.8 | 1,089.8 | -7.9 | % | |||||||||||||||||||||
| Guatemala | 88.1 | 4.1 | 1.5 | 4.3 | 98.1 | 86.5 | 5.1 | - | 4.8 | 96.4 | 1.8 | % | |||||||||||||||||||||
| CAM South | 72.7 | 4.5 | 0.4 | 11.3 | 88.8 | 73.0 | 3.1 | 2.0 | 11.2 | 89.2 | -0.4 | % | |||||||||||||||||||||
| Mexico and Central America | 828.4 | 76.7 | 187.4 | 97.6 | 1,190.2 | 894.2 | 83.6 | 199.9 | 97.7 | 1,275.4 | -6.7 | % | |||||||||||||||||||||
| Colombia | 125.2 | 19.4 | 7.1 | 12.2 | 163.8 | 130.5 | 19.9 | 8.1 | 14.7 | 173.3 | -5.5 | % | |||||||||||||||||||||
| Brazil (3) | 465.5 | 41.8 | 4.7 | 48.6 | 560.6 | 464.1 | 39.6 | 5.1 | 48.7 | 557.6 | 0.5 | % | |||||||||||||||||||||
| Argentina | 60.5 | 11.2 | 2.7 | 8.1 | 82.6 | 56.2 | 9.3 | 3.7 | 5.5 | 74.8 | 10.5 | % | |||||||||||||||||||||
| Uruguay | 19.1 | 3.8 | - | 1.7 | 24.6 | 18.8 | 3.3 | - | 1.3 | 23.3 | 5.5 | % | |||||||||||||||||||||
| South America | 670.3 | 76.3 | 14.4 | 70.6 | 831.6 | 669.6 | 72.2 | 16.9 | 70.3 | 829.0 | 0.3 | % | |||||||||||||||||||||
| TOTAL | 1,498.7 | 153.0 | 201.8 | 168.3 | 2,021.8 | 1,563.8 | 155.7 | 216.9 | 168.0 | 2,104.4 | -3.9 | % | |||||||||||||||||||||
(1) Excludes water presentations larger than 5.0 Lt ; includes flavored water.
(2) Bulk Water = Still bottled water in 5.0, 19.0 and 20.0 - liter packaging presentations; includes flavored water
Transactions
| YTD 2025 | YTD 2024 | YoY | |||||||||||||||||||||||||
| Sparkling | Water | Stills | Total | Sparkling | Water | Stills | Total | Δ % | |||||||||||||||||||
| Mexico | 3,713.7 | 482.4 | 571.4 | 4,767.5 | 4,097.6 | 516.5 | 573.8 | 5,187.9 | -8.1 | % | |||||||||||||||||
| Guatemala | 658.7 | 39.3 | 47.8 | 745.7 | 642.1 | 34.7 | 49.9 | 726.7 | 2.6 | % | |||||||||||||||||
| CAM South | 528.6 | 29.1 | 112.0 | 669.7 | 527.5 | 30.2 | 112.2 | 669.9 | 0.0 | % | |||||||||||||||||
| Mexico and Central America | 4,901.0 | 550.8 | 731.1 | 6,182.9 | 5,267.2 | 581.4 | 735.9 | 6,584.4 | -6.1 | % | |||||||||||||||||
| Colombia | 916.8 | 194.9 | 93.6 | 1,205.3 | 954.4 | 204.8 | 124.2 | 1,283.4 | -6.1 | % | |||||||||||||||||
| Brazil (3) | 3,176.7 | 360.8 | 558.9 | 4,096.5 | 3,059.1 | 343.6 | 551.8 | 3,954.4 | 3.6 | % | |||||||||||||||||
| Argentina | 312.1 | 65.8 | 68.3 | 446.1 | 286.6 | 58.4 | 48.6 | 393.6 | 13.3 | % | |||||||||||||||||
| Uruguay | 94.6 | 14.6 | 13.6 | 122.9 | 91.0 | 12.7 | 11.2 | 114.9 | 6.9 | % | |||||||||||||||||
| South America | 4,500.2 | 636.1 | 734.4 | 5,870.8 | 4,391.2 | 619.4 | 735.8 | 5,746.4 | 2.2 | % | |||||||||||||||||
| TOTAL | 9,401.2 | 1,186.9 | 1,465.6 | 12,053.7 | 9,658.3 | 1,200.8 | 1,471.6 | 12,330.7 | -2.2 | % | |||||||||||||||||
Revenues
| Expressed in million Mexican Pesos | YTD 2025 | YTD 2024 | Δ % | ||||||
| Mexico | 67,892 | 68,328 | -0.6 | % | |||||
| Guatemala | 8,631 | 7,244 | 19.1 | % | |||||
| CAM South | 8,452 | 7,338 | 15.2 | % | |||||
| Mexico and Central America | 84,975 | 82,911 | 2.5 | % | |||||
| Colombia | 10,748 | 9,668 | 11.2 | % | |||||
| Brazil (4) | 38,668 | 34,279 | 12.8 | % | |||||
| Argentina | 5,716 | 4,730 | 20.8 | % | |||||
| Uruguay | 2,595 | 2,096 | 23.8 | % | |||||
| South America | 57,727 | 50,774 | 13.7 | % | |||||
| TOTAL | 142,703 | 133,685 | 6.7 | % |
(3) Volume and transactions in Brazil do not include beer
(4) Brazil includes beer revenues of Ps. 2,368.3 million for the first six months of 2025 and Ps. 2,529.1 million for the same period of the previous year.
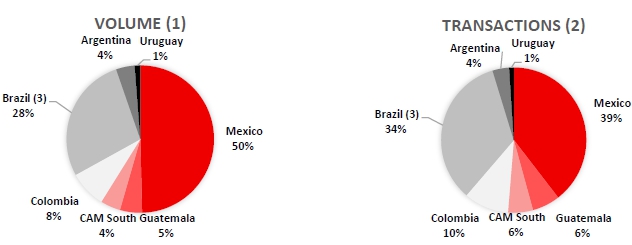
| (1) | Volume is expressed in unit cases. Unit case refers to 192 ounces of finished beverage product (24 eight-ounce servings) and, when applied to soda fountains, refers to the volume of syrup, powders, and concentrate that is required to produce 192 ounces of finished beverage product. |
| (2) | Transactions refers to the number of single units (e.g., a can or a bottle) sold, regardless of their size or volume or whether they are sold individually or in multipacks, except for soda fountains, which represent multiple transactions based on a standard 12 oz. serving. |
| Coca-Cola FEMSA Reports 2Q25 Results Información de uso interno | Page 16 of 17 | |
| July 23, 2025 |
COCA-COLA FEMSA
MACROECONOMIC INFORMATION
Inflation (1)
| LTM | 2Q25 | YTD | ||||||||||
| Mexico | 4.51 | % | 1.41 | % | 1.67 | % | ||||||
| Colombia | 5.08 | % | 1.51 | % | 3.84 | % | ||||||
| Brasil | 5.35 | % | 1.15 | % | 2.97 | % | ||||||
| Argentina | 39.63 | % | 7.64 | % | 15.61 | % | ||||||
| Costa Rica | 0.02 | % | -1.23 | % | -0.70 | % | ||||||
| Panama | -0.49 | % | 0.09 | % | 0.79 | % | ||||||
| Guatemala | 1.51 | % | 1.47 | % | 1.00 | % | ||||||
| Nicaragua | 1.12 | % | 0.00 | % | 1.28 | % | ||||||
| Uruguay | 5.16 | % | 0.91 | % | 3.14 | % |
(1) Source: inflation estimated by the company based on historic publications from the Central Bank of each country.
Average Exchange Rates for each period (2)
| Quarterly Exchange Rate (Local Currency per USD) | Year to Date Exchange Rate (Local Currency per USD) | |||||||||||||||||
| 2Q25 | 2Q24 | Δ % | YTD 25 | YTD 24 | Δ % | |||||||||||||
| México | 19.55 | 17.21 | 13.6 | % | 19.98 | 18.30 | 9.2 | % | ||||||||||
| Colombia | 4,197.35 | 3,928.59 | 6.8 | % | 4,192.97 | 4,074.44 | 2.9 | % | ||||||||||
| Brasil | 5.67 | 5.22 | 8.6 | % | 5.76 | 5.39 | 6.8 | % | ||||||||||
| Argentina | 1151.04 | 886.47 | 29.8 | % | 1104.02 | 916.29 | 20.5 | % | ||||||||||
| Costa Rica | 508.77 | 516.43 | -1.5 | % | 508.22 | 518.22 | -1.9 | % | ||||||||||
| Panama | 1.00 | 1.00 | 0.0 | % | 1.00 | 1.00 | 0.0 | % | ||||||||||
| Guatemala | 7.69 | 7.77 | -1.1 | % | 7.70 | 7.76 | -0.8 | % | ||||||||||
| Nicaragua | 36.62 | 36.62 | 0.0 | % | 36.62 | 36.62 | 0.0 | % | ||||||||||
| Uruguay | 41.61 | 38.75 | 7.4 | % | 42.32 | 40.21 | 5.2 | % | ||||||||||
End-of-period Exchange Rates
| Closing Exchange Rate (Local Currency per USD) | Closing Exchange Rate (Local Currency per USD) | |||||||||||||||||
| Jun-25 | Jun-24 | Δ % | Mar-25 | Mar-24 | Δ % | |||||||||||||
| México | 18.89 | 18.38 | 2.8 | % | 20.32 | 16.68 | 21.8 | % | ||||||||||
| Colombia | 4,069.67 | 4,148.04 | -1.9 | % | 4,192.57 | 3,842.30 | 9.1 | % | ||||||||||
| Brasil | 5.46 | 5.56 | -1.8 | % | 5.74 | 5.00 | 14.9 | % | ||||||||||
| Argentina | 1,205.00 | 912.00 | 32.1 | % | 1,074.00 | 858.00 | 25.2 | % | ||||||||||
| Costa Rica | 508.28 | 528.80 | -3.9 | % | 504.21 | 506.60 | -0.5 | % | ||||||||||
| Panama | 1.00 | 1.00 | 0.0 | % | 1.00 | 1.00 | 0.0 | % | ||||||||||
| Guatemala | 7.68 | 7.77 | -1.1 | % | 7.71 | 7.79 | -1.0 | % | ||||||||||
| Nicaragua | 36.62 | 36.62 | 0.0 | % | 36.62 | 36.62 | 0.0 | % | ||||||||||
| Uruguay | 39.55 | 39.99 | -1.1 | % | 42.13 | 37.55 | 12.2 | % | ||||||||||
(2) Average exchange rate for each period computed with the average exchange rate of each month.
| Coca-Cola FEMSA Reports 2Q25 Results Información de uso interno | Page 17 of 17 | |
| July 23, 2025 |