Operator
Hello, everyone, and welcome to GBDC's earnings call for the fiscal quarter ended June 30th, 2026. Before we begin, I'd like to take a moment to remind our listeners that remarks made during this call may contain forward-looking statements within the meaning of the Private Securities Litigation Reform Act of 1995. Statements other than statements of historical facts made during this call may constitute forward-looking statements and are not guarantees of future performance or results and involve a number of risks and uncertainties. Actual results may differ materially from those in the forward-looking statements as a result of a number of factors, including those described from time to time in GBDC's SEC filings. For materials we intend to refer to on today's earnings call, please visit the Investor Resources tab on the homepage of our website, which is www.golubcapitalbdc.com, and click on the Events and Presentations link. Our earnings release is also available on our website in the Investor Resources section. As a reminder, this call is being recorded. With that, I'm pleased to turn the call over to David Golub, Chief Executive Officer of GBDC.
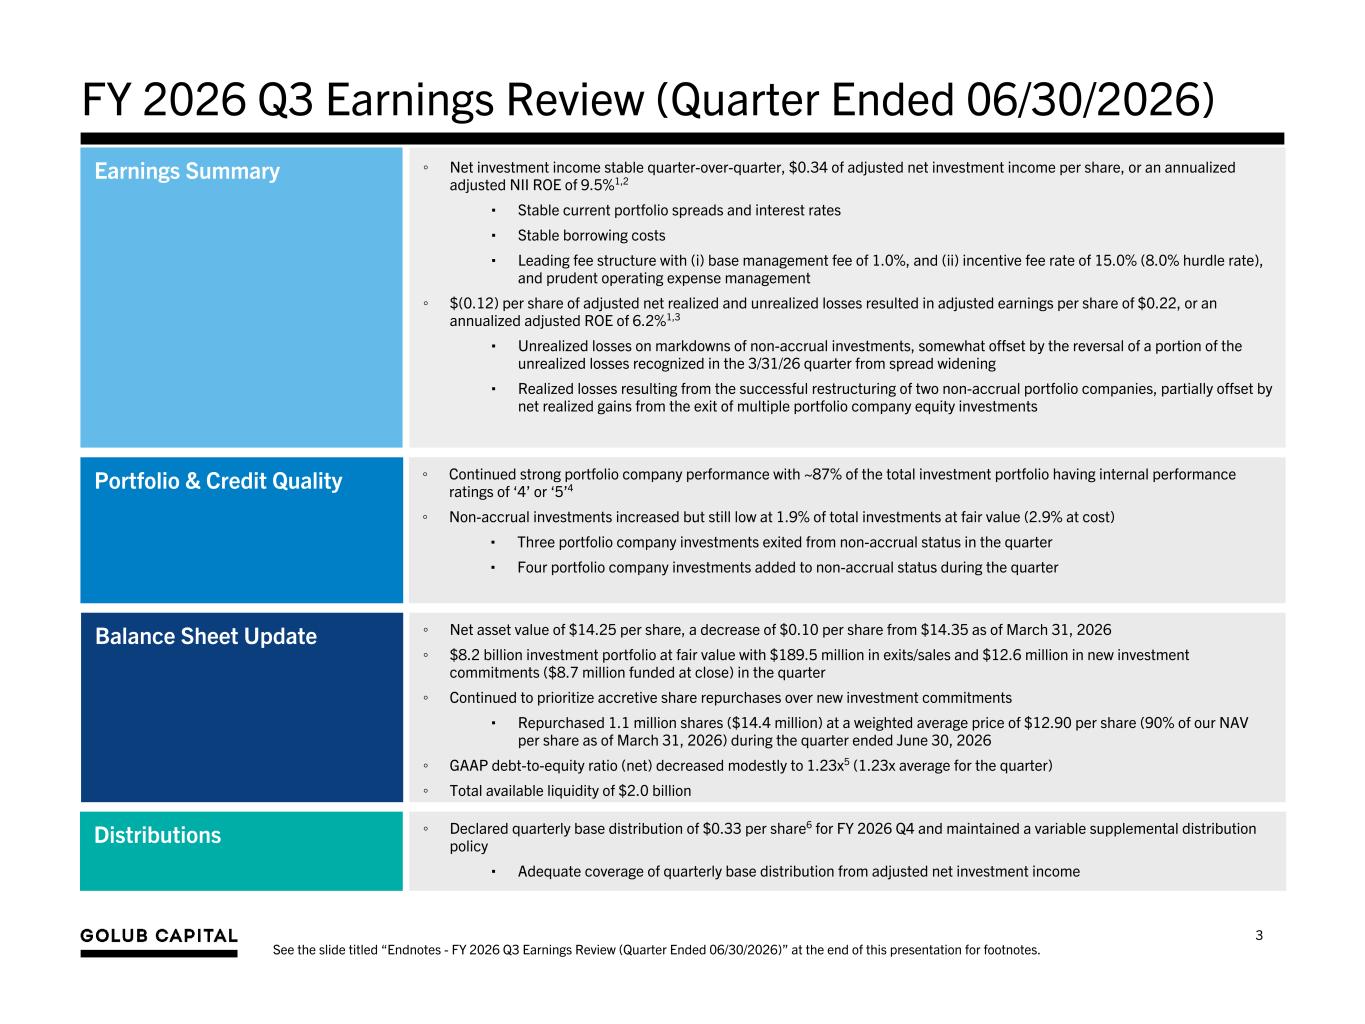
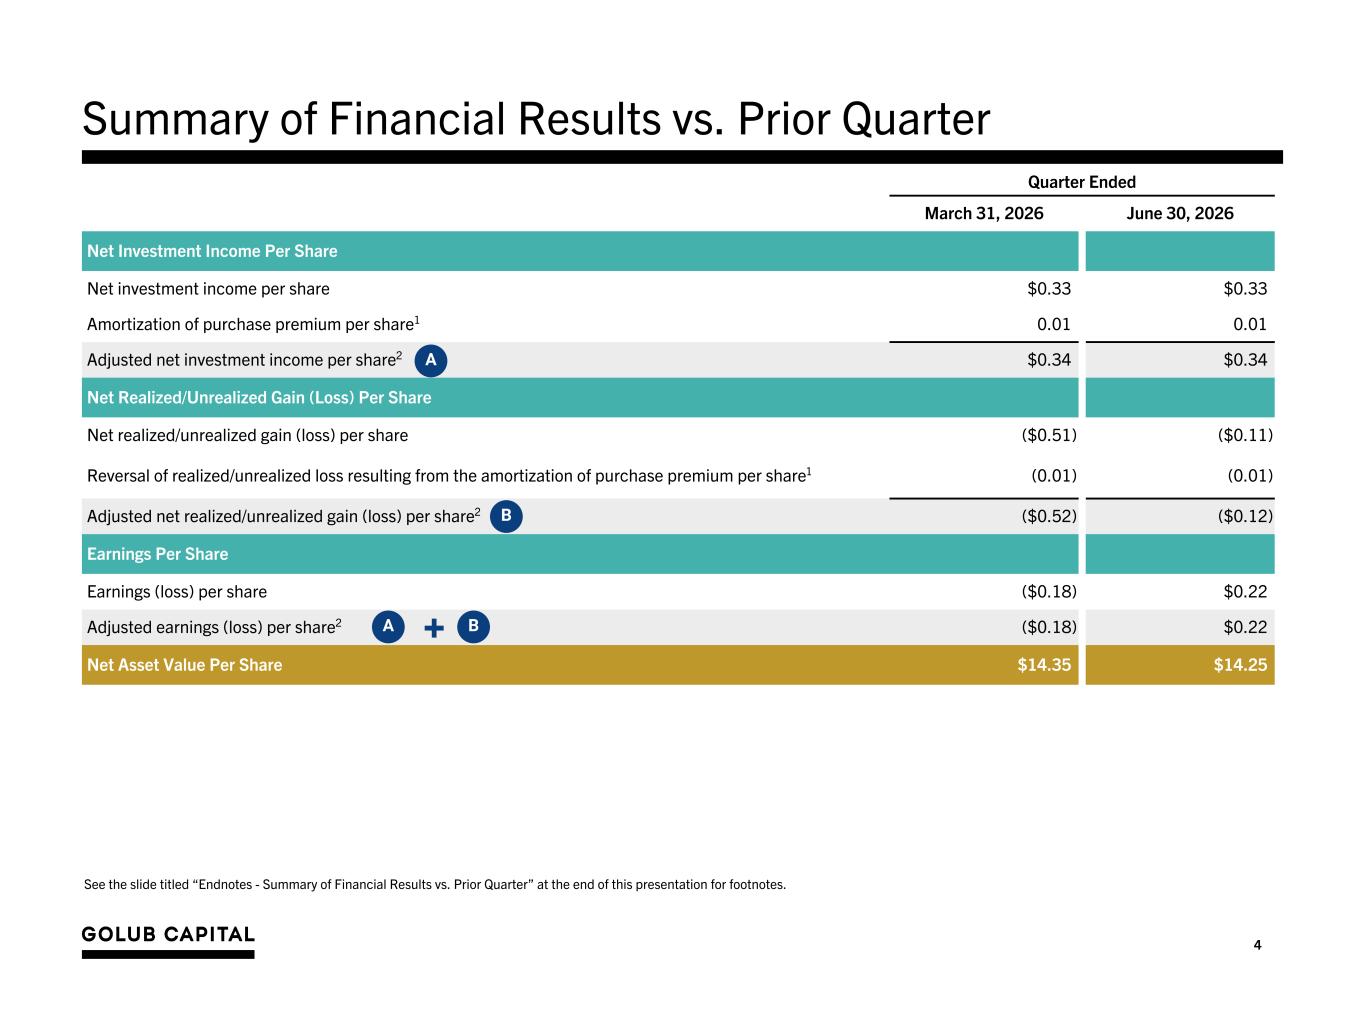
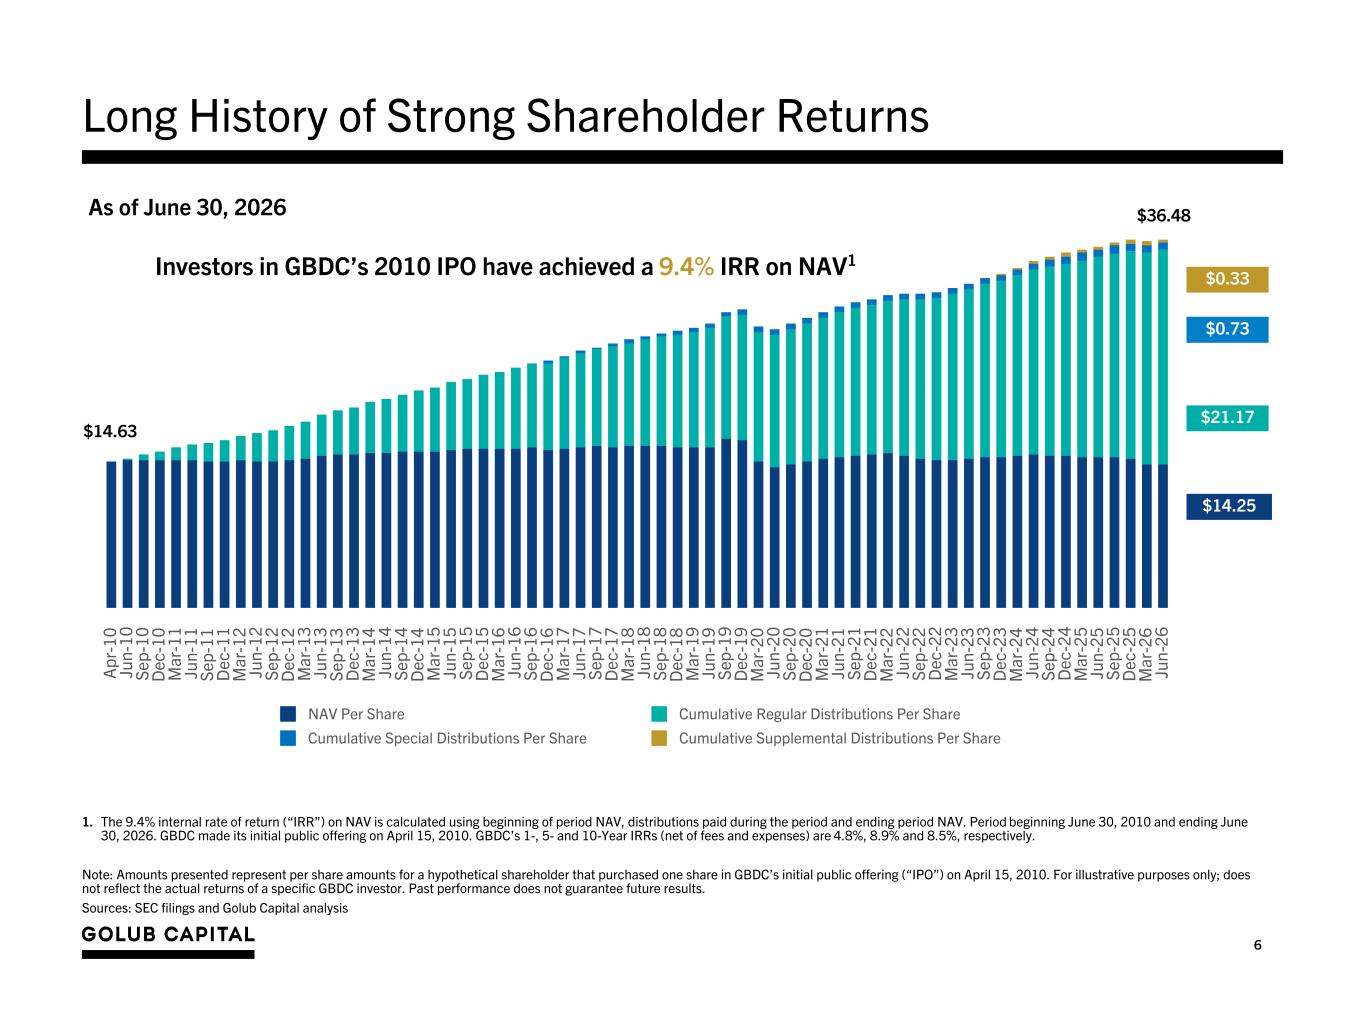
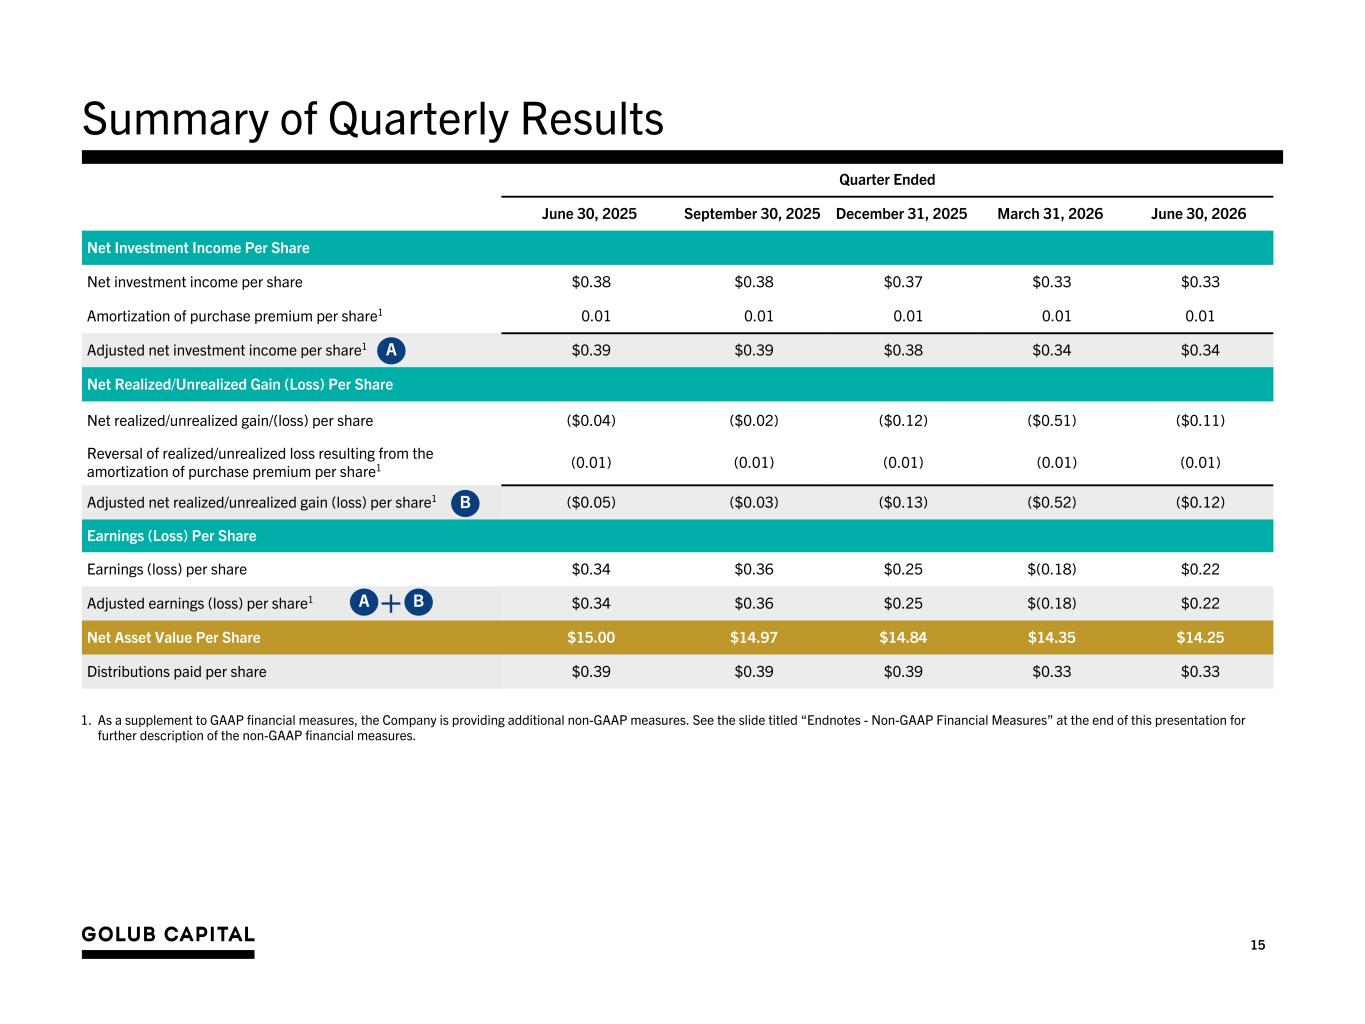
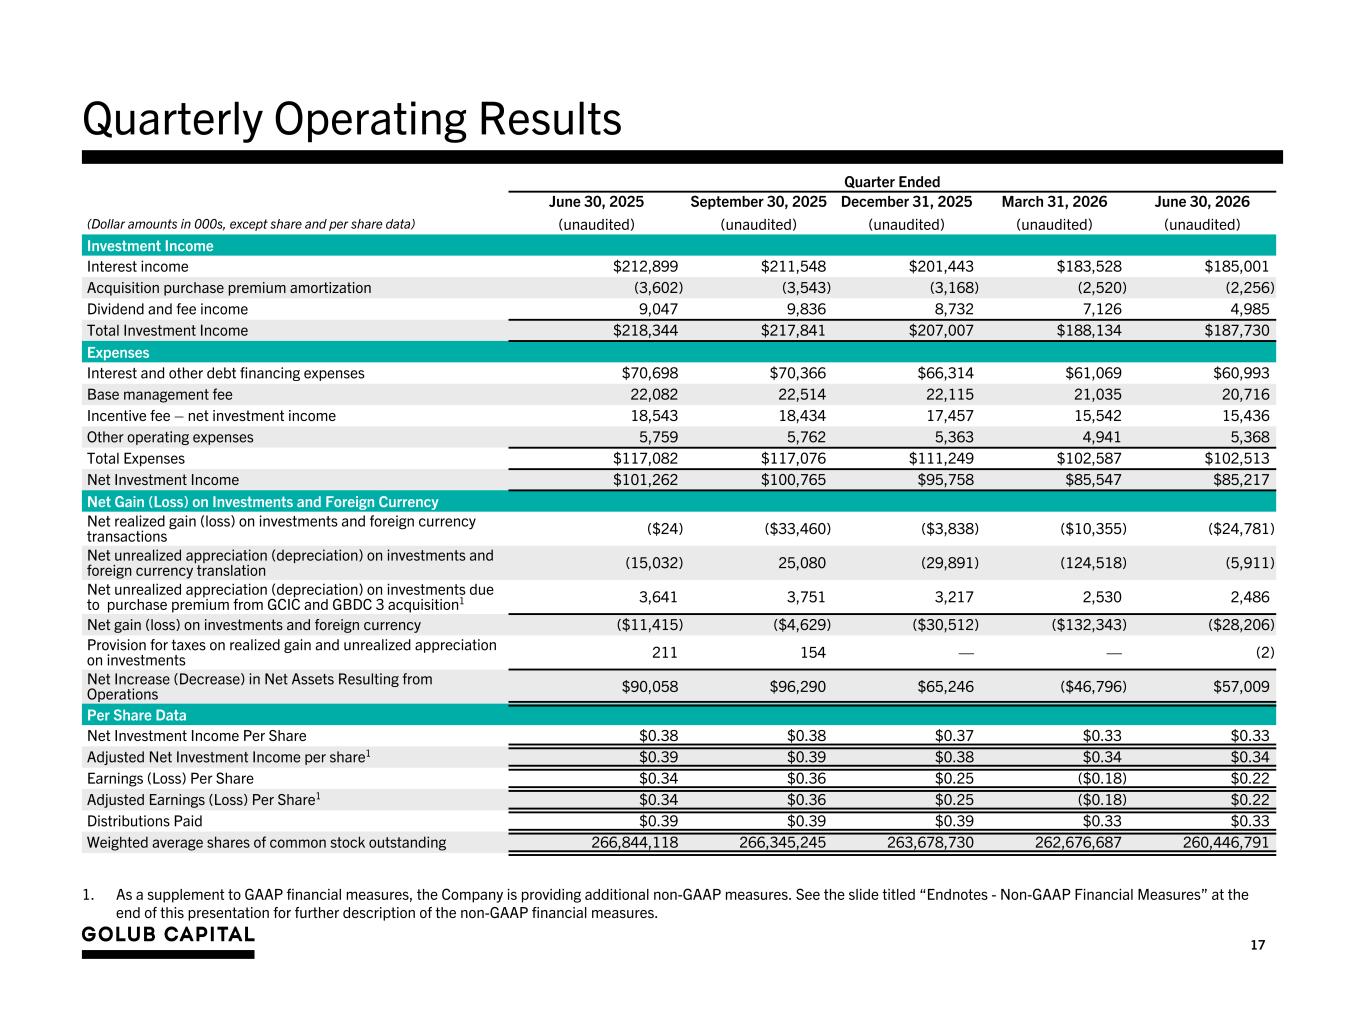
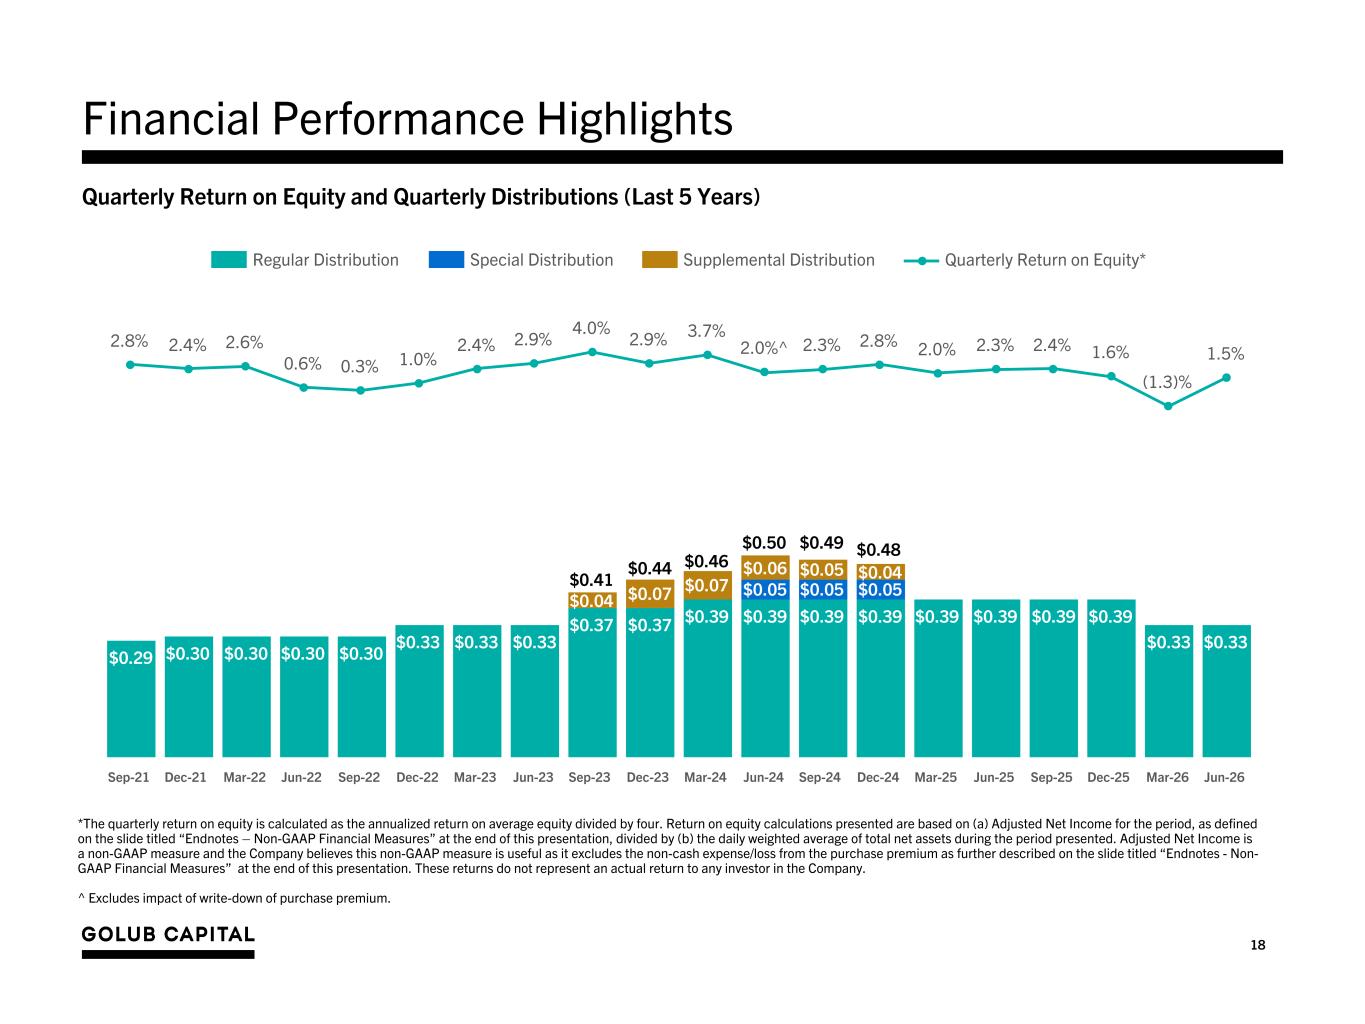
Hello, everybody, and thanks for joining us today. This is David Golub, and I'm joined by Tim Topics, our Chief Operating Officer, Rob Tucherer, a Senior Managing Director and Officer of GBDC, and Chris Erickson, our Chief Financial Officer. For those of you who are new to GBDC, our investment strategies focused on providing first-lean senior-secured loans to healthy, resilient middle-market companies, companies that are backed by strong, partnership-oriented private equity sponsors. Yesterday, we issued our earnings press release for the fiscal quarter ended June 30th, and we posted an earnings presentation on our website. We'll be referring to this presentation during today's call. I'm going to start with headlines and a brief summary of performance for the quarter. Then Tim, Rob, and Chris are going to walk you through our operating and financial performance in more detail. Finally, I'll wrap up with some observations on current market conditions and our outlook, and we'll take questions. So the headline for the quarter is this, GBDC's performance was much better than the last quarter, not as good as we'd like, and better than it looks. So that's a lot. That's a three-parter. so let me take a few moments to unpack each of the three parts of that headline. First, GBDC's performance was much better than last quarter. That's pretty clear from the data. Adjusted net income per share was $0.22. That compares to an $0.18 per share loss last quarter, and it translates into an annualized adjusted ROE of 6.2%. The key driver of the improvement quarter over quarter was a decrease in adjusted net realized and unrealized losses. Such losses went from $0.52 per share last quarter to $0.12 per share this quarter. At the same time, adjusted NII per share remained solid and consistent with last quarter at $0.34 per share, which translates into an adjusted NII ROE of 9.5%. Finally, GBDC paid a $0.33 per share distribution. Now, for those of you who are familiar with GBDC, you can see from the data I just described why the quarter was not as good as we'd like. GBDC's delivered a 9.4% net IRR on NAV since our IPO in 2010. If we compare that to GBDC's annualized adjusted ROE for the quarter of 6.2%, it's clearly a few points below GBDC's 16-year-plus average. Now, you've heard us talk for several quarters about how we're in a credit cycle, how we're in a period that's marked by sustained elevated credit stress. We've also talked, including on last quarter's call, about our view that what we're seeing fits a pattern. It's a pattern that when things shift from a borrower-friendly environment to a more lender-friendly one, we tend to see a period of bumpiness in results. So I'm not entirely surprised to see a degree of bumpiness in GBDC's results for the quarter. And my expectation is that we're going to see a large degree of bumpiness across the BDC industry as results come in. That all said, some quarters feel worse than the numbers and some quarters feel better than the numbers. This quarter feels to me better than the numbers. Why do I think that? Well, GBDC's net realized and unrealized losses for the quarter, the 12 cents per share of loss, they arose primarily from a small number of junior debt and equity positions and not from the core debt portfolio. We saw a lot of stability in the core debt portfolio. This is important because our experience is that the kinds of write-downs that we had, they're typically one-offs. Put differently, I'm encouraged by the health and resilience of the vast majority of GBDC's portfolio. I'll have more to say about that in my outlook, in my closing remarks. For now, I'm going to let Tim, Rob, and Chris go into the quarter in more detail. Tim? Thanks, David.
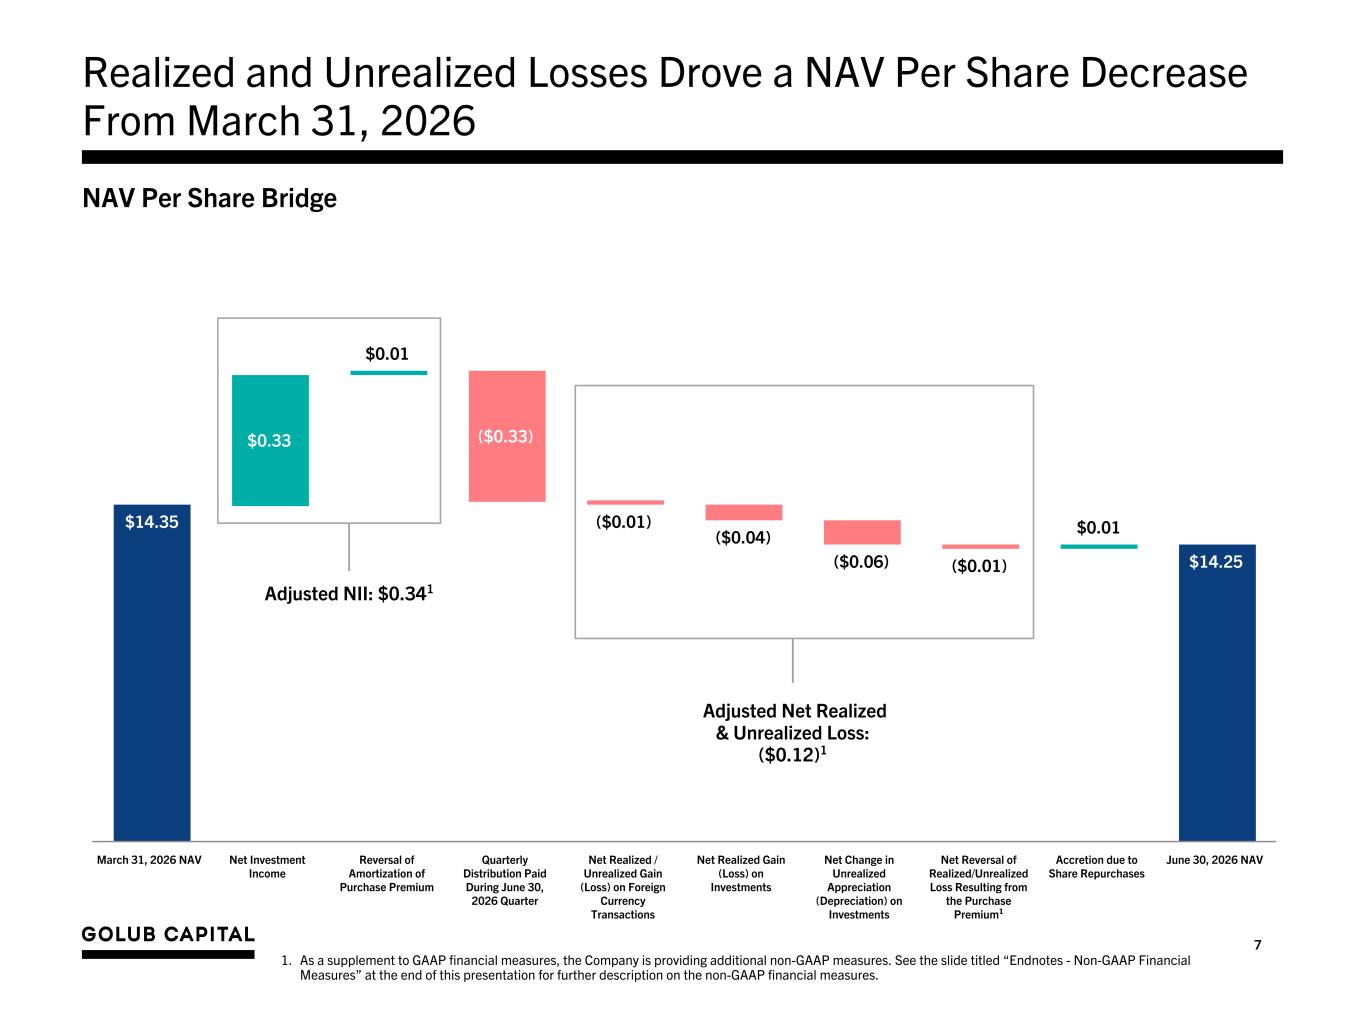
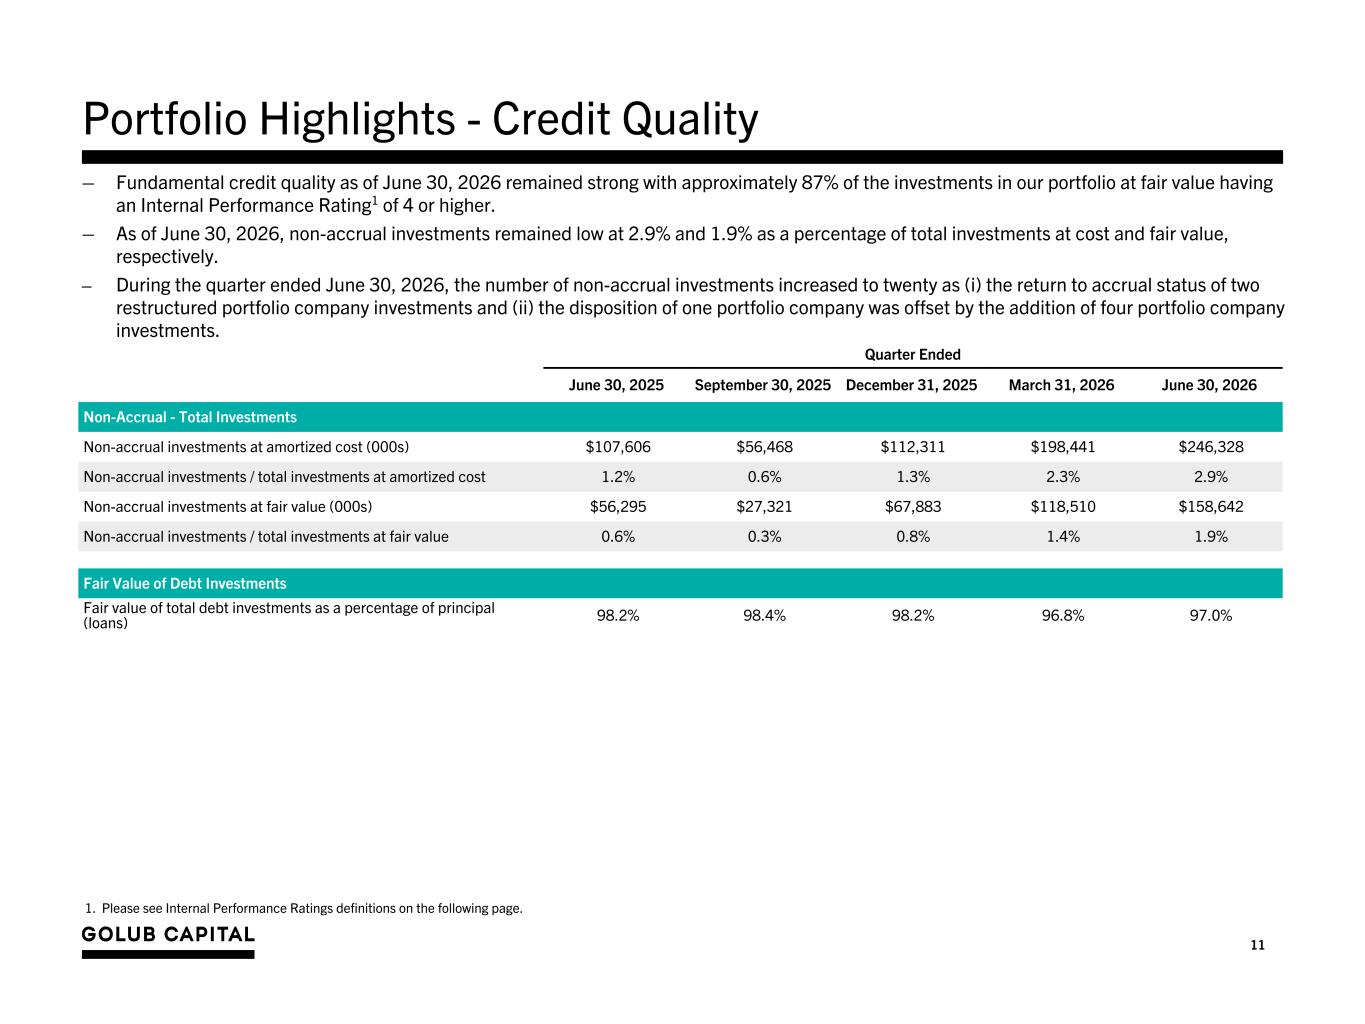
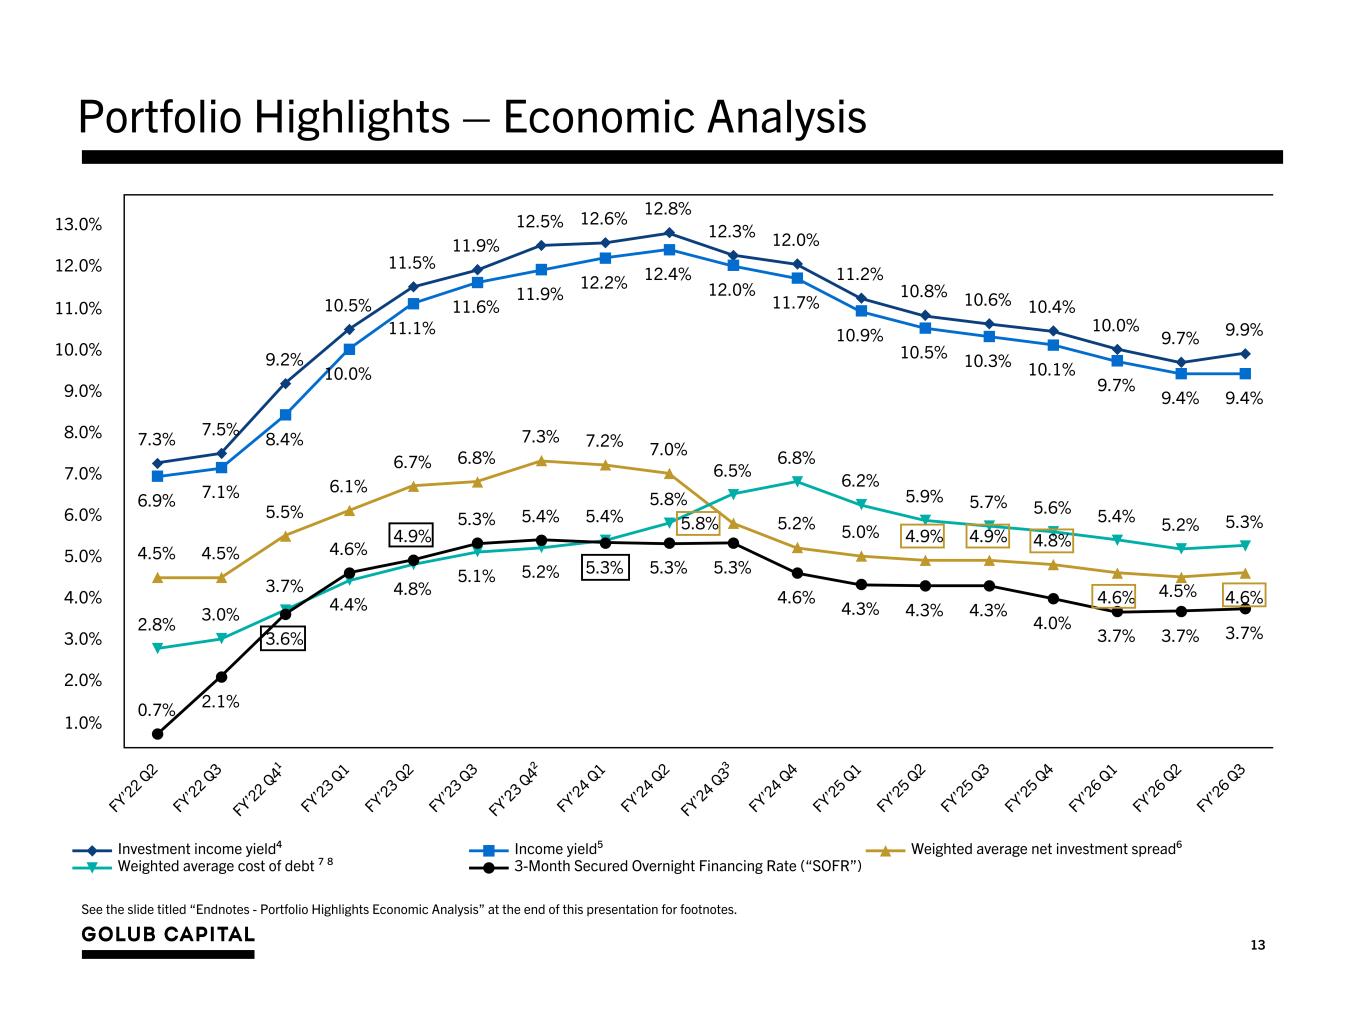
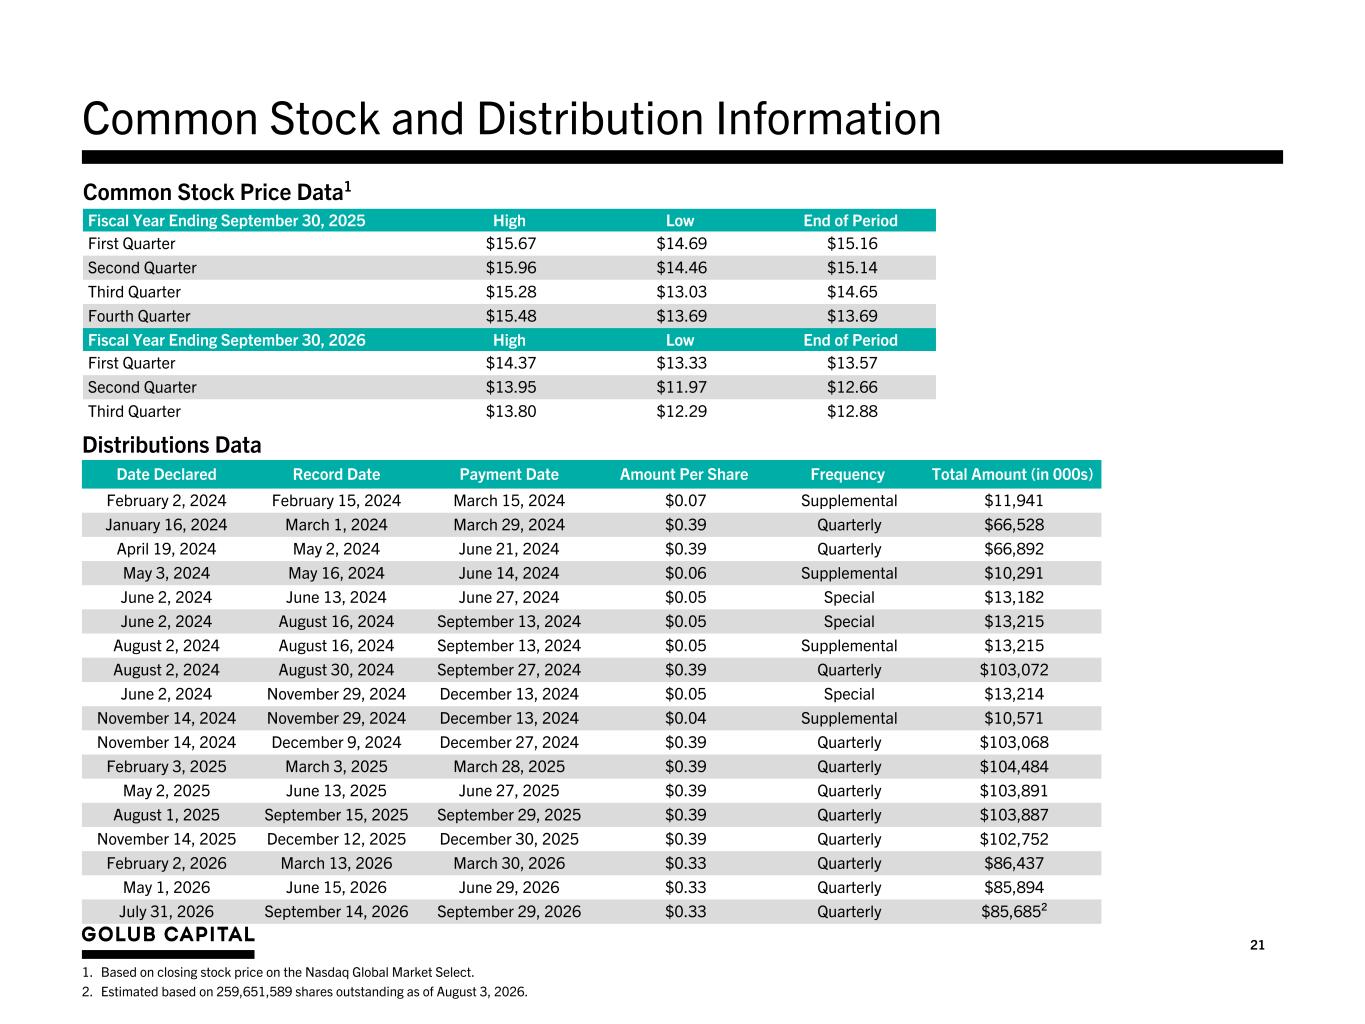
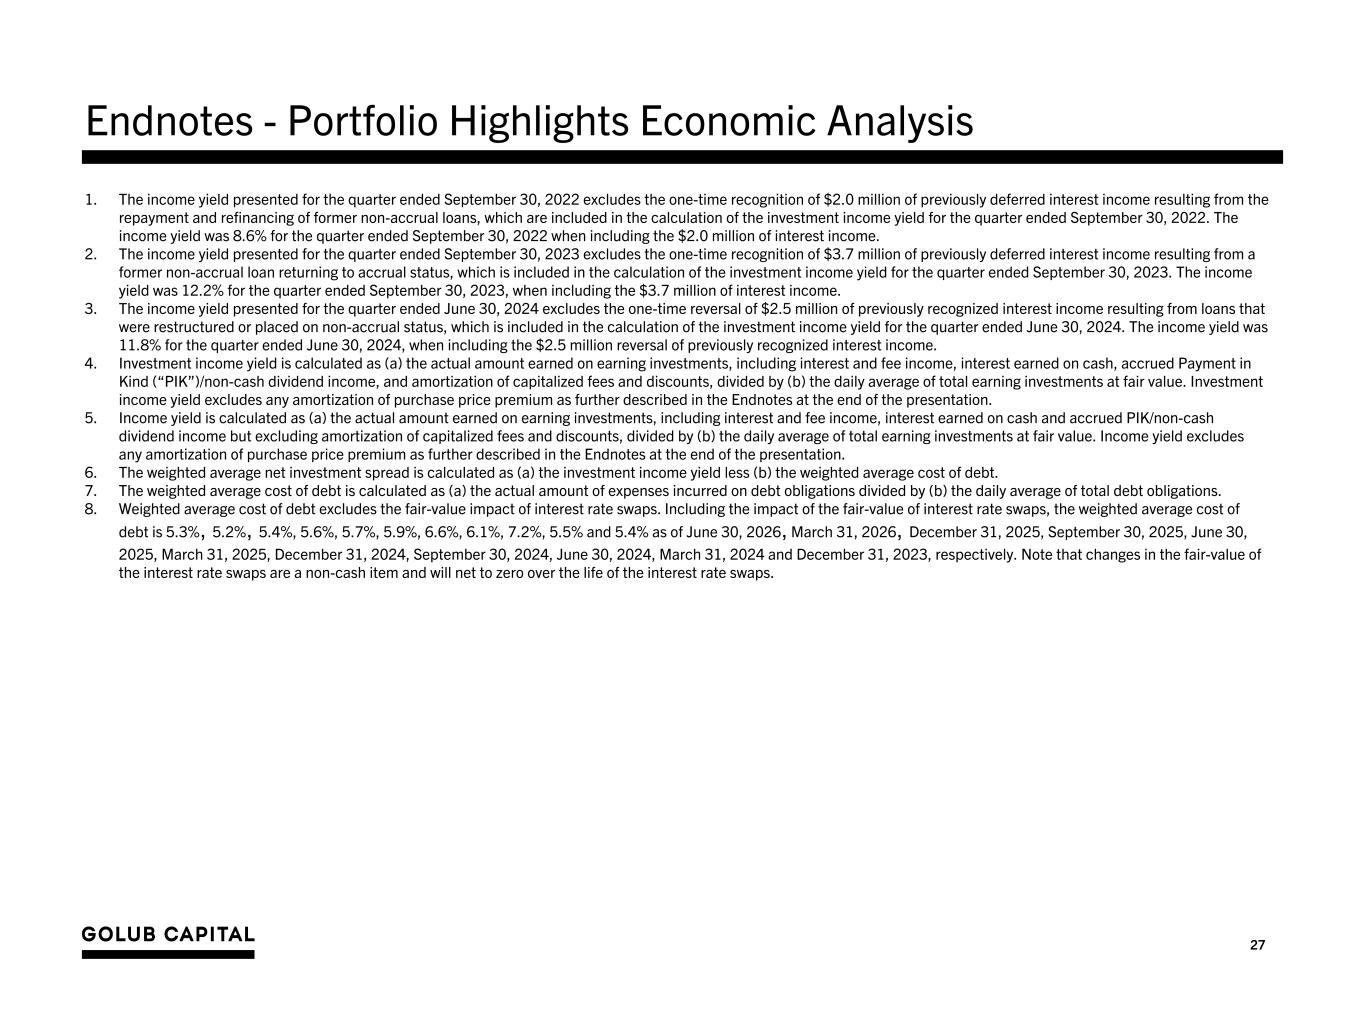
Let's start on slide three and walk through the drivers of GBDC's earnings in the quarter. I'll start with the drivers of our $0.34 per share of adjusted net investment income, and then unpack credit gains and losses that contributed to $0.22 per share of adjusted earnings. Let me start with the drivers of net investment income. There were three in the quarter. Number one, improving investment income yield. Number two, stable borrowing costs. And number three, prudent expense management. Let's go through each of these in turn. First, on investment income yield, it was 9.9% annualized, which increased modestly quarter over quarter. It was supported by a stable weighted average spread in the portfolio, consistent base rates throughout the quarter, and to a lesser extent, a modest amount of accelerated fee recognition and discount accretion tied to a handful of payoffs. On number two, borrowing costs held steady at 5.3% annualized, one of the lowest borrowing costs in the listed BDC peer group and a real competitive advantage for GBDC and its investors. And then number three, operating expenses remain low. GBDC continues to benefit from its gold standard fee structure. There's nothing new to call out here. It's just continued efficiency. Now let's unpack the drivers of GBDC's $0.22 per share of adjusted earnings. Overall credit performance remains solid. Approximately 87% of our portfolio at fair value remains in our highest performing internal rating categories. And investments on non-accrual status remained low, at just 1.9% of the portfolio at fair value. That's a level well below the average of our listed BDC peers. We did, however, recognize $0.12 per share of adjusted net realized and unrealized losses in the quarter. Here's how that breaks down. Approximately $0.08 per share of unrealized losses from markdowns on junior debt and equity investments in two portfolio companies that were taken to non-accrual status or were on a non-accrual status in the quarter. Those losses were somewhat offset by unrealized gains due to a small degree of reversal of last quarter's spread-driven unrealized losses. We recognized approximately four cents per share of net realized losses. This was driven primarily from the successful restructuring of RWAM Holco and Dolphys Meag in the quarter. Importantly, the realized losses resulting from these restructurings were more than fully offset by the reversal of unrealized losses in the same investments. And then lastly, and on a positive note, we recognize $4 million of net realized gains on the exit of equity investments in a couple portfolio companies. As a reminder, GBDC will in certain instances co-invest in the equity of high-performing borrowers. And the liquidation of these equity investments, which historically has typically happened at a gain, is one of the factors that have contributed to GBDC's top quartile credit performance since IPO. Now, regarding balance sheet changes and distributions in the quarter, NAV per share declined slightly to $14.25 per share. We racked up the quarter with net debt to equity of 1.23 times. That was down slightly from the prior quarter, while average leverage throughout the quarter was also 1.23 times. Total distributions paid in the quarter were 33 cents per share, and our board of directors declared a 33 cent per share distribution for the fourth fiscal quarter of 2026. We also kept up our opportunistic share repurchase program during the quarter. The company bought back 1.1 million shares at a weighted average price of 12.90 per share for an approximate 10% discount to our March 31, 2026 net asset value. In addition, the Gallup Capital Rabbi Trust purchased approximately $31 million, or 2.4 million shares of GBDC during the quarter for incentive compensation purposes. This brought purchases of GBDC shares by the trust to $70 million over the last 12 months. Gallup Capital affiliates now hold about 8% of GBDC shares outstanding. That's an indication of a high degree of alignment between Gallup Capital and GBDC investors. Now turning to slide 7, here we've laid out the map for share bridge quarter over quarter. You can see how the earnings drivers that I just walked through translate into GBDC's June 30, 2026 net asset value per share of $14.25. Adjusted NII per share of $0.34 fully covered the $0.33 per share distribution that was paid out during the quarter. Adjusted net realized and unrealized losses were $0.12 per share, and share of purchases added a penny per share of nav accretion put it all together and you get a net asset value that moved down modestly from 1435 to 1425 in the quarter so that's the earnings summary for the quarter with that let me hand things over to rob to take us through our investing activity and portfolio in more detail rob thanks tim i will now highlight our third fiscal quarter investment activity and provide some additional context on portfolio performance Turning to slide eight, in the second calendar quarter of 2026, at the Gallup Capital level, our team originated nearly $3 billion of new investment commitments.
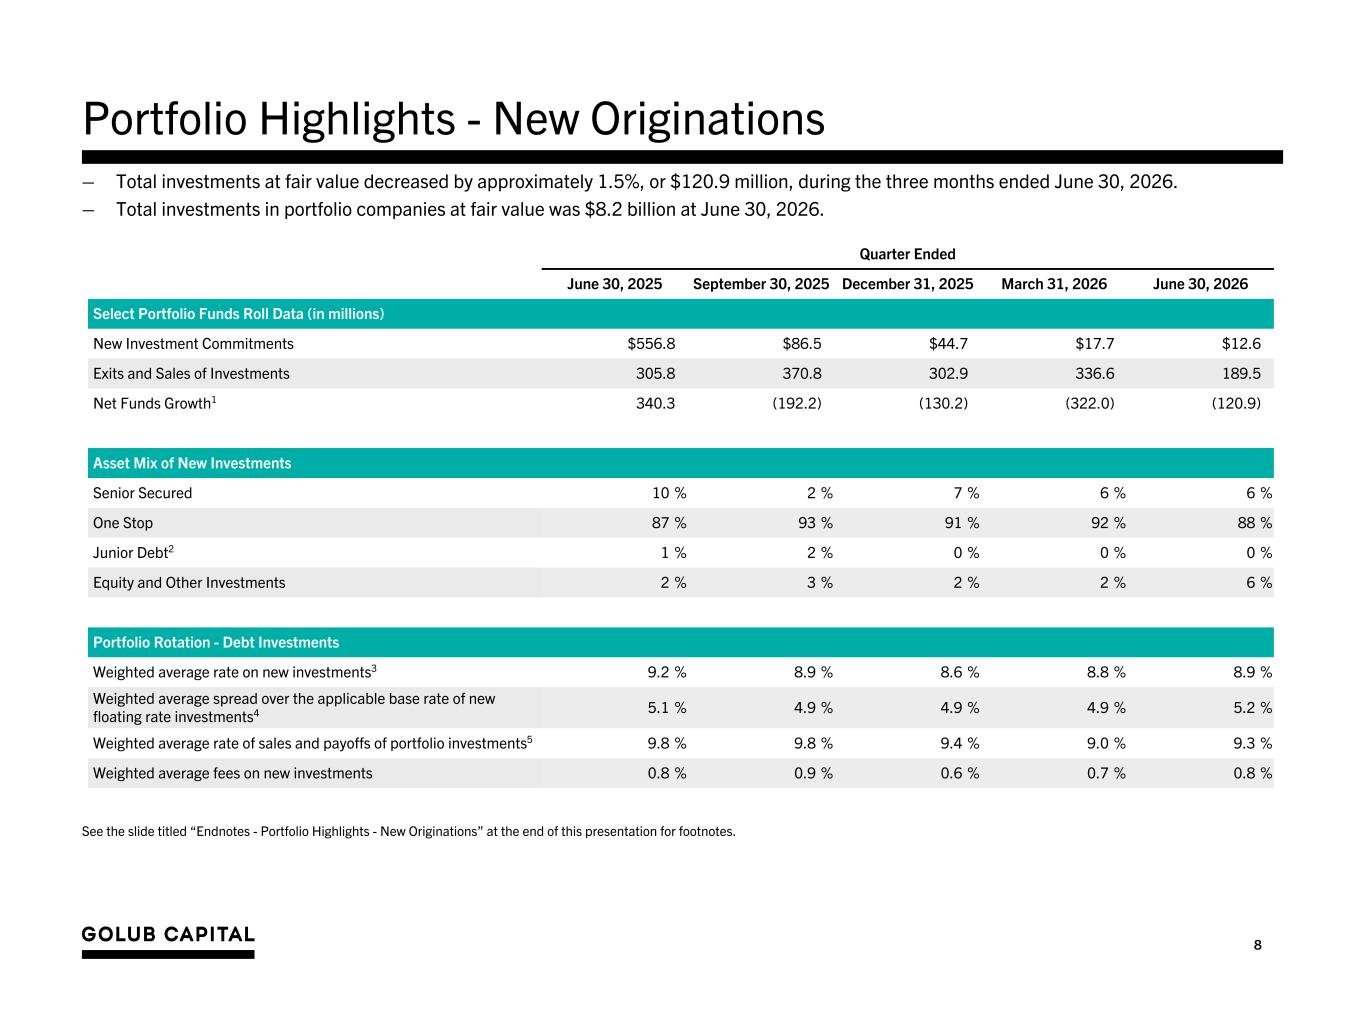
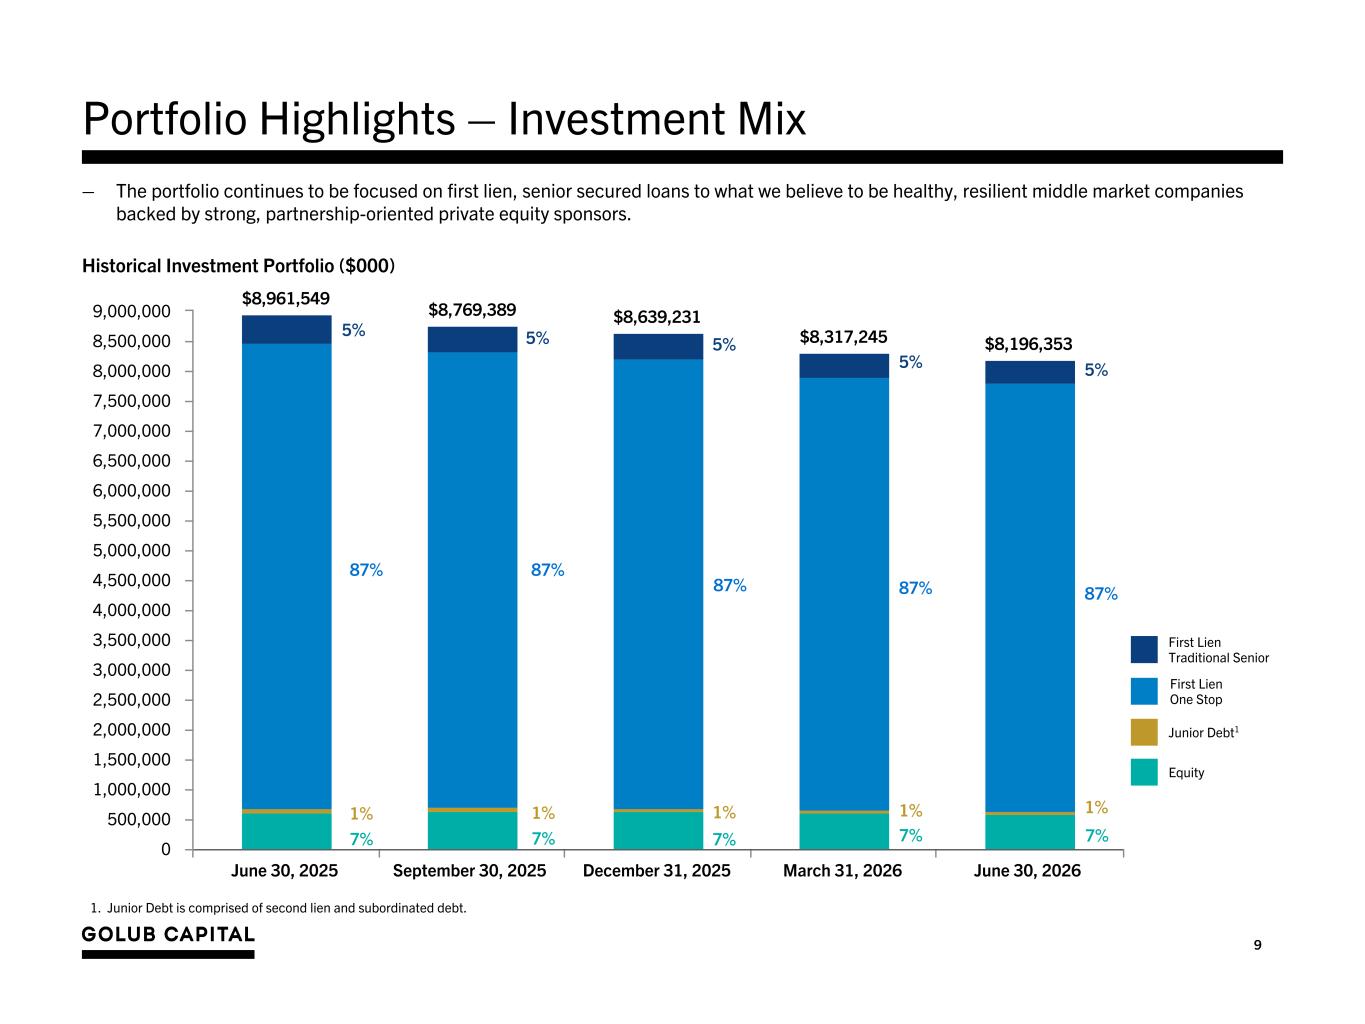
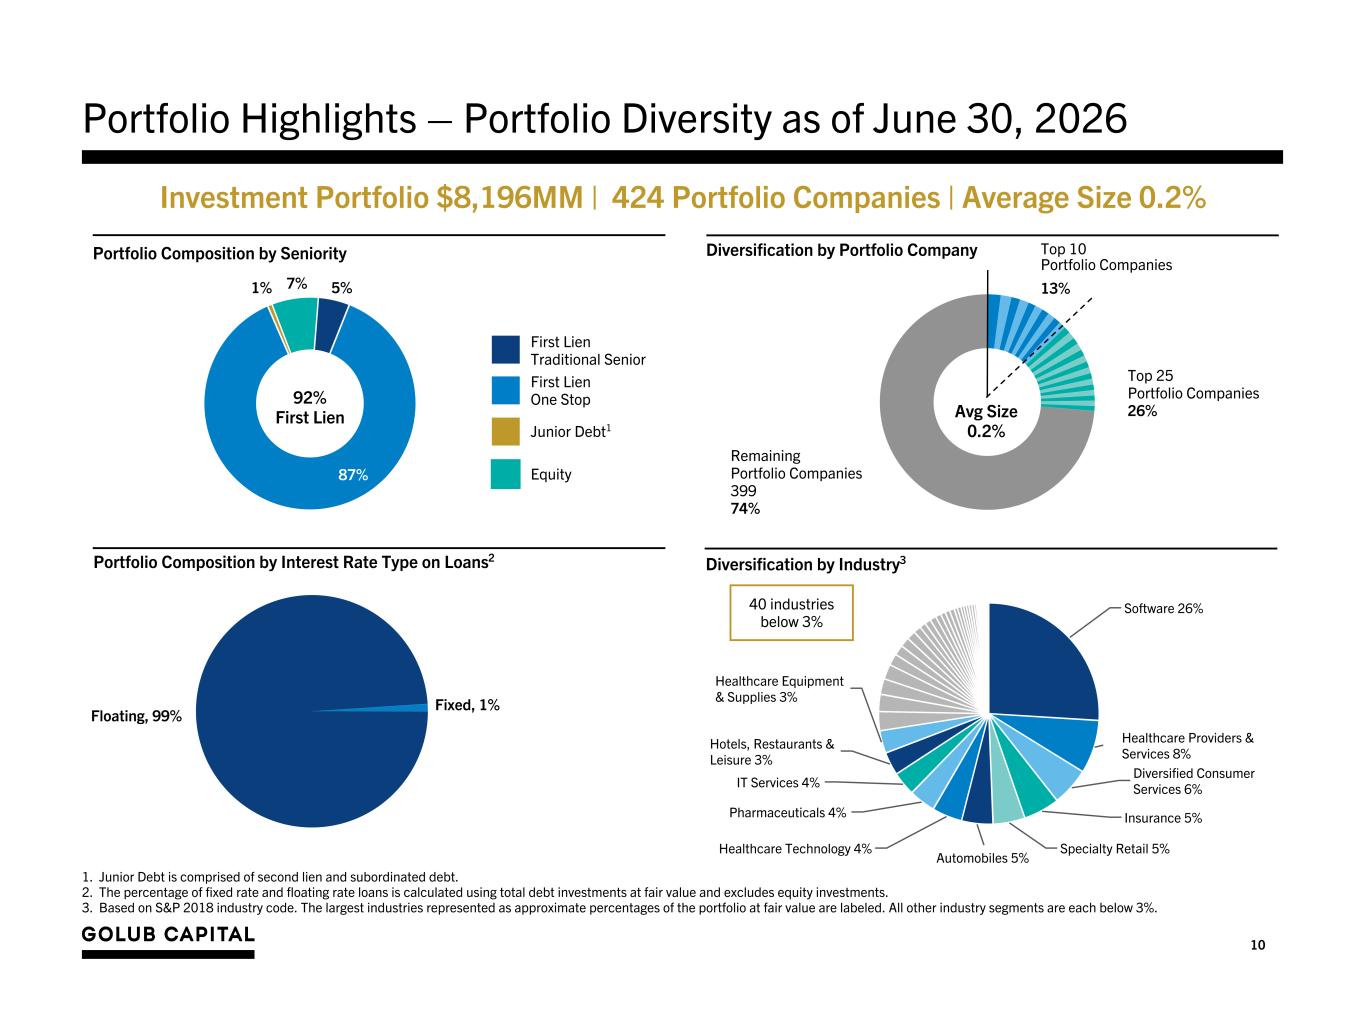
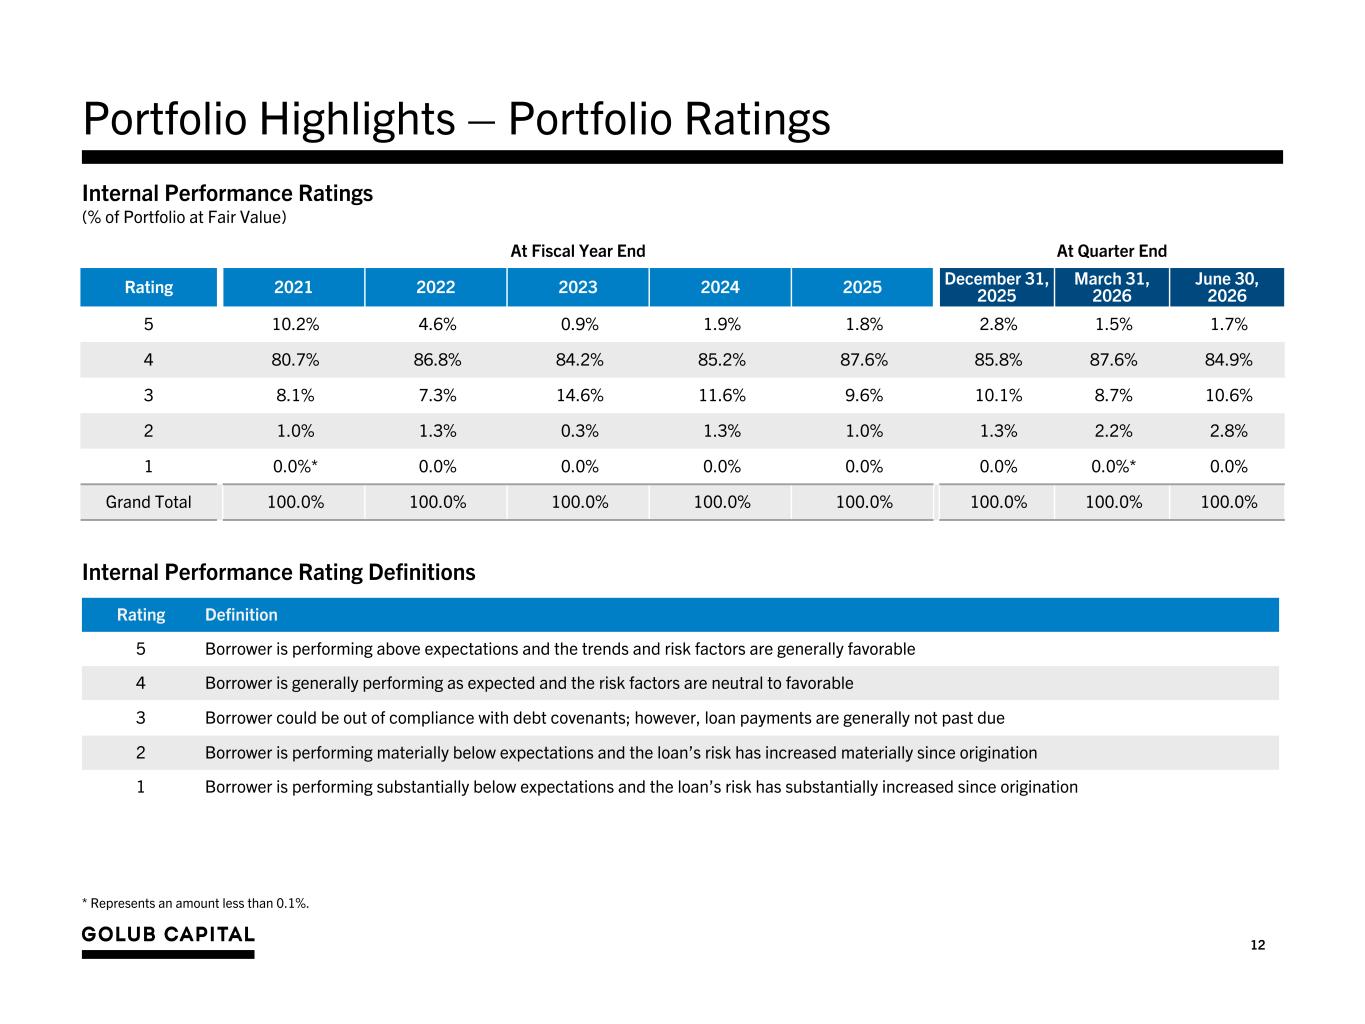
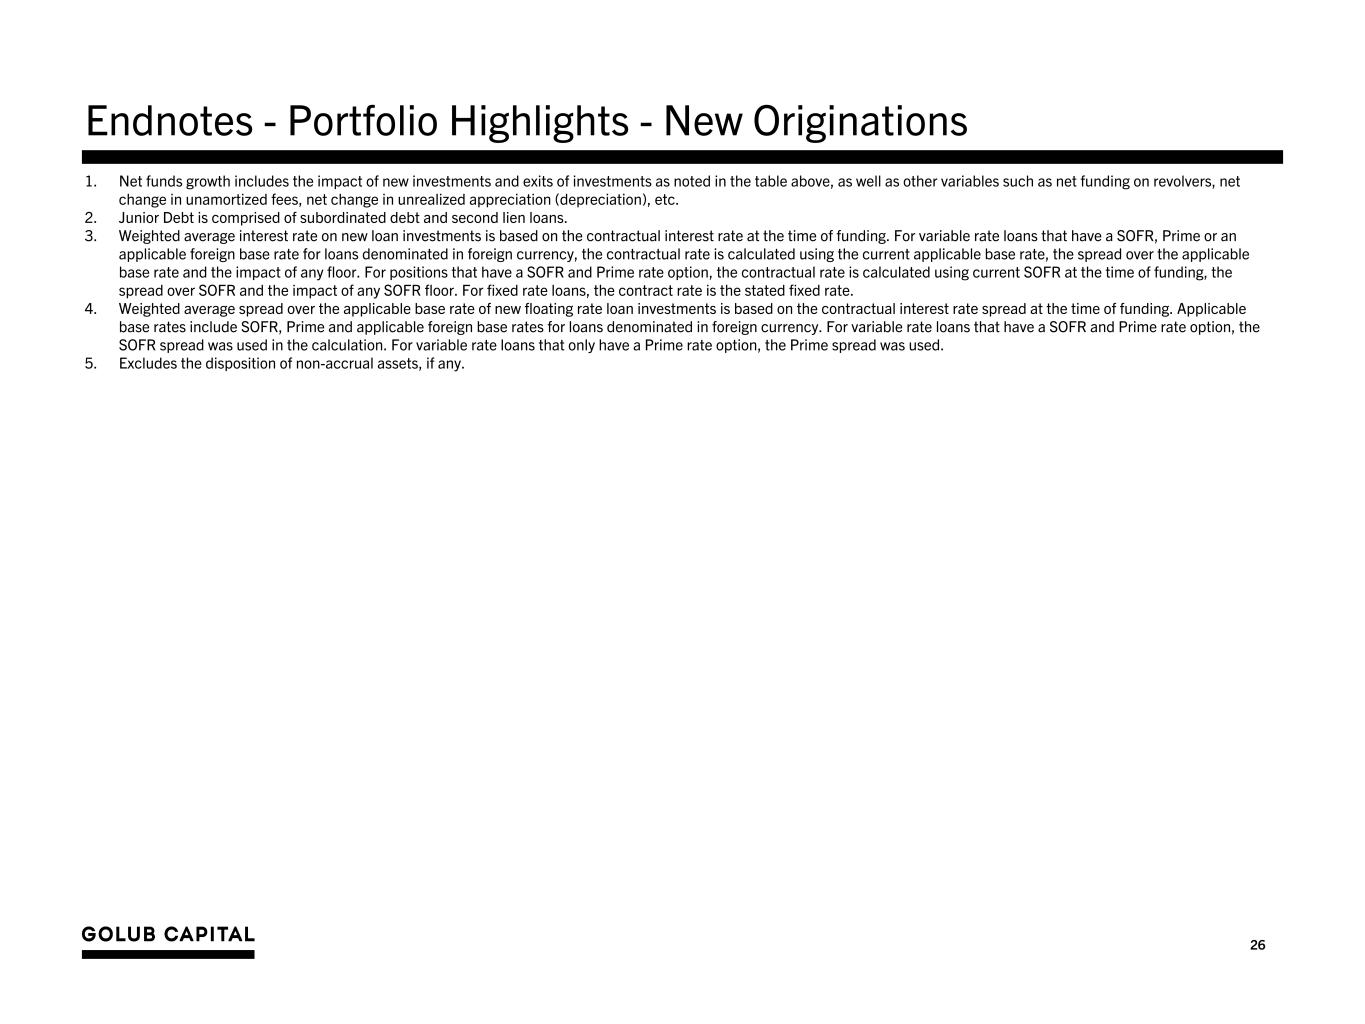
GBDC participated in these new originations on a limited basis, with $13 million in new investment commitments in the quarter, given slow repayments and our desire to focus on accretive share repurchases. We remained highly selective and conservative in our underwriting, closing on just 1.5% of deals reviewed in the quarter at a weighted average loan-to-value of approximately 45%. Existing sponsor relationships and portfolio company incumbencies accounted for approximately 54% of our origination volume, and we made loans to nine new borrowers. Further, GBDC continued to participate in add-on investment commitments to existing portfolio companies via transactions in the secondary market. Leveraging the capabilities of our capital markets desk, we acquired incremental interest in existing loans to high-quality borrowers at discounts to fair value, which we believe will prove accretive to GBDC's returns over time. We continue to leverage our scale-to-lead deals, acting as the sole or lead lender on 99% of our transactions in the quarter. About 78% of our new origination volume in the third fiscal quarter supported M&A-driven transactions, such as LBOs and add-on acquisitions. which builds on the momentum we saw last quarter and highlights our ability to benefit from the early signs of a more active and M&A-driven market environment. Of GBDC's $13 million in new investment commitments in the quarter, 94% were in senior secure debt investments. New investments carried a total weighted average rate of 8.9%, which included a 5.2% weighted average spread. Turning to slide 10, as of June 30, 2026, GBDC's $8.2 billion portfolio remains well diversified across 424 different borrowers. The granularity of our portfolio can also be seen in our small position sizes. Each of our investments represent less than 0.2% of the overall portfolio on average, and our top 10 investments comprise just 13% of the overall portfolio, which represents a concentration level that is less than half of the average of our listed BDC peers. GBDC's portfolio is also diversified by industry subsector, with 51 individual subsectors represented. Investments in software portfolio companies continue to represent our single largest industry subsector exposure at 26%. I mentioned on last quarter's earnings call that we plan to report back on additional work we were performing to assess the impact of AI on our software holdings. You will recall that we are experts in software lending, having completed more than 1,000 software loans representing over $90 billion in principle over the last 20 years, with a default rate averaging about five basis points per year. I'm pleased to report that we completed a full re-underwrite of our current software portfolio this last quarter. I'm going to outline the key takeaways. However, there will be more detail in an update to our quarterly investor presentation which we plan to publish later this month our credit by credit re-underwrite was multi-factored it included evaluating revenue model product criticality data modes regulatory complexity and switching costs in addition to our internal assessment we engaged a leading third-party consulting firm at the expense of the manager, not the fund, to perform an independent AI risk assessment. The third-party consultant analyzed potential product displacement and end-user workflow risks. They also assessed the ability for companies with higher potential product displacement and end-user workflow risks to adapt in this new environment. The results of our internal AI risk analysis showed that less than 10% of our software portfolio was subject to elevated AI disruption risk. The third party's consultants' AI risk assessment concluded that fewer than 3% were at elevated risk. We believe our software-related risk is very manageable, and we believe there will be opportunities for Gallup Capital in the software space, in part because many other lenders are leaving the sector or reducing exposures. On slide 11, you can see that non-accruals increased slightly quarter over quarter to 1.9% of total investments at fair value, but remain at very low levels in absolute terms and relative to the broader listed BDC sector. During the quarter, the number of non-accrual investments increased from 19 to 20, as the addition of four investments were partially offset by the removal of three portfolio companies. Our focus, as always, with underperforming borrowers is to use our deep bench of experienced investment professionals and the playbook that we've developed over several decades to minimize realized losses. Slide 12 shows the trend in internal performance ratings for the entire GBDC portfolio. As Tim noted earlier, approximately 87% of the total investment portfolio remained in our top two internal performance rating categories, and investments rated three, which signal a borrower may have the potential to or is expected to be performing below expectations, was 10.6%, modestly above historical averages. The proportion of loans rated 1 and 2, which are the loans we believe are most likely to see significant credit impairment, remained very low at just 2.8% of the portfolio at fair value. Now I'm going to turn it over to Chris to take us through our financial results in more detail.
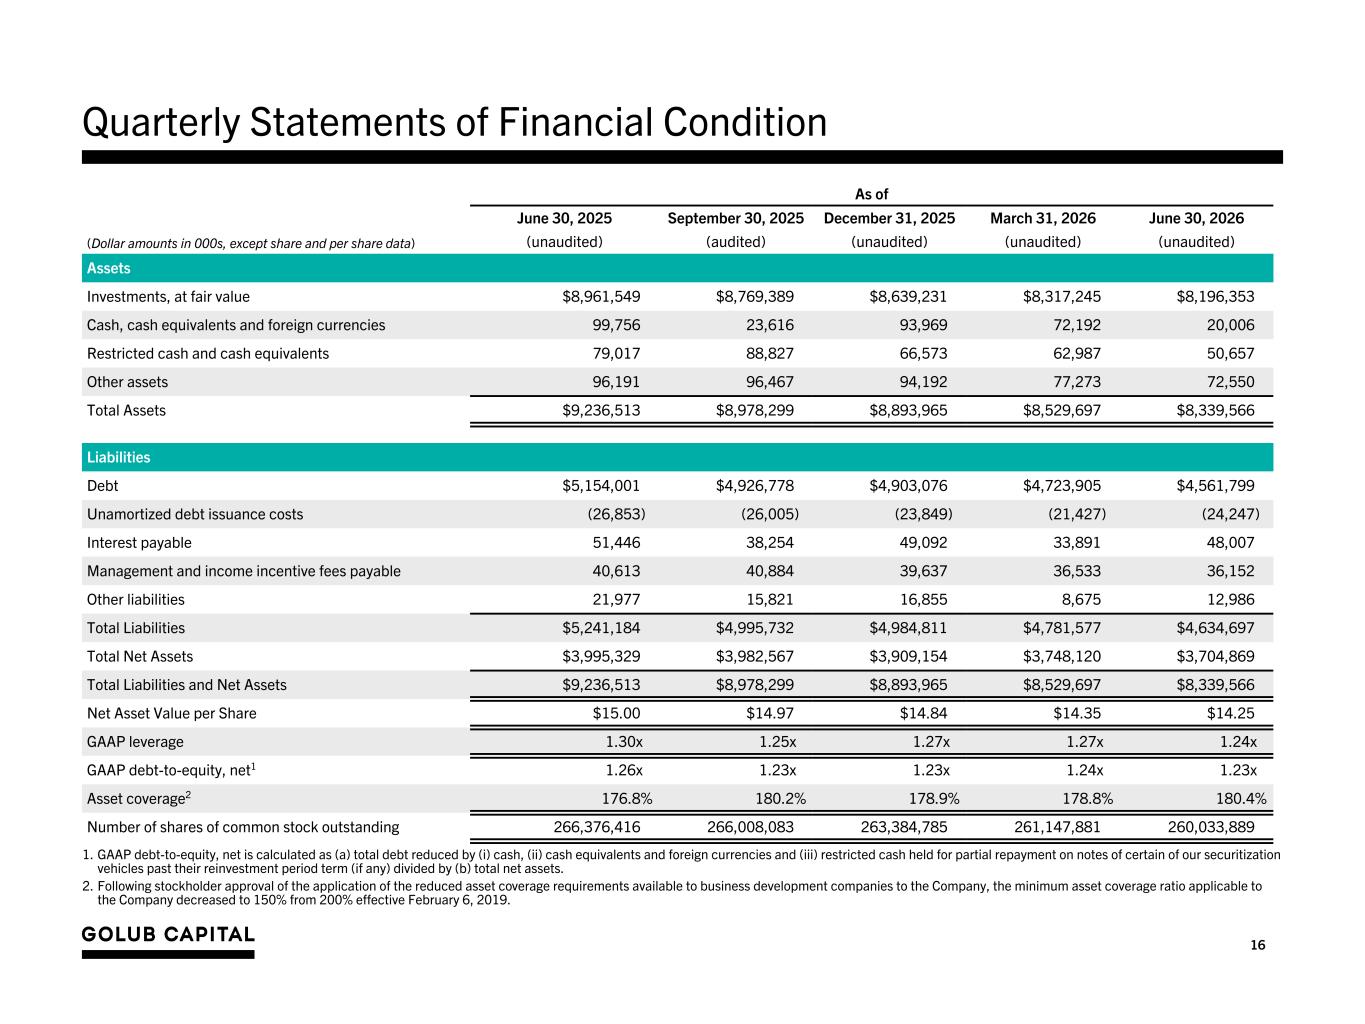
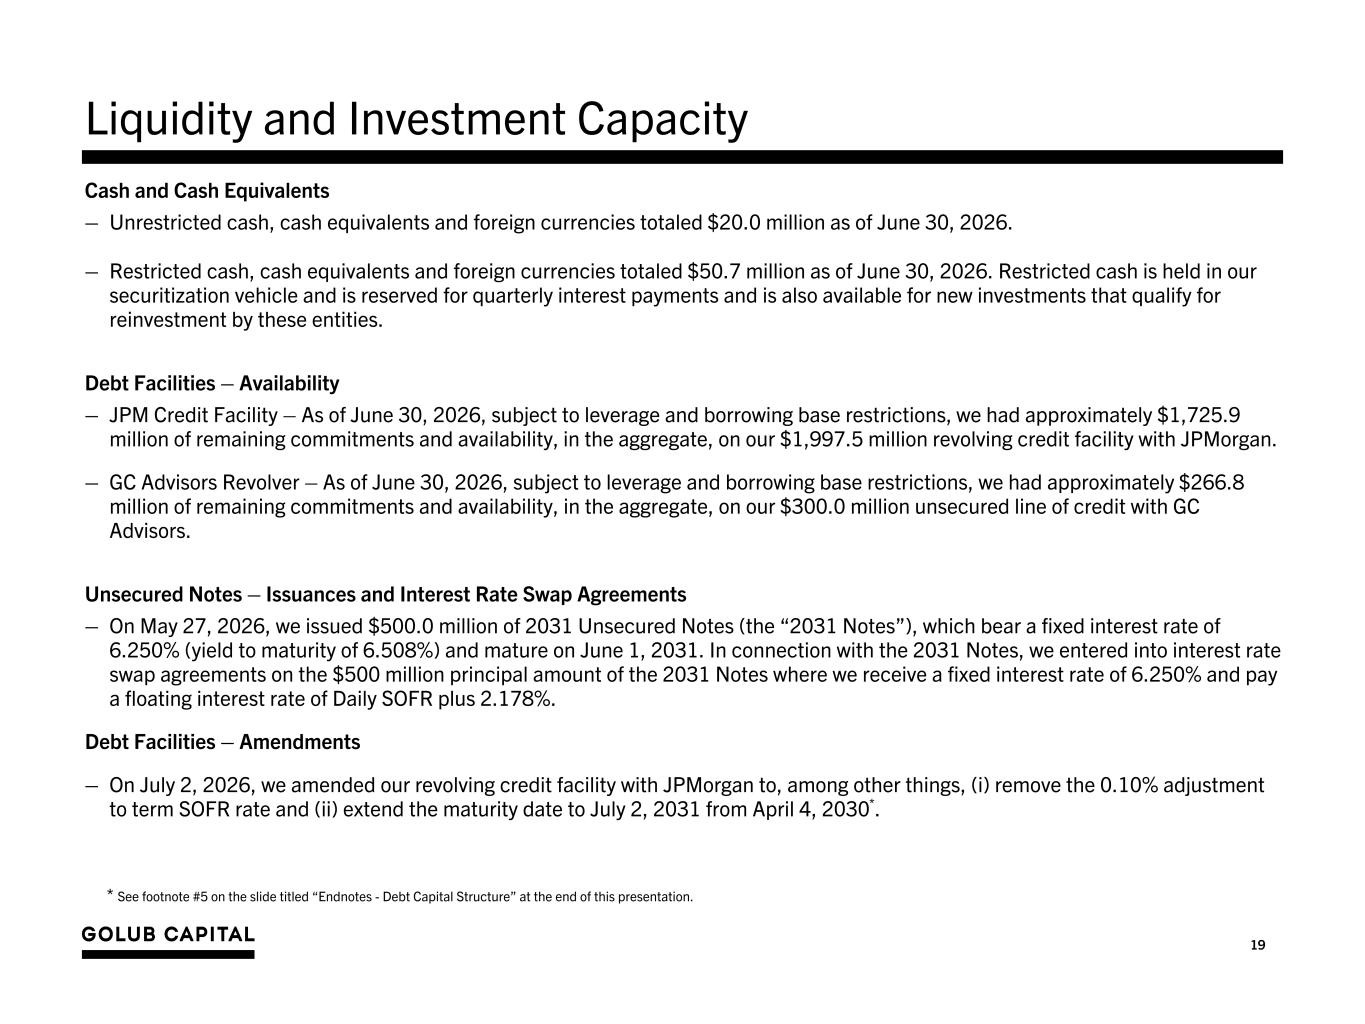
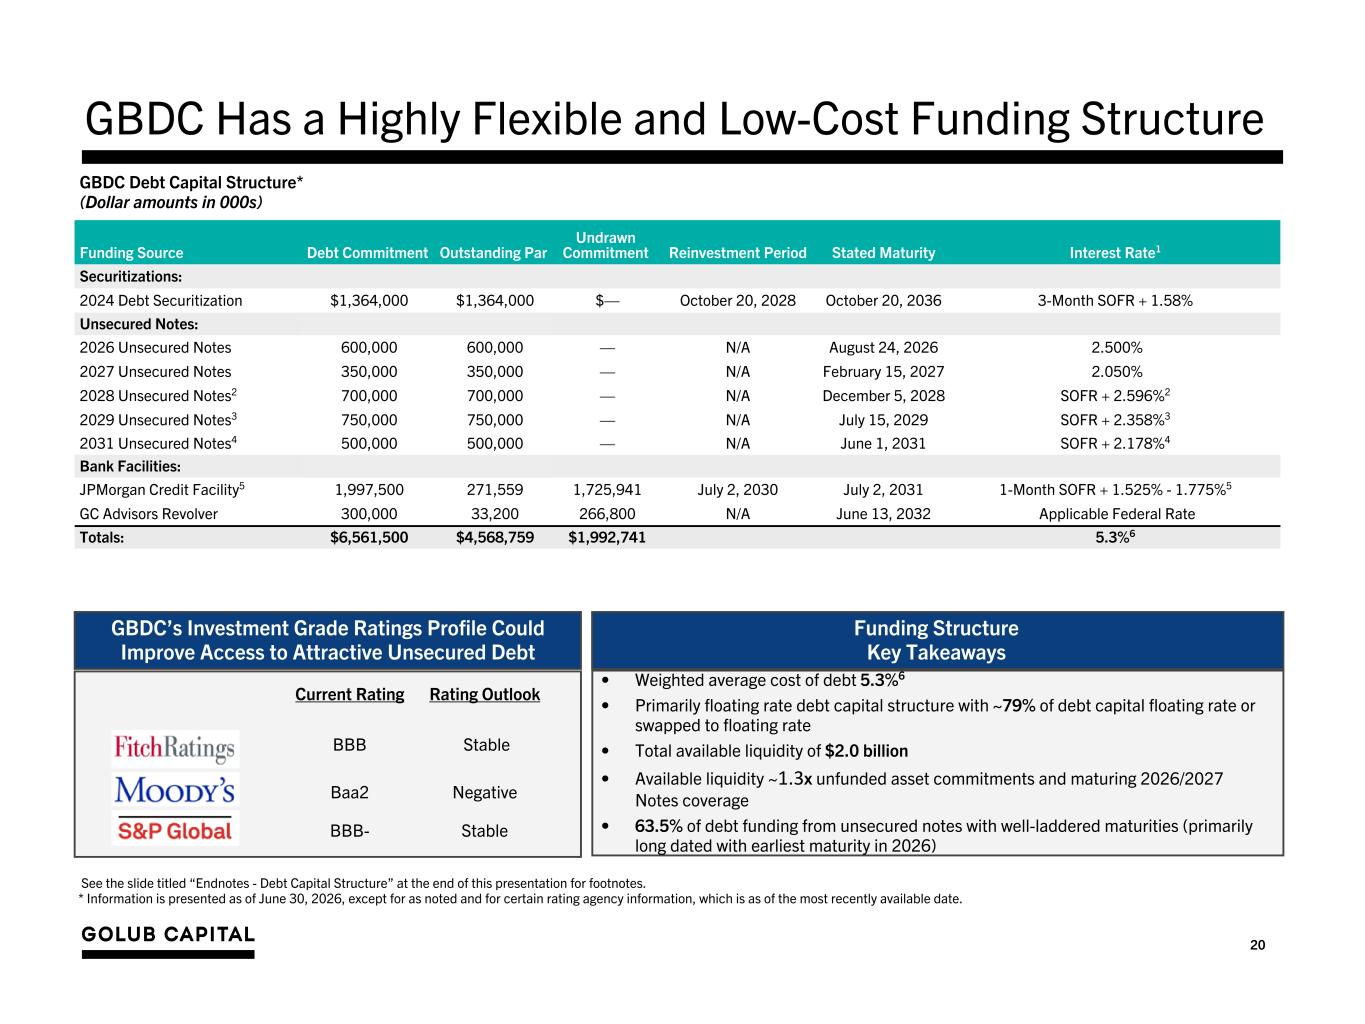
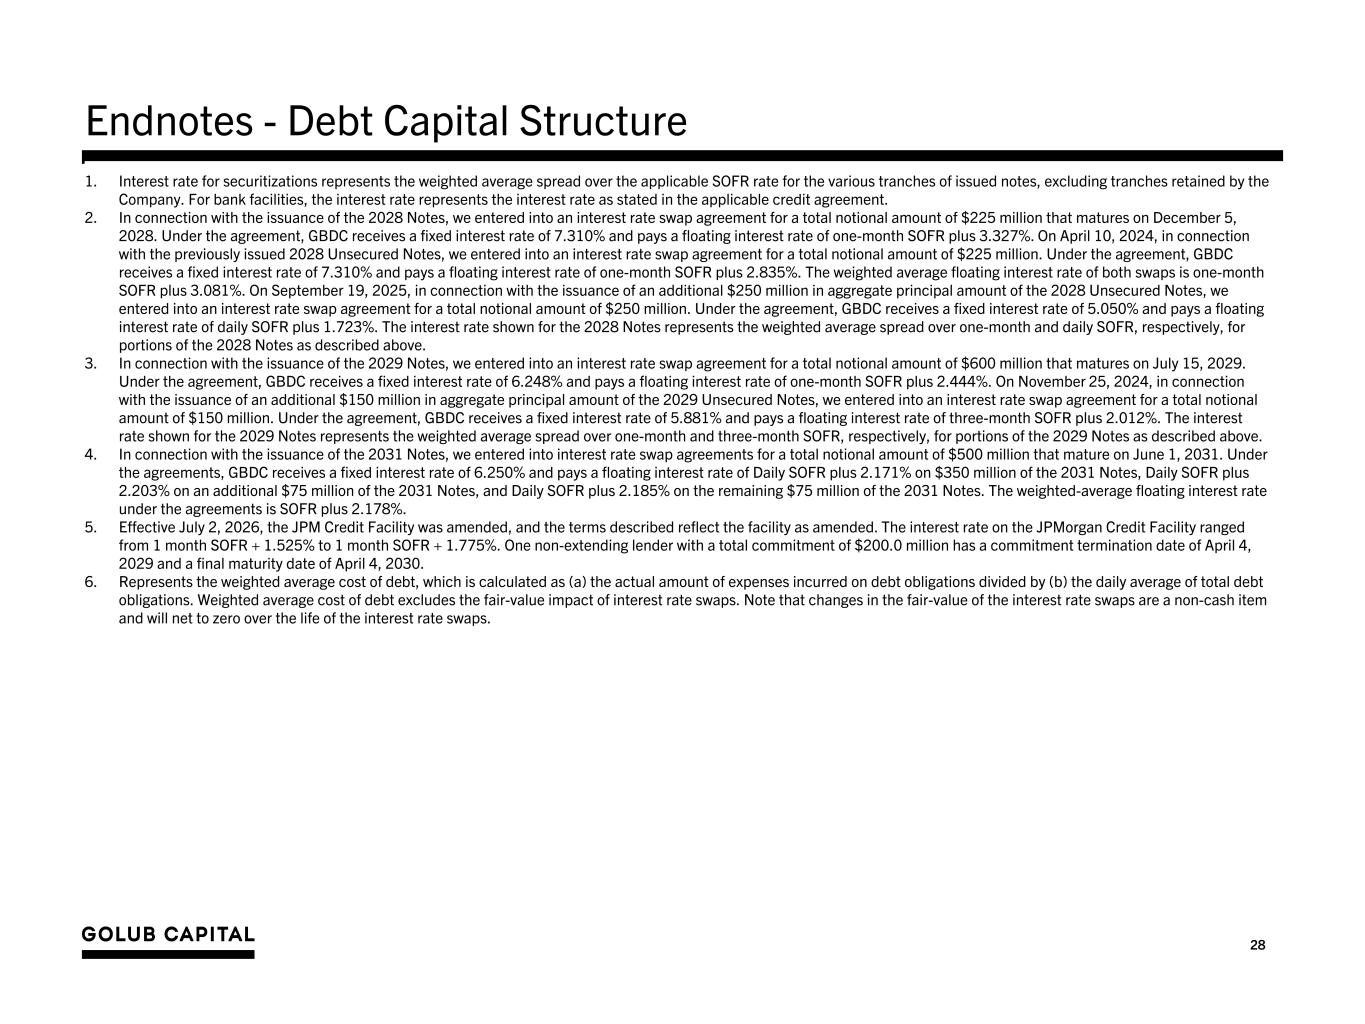
Thanks, Rob. I will now cover GBDC's financial performance and liability profile for the third fiscal quarter of 2026. First, turning to performance, slide 13 highlights the key drivers of GBDC's net investment spread, which increased modestly quarter over quarter to 4.6% on an annualized basis. Let's walk through the key components in detail. Starting with the dark blue line, which is our investment income yield, as a reminder, the investment income yield includes the amortization of fees and discounts. GBDC's investment income yield increased approximately 20 basis points sequentially to 9.9% annualized, the result of stable weighted average reference rates and spreads across the portfolio, while benefiting from some accelerated discount accretion and fees from loan payoffs in the quarter. Our cost of debt, the teal line, increased modestly approximately 10 basis points to 5.3%. Net-net, GBDC's weighted average net investment spread, the gold line, increased modestly quarter over quarter to 4.6% annualized. Moving to the balance sheet on slide 16, we ended the quarter with approximately $8.2 billion of total portfolio investments at fair value, $4.6 billion of outstanding debt, and $3.7 billion of total net assets. Net debt-to-equity leverage for the quarter ended at 1.23 times, down 0.01 times from the prior quarter, reflecting the impact of lower-average investments outstanding in the quarter. Turning to GVDC's liquidity on slide 19, overall, our liquidity position remained strong, and we ended the quarter with approximately $2 billion of liquidity from unrestricted cash and undrawn commitments on our corporate revolver and the unsecured revolver provided by our advisor. This provides more than 1.3 times coverage of our unfunded investment commitments and the upcoming maturities of our 2026 and 2027 notes. Supporting the strength of our balance sheet, in May 2026, we issued $500 million in five-year unsecured notes, which we swapped to SOFR plus 218 basis points. Subsequent to quarter end, we successfully amended certain terms and extended the maturity of our syndicated corporate revolver to July 2031 in partnership with our 18 bank partners. Total commitments under the revolver remained at approximately $2 billion, with an accordion provision allowing for an increase in total facility size of up to $3 billion. Among other restated terms, we successfully negotiated the removal of the 10 basis point term SOFR credit spread adjustment and maintained a drawn spread of term SOFR plus 1.525% to 1.775% subject to borrowing-based levels. GBDC continues to have what we believe is one of the most competitively priced revolvers across our listed BDC peers. Our debt funding structure, highlighted on slide 20, remains highly diversified across multiple financing markets. Our weighted average borrowing costs of 5.3% annualized remains one of the lowest in our listed BDC peer group and is underpinned by a differentiated investment grade ratings profile. Consistent with our asset liability matching principle, approximately 80% of GBDC's total debt funding is floating rate or swapped to a floating rate, and 64% of our debt funding is in the form of unsecured notes across a well-laddered maturity profile. Following the July maturity extension of GBDC's corporate revolver, the weighted average maturity on our outstanding debt at June 30 was 4.8 years, well in excess of the weighted average maturity on accruing debt investments of 3.1 years, reflecting a prudent approach to asset and liability matching. Now, I'll hand it back over to David for closing remarks.
Thanks, Chris. Last quarter, we introduced two themes, and in my view, both of these themes continued to play out in this quarter's results. First, we said that we thought the direct lending market had shifted direction, and we still do. After a long period of trending more borrower friendly, since the beginning of this year, we think the market's been growing more lender friendly. It's happening slowly, in part because of light M&A volumes. Deal activity picked up in Q2 relative to Q1, but it remained well below what we consider a normal level. and spreads on new deals are generally up 25 to 50 basis points in the context of this wind direction shift. The second theme we introduced was we said we anticipated a continued period of elevated credit stress. Our expectation was that sustained elevated credit stress, that this would continue to be an industry-wide headwind throughout calendar Q2. And this is also proved right. We recently released Fitch default report. We think it's also going to be reflected in lower industry returns on equity and higher dispersion in performance between managers as this quarter's earning season continues. Our expectation is that in this environment, Gallup Capital is going to once again outperform. This stems in part from our strategy. We focus on firstly loans to resilient businesses and resilient industries, and we have limited exposure to junior debt. That helps in this kind of environment. But it's also about our strong underwriting and monitoring. We think we're particularly strong at early identification of problem credits and mitigating the credit losses on those problem credits, in part because of that early attention. Overall, I continue to believe we're in a Darwinian moment for private credit. I said that early this year, and I continue to believe it. I think that firms with sustainable competitive advantages, with strong performance and with well-diversified long-term capital bases, they're going to adapt and take share. And firms with less good credit performance or with over-reliance on certain kinds of capital like retail products, they're going to struggle. Private equity sponsors in this context are soon going to know which private credit firms they can count on to provide consistent, steady access to compelling financing solutions, and which private credit firms can't do that. And I think all of this is going to continue a pattern that I started to talk about last year. It's the growing separation between the winners and the winers. With that, operator, can you please open the line for questions?
Operator
Thank you. We will now begin the question and answer session. If you would like to ask a question, please press star one to raise your hand. To withdraw your question, press star one again. We ask that you pick up your handset when asking a question to allow for optimum sound quality. If you are muted locally, please remember to unmute your device. Please stand by while we compile the Q&A roster. Your first question comes from the line of Finian O'Shea with Wells Fargo. Your line is open. Please go ahead.
Hey everyone, good morning. David, on capital allocation, appreciating the posture of focus on de-levering and buybacks, can you hit on how much of that stemmed from sort of the other variable, which is the quality and price of new investment opportunity? um and and you know if that's if that sort of preference is expected to continue here um as you've as you've delivered a little bit or or should you um expect to go more conservative as you know say the new investment opportunity isn't isn't great and there are still some credit headwinds in the industry?
It's a good question. We always need to think through the trade-offs between buying back shares, making new investments, having leverage be in our target range. And all of those are goals that we have that we want to achieve. And there's some trade-offs between them. So you quite correctly pointed out that in this last quarter, we saw relatively slow payoffs. We made the decision to slow down on new investing activity in order to achieve our goals with respect to repurchases and with respect to a bit of deleveraging. I think the payoffs are going to increase, and that's going to give us a lot more flexibility to be able to play more in new investing activity and simultaneously continue to achieve our leverage goals and our repurchase goals. But we're going to have to continue to monitor all of these different options and weigh the pros and cons against each other, because I think these are at core alternative uses of capital. I think it's, you know, very important for you, Finn, and I know you focused on this before, others have as well, to focus on the emphasis we've put on repurchase of shares. When BDC shares are trading at a discount, they're trading at a discount to what managers are saying fair value is.
I think that's a really important fact to bear in mind as you think about why some of them do repurchase their shares and some don't very helpful um just a follow-up on credit pressure we're seeing a bit more uh last couple quarters including this quarter on the home services area you have a little bit of that um seeing if you could could outline anything thematically going on there if it's sort of a repeat of like the health care roll-up issues or something in the K-shaped economy or whatnot.
I think you're right that we're seeing a pattern, and I described the pattern maybe less about being home services than about being businesses that are impacted by slower degrees of home sales. So, you know, Now, there's been some good writings on this. So we've seen that we are in a period since 2022 when mortgage rates have gone up. So if you are a homeowner and a holder of a pre-2022 mortgage, you're reluctant to give up that mortgage because your replacement mortgage will be much more expensive, even if you want to move. So that has cut down the amount of moving activity. And I think one of the reasons why some home services businesses have seen slack demand is related to this move volume being below normal. I don't think that can persist forever. I think this is a self-curing problem, but I don't think it's going to be cured tomorrow So you're going to see some continued pressure in that space on businesses that are reliant on or that are influenced by the amount of moving activity. Great. That's all for me.
Operator
Your next question comes from the line of Kenneth Lee with RBC Capital Markets. Your line is open. Please go ahead.
Hey, good morning and thanks for taking my question. Just one on the, in terms of the deal activities, in terms of the deal you saw in the quarter and you mentioned a brief pickup in some of the spreads on new investments, wonder if you could just further flesh that out, you know, what are you seeing in terms of terms, in terms of docs versus what you saw in the March quarter? Sure.
So I think most folks in our industry expected 2026 to see much stronger M&A volumes than we saw in 2025. And as the year turned, as we got into January and February, that did not happen. In fact, we saw reductions, not increases in M&A in Q1. In Q2, we saw a little bit of recovery, Ken, but we're still operating in a very modulated, very constrained M&A environment for private equity-backed M&A. If you look at the overall stats, it can be a little confusing because industry M&A volumes are very influenced by some very large strategic deals. But if you look at the private equity ecosystem, M&A's been low. As a consequence of that, I think there's been more competition and more attention around the deals that are getting done. And that's mitigated to a degree the spread widening and the improvement in terms that we would otherwise have seen in private credit in q2 we still saw some uh i mentioned in in the prepared remarks you know about a 25 to 50 basis point improvement in pricing um and there's also been some improvements in in terms uh and and and in and in leverage levels so so the the overall situation is actually a bit better than than just that spread increase um but i think we're going to see more i think we're going to see more when M&A starts to recover more clearly. And I think over the course of the coming quarters, we'll see both an improvement, an increase in M&A activity and a further improvement in the terms and conditions available for new loans for private credit players.
Gotcha. Very helpful there. And just one follow-up, if I may, within the software loan portfolio there, the sequential pickup in the bottom three risk grades. I wonder if you could just talk about any common themes there, anything notable driving some of the movement there.
Yeah, I mean, let's go back to a conversation that we had at the very beginning of the year, I was asked, so all this AI stuff, you've got some competitors who are saying it's a big nothing. and I said very pointedly, it is not a big nothing. There is a very significant change in the cost of coding as a result of AI and there are going to be winners and losers in the industry that arise because of this very, very, very significant change that was not fully anticipated. I think what I also said at the time was I think we're well positioned for this. We are experts in software lending. We've been doing it for a very long time, very successfully. uh and we've been thinking about ai in the context of our lending activity all that's all that's true i i'm also going to say we're not perfect and uh rob jushir talked about how in our re-underwriting and in uh our uh look at our portfolio with with an outside consultant we identified that we had a subset a small subset but but identifiable subset of our of our software loans, where the companies are susceptible to some issues related to AI. I think we're seeing that. I think we're beginning to see that. I think that's going to become a continuing theme, not just for us, but for everybody in the industry. Software is going to separate into winners and losers. I think our portfolio is very manageable, but there were a couple of instances in the portfolio where we're distinguishing some losers or some potentially challenged companies in our portfolio and reflecting that in valuations.
Gotcha. Very helpful there. Thanks again.
Operator
Your next question comes from the line of Paul Johnson with KBW. Your line is open. Please go ahead.
Good morning. Thanks for taking my questions. Just with the trends we've seen across the sector, I mean, credit's been normalizing, you're talking about here on the call, you know, a little bit of migration within your portfolio as well. I guess, how good of a grasp do you think that you have in terms of kind of outlining the tail within the portfolio? I mean, at this point, do you think that the tail within the portfolio is pretty much known or it's still growing at this point? I mean, it's relatively kind of early on in this normalization process. I'm just curious kind of where you think the industry is at in terms of the tail that we've seen increasing across the space and then also, I guess, within GBDC's portfolio.
Thanks, Paul. So I think you're on to some if there's a critical point for investors and analysts to focus on right now, I think it's exactly where you were headed. we're in we're in a credit cycle i've been saying it for a year others denied it for a while i don't think there's a lot of denial anymore uh we're in we're in a credit cycle there's elevated credit stress it's gonna result in winners and losers within people's portfolios and it's gonna create winners and losers between different managers because it's during credit cycles that that dispersion between different managers becomes really significantly pronounced so we've already started to see that, I think we're going to see more. One of the patterns that I've seen over 30 years is that some managers do a better job than others in early identification of problems. We're giant believers in early identification of problems. The reason we focus so much on this is that when, in our experience, when you identify a problem situation early, there are just a lot more options that you can explore with a sponsor, with a management team. And when you come into a situation that's problematic late, when there are liquidity issues, there tend to be no good options and a choice between some bad and terrible options. So we're very focused on this early identification. That leads us, I think, to identify our tail earlier than others. It also leads us, I think, to value that tail more accurately because we're on it. So I think that's where we're at right now. I think we're at a phase where we're most of the way toward having identified the credits in our portfolio that are going to have challenges. And I think across the industry, there are others who are not at the same phase, and you're going to see that over the course of this quarter and the next several quarters.
Also, I guess in terms of the growth that you're seeing, because there is still growth out there as well, of course, and it's obviously different across different industries, but what is the quality of growth that you're still seeing within sponsor-backed portfolios? Is it maybe coming down not as strong as it was, but I'd just be curious how much of this is this organic growth versus growth that's just becoming more challenged and perhaps requires more M&A to kind of achieve those sufficient growth rates?
So I think if you look at the Cobb Capital Allotment Index numbers, it's instructive vis-a-vis your question, Paul. What it shows, if you look at the numbers, is that we're still seeing a growing economy. We're still seeing growth in revenues and in EBITDA in our portfolio companies. The pace of that growth is moderate, especially on an inflation-adjusted basis. It's moderate. It's not as strong as it was in the immediate post-COVID period. It's not bad. It's not recessionary, but it's muddling growth. And my expectation is that we're going to continue to see that pattern. There's some outlier events that may occur, including a situation in the Middle East that could drive in a more negative direction. But I see a lot of momentum right now a lot of resilience in the US economy in this slow to medium growth range. What does that mean for M&A volumes? I think there are a lot of pent-up buyers and pent-up sellers in the private equity ecosystem. What we need is a period of stability, a period where we've got less uncertainty around rates, less uncertainty around energy prices, and we'll start to see a growing degree of M&A. And I think that would be very healthy for the PE ecosystem.
Kathy, appreciate it. Those are all the questions for me.
Operator
Your next question comes from the line of Robert Dodd with Raymond James. Your line is open. Please go ahead.
Morning, everybody. David, if I can go back to software, I apologize almost for that. I mean, I think three of you knew Nonocruals this quarter were software. Were they all in the group that you would have considered elevated AI risk? Or are there other themes also going on in the software kind of segment? And your software segment is pretty broad because the way you define it. Are there other issues going on there? Or were all of those issues you, precisely as you say, like going to the table quickly and kind of putting them on non-accrual earlier than you think some others might be willing to do?
Look, I don't, it's a great question, Robert. I don't think there's ever, you know, just one reason for almost anything in life. So I don't want to lead everyone to think, oh, this is all just AI. There are always multiple issues. In some cases, there are acquisitions that have been made where the integration maybe isn't going as smoothly as was expected. It's very difficult to successfully generalize about sources or reasons for underperformance. performance. But I would also say, you know, I think AI is and will continue to be a meaningful factor.
Got it. Thank you. I mean, the number you gave, I mean, your internal assessment was less than 10% subject to elevated AI risk. And then the third party, I think, was less than three, if I heard correctly. That's a pretty significant difference in terms of the third part being meaningfully more optimistic than your internal assessment, but maybe, hey, credit guys are always pessimistic. So can you give us any, what would they, and you gave a little color on it, but I mean, were there significant, is there a theme there on why their analysis, the third party, came out with a meaningfully more optimistic assessment than your own internal review.
I actually view the two much more similarly than you do. I wouldn't get too focused on the difference between these two. We don't have exactly the same grading scale. You know, there's no agreement on here's the basis for making an assessment or here's what exactly the words mean. I think I would take a different conclusion or a different lesson from the two different analyses, which is they're both low numbers. And that's the really important thing, they're both low numbers. The reality, if you ask me, is that if we looked across the software industry, the proportion of software companies that are going to be vulnerable to AI-related elevated risks, it's a lot higher than what's in our portfolio. Our focus on enterprise risk systems that are deeply embedded in their clients' businesses, that control data, that are systems of record, that are in many cases in regulated industries where security and other issues are hard to manage. I mean, that's why our software is in good shape. It's because of choices that we've made, underwriting decisions that we've made over an extended period of time about what constitutes a Golub software credit. And I think that's really the key thing I want to, I would like for you and others to take away.
Got it. Got it. Appreciate that. One more, If I can real quick, on the dividend in prior quarters, you said you'd revisit the dividend or reevaluate the policy in context of industry trends, right? Better spreads, moderate base rates, that was the past. Right now, it sounds like spreads are moving a little higher. The forward outlook for base rates might be more up than down or at least stable. I don't think we're going to three SOFA any time soon, but I'm not a rate forecaster. So, would you say, you know, the dividend is always under review, obviously, but do you think any re-evaluation is likely to be a more longer-term issue if we sit in an environment with a little higher SOFA, a little wider spreads in the short term, the re-evaluation might not be necessary?
So those are clearly helpful, right? I mean, higher base rates are good. Higher spreads are good. Whenever we talk about dividend policy, I just want to remind everybody about our approach. And our approach is, you know, we want to pay out an amount that is a good distribution for shareholders while at the same time holding a steady nav and not changing our dividend too frequently. So those are all things we need to weigh. And, you know, I'd say the trends in the last quarter were a little helpful on that front. I don't think many of us were expecting the SOFR forward curve to switch directions and has. That's a useful thing from the standpoint of being able to project future earnings power. But it's something we're going to have to continue to watch. It's part of what being a floating rate debt manager involves. You've got to constantly be looking at what's forward earnings power.
Operator
Your next question comes from the line of Ethan Kay with Lucid Capital Markets. Your line is open. Please go ahead.
Hey, good morning, guys. You mentioned some opportunities, I think, in the secondary market here. Can you kind of just help us, help kind of like size that for us, how much was done? I guess maybe this quarter wasn't too significant given the overall investment levels. But, you know, is this something that you think there's still opportunity for going forward? And maybe also, can you kind of ballpark at what, you know, percent discount some of these purchases were executed? Sure.
So let me take a step back because this, again, is a subject that's gotten a lot of, in my mind, confusing and misinformation. So there have been a series of articles in the press about how secondary sales of private credit, that this is new and bad. And I want to take the opposite position. I think it's old and good. We've had a desk at Gallup Capital focused on sales and trading of private credit loans for more than a decade. We're a market leader at doing it. This is something that we have been doing a very long time. Why is it good? Well, sometimes in private credit borrower lending groups, there's a lender who wants to sell. If you think about this in the simplest of contexts, they have an old fund. They have a desire to rebalance and put their capital in a different place. They have a debt facility that's maturing. They have lost confidence in a sponsor or a sponsor relationship. There are lots of different reasons. And from a borrower standpoint, once there's a lender who wants to sell, their choice is they can either have an unhappy lender in their group or they can have a new lender. We think that it's almost always better for them to have a new lender. And we're in the business of facilitating that. In the process, we also, because of this position we're in as the largest sales and trading party, we also get to see a lot of stuff. And sometimes what we see, we want to buy. You know, in the calendar year to date, the Gallup capital sales and trading activity has exceeded $2 billion. It's a record first half for us. And across the platform, we've seen some opportunities to buy some loans that we think are attractive. Is it a major part of the platform's overall origination activity? the vast preponderance of what we're doing is arrangement origination of new loans but we think it's a meaningful competitive advantage of the platform to to have this sales and trading expertise we think it's good for our sponsor clients because we're able to help them replace unhappy lenders with with with happy ones and we think it's good for our investors because it gives us a source of information opportunities that that that aren't widely available For GBDC and calendar Q2, this was not a meaningful source of new investment activity, but I'm glad you raised it because I think it's an example of a competitive advantage of the Gallup Capital platform.
That I appreciate that. And then one more for me. You talked about in the prepared remarks, some of the kind of reversal of, you know, some of the spread driven, right, markdowns from last quarter. I think we heard from another peer kind of indicate on their call that there was still actually some pressure on their nav in 2Q from this. I'm just wondering if there's anything, you know, maybe you can point to that might drive that distinction, right? Is it perhaps a function of the respective markets you guys are focused on?
So I don't think we saw a lot of spread-related valuation movement in the portfolio in Q2. I think that was primarily a Q1 event. There was a little bit of bounce back in, you know, what I mean by that is spread tightening in the larger size range of the private credit universe in Q2, but not a lot. The main story was stabilization. So I think what you're going to see across Q2 results in the industry is credit-related valuation changes. And my expectation is we're going to see a bunch of those. That's what happens when you're in a credit cycle.
Operator
There are no further questions at this time. I will now turn the call back to David Golub for closing remarks.
Thanks, everyone, for listening today. As always, if you have a question that we did not cover today or that you think of later, feel free to reach out. And we look forward to talking to you again in a quarter.
Operator
This concludes today's call. Thank you for attending. You may now disconnect.