
Transcode Therapeutics, Inc S-1/A, filed May 3, 2021
Transcode Therapeutics, Inc. (RNAZ)
SECURITIES AND EXCHANGE COMMISSION
TO
FORM S-1
UNDER
THE SECURITIES ACT OF 1933
(Exact name of Registrant as specified in its charter)
| |
Delaware
(State or other jurisdiction of incorporation or organization) |
| |
2834
(Primary Standard Industrial Classification Code Number)
6 Liberty Square, #2382
Boston, MA 02109 (857) 837-3099 |
| |
81-1065054
(I.R.S. Employer Identification No.) |
|
Chief Executive Officer
TransCode Therapeutics, Inc.
6 Liberty Square, #2382
Boston, MA 02109
(857) 837-3099
| |
Michael Bison, Esq.
Goodwin Procter LLP 100 Northern Avenue Boston, MA 02210 (617) 570-1000 |
| |
Thomas A. Fitzgerald
Chief Financial Officer TransCode Therapeutics, Inc. 6 Liberty Square, #2382 Boston, MA 02109 (857) 837-3099 |
| |
Stephen Older, Esq.
Rakesh Gopalan, Esq. McGuireWoods LLP 1251 Avenue of the Americas, 20th Floor New York, NY 10020 (212) 548-2122 |
|
| |
Large accelerated filer
☐
|
| |
Accelerated filer
☐
|
| |
Non-accelerated filer
☒
|
| |
Smaller reporting company
☒
|
|
| | | | | | | | | | |
Emerging growth company
☒
|
|
| | | ||||||||||||||
|
Title of Each Class of
Securities to be Registered |
| | |
Proposed Maximum
Aggregate Offering Price(1) |
| | |
Amount of
Registration Fee(2) |
| ||||||
|
Common Stock, par value $0.0001 per share
|
| | | | $ | 28,750,000.00 | | | | | | $ | 3,137.00 | | |
|
Representative Warrant(3)
|
| | | | | ― | | | | | | | ― | | |
|
Common Stock issuable upon exercise of Representative Warrant(4)
|
| | | | $ | 1,562,500.00 | | | | | | $ | 171.00 | | |
| Total | | | | | $ | 30,312,500.00 | | | | | | $ | 3,308.00(5) | | |
Common Stock

| | | |
Per Share
|
| |
Total
|
| ||||||
| Initial public offering price | | | | $ | | | | | $ | | | ||
| Underwriting discounts and commissions(1) | | | | $ | | | | | $ | | | ||
| Proceeds to us, before expenses | | | | $ | | | | | $ | | | | |

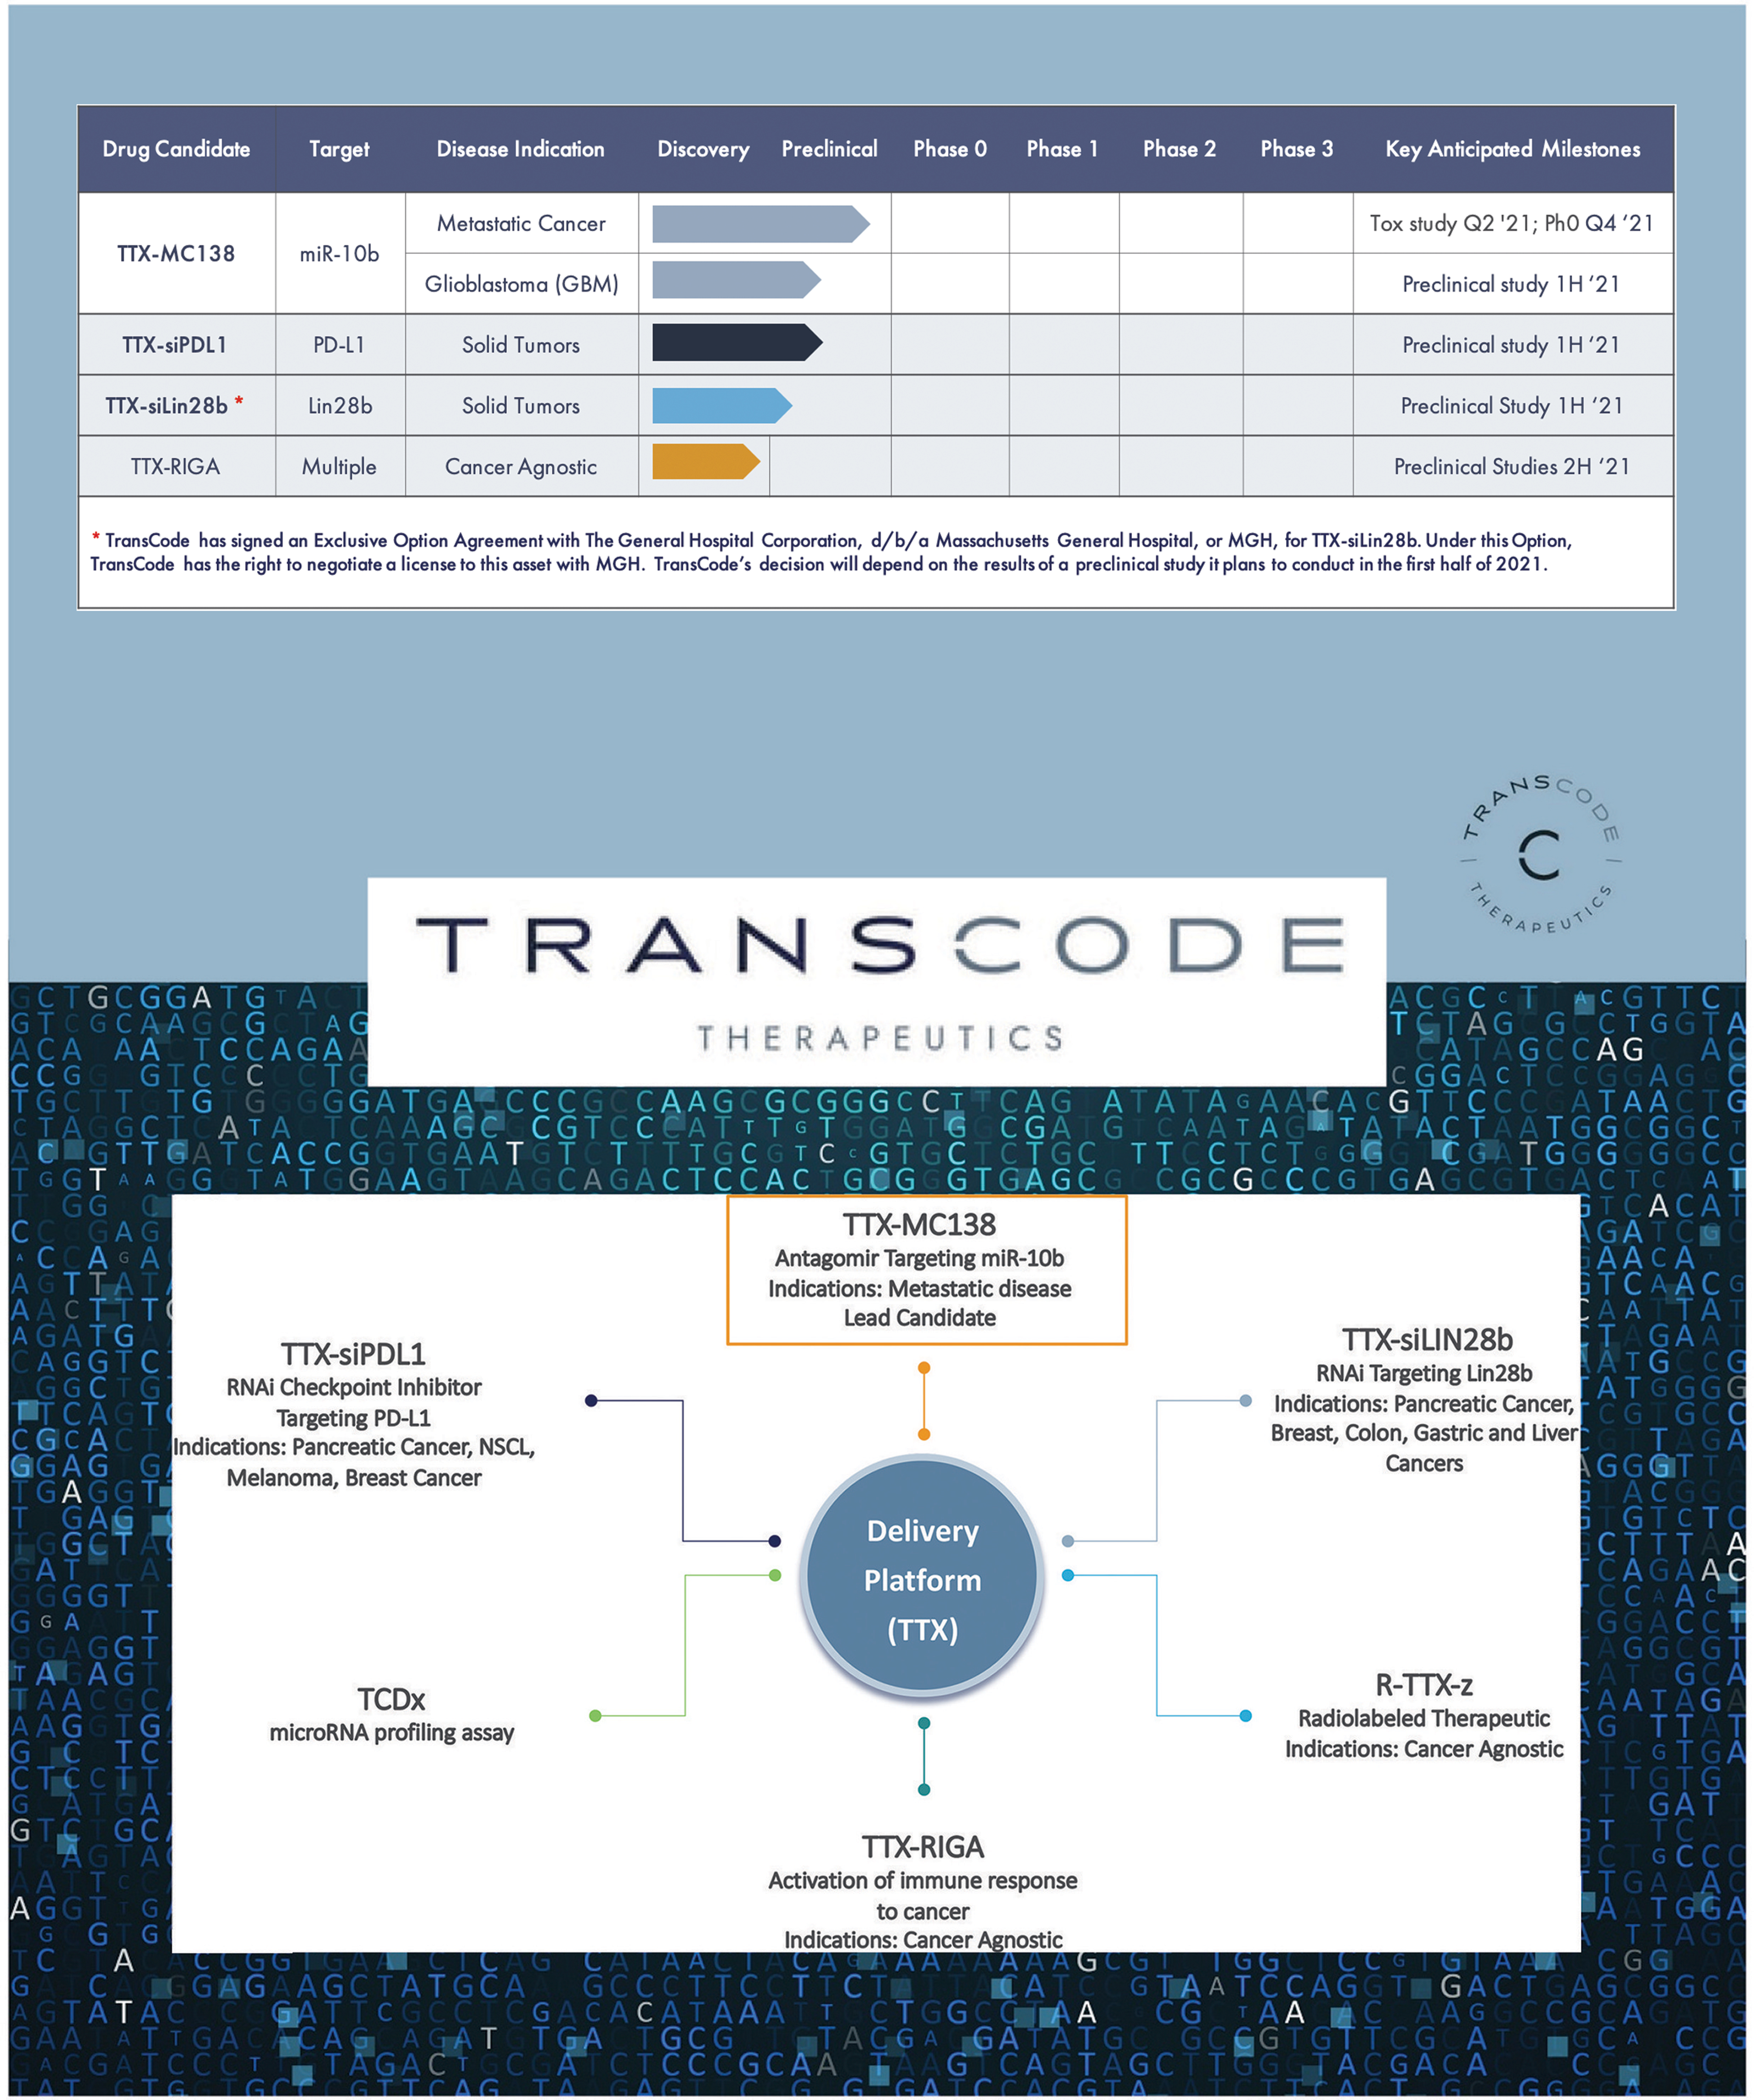
| | | | |
|
| | ||
| | | | |
|
| | ||
| | | | |
|
| | ||
| | | | |
|
| | ||
| | | | |
|
| | ||
| | | | |
|
| | ||
| | CAPITALIZATION | | | |
|
| | |
| | DILUTION | | | |
|
| | |
| | | | |
|
| | ||
| | BUSINESS | | | |
|
| | |
| | MANAGEMENT | | | |
|
| | |
| | | | |
|
| | ||
| | | | |
|
| | ||
| | | | |
|
| | ||
| | | | |
|
| | ||
| | | | |
|
| | ||
| | | | |
|
| | ||
| | UNDERWRITING | | | |
|
| | |
| | | | |
|
| | ||
| | EXPERTS | | | |
|
| | |
| | | | |
|
| |

AND A SMALLER REPORTING COMPANY
after this offering
| | | |
Years Ended
December 31, |
| |||||||||
| | | |
2020
|
| |
2019
|
| ||||||
| Statement of Operations Data | | | | | | | | | | | | | |
| Operating expenses | | | | | | | | | | | | | |
|
Research and development
|
| | | $ | 284,459 | | | | | $ | 226,309 | | |
|
General and administrative
|
| | | | 442,145 | | | | | | 230,556 | | |
|
Total operating expenses
|
| | | | 726,604 | | | | | | 456,865 | | |
|
Operating loss
|
| | | | (726,604) | | | | | | (456,865) | | |
| Other income (expense) | | | | | | | | | | | | | |
|
Change in fair value of derivative liabilities
|
| | | | (1,208,000) | | | | | | 4,000 | | |
|
Change in fair value of warranty liability
|
| | | | (14,852) | | | | | | 2,584 | | |
|
Interest expense
|
| | | | (394,573) | | | | | | (156,965) | | |
|
Interest income
|
| | | | 136 | | | | | | 34 | | |
|
Total other income (expense)
|
| | | | (1,617,289) | | | | | | (150,347) | | |
|
Loss before income taxes
|
| | | | (2,343,893) | | | | | | (607,212) | | |
|
Income tax expense (benefit)
|
| | | | — | | | | | | — | | |
|
Net loss
|
| | | $ | (2,343,893) | | | | | $ | (607,212) | | |
|
Basic and diluted loss per common share
|
| | | $ | (0.51) | | | | | $ | (0.13) | | |
|
Weighted average number of common shares outstanding, basic and
diluted(1) |
| | | | 4,636,216 | | | | | | 4,636,216 | | |
|
Pro forma net loss per common share – basic and diluted (unaudited)(2)
|
| | | $ | (0.32) | | | | | $ | (0.09) | | |
|
Pro forma weighted average common shares outstanding (unaudited)(2)
|
| | | | 6,040,735 | | | | | | 5,126,193 | | |
| | | |
December 31, 2020
|
| |||||||||||||||
| | | |
Actual
|
| |
Pro Forma(3)
|
| |
Pro Forma
As Adjusted(4) |
| |||||||||
| Balance Sheet Data | | | | | | | | | | | | | | | | | | | |
|
Current assets
|
| | | $ | 831,215 | | | | | $ | 831,215 | | | | | $ | 22,856,215 | | |
|
Deferred offering costs
|
| | | | 224,153 | | | | | | 224,153 | | | | | | — | | |
|
Total assets
|
| | | | 1,055,368 | | | | | | 1,055,368 | | | | | | 22,856,215 | | |
|
Current liabilities
|
| | | | 404,862 | | | | | | 404,862 | | | | | | 404,862 | | |
|
Convertible promissory notes, net of unamortized debt issuance
costs and debt discount |
| | | | 2,086,675 | | | | | | — | | | | | | — | | |
|
Derivative liabilities
|
| | | | 1,751,000 | | | | | | — | | | | | | — | | |
|
Total liabilities
|
| | | | 4,463,600 | | | | | | 404,862 | | | | | | 404,862 | | |
|
Total stockholders’ equity (deficit)
|
| | | | (3,408,232) | | | | | | 650,506 | | | | | | 22,451,353 | | |
| | | |
December 31, 2020
|
| |||||||||||||||
| | | |
Actual
|
| |
Pro Forma
|
| |
Pro Forma
As Adjusted |
| |||||||||
|
Cash and cash equivalents
|
| | | $ | 828,016 | | | | | $ | 828,016 | | | | | $ | 22,853,016 | | |
|
Convertible promissory notes, net of unamortized debt issuance
costs and debt discount |
| | | $ | 2,086,675 | | | | | $ | — | | | | | $ | — | | |
|
Accrued interest — convertible promissory notes
|
| | | | 191,687 | | | | | | — | | | | | | — | | |
|
Derivative liabilities
|
| | | | 1,751,000 | | | | | | — | | | | | | — | | |
| | | | | | 4,029,362 | | | | | | — | | | | | | — | | |
| Stockholders’ equity (deficit) | | | | | | | | | | | | | | | | | | | |
|
Preferred stock — $0.0001 par value; 5,000,000 shares authorized actual; 10,000,000 shares authorized pro forma, no shares issued or outstanding pro forma; and 10,000,000 shares authorized pro forma as adjusted, no shares issued or outstanding pro forma as adjusted
|
| | | | — | | | | | | — | | | | | | — | | |
|
Common stock — $0.0001 par value; 20,000,000 shares authorized and 4,636,216 shares issued and outstanding actual; 290,000,000 shares authorized pro forma, 5,707,303 shares issued and outstanding pro forma; and 290,000,000 shares authorized pro forma as adjusted, 11,957,303 shares issued and outstanding pro forma as adjusted
|
| | | | 464 | | | | | | 571 | | | | | | 1,196 | | |
|
Additional paid-in capital
|
| | | | 65,950 | | | | | | 4,350,190 | | | | | | 26,150,412 | | |
|
Subscription receivable
|
| | | | (12,763) | | | | | | (12,763) | | | | | | (12,763) | | |
|
Accumulated deficit
|
| | | | (3,461,882) | | | | | | (3,687,492) | | | | | | (3,687,492) | | |
|
Total stockholders’ equity (deficit)
|
| | | | (3,408,232) | | | | | | 650,506 | | | | | | 22,451,353 | | |
|
Total capitalization
|
| | | $ | 621,130 | | | | | $ | 650,506 | | | | | $ | 22,451,353 | | |
| |
Assumed public offering price per share
|
| | | | | | | | | $ | 4.00 | | |
| |
Net tangible book value per share at December 31, 2020
|
| | | $ | (0.74) | | | | | | | | |
| |
Pro forma increase attributable to the pro forma adjustments
|
| | | | 0.85 | | | | | | | | |
| |
Pro forma net tangible book value per share at December 31, 2020
|
| | | | 0.11 | | | | | | | | |
| |
Increase in book value per share attributable to new investors
|
| | | | 1.77 | | | | | | | | |
| |
Pro forma as adjusted net tangible book value per share after this offering
|
| | | | | | | | | | 1.88 | | |
| |
Dilution per share to new investors
|
| | | | | | | | | $ | 2.12 | | |
| | | |
Shares Purchased
|
| |
Total Consideration
|
| |
Average Price
Per Share |
| |||||||||||||||||||||
| | | |
Number
|
| |
%
|
| |
Amount
|
| |
%
|
| | | | | | | ||||||||||||
|
Existing Shareholders
|
| | | | 5,707,303 | | | | | | 48% | | | | | $ | 2,509,778 | | | | | | 9% | | | | | $ | 0.44 | | |
|
New Investors
|
| | | | 6,250,000 | | | | | | 52% | | | | | $ | 25,000,000 | | | | | | 91% | | | | | $ | 4.00 | | |
|
Total
|
| | | | 11,957,303 | | | | | | 100% | | | | | $ | 27,509,778 | | | | | | 100% | | | | | $ | 2.30 | | |
AND RESULTS OF OPERATIONS
| | | |
Year ended
December 31, |
| | | | | | | |||||||||
| | | |
2020
|
| |
2019
|
| |
Change
|
| |||||||||
| | | |
(in thousands)
|
| |||||||||||||||
| Operating expenses: | | | | | | | | | | | | | | | | | | | |
|
Research and development
|
| | | $ | 284 | | | | | $ | 226 | | | | | $ | 58 | | |
|
General and administrative
|
| | | | 442 | | | | | | 231 | | | | | | 212 | | |
|
Total operating expenses
|
| | | | 726 | | | | | | 457 | | | | | | 269 | | |
|
Loss from operations
|
| | | | (726) | | | | | | (457) | | | | | | (269) | | |
|
Interest expense
|
| | | | (395) | | | | | | (157) | | | | | | (238) | | |
|
Change in fair value of derivative liabilities
|
| | | | (1,208) | | | | | | 4 | | | | | | (1,212) | | |
|
Change in fair value of warrant liability
|
| | | | (15) | | | | | | 3 | | | | | | (17) | | |
|
Total other income (expense), net
|
| | | | (1,617) | | | | | | (150) | | | | | | (1,467) | | |
|
Net loss
|
| | | $ | (2,344) | | | | | $ | (607) | | | | | $ | (1,737) | | |
| | | |
Year ended
December 31, |
| |||||||||
| | | |
2020
|
| |
2019
|
| ||||||
| | | |
(in thousands)
|
| |||||||||
|
Net cash used in operating activities
|
| | | $ | (493) | | | | | $ | (509) | | |
|
Net cash provided by (used in) investing activities
|
| | | | — | | | | | | — | | |
|
Net cash provided by financing activities
|
| | | | 1,117 | | | | | | 500 | | |
|
Net increase (decrease) in cash and cash equivalents
|
| | | $ | 624 | | | | | $ | (9) | | |
|
Grant Date
|
| |
Number of
shares subject to award |
| |
Per share
purchase price of restricted stock |
| |
Per share
estimated fair value of award on grant date |
| |||||||||
|
February 1, 2016
|
| | | | 3,245,082 | | | | | $ | 0.0001 | | | | | $ | 0.0001 | | |
|
April 1, 2016
|
| | | | 36,393 | | | | | $ | 0.0001 | | | | | $ | 0.0001 | | |
|
August 17, 2016
|
| | | | 139,508 | | | | | $ | 0.0001 | | | | | $ | 0.0001 | | |
|
June 1, 2017
|
| | | | 812,787 | | | | | $ | 0.0001 | | | | | $ | 0.0001 | | |
|
June 1, 2017(1)
|
| | | | (594,426) | | | | | $ | 0.0001 | | | | | $ | 0.0001 | | |
|
June 12, 2017
|
| | | | 600,491 | | | | | $ | 0.0001 | | | | | $ | 0.0001 | | |
|
July 15, 2017
|
| | | | 211,991 | | | | | $ | 0.0001 | | | | | $ | 0.0001 | | |
|
August 28, 2017
|
| | | | 184,393 | | | | | $ | 0.0001 | | | | | $ | 0.0001 | | |
|
December 11, 2017(1)
|
| | | | (1,024,778) | | | | | $ | 0.0001 | | | | | $ | 0.0001 | | |
|
January 22, 2018
|
| | | | 670,246 | | | | | $ | 0.0001 | | | | | $ | 0.0001 | | |
|
July 1, 2018(2)
|
| | | | 127,377 | | | | | $ | 0.0001 | | | | | $ | 0.0400 | | |
|
October 1, 2018
|
| | | | 49,889 | | | | | $ | 0.0400 | | | | | $ | 0.0400 | | |
|
October 7, 2018
|
| | | | 177,266 | | | | | $ | 0.0400 | | | | | $ | 0.0400 | | |


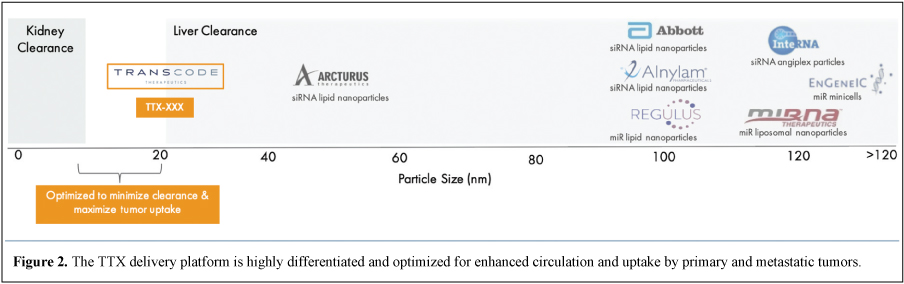
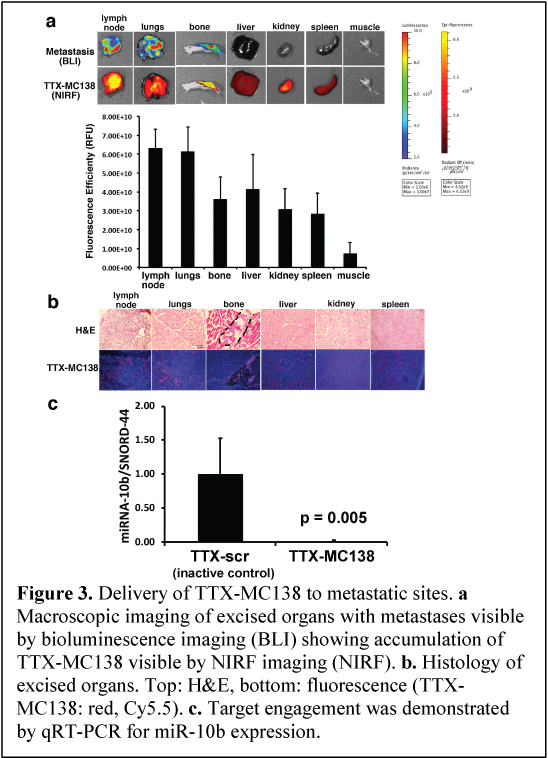


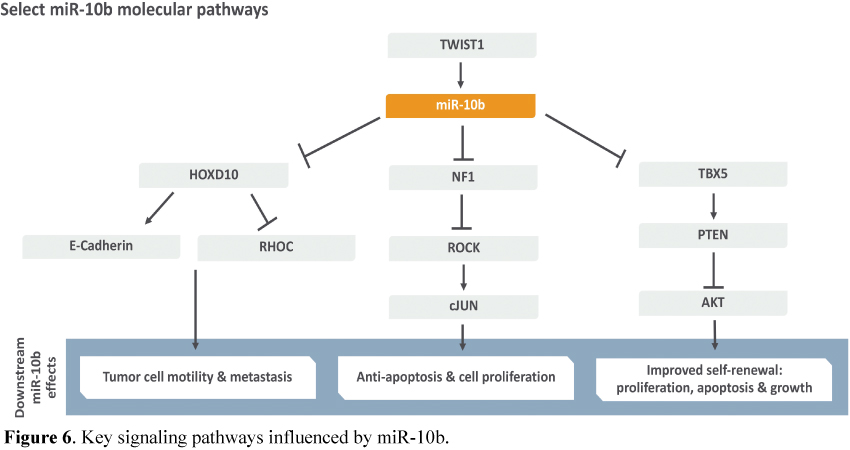

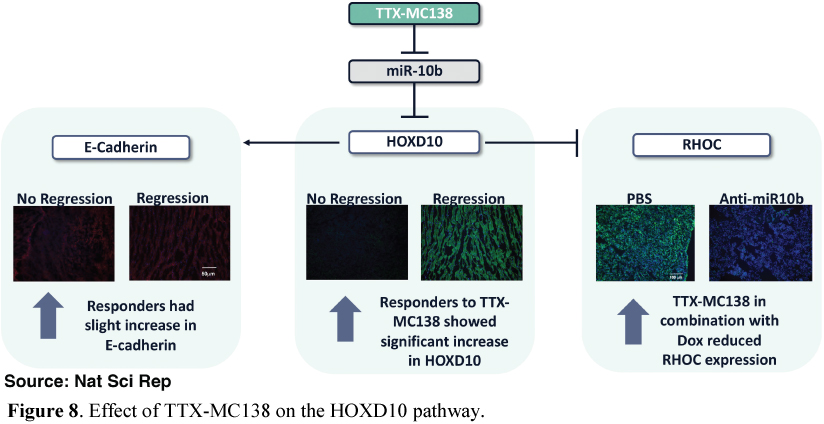
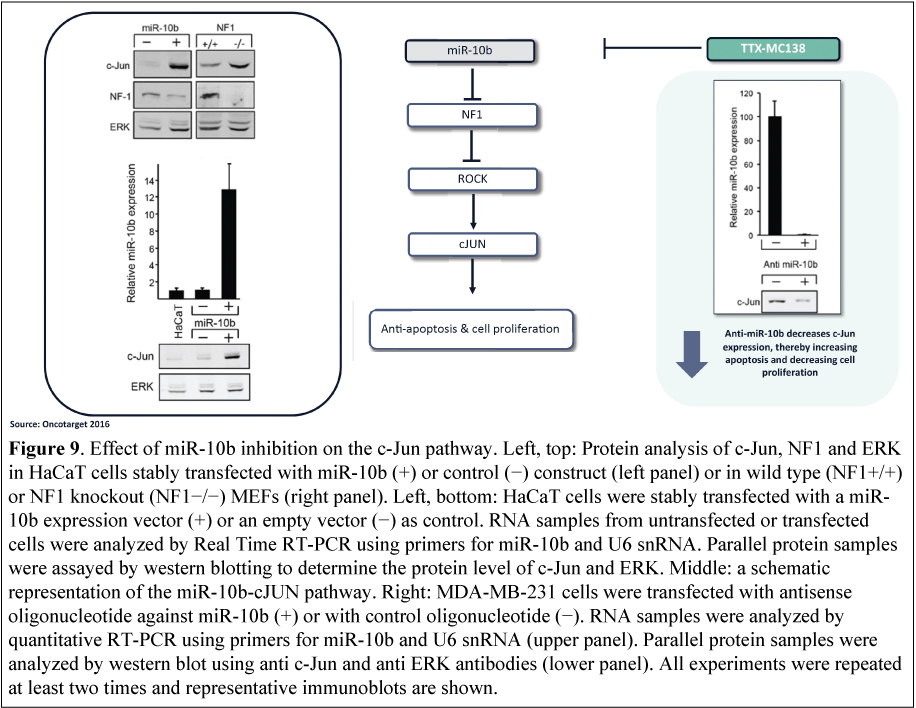
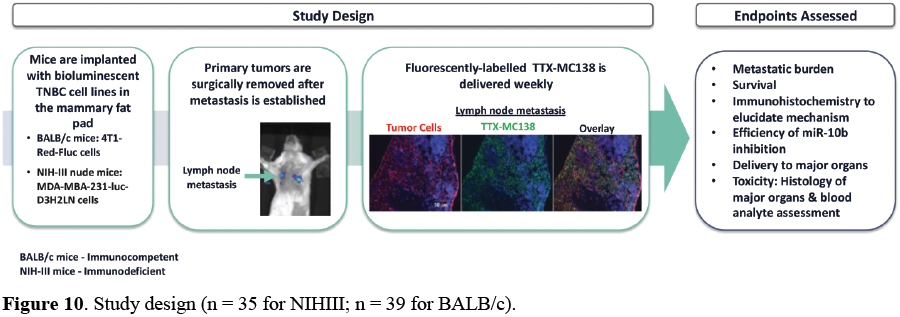
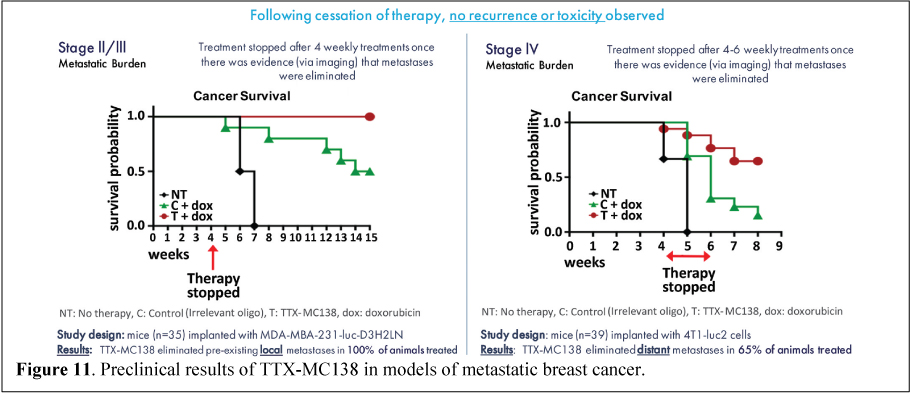

| |
Name
|
| |
Age
|
| |
Position
|
| |
Committees
|
|
| | Executive Officers | | | | | | | | | | |
| |
Robert Michael Dudley
|
| |
71
|
| | Co-Founder, President, Chief Executive Officer, Director | | | 3 | |
| |
Thomas A. Fitzgerald, MBA
|
| |
70
|
| | Vice President, Chief Financial Officer, Director | | | | |
| | Key Employees and Advisors | | | | | | | | | | |
| |
Zdravka Medarova, PhD
|
| |
46
|
| | Co-Founder and Vice President Drug Discovery | | | | |
| |
Judy Carmody, PhD
|
| |
54
|
| | Vice President of Operations | | | | |
| |
Qiyong Peter Liu, PhD
|
| |
57
|
| | Chief Scientist | | | | |
| |
Anna Moore, PhD
|
| |
59
|
| | Co-Founder, Scientific Advisor | | | | |
| | Non-Employee Directors | | | | | | | | | | |
| |
Philippe P. Calais, PhD
|
| |
61
|
| | Independent Director, Chairman of the Board of Directors | | | 1, 2 | |
| |
Erik Manting, PhD
|
| |
49
|
| | Independent Director | | | 1, 2, 3 | |
| |
Magda Marquet, PhD
|
| |
61
|
| | Independent Director | | | 1, 2, 3 | |
| | | | | | | | | | | | | | | |
Option Awards
|
| |
Stock Awards
|
| ||||||||||||||||||||||||||||||||||||
|
Name
|
| |
Grant
Date |
| |
Vesting
Commencement Date |
| |
Number of
Securities Underlying Unexercised Options (#) Exercisable |
| |
Number of
Securities Underlying Unexercised Options (#) Unexercisable |
| |
Equity
Incentive Plan Awards: Number of Securities Underlying Unexercised Unearned Options (#) |
| |
Option
Exercise Price ($) |
| |
Option
Expiration Date |
| |
Number of
Shares or Units of Stock That Have Not Vested |
| |
Market
Value of Shares or Units of Stock That Have Not Vested ($) |
| |||||||||||||||||||||||||||
|
Robert Michael Dudley(1)
Co-Founder, President and Chief Executive Officer |
| | | | 2/01/2016 | | | | | | 2/1/2016 | | | | | | — | | | | | | — | | | | | | — | | | | | | — | | | | | | — | | | | | | — | | | | | | — | | |
| | | | 8/17/2016 | | | | | | 8/17/2016 | | | | | | — | | | | | | — | | | | | | — | | | | | | — | | | | | | — | | | | | | — | | | | | | — | | | ||
| | | | 6/12/2017 | | | | | | 6/12/2017 | | | | | | — | | | | | | — | | | | | | — | | | | | | — | | | | | | — | | | | | | — | | | | | | — | | | ||
| | | | | | 6/19/2020 | | | | | | 1/1/2020 | | | | | | 272,950(2) | | | | | | 545,901(2) | | | | | | 545,901 | | | | | $ | 0.09 | | | | | | 6/18/2025 | | | | | | — | | | | | | — | | |
|
Thomas A. Fitzgerald
Vice President and Chief Financial Officer |
| | | | 7/01/2018 | | | | | | 7/1/2018 | | | | | | — | | | | | | — | | | | | | — | | | | | | — | | | | | | — | | | | | | 21,229 | | | | | $ | 84,916 | | |
| | | | 6/19/2020 | | | | | | 1/1/2020 | | | | | | 80,874(2) | | | | | | 161,749(2) | | | | | | 161,749 | | | | | $ | 0.08 | | | | | | 6/18/2030 | | | | | | — | | | | | | — | | | ||
|
Name
|
| |
Fees
Earned or Paid in Cash ($) |
| |
Option
Awards ($)(1) |
| |
Total ($)
|
| |||||||||
|
Philippe P. Calais(2)
|
| | | | — | | | | | | 109,490.25 | | | | | | 109,490.25 | | |
|
Erik Manting(2)
|
| | | | — | | | | | | 109,490.25 | | | | | | 109,490.25 | | |
| | | |
Shares Beneficially
Owned Prior to Offering |
| |
Shares Beneficially
Owned After Offering |
| | ||||||||||||||||||||
|
Name and Address of Beneficial Owner(*)
|
| |
Number
|
| |
Percent
|
| |
Number
|
| |
Percent
|
| | ||||||||||||||
| 5% of Greater Stockholders | | | | | | | | | | | | | | | | | | | | | | | | | | | | |
|
Anna Moore, PhD, Co-Founder, Advisor(1)
|
| | | | 1,576,796 | | | | | | 27.5% | | | | | | 1,576,796 | | | | | | 13.2% | | | | ||
|
Judy and Patrick Carmody(2)
|
| | | | 517,705 | | | | | | 9.0% | | | | | | 517,705 | | | | | | 4.3% | | | | ||
| Named Executive Officers and Directors | | | | | | | | | | | | | | | | | | | | | | | | | | | ||
|
Robert Michael Dudley, Chief Executive Officer, President, and Director(3)
|
| | | | 1,273,352 | | | | | | 20.7% | | | | | | 1,273,352 | | | | | | 10.3% | | | | ||
|
Zdravka Medarova, PhD, Vice President, Drug Discovery(4)
|
| | | | 1,600,806 | | | | | | 27.8% | | | | | | 1,600,806 | | | | | | 13.3% | | | | ||
|
Thomas A. Fitzgerald, Vice President, Chief Financial Officer(5)
|
| | | | 254,855 | | | | | | 4.4% | | | | | | 254,855 | | | | | | 2.1% | | | | ||
|
Philippe Calais, PhD, Director(6)
|
| | | | 127,377 | | | | | | 2.2% | | | | | | 127,377 | | | | | | 1.1% | | | | ||
|
Erik Manting, PhD, Director(7)
|
| | | | — | | | | | | — | | | | | | — | | | | | | — | | | | ||
|
Magda Marquet, PhD, Director(7)
|
| | | | — | | | | | | — | | | | | | — | | | | | | — | | | | ||
|
All Directors and Named Executive Officers as a group
(6 persons) |
| | | | 3,256,390 | | | | | | 51.6% | | | | | | 3,256,390 | | | | | | 25.9% | | | | ||
|
Underwriters
|
| |
Number of Shares
|
| |||
|
ThinkEquity, a division of Fordham Financial Management, Inc.
|
| | | | 6,250,000 | | |
|
Total
|
| | | | 6,250,000 | | |
| | | |
Per Share
|
| |
With No
Over-Allotment |
| |
With Full
Over-Allotment |
| |||||||||
|
Public offering price
|
| | | $ | | | | | $ | | | | | $ | | | |||
|
Underwriting discount (7%)
|
| | | $ | | | | | $ | | | | | $ | | | |||
|
Proceeds, before expenses, to us
|
| | | $ | | | | | $ | | | | | $ | | | |||
|
Non-accountable expense allowance (1%)
|
| | | $ | | | | | $ | | | | | $ | | | | ||
| | | |
Page
|
| |||
| | | | | F-2 | | | |
| | | | | F-3 | | | |
| | | | | F-4 | | | |
| | | | | F-5 | | | |
| | | | | F-6 | | | |
| | | | | F-7 | | | |
East Brunswick, New Jersey
February 26, 2021, except for the effects of the reverse stock split described in Note 2(m), as to which the date is March 24, 2021
December 31, 2020 and 2019
| | | |
2020
|
| |
2019
|
| ||||||
|
Assets
|
| | | | | | | | | | | | |
| Current assets: | | | | | | | | | | | | | |
|
Cash and cash equivalents
|
| | | $ | 828,016 | | | | | $ | 204,471 | | |
|
Prepaid expenses and other current assets
|
| | | | 3,199 | | | | | | — | | |
|
Total current assets
|
| | | | 831,215 | | | | | | 204,471 | | |
|
Deferred offering costs
|
| | | | 224,153 | | | | | | — | | |
|
Total assets
|
| | | $ | 1,055,368 | | | | | $ | 204,471 | | |
|
Liabilities and Stockholders’ Equity (Deficit)
|
| | | | | | | | | | | | |
| Current liabilities: | | | | | | | | | | | | | |
|
Accounts payable and accrued expenses
|
| | | $ | 369,177 | | | | | $ | 27,257 | | |
|
Due to related parties
|
| | | | 35,685 | | | | | | 35,685 | | |
|
Total current liabilities
|
| | | | 404,862 | | | | | | 62,942 | | |
|
Convertible promissory notes, net of debt issuance costs and debt discount
|
| | | | 2,086,675 | | | | | | 927,810 | | |
|
Accrued interest – convertible promissory notes
|
| | | | 191,687 | | | | | | 69,978 | | |
|
Derivative liabilities
|
| | | | 1,751,000 | | | | | | 239,000 | | |
|
Warrant liability
|
| | | | 29,376 | | | | | | 14,524 | | |
|
Total liabilities
|
| | | | 4,463,600 | | | | | | 1,314,254 | | |
| Stockholders’ equity (deficit): | | | | | | | | | | | | | |
|
Preferred stock – $0.0001 par value; 5,000,000 and -0- shares authorized at
December 31, 2020 and 2019, respectively; -0- shares issued or outstanding at December 31, 2020 |
| | | | — | | | | | | — | | |
|
Common stock – $0.0001 par value, 20,000,000 shares authorized at December 31, 2020 and 2019; 4,636,216 shares issued and outstanding at December 31, 2020 and 2019
|
| | | | 464 | | | | | | 464 | | |
|
Additional paid-in capital
|
| | | | 65,949 | | | | | | 20,014 | | |
|
Subscription receivable
|
| | | | (12,763) | | | | | | (12,272) | | |
|
Accumulated deficit
|
| | | | (3,461,882) | | | | | | (1,117,989) | | |
|
Total stockholders’ equity (deficit)
|
| | | | (3,408,232) | | | | | | (1,109,783) | | |
|
Total liabilities and stockholders’ equity (deficit)
|
| | | $ | 1,055,368 | | | | | $ | 204,471 | | |
Years ended December 31, 2020 and 2019
| | | |
2020
|
| |
2019
|
| ||||||
| Operating expenses: | | | | | | | | | | | | | |
|
Research and development
|
| | | $ | 284,459 | | | | | $ | 226,309 | | |
|
General and administrative
|
| | | | 442,145 | | | | | | 230,556 | | |
|
Total operating expenses
|
| | | | 726,604 | | | | | | 456,865 | | |
|
Operating loss
|
| | | | (726,604) | | | | | | (456,865) | | |
| Other income (expense): | | | | | | | | | | | | | |
|
Change in fair value of derivative liabilities
|
| | | | (1,208,000) | | | | | | 4,000 | | |
|
Change in fair value of warrant liability
|
| | | | (14,852) | | | | | | 2,584 | | |
|
Interest expense
|
| | | | (394,573) | | | | | | (156,965) | | |
|
Interest income
|
| | | | 136 | | | | | | 34 | | |
|
Total other income (expense)
|
| | | | (1,617,289) | | | | | | (150,347) | | |
|
Loss before income taxes
|
| | | | (2,343,893) | | | | | | (607,212) | | |
|
Income tax expense (benefit)
|
| | | | — | | | | | | — | | |
|
Net loss
|
| | | $ | (2,343,893) | | | | | $ | (607,212) | | |
|
Basic and diluted loss per common share
|
| | | $ | (0.51) | | | | | $ | (0.13) | | |
|
Weighted average number of common shares outstanding, basic and diluted
|
| | | | 4,636,216 | | | | | | 4,636,216 | | |
Years ended December 31, 2020 and 2019
| | | |
Common Stock
|
| |
Additional
Paid-In Capital |
| |
Subscription
Receivable |
| |
Accumulated
Deficit |
| |
Total
Stockholders’ Equity (Deficit) |
| |||||||||||||||||||||
| | | |
Shares
|
| |
Amount
|
| ||||||||||||||||||||||||||||||
|
Balance, December 31, 2018
|
| | | | 4,636,216 | | | | | $ | 464 | | | | | $ | 18,145 | | | | | $ | (11,800) | | | | | $ | (510,777) | | | | | $ | (503,968) | | |
|
Interest on subscription receivable
|
| | | | — | | | | | | — | | | | | | 472 | | | | | | (472) | | | | | | — | | | | | | — | | |
|
Share-based compensation expense
|
| | | | — | | | | | | — | | | | | | 1,397 | | | | | | — | | | | | | — | | | | | | 1,397 | | |
|
Net loss
|
| | | | — | | | | | | — | | | | | | — | | | | | | — | | | | | | (607,212) | | | | | | (607,212) | | |
|
Balance, December 31, 2019
|
| | | | 4,636,216 | | | | | $ | 464 | | | | | $ | 20,014 | | | | | $ | (12,272) | | | | | $ | (1,117,989) | | | | | $ | (1,109,783) | | |
|
Interest on subscription receivable
|
| | | | — | | | | | | — | | | | | | 491 | | | | | | (491) | | | | | | — | | | | | | — | | |
|
Share-based compensation expense
|
| | | | — | | | | | | — | | | | | | 45,444 | | | | | | — | | | | | | — | | | | | | 45,444 | | |
|
Net loss
|
| | | | — | | | | | | — | | | | | | — | | | | | | — | | | | | | (2,343,893) | | | | | | (2,343,893) | | |
|
Balance, December 31, 2020
|
| | | | 4,636,216 | | | | | $ | 464 | | | | | $ | 65,949 | | | | | $ | (12,763) | | | | | $ | (3,461,882) | | | | | $ | (3,408,232) | | |
Years ended December 31, 2020 and 2019
| | | |
2020
|
| |
2019
|
| ||||||
| Cash flows from operating activities: | | | | | | | | | | | | | |
|
Net loss
|
| | | $ | (2,343,893) | | | | | $ | (607,212) | | |
|
Adjustments to reconcile net loss to net cash used in operating activities:
|
| | | | | | | | | | | | |
|
Share-based compensation expense
|
| | | | 45,444 | | | | | | 1,397 | | |
|
Change in fair market value of derivative liabilities
|
| | | | 1,208,000 | | | | | | (4,000) | | |
|
Change in fair market value of warrant liability
|
| | | | 14,852 | | | | | | (2,584) | | |
|
Non-cash interest expense
|
| | | | 272,864 | | | | | | 108,595 | | |
|
Changes in operating assets and liabilities:
|
| | | | | | | | | | | | |
|
Prepaid expenses and other current assets
|
| | | | (3,199) | | | | | | 1,667 | | |
|
Accounts payable and accrued expenses
|
| | | | 191,253 | | | | | | (54,741) | | |
|
Accrued interest on convertible promissory notes
|
| | | | 121,709 | | | | | | 48,370 | | |
|
Net cash used in operating activities
|
| | | | (492,971) | | | | | | (508,508) | | |
| Cash flows from financing activities: | | | | | | | | | | | | | |
|
Proceeds from convertible promissory notes
|
| | | | 1,190,000 | | | | | | 500,000 | | |
|
Payments of deferred offering costs
|
| | | | (73,484) | | | | | | — | | |
|
Net cash provided by financing activities
|
| | | | 1,116,516 | | | | | | 500,000 | | |
|
Net change in cash and cash equivalents
|
| | | | 623,545 | | | | | | (8,508) | | |
|
Cash and cash equivalents, beginning of year
|
| | | | 204,471 | | | | | | 212,979 | | |
|
Cash and cash equivalents, end of year
|
| | | $ | 828,016 | | | | | $ | 204,471 | | |
| Supplemental disclosure of cash flow | | | | | | | | | | | | | |
|
Cash paid during the year for
|
| | | | | | | | | | | | |
|
Interest
|
| | | $ | — | | | | | $ | — | | |
|
Income taxes
|
| | | $ | — | | | | | $ | — | | |
| Supplemental disclosure of non-cash investing and financing activities | | | | | | | | | | | | | |
|
Accrued interest on subscriptions receivable
|
| | | $ | (491) | | | | | $ | (472) | | |
|
Debt discounts associated with derivative liabilities of convertible promissory
notes |
| | | $ | 304,000 | | | | | $ | 117,000 | | |
|
Deferred offering costs included in accounts payable and accrued expenses
|
| | | $ | 150,669 | | | | | $ | — | | |
December 31, 2020 and 2019
December 31, 2020 and 2019
December 31, 2020 and 2019
December 31, 2020 and 2019
December 31, 2020 and 2019
December 31, 2020 and 2019
| | | |
Fair value measurements as of
December 31, 2019, using: |
| |||||||||||||||||||||
| | | |
Level 1
|
| |
Level 2
|
| |
Level 3
|
| |
Total
|
| ||||||||||||
| Liabilities | | | | | | | | | | | | | | | | | | | | | | | | | |
|
Derivative liabilities
|
| | | $ | — | | | | | $ | — | | | | | $ | 239,000 | | | | | $ | 239,000 | | |
|
Warrant liability
|
| | | | — | | | | | | — | | | | | | 14,524 | | | | | | 14,524 | | |
| | | | | $ | — | | | | | $ | — | | | | | $ | 253,524 | | | | | $ | 253,524 | | |
December 31, 2020 and 2019
| | | |
Fair value measurements as of
December 31, 2020, using: |
| |||||||||||||||||||||
| | | |
Level 1
|
| |
Level 2
|
| |
Level 3
|
| |
Total
|
| ||||||||||||
| Liabilities | | | | | | | | | | | | | | | | | | | | | | | | | |
|
Derivative liabilities
|
| | | $ | — | | | | | $ | — | | | | | | 1,751,000 | | | | | | 1,751,000 | | |
|
Warrant liability
|
| | | | — | | | | | | — | | | | | | 29,376 | | | | | | 29,376 | | |
| | | | | $ | — | | | | | $ | — | | | | | $ | 1,780,376 | | | | | | 1,780,376 | | |
| | | |
December 31,
|
| |||||||||
| | | |
2020
|
| |
2019
|
| ||||||
|
Professional fees
|
| | | $ | 193,281 | | | | | $ | 1,650 | | |
|
Consulting fees
|
| | | | 80,013 | | | | | | — | | |
|
Research and development billings
|
| | | | 51,806 | | | | | | — | | |
|
State filing and other fees
|
| | | | 1,778 | | | | | | 607 | | |
|
Accrued license payments
|
| | | | 42,300 | | | | | | 25,000 | | |
| | | | | $ | 369,178 | | | | | $ | 27,257 | | |
December 31, 2020 and 2019
|
Milestone Event
|
| |
Amount
|
| |||
|
Enrollment of first patient in a phase II clinical trial of a therapeutic product or process
|
| | | $ | 100,000 | | |
|
Enrollment of first patient in a phase III clinical trial of a therapeutic product or process
|
| | | $ | 200,000 | | |
|
First commercial sale of a therapeutic product or process
|
| | | $ | 1,000,000 | | |
|
Filing of an application for regulatory approval of a clinical diagnostic product or process
|
| | | $ | 100,000 | | |
|
First regulatory approval of a clinical diagnostic product or process
|
| | | $ | 150,000 | | |
December 31, 2020 and 2019
December 31, 2020 and 2019
|
Note Identifier
|
| |
Issue Date
|
| |
Principal
Amount |
| |
Accrued Interest at
December 31, 2020 |
| |
Accrued Interest at
December 31, 2019 |
| |||||||||
|
Note One
|
| |
May 2, 2018
|
| | | $ | 500,000 | | | | | $ | 80,137 | | | | | $ | 50,055 | | |
|
Note Two
|
| |
June 26, 2018
|
| | | $ | 50,000 | | | | | $ | 7,562 | | | | | $ | 4,553 | | |
|
Note Three
|
| |
March 2, 2019
|
| | | $ | 100,000 | | | | | $ | 10,767 | | | | | $ | 4,751 | | |
|
Note Four
|
| |
March 5, 2019
|
| | | $ | 50,000 | | | | | $ | 5,466 | | | | | $ | 2,458 | | |
|
Note Five
|
| |
March 8, 2019
|
| | | $ | 50,000 | | | | | $ | 5,384 | | | | | $ | 2,375 | | |
|
Note Six
|
| |
March 15, 2019
|
| | | $ | 50,000 | | | | | $ | 5,326 | | | | | $ | 2,318 | | |
|
Note Seven
|
| |
March 20, 2019
|
| | | $ | 50,000 | | | | | $ | 5,293 | | | | | $ | 2,285 | | |
|
Note Eight
|
| |
November 7, 2019
|
| | | $ | 100,000 | | | | | $ | 6,723 | | | | | $ | 723 | | |
|
Note Nine
|
| |
November 7, 2019
|
| | | $ | 100,000 | | | | | $ | 6,460 | | | | | $ | 460 | | |
|
Note Ten
|
| |
February 17, 2020
|
| | | $ | 1,000,000 | | | | | $ | 50,984 | | | | | | — | | |
|
Note Eleven
|
| |
April 3, 2020
|
| | | $ | 40,000 | | | | | $ | 1,790 | | | | | | — | | |
|
Note Twelve
|
| |
May 8, 2020
|
| | | $ | 50,000 | | | | | $ | 1,951 | | | | | | — | | |
|
Note Thirteen
|
| |
May 8, 2020
|
| | | $ | 50,000 | | | | | $ | 1,951 | | | | | | — | | |
|
Note Fourteen
|
| |
May 15, 2020
|
| | | $ | 50,000 | | | | | $ | 1,893 | | | | | | — | | |
| | | |
2020
|
| |
2019
|
| ||||||
|
Principal amount of convertible promissory notes
|
| | | $ | 2,240,000 | | | | | $ | 1,050,000 | | |
|
Less unamortized debt issuance costs
|
| | | | (8,002) | | | | | | (18,540) | | |
|
Less unamortized debt discounts
|
| | | | (145,323) | | | | | | (103,650) | | |
|
Convertible promissory notes, net
|
| | | $ | 2,086,675 | | | | | $ | 927,810 | | |
December 31, 2020 and 2019
| |
Unvested restricted common stock at December 31, 2018
|
| | | | 1,395,815 | | |
| |
Shares issued
|
| | | | — | | |
| |
Shares vested
|
| | | | (809,122) | | |
| |
Unvested restricted common stock at December 31, 2019
|
| | | | 586,693 | | |
| |
Shares issued
|
| | | | — | | |
| |
Shares vested
|
| | | | (440,209) | | |
| |
Unvested restricted common stock at December 31, 2020
|
| | | | 146,483 | | |
December 31, 2020 and 2019
| | | |
Warrant Liability
|
| |||
|
Fair value at December 31, 2018
|
| | | $ | 17,108 | | |
|
Change in fair value
|
| | | | (2,584) | | |
|
Fair value at December 31, 2019
|
| | | | 14,524 | | |
|
Change in fair value
|
| | | | 14,852 | | |
|
Fair value at December 31, 2020
|
| | | $ | 29,376 | | |
| | | |
As of December 31,
|
| |||||||||
| | | |
2020
|
| |
2019
|
| ||||||
|
Fair value per share of Company’s common stock
|
| | | $ | 3.91 | | | | | $ | 0.08 | | |
December 31, 2020 and 2019
| | | |
As of December 31,
|
| |||||||||
| | | |
2020
|
| |
2019
|
| ||||||
|
Dividend yield
|
| | | | 0.0% | | | | | | 0.0% | | |
|
Expected volatility
|
| | | | 84.0% | | | | | | 79.0% | | |
|
Risk Free interest rate
|
| | | | 0.3% | | | | | | 1.7% | | |
|
Expected life (years)
|
| | | | 4.67 | | | | | | 4.73 | | |
|
Fair value of warrants
|
| | | $ | 29,376 | | | | | $ | 14,524 | | |
| | | |
Number
of shares |
| |
Weighted
average exercise price per share |
| |
Weighted
average remaining contractual term (years) |
| |||||||||
|
Outstanding at December 31, 2019
|
| | | | — | | | | | | — | | | | | | — | | |
|
Granted
|
| | | | 1,756,279 | | | | | $ | 0.25 | | | | | | 6.4 | | |
|
Exercised
|
| | | | — | | | | | | — | | | | | | — | | |
December 31, 2020 and 2019
| | | |
Number
of shares |
| |
Weighted
average exercise price per share |
| |
Weighted
average remaining contractual term (years) |
| |||||||||
|
Forfeited
|
| | | | — | | | | | | — | | | | | | — | | |
|
Outstanding at December 31, 2020
|
| | | | 1,756,279 | | | | | $ | 0.25 | | | | | | 6.4 | | |
| | |||||||||||||||||||
| | | |
Year ended
December 31, 2020 |
|
|
Risk-free interest rate
|
| |
0.25% - 0.55%
|
|
|
Expected term (in years)
|
| |
3.5 - 6.25
|
|
|
Expected volatility
|
| |
95.83% - 97.20%
|
|
|
Expected dividend yield
|
| |
0%
|
|
|
Fair value of underlying stock
|
| |
$0.08 - $3.91
|
|
| | | |
Years Ended
December 31, |
| |||||||||
| | | |
2020
|
| |
2019
|
| ||||||
| Numerator | | | | | | | | | | | | | |
|
Net loss
|
| | | $ | (2,343,893) | | | | | $ | (607,212) | | |
| Denominator | | | | | | | | | | | | | |
|
Weighted-average common shares outstanding, basic and diluted
|
| | | | 4,636,216 | | | | | | 4,636,216 | | |
|
Net loss per share attributable to common stockholders, basic and diluted
|
| | | $ | (0.51) | | | | | $ | (0.13) | | |
December 31, 2020 and 2019
| | | |
December 31,
|
| |||||||||
| | | |
2020
|
| |
2019
|
| ||||||
|
Shares issuable on conversion of Promissory Notes
|
| | | | 1,038,309 | | | | | | 471,757 | | |
|
Shares issuable on exercise of Warrants
|
| | | | 12,385 | | | | | | 11,584 | | |
|
Shares issuable on exercise of vested Options
|
| | | | 353,824 | | | | | | — | | |
| | | |
December 31,
|
| |||||||||
| | | |
2020
|
| |
2019
|
| ||||||
|
Federal income tax benefit at statutory rate
|
| | | | 21.0% | | | | | | 21.0% | | |
|
State and local tax, net of federal benefit
|
| | | | 1.9% | | | | | | 4.9% | | |
|
Permanent differences
|
| | | | (14.8)% | | | | | | (4.8)% | | |
|
Change in valuation allowance
|
| | | | (7.5)% | | | | | | (21.1)% | | |
|
Effective Income Tax rate
|
| | | | 0.0% | | | | | | 0.0% | | |
| | | |
December 31,
|
| |||||||||
| | | |
2020
|
| |
2019
|
| ||||||
|
Net operating loss carryforwards
|
| | | $ | 421,000 | | | | | $ | 243,000 | | |
|
Capitalized research and development costs, start-up costs and amortization
|
| | | | 14,000 | | | | | | 17,000 | | |
|
Total deferred tax assets
|
| | | | 435,000 | | | | | | 260,000 | | |
|
Less valuation allowance
|
| | | | (435,000) | | | | | | (260,000) | | |
|
Net deferred taxes
|
| | | $ | — | | | | | $ | — | | |
December 31, 2020 and 2019
December 31, 2020 and 2019
| | | |
Amount Paid
or to Be Paid |
| |||
|
SEC registration fee
|
| | | $ | 3,675 | | |
|
FINRA filing fee
|
| | | $ | 4,800 | | |
|
Printing and mailing
|
| | | $ | 125,000 | | |
|
Legal fees and expenses
|
| | | $ | 475,000 | | |
|
Accounting fees and expenses
|
| | | $ | 175,000 | | |
|
Transfer agent and registrar fees and expenses
|
| | | $ | 4,000 | | |
|
Miscellaneous
|
| | | $ | 187,525 | | |
|
Total
|
| | | $ | 975,000 | | |
|
Exhibit
number |
| |
Description
|
|
| 1.1** | | | | |
| 3.1** | | | | |
| 3.2** | | | | |
| 3.3** | | | | |
| 3.4** | | | | |
| 3.5** | | | | |
| 4.1** | | | | |
| 4.2** | | | | |
| 5.1 | | | | |
| 10.1**# | | | | |
| 10.2**# | | | | |
| 10.3**# | | | | |
| 10.4**# | | | | |
| 10.5**# | | | | |
| 10.6**† | | | | |
| 10.7**† | | | First Amendment to Exclusive Patent License Agreement by and between TransCode Therapeutics, Inc. and The General Hospital Corporation, d/b/a Massachusetts General Hospital, dated as of October 30, 2020. | |
| 10.8**# | | | | |
| 10.9**# | | | Employment Agreement, dated as of March 24, 2021, by and Between TransCode Therapeutics, Inc. and Robert Michael Dudley. | |
| 10.10**# | | | Letter Agreement, dated as of March 24, 2021, by and Between TransCode Therapeutics, Inc. and Robert Michael Dudley. | |
| 10.11**# | | | Employment Agreement, dated as of March 24, 2021, by and Between TransCode Therapeutics, Inc. and Thomas A. Fitzgerald. | |
| 10.12**# | | | | |
| 23.1 | | | | |
| 23.2 | | | | |
| 24.1** | | | |
Chief Executive Officer
| |
NAME
|
| |
TITLE
|
| |
DATE
|
|
| |
/s/ Robert Michael Dudley
Robert Michael Dudley
|
| |
Director and Chief Executive Officer (Principal Executive Officer)
|
| |
May 3, 2021
|
|
| |
/s/ Thomas A. Fitzgerald
Thomas A. Fitzgerald, MBA
|
| |
Director and Chief Financial Officer (Principal Financial and Accounting Officer)
|
| |
May 3, 2021
|
|
| |
*
Philippe P. Calais, PhD
|
| |
Director
|
| |
May 3, 2021
|
|
| |
*
Erik Manting, PhD
|
| |
Director
|
| |
May 3, 2021
|
|
| |
*
Magda Marquet, PhD
|
| |
Director
|
| |
May 3, 2021
|
|
| |
*Pursuant to Power of Attorney
By:
/s/ Thomas A. Fitzgerald
Attorney-in-Fact
|
| | | ||||
Exhibit 5.1
| May 3, 2021 |
Transcode Therapeutics, Inc.
6 Liberty Square, #2382
Boston, MA 02109
Re: Securities Registered under Registration Statement on Form S-1
Ladies and Gentlemen:
We have acted as counsel to you in connection with your filing of a Registration Statement on Form S-1 (File No. 333-253599) (as amended or supplemented, the "Registration Statement") pursuant to the Securities Act of 1933, as amended (the “Securities Act”), relating to the registration of the offering by Transcode Therapeutics, Inc., a Delaware corporation (the “Company”) of up to 7,187,500 shares (the “Shares”) of the Company’s Common Stock, $0.0001 par value per share, including Shares purchasable by the underwriters upon their exercise of an over-allotment option granted to the underwriters by the Company, and warrants (the “Representative Warrants”) to purchase up to 312,500 shares of Common Stock as contemplated pursuant to the registration statement (the “Representative Warrant Shares”). The Shares are being sold to the several underwriters named in, and pursuant to, an underwriting agreement among the Company and such underwriters (the "Underwriting Agreement").
We have reviewed such documents and made such examination of law as we have deemed appropriate to give the opinions set forth below. We have relied, without independent verification, on certificates of public officials and, as to matters of fact material to the opinions set forth below, on certificates of officers of the Company.
The opinion set forth below is limited to the Delaware General Corporation Law.
Based on the foregoing, we are of the opinion that (i) the Company Shares have been duly authorized and, upon issuance and delivery against payment therefor in accordance with the terms of the Underwriting Agreement, the Company Shares will be validly issued, fully paid and non-assessable and (ii) the Representative Warrants have been duly and validly authorized and when and sold in accordance with the terms and conditions of the Underwriting Agreement, will be valid and binding obligations of the Company and (iii) the Representative Warrant Shares, when issued, sold and paid for in accordance with the terms of the Representative Warrants, will be validly issued, fully paid and non-assessable.
We hereby consent to the inclusion of this opinion as Exhibit 5.1 to the Registration Statement and to the references to our firm under the caption "Legal Matters" in the Registration Statement. In giving our consent, we do not admit that we are in the category of persons whose consent is required under Section 7 of the Securities Act or the rules and regulations thereunder.
| Very truly yours, | |
| /s/ Goodwin Procter LLP | |
| GOODWIN PROCTER LLP |
Exhibit 23.1
CONSENT OF INDEPENDENT REGISTERED PUBLIC ACCOUNTING FIRM
We hereby consent to the incorporation by reference in the Prospectus constituting a part of this Registration Statement of our report dated February 26, 2021, except for the effects of the reverse stock split described in Note 2(m), as to which the date is March 24, 2021, which includes an explanatory paragraph relating to the Company’s ability to continue as a going concern, relating to the financial statements of Transcode Therapeutics, Inc. as of and for the years ended December 31, 2020 and 2019. We also consent to the reference to us under the caption “Experts” in the Prospectus.
| /s/ WithumSmith+Brown, PC | |
| East Brunswick, New Jersey | |
| May 3, 2021 |