
Western Alliance Bancorporation 8-K, filed Oct 19, 2026
Western Alliance Bancorporation (WAL)
8-K
2026-10-19
For: 2026-10-19
View Original
Added on
October 19, 2026
About this 8-K
Western Alliance Bancorporation filed this 8-K on October 19, 2026.
Western Alliance Bancorporation reported third-quarter 2026 net income of $277.2 million and diluted EPS of $2.45, up from $260.5 million and $2.28 a year earlier. Net interest margin expanded to 3.57% and deposits were $81.8 billion at September 30, 2026. AI summary
Items reported
- Item 2.02: Financial results
- Item 9.01: Financial statements and exhibits
UNITED STATES
SECURITIES AND EXCHANGE COMMISSION
Washington, D.C. 20549
FORM 8-K
CURRENT REPORT
Pursuant to Section 13 or 15(d) of the
Securities Exchange Act of 1934
Date of Report (Date of earliest event reported): October 19, 2026
(Exact name of registrant as specified in its charter)
| (State or other jurisdiction of incorporation) | (Commission File Number) | (IRS Employer Identification No.) | ||||||||||||
(Address of principal executive offices) (Zip Code)
(602 ) 389-3500
(Registrant's telephone number, including area code)
Not Applicable
(Former name or former address, if changed since last report)
Check the appropriate box below if the Form 8-K filing is intended to simultaneously satisfy the filing obligation of the registrant under any of the following provisions:
Securities registered pursuant to Section 12(b) of the Act:
| Title of each class | Trading Symbol(s) | Name of each exchange on which registered | ||||||||||||
Depositary Shares, Each Representing a 1/400th Interest in a Share of 4.250% Fixed-Rate Reset Non-Cumulative Perpetual Preferred Stock, Series A | ||||||||||||||
Indicate by check mark whether the registrant is an emerging growth company as defined in Rule 405 of the Securities Act of 1933 (§230.405 of this chapter) or Rule 12b-2 of the Securities Exchange Act of 1934 (§240.12b-2 of this chapter).
Emerging growth company ☐
If an emerging growth company, indicate by check mark if the registrant has elected not to use the extended transition period for complying with any new or revised financial accounting standards provided pursuant to Section 13(a) of the Exchange Act. ¨
ITEM 2.02. RESULTS OF OPERATIONS AND FINANCIAL CONDITION.
On October 19, 2026, Western Alliance Bancorporation (the “Company”) issued a press release reporting results for the fiscal quarter ended September 30, 2026 and posted on its website its third quarter 2026 Earnings Conference Call Presentation, which contains certain additional historical and forward-looking information relating to the Company. Copies of the press release and presentation slides are attached hereto as Exhibits 99.1 and 99.2, respectively.
The information in this report (including Exhibits 99.1 and 99.2 hereto) is being “furnished” and shall not be deemed “filed” for the purposes of Section 18 of the Securities Exchange Act of 1934, as amended, is not subject to the liabilities of that section and is not deemed incorporated by reference in any filing under the Securities Act of 1933, as amended, or the Securities Exchange Act of 1934, as amended, except as shall be expressly set forth by specific reference in such filing.
ITEM 9.01. FINANCIAL STATEMENTS AND EXHIBITS.
(d) Exhibits.
| 99.1 | ||||||||
| 99.2 | ||||||||
| 104 | Cover Page Interactive Data File (embedded within the Inline XBRL document) | |||||||
SIGNATURES
Pursuant to the requirements of the Securities Exchange Act of 1934, the registrant has duly caused this report to be signed on its behalf by the undersigned hereunto duly authorized.
| WESTERN ALLIANCE BANCORPORATION | ||||||||
| (Registrant) | ||||||||
| /s/ Vishal Idnani | ||||||||
| Vishal Idnani | ||||||||
| Chief Financial Officer | ||||||||
| Date: | October 19, 2026 | |||||||
| Western Alliance Bancorporation |  | |||||||
| One East Washington Street | ||||||||
| Phoenix, AZ 85004 | ||||||||
| www.westernalliancebancorporation.com | ||||||||
PHOENIX--(BUSINESS WIRE)--October 19, 2026
THIRD QUARTER 2026 FINANCIAL RESULTS
| Quarter Highlights: | ||||||||||||||||||||||||||||||||
| Net income | Diluted earnings per share | PPNR1 | Net interest margin | Efficiency ratio1 | Book value per common share | |||||||||||||||||||||||||||
| $277.2 million | $2.45 | $419.1 million | 3.57% | 58.1% | $68.14 | |||||||||||||||||||||||||||
50.0%, adjusted for deposit costs1 | $62.22, excluding goodwill and intangibles1 | |||||||||||||||||||||||||||||||
| CEO COMMENTARY: | ||||||||||||||||||||||||||
“Western Alliance’s third quarter results featured enhanced profitability, lower deposit costs, improved asset quality and stronger reserve coverage, as well as accelerated share repurchase activity,” said Kenneth A. Vecchione, Chairman, President and Chief Executive Officer. “Strong execution generated pre-provision net revenue1 of $419 million, up $25 million, or 6.4%, year-over-year and earnings per share of $2.45, up $0.17, or 7.5%. Return on average assets of 1.12% and return on average tangible common equity1 of 15.5% both increased for the second consecutive quarter. Deposit optimization actions totaling $4.5 billion over the past two quarters drove a $14 million, or 8%, quarterly decline in ECR-related deposit costs. Strong commercial banking deposit growth offset the optimization activity, keeping total deposits stable at $81.8 billion. Net interest income increased $11 million from the prior quarter, while net interest margin expanded 4 basis points quarterly to 3.57%. Asset quality improved notably, with nonaccrual loans declining $77 million, or approximately 14%, to 0.79% of funded HFI loans. Continued reserve building increased ACL coverage of funded HFI loans by 4 basis points to 0.93% and raised ACL coverage of nonaccrual loans from 96% to 118%. Net charge-offs declined 7 basis points quarterly to 0.30%, the midpoint of our 2026 guidance range. We continued to prioritize shareholder returns, repurchasing $92 million of shares.” | ||||||||||||||||||||||||||
| LINKED-QUARTER BASIS | YEAR-OVER-YEAR | ||||
| FINANCIAL HIGHLIGHTS: | |||||
▪Net income of $277.2 million and earnings per share of $2.45, up 3.1% and 3.8%, from $268.8 million and $2.36, respectively | ▪Net income of $277.2 million and earnings per share of $2.45, up 6.4% and 7.5%, from $260.5 million and $2.28, respectively | ||||
▪Net revenue of $1.0 billion, increased 1.9%, or $18.5 million, from $995.7 million | ▪Net revenue of $1.0 billion, increased 8.1%, or $76.0 million, from $938.2 million | ||||
▪Pre-provision net revenue1 of $419.1 million, up $6.7 million, or 1.6%, from $412.4 million | ▪Pre-provision net revenue1 of $419.1 million, up $25.3 million, or 6.4%, from $393.8 million | ||||
▪Effective tax rate of 18.3%, compared to 19.0% | ▪Effective tax rate of 18.3%, compared to 17.0% | ||||
▪Repurchased $92.1 million, or 1.15 million shares at an average price of $79.78 per share | |||||
| FINANCIAL POSITION RESULTS: | |||||
▪HFI loans of $61.5 billion, up $600 million, or 1.0% | ▪Increase in HFI loans of $4.9 billion, or 8.7% | ||||
▪Total deposits of $81.8 billion, down $119 million, or 0.1% | ▪Increase in total deposits of $4.5 billion, or 5.8% | ||||
▪HFI loan-to-deposit ratio of 75.3%, up from 74.4% | ▪HFI loan-to-deposit ratio of 75.3%, up from 73.3% | ||||
▪Total equity of $7.9 billion, down $188 million, or 2.3% | ▪Increase in total equity of $257 million, or 3.3% | ||||
| LOANS AND ASSET QUALITY: | |||||
▪Nonaccrual loans to funded HFI loans of 0.79%, decreased from 0.92% | ▪Nonaccrual loans to funded HFI loans of 0.79%, decreased from 0.92% | ||||
▪Nonaccrual loans and repossessed assets to total assets of 0.66%, decreased from 0.70% | ▪Nonaccrual loans and repossessed assets to total assets of 0.66%, decreased from 0.72% | ||||
▪Allowance for credit losses to funded HFI loans of 0.93%, increased 4 basis points from 0.89% | ▪Allowance for credit losses to funded HFI loans of 0.93%, increased 8 basis points from 0.85% | ||||
▪Allowance for credit losses to nonaccrual loans of 118%, increased 22% from 96% | ▪Allowance for credit losses to nonaccrual loans of 118%, increased 26% from 92% | ||||
▪Annualized net loan charge-offs to average loans outstanding of 0.30%, compared to 0.37% | ▪Annualized net loan charge-offs to average loans outstanding of 0.30%, compared to 0.22% | ||||
| KEY PERFORMANCE METRICS: | |||||
▪Net interest margin of 3.57%, increased from 3.53% | ▪Net interest margin of 3.57%, increased from 3.53% | ||||
▪Return on average assets and on tangible common equity1 of 1.12% and 15.5%, compared to 1.09% and 15.3%, respectively | ▪Return on average assets and on tangible common equity1 of 1.12% and 15.5%, compared to 1.13% and 15.6%, respectively | ||||
▪Tangible common equity ratio1 of 6.9%, decreased from 7.0% | ▪Tangible common equity ratio1 of 6.9%, decreased from 7.1% | ||||
▪CET1 ratio of 10.9%, compared to 11.0% | ▪CET1 ratio of 10.9%, compared to 11.3% | ||||
▪Tangible book value per share1, net of tax, of $62.22, decreased 1.6% from $63.24 | ▪Tangible book value per share1, net of tax, of $62.22, increased 6.3% from $58.56 | ||||
▪Efficiency ratio1 of 58.1%, increased 0.1%, from 58.0%, while the efficiency ratio, adjusted for deposit costs1 increased 1.1% to 50.0% from 48.9% | ▪Efficiency ratio1 of 58.1%, increased 0.7%, from 57.4%, while the efficiency ratio, adjusted for deposit costs1 increased 2.2% to 50.0% from 47.8% | ||||
1 See Reconciliation of Non-GAAP Financial Measures beginning on page 16.
Income Statement
Net interest income totaled $807.6 million in the third quarter 2026, an increase of $10.7 million, or 1.3%, from $796.9 million in the second quarter 2026, and an increase of $57.2 million, or 7.6%, compared to $750.4 million in the third quarter 2025. The increase from the second quarter 2026 was primarily due to higher yields on interest earning assets and higher average HFI loan balances, partially offset by lower average balances in cash and other interest earning assets and an increase in average interest bearing liabilities and the related costs of these liabilities. The increase in net interest income from the third quarter 2025 was primarily driven by an increase in average interest earning asset balances of $5.5 billion and lower rates on interest bearing liabilities, partially offset by declining yields on interest earning assets.
The Company recorded a provision for credit losses of $80.0 million in the third quarter 2026, compared with $80.4 million in the second quarter 2026, and $80.0 million in the third quarter 2025. The provision for credit losses during the third quarter 2026 was primarily driven by net charge-offs totaling $45.8 million, loan growth, and proactive provisioning for macroeconomic risks associated with the higher interest rate environment. These factors increased the total allowance for credit losses to funded HFI loans ratio from 89 basis points in the prior quarter to 93 basis points.
The Company’s net interest margin increased to 3.57% in the third quarter 2026 from 3.53% in both the second quarter 2026 and the third quarter 2025. Net interest margin increased from the second quarter 2026 due to higher yields on interest earning assets, partially offset by higher costs on interest bearing liabilities. Net interest margin increased from the third quarter 2025 as an increase of $5.5 billion in average interest earning assets and lower interest bearing liability costs more than offset declining yields on interest earning assets.
Non-interest income was $206.6 million for the third quarter 2026, compared to $198.8 million for the second quarter 2026, and $187.8 million for the third quarter 2025. The increase in non-interest income of $7.8 million from the second quarter 2026 was primarily due to increases in gain on sales of investment securities of $13.8 million, partially offset by a decrease in mortgage banking revenue of $5.2 million. The increase in non-interest income of $18.8 million from the third quarter 2025 was primarily driven by increases in service charges and fees and gain on sales of investment securities, partially offset by a decrease in mortgage banking revenue.
Net revenue totaled $1.0 billion for the third quarter 2026, up $18.5 million, or 1.9%, from $995.7 million in the second quarter 2026, and $76.0 million, or 8.1%, from $938.2 million in the third quarter 2025.
Non-interest expense was $595.1 million for the third quarter 2026, compared to $583.3 million for the second quarter 2026, and $544.4 million for the third quarter 2025. The increase in non-interest expense of $11.8 million from the second quarter 2026 was primarily due to an increase in salaries and employee benefits of $21.8 million, partially offset by a decrease of $13.8 million in deposit costs driven by decreased average ECR-related deposit balances. The increase in non-interest expense of $50.7 million from the third quarter 2025 was primarily attributable to increased salaries and employee benefits of $32.6 million and increased data processing costs of $7.7 million. These increases were partially offset by decreased deposit costs of $9.7 million driven by decreased average ECR-related deposit balances.
The Company's efficiency ratio was 58.1% for the third quarter 2026, compared to 58.0% for the second quarter 2026, and 57.4% for the third quarter 2025. The Company’s efficiency ratio, adjusted for deposit costs1, was 50.0% for the third quarter 2026, compared to 48.9% for the second quarter 2026, and 47.8% for the third quarter 2025.
Income tax expense was $61.9 million for the third quarter 2026, compared to $63.2 million for the second quarter 2026, and $53.3 million for the third quarter 2025. The decrease in income tax expense from the second quarter 2026 was primarily driven by increases in investment tax credits. The increase in income tax expense from the third quarter 2025 was primarily driven by an increase in pretax income.
Net income was $277.2 million for the third quarter 2026, an increase of $8.4 million from $268.8 million for the second quarter 2026, and an increase of $16.7 million from $260.5 million for the third quarter 2025. Earnings per share totaled $2.45 for the third quarter 2026, compared to $2.36 for the second quarter 2026, and $2.28 for the third quarter 2025.
The Company believes its pre-provision net revenue1 ("PPNR"), which it defines as net revenue less non-interest expense, is a key metric for assessing the Company’s earnings power. For the third quarter 2026, the Company’s PPNR1 was $419.1 million, up $6.7 million from $412.4 million in the second quarter 2026, and up $25.3 million from $393.8 million in the third quarter 2025.
1 See Reconciliation of Non-GAAP Financial Measures beginning on page 16.
2
Balance Sheet
HFI loans, net of deferred fees, totaled $61.5 billion at September 30, 2026, compared to $60.9 billion at June 30, 2026, and $56.6 billion at September 30, 2025. The $600 million increase from the prior quarter end primarily reflected increases of $396 million in commercial real estate non-owner occupied loans and $336 million in commercial and industrial loans, partially offset by a $111 million decrease in residential real estate loans. The $4.9 billion increase from September 30, 2025 was primarily attributable to increases of $4.4 billion in commercial and industrial loans, $286 million in residential real estate loans, $210 million in commercial real estate non-owner occupied loans, and $173 million in construction and land development loans, partially offset by a $121 million decrease in commercial real estate owner occupied loans. HFS loans totaled $4.0 billion at September 30, 2026, compared to $4.3 billion at June 30, 2026, and $3.5 billion at September 30, 2025. The $396 million decrease from the prior quarter end primarily reflected lower loan funding volume during the quarter and unfavorable fair value changes resulting from higher interest rates. The $449 million increase from September 30, 2025 was primarily attributable to higher period-end inventory levels resulting from the timing of loan production and sales activity, as well as increased early buyout activity.
The Company's allowance for credit losses on HFI loans comprises allowances for funded HFI loans and unfunded loan commitments. The allowance for loan losses as a percentage of funded HFI loans was 0.83% at September 30, 2026, 0.80% at June 30, 2026, and 0.78% at September 30, 2025. Including the allowance for unfunded loan commitments, the allowance for credit losses as a percentage of funded HFI loans was 0.93% at September 30, 2026, 0.89% at June 30, 2026, and 0.85% at September 30, 2025. Through credit linked note transactions, the Company effectively transfers a portion of the risk of losses on reference pools of loans to the purchasers of the notes. These transactions provide first-loss protection on reference pools of loans that totaled $7.6 billion, $7.8 billion, and $8.2 billion as of September 30, 2026, June 30, 2026, and September 30, 2025, respectively. However, as these note transactions are considered freestanding credit enhancements, the allowance for credit losses cannot be reduced for expected credit losses that these notes may mitigate. Accordingly, the allowance ratios include $11.6 million, $10.2 million, and $11.8 million related to these pools of loans as of September 30, 2026, June 30, 2026, and September 30, 2025, respectively. The allowance for credit losses to funded HFI loans ratio, adjusted to reduce the HFI loan balance by the amount of loans in covered reference pools, was 1.07% at September 30, 2026, 1.01% at June 30, 2026, and 1.00% at September 30, 2025.
Deposits totaled $81.8 billion at September 30, 2026, a decrease of $119 million from June 30, 2026, and an increase of $4.5 billion from $77.2 billion at September 30, 2025. The decline in deposits from the prior quarter primarily reflected a $2.1 billion decrease in non-interest bearing deposits, partially offset by increases of $871 million in interest bearing demand deposits, $754 million in certificates of deposit, and $324 million in savings and money market accounts. Deposit optimization efforts drove the decline in non-interest bearing deposits, partially offset by strong commercial banking growth in interest bearing deposits. From September 30, 2025, interest bearing demand deposits, certificates of deposit, and savings and money market accounts increased $3.7 billion, $1.1 billion, and $583 million, respectively, while non-interest bearing deposits decreased $876 million. Non-interest bearing deposits totaled $25.8 billion at September 30, 2026, compared to $27.8 billion at June 30, 2026, and $26.6 billion at September 30, 2025.
The Company’s ratio of HFI loans to deposits was 75.3% at September 30, 2026, compared to 74.4% at June 30, 2026, and 73.3% at September 30, 2025.
Borrowings totaled $5.6 billion at September 30, 2026, compared with $6.2 billion at June 30, 2026, and $3.9 billion at September 30, 2025. Borrowings decreased $623 million from June 30, 2026, reflecting declines of $515 million in short-term borrowings and $108 million in long-term borrowings. Borrowings increased $1.8 billion from September 30, 2025, as a $3.3 billion increase in short-term borrowings was partially offset by a $1.5 billion decrease in long-term borrowings.
Qualifying debt totaled $1.1 billion at both September 30, 2026 and June 30, 2026, compared with $681 million at September 30, 2025. The increase from September 30, 2025 primarily reflects the issuance of $400 million of subordinated debt during the quarter ended December 31, 2025.
Total equity was $7.9 billion at September 30, 2026, compared to $8.1 billion at June 30, 2026, and $7.7 billion at September 30, 2025. The decrease from the prior quarter was primarily due to changes in AOCI related to higher interest rates, unrealized fair value losses of $338.0 million on the Company's available-for-sale securities, which are recorded in other comprehensive loss, net of tax, the repurchase of 1.15 million shares for $92.1 million, and dividends, partially offset by net income of $277.2 million. Third quarter cash dividends paid included $45.7 million, or $0.42 per share, for common stockholders; $3.2 million, or $0.27 per depositary share, for preferred stockholders; and $7.1 million on preferred stock of the Company's REIT subsidiary. The increase in equity from September 30, 2025 was primarily driven by net income, partially offset by dividends to stockholders and share repurchases. Since inception of the share repurchase program through September 30, 2026, the Company has repurchased 2.7 million shares for $212.5 million under its $300 million authorization.
The Company's common equity tier 1 capital ratio was 10.9% at September 30, 2026, compared with 11.0% at June 30, 2026, and 11.3% at September 30, 2025. At September 30, 2026, tangible common equity, net of tax1, was 6.9% of tangible assets1, while total capital was 14.0% of risk-weighted assets. The Company’s tangible book value per share1 was $62.22 at September 30, 2026, down 1.6% from $63.24 at June 30, 2026, and up 6.3% from $58.56 at September 30, 2025. The increase in tangible book value per share from September 30, 2025 was primarily attributable to net income.
Total assets were $98.1 billion at September 30, 2026, down $629 million, or 0.6%, from $98.7 billion at June 30, 2026, and up 7.8% from $91.0 billion at September 30, 2025. The decrease in total assets from the prior quarter end reflected lower cash, HFS loans, and investment securities, partially offset by higher HFI loans. The increase in total assets from September 30, 2025 was primarily driven by growth in HFI and HFS loans and investment securities.
1 See Reconciliation of Non-GAAP Financial Measures beginning on page 16.
3
Asset Quality
Provision for credit losses totaled $80.0 million for the third quarter 2026, compared to $80.4 million for the second quarter 2026, and $80.0 million for the third quarter 2025. Net loan charge-offs in the third quarter 2026 totaled $45.8 million, or 0.30% of average loans on an annualized basis, compared to $55.0 million, or 0.37% in the second quarter 2026, and $31.1 million, or 0.22%, in the third quarter 2025. The allowance for credit losses to funded HFI loans was 0.93% at September 30, 2026 compared to 0.89% and 0.85% at June 30, 2026 and September 30, 2025, respectively.
Nonaccrual loans decreased $77 million during the quarter and $37 million from September 30, 2025, to $485 million. The decline in nonaccrual loans, combined with the increase in the allowance for credit losses, increased coverage of nonaccrual loans to 118%, from 96% at June 30, 2026, and 92% at September 30, 2025. Loans past due 90 days and still accruing interest totaled $58 million at September 30, 2026, compared with $55 million at June 30, 2026, and $49 million at September 30, 2025 (excluding government guaranteed loans of $214 million, $248 million, and $282 million, respectively). Loans past due 30-89 days and still accruing interest totaled $138 million at September 30, 2026, compared with $122 million at June 30, 2026, and $196 million at September 30, 2025 (excluding government guaranteed loans of $101 million, $102 million, and $149 million, respectively) a year-over-year decrease of $58 million. Criticized loans totaled $1.3 billion, an increase of $5 million during the quarter and $33 million from September 30, 2025.
Repossessed assets totaled $165 million at September 30, 2026, compared to $126 million at June 30, 2026, and $130 million at September 30, 2025. Classified assets of $1.1 billion at September 30, 2026 decreased $37 million from June 30, 2026, and $38 million from September 30, 2025.
4
Conference Call and Webcast
Western Alliance Bancorporation will host a conference call and live webcast to discuss its third quarter 2026 financial results at 12:00 p.m. ET on Tuesday, October 20, 2026. Participants may access the call by dialing 1-833-461-5787 and using access code 788268041 or via live audio webcast using the website link https://events.q4inc.com/attendee/788268041. The webcast is also available via the Company’s website at www.westernalliancebancorporation.com. Participants should log in at least 15 minutes early to receive instructions. The call will be recorded, and the webcast replay will remain available for one year.
Reclassifications
Certain amounts in the Consolidated Income Statements for the prior periods have been reclassified to conform to the current presentation. Gains and losses related to the Company’s back-to-back interest rate swaps, risk participation agreements, and foreign exchange derivative contracts with customers have been reclassified to Commercial banking income and related fees in the Consolidated Income Statement. The reclassifications have no effect on net income or stockholders’ equity as previously reported.
Use of Non-GAAP Financial Information
This press release contains both financial measures based on GAAP and non-GAAP based financial measures, which are used where management believes them to be helpful in understanding the Company’s results of operations or financial position. Where non-GAAP financial measures are used, the comparable GAAP financial measure, as well as the reconciliation to the comparable GAAP financial measure, can be found in this press release. These disclosures should not be viewed as a substitute for operating results determined in accordance with GAAP, nor are they necessarily comparable to non-GAAP performance measures that may be presented by other companies.
Cautionary Note Regarding Forward-Looking Statements
This release contains forward-looking statements that relate to expectations, beliefs, projections, future plans and strategies, anticipated events or trends and similar expressions concerning matters that are not historical facts. Examples of forward-looking statements include, among others, statements we make regarding our expectations with regard to our business, financial and operating results, including our deposits and deposit optimization strategy, liquidity and funding, changes in economic conditions and related impacts on the Company's business, future economic performance and dividends. The forward-looking statements contained herein reflect our current views about future events and financial performance and are subject to risks, uncertainties, assumptions and changes in circumstances that may cause our actual results to differ significantly from historical results and those expressed in any forward-looking statement. Some factors that could cause actual results to differ materially from historical or expected results include, among others: the risk factors discussed in the Company’s Annual Report on Form 10-K for the year ended December 31, 2025 and the Company's subsequent Quarterly Reports on Form 10-Q, each as filed with the Securities and Exchange Commission; adverse developments in the financial services industry generally and any related impact on depositor behavior; risks related to the sufficiency of liquidity; changes in international trade policies, tariffs and treaties affecting imports and exports, trade disputes, barriers to trade or the emergence of other trade restrictions, and their related impacts on macroeconomic conditions and customer behavior; the potential adverse effects of unusual and infrequently occurring events and any governmental or societal responses thereto; changes in general economic conditions, either nationally or locally in the areas in which we conduct or will conduct our business; the impact on financial markets from geopolitical conflicts; inflation, interest rate, market and monetary fluctuations; increases in competitive pressures among financial institutions and businesses offering similar products and services; higher defaults on our loan portfolio than we expect; increased foreclosures and ownership of real property; changes in management’s estimate of the adequacy of the allowance for credit losses; technological risks and developments and cyber threats, attacks or events; emerging external focus among regulators and other officials related to risks in connection with the development and use of artificial intelligence; legislative or regulatory changes or changes in accounting principles, policies or guidelines; supervisory actions by regulatory agencies which may limit our ability to pursue certain growth opportunities, including expansion through acquisitions; additional regulatory requirements resulting from our continued growth; management’s estimates and projections of interest rates and interest rate policy; the execution of our business plan; the outcome of legal proceedings, the amount of funds and/or collateral that may be available for repayment of such loans, and any adverse economic or other events impacting the collateral, borrower or guarantors with respect to such loans; and other factors affecting the financial services industry generally or the banking industry in particular.
Any forward-looking statement made by us in this release is based only on information currently available to us and speaks only as of the date on which it is made. We do not intend and disclaim any duty or obligation to update or revise any industry information or forward-looking statements, whether written or oral, that may be made from time to time, set forth in this press release to reflect new information, future events or otherwise, except to the extent required by applicable law. In light of these risks, uncertainties and assumptions, the forward-looking events discussed in this press release might not occur, and you should not put undue reliance on any forward-looking statements.
About Western Alliance Bancorporation
Western Alliance Bancorporation (NYSE:WAL) is one of the country’s top-performing banking companies. Its primary subsidiary, Western Alliance Bank, Member FDIC, is a leading national bank for business that puts customers first, delivering tailored business banking solutions and consumer products backed by outstanding, personalized service and specific expertise in more than 30 industries and sectors. With more than $90 billion in assets and offices nationwide, Western Alliance has ranked as a top U.S. bank by American Banker and Bank Director since 2016. In 2025, Western Alliance Bancorporation was #2 for Best CEO, Best CFO and Best Company Board of Directors on Extel’s All-America Executive Team Midcap Banks list. For more information on offerings, subsidiaries and affiliates, visit www.westernalliancebank.com or follow Western Alliance Bank on LinkedIn.
Contacts
Investors: Miles Pondelik, 602-346-7462
Email: MPondelik@westernalliancebank.com
Media: Stephanie Whitlow, 480-998-6547
Email: SWhitlow@westernalliancebank.com
5
| Western Alliance Bancorporation and Subsidiaries | . | |||||||||||||||||||||||||||||||||||||
| Summary Consolidated Financial Data | ||||||||||||||||||||||||||||||||||||||
| Unaudited | ||||||||||||||||||||||||||||||||||||||
| Selected Balance Sheet Data: | ||||||||||||||||||||||||||||||||||||||
| As of September 30, | ||||||||||||||||||||||||||||||||||||||
| 2026 | 2025 | Change % | ||||||||||||||||||||||||||||||||||||
| (in millions) | ||||||||||||||||||||||||||||||||||||||
| Total assets | $ | 98,072 | $ | 90,970 | 7.8 | % | ||||||||||||||||||||||||||||||||
| Loans held for sale | 3,951 | 3,502 | 12.8 | |||||||||||||||||||||||||||||||||||
| Loans HFI, net of deferred fees | 61,549 | 56,646 | 8.7 | |||||||||||||||||||||||||||||||||||
| Investment securities | 20,239 | 18,841 | 7.4 | |||||||||||||||||||||||||||||||||||
| Total deposits | 81,755 | 77,247 | 5.8 | |||||||||||||||||||||||||||||||||||
| Borrowings | 5,613 | 3,862 | 45.3 | |||||||||||||||||||||||||||||||||||
| Qualifying debt | 1,053 | 681 | 54.6 | |||||||||||||||||||||||||||||||||||
| Total equity | 7,947 | 7,690 | 3.3 | |||||||||||||||||||||||||||||||||||
| Tangible common equity, net of tax (1) | 6,720 | 6,453 | 4.1 | |||||||||||||||||||||||||||||||||||
| Common equity Tier 1 capital | 7,389 | 6,736 | 9.7 | |||||||||||||||||||||||||||||||||||
| Selected Income Statement Data: | ||||||||||||||||||||||||||||||||||||||
| For the Three Months Ended September 30, | For the Nine Months Ended September 30, | |||||||||||||||||||||||||||||||||||||
| 2026 | 2025 | Change % | 2026 | 2025 | Change % | |||||||||||||||||||||||||||||||||
| (in millions, except per share data) | (in millions, except per share data) | |||||||||||||||||||||||||||||||||||||
| Interest income | $ | 1,257.3 | $ | 1,225.5 | 2.6 | % | $ | 3,677.4 | $ | 3,475.5 | 5.8 | % | ||||||||||||||||||||||||||
| Interest expense | 449.7 | 475.1 | (5.3) | 1,306.6 | 1,376.9 | (5.1) | ||||||||||||||||||||||||||||||||
| Net interest income | 807.6 | 750.4 | 7.6 | 2,370.8 | 2,098.6 | 13.0 | ||||||||||||||||||||||||||||||||
| Provision for credit losses | 80.0 | 80.0 | — | 373.6 | 151.1 | NM | ||||||||||||||||||||||||||||||||
| Net interest income after provision for credit losses | 727.6 | 670.4 | 8.5 | 1,997.2 | 1,947.5 | 2.6 | ||||||||||||||||||||||||||||||||
| Non-interest income | 206.6 | 187.8 | 10.0 | 658.0 | 463.5 | 42.0 | ||||||||||||||||||||||||||||||||
| Non-interest expense | 595.1 | 544.4 | 9.3 | 1,752.8 | 1,559.5 | 12.4 | ||||||||||||||||||||||||||||||||
| Income before income taxes | 339.1 | 313.8 | 8.1 | 902.4 | 851.5 | 6.0 | ||||||||||||||||||||||||||||||||
| Income tax expense | 61.9 | 53.3 | 16.1 | 167.2 | 154.1 | 8.5 | ||||||||||||||||||||||||||||||||
| Net income | 277.2 | 260.5 | 6.4 | 735.2 | 697.4 | 5.4 | ||||||||||||||||||||||||||||||||
| Net income attributable to noncontrolling interest | 7.1 | 7.1 | — | 21.3 | 14.5 | 46.9 | ||||||||||||||||||||||||||||||||
| Net income attributable to Western Alliance | 270.1 | 253.4 | 6.6 | 713.9 | 682.9 | 4.5 | ||||||||||||||||||||||||||||||||
| Dividends on preferred stock | 3.2 | 3.2 | — | 9.6 | 9.6 | — | ||||||||||||||||||||||||||||||||
| Net income available to common stockholders | $ | 266.9 | $ | 250.2 | 6.7 | $ | 704.3 | $ | 673.3 | 4.6 | ||||||||||||||||||||||||||||
| Diluted earnings per common share | $ | 2.45 | $ | 2.28 | 7.5 | $ | 6.43 | $ | 6.14 | 4.7 | ||||||||||||||||||||||||||||
(1) See Reconciliation of Non-GAAP Financial Measures.
NM Changes +/- 100% are not meaningful.
6
| Western Alliance Bancorporation and Subsidiaries | ||||||||||||||||||||||||||||||||||||||||||||||||||
| Summary Consolidated Financial Data | ||||||||||||||||||||||||||||||||||||||||||||||||||
| Unaudited | ||||||||||||||||||||||||||||||||||||||||||||||||||
| Common Share Data: | ||||||||||||||||||||||||||||||||||||||||||||||||||
| At or For the Three Months Ended September 30, | For the Nine Months Ended September 30, | |||||||||||||||||||||||||||||||||||||||||||||||||
| 2026 | 2025 | Change % (1) | 2026 | 2025 | Change % (1) | |||||||||||||||||||||||||||||||||||||||||||||
| Diluted earnings per common share (2) / as adjusted (3) | $ | 2.45 | $ | 2.28 | 7.5 | % | $ | 6.43 | / | $ | 7.01 | $ | 6.14 | 4.7 | % | |||||||||||||||||||||||||||||||||||
| Book value per common share | 68.14 | 64.45 | 5.7 | |||||||||||||||||||||||||||||||||||||||||||||||
| Tangible book value per common share, net of tax (3) | 62.22 | 58.56 | 6.3 | |||||||||||||||||||||||||||||||||||||||||||||||
| Average common shares outstanding (in millions): | ||||||||||||||||||||||||||||||||||||||||||||||||||
| Basic | 107.4 | 109.0 | (1.5) | 107.8 | 108.9 | (1.0) | ||||||||||||||||||||||||||||||||||||||||||||
| Diluted | 107.8 | 109.8 | (1.8) | 108.1 | 109.6 | (1.4) | ||||||||||||||||||||||||||||||||||||||||||||
| Common shares outstanding | 108.0 | 110.2 | (2.0) | |||||||||||||||||||||||||||||||||||||||||||||||
| Selected Performance Ratios: | ||||||||||||||||||||||||||||||||||||||||||||||||||
| Return on average assets / as adjusted (3, 4) | 1.12 | % | 1.13 | % | (0.9) | % | 1.01 | % | / | 1.10 | % | 1.07 | % | (5.6) | % | |||||||||||||||||||||||||||||||||||
| Return on average tangible common equity / as adjusted (3, 4) | 15.5 | 15.6 | (0.6) | 13.8 | / | 15.0 | 14.7 | (6.1) | ||||||||||||||||||||||||||||||||||||||||||
| Net interest margin (4) | 3.57 | 3.53 | 1.1 | 3.55 | 3.51 | 1.1 | ||||||||||||||||||||||||||||||||||||||||||||
| Efficiency ratio (3) | 58.1 | 57.4 | 1.2 | 57.3 | 60.2 | (4.8) | ||||||||||||||||||||||||||||||||||||||||||||
| Efficiency ratio, adjusted for deposit costs (3) | 50.0 | 47.8 | 4.6 | 48.8 | 51.6 | (5.4) | ||||||||||||||||||||||||||||||||||||||||||||
| HFI loan to deposit ratio | 75.3 | 73.3 | 2.7 | |||||||||||||||||||||||||||||||||||||||||||||||
| Asset Quality Ratios: | ||||||||||||||||||||||||||||||||||||||||||||||||||
| Net charge-offs to average loans outstanding / as adjusted (3, 4) | 0.30 | % | 0.22 | % | 36.4 | 0.70 | % | / | 0.35 | % | 0.21 | % | NM | |||||||||||||||||||||||||||||||||||||
| Nonaccrual loans to funded HFI loans | 0.79 | 0.92 | (14.1) | |||||||||||||||||||||||||||||||||||||||||||||||
| Nonaccrual loans and repossessed assets to total assets | 0.66 | 0.72 | (8.3) | |||||||||||||||||||||||||||||||||||||||||||||||
| Allowance for loan losses to funded HFI loans | 0.83 | 0.78 | 6.4 | |||||||||||||||||||||||||||||||||||||||||||||||
| Allowance for credit losses to funded HFI loans | 0.93 | 0.85 | 9.4 | |||||||||||||||||||||||||||||||||||||||||||||||
| Allowance for loan losses to nonaccrual HFI loans | 106 | 84 | 26.2 | |||||||||||||||||||||||||||||||||||||||||||||||
| Allowance for credit losses to nonaccrual loans | 118 | 92 | 28.3 | |||||||||||||||||||||||||||||||||||||||||||||||
| Capital Ratios: | ||||||||||||||||||||
| Sep 30, 2026 | Jun 30, 2026 | Sep 30, 2025 | ||||||||||||||||||
| Tangible common equity (3) | 6.9 | % | 7.0 | % | 7.1 | % | ||||||||||||||
| Common Equity Tier 1 (5) | 10.9 | 11.0 | 11.3 | |||||||||||||||||
| Tier 1 Leverage ratio (5) | 8.2 | 8.1 | 8.1 | |||||||||||||||||
| Tier 1 Capital (5) | 11.9 | 12.0 | 12.4 | |||||||||||||||||
| Total Capital (5) | 14.0 | 14.1 | 14.2 | |||||||||||||||||
(1) Represents percentage change in reported metric from the prior period.
(2) Diluted earnings per share for the three and nine months ended September 30, 2026 includes a reduction for earnings allocated to participating stock awards of $3.4 million and $9.0 million, respectively.
(3) See Reconciliation of Non-GAAP Financial Measures.
(4) Annualized on an actual/actual basis for periods less than 12 months.
(5) Capital ratios for September 30, 2026 are preliminary.
NM Changes +/- 100% are not meaningful.
7
| Western Alliance Bancorporation and Subsidiaries | ||||||||||||||||||||||||||
| Condensed Consolidated Income Statements | ||||||||||||||||||||||||||
| Unaudited | ||||||||||||||||||||||||||
| Three Months Ended September 30, | Nine Months Ended September 30, | |||||||||||||||||||||||||
| 2026 | 2025 | 2026 | 2025 | |||||||||||||||||||||||
| (in millions, except per share data) | ||||||||||||||||||||||||||
| Interest income: | ||||||||||||||||||||||||||
| Loans | $ | 981.5 | $ | 948.3 | $ | 2,838.7 | $ | 2,743.6 | ||||||||||||||||||
| Investment securities | 238.1 | 231.7 | 703.4 | 601.2 | ||||||||||||||||||||||
| Other | 37.7 | 45.5 | 135.3 | 130.7 | ||||||||||||||||||||||
| Total interest income | 1,257.3 | 1,225.5 | 3,677.4 | 3,475.5 | ||||||||||||||||||||||
| Interest expense: | ||||||||||||||||||||||||||
| Deposits | 382.5 | 398.2 | 1,113.7 | 1,154.3 | ||||||||||||||||||||||
| Qualifying debt | 17.4 | 6.3 | 44.3 | 23.8 | ||||||||||||||||||||||
| Borrowings | 49.8 | 70.6 | 148.6 | 198.8 | ||||||||||||||||||||||
| Total interest expense | 449.7 | 475.1 | 1,306.6 | 1,376.9 | ||||||||||||||||||||||
| Net interest income | 807.6 | 750.4 | 2,370.8 | 2,098.6 | ||||||||||||||||||||||
| Provision for credit losses | 80.0 | 80.0 | 373.6 | 151.1 | ||||||||||||||||||||||
| Net interest income after provision for credit losses | 727.6 | 670.4 | 1,997.2 | 1,947.5 | ||||||||||||||||||||||
| Non-interest income: | ||||||||||||||||||||||||||
| Commercial banking income and related fees | 78.7 | 52.4 | 248.2 | 139.5 | ||||||||||||||||||||||
| Net gain on mortgage loan origination and sale activities | 55.7 | 75.5 | 181.8 | 164.4 | ||||||||||||||||||||||
| Net loan servicing revenue | 23.8 | 19.1 | 53.8 | 79.2 | ||||||||||||||||||||||
| Gain on sales of investment securities | 16.8 | 8.5 | 70.3 | 22.0 | ||||||||||||||||||||||
| Income from bank owned life insurance | 12.9 | 11.8 | 34.4 | 34.2 | ||||||||||||||||||||||
| Fair value gain (loss) adjustments, net | 0.5 | 2.9 | 8.4 | (0.7) | ||||||||||||||||||||||
| Income from equity investments | 7.8 | 7.8 | 33.0 | 5.9 | ||||||||||||||||||||||
| Other | 10.4 | 9.8 | 28.1 | 19.0 | ||||||||||||||||||||||
| Total non-interest income | 206.6 | 187.8 | 658.0 | 463.5 | ||||||||||||||||||||||
| Non-interest expenses: | ||||||||||||||||||||||||||
| Salaries and employee benefits | 226.1 | 193.5 | 635.9 | 555.8 | ||||||||||||||||||||||
| Deposit costs | 165.4 | 175.1 | 507.9 | 459.3 | ||||||||||||||||||||||
| Data processing | 55.8 | 48.1 | 161.0 | 138.3 | ||||||||||||||||||||||
| Legal, professional, and directors' fees | 34.4 | 28.1 | 97.8 | 82.3 | ||||||||||||||||||||||
| Insurance | 25.5 | 24.5 | 78.5 | 99.8 | ||||||||||||||||||||||
| Occupancy | 22.4 | 16.8 | 62.7 | 50.9 | ||||||||||||||||||||||
| Loan servicing expenses | 17.0 | 15.0 | 51.3 | 51.5 | ||||||||||||||||||||||
| Business development and marketing | 10.2 | 5.6 | 28.0 | 17.6 | ||||||||||||||||||||||
| Loan acquisition and origination expenses | 8.5 | 7.3 | 25.2 | 18.3 | ||||||||||||||||||||||
| Other | 29.8 | 30.4 | 104.5 | 85.7 | ||||||||||||||||||||||
| Total non-interest expense | 595.1 | 544.4 | 1,752.8 | 1,559.5 | ||||||||||||||||||||||
| Income before income taxes | 339.1 | 313.8 | 902.4 | 851.5 | ||||||||||||||||||||||
| Income tax expense | 61.9 | 53.3 | 167.2 | 154.1 | ||||||||||||||||||||||
| Net income | 277.2 | 260.5 | 735.2 | 697.4 | ||||||||||||||||||||||
| Net income attributable to noncontrolling interest | 7.1 | 7.1 | 21.3 | 14.5 | ||||||||||||||||||||||
| Net income attributable to Western Alliance | 270.1 | 253.4 | 713.9 | 682.9 | ||||||||||||||||||||||
| Dividends on preferred stock | 3.2 | 3.2 | 9.6 | 9.6 | ||||||||||||||||||||||
| Net income available to common stockholders | $ | 266.9 | $ | 250.2 | $ | 704.3 | $ | 673.3 | ||||||||||||||||||
| Earnings per common share: | ||||||||||||||||||||||||||
| Diluted shares | 107.8 | 109.8 | 108.1 | 109.6 | ||||||||||||||||||||||
| Diluted earnings per share (1) | $ | 2.45 | $ | 2.28 | $ | 6.43 | $ | 6.14 | ||||||||||||||||||
(1) Diluted earnings per share for the three and nine months ended September 30, 2026 includes a reduction for earnings allocated to participating stock awards of $3.4 million and $9.0 million, respectively.
8
| Western Alliance Bancorporation and Subsidiaries | ||||||||||||||||||||||||||||||||
| Five Quarter Condensed Consolidated Income Statements | ||||||||||||||||||||||||||||||||
| Unaudited | ||||||||||||||||||||||||||||||||
| Three Months Ended | ||||||||||||||||||||||||||||||||
| Sep 30, 2026 | Jun 30, 2026 | Mar 31, 2026 | Dec 31, 2025 | Sep 30, 2025 | ||||||||||||||||||||||||||||
| (in millions, except per share data) | ||||||||||||||||||||||||||||||||
| Interest income: | ||||||||||||||||||||||||||||||||
| Loans | $ | 981.5 | $ | 941.5 | $ | 915.7 | $ | 936.2 | $ | 948.3 | ||||||||||||||||||||||
| Investment securities | 238.1 | 245.4 | 219.9 | 221.6 | 231.7 | |||||||||||||||||||||||||||
| Other | 37.7 | 45.0 | 52.6 | 59.6 | 45.5 | |||||||||||||||||||||||||||
| Total interest income | 1,257.3 | 1,231.9 | 1,188.2 | 1,217.4 | 1,225.5 | |||||||||||||||||||||||||||
| Interest expense: | ||||||||||||||||||||||||||||||||
| Deposits | 382.5 | 370.5 | 360.7 | 383.5 | 398.2 | |||||||||||||||||||||||||||
| Qualifying debt | 17.4 | 13.8 | 13.1 | 9.0 | 6.3 | |||||||||||||||||||||||||||
| Borrowings | 49.8 | 50.7 | 48.1 | 58.7 | 70.6 | |||||||||||||||||||||||||||
| Total interest expense | 449.7 | 435.0 | 421.9 | 451.2 | 475.1 | |||||||||||||||||||||||||||
| Net interest income | 807.6 | 796.9 | 766.3 | 766.2 | 750.4 | |||||||||||||||||||||||||||
| Provision for credit losses | 80.0 | 80.4 | 213.2 | 73.0 | 80.0 | |||||||||||||||||||||||||||
| Net interest income after provision for credit losses | 727.6 | 716.5 | 553.1 | 693.2 | 670.4 | |||||||||||||||||||||||||||
| Non-interest income: | ||||||||||||||||||||||||||||||||
| Commercial banking income and related fees | 78.7 | 73.1 | 96.4 | 80.7 | 52.4 | |||||||||||||||||||||||||||
| Net gain on mortgage loan origination and sale activities | 55.7 | 53.4 | 72.7 | 91.1 | 75.5 | |||||||||||||||||||||||||||
| Net loan servicing revenue (loss) | 23.8 | 31.3 | (1.3) | (1.4) | 19.1 | |||||||||||||||||||||||||||
| Gain on sales of investment securities | 16.8 | 3.0 | 50.5 | 7.4 | 8.5 | |||||||||||||||||||||||||||
| Income from bank owned life insurance | 12.9 | 10.8 | 10.7 | 11.8 | 11.8 | |||||||||||||||||||||||||||
| Fair value gain (loss) adjustments, net | 0.5 | 8.3 | (0.4) | (0.4) | 2.9 | |||||||||||||||||||||||||||
| Income from equity investments | 7.8 | 11.9 | 13.3 | 12.2 | 7.8 | |||||||||||||||||||||||||||
| Other | 10.4 | 7.0 | 10.7 | 13.3 | 9.8 | |||||||||||||||||||||||||||
| Total non-interest income | 206.6 | 198.8 | 252.6 | 214.7 | 187.8 | |||||||||||||||||||||||||||
| Non-interest expenses: | ||||||||||||||||||||||||||||||||
| Salaries and employee benefits | 226.1 | 204.3 | 205.5 | 201.7 | 193.5 | |||||||||||||||||||||||||||
| Deposit costs | 165.4 | 179.2 | 163.3 | 171.2 | 175.1 | |||||||||||||||||||||||||||
| Data processing | 55.8 | 52.1 | 53.1 | 48.9 | 48.1 | |||||||||||||||||||||||||||
| Legal, professional, and directors' fees | 34.4 | 32.8 | 30.6 | 33.6 | 28.1 | |||||||||||||||||||||||||||
| Insurance | 25.5 | 28.3 | 24.7 | 17.7 | 24.5 | |||||||||||||||||||||||||||
| Occupancy | 22.4 | 21.1 | 19.2 | 19.7 | 16.8 | |||||||||||||||||||||||||||
| Loan servicing expenses | 17.0 | 17.6 | 16.7 | 17.7 | 15.0 | |||||||||||||||||||||||||||
| Business development and marketing | 10.2 | 8.3 | 9.5 | 11.1 | 5.6 | |||||||||||||||||||||||||||
| Loan acquisition and origination expenses | 8.5 | 8.8 | 7.9 | 7.9 | 7.3 | |||||||||||||||||||||||||||
| Other | 29.8 | 30.8 | 43.9 | 22.7 | 30.4 | |||||||||||||||||||||||||||
| Total non-interest expense | 595.1 | 583.3 | 574.4 | 552.2 | 544.4 | |||||||||||||||||||||||||||
| Income before income taxes | 339.1 | 332.0 | 231.3 | 355.7 | 313.8 | |||||||||||||||||||||||||||
| Income tax expense | 61.9 | 63.2 | 42.1 | 62.5 | 53.3 | |||||||||||||||||||||||||||
| Net income | 277.2 | 268.8 | 189.2 | 293.2 | 260.5 | |||||||||||||||||||||||||||
| Net income attributable to noncontrolling interest | 7.1 | 7.1 | 7.1 | 7.1 | 7.1 | |||||||||||||||||||||||||||
| Net income attributable to Western Alliance | 270.1 | 261.7 | 182.1 | 286.1 | 253.4 | |||||||||||||||||||||||||||
| Dividends on preferred stock | 3.2 | 3.2 | 3.2 | 3.2 | 3.2 | |||||||||||||||||||||||||||
| Net income available to common stockholders | $ | 266.9 | $ | 258.5 | $ | 178.9 | $ | 282.9 | $ | 250.2 | ||||||||||||||||||||||
| Earnings per common share: | ||||||||||||||||||||||||||||||||
| Diluted shares | 107.8 | 108.0 | 108.7 | 109.3 | 109.8 | |||||||||||||||||||||||||||
| Diluted earnings per share (1) | $ | 2.45 | $ | 2.36 | $ | 1.65 | $ | 2.59 | $ | 2.28 | ||||||||||||||||||||||
(1) Diluted earnings per share for the three months ended September 30, 2026 includes a reduction for earnings allocated to participating stock awards of $3.4 million.
9
| Western Alliance Bancorporation and Subsidiaries | ||||||||||||||||||||||||||||||||
| Five Quarter Condensed Consolidated Balance Sheets | ||||||||||||||||||||||||||||||||
| Unaudited | ||||||||||||||||||||||||||||||||
| Sep 30, 2026 | Jun 30, 2026 | Mar 31, 2026 | Dec 31, 2025 | Sep 30, 2025 | ||||||||||||||||||||||||||||
| (in millions) | ||||||||||||||||||||||||||||||||
| Assets: | ||||||||||||||||||||||||||||||||
| Cash and due from banks | $ | 5,328 | $ | 5,936 | $ | 8,554 | $ | 3,596 | $ | 5,756 | ||||||||||||||||||||||
| Investment securities | 20,239 | 20,622 | 20,392 | 20,438 | 18,841 | |||||||||||||||||||||||||||
| Loans held for sale | 3,951 | 4,347 | 3,936 | 3,498 | 3,502 | |||||||||||||||||||||||||||
| Loans held for investment: | ||||||||||||||||||||||||||||||||
| Commercial and industrial | 30,101 | 29,765 | 28,223 | 27,928 | 25,734 | |||||||||||||||||||||||||||
| Commercial real estate - non-owner occupied | 10,697 | 10,301 | 10,344 | 10,340 | 10,487 | |||||||||||||||||||||||||||
| Commercial real estate - owner occupied | 1,561 | 1,578 | 1,711 | 1,683 | 1,682 | |||||||||||||||||||||||||||
| Construction and land development | 4,238 | 4,241 | 4,080 | 4,055 | 4,065 | |||||||||||||||||||||||||||
| Residential real estate | 14,937 | 15,048 | 14,765 | 14,652 | 14,651 | |||||||||||||||||||||||||||
| Consumer | 15 | 16 | 19 | 19 | 27 | |||||||||||||||||||||||||||
| Loans HFI, net of deferred fees | 61,549 | 60,949 | 59,142 | 58,677 | 56,646 | |||||||||||||||||||||||||||
| Allowance for loan losses | (513) | (487) | (461) | (461) | (440) | |||||||||||||||||||||||||||
| Loans HFI, net of deferred fees and allowance | 61,036 | 60,462 | 58,681 | 58,216 | 56,206 | |||||||||||||||||||||||||||
| Mortgage servicing rights | 1,576 | 1,500 | 1,516 | 1,494 | 1,213 | |||||||||||||||||||||||||||
| Premises and equipment, net | 478 | 479 | 480 | 442 | 416 | |||||||||||||||||||||||||||
| Operating lease right-of-use asset | 114 | 119 | 125 | 131 | 134 | |||||||||||||||||||||||||||
| Other assets acquired through foreclosure, net | 165 | 126 | 123 | 137 | 130 | |||||||||||||||||||||||||||
| Bank owned life insurance | 1,084 | 1,075 | 1,067 | 1,057 | 1,045 | |||||||||||||||||||||||||||
| Goodwill and other intangibles, net | 642 | 644 | 646 | 649 | 651 | |||||||||||||||||||||||||||
| Other assets | 3,459 | 3,391 | 3,333 | 3,116 | 3,076 | |||||||||||||||||||||||||||
| Total assets | $ | 98,072 | $ | 98,701 | $ | 98,853 | $ | 92,774 | $ | 90,970 | ||||||||||||||||||||||
| Liabilities and stockholders' equity: | ||||||||||||||||||||||||||||||||
| Liabilities: | ||||||||||||||||||||||||||||||||
| Deposits | ||||||||||||||||||||||||||||||||
| Non-interest bearing deposits | $ | 25,752 | $ | 27,820 | $ | 28,078 | $ | 24,353 | $ | 26,628 | ||||||||||||||||||||||
| Interest bearing: | ||||||||||||||||||||||||||||||||
| Demand | 20,130 | 19,259 | 19,385 | 18,416 | 16,422 | |||||||||||||||||||||||||||
| Savings and money market | 25,210 | 24,886 | 25,414 | 24,586 | 24,627 | |||||||||||||||||||||||||||
| Certificates of deposit | 10,663 | 9,909 | 9,846 | 9,804 | 9,570 | |||||||||||||||||||||||||||
| Total deposits | 81,755 | 81,874 | 82,723 | 77,159 | 77,247 | |||||||||||||||||||||||||||
| Borrowings | 5,613 | 6,236 | 5,610 | 5,240 | 3,862 | |||||||||||||||||||||||||||
| Qualifying debt | 1,053 | 1,069 | 1,072 | 1,076 | 681 | |||||||||||||||||||||||||||
| Operating lease liability | 141 | 148 | 154 | 160 | 164 | |||||||||||||||||||||||||||
| Accrued interest payable and other liabilities | 1,563 | 1,239 | 1,386 | 1,193 | 1,326 | |||||||||||||||||||||||||||
| Total liabilities | 90,125 | 90,566 | 90,945 | 84,828 | 83,280 | |||||||||||||||||||||||||||
| Equity: | ||||||||||||||||||||||||||||||||
| Preferred stock | 295 | 295 | 295 | 295 | 295 | |||||||||||||||||||||||||||
| Common stock and additional paid-in capital | 1,972 | 2,046 | 2,036 | 2,095 | 2,140 | |||||||||||||||||||||||||||
| Retained earnings | 6,173 | 5,952 | 5,740 | 5,607 | 5,371 | |||||||||||||||||||||||||||
| Accumulated other comprehensive loss | (786) | (451) | (456) | (344) | (409) | |||||||||||||||||||||||||||
| Total Western Alliance stockholders' equity | 7,654 | 7,842 | 7,615 | 7,653 | 7,397 | |||||||||||||||||||||||||||
| Noncontrolling interest in subsidiary | 293 | 293 | 293 | 293 | 293 | |||||||||||||||||||||||||||
| Total equity | 7,947 | 8,135 | 7,908 | 7,946 | 7,690 | |||||||||||||||||||||||||||
| Total liabilities and equity | $ | 98,072 | $ | 98,701 | $ | 98,853 | $ | 92,774 | $ | 90,970 | ||||||||||||||||||||||
10
| Western Alliance Bancorporation and Subsidiaries | ||||||||||||||||||||||||||||||||
| Changes in the Allowance For Credit Losses on Loans | ||||||||||||||||||||||||||||||||
| Unaudited | ||||||||||||||||||||||||||||||||
| Three Months Ended | ||||||||||||||||||||||||||||||||
| Sep 30, 2026 | Jun 30, 2026 | Mar 31, 2026 | Dec 31, 2025 | Sep 30, 2025 | ||||||||||||||||||||||||||||
| (dollars in millions) | ||||||||||||||||||||||||||||||||
| Allowance for loan losses | ||||||||||||||||||||||||||||||||
| Balance, beginning of period | $ | 487.4 | $ | 461.1 | $ | 460.6 | $ | 440.4 | $ | 394.7 | ||||||||||||||||||||||
| Provision for credit losses (1) | 71.2 | 81.3 | 209.0 | 64.8 | 76.8 | |||||||||||||||||||||||||||
| Recoveries of loans previously charged-off: | ||||||||||||||||||||||||||||||||
| Commercial and industrial | 0.7 | 1.6 | 0.6 | 1.7 | 0.7 | |||||||||||||||||||||||||||
| Commercial real estate - non-owner occupied | 1.3 | 1.0 | — | — | — | |||||||||||||||||||||||||||
| Commercial real estate - owner occupied | — | — | — | 0.4 | — | |||||||||||||||||||||||||||
| Construction and land development | — | — | — | 1.5 | — | |||||||||||||||||||||||||||
| Residential real estate | — | — | — | — | — | |||||||||||||||||||||||||||
| Consumer | 0.2 | — | — | 0.1 | — | |||||||||||||||||||||||||||
| Total recoveries | 2.2 | 2.6 | 0.6 | 3.7 | 0.7 | |||||||||||||||||||||||||||
| Loans charged-off: | ||||||||||||||||||||||||||||||||
| Commercial and industrial | 16.2 | 25.4 | 181.4 | 28.9 | 12.4 | |||||||||||||||||||||||||||
| Commercial real estate - non-owner occupied | 25.7 | 32.0 | 27.7 | 10.7 | 12.9 | |||||||||||||||||||||||||||
| Commercial real estate - owner occupied | — | 0.1 | — | — | — | |||||||||||||||||||||||||||
| Construction and land development | 6.1 | 0.1 | — | 8.6 | 6.3 | |||||||||||||||||||||||||||
| Residential real estate | — | — | — | — | — | |||||||||||||||||||||||||||
| Consumer | — | — | — | 0.1 | 0.2 | |||||||||||||||||||||||||||
| Total loans charged-off | 48.0 | 57.6 | 209.1 | 48.3 | 31.8 | |||||||||||||||||||||||||||
| Net loan charge-offs | 45.8 | 55.0 | 208.5 | 44.6 | 31.1 | |||||||||||||||||||||||||||
| Balance, end of period | $ | 512.8 | $ | 487.4 | $ | 461.1 | $ | 460.6 | $ | 440.4 | ||||||||||||||||||||||
| Allowance for unfunded loan commitments | ||||||||||||||||||||||||||||||||
| Balance, beginning of period | $ | 52.0 | $ | 53.3 | $ | 49.6 | $ | 42.3 | $ | 39.2 | ||||||||||||||||||||||
| Provision for (recovery of) credit losses (1) | 9.6 | (1.3) | 3.7 | 7.3 | 3.1 | |||||||||||||||||||||||||||
| Balance, end of period (2) | $ | 61.6 | $ | 52.0 | $ | 53.3 | $ | 49.6 | $ | 42.3 | ||||||||||||||||||||||
| Components of the allowance for credit losses on loans | ||||||||||||||||||||||||||||||||
| Allowance for loan losses | $ | 512.8 | $ | 487.4 | $ | 461.1 | $ | 460.6 | $ | 440.4 | ||||||||||||||||||||||
| Allowance for unfunded loan commitments | 61.6 | 52.0 | 53.3 | 49.6 | 42.3 | |||||||||||||||||||||||||||
| Total allowance for credit losses on loans | $ | 574.4 | $ | 539.4 | $ | 514.4 | $ | 510.2 | $ | 482.7 | ||||||||||||||||||||||
| Net charge-offs to average loans - annualized | 0.30 | % | 0.37 | % | 1.45 | % | 0.31 | % | 0.22 | % | ||||||||||||||||||||||
| Allowance ratios | ||||||||||||||||||||||||||||||||
| Allowance for loan losses to funded HFI loans (3) | 0.83 | % | 0.80 | % | 0.78 | % | 0.78 | % | 0.78 | % | ||||||||||||||||||||||
| Allowance for credit losses to funded HFI loans (3) | 0.93 | 0.89 | 0.87 | 0.87 | 0.85 | |||||||||||||||||||||||||||
| Allowance for loan losses to nonaccrual loans | 106 | 87 | 94 | 92 | 84 | |||||||||||||||||||||||||||
| Allowance for credit losses to nonaccrual loans | 118 | 96 | 105 | 102 | 92 | |||||||||||||||||||||||||||
(1) The above tables reflect only the provision for credit losses on funded and unfunded loans. For the three months ended September 30, 2026, the release of provision for credit losses for HTM investment securities totaled $0.8 million. The allowance for credit losses on HTM investment securities totaled $13.0 million as of September 30, 2026.
(2) The allowance for unfunded loan commitments is included as part of accrued interest payable and other liabilities on the balance sheet.
(3) Ratio includes an allowance for credit losses of $11.6 million as of September 30, 2026 related to a pool of loans covered under three separate credit linked note transactions.
11
| Western Alliance Bancorporation and Subsidiaries | ||||||||||||||||||||||||||||||||
| Asset Quality Metrics | ||||||||||||||||||||||||||||||||
| Unaudited | ||||||||||||||||||||||||||||||||
| Three Months Ended | ||||||||||||||||||||||||||||||||
| Sep 30, 2026 | Jun 30, 2026 | Mar 31, 2026 | Dec 31, 2025 | Sep 30, 2025 | ||||||||||||||||||||||||||||
| (dollars in millions) | ||||||||||||||||||||||||||||||||
| Nonaccrual loans and repossessed assets | ||||||||||||||||||||||||||||||||
| Nonaccrual loans | $ | 485 | $ | 562 | $ | 492 | $ | 500 | $ | 522 | ||||||||||||||||||||||
| Nonaccrual loans to funded HFI loans | 0.79 | % | 0.92 | % | 0.83 | % | 0.85 | % | 0.92 | % | ||||||||||||||||||||||
| Repossessed assets | $ | 165 | $ | 126 | $ | 123 | $ | 137 | $ | 130 | ||||||||||||||||||||||
| Nonaccrual loans and repossessed assets to total assets | 0.66 | % | 0.70 | % | 0.62 | % | 0.69 | % | 0.72 | % | ||||||||||||||||||||||
| Loans Past Due | ||||||||||||||||||||||||||||||||
| Loans past due 90 days, still accruing (1) | $ | 58 | $ | 55 | $ | 56 | $ | 66 | $ | 49 | ||||||||||||||||||||||
| Loans past due 90 days, still accruing to funded HFI loans (1) | 0.09 | % | 0.09 | % | 0.09 | % | 0.11 | % | 0.09 | % | ||||||||||||||||||||||
| Loans past due 30 to 89 days, still accruing (2) | $ | 138 | $ | 122 | $ | 157 | $ | 108 | $ | 196 | ||||||||||||||||||||||
| Loans past due 30 to 89 days, still accruing to funded HFI loans (2) | 0.22 | % | 0.20 | % | 0.27 | % | 0.18 | % | 0.35 | % | ||||||||||||||||||||||
| Other credit quality metrics | ||||||||||||||||||||||||||||||||
| Special mention loans | $ | 397 | $ | 316 | $ | 403 | $ | 325 | $ | 292 | ||||||||||||||||||||||
| Special mention loans to funded HFI loans | 0.65 | % | 0.52 | % | 0.68 | % | 0.55 | % | 0.52 | % | ||||||||||||||||||||||
| Classified accruing loans | $ | 441 | $ | 440 | $ | 455 | $ | 450 | $ | 476 | ||||||||||||||||||||||
| Classified accruing loans to funded HFI loans | 0.72 | % | 0.72 | % | 0.77 | % | 0.77 | % | 0.84 | % | ||||||||||||||||||||||
| Classified assets | $ | 1,091 | $ | 1,128 | $ | 1,070 | $ | 1,088 | $ | 1,129 | ||||||||||||||||||||||
| Classified assets to total assets | 1.11 | % | 1.14 | % | 1.08 | % | 1.17 | % | 1.24 | % | ||||||||||||||||||||||
(1) Excludes government guaranteed residential mortgage loans of $214 million, $248 million, $288 million, $290 million, and $282 million as of each respective date in the table above.
(2) Excludes government guaranteed residential mortgage loans of $101 million, $102 million, $94 million, $145 million, and $149 million as of each respective date in the table above.
12
| Western Alliance Bancorporation and Subsidiaries | ||||||||||||||||||||||||||||||||||||||
| Analysis of Average Balances, Yields and Rates | ||||||||||||||||||||||||||||||||||||||
| Unaudited | ||||||||||||||||||||||||||||||||||||||
| Three Months Ended | ||||||||||||||||||||||||||||||||||||||
| September 30, 2026 | June 30, 2026 | |||||||||||||||||||||||||||||||||||||
| Average Balance | Interest | Average Yield / Cost | Average Balance | Interest | Average Yield / Cost | |||||||||||||||||||||||||||||||||
| (dollars in millions) | ||||||||||||||||||||||||||||||||||||||
| Interest earning assets | ||||||||||||||||||||||||||||||||||||||
| Loans HFS | $ | 5,858 | $ | 90.3 | 6.12 | % | $ | 5,653 | $ | 84.9 | 6.02 | % | ||||||||||||||||||||||||||
| Loans HFI: | ||||||||||||||||||||||||||||||||||||||
| Commercial and industrial | 29,591 | 451.2 | 6.09 | 28,364 | 426.4 | 6.07 | ||||||||||||||||||||||||||||||||
| CRE - non-owner occupied | 10,417 | 172.6 | 6.57 | 10,296 | 169.6 | 6.61 | ||||||||||||||||||||||||||||||||
| CRE - owner occupied | 1,557 | 24.2 | 6.18 | 1,574 | 23.8 | 6.07 | ||||||||||||||||||||||||||||||||
| Construction and land development | 4,212 | 82.1 | 7.79 | 4,191 | 80.8 | 7.78 | ||||||||||||||||||||||||||||||||
| Residential real estate | 15,002 | 160.8 | 4.25 | 14,879 | 155.7 | 4.20 | ||||||||||||||||||||||||||||||||
| Consumer | 15 | 0.3 | 7.14 | 17 | 0.3 | 6.57 | ||||||||||||||||||||||||||||||||
| Total HFI loans (1), (2), (3), (4) | 60,794 | 891.2 | 5.84 | 59,321 | 856.6 | 5.82 | ||||||||||||||||||||||||||||||||
| Investment securities: | ||||||||||||||||||||||||||||||||||||||
| Taxable | 18,675 | 213.8 | 4.54 | 19,474 | 220.2 | 4.54 | ||||||||||||||||||||||||||||||||
| Tax-exempt | 2,349 | 24.3 | 5.21 | 2,312 | 25.2 | 5.50 | ||||||||||||||||||||||||||||||||
| Total investment securities (1) | 21,024 | 238.1 | 4.62 | 21,786 | 245.4 | 4.64 | ||||||||||||||||||||||||||||||||
| Cash and other | 3,200 | 37.7 | 4.68 | 4,901 | 45.0 | 3.68 | ||||||||||||||||||||||||||||||||
| Total interest earning assets | 90,876 | 1,257.3 | 5.53 | 91,661 | 1,231.9 | 5.43 | ||||||||||||||||||||||||||||||||
| Non-interest earning assets | ||||||||||||||||||||||||||||||||||||||
| Cash and due from banks | 426 | 544 | ||||||||||||||||||||||||||||||||||||
| Allowance for loan losses | (509) | (482) | ||||||||||||||||||||||||||||||||||||
| Bank owned life insurance | 1,078 | 1,069 | ||||||||||||||||||||||||||||||||||||
| Other assets | 5,933 | 5,692 | ||||||||||||||||||||||||||||||||||||
| Total assets | $ | 97,804 | $ | 98,484 | ||||||||||||||||||||||||||||||||||
| Interest-bearing liabilities | ||||||||||||||||||||||||||||||||||||||
| Interest-bearing deposits: | ||||||||||||||||||||||||||||||||||||||
| Interest-bearing demand accounts | $ | 19,766 | $ | 110.9 | 2.22 | % | $ | 19,316 | $ | 102.5 | 2.13 | % | ||||||||||||||||||||||||||
| Savings and money market | 25,052 | 177.3 | 2.81 | 24,995 | 174.4 | 2.80 | ||||||||||||||||||||||||||||||||
| Certificates of deposit | 10,088 | 94.3 | 3.71 | 9,873 | 93.6 | 3.80 | ||||||||||||||||||||||||||||||||
| Total interest-bearing deposits | 54,906 | 382.5 | 2.76 | 54,184 | 370.5 | 2.74 | ||||||||||||||||||||||||||||||||
| Short-term borrowings | 2,678 | 28.3 | 4.19 | 3,329 | 33.9 | 4.08 | ||||||||||||||||||||||||||||||||
| Long-term debt | 1,601 | 21.5 | 5.33 | 1,158 | 16.8 | 5.83 | ||||||||||||||||||||||||||||||||
| Qualifying debt | 1,067 | 17.4 | 6.48 | 1,071 | 13.8 | 5.17 | ||||||||||||||||||||||||||||||||
| Total interest-bearing liabilities | 60,252 | 449.7 | 2.96 | 59,742 | 435.0 | 2.92 | ||||||||||||||||||||||||||||||||
| Interest cost of funding earning assets | 1.96 | 1.90 | ||||||||||||||||||||||||||||||||||||
| Non-interest-bearing liabilities | ||||||||||||||||||||||||||||||||||||||
| Non-interest-bearing deposits | 27,919 | 29,351 | ||||||||||||||||||||||||||||||||||||
| Other liabilities | 1,554 | 1,379 | ||||||||||||||||||||||||||||||||||||
| Equity | 8,079 | 8,012 | ||||||||||||||||||||||||||||||||||||
| Total liabilities and equity | $ | 97,804 | $ | 98,484 | ||||||||||||||||||||||||||||||||||
| Net interest income and margin (5) | $ | 807.6 | 3.57 | % | $ | 796.9 | 3.53 | % | ||||||||||||||||||||||||||||||
(1) Yields on loans and securities have been adjusted to a tax equivalent basis. The tax equivalent adjustment was $10.4 million and $10.1 million for the three months ended September 30, 2026 and June 30, 2026, respectively.
(2) Included in the yield computation are net loan fees of $23.9 million and $25.5 million for the three months ended September 30, 2026 and June 30, 2026, respectively.
(3) Interest income includes a reduction for earnings credits totaling $56.7 million and $52.5 million for the three months ended September 30, 2026 and June 30, 2026, respectively.
(4) Includes nonaccrual loans.
(5) Net interest margin is computed by dividing net interest income on a tax equivalent basis by total average earning assets, annualized on an actual/actual basis.
13
| Western Alliance Bancorporation and Subsidiaries | ||||||||||||||||||||||||||||||||||||||
| Analysis of Average Balances, Yields and Rates | ||||||||||||||||||||||||||||||||||||||
| Unaudited | ||||||||||||||||||||||||||||||||||||||
| Three Months Ended | ||||||||||||||||||||||||||||||||||||||
| September 30, 2026 | September 30, 2025 | |||||||||||||||||||||||||||||||||||||
| Average Balance | Interest | Average Yield / Cost | Average Balance | Interest | Average Yield / Cost | |||||||||||||||||||||||||||||||||
| (dollars in millions) | ||||||||||||||||||||||||||||||||||||||
| Interest earning assets | ||||||||||||||||||||||||||||||||||||||
| Loans HFS | $ | 5,858 | $ | 90.3 | 6.12 | % | $ | 5,009 | $ | 77.1 | 6.11 | % | ||||||||||||||||||||||||||
| Loans HFI: | ||||||||||||||||||||||||||||||||||||||
| Commercial and industrial | 29,591 | 451.2 | 6.09 | 25,216 | 410.9 | 6.51 | ||||||||||||||||||||||||||||||||
| CRE - non-owner occupied | 10,417 | 172.6 | 6.57 | 10,473 | 190.8 | 7.23 | ||||||||||||||||||||||||||||||||
| CRE - owner occupied | 1,557 | 24.2 | 6.18 | 1,688 | 25.2 | 6.05 | ||||||||||||||||||||||||||||||||
| Construction and land development | 4,212 | 82.1 | 7.79 | 4,233 | 88.8 | 8.32 | ||||||||||||||||||||||||||||||||
| Residential real estate | 15,002 | 160.8 | 4.25 | 14,557 | 155.1 | 4.23 | ||||||||||||||||||||||||||||||||
| Consumer | 15 | 0.3 | 7.14 | 24 | 0.4 | 7.43 | ||||||||||||||||||||||||||||||||
| Total loans HFI (1), (2), (3), (4) | 60,794 | 891.2 | 5.84 | 56,191 | 871.2 | 6.18 | ||||||||||||||||||||||||||||||||
| Investment securities: | ||||||||||||||||||||||||||||||||||||||
| Taxable | 18,675 | 213.8 | 4.54 | 17,794 | 208.2 | 4.64 | ||||||||||||||||||||||||||||||||
| Tax-exempt | 2,349 | 24.3 | 5.21 | 2,193 | 23.5 | 5.32 | ||||||||||||||||||||||||||||||||
| Total investment securities (1) | 21,024 | 238.1 | 4.62 | 19,987 | 231.7 | 4.72 | ||||||||||||||||||||||||||||||||
| Cash and other | 3,200 | 37.7 | 4.68 | 4,147 | 45.5 | 4.35 | ||||||||||||||||||||||||||||||||
| Total interest earning assets | 90,876 | 1,257.3 | 5.53 | 85,334 | 1,225.5 | 5.74 | ||||||||||||||||||||||||||||||||
| Non-interest earning assets | ||||||||||||||||||||||||||||||||||||||
| Cash and due from banks | 426 | 397 | ||||||||||||||||||||||||||||||||||||
| Allowance for loan losses | (509) | (414) | ||||||||||||||||||||||||||||||||||||
| Bank owned life insurance | 1,078 | 1,038 | ||||||||||||||||||||||||||||||||||||
| Other assets | 5,933 | 4,957 | ||||||||||||||||||||||||||||||||||||
| Total assets | $ | 97,804 | $ | 91,312 | ||||||||||||||||||||||||||||||||||
| Interest bearing liabilities | ||||||||||||||||||||||||||||||||||||||
| Interest bearing deposits: | ||||||||||||||||||||||||||||||||||||||
| Interest bearing demand accounts | $ | 19,766 | $ | 110.9 | 2.22 | % | $ | 16,071 | $ | 101.4 | 2.50 | % | ||||||||||||||||||||||||||
| Savings and money market accounts | 25,052 | 177.3 | 2.81 | 23,373 | 189.4 | 3.21 | ||||||||||||||||||||||||||||||||
| Certificates of deposit | 10,088 | 94.3 | 3.71 | 10,124 | 107.4 | 4.21 | ||||||||||||||||||||||||||||||||
| Total interest bearing deposits | 54,906 | 382.5 | 2.76 | 49,568 | 398.2 | 3.19 | ||||||||||||||||||||||||||||||||
| Short-term borrowings | 2,678 | 28.3 | 4.19 | 2,577 | 30.2 | 4.66 | ||||||||||||||||||||||||||||||||
| Long-term debt | 1,601 | 21.5 | 5.33 | 2,905 | 40.4 | 5.52 | ||||||||||||||||||||||||||||||||
| Qualifying debt | 1,067 | 17.4 | 6.48 | 678 | 6.3 | 3.63 | ||||||||||||||||||||||||||||||||
| Total interest bearing liabilities | 60,252 | 449.7 | 2.96 | 55,728 | 475.1 | 3.38 | ||||||||||||||||||||||||||||||||
| Interest cost of funding earning assets | 1.96 | 2.21 | ||||||||||||||||||||||||||||||||||||
| Non-interest bearing liabilities | ||||||||||||||||||||||||||||||||||||||
| Non-interest bearing deposits | 27,919 | 26,438 | ||||||||||||||||||||||||||||||||||||
| Other liabilities | 1,554 | 1,539 | ||||||||||||||||||||||||||||||||||||
| Equity | 8,079 | 7,607 | ||||||||||||||||||||||||||||||||||||
| Total liabilities and equity | $ | 97,804 | $ | 91,312 | ||||||||||||||||||||||||||||||||||
| Net interest income and margin (5) | $ | 807.6 | 3.57 | % | $ | 750.4 | 3.53 | % | ||||||||||||||||||||||||||||||
(1) Yields on loans and securities have been adjusted to a tax equivalent basis. The tax equivalent adjustment was $10.4 million and $9.7 million for the three months ended September 30, 2026 and 2025, respectively.
(2) Included in the yield computation are net loan fees of $23.9 million and $28.1 million for the three months ended September 30, 2026 and 2025, respectively.
(3) Interest income includes a reduction for earnings credits totaling $56.7 million and $64.9 million for the three months ended September 30, 2026 and 2025, respectively.
(4) Includes nonaccrual loans.
(5) Net interest margin is computed by dividing net interest income on a tax equivalent basis by total average earning assets, annualized on an actual/actual basis.
14
| Western Alliance Bancorporation and Subsidiaries | ||||||||||||||||||||||||||||||||||||||
| Analysis of Average Balances, Yields and Rates | ||||||||||||||||||||||||||||||||||||||
| Unaudited | ||||||||||||||||||||||||||||||||||||||
| Nine Months Ended | ||||||||||||||||||||||||||||||||||||||
| September 30, 2026 | September 30, 2025 | |||||||||||||||||||||||||||||||||||||
| Average Balance | Interest | Average Yield / Cost | Average Balance | Interest | Average Yield / Cost | |||||||||||||||||||||||||||||||||
| (dollars in millions) | ||||||||||||||||||||||||||||||||||||||
| Interest earning assets | ||||||||||||||||||||||||||||||||||||||
| Loans HFS | $ | 5,661 | $ | 255.4 | 6.03 | % | $ | 4,725 | $ | 217.7 | 6.16 | % | ||||||||||||||||||||||||||
| Loans HFI: | ||||||||||||||||||||||||||||||||||||||
| Commercial and industrial | 28,512 | 1,290.9 | 6.10 | 24,056 | 1,168.9 | 6.55 | ||||||||||||||||||||||||||||||||
| CRE - non-owner occupied | 10,343 | 512.0 | 6.62 | 10,247 | 547.8 | 7.15 | ||||||||||||||||||||||||||||||||
| CRE - owner occupied | 1,608 | 72.9 | 6.08 | 1,785 | 80.7 | 6.15 | ||||||||||||||||||||||||||||||||
| Construction and land development | 4,130 | 239.3 | 7.78 | 4,309 | 269.2 | 8.36 | ||||||||||||||||||||||||||||||||
| Residential real estate | 14,832 | 467.3 | 4.21 | 14,435 | 457.5 | 4.24 | ||||||||||||||||||||||||||||||||
| Consumer | 17 | 0.9 | 7.07 | 34 | 1.8 | 6.99 | ||||||||||||||||||||||||||||||||
| Total loans HFI (1), (2), (3), (4) | 59,442 | 2,583.3 | 5.84 | 54,866 | 2,525.9 | 6.18 | ||||||||||||||||||||||||||||||||
| Investment securities: | ||||||||||||||||||||||||||||||||||||||
| Taxable | 18,618 | 629.4 | 4.52 | 15,322 | 529.2 | 4.62 | ||||||||||||||||||||||||||||||||
| Tax-exempt | 2,314 | 74.0 | 5.40 | 2,221 | 72.0 | 5.44 | ||||||||||||||||||||||||||||||||
| Total investment securities (1) | 20,932 | 703.4 | 4.62 | 17,543 | 601.2 | 4.72 | ||||||||||||||||||||||||||||||||
| Cash and other | 4,469 | 135.3 | 4.05 | 3,909 | 130.7 | 4.47 | ||||||||||||||||||||||||||||||||
| Total interest earning assets | 90,504 | 3,677.4 | 5.48 | 81,043 | 3,475.5 | 5.78 | ||||||||||||||||||||||||||||||||
| Non-interest earning assets | ||||||||||||||||||||||||||||||||||||||
| Cash and due from banks | 504 | 358 | ||||||||||||||||||||||||||||||||||||
| Allowance for loan losses | (485) | (405) | ||||||||||||||||||||||||||||||||||||
| Bank owned life insurance | 1,069 | 1,026 | ||||||||||||||||||||||||||||||||||||
| Other assets | 5,713 | 4,862 | ||||||||||||||||||||||||||||||||||||
| Total assets | $ | 97,305 | $ | 86,884 | ||||||||||||||||||||||||||||||||||
| Interest bearing liabilities | ||||||||||||||||||||||||||||||||||||||
| Interest bearing deposits: | ||||||||||||||||||||||||||||||||||||||
| Interest bearing demand accounts | $ | 19,346 | $ | 312.9 | 2.16 | % | $ | 15,883 | $ | 298.5 | 2.51 | % | ||||||||||||||||||||||||||
| Savings and money market accounts | 24,887 | 520.5 | 2.80 | 22,113 | 524.7 | 3.17 | ||||||||||||||||||||||||||||||||
| Certificates of deposit | 9,897 | 280.3 | 3.79 | 10,076 | 331.1 | 4.39 | ||||||||||||||||||||||||||||||||
| Total interest bearing deposits | 54,130 | 1,113.7 | 2.75 | 48,072 | 1,154.3 | 3.21 | ||||||||||||||||||||||||||||||||
| Short-term borrowings | 2,984 | 91.6 | 4.10 | 2,452 | 86.7 | 4.72 | ||||||||||||||||||||||||||||||||
| Long-term debt | 1,371 | 57.0 | 5.56 | 2,686 | 112.1 | 5.58 | ||||||||||||||||||||||||||||||||
| Qualifying debt | 1,072 | 44.3 | 5.52 | 800 | 23.8 | 3.97 | ||||||||||||||||||||||||||||||||
| Total interest bearing liabilities | 59,557 | 1,306.6 | 2.93 | 54,010 | 1,376.9 | 3.41 | ||||||||||||||||||||||||||||||||
| Interest cost of funding earning assets | 1.93 | 2.27 | ||||||||||||||||||||||||||||||||||||
| Non-interest bearing liabilities | ||||||||||||||||||||||||||||||||||||||
| Non-interest bearing deposits | 28,209 | 24,051 | ||||||||||||||||||||||||||||||||||||
| Other liabilities | 1,469 | 1,534 | ||||||||||||||||||||||||||||||||||||
| Equity | 8,070 | 7,289 | ||||||||||||||||||||||||||||||||||||
| Total liabilities and equity | $ | 97,305 | $ | 86,884 | ||||||||||||||||||||||||||||||||||
| Net interest income and margin (5) | $ | 2,370.8 | 3.55 | % | $ | 2,098.6 | 3.51 | % | ||||||||||||||||||||||||||||||
(1) Yields on loans and securities have been adjusted to a tax equivalent basis. The tax equivalent adjustment was $30.7 million and $30.1 million for the nine months ended September 30, 2026 and 2025, respectively.
(2) Included in the yield computation are net loan fees of $73.3 million and $77.4 million for the nine months ended September 30, 2026 and 2025, respectively.
(3) Interest income includes a reduction for earnings credits totaling $157.9 million and $184.3 million for the nine months ended September 30, 2026 and 2025, respectively.
(4) Includes nonaccrual loans.
(5) Net interest margin is computed by dividing net interest income on a tax equivalent basis by total average earning assets, annualized on an actual/actual basis.
15
| Western Alliance Bancorporation and Subsidiaries | ||
| Income Statement Classification of Earnings Credit and Referral Costs | ||
| Unaudited | ||
The below table presents the income statement classification for total earnings credit and referral costs incurred on deposits:
| Three Months Ended | |||||||||||||||||||||||||||||
| Sep 30, 2026 | Jun 30, 2026 | Mar 31, 2026 | Dec 31, 2025 | Sep 30, 2025 | |||||||||||||||||||||||||
| Income statement line item | (in millions) | ||||||||||||||||||||||||||||
| Interest income (1) | $ | 56.7 | $ | 52.5 | $ | 48.7 | $ | 56.6 | $ | 64.9 | |||||||||||||||||||
| Commercial banking income and related fees (1) | 8.6 | 8.4 | 8.3 | 7.2 | 5.4 | ||||||||||||||||||||||||
| Deposit costs (2) | 158.4 | 173.3 | 157.3 | 165.0 | 169.1 | ||||||||||||||||||||||||
| Total earnings credit and referral costs | $ | 223.7 | $ | 234.2 | $ | 214.3 | $ | 228.8 | $ | 239.4 | |||||||||||||||||||
(1) Earnings credits recorded as a reduction to Interest income and Commercial banking income and related fees.
(2) Deposit costs also included $7.0 million, $5.9 million, $6.0 million, $6.2 million, and $6.0 million in other deposit related costs for each respective period in the table above, primarily associated with reciprocal deposits.
| Western Alliance Bancorporation and Subsidiaries | ||
| Reconciliation of Non-GAAP Financial Measures | ||
| Unaudited | ||
| Pre-Provision Net Revenue by Quarter: | |||||||||||||||||||||||||||||
| Three Months Ended | |||||||||||||||||||||||||||||
| Sep 30, 2026 | Jun 30, 2026 | Mar 31, 2026 | Dec 31, 2025 | Sep 30, 2025 | |||||||||||||||||||||||||
| (in millions) | |||||||||||||||||||||||||||||
| Net interest income | $ | 807.6 | $ | 796.9 | $ | 766.3 | $ | 766.2 | $ | 750.4 | |||||||||||||||||||
| Total non-interest income | 206.6 | 198.8 | 252.6 | 214.7 | 187.8 | ||||||||||||||||||||||||
| Net revenue | $ | 1,014.2 | $ | 995.7 | $ | 1,018.9 | $ | 980.9 | $ | 938.2 | |||||||||||||||||||
| Total non-interest expense | 595.1 | 583.3 | 574.4 | 552.2 | 544.4 | ||||||||||||||||||||||||
| Pre-provision net revenue (1) | $ | 419.1 | $ | 412.4 | $ | 444.5 | $ | 428.7 | $ | 393.8 | |||||||||||||||||||
| Less: | |||||||||||||||||||||||||||||
| Provision for credit losses | 80.0 | 80.4 | 213.2 | 73.0 | 80.0 | ||||||||||||||||||||||||
| Income tax expense | 61.9 | 63.2 | 42.1 | 62.5 | 53.3 | ||||||||||||||||||||||||
| Net income | $ | 277.2 | $ | 268.8 | $ | 189.2 | $ | 293.2 | $ | 260.5 | |||||||||||||||||||
| Efficiency Ratio (Tax Equivalent Basis) by Quarter: | |||||||||||||||||||||||||||||
| Three Months Ended | |||||||||||||||||||||||||||||
| Sep 30, 2026 | Jun 30, 2026 | Mar 31, 2026 | Dec 31, 2025 | Sep 30, 2025 | |||||||||||||||||||||||||
| (dollars in millions) | |||||||||||||||||||||||||||||
| Total non-interest expense | $ | 595.1 | $ | 583.3 | $ | 574.4 | $ | 552.2 | $ | 544.4 | |||||||||||||||||||
| Less: Deposit costs | 165.4 | 179.2 | 163.3 | 171.2 | 175.1 | ||||||||||||||||||||||||
| Total non-interest expense, excluding deposit costs | 429.7 | 404.1 | 411.1 | 381.0 | 369.3 | ||||||||||||||||||||||||
| Divided by: | |||||||||||||||||||||||||||||
| Total net interest income | 807.6 | 796.9 | 766.3 | 766.2 | 750.4 | ||||||||||||||||||||||||
| Plus: | |||||||||||||||||||||||||||||
| Tax equivalent interest adjustment | 10.4 | 10.1 | 10.1 | 9.9 | 9.7 | ||||||||||||||||||||||||
| Total non-interest income | 206.6 | 198.8 | 252.6 | 214.7 | 187.8 | ||||||||||||||||||||||||
| Less: Deposit costs | 165.4 | 179.2 | 163.3 | 171.2 | 175.1 | ||||||||||||||||||||||||
| $ | 859.2 | $ | 826.6 | $ | 865.7 | $ | 819.6 | $ | 772.8 | ||||||||||||||||||||
| Efficiency ratio (2) | 58.1 | % | 58.0 | % | 55.8 | % | 55.7 | % | 57.4 | % | |||||||||||||||||||
| Efficiency ratio, adjusted for deposit costs (2) | 50.0 | % | 48.9 | % | 47.5 | % | 46.5 | % | 47.8 | % | |||||||||||||||||||
16
| Western Alliance Bancorporation and Subsidiaries | ||
| Reconciliation of Non-GAAP Financial Measures | ||
| Unaudited | ||
| Tangible Common Equity: | |||||||||||||||||||||||||||||
| Sep 30, 2026 | Jun 30, 2026 | Mar 31, 2026 | Dec 31, 2025 | Sep 30, 2025 | |||||||||||||||||||||||||
| (in millions, except per share data) | |||||||||||||||||||||||||||||
| Total equity | $ | 7,947 | $ | 8,135 | $ | 7,908 | $ | 7,946 | $ | 7,690 | |||||||||||||||||||
| Less: | |||||||||||||||||||||||||||||
| Goodwill and intangible assets, net | 642 | 644 | 646 | 649 | 651 | ||||||||||||||||||||||||
| Preferred stock | 295 | 295 | 295 | 295 | 295 | ||||||||||||||||||||||||
| Noncontrolling interest in subsidiary | 293 | 293 | 293 | 293 | 293 | ||||||||||||||||||||||||
| Total tangible common equity | 6,717 | 6,903 | 6,674 | 6,709 | 6,451 | ||||||||||||||||||||||||
| Plus: deferred tax - attributed to intangible assets | 3 | 3 | 3 | 2 | 2 | ||||||||||||||||||||||||
| Total tangible common equity, net of tax | $ | 6,720 | $ | 6,906 | $ | 6,677 | $ | 6,711 | $ | 6,453 | |||||||||||||||||||
| Total assets | $ | 98,072 | $ | 98,701 | $ | 98,853 | $ | 92,774 | $ | 90,970 | |||||||||||||||||||
| Less: goodwill and intangible assets, net | 642 | 644 | 646 | 649 | 651 | ||||||||||||||||||||||||
| Tangible assets | 97,430 | 98,057 | 98,207 | 92,125 | 90,319 | ||||||||||||||||||||||||
| Plus: deferred tax - attributed to intangible assets | 3 | 3 | 3 | 2 | 2 | ||||||||||||||||||||||||
| Total tangible assets, net of tax | $ | 97,433 | $ | 98,060 | $ | 98,210 | $ | 92,127 | $ | 90,321 | |||||||||||||||||||
| Tangible common equity ratio (3) | 6.9 | % | 7.0 | % | 6.8 | % | 7.3 | % | 7.1 | % | |||||||||||||||||||
| Common shares outstanding | 108.0 | 109.2 | 109.2 | 109.5 | 110.2 | ||||||||||||||||||||||||
| Tangible book value per share, net of tax (3) | $ | 62.22 | $ | 63.24 | $ | 61.14 | $ | 61.29 | $ | 58.56 | |||||||||||||||||||
| Return on Average Tangible Common Equity: | |||||||||||||||||||||||||||||
| Three Months Ended | |||||||||||||||||||||||||||||
| Sep 30, 2026 | Jun 30, 2026 | Mar 31, 2026 | Dec 31, 2025 | Sep 30, 2025 | |||||||||||||||||||||||||
| (in millions) | |||||||||||||||||||||||||||||
| Net income available to common shareholders | $ | 266.9 | $ | 258.5 | $ | 178.9 | $ | 282.9 | $ | 250.2 | |||||||||||||||||||
| Divided by: | |||||||||||||||||||||||||||||
| Average equity | 8,079 | 8,012 | 8,121 | 7,864 | 7,607 | ||||||||||||||||||||||||
| Less: | |||||||||||||||||||||||||||||
| Average goodwill and intangible assets | 643 | 646 | 648 | 650 | 652 | ||||||||||||||||||||||||
| Average preferred stock | 295 | 295 | 295 | 295 | 295 | ||||||||||||||||||||||||
| Average noncontrolling interest in subsidiary | 293 | 293 | 293 | 293 | 293 | ||||||||||||||||||||||||
| Average tangible common equity | $ | 6,848 | $ | 6,778 | $ | 6,885 | $ | 6,626 | $ | 6,367 | |||||||||||||||||||
| Return on average tangible common equity (1) | 15.5 | % | 15.3 | % | 10.5 | % | 16.9 | % | 15.6 | % | |||||||||||||||||||
17
| Western Alliance Bancorporation and Subsidiaries | ||
| Reconciliation of Non-GAAP Financial Measures | ||
| Unaudited | ||
The adjusted revenue, earnings and return metrics presented below for the nine months ended September 30, 2026 exclude the impact to provision for credit losses of charging off the remaining balance of the Leucadia Asset Management ("LAM") loan as well as gains from sales of investment securities that were executed as part of the Company's mitigation strategy, as applicable. In addition, net charge-offs for the nine months ended September 30, 2026 have been adjusted to exclude the impact of fraud related charge-offs associated with the LAM and Cantor Group V, LLC ("Cantor") loans. For more information regarding the LAM and Cantor loans, see the Company's Quarterly Report on Form 10-Q for the quarter ended June 30, 2026, which was filed with the U.S. Securities and Exchange Commission on July 31, 2026.
| Net Revenue and Pre-Provision Net Revenue, As Adjusted | |||||||||||||||||||||||||||||||||||
| Nine Months Ended September 30, 2026 | |||||||||||||||||||||||||||||||||||
| (in millions) | |||||||||||||||||||||||||||||||||||
| Net revenue | $ | 3,028.8 | |||||||||||||||||||||||||||||||||
| Adjusted for: | |||||||||||||||||||||||||||||||||||
| Gain on sales of investment securities | (50.5) | ||||||||||||||||||||||||||||||||||
| Net revenue, as adjusted | $ | 2,978.3 | |||||||||||||||||||||||||||||||||
| Total non-interest expense | 1,752.8 | ||||||||||||||||||||||||||||||||||
| Pre-provision net revenue, as adjusted (1) | $ | 1,225.5 | |||||||||||||||||||||||||||||||||
| Less: | |||||||||||||||||||||||||||||||||||
| Provision for credit losses | 373.6 | ||||||||||||||||||||||||||||||||||
| Income tax expense | 167.2 | ||||||||||||||||||||||||||||||||||
| Gain on sales of investment securities | (50.5) | ||||||||||||||||||||||||||||||||||
| Net income | $ | 735.2 | |||||||||||||||||||||||||||||||||
| Earnings per Share, As Adjusted: | |||||||||||||||||||||||||||||||||||
| Nine Months Ended September 30, 2026 | |||||||||||||||||||||||||||||||||||
| (in millions, except per share data) | |||||||||||||||||||||||||||||||||||
| Net income | $ | 735.2 | |||||||||||||||||||||||||||||||||
| Adjusted for: | |||||||||||||||||||||||||||||||||||
| Gain on sales of investment securities | (50.5) | ||||||||||||||||||||||||||||||||||
| Provision for credit losses on LAM | 126.4 | ||||||||||||||||||||||||||||||||||
| Tax effect of adjustments | (13.8) | ||||||||||||||||||||||||||||||||||
| Net income, as adjusted | 797.3 | ||||||||||||||||||||||||||||||||||
| Net income attributable to noncontrolling interest | 21.3 | ||||||||||||||||||||||||||||||||||
| Dividends on preferred stock | 9.6 | ||||||||||||||||||||||||||||||||||
| Net income available to common stockholders, as adjusted | $ | 766.4 | |||||||||||||||||||||||||||||||||
| Diluted shares | 108.1 | ||||||||||||||||||||||||||||||||||
| Diluted earnings per share, as adjusted (1) | $ | 7.01 | |||||||||||||||||||||||||||||||||
Return on Average Assets, As Adjusted: | |||||||||||||||||||||||||||||||||||
| Nine Months Ended September 30, 2026 | |||||||||||||||||||||||||||||||||||
| (dollars in millions) | |||||||||||||||||||||||||||||||||||
Net income, as adjusted | $ | 797.3 | |||||||||||||||||||||||||||||||||
| Divided by: | |||||||||||||||||||||||||||||||||||
| Average assets | $ | 97,305 | |||||||||||||||||||||||||||||||||
Return on average assets, as adjusted (1) | 1.10 | % | |||||||||||||||||||||||||||||||||
18
| Western Alliance Bancorporation and Subsidiaries | ||
| Reconciliation of Non-GAAP Financial Measures | ||
| Unaudited | ||
Return on Average Tangible Common Equity, As Adjusted: | |||||||||||||||||||||||||||||||||||
| Nine Months Ended September 30, 2026 | |||||||||||||||||||||||||||||||||||
| (dollars in millions) | |||||||||||||||||||||||||||||||||||
Net income available to common stockholders, as adjusted | $ | 766.4 | |||||||||||||||||||||||||||||||||
| Divided by: Average equity | 8,070 | ||||||||||||||||||||||||||||||||||
| Less: | |||||||||||||||||||||||||||||||||||
| Average goodwill and intangible assets | 646 | ||||||||||||||||||||||||||||||||||
| Average preferred stock | 295 | ||||||||||||||||||||||||||||||||||
| Average noncontrolling interest in subsidiary | 293 | ||||||||||||||||||||||||||||||||||
| Average tangible common equity | $ | 6,836 | |||||||||||||||||||||||||||||||||
| Return on average tangible common equity (1) | 13.8 | % | |||||||||||||||||||||||||||||||||
| Return on average tangible common equity, as adjusted (1) | 15.0 | % | |||||||||||||||||||||||||||||||||
| Net Charge-Offs and Net Charge-Offs to Average Loans, As Adjusted: | |||||||||||||||||||||||||||||||||||
| Nine Months Ended September 30, 2026 | |||||||||||||||||||||||||||||||||||
| (dollars in millions) | |||||||||||||||||||||||||||||||||||
| Net charge-offs | $ | 309.3 | |||||||||||||||||||||||||||||||||
| Adjusted for fraud related charge-offs: | |||||||||||||||||||||||||||||||||||
| LAM | (126.4) | ||||||||||||||||||||||||||||||||||
| Cantor | (26.1) | ||||||||||||||||||||||||||||||||||
| Net charge-offs, as adjusted | $ | 156.8 | |||||||||||||||||||||||||||||||||
| Divided by: Average HFI loans | 59,442 | ||||||||||||||||||||||||||||||||||
| Net charge-offs to average loans - annualized, as adjusted | 0.35 | % | |||||||||||||||||||||||||||||||||
| Non-GAAP Financial Measures Footnotes | ||||||||||||||||||||||||||
| (1) | We believe this non-GAAP measurement is a key indicator of the earnings power of the Company. | |||||||||||||||||||||||||
| (2) | We believe this non-GAAP ratio provides a useful metric to measure the efficiency of the Company. | |||||||||||||||||||||||||
| (3) | We believe this non-GAAP metric provides an important metric with which to analyze and evaluate the financial condition and capital strength of the Company. | |||||||||||||||||||||||||
19

EARNINGS CALL 3rd Quarter 2026 October 20, 2026
2 This presentation contains forward-looking statements that relate to expectations, beliefs, projections, future plans and strategies, anticipated events or trends and similar expressions concerning matters that are not historical facts. Examples of forward-looking statements include, among others, statements we make regarding our expectations with regard to our business, financial and operating results, including our deposits and deposit optimization strategy, liquidity and funding, changes in economic conditions and related impacts on the Company's business, future economic performance and dividends, including our statements on the slide entitled "Management Outlook." The forward-looking statements contained herein reflect our current views about future events and financial performance and are subject to risks, uncertainties, assumptions and changes in circumstances that may cause our actual results to differ significantly from historical results and those expressed in any forward-looking statement. Some factors that could cause actual results to differ materially from historical or expected results include, among others: the risk factors discussed in the Company’s Annual Report on Form 10-K for the year ended December 31, 2025 and the Company's subsequent Quarterly Reports on Form 10-Q, each as filed with the Securities and Exchange Commission; adverse developments in the financial services industry generally and any related impact on depositor behavior; risks related to the sufficiency of liquidity; changes in international trade policies, tariffs and treaties affecting imports and exports, trade disputes, barriers to trade or the emergence of other trade restrictions, and their related impacts on macroeconomic conditions and customer behavior; the potential adverse effects of unusual and infrequently occurring events and any governmental or societal responses thereto; changes in general economic conditions, either nationally or locally in the areas in which we conduct or will conduct our business; the impact on financial markets from geopolitical conflicts; inflation, interest rate, market and monetary fluctuations; increases in competitive pressures among financial institutions and businesses offering similar products and services; higher defaults on our loan portfolio than we expect; increased foreclosures and ownership of real property; changes in management’s estimate of the adequacy of the allowance for credit losses; technological risks and developments and cyber threats, attacks or events; emerging external focus among regulators and other officials related to risks in connection with the development and use of artificial intelligence; legislative or regulatory changes or changes in accounting principles, policies or guidelines; supervisory actions by regulatory agencies which may limit our ability to pursue certain growth opportunities, including expansion through acquisitions; additional regulatory requirements resulting from our continued growth; management’s estimates and projections of interest rates and interest rate policy; the execution of our business plan; the outcome of legal proceedings, the amount of funds and/or collateral that may be available for the repayment of such loans, and any adverse economic or other events impacting the collateral, borrower or guarantors with respect to such loans; and other factors affecting the financial services industry generally or the banking industry in particular. Any forward-looking statement made by us in this presentation is based only on information currently available to us and speaks only as of the date on which it is made. We do not intend and disclaim any duty or obligation to update or revise any industry information or forward-looking statements, whether written or oral, that may be made from time to time, set forth in this presentation to reflect new information, future events or otherwise, except to the extent required by applicable law. In light of these risks, uncertainties and assumptions, the forward- looking events discussed in this presentation might not occur, and you should not put undue reliance on any forward-looking statements. Non-GAAP Financial Measures This presentation contains both financial measures based on GAAP and non-GAAP based financial measures, which are used where management believes them to be helpful in understanding the Company’s results of operations or financial position. Where non-GAAP financial measures are used, the comparable GAAP financial measure, as well as the reconciliation to the comparable GAAP financial measure, can be found in the Company’s press release as of and for the quarter ended September 30, 2026. These disclosures should not be viewed as a substitute for operating results determined in accordance with GAAP, nor are they necessarily comparable to non-GAAP performance measures that may be presented by other companies. Forward-Looking Statements
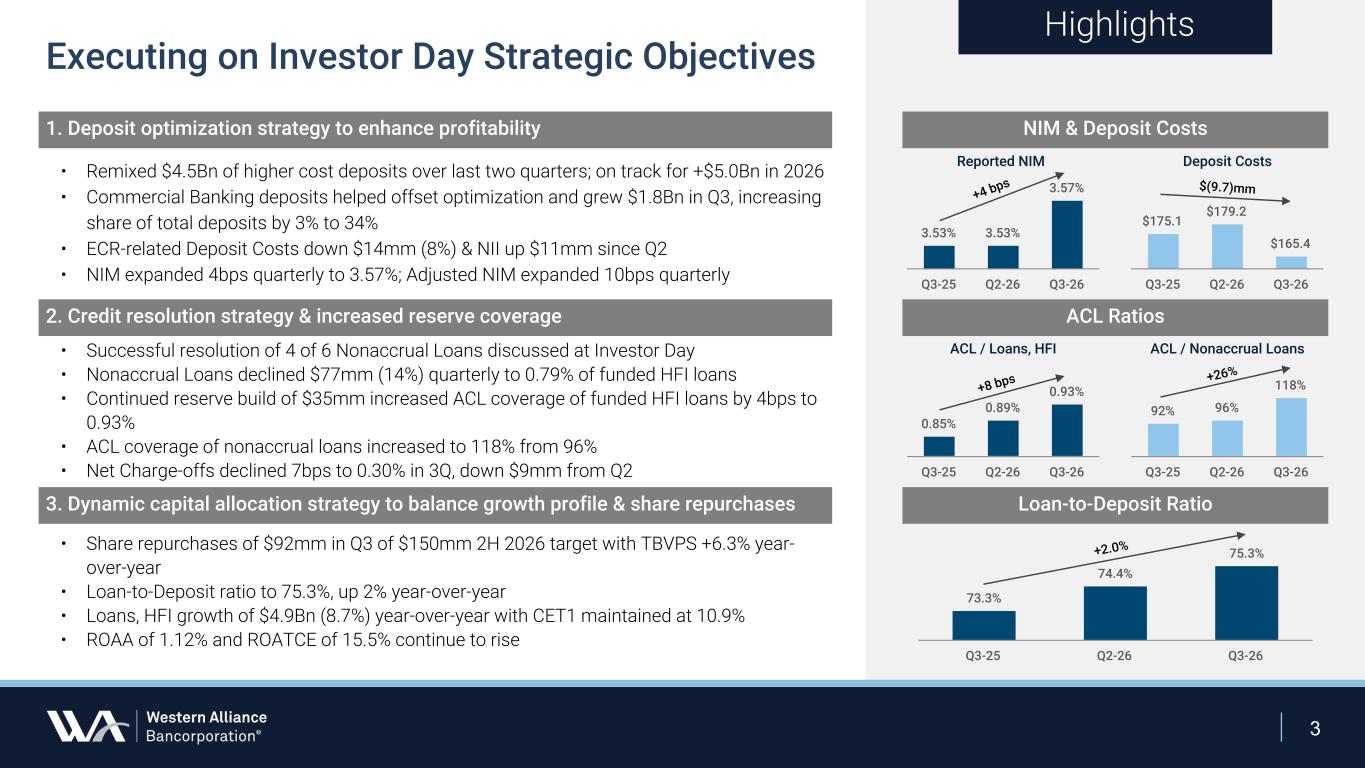
3 Executing on Investor Day Strategic Objectives Highlights 1. Deposit optimization strategy to enhance profitability 2. Credit resolution strategy & increased reserve coverage 3. Dynamic capital allocation strategy to balance growth profile & share repurchases • Remixed $4.5Bn of higher cost deposits over last two quarters; on track for +$5.0Bn in 2026 • Commercial Banking deposits helped offset optimization and grew $1.8Bn in Q3, increasing share of total deposits by 3% to 34% • ECR-related Deposit Costs down $14mm (8%) & NII up $11mm since Q2 • NIM expanded 4bps quarterly to 3.57%; Adjusted NIM expanded 10bps quarterly • Successful resolution of 4 of 6 Nonaccrual Loans discussed at Investor Day • Nonaccrual Loans declined $77mm (14%) quarterly to 0.79% of funded HFI loans • Continued reserve build of $35mm increased ACL coverage of funded HFI loans by 4bps to 0.93% • ACL coverage of nonaccrual loans increased to 118% from 96% • Net Charge-offs declined 7bps to 0.30% in 3Q, down $9mm from Q2 • Share repurchases of $92mm in Q3 of $150mm 2H 2026 target with TBVPS +6.3% year- over-year • Loan-to-Deposit ratio to 75.3%, up 2% year-over-year • Loans, HFI growth of $4.9Bn (8.7%) year-over-year with CET1 maintained at 10.9% • ROAA of 1.12% and ROATCE of 15.5% continue to rise NIM & Deposit Costs ACL Ratios 0.85% 0.89% 0.93% Q3-25 Q2-26 Q3-26 92% 96% 118% Q3-25 Q2-26 Q3-26 Loan-to-Deposit Ratio 73.3% 74.4% 75.3% Q3-25 Q2-26 Q3-26 ACL / Loans, HFI ACL / Nonaccrual Loans +2.0% +8 bps +26% 3.53% 3.53% 3.57% Q3-25 Q2-26 Q3-26 +4 bps Reported NIM Deposit Costs $175.1 $179.2 $165.4 Q3-25 Q2-26 Q3-26 $(9.7)mm
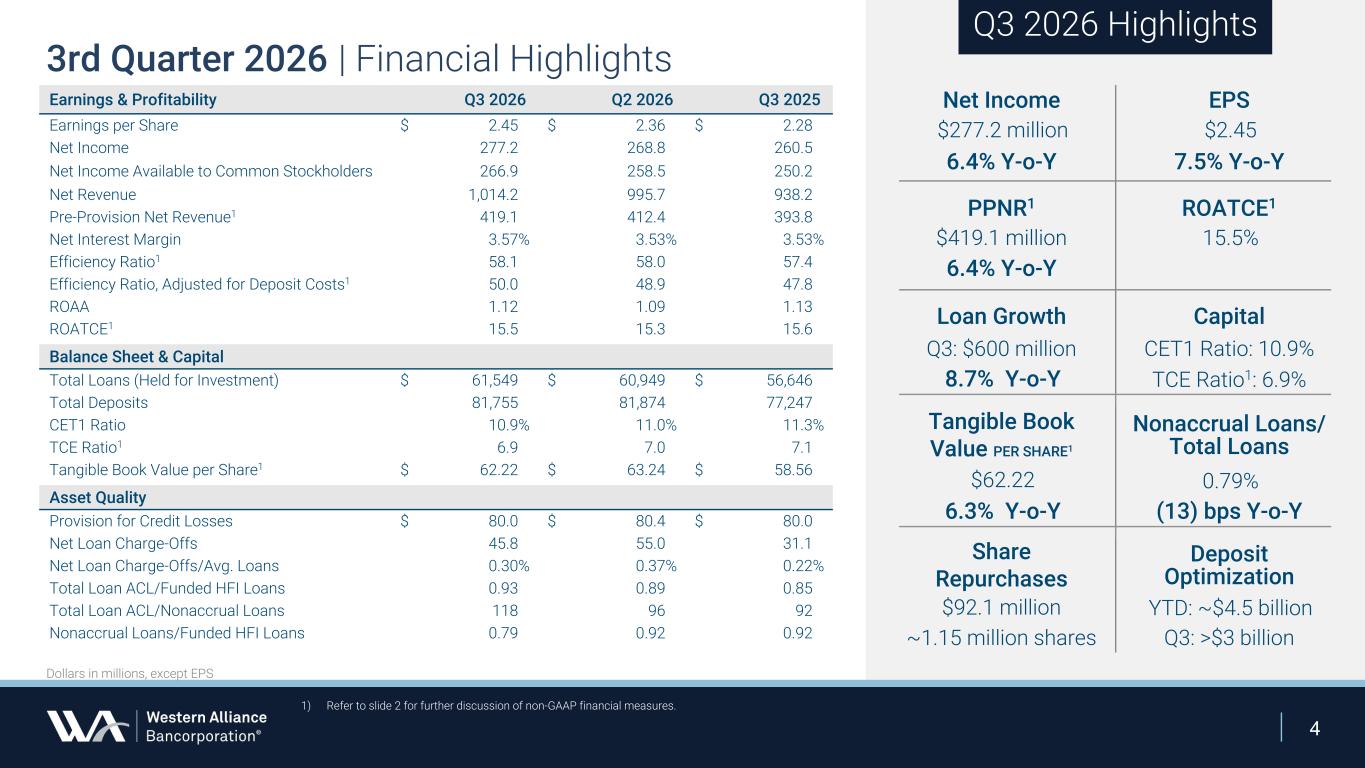
4 3rd Quarter 2026 | Financial Highlights Earnings & Profitability Q3 2026 Q2 2026 Q3 2025 Earnings per Share $ 2.45 $ 2.36 $ 2.28 Net Income 277.2 268.8 260.5 Net Income Available to Common Stockholders 266.9 258.5 250.2 Net Revenue 1,014.2 995.7 938.2 Pre-Provision Net Revenue1 419.1 412.4 393.8 Net Interest Margin 3.57% 3.53% 3.53% Efficiency Ratio1 58.1 58.0 57.4 Efficiency Ratio, Adjusted for Deposit Costs1 50.0 48.9 47.8 ROAA 1.12 1.09 1.13 ROATCE1 15.5 15.3 15.6 Balance Sheet & Capital Total Loans (Held for Investment) $ 61,549 $ 60,949 $ 56,646 Total Deposits 81,755 81,874 77,247 CET1 Ratio 10.9% 11.0% 11.3% TCE Ratio1 6.9 7.0 7.1 Tangible Book Value per Share1 $ 62.22 $ 63.24 $ 58.56 Asset Quality Provision for Credit Losses $ 80.0 $ 80.4 $ 80.0 Net Loan Charge-Offs 45.8 55.0 31.1 Net Loan Charge-Offs/Avg. Loans 0.30% 0.37% 0.22% Total Loan ACL/Funded HFI Loans 0.93 0.89 0.85 Total Loan ACL/Nonaccrual Loans 118 96 92 Nonaccrual Loans/Funded HFI Loans 0.79 0.92 0.92 Dollars in millions, except EPS 1) Refer to slide 2 for further discussion of non-GAAP financial measures. Q3 2026 Highlights Net Income EPS $277.2 million $2.45 6.4% Y-o-Y 7.5% Y-o-Y PPNR1 ROATCE1 $419.1 million 15.5% 6.4% Y-o-Y Loan Growth Capital Q3: $600 million CET1 Ratio: 10.9% 8.7% Y-o-Y TCE Ratio1: 6.9% Tangible Book Value PER SHARE1 Nonaccrual Loans/ Total Loans $62.22 0.79% 6.3% Y-o-Y (13) bps Y-o-Y Share Repurchases Deposit Optimization $92.1 million YTD: ~$4.5 billion ~1.15 million shares Q3: >$3 billion
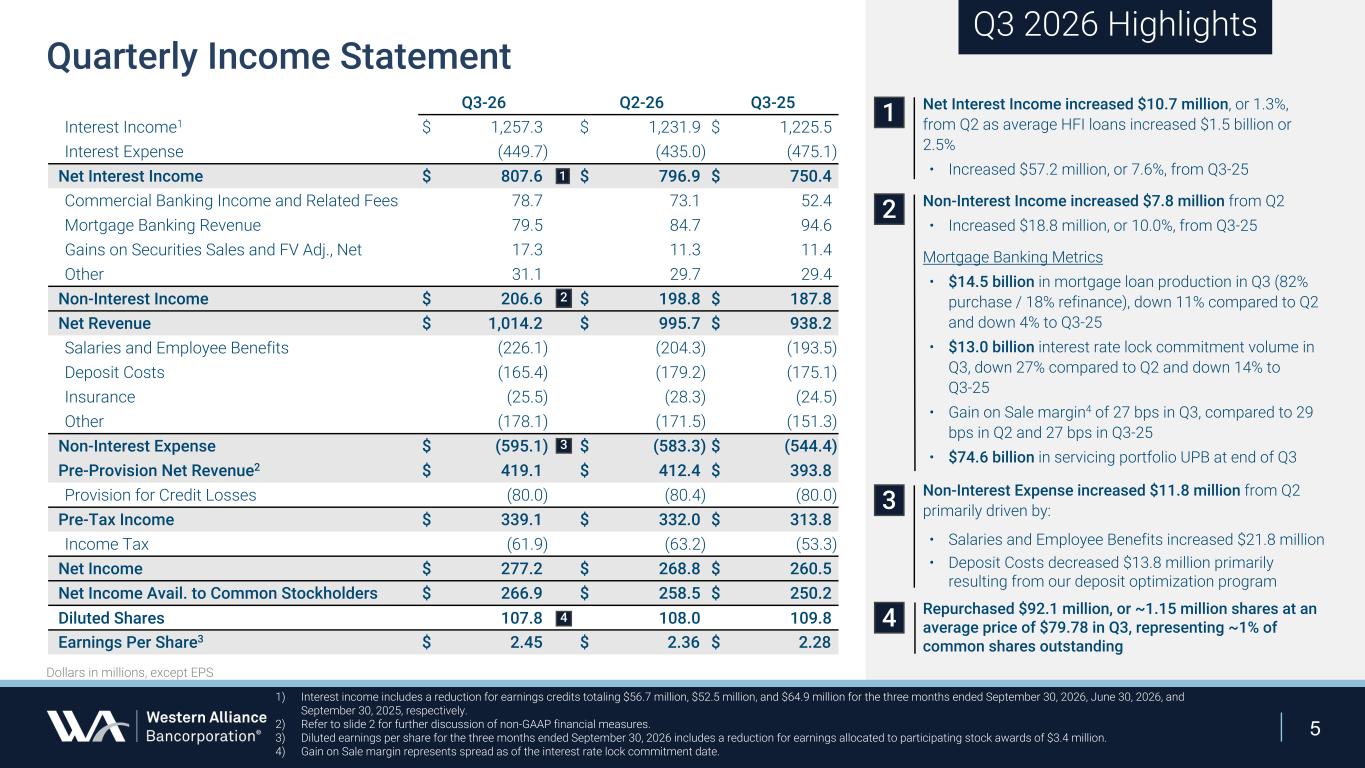
5 Q3-26 Q2-26 Q3-25 Interest Income1 $ 1,257.3 $ 1,231.9 $ 1,225.5 Interest Expense (449.7) (435.0) (475.1) Net Interest Income $ 807.6 $ 796.9 $ 750.4 Commercial Banking Income and Related Fees 78.7 73.1 52.4 Mortgage Banking Revenue 79.5 84.7 94.6 Gains on Securities Sales and FV Adj., Net 17.3 11.3 11.4 Other 31.1 29.7 29.4 Non-Interest Income $ 206.6 $ 198.8 $ 187.8 Net Revenue $ 1,014.2 $ 995.7 $ 938.2 Salaries and Employee Benefits (226.1) (204.3) (193.5) Deposit Costs (165.4) (179.2) (175.1) Insurance (25.5) (28.3) (24.5) Other (178.1) (171.5) (151.3) Non-Interest Expense $ (595.1) $ (583.3) $ (544.4) Pre-Provision Net Revenue2 $ 419.1 $ 412.4 $ 393.8 Provision for Credit Losses (80.0) (80.4) (80.0) Pre-Tax Income $ 339.1 $ 332.0 $ 313.8 Income Tax (61.9) (63.2) (53.3) Net Income $ 277.2 $ 268.8 $ 260.5 Net Income Avail. to Common Stockholders $ 266.9 $ 258.5 $ 250.2 Diluted Shares 107.8 108.0 109.8 Earnings Per Share3 $ 2.45 $ 2.36 $ 2.28 Net Interest Income increased $10.7 million, or 1.3%, from Q2 as average HFI loans increased $1.5 billion or 2.5% • Increased $57.2 million, or 7.6%, from Q3-25 Non-Interest Income increased $7.8 million from Q2 • Increased $18.8 million, or 10.0%, from Q3-25 Mortgage Banking Metrics • $14.5 billion in mortgage loan production in Q3 (82% purchase / 18% refinance), down 11% compared to Q2 and down 4% to Q3-25 • $13.0 billion interest rate lock commitment volume in Q3, down 27% compared to Q2 and down 14% to Q3-25 • Gain on Sale margin4 of 27 bps in Q3, compared to 29 bps in Q2 and 27 bps in Q3-25 • $74.6 billion in servicing portfolio UPB at end of Q3 Non-Interest Expense increased $11.8 million from Q2 primarily driven by: • Salaries and Employee Benefits increased $21.8 million • Deposit Costs decreased $13.8 million primarily resulting from our deposit optimization program Repurchased $92.1 million, or ~1.15 million shares at an average price of $79.78 in Q3, representing ~1% of common shares outstanding 1) Interest income includes a reduction for earnings credits totaling $56.7 million, $52.5 million, and $64.9 million for the three months ended September 30, 2026, June 30, 2026, and September 30, 2025, respectively. 2) Refer to slide 2 for further discussion of non-GAAP financial measures. 3) Diluted earnings per share for the three months ended September 30, 2026 includes a reduction for earnings allocated to participating stock awards of $3.4 million. 4) Gain on Sale margin represents spread as of the interest rate lock commitment date. Quarterly Income Statement Q3 2026 Highlights 1 2 3 1 2 4 Dollars in millions, except EPS 3 4
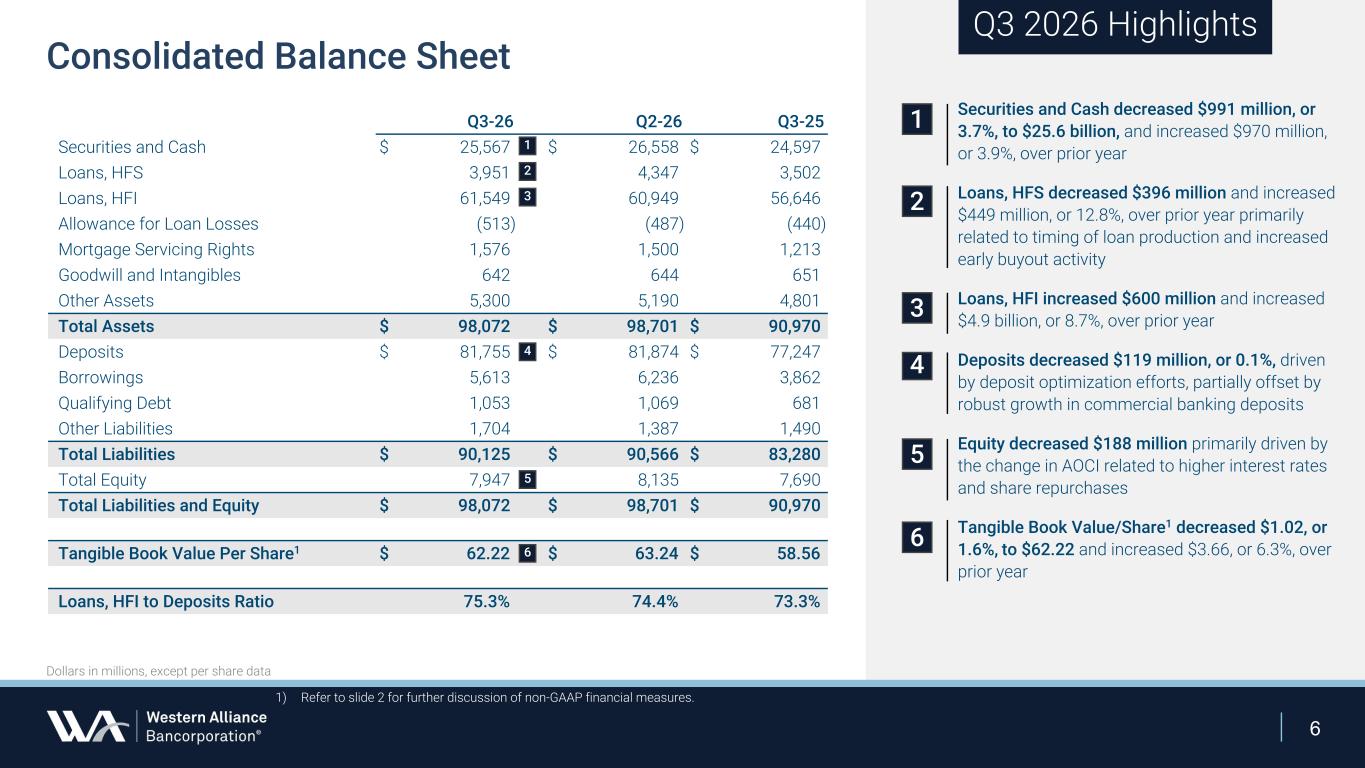
6 Dollars in millions, except per share data Consolidated Balance Sheet Q3 2026 Highlights 1 2 3 4 Securities and Cash decreased $991 million, or 3.7%, to $25.6 billion, and increased $970 million, or 3.9%, over prior year Loans, HFS decreased $396 million and increased $449 million, or 12.8%, over prior year primarily related to timing of loan production and increased early buyout activity Loans, HFI increased $600 million and increased $4.9 billion, or 8.7%, over prior year Deposits decreased $119 million, or 0.1%, driven by deposit optimization efforts, partially offset by robust growth in commercial banking deposits Equity decreased $188 million primarily driven by the change in AOCI related to higher interest rates and share repurchases Tangible Book Value/Share1 decreased $1.02, or 1.6%, to $62.22 and increased $3.66, or 6.3%, over prior year 1) Refer to slide 2 for further discussion of non-GAAP financial measures. 5 1 3 4 5 6 Q3-26 Q2-26 Q3-25 Securities and Cash $ 25,567 $ 26,558 $ 24,597 Loans, HFS 3,951 4,347 3,502 Loans, HFI 61,549 60,949 56,646 Allowance for Loan Losses (513) (487) (440) Mortgage Servicing Rights 1,576 1,500 1,213 Goodwill and Intangibles 642 644 651 Other Assets 5,300 5,190 4,801 Total Assets $ 98,072 $ 98,701 $ 90,970 Deposits $ 81,755 $ 81,874 $ 77,247 Borrowings 5,613 6,236 3,862 Qualifying Debt 1,053 1,069 681 Other Liabilities 1,704 1,387 1,490 Total Liabilities $ 90,125 $ 90,566 $ 83,280 Total Equity 7,947 8,135 7,690 Total Liabilities and Equity $ 98,072 $ 98,701 $ 90,970 Tangible Book Value Per Share1 $ 62.22 $ 63.24 $ 58.56 Loans, HFI to Deposits Ratio 75.3 % 74.4 % 73.3 % 2 6
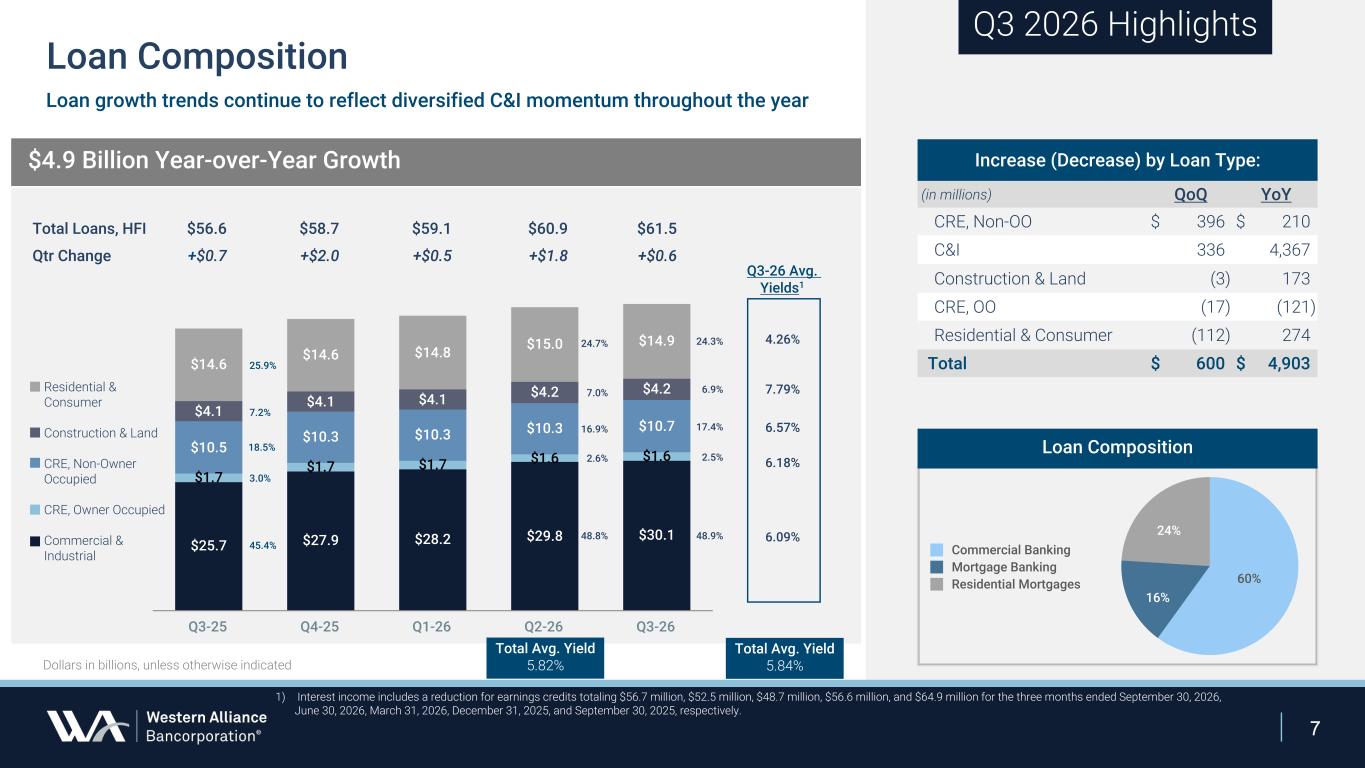
7 $4.9 Billion Year-over-Year Growth $25.7 $27.9 $28.2 $29.8 $30.1 $1.7 $1.7 $1.7 $1.6 $1.6$10.5 $10.3 $10.3 $10.3 $10.7 $4.1 $4.1 $4.1 $4.2 $4.2 $14.6 $14.6 $14.8 $15.0 $14.9 Q3-25 Q4-25 Q1-26 Q2-26 Q3-26 25.9% 3.0% 18.5% 45.4% 7.2% 24.3% 2.5% 17.4% 48.9% 6.9%Residential & Consumer Construction & Land CRE, Non-Owner Occupied CRE, Owner Occupied Commercial & Industrial $56.6 +$0.7 $58.7 +$2.0 $59.1 +$0.5 $60.9 +$1.8 $61.5 +$0.6 Dollars in billions, unless otherwise indicated Total Loans, HFI Qtr Change Loan Composition Q3 2026 Highlights Increase (Decrease) by Loan Type: (in millions) QoQ YoY CRE, Non-OO $ 396 $ 210 C&I 336 4,367 Construction & Land (3) 173 CRE, OO (17) (121) Residential & Consumer (112) 274 Total $ 600 $ 4,903 24.7% 2.6% 16.9% 48.8% 7.0% 4.26% 6.18% 6.57% 6.09% 7.79% Q3-26 Avg. Yields1 Total Avg. Yield 5.84% 1) Interest income includes a reduction for earnings credits totaling $56.7 million, $52.5 million, $48.7 million, $56.6 million, and $64.9 million for the three months ended September 30, 2026, June 30, 2026, March 31, 2026, December 31, 2025, and September 30, 2025, respectively. Loan growth trends continue to reflect diversified C&I momentum throughout the year 60% 16% 24% Commercial Banking Mortgage Banking Residential Mortgages Loan Composition Total Avg. Yield 5.82%
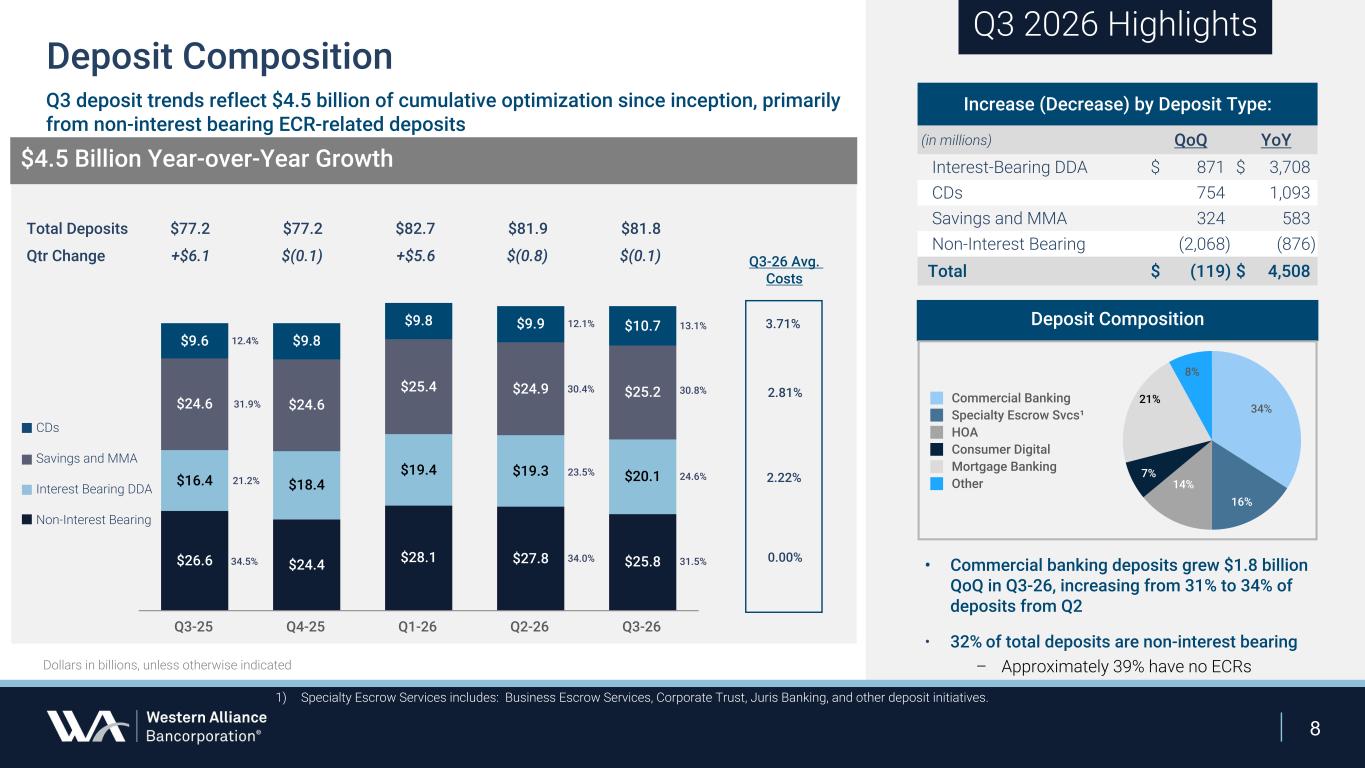
8 Q3 deposit trends reflect $4.5 billion of cumulative optimization since inception, primarily from non-interest bearing ECR-related deposits Q3 2026 Highlights $26.6 $24.4 $28.1 $27.8 $25.8 $16.4 $18.4 $19.4 $19.3 $20.1 $24.6 $24.6 $25.4 $24.9 $25.2 $9.6 $9.8 $9.8 $9.9 $10.7 Q3-25 Q4-25 Q1-26 Q2-26 Q3-26 21.2% 12.4% 34.5% 31.9% 24.6% 13.1% 31.5% 30.8% $4.5 Billion Year-over-Year Growth CDs Savings and MMA Interest Bearing DDA Non-Interest Bearing $77.2 $(0.1) $77.2 +$6.1 $81.9 $(0.8) $81.8 $(0.1) Increase (Decrease) by Deposit Type: (in millions) QoQ YoY Interest-Bearing DDA $ 871 $ 3,708 CDs 754 1,093 Savings and MMA 324 583 Non-Interest Bearing (2,068) (876) Total $ (119) $ 4,508 $82.7 +$5.6 Total Deposits Qtr Change Deposit Composition Q3-26 Avg. Costs Dollars in billions, unless otherwise indicated 3.71% 2.22% 0.00% 2.81% 23.5% 12.1% 34.0% 30.4% Deposit Composition • 32% of total deposits are non-interest bearing – Approximately 39% have no ECRs 34% 16% 14% 7% 21% 8% Commercial Banking Specialty Escrow Svcs¹ HOA Consumer Digital Mortgage Banking Other 1) Specialty Escrow Services includes: Business Escrow Services, Corporate Trust, Juris Banking, and other deposit initiatives. • Commercial banking deposits grew $1.8 billion QoQ in Q3-26, increasing from 31% to 34% of deposits from Q2
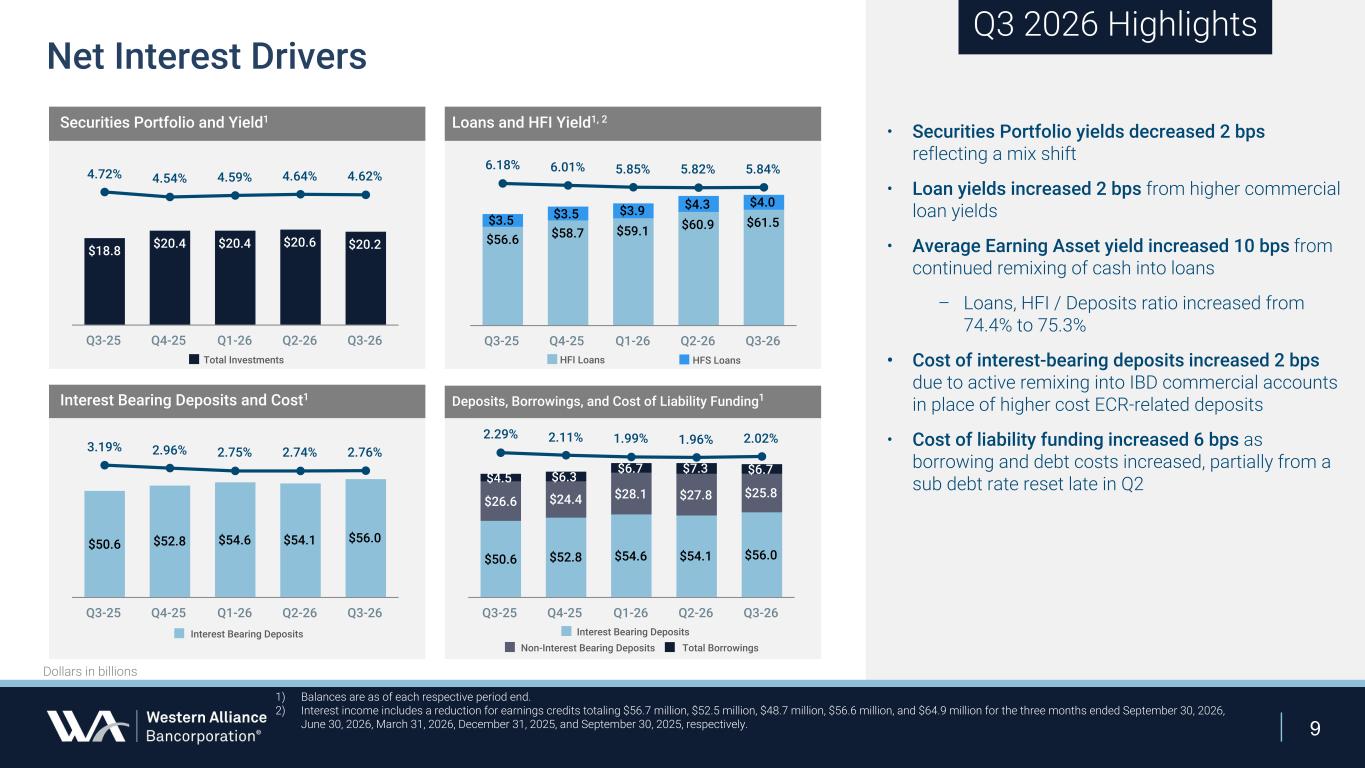
9 • Securities Portfolio yields decreased 2 bps reflecting a mix shift • Loan yields increased 2 bps from higher commercial loan yields • Average Earning Asset yield increased 10 bps from continued remixing of cash into loans – Loans, HFI / Deposits ratio increased from 74.4% to 75.3% • Cost of interest-bearing deposits increased 2 bps due to active remixing into IBD commercial accounts in place of higher cost ECR-related deposits • Cost of liability funding increased 6 bps as borrowing and debt costs increased, partially from a sub debt rate reset late in Q2 Interest Bearing Deposits and Cost1 Loans and HFI Yield1, 2 Deposits, Borrowings, and Cost of Liability Funding1 Securities Portfolio and Yield1 $18.8 $20.4 $20.4 $20.6 $20.2 4.72% 4.54% 4.59% 4.64% 4.62% Q3-25 Q4-25 Q1-26 Q2-26 Q3-26 $56.6 $58.7 $59.1 $60.9 $61.5$3.5 $3.5 $3.9 $4.3 $4.0 6.18% 6.01% 5.85% 5.82% 5.84% Q3-25 Q4-25 Q1-26 Q2-26 Q3-26 $50.6 $52.8 $54.6 $54.1 $56.0 3.19% 2.96% 2.75% 2.74% 2.76% Q3-25 Q4-25 Q1-26 Q2-26 Q3-26 $50.6 $52.8 $54.6 $54.1 $56.0 $26.6 $24.4 $28.1 $27.8 $25.8 $4.5 $6.3 $6.7 $7.3 $6.7 2.29% 2.11% 1.99% 1.96% 2.02% Q3-25 Q4-25 Q1-26 Q2-26 Q3-26 Non-Interest Bearing Deposits Total Borrowings Q3 2026 Highlights Net Interest Drivers Dollars in billions Interest Bearing DepositsInterest Bearing Deposits Total Investments HFI Loans HFS Loans 1) Balances are as of each respective period end. 2) Interest income includes a reduction for earnings credits totaling $56.7 million, $52.5 million, $48.7 million, $56.6 million, and $64.9 million for the three months ended September 30, 2026, June 30, 2026, March 31, 2026, December 31, 2025, and September 30, 2025, respectively.
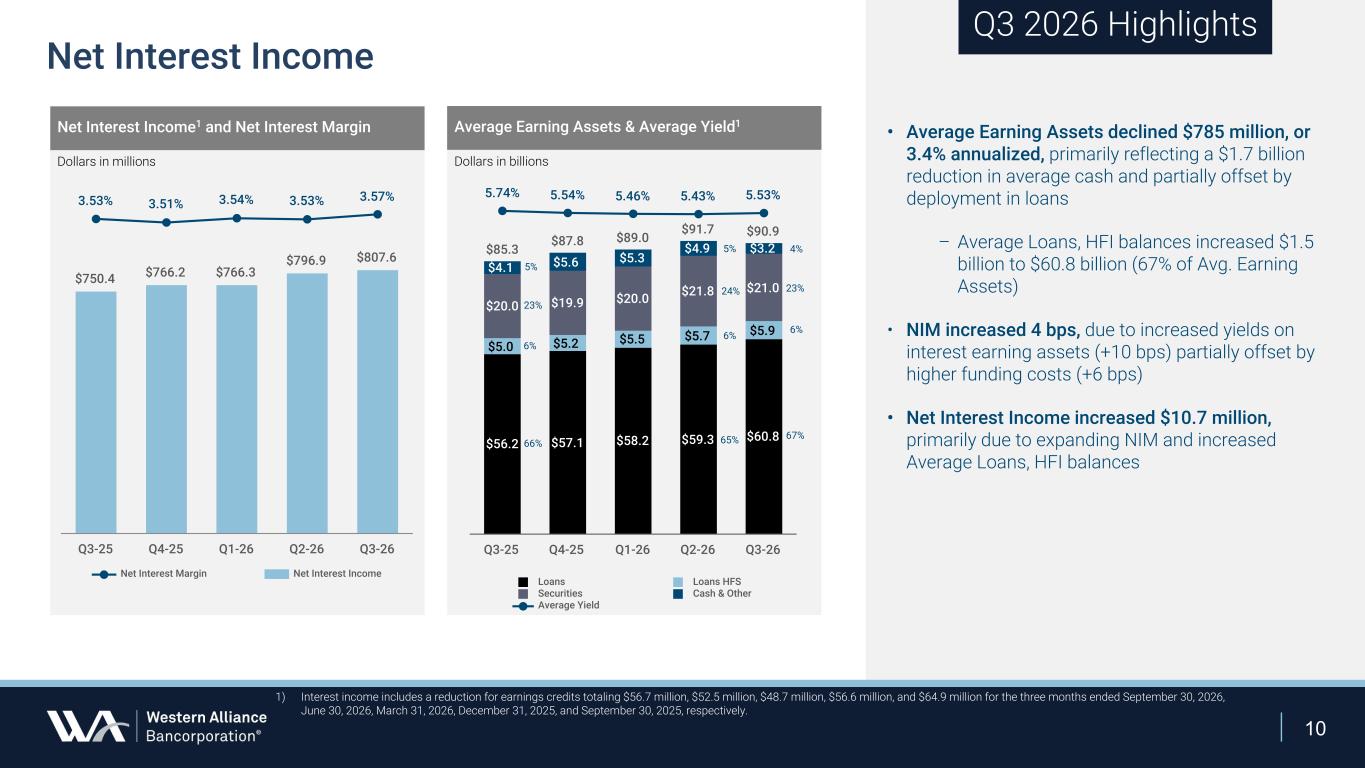
10 Net Interest Income1 and Net Interest Margin $750.4 $766.2 $766.3 $796.9 $807.6 3.53% 3.51% 3.54% 3.53% 3.57% Net Interest Margin Net Interest Income Q3-25 Q4-25 Q1-26 Q2-26 Q3-26 $85.3 $87.8 $89.0 $91.7 $90.9 $56.2 $57.1 $58.2 $59.3 $60.8 $5.0 $5.2 $5.5 $5.7 $5.9 $20.0 $19.9 $20.0 $21.8 $21.0 $4.1 $5.6 $5.3 $4.9 $3.2 5.74% 5.54% 5.46% 5.43% 5.53% Loans Loans HFS Securities Cash & Other Average Yield Q3-25 Q4-25 Q1-26 Q2-26 Q3-26 Average Earning Assets & Average Yield1 Dollars in millions Dollars in billions Net Interest Income Q3 2026 Highlights 5% 23% 6% 5% 24% 6% 4% 23% 6% 66% 65% 67% 1) Interest income includes a reduction for earnings credits totaling $56.7 million, $52.5 million, $48.7 million, $56.6 million, and $64.9 million for the three months ended September 30, 2026, June 30, 2026, March 31, 2026, December 31, 2025, and September 30, 2025, respectively. • Average Earning Assets declined $785 million, or 3.4% annualized, primarily reflecting a $1.7 billion reduction in average cash and partially offset by deployment in loans – Average Loans, HFI balances increased $1.5 billion to $60.8 billion (67% of Avg. Earning Assets) • NIM increased 4 bps, due to increased yields on interest earning assets (+10 bps) partially offset by higher funding costs (+6 bps) • Net Interest Income increased $10.7 million, primarily due to expanding NIM and increased Average Loans, HFI balances
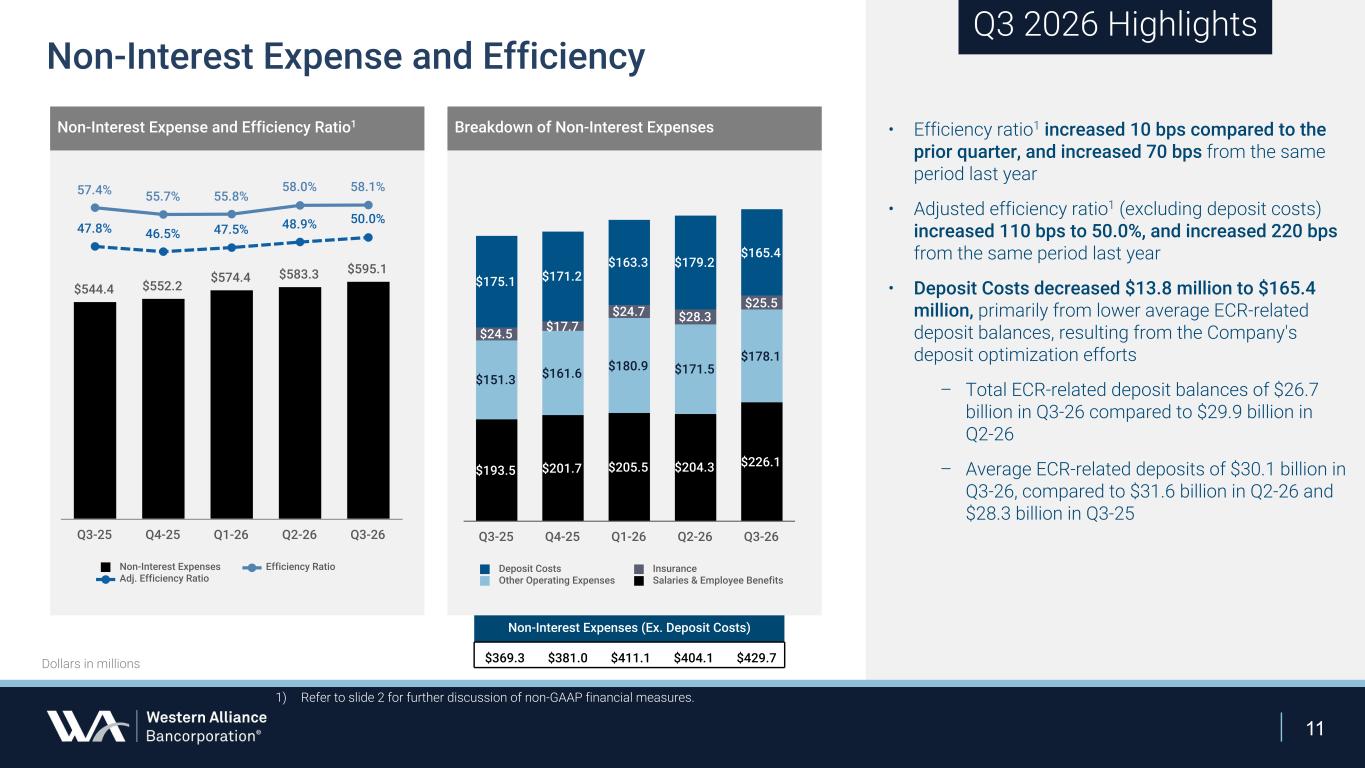
11 $544.4 $552.2 $574.4 $583.3 $595.1 57.4% 55.7% 55.8% 58.0% 58.1% 47.8% 46.5% 47.5% 48.9% 50.0% Non-Interest Expenses Efficiency Ratio Adj. Efficiency Ratio Q3-25 Q4-25 Q1-26 Q2-26 Q3-26 • Efficiency ratio1 increased 10 bps compared to the prior quarter, and increased 70 bps from the same period last year • Adjusted efficiency ratio1 (excluding deposit costs) increased 110 bps to 50.0%, and increased 220 bps from the same period last year • Deposit Costs decreased $13.8 million to $165.4 million, primarily from lower average ECR-related deposit balances, resulting from the Company's deposit optimization efforts – Total ECR-related deposit balances of $26.7 billion in Q3-26 compared to $29.9 billion in Q2-26 – Average ECR-related deposits of $30.1 billion in Q3-26, compared to $31.6 billion in Q2-26 and $28.3 billion in Q3-25 Dollars in millions Non-Interest Expense and Efficiency $193.5 $201.7 $205.5 $204.3 $226.1 $151.3 $161.6 $180.9 $171.5 $178.1 $24.5 $17.7 $24.7 $28.3 $25.5 $175.1 $171.2 $163.3 $179.2 $165.4 Deposit Costs Insurance Other Operating Expenses Salaries & Employee Benefits Q3-25 Q4-25 Q1-26 Q2-26 Q3-26 Q3 2026 Highlights Non-Interest Expense and Efficiency Ratio1 1) Refer to slide 2 for further discussion of non-GAAP financial measures. Breakdown of Non-Interest Expenses Non-Interest Expenses (Ex. Deposit Costs) $369.3 $381.0 $411.1 $404.1 $429.7
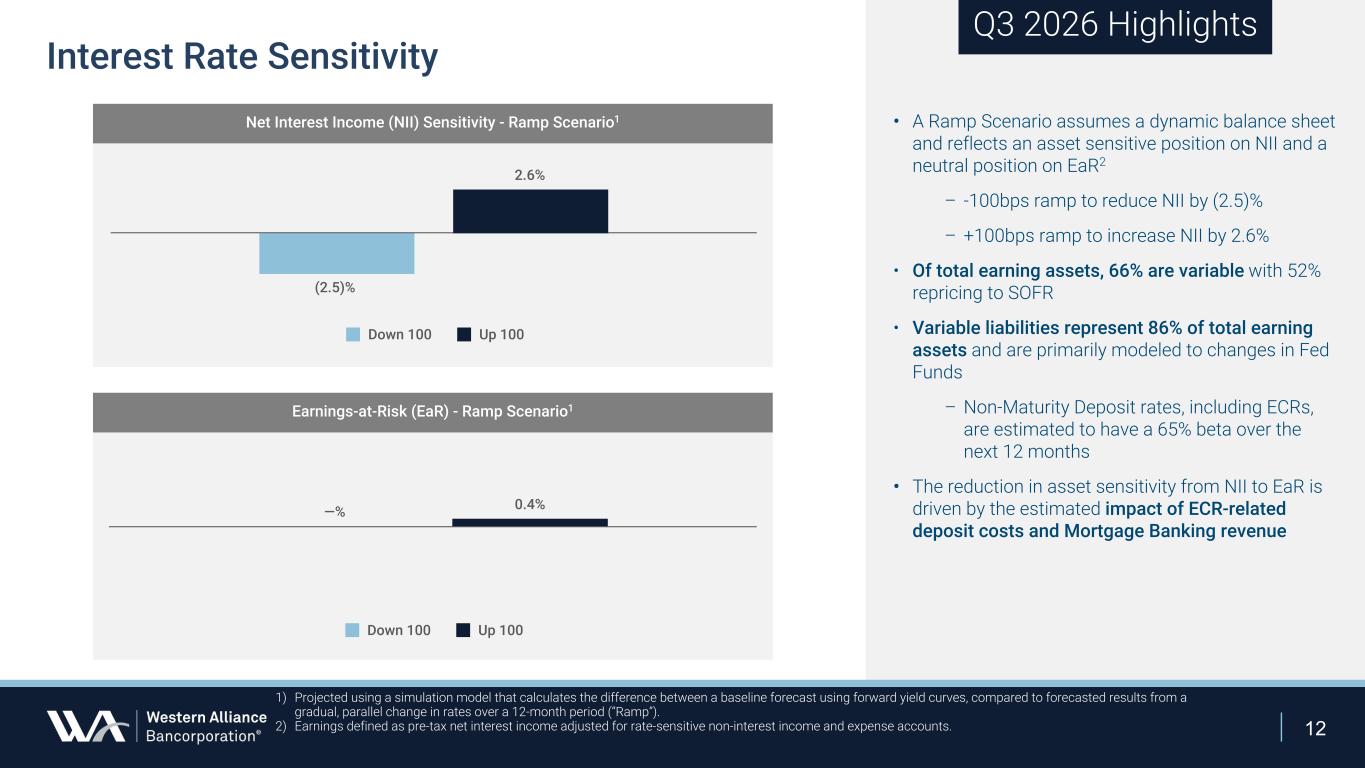
12 Interest Rate Sensitivity Q3 2026 Highlights • A Ramp Scenario assumes a dynamic balance sheet and reflects an asset sensitive position on NII and a neutral position on EaR2 – -100bps ramp to reduce NII by (2.5)% – +100bps ramp to increase NII by 2.6% • Of total earning assets, 66% are variable with 52% repricing to SOFR • Variable liabilities represent 86% of total earning assets and are primarily modeled to changes in Fed Funds – Non-Maturity Deposit rates, including ECRs, are estimated to have a 65% beta over the next 12 months • The reduction in asset sensitivity from NII to EaR is driven by the estimated impact of ECR-related deposit costs and Mortgage Banking revenue (2.5)% 2.6% Down 100 Up 100 —% 0.4% Down 100 Up 100 1) Projected using a simulation model that calculates the difference between a baseline forecast using forward yield curves, compared to forecasted results from a gradual, parallel change in rates over a 12-month period (“Ramp”). 2) Earnings defined as pre-tax net interest income adjusted for rate-sensitive non-interest income and expense accounts. Net Interest Income (NII) Sensitivity - Ramp Scenario1 Earnings-at-Risk (EaR) - Ramp Scenario1
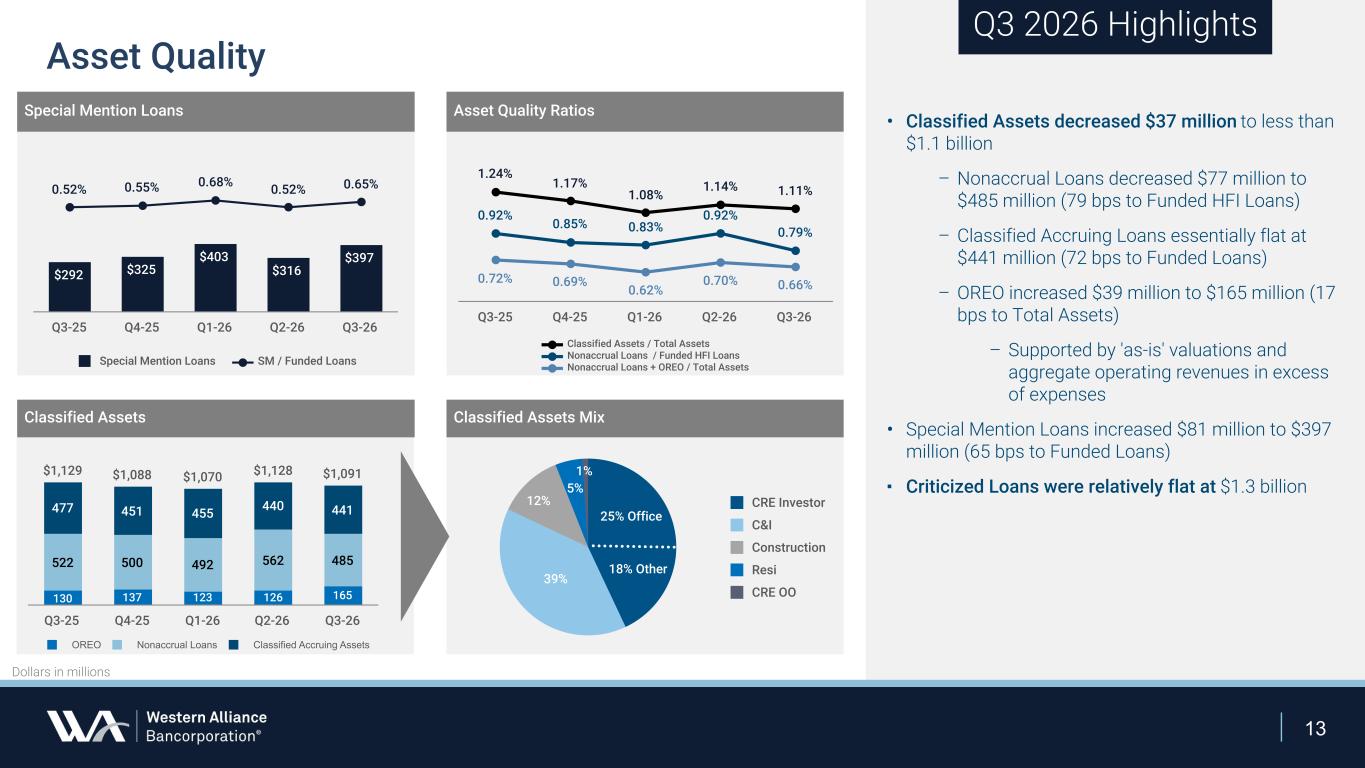
13 1.24% 1.17% 1.08% 1.14% 1.11% 0.92% 0.85% 0.83% 0.92% 0.79% 0.72% 0.69% 0.62% 0.70% 0.66% Classified Assets / Total Assets Nonaccrual Loans / Funded HFI Loans Nonaccrual Loans + OREO / Total Assets Q3-25 Q4-25 Q1-26 Q2-26 Q3-26 $1,129 $1,088 $1,070 $1,128 $1,091 130 137 123 126 165 522 500 492 562 485 477 451 455 440 441 OREO Nonaccrual Loans Classified Accruing Assets Q3-25 Q4-25 Q1-26 Q2-26 Q3-26 Dollars in millions Asset Quality RatiosSpecial Mention Loans • Classified Assets decreased $37 million to less than $1.1 billion – Nonaccrual Loans decreased $77 million to $485 million (79 bps to Funded HFI Loans) – Classified Accruing Loans essentially flat at $441 million (72 bps to Funded Loans) – OREO increased $39 million to $165 million (17 bps to Total Assets) – Supported by 'as-is' valuations and aggregate operating revenues in excess of expenses • Special Mention Loans increased $81 million to $397 million (65 bps to Funded Loans) ▪ Criticized Loans were relatively flat at $1.3 billion Classified Assets $292 $325 $403 $316 $397 0.52% 0.55% 0.68% 0.52% 0.65% Special Mention Loans SM / Funded Loans Q3-25 Q4-25 Q1-26 Q2-26 Q3-26 Q3 2026 Highlights Classified Assets Mix 39% 12% 5% 1% CRE Investor C&I Construction Resi CRE OO 18% Other 25% Office Asset Quality
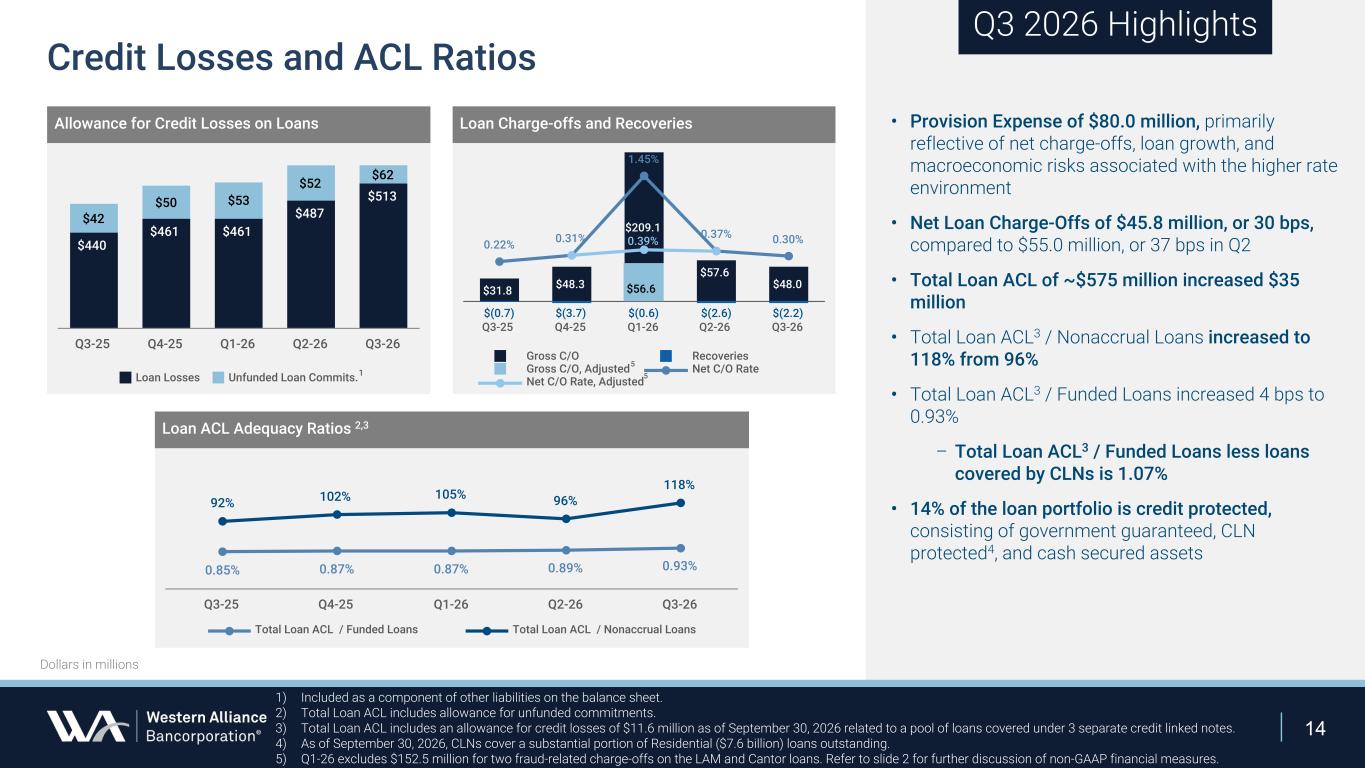
14 $31.8 $48.3 $209.1 $57.6 $48.0 $(0.7) $(3.7) $(0.6) $(2.6) $(2.2) 0.22% 0.31% 1.45% 0.37% 0.30% Gross C/O Recoveries Gross C/O, Adjusted Net C/O Rate Net C/O Rate, Adjusted Q3-25 Q4-25 Q1-26 Q2-26 Q3-26 $440 $461 $461 $487 $513 $42 $50 $53 $52 $62 Loan Losses Unfunded Loan Commits. Q3-25 Q4-25 Q1-26 Q2-26 Q3-26 0.85% 0.87% 0.87% 0.89% 0.93% 92% 102% 105% 96% 118% Total Loan ACL / Funded Loans Total Loan ACL / Nonaccrual Loans Q3-25 Q4-25 Q1-26 Q2-26 Q3-26 Dollars in millions • Provision Expense of $80.0 million, primarily reflective of net charge-offs, loan growth, and macroeconomic risks associated with the higher rate environment • Net Loan Charge-Offs of $45.8 million, or 30 bps, compared to $55.0 million, or 37 bps in Q2 • Total Loan ACL of ~$575 million increased $35 million • Total Loan ACL3 / Nonaccrual Loans increased to 118% from 96% • Total Loan ACL3 / Funded Loans increased 4 bps to 0.93% – Total Loan ACL3 / Funded Loans less loans covered by CLNs is 1.07% • 14% of the loan portfolio is credit protected, consisting of government guaranteed, CLN protected4, and cash secured assets Credit Losses and ACL Ratios Q3 2026 Highlights Loan Charge-offs and RecoveriesAllowance for Credit Losses on Loans Loan ACL Adequacy Ratios 2,3 1) Included as a component of other liabilities on the balance sheet. 2) Total Loan ACL includes allowance for unfunded commitments. 3) Total Loan ACL includes an allowance for credit losses of $11.6 million as of September 30, 2026 related to a pool of loans covered under 3 separate credit linked notes. 4) As of September 30, 2026, CLNs cover a substantial portion of Residential ($7.6 billion) loans outstanding. 5) Q1-26 excludes $152.5 million for two fraud-related charge-offs on the LAM and Cantor loans. Refer to slide 2 for further discussion of non-GAAP financial measures. 1 $56.6 0.39% 5 5
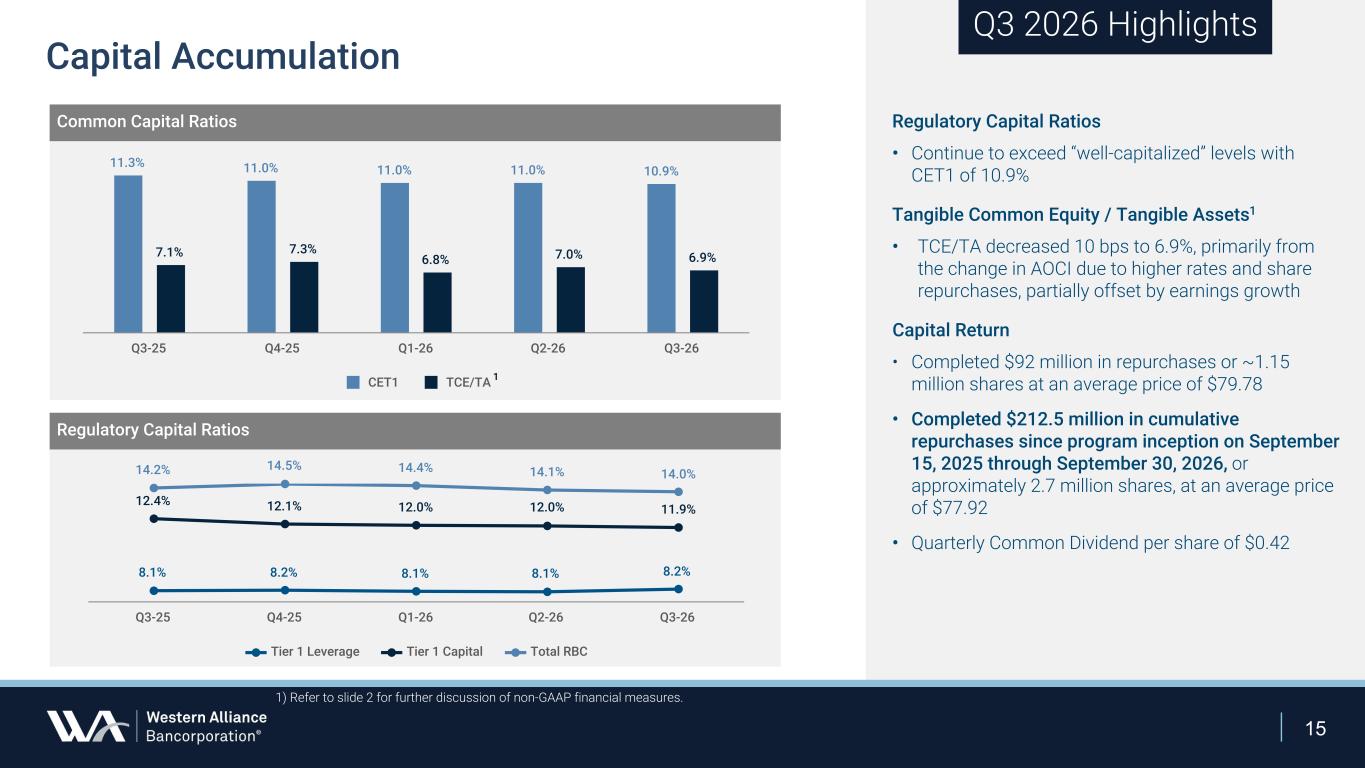
15 Regulatory Capital Ratios • Continue to exceed “well-capitalized” levels with CET1 of 10.9% Tangible Common Equity / Tangible Assets1 • TCE/TA decreased 10 bps to 6.9%, primarily from the change in AOCI due to higher rates and share repurchases, partially offset by earnings growth Capital Return • Completed $92 million in repurchases or ~1.15 million shares at an average price of $79.78 • Completed $212.5 million in cumulative repurchases since program inception on September 15, 2025 through September 30, 2026, or approximately 2.7 million shares, at an average price of $77.92 • Quarterly Common Dividend per share of $0.42 11.3% 11.0% 11.0% 11.0% 10.9% 7.1% 7.3% 6.8% 7.0% 6.9% CET1 TCE/TA Q3-25 Q4-25 Q1-26 Q2-26 Q3-26 1) Refer to slide 2 for further discussion of non-GAAP financial measures. 14.2% 14.5% 14.4% 14.1% 14.0% 12.4% 12.1% 12.0% 12.0% 11.9% 8.1% 8.2% 8.1% 8.1% 8.2% Tier 1 Leverage Tier 1 Capital Total RBC Q3-25 Q4-25 Q1-26 Q2-26 Q3-26 Q3 2026 Highlights Common Capital Ratios Capital Accumulation Regulatory Capital Ratios 1
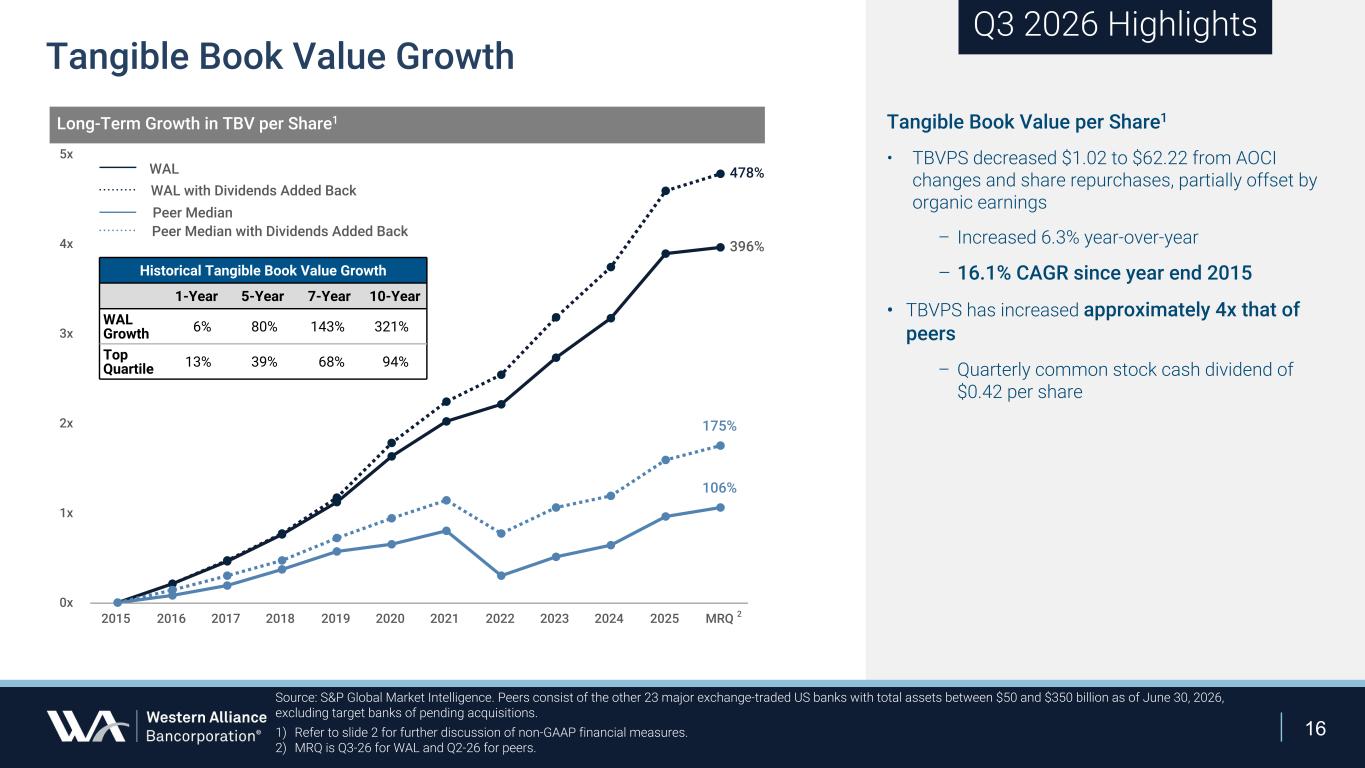
16 396% 478% 106% 175% 2015 2016 2017 2018 2019 2020 2021 2022 2023 2024 2025 MRQ 0x 1x 2x 3x 4x 5x Tangible Book Value per Share1 • TBVPS decreased $1.02 to $62.22 from AOCI changes and share repurchases, partially offset by organic earnings – Increased 6.3% year-over-year – 16.1% CAGR since year end 2015 • TBVPS has increased approximately 4x that of peers – Quarterly common stock cash dividend of $0.42 per share Source: S&P Global Market Intelligence. Peers consist of the other 23 major exchange-traded US banks with total assets between $50 and $350 billion as of June 30, 2026, excluding target banks of pending acquisitions. 1) Refer to slide 2 for further discussion of non-GAAP financial measures. 2) MRQ is Q3-26 for WAL and Q2-26 for peers. Q3 2026 Highlights Tangible Book Value Growth Long-Term Growth in TBV per Share1 2 WAL Peer Median with Dividends Added Back Peer Median WAL with Dividends Added Back Historical Tangible Book Value Growth 1-Year 5-Year 7-Year 10-Year WAL Growth 6 % 80 % 143 % 321 % Top Quartile 13 % 39 % 68 % 94 %

17 • Strong YTD performance supported by steady growth in commercial banking service charges • Core NCO guidance (ex-fraud) tracking to upper half of range Balance Sheet Growth Capital (CET1) Net Interest Income Non-interest Income Non-interest Expense Net Charge-Offs Effective Tax Rate 2025 Baseline Prior 2026 Outlook Loans (HFI): $58.7 bn Deposits: $77.2 bn L (HFI): Up $5.0 bn D: Up $6.0 bn 11.0% ~ 11% $2.86 bn Up 12% - 14% $678 mm Up 13% - 17% $2.11 bn 24 bps Up 7% - 11% 25 - 35 bps 18% ~ 19% NIE (Ex. Deposit Costs) Deposit Costs $1,600 - $1,650 mm $650 - $700 mm $1,481 mm $631 mm Management Outlook Commentary • Capital target remains comfortably above well-capitalized thresholds even including AOCI position Assumes (1) 25 bp rate hike in Sept. • Reflects outperformance on deposit optimization and related impact on AEA • Q4: Flat to slightly up from Q3 Revised 2026 Outlook L (HFI): Up $4.0 bn D: Up $3.5 bn - $4.0 bn ~ 11% Up 11% - 12% Up 18% - 21% Up 7% - 10% 25 - 35 bps ~ 19% $1,600 - $1,650 mm $650 - $675 mm Assumes (1) more 25 bp rate hike in Dec. • Deposit range subject to ongoing optimization strategy & mix shift into Commercial Banking Deposits • NIE (ex. Deposit Costs) tracking to upper end of range • Deposit optimization effectively reducing ECR Deposit Costs and helping to offset rate hike

Questions & Answers

Appendix
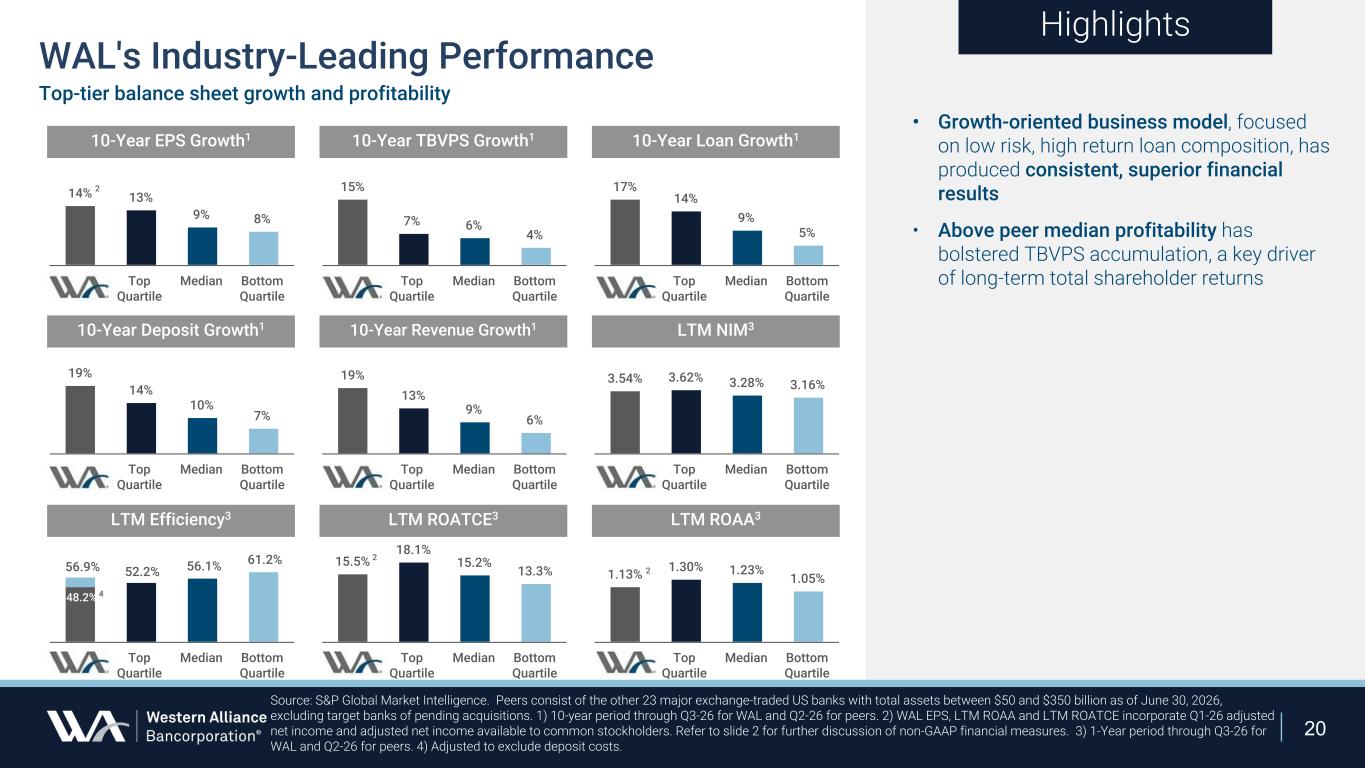
20 10-Year Revenue Growth1 • Growth-oriented business model, focused on low risk, high return loan composition, has produced consistent, superior financial results • Above peer median profitability has bolstered TBVPS accumulation, a key driver of long-term total shareholder returns Highlights Source: S&P Global Market Intelligence. Peers consist of the other 23 major exchange-traded US banks with total assets between $50 and $350 billion as of June 30, 2026, excluding target banks of pending acquisitions. 1) 10-year period through Q3-26 for WAL and Q2-26 for peers. 2) WAL EPS, LTM ROAA and LTM ROATCE incorporate Q1-26 adjusted net income and adjusted net income available to common stockholders. Refer to slide 2 for further discussion of non-GAAP financial measures. 3) 1-Year period through Q3-26 for WAL and Q2-26 for peers. 4) Adjusted to exclude deposit costs. WAL's Industry-Leading Performance Top-tier balance sheet growth and profitability 14% 13% 9% 8% WAL Top Quartile Median Bottom Quartile 15% 7% 6% 4% WAL Top Quartile Median Bottom Quartile 17% 14% 9% 5% WAL Top Quartile Median Bottom Quartile 19% 14% 10% 7% WAL Top Quartile Median Bottom Quartile 19% 13% 9% 6% WAL Top Quartile Median Bottom Quartile 15.5% 18.1% 15.2% 13.3% WAL Top Quartile Median Bottom Quartile WAL Top Quartile Median Bottom Quartile 3.54% 3.62% 3.28% 3.16% WAL Top Quartile Median Bottom Quartile 10-Year Loan Growth1 10-Year Deposit Growth1 LTM NIM3 LTM Efficiency3 LTM ROATCE3 1.13% 1.30% 1.23% 1.05% WAL Top Quartile Median Bottom Quartile 52.2% 56.1% 61.2%56.9% 48.2% 4 2 2 2 10-Year EPS Growth1 10-Year TBVPS Growth1 LTM ROAA3
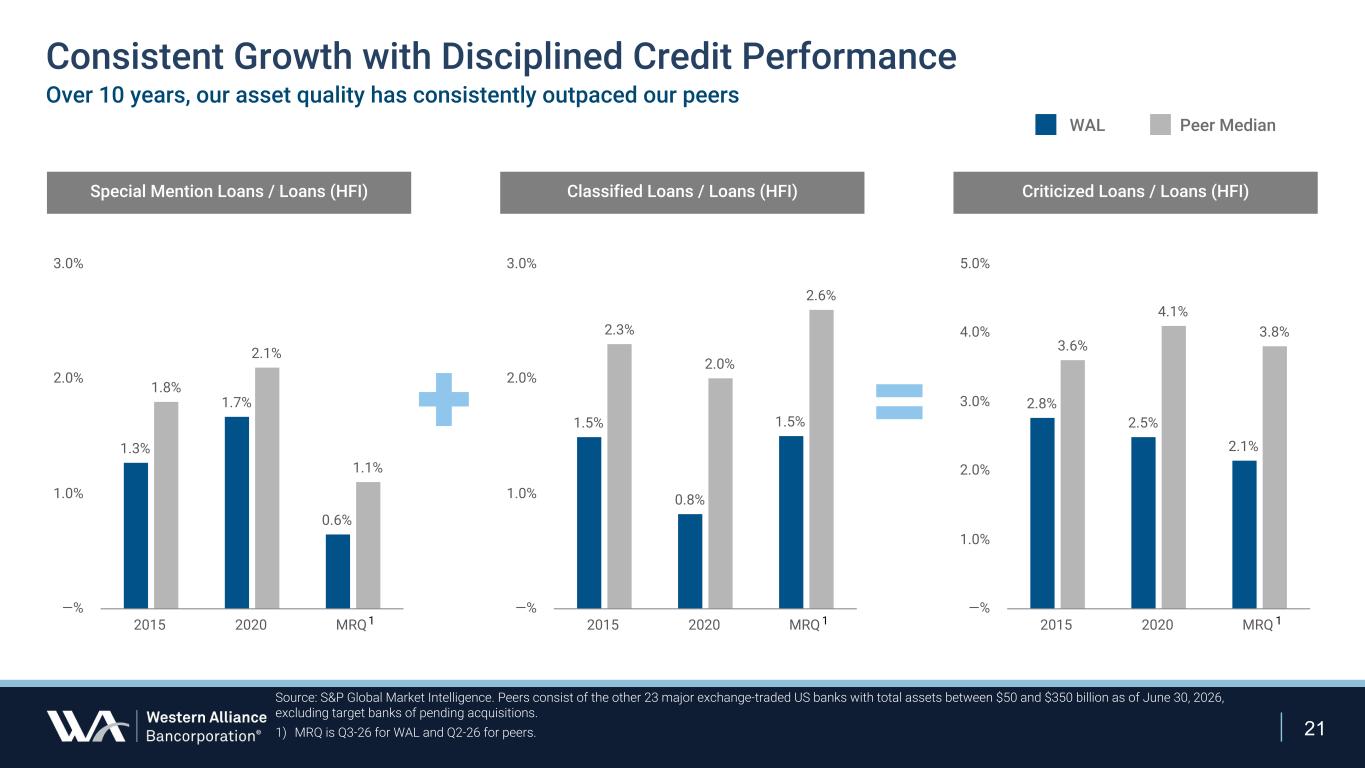
21 Consistent Growth with Disciplined Credit Performance Over 10 years, our asset quality has consistently outpaced our peers 1.3% 1.7% 0.6% 1.8% 2.1% 1.1% 2015 2020 MRQ —% 1.0% 2.0% 3.0% 1.5% 0.8% 1.5% 2.3% 2.0% 2.6% 2015 2020 MRQ —% 1.0% 2.0% 3.0% 2.8% 2.5% 2.1% 3.6% 4.1% 3.8% 2015 2020 MRQ —% 1.0% 2.0% 3.0% 4.0% 5.0% + = Special Mention Loans / Loans (HFI) Classified Loans / Loans (HFI) Criticized Loans / Loans (HFI) Source: S&P Global Market Intelligence. Peers consist of the other 23 major exchange-traded US banks with total assets between $50 and $350 billion as of June 30, 2026, excluding target banks of pending acquisitions. 1) MRQ is Q3-26 for WAL and Q2-26 for peers. 1 1 1 WAL Peer Median
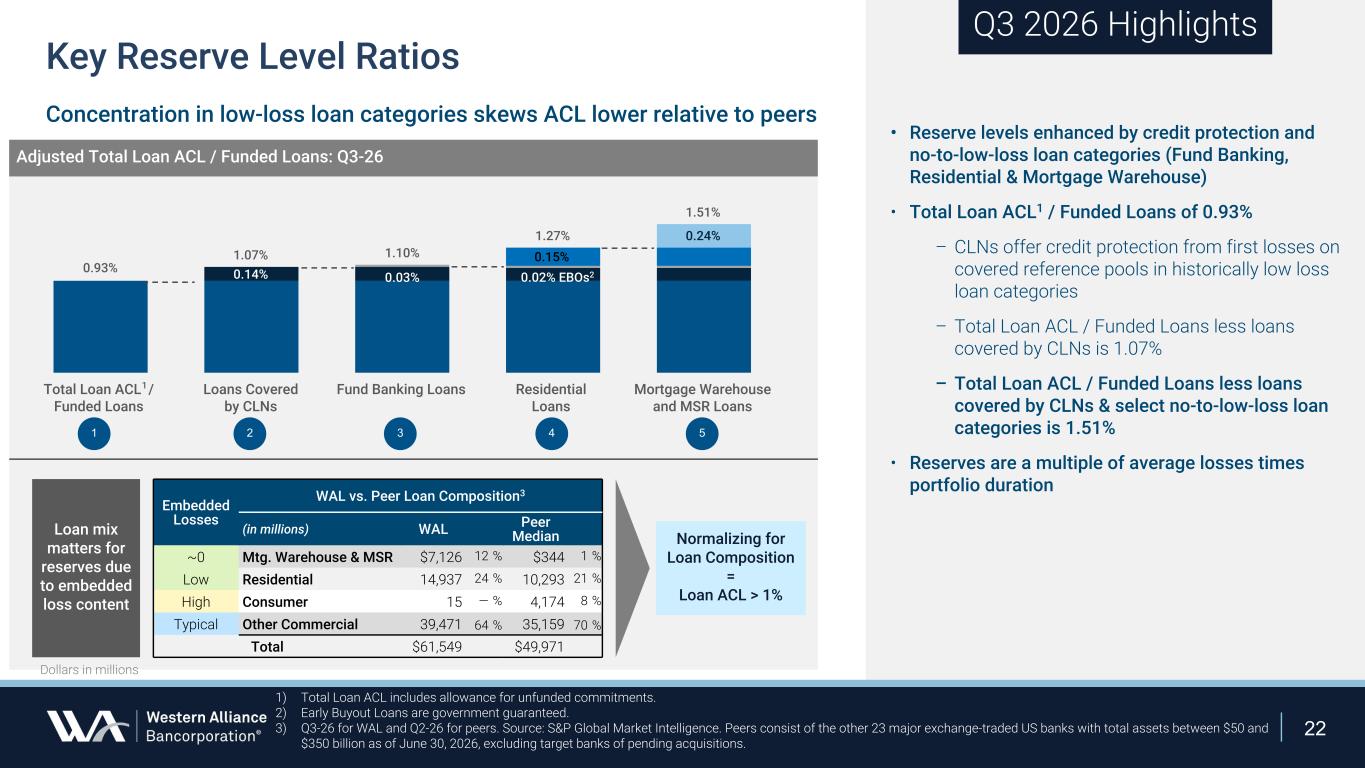
22 • Reserve levels enhanced by credit protection and no-to-low-loss loan categories (Fund Banking, Residential & Mortgage Warehouse) • Total Loan ACL1 / Funded Loans of 0.93% – CLNs offer credit protection from first losses on covered reference pools in historically low loss loan categories – Total Loan ACL / Funded Loans less loans covered by CLNs is 1.07% – Total Loan ACL / Funded Loans less loans covered by CLNs & select no-to-low-loss loan categories is 1.51% • Reserves are a multiple of average losses times portfolio duration Q3 2026 Highlights Adjusted Total Loan ACL / Funded Loans: Q3-26 1) Total Loan ACL includes allowance for unfunded commitments. 2) Early Buyout Loans are government guaranteed. 3) Q3-26 for WAL and Q2-26 for peers. Source: S&P Global Market Intelligence. Peers consist of the other 23 major exchange-traded US banks with total assets between $50 and $350 billion as of June 30, 2026, excluding target banks of pending acquisitions. Key Reserve Level Ratios Concentration in low-loss loan categories skews ACL lower relative to peers 0.93% 1.07% 1.10% 1.27% 1.51% 0.14% 0.03% 0.24% Total Loan ACL / Funded Loans Loans Covered by CLNs Fund Banking Loans Residential Loans Mortgage Warehouse and MSR Loans 1 2 3 4 5 0.15% 1 Embedded Losses WAL vs. Peer Loan Composition3 (in millions) WAL Peer Median ~0 Mtg. Warehouse & MSR $7,126 12 % $344 1 % Low Residential 14,937 24 % 10,293 21 % High Consumer 15 — % 4,174 8 % Typical Other Commercial 39,471 64 % 35,159 70 % Total $61,549 $49,971 Loan mix matters for reserves due to embedded loss content Normalizing for Loan Composition = Loan ACL > 1% Dollars in millions 0.02% EBOs2

23 Non-Depository Financial Institution (NDFI) Loans NDFI loan mix adjusted for low-loss Mortgage Credit Intermediaries aligns with peer average 1 Source: S&P Global Market Intelligence (peer data). Western Alliance data are preliminary as of September 30, 2026. Peer data as of June 30, 2026. Peers consist of US-based commercial banks with assets >$50 billion, as of June 30, 2026 using primary bank subsidiary Call Report data. 1) Total loans includes Loans HFI, Loans HFS, and Loans eligible for repurchase held in domestic offices of reporting banks. Western Alliance total loan data is based on Loans HFI and Loans HFS as of September 30, 2026 % Total Loans1 Commercial Banks Mtg Credit Bus. Credit Private Equity Cons. Credit Other NDFI (>$50 bn Assets) Ticker Intermediaries Intermediaries Funds Intermediaries NDFIs Ex-Mtg Credit Ex-Mtg Credit & PE KeyCorp KEY 1% 8% 1% 0% 9% 18% 17% The PNC Financial Services Group, Inc. PNC 1% 9% 7% 0% 3% 20% 13% Wells Fargo & Co. WFC 4% 7% 5% 2% 3% 17% 12% Regions Financial Corp. RF 0% 5% 2% 1% 5% 13% 11% Bank of America Corp. BAC 2% 2% 3% 1% 6% 13% 9% Truist Financial Corp. TFC 1% 7% 2% 1% 2% 11% 9% Citigroup, Inc. C 6% 6% 2% 3% 1% 11% 9% Pinnacle Financial Partners, Inc. PNFP 1% 5% 1% 1% 3% 9% 8% Citizens Financial Group, Inc. CFG 0% 4% 7% 1% 3% 15% 8% U.S. Bancorp USB 2% 3% 3% 2% 1% 10% 7% East West Bancorp, Inc. EWBC 3% 4% 3% 2% 1% 9% 7% JPMorgan Chase & Co. JPM 4% 3% 4% 2% 1% 10% 6% Western Alliance Bancorporation WAL 16% 5% 2% 0% 0% 8% 5% Huntington Bancshares, Inc. HBAN 2% 2% 2% 0% 3% 8% 5% First Horizon Corp. FHN 8% 1% 0% 3% 1% 5% 5% UMB Financial Corp. UMBF 0% 1% 2% 0% 3% 7% 5% First Citizens BancShares, Inc. FCNC.A 0% 2% 23% 0% 2% 27% 4% Fifth Third Bancorp FITB 2% 2% 2% 1% 1% 6% 4% Cullen/Frost Bankers, Inc. CFR 0% 1% 1% 0% 1% 4% 3% Zions Bancorporation, N.A. ZION 1% 2% 0% 0% 1% 3% 3% M&T Bank Corp. MTB 5% 1% 2% 0% 1% 5% 3% Flagstar Bank, N.A. FLG 2% 0% 1% 1% 1% 4% 2% Wintrust Financial Corp. WTFC 3% 1% 1% 0% 1% 3% 2% Associated Banc-Corp ASB 6% 1% 0% 0% 1% 2% 2% F.N.B. Corp. FNB 0% 0% 0% 0% 1% 1% 1% Popular Inc. BPOP 0% 0% 0% 0% 1% 1% 1% Valley National Bancorp VLY 1% 1% 2% 0% 0% 3% 1% Old National Bancorp ONB 0% 0% 0% 1% 0% 1% 1% BOK Financial Corp. BOKF 2% 0% 1% 0% 1% 2% 1% SouthState Bank Corp. SSB 0% 0% 1% 0% 0% 1% 1% Columbia Banking System, Inc. COLB 1% 0% 0% 0% 0% 1% 1% PEER MEDIAN 1% 2% 2% 0% 1% 6% 4% PEER AVERAGE 2% 3% 3% 1% 2% 8% 5%
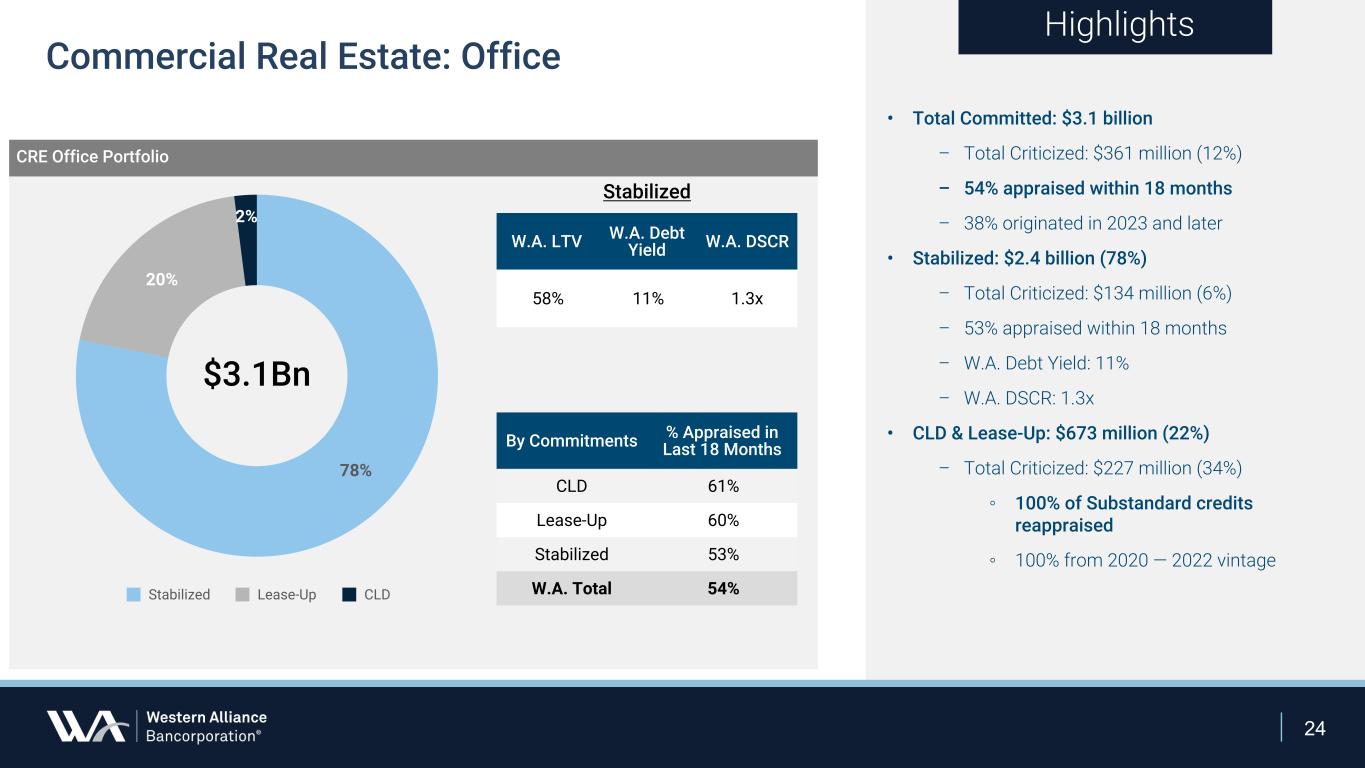
24 Commercial Real Estate: Office 78% 20% 2% Stabilized Lease-Up CLD Stabilized W.A. LTV W.A. Debt Yield W.A. DSCR 58% 11% 1.3x By Commitments % Appraised in Last 18 Months CLD 61% Lease-Up 60% Stabilized 53% W.A. Total 54% Highlights • Total Committed: $3.1 billion – Total Criticized: $361 million (12%) – 54% appraised within 18 months – 38% originated in 2023 and later • Stabilized: $2.4 billion (78%) – Total Criticized: $134 million (6%) – 53% appraised within 18 months – W.A. Debt Yield: 11% – W.A. DSCR: 1.3x • CLD & Lease-Up: $673 million (22%) – Total Criticized: $227 million (34%) ◦ 100% of Substandard credits reappraised ◦ 100% from 2020 — 2022 vintage $3.1Bn CRE Office Portfolio