

Options was the most-requested thing we didn't have. It showed up in feature requests, and it showed up constantly inside ALVIS conversations: implied volatility, open interest, 0DTE, how a spread would behave. All of it against data we couldn't see. So we went and got it.
It's live now for every US stock with listed options, in all three places you use us, on the free plan and on Pro alike.
For agents and scripts
The MCP server gets three tools, GetOptionExpirations, GetOptionChain and GetOptionContract, documented here. ALVIS can reach all three. It's worth pointing it at the questions the grid doesn't answer, like where the open interest suggests the market expects a stock to pin, rather than asking it to read out a table you can open yourself.
If you haven't connected the MCP server yet, here's how — ChatGPT, Claude, Cursor and anything else that speaks MCP. It takes a URL and an API key, and it's on the free plan too.
The REST API gets the matching endpoints, under the stock you already query — documented here.
On the stock pages
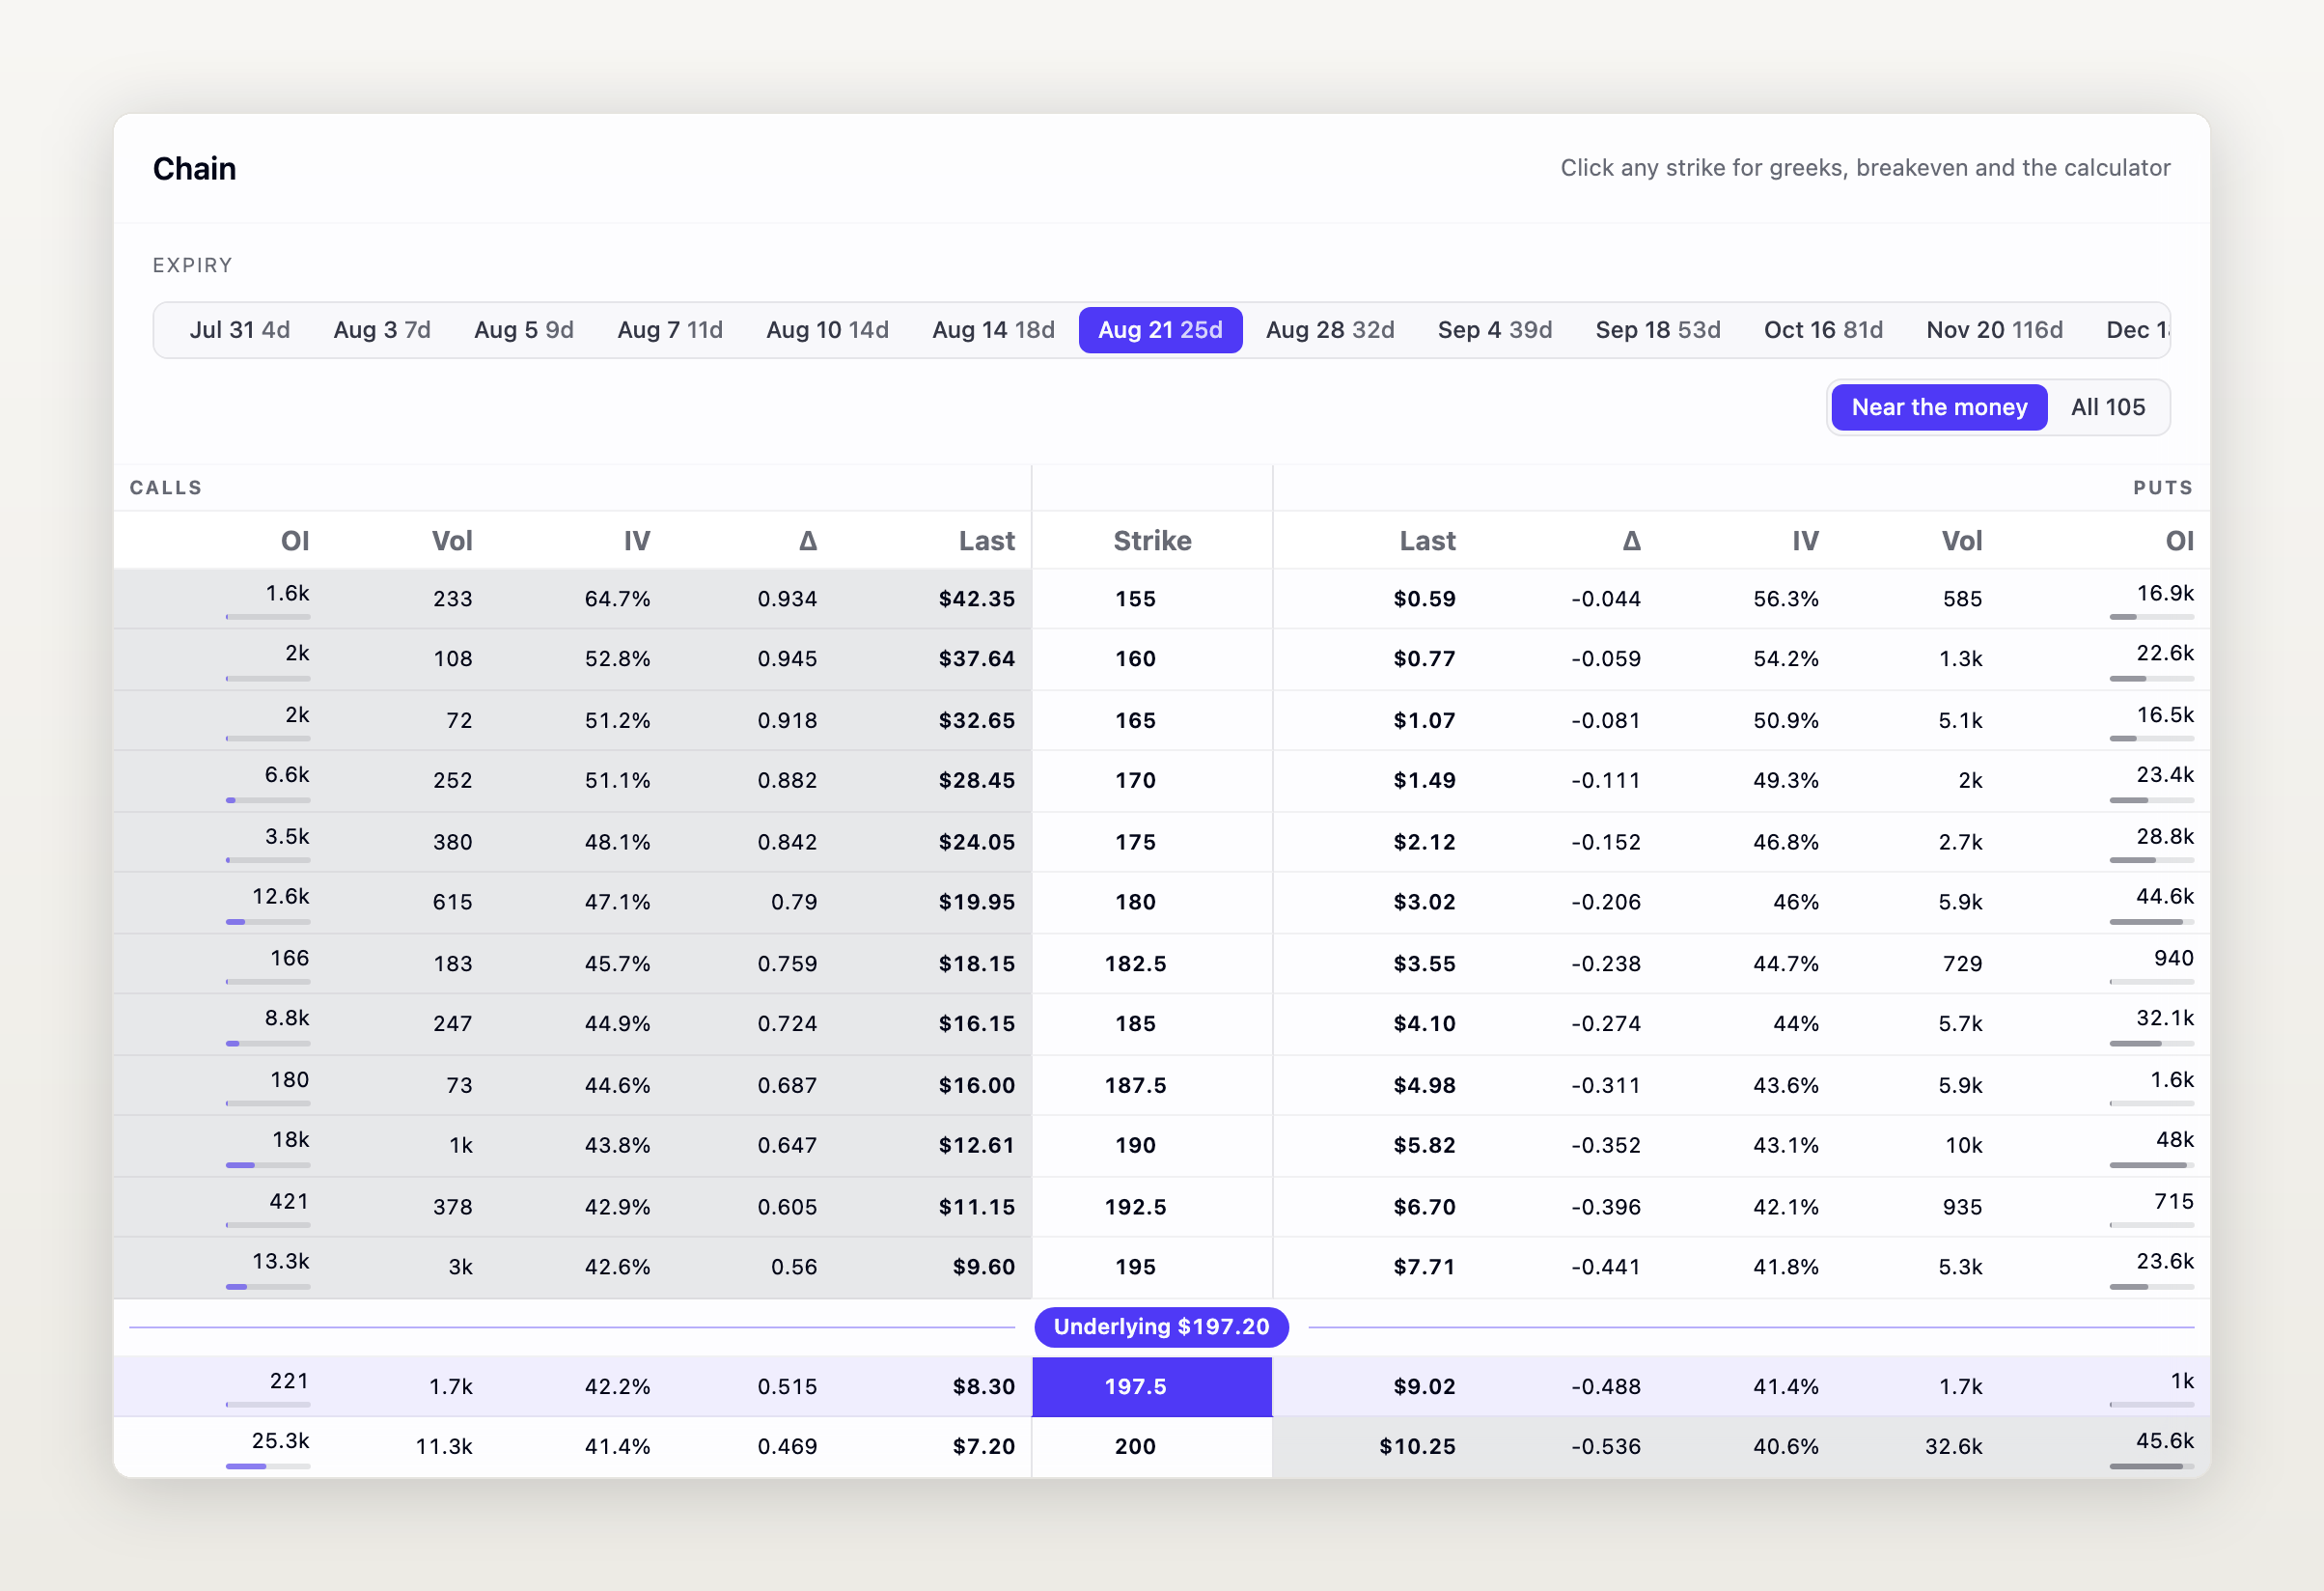
Every stock with listed options has an Options Chain tab. Calls on the left, puts on the right, strikes down the middle, and the columns you'd expect: last price, implied volatility, delta, volume, open interest. Click any strike for its greeks, breakeven and moneyness.
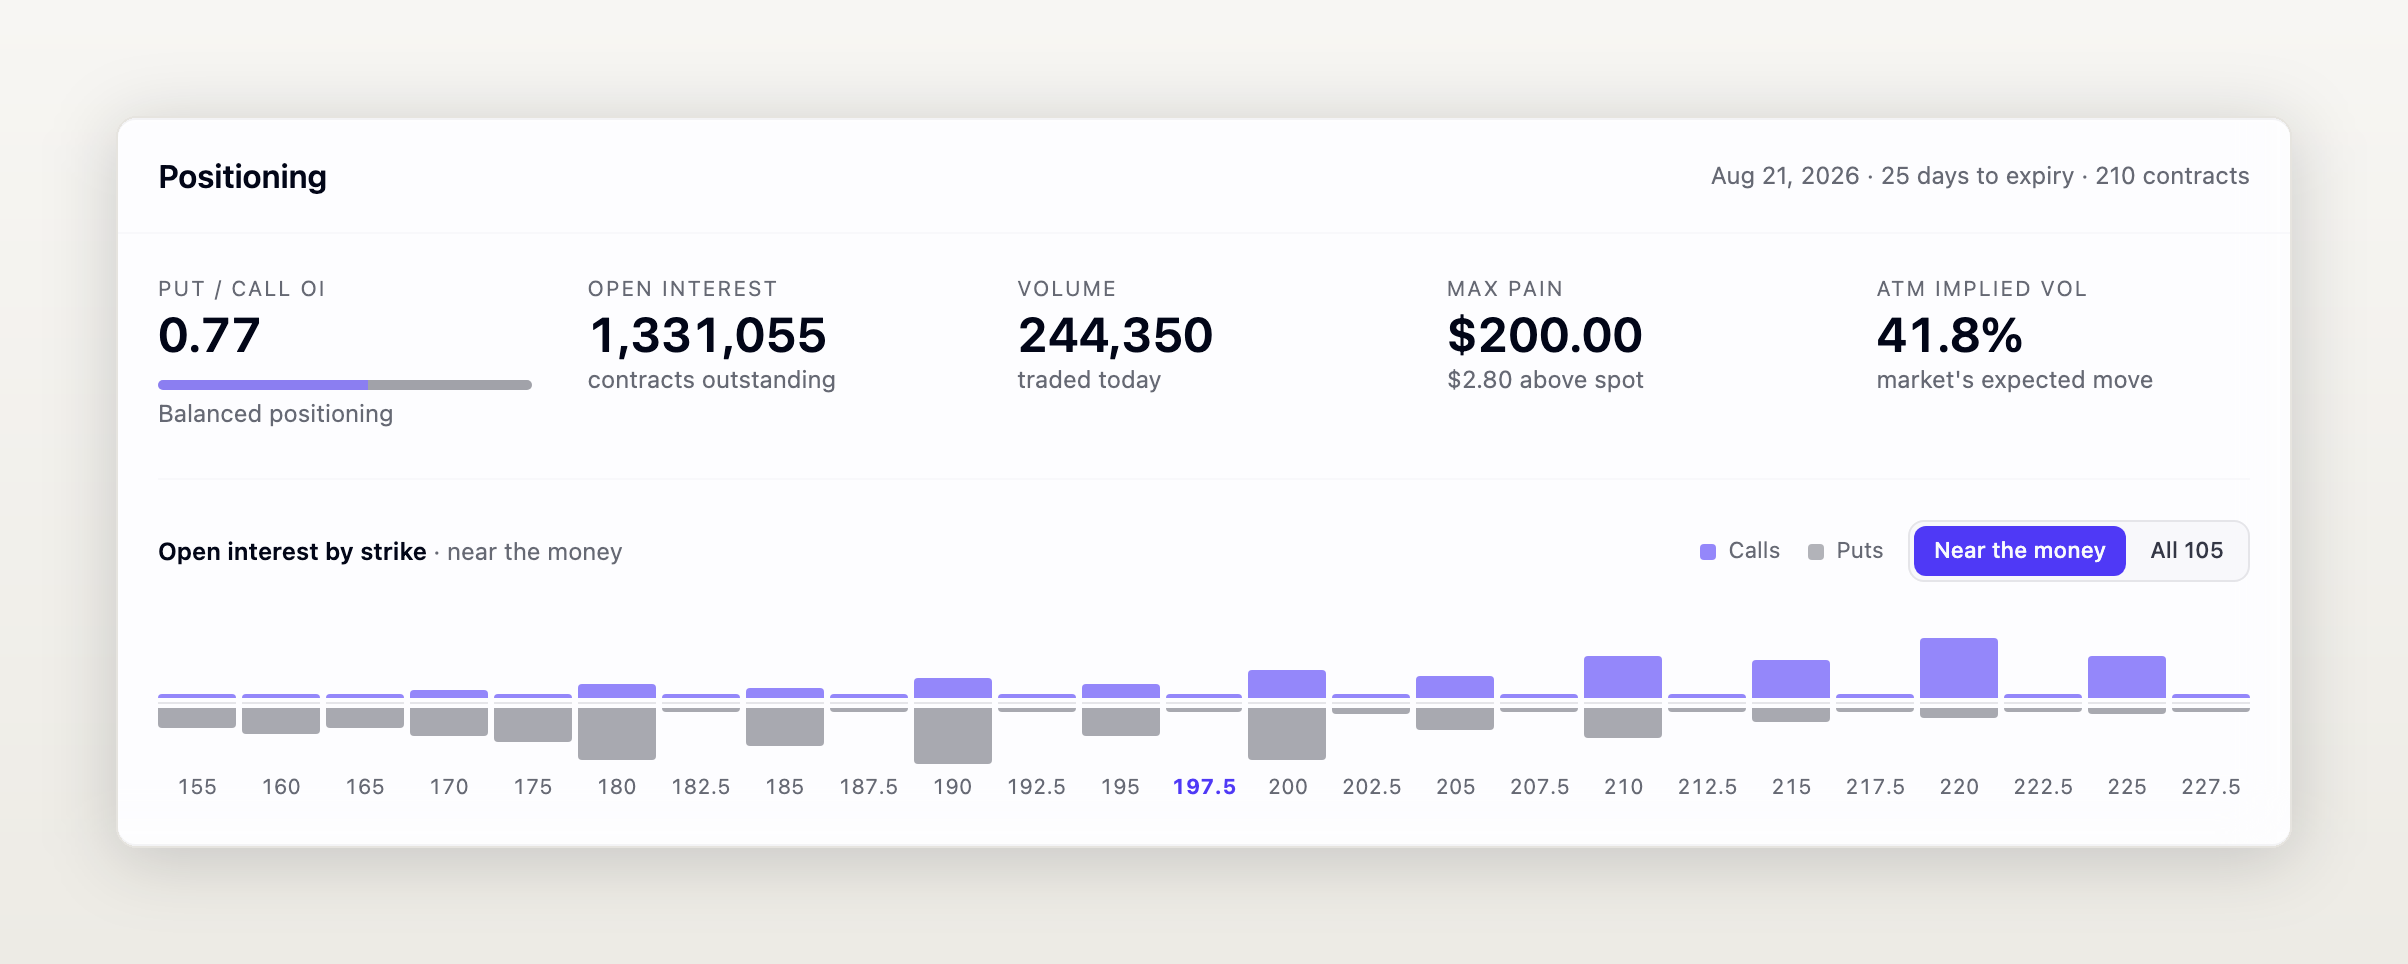
Above the grid we put the numbers you'd otherwise work out yourself. Put/call open interest ratio, total open interest and volume, max pain, at-the-money implied vol, and open interest by strike so you can see where the positioning actually sits.
Liquid names carry a lot of strikes. NVDA lists 62 on some expirations, which is unreadable as a wall, so the grid opens on the 25 around the money and keeps the wings behind a toggle.
The calculator next door
The Options Calculator tab holds two tools. One is a Black-Scholes ladder that prices a contract across spot and time. It seeds its volatility from the chain's real at-the-money IV instead of a default, which matters more than it sounds, because the output is only ever as good as the vol you feed it.
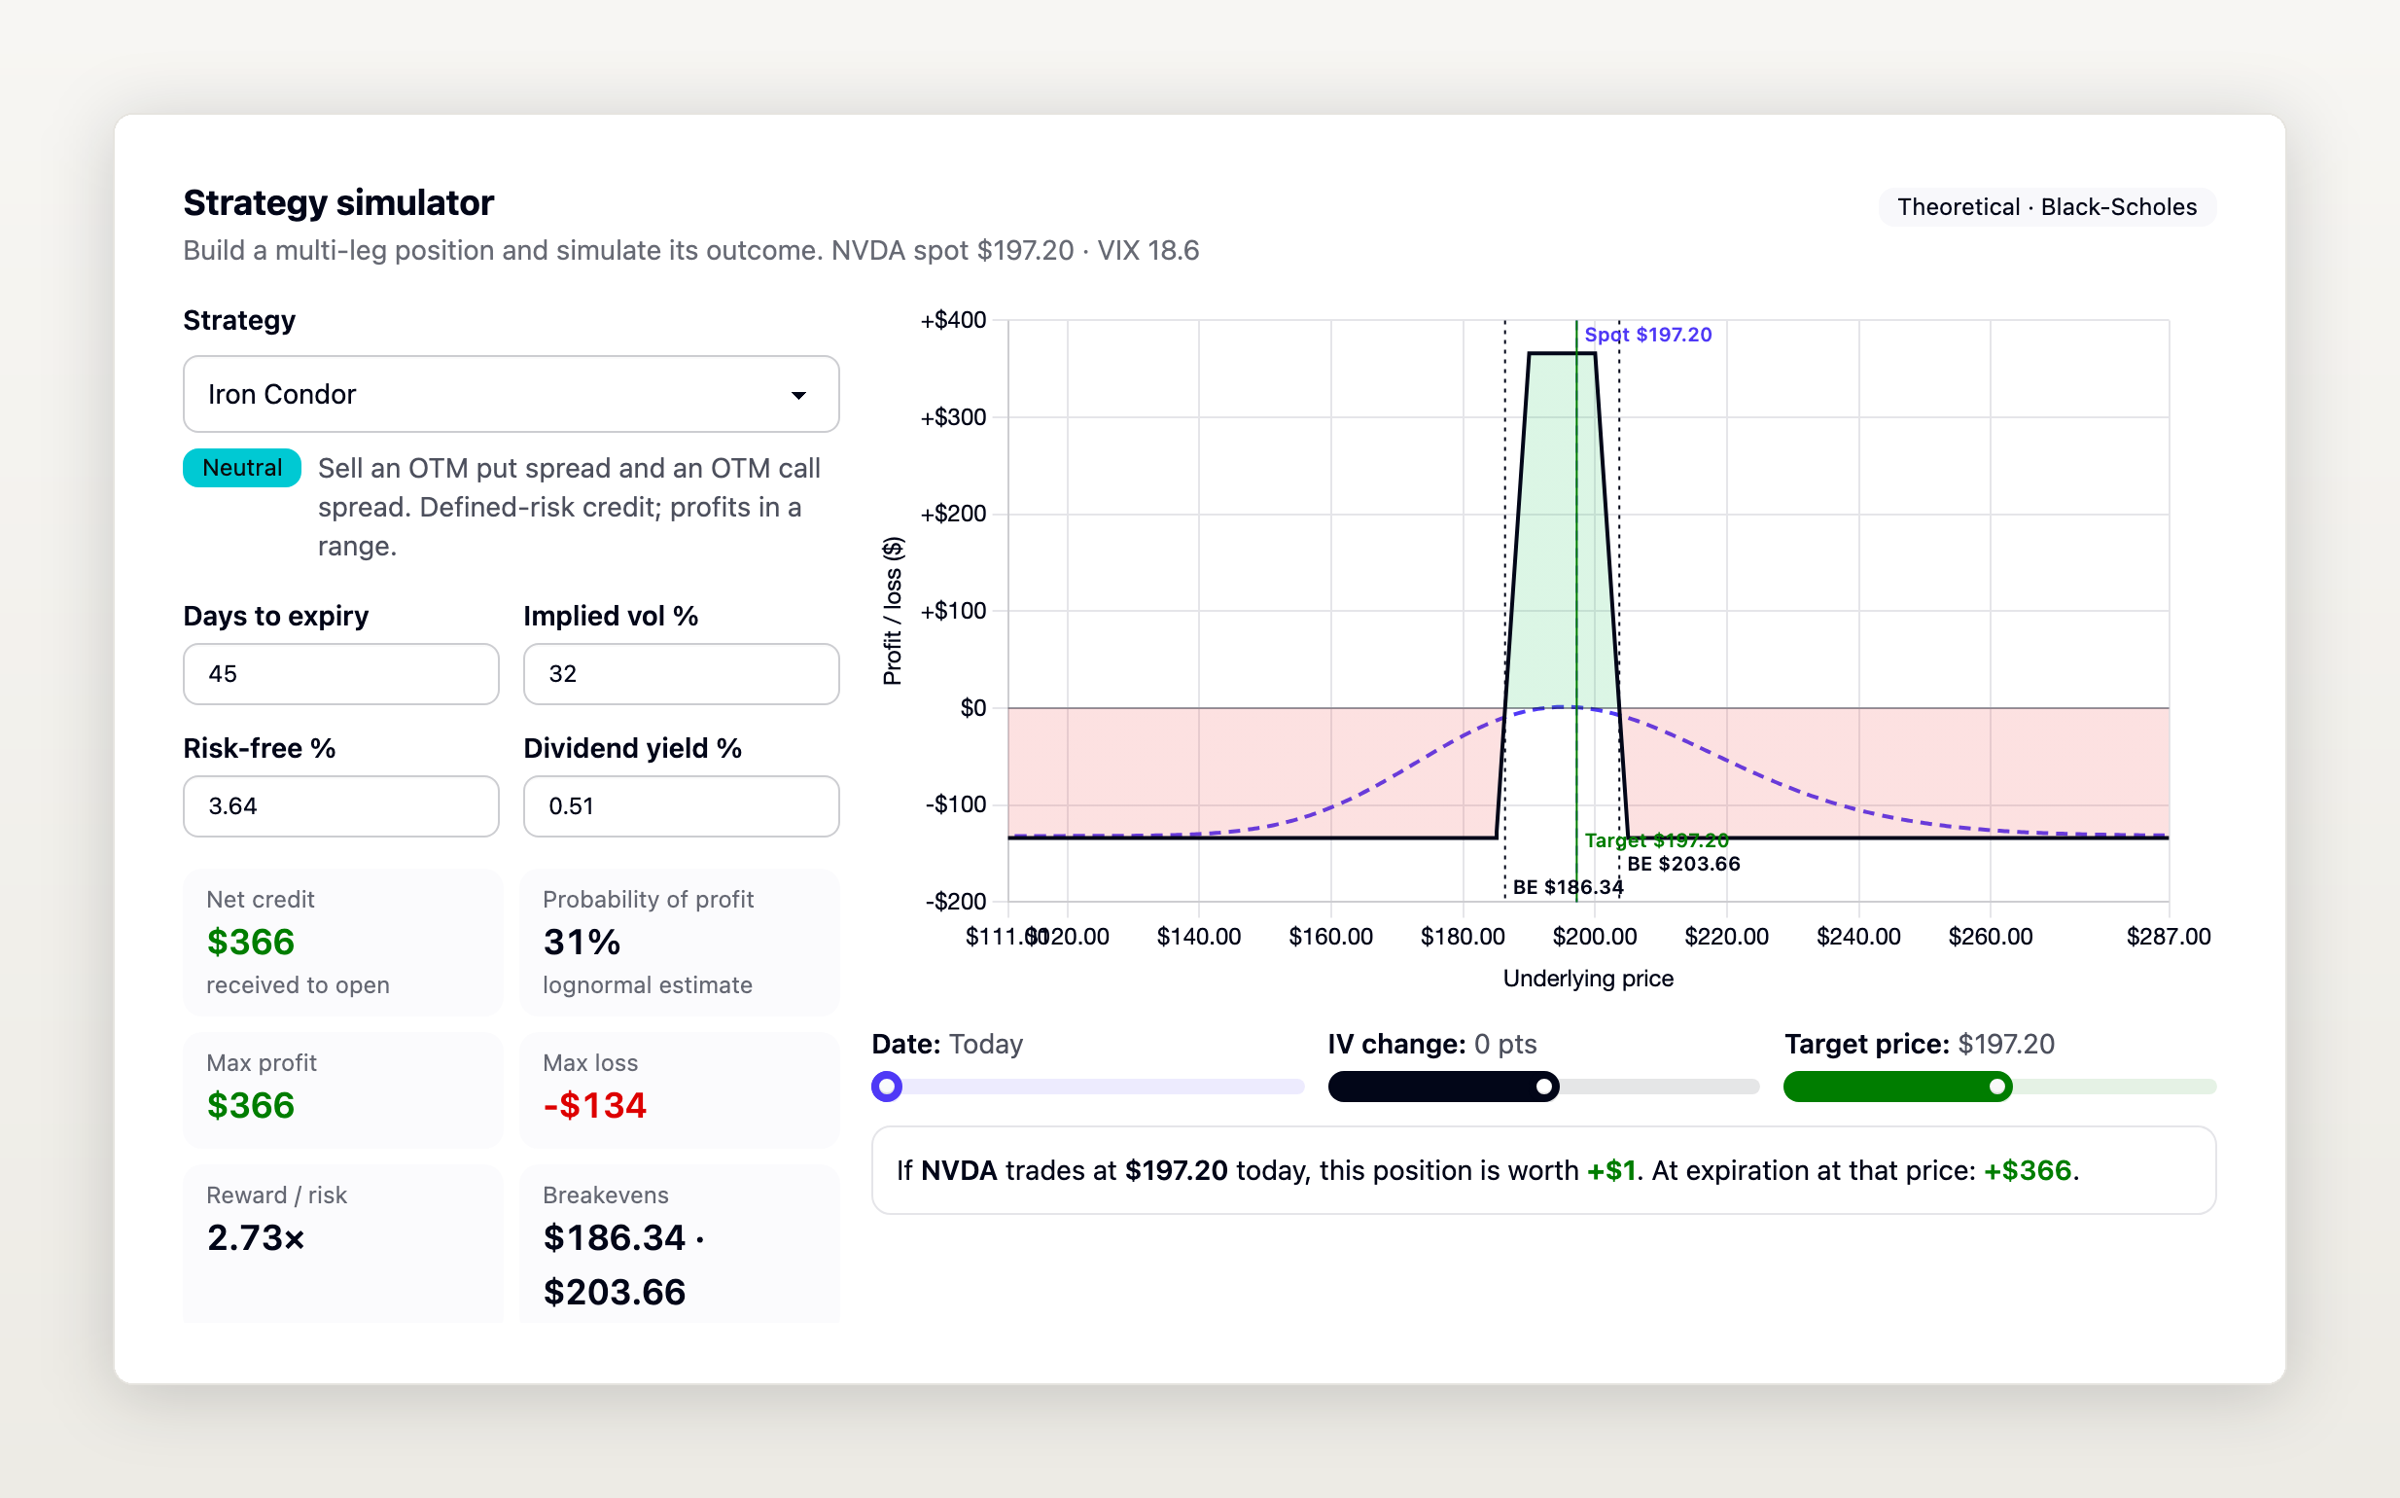
The other is a strategy simulator with 26 presets, covered calls through iron condors and ratio spreads. It draws the payoff at expiration and, separately, what the position is worth if you roll time forward and shift volatility, with per-leg greeks underneath. Neither tool needs an account.
What's next
Unusual options flow is the obvious one. We're also weighing historical chain snapshots, so you could watch positioning build instead of only seeing where it stands today. If either of those is what you actually want, or if it's something else entirely, tell us — all feedback is very welcome, and a list of requests is what got options built.