Good afternoon, and thank you for joining our discussion of BOK Financial's first quarter 2026 financial results. Our CEO, Stacey Kimes, will provide opening comments, cover the loan portfolio, and related credit metrics. Scott Grauer, Executive Vice President of Wealth Management, will cover our fee-based results, and our CFO, Marty Grunst, will then discuss financial performance for the quarter, as well as our forward guidance. The slide presentation and press release are available on our website at BOKF.com. We refer you to the disclaimers on slide two regarding any forward-looking statements made during this call. I will now turn the call over to Safety Times, who will begin on slide four.
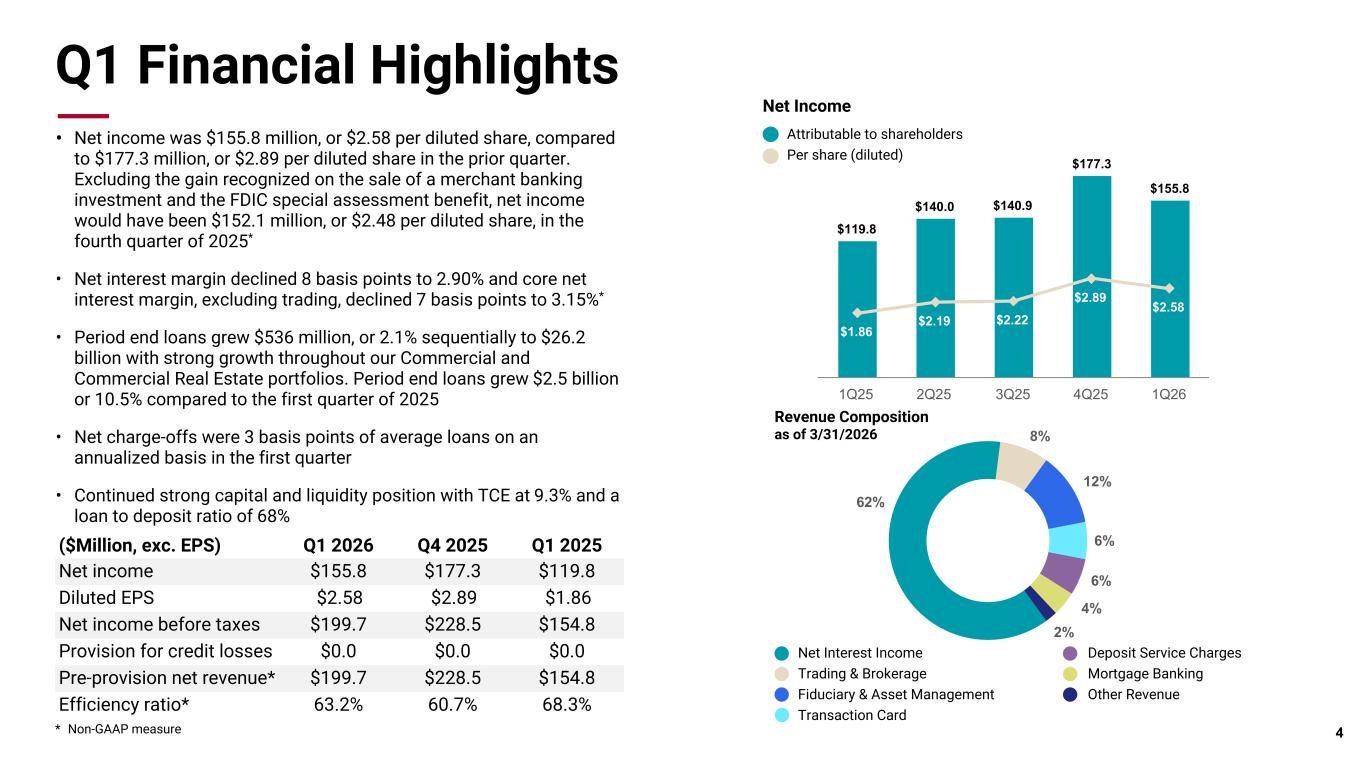
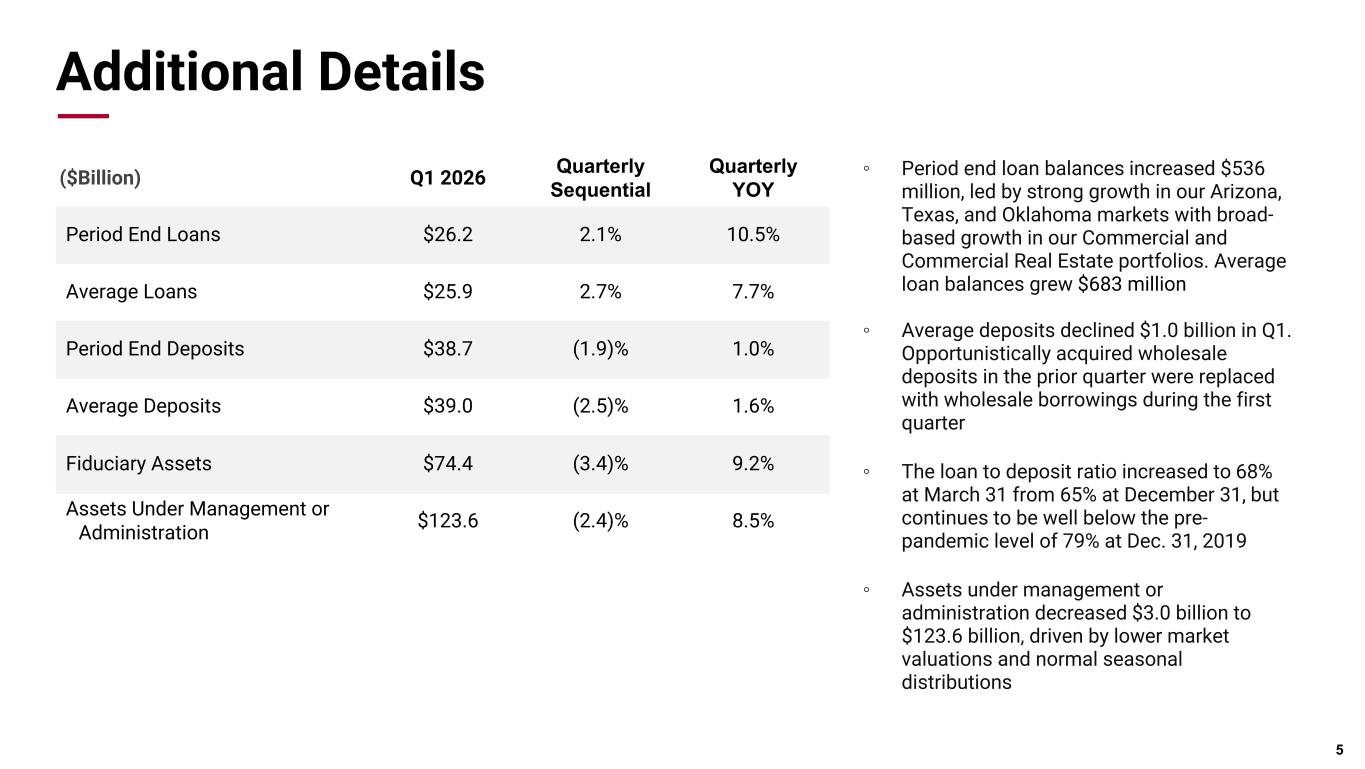
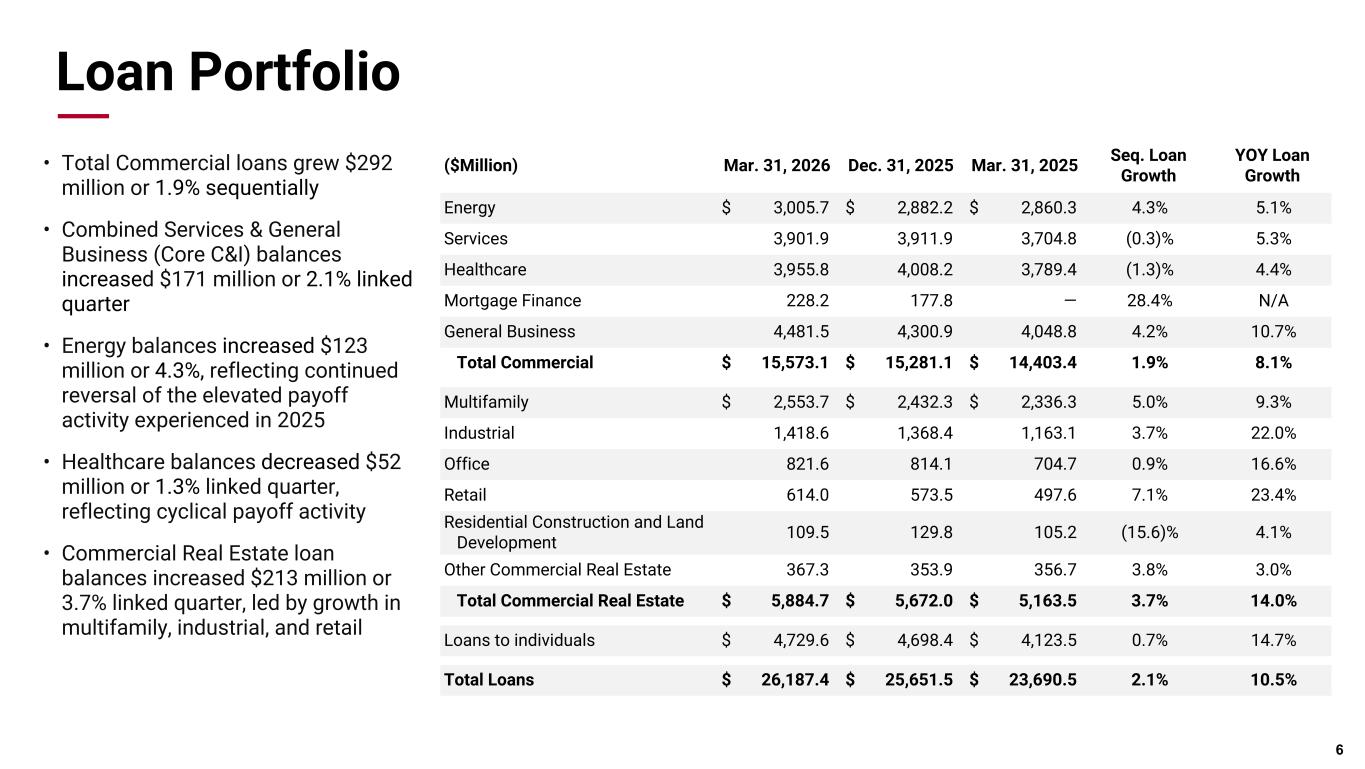
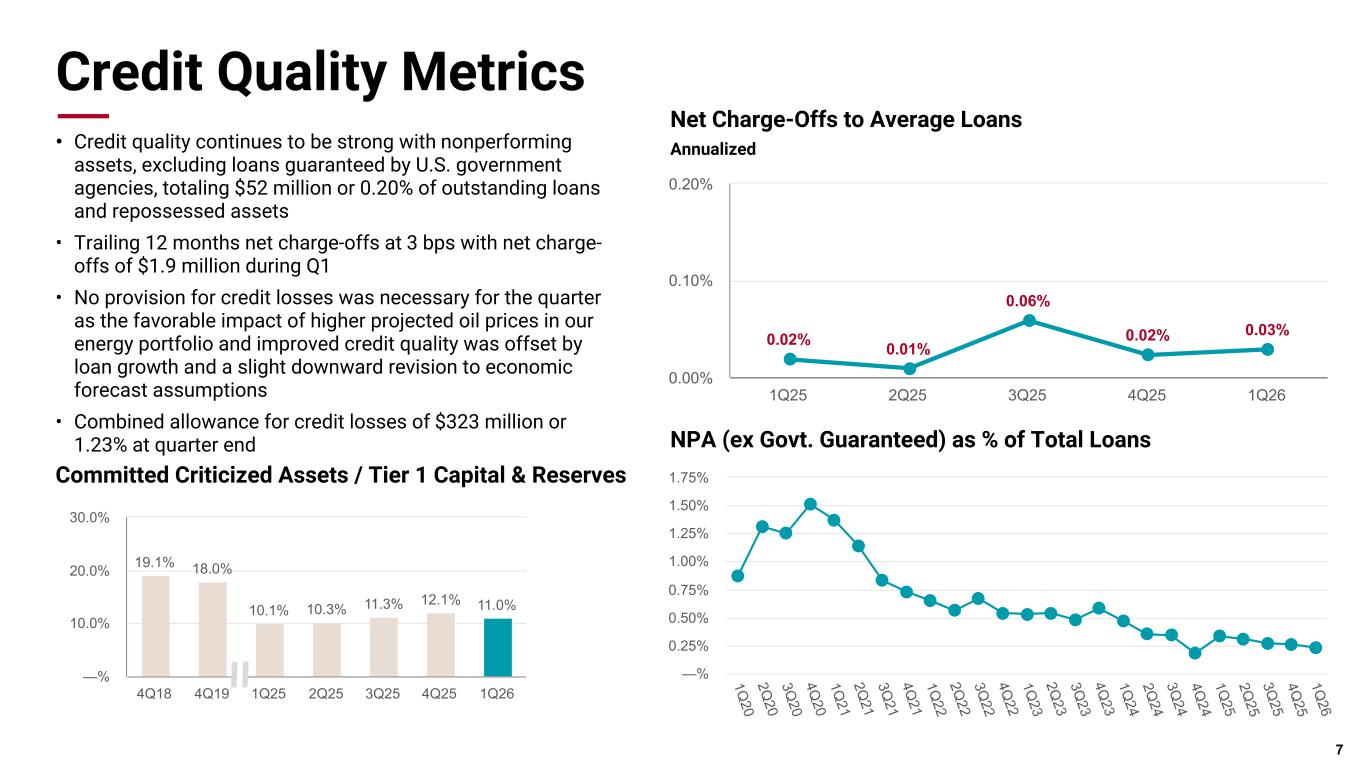
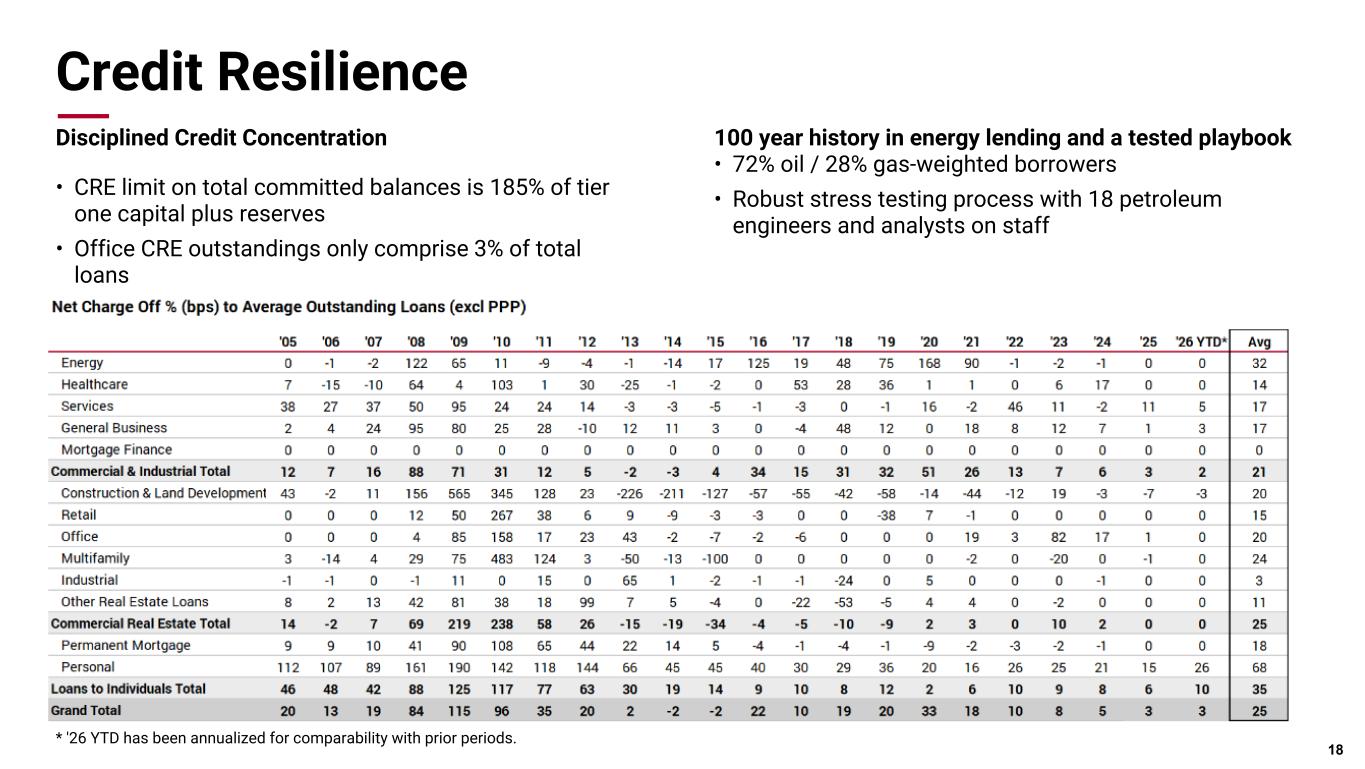
Thank you, Heather. We appreciate you joining the call this afternoon. We reported earnings of $155.8 million, or EPS, of $2.58 per diluted share for the first What stood out this quarter was the consistency of execution across the company and how our teams continue to build on the momentum we established in 2025. During the quarter, total loans grew 536 million, or 2.1% sequentially. That growth was well distributed across the portfolio. We saw strong momentum last year, and we're encouraged to see that continue. Pipelines remain solid, and business activity across our footprint and customer base has been constructive, even with more macroeconomic uncertainty. Growth was also well-balanced geographically across our franchise, with Texas growing 208 million, or 8% on an annualized basis, Oklahoma hosting growth of 163 million, or approximately 9% annualized, and Arizona increasing 236 million. Our fee-based businesses also perform well, even in an environment with elevated uncertainty and a rapidly changing macroeconomic backdrop. The revenue exceeded three of the past four quarters, reflecting the diversification and underlying strength of those platforms. Expenses declined meaningfully this quarter, reflecting our continued focus on managing our core cost structure. Over the past several quarters, we've worked to better align expenses with market opportunities and customer needs. This quarter illustrates that progress. Expenses were down $6.9 million, and we've posted an efficiency ratio. Importantly, this quarter provides a clean view of a more typical expense profile, with prior actions now embedded and temporary items less meaningful. Capital levels remain very strong, with tangible common equity at 9.3% and CET1 at 12.6%. Slide 6 provides a closer look at outstanding loans, energy, and commercial real estate. Our core C&I loan portfolio, which represents our combined services and general business portfolios, through 2.1% sequentially. This is the fourth consecutive quarter of growth in this portfolio reflecting long-term sustained customer relationships, through 1.3%. Loan production in this segment remains at record highs with a very strong pipeline. This business has also supported our fee income lines with strong syndication fees generated during the quarter. The reduction in loan balance of this quarter is primarily related to cyclical payoff activity. We believe we are well positioned to grow this portfolio throughout the remainder of the year. Engine loans grew this quarter, increasing 4.3%. This marks another reversal of the payoff trends we discussed last year. We're not currently seeing clients seeking to add production capacity yet. Our CRE business increased 3.7% compared to the prior quarter. We remain well within our concentration limits for this segment, which allows us to be selective about opportunities and devoid capital where structure, terms, and returns may be. Mortgage finance loans totaled $228 million, an increase of $50 million from the fourth quarter. This business is making, but it's important to note that the loan growth exhibited in the first quarter was driven by our existing businesses. Moving to slide seven. It has become a thing for me to keep my comments short on this topic, and I'm going to do that again this quarter. Product quality remains strong. MBAs not guaranteed by the U.S. government decreased $14 million to $52 million. The resulting non-performing assets, superiority in loans, and repossessed assets decreased 6 basis points to 20 basis points. Committed criticized assets decreased this quarter, remaining very low relative to historical standards. We had net charge-offs of just $1.9 million during the quarter, averaging 3 basis points over the last 12 months. I will reiterate that the limited charge-offs we've seen show no patterns or concentrations that raise concerns about specific business lines for geography, but also note proactively that we have virtually no exposure to private credit facilities. Over the long term, we do expect credit metrics to normalize. In the near term, we continue to expect net charge-offs to remain below historical averages. No provision was required this quarter. Our provisions benefited from the favorable impact of higher projected oil prices in our energy portfolio and improved overall credit quality. This was offset by loan growth and a modest downward division to economic forecast assumptions. Our combined allowance for credit losses is a healthy $323 million, or 1.23% of outstanding loans. Overall credit performance this quarter was accepted. And with that, I'll turn the call over to Scott.
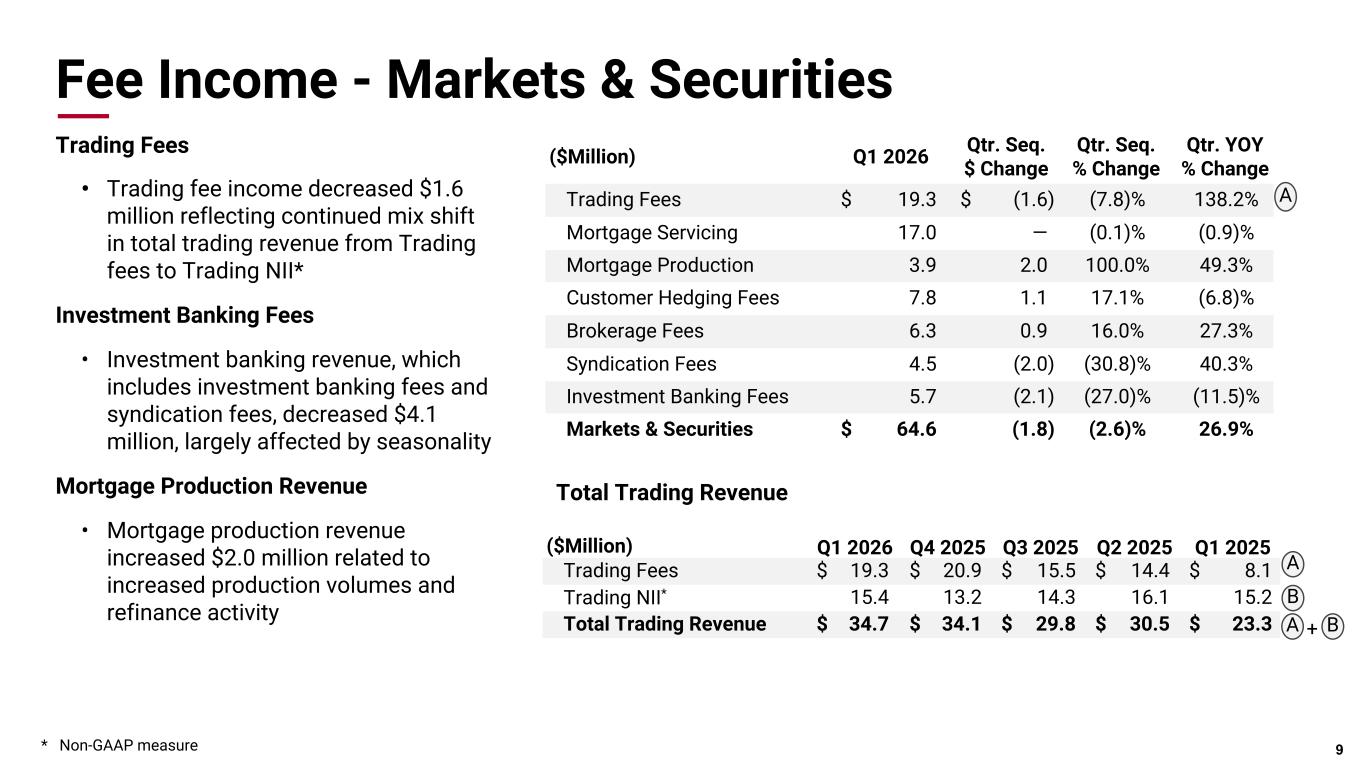
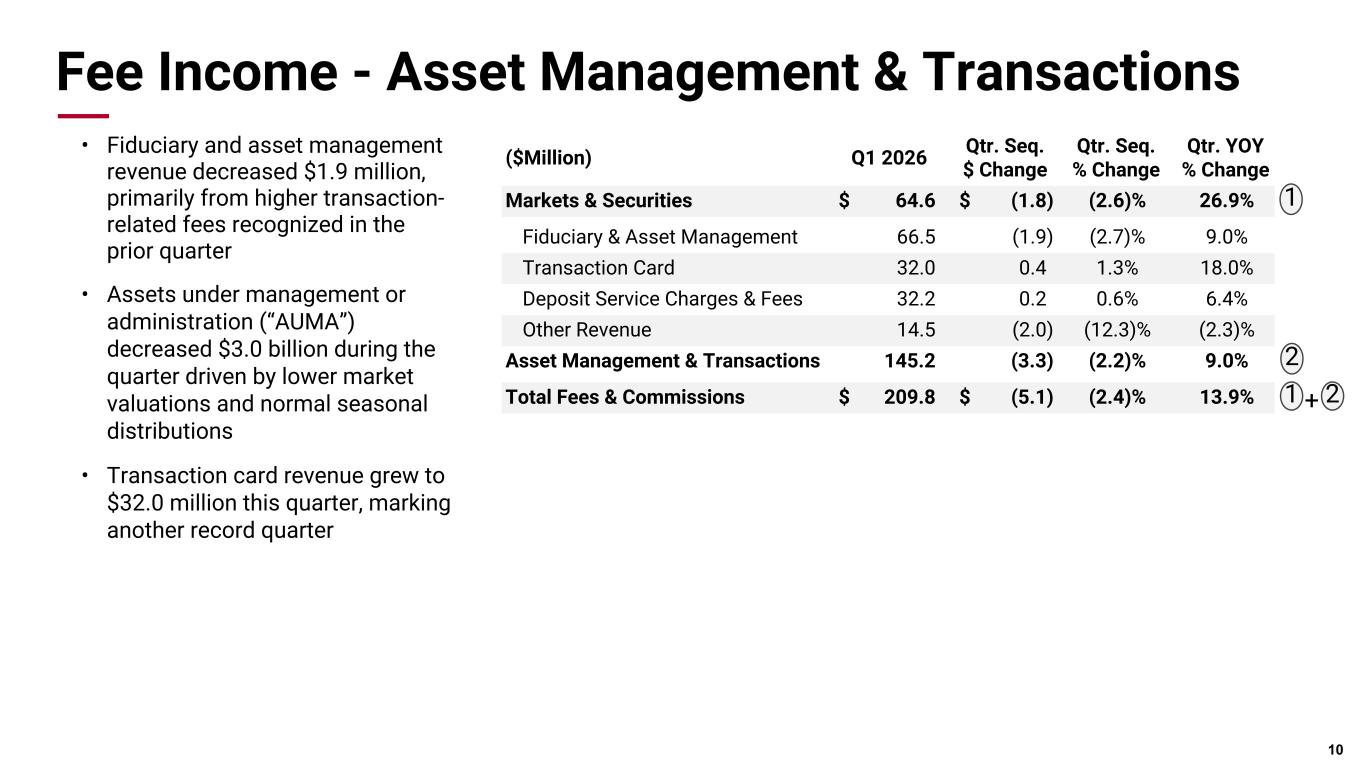
Turning to our operating results for the quarter on Slides 9 and 10, fee income remained solid this quarter despite the volatile market environment and macroeconomic backdrop of the quarter. Fees declined $5.1 million sequentially following a very strong fourth quarter. Fee income totaled $209.8 million, exceeding three of the past four quarters and underscoring the underlying strength of our fee-based business in any market environment. Total trading revenue, which includes trading-related net interest income, increased modestly to $4.1 million in the prior quarter. Customer hedging revenue grew $1.1 million as our energy customers predictably increased their hedging activity when higher short-term crude oil prices presented themselves. Investment banking revenue, which includes investment banking and syndication fees, went to outstanding quarter. The activity begins to build in the second quarter. I would note that the first quarter of 2026 is the strongest first quarter syndication activity on record. This result represents a 40% increase in higher production and refinance activity. Turning to slide 10 to discuss our asset management and transactions businesses. Fiduciary and asset management revenue delivered strong results, contributing 66.5 mention card revenue continued its trend of record-setting results, contributing $32 million to revenue. These results demonstrate the strength of this franchise, which has been increased sustained momentum and reliable execution. Our fee income performance this quarter reflects disciplined execution and the strength of these businesses, even amid shifting market conditions. The overall foundation remains solid and continues to support consistent... Thank you, Scott.
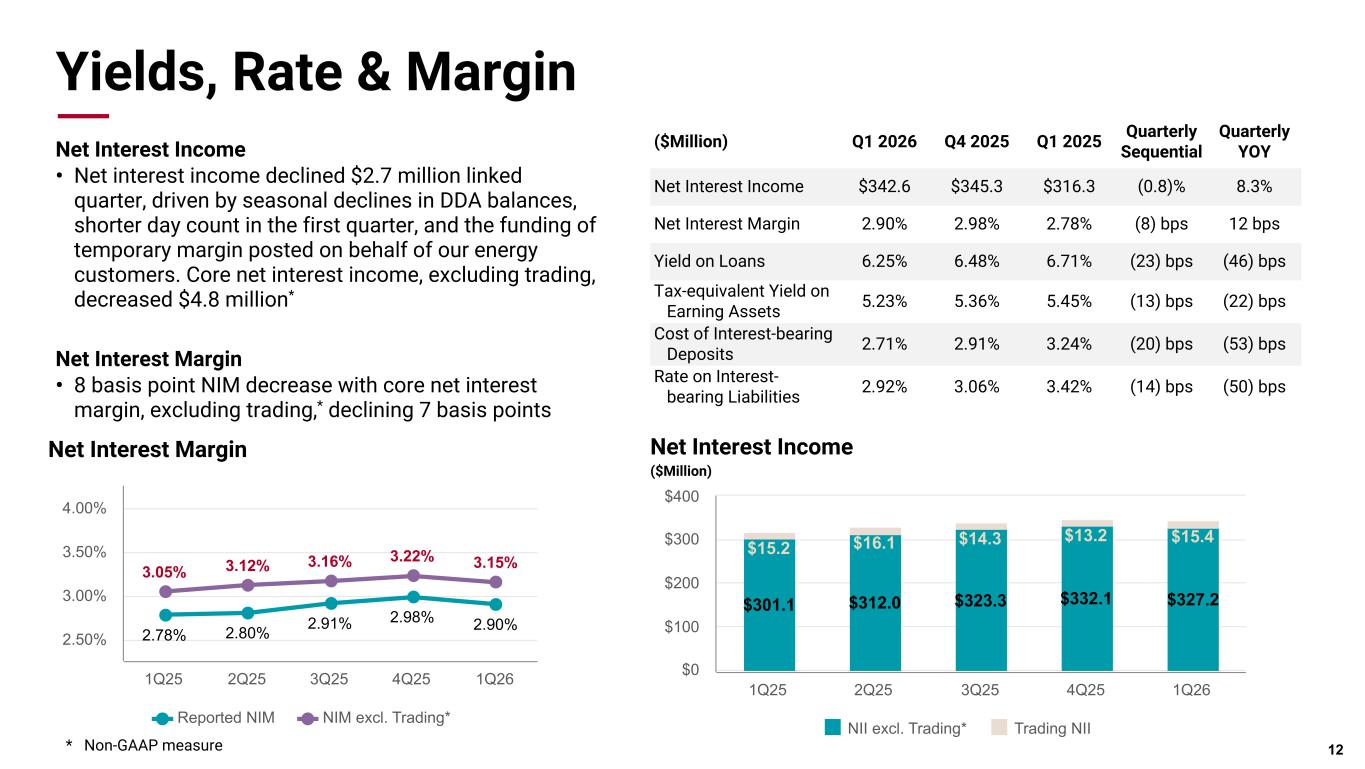
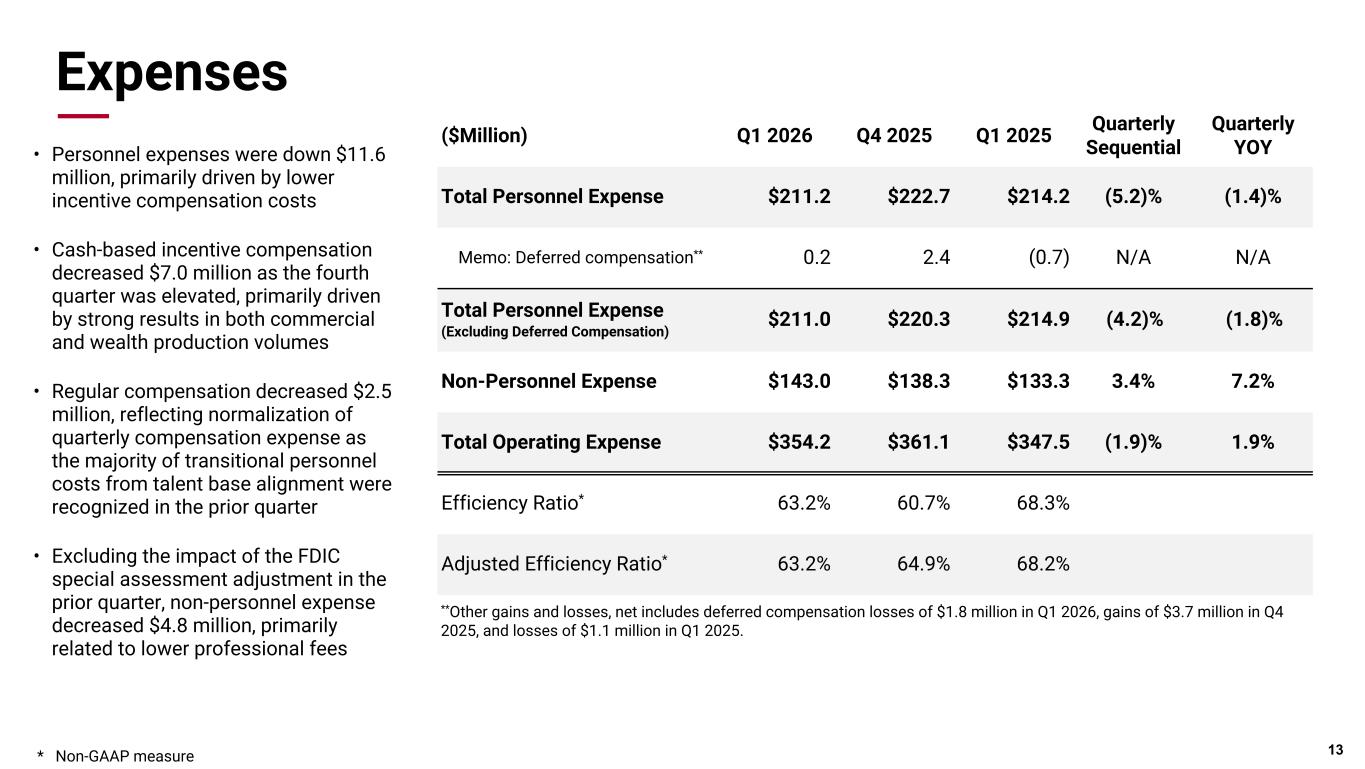
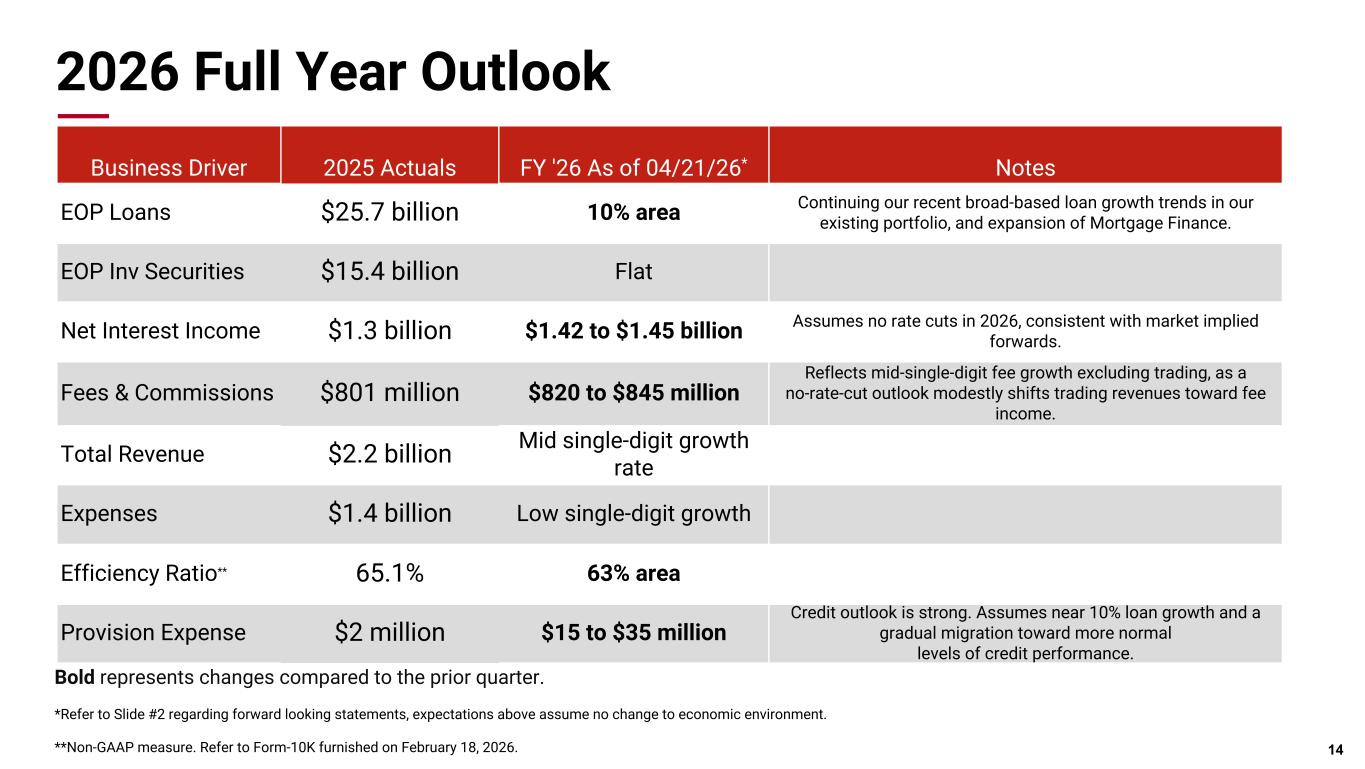
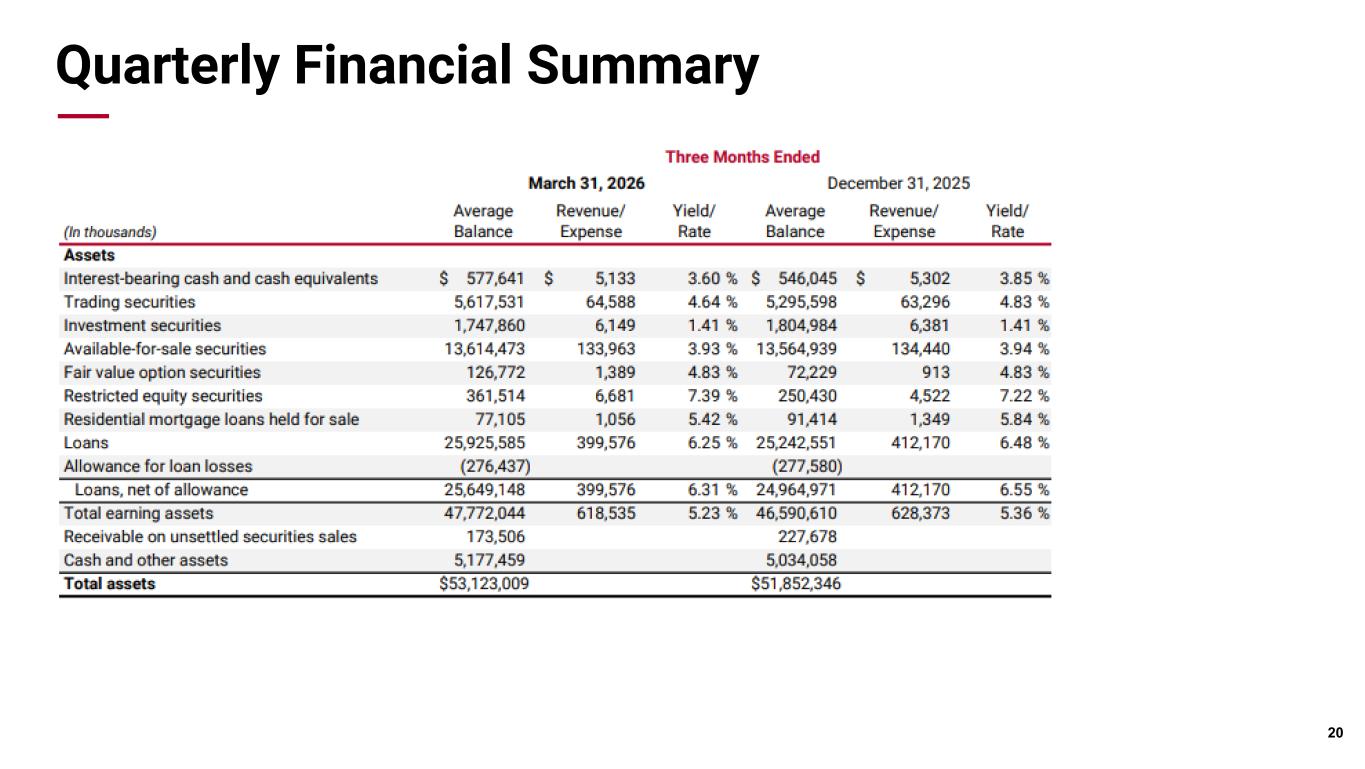
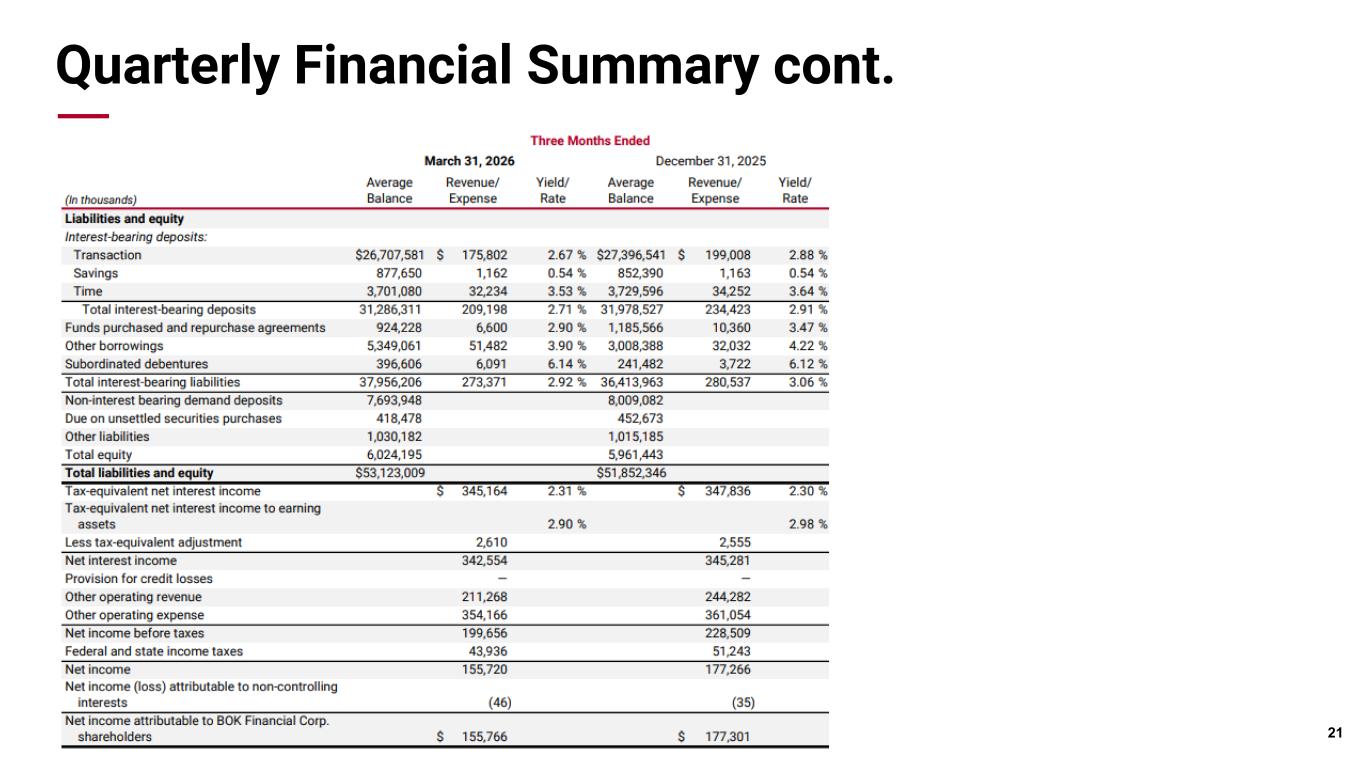
Turning to slide 12, net interest income decreased $2.7 million and reported net interest margin declined 8 basis points, excluding trading, core net interest increased 7 basis points. We continue to expect margin expansion over the course of 2026. Sixth grade asset repricing and loan growth were positive drivers for this quarter and are expected to persist. However, we saw several small negatives impact, with Q1 being the seasonal low point. Takeouts, of course. Loan fees were down sequentially. normally wise in Q4, and we benefited from that in Q4. The spreads returned to normal in Q1. It drove some funding costs for counterparty margin posted to exchanges for energy derivatives. And lastly, we saw the full quarter impact of the subdebt issued last November. Each of those items had one or two basis point negative effects individually, which accumulated to overcome the positives of loan growth and fixed rate asset repricing in the first quarter. Coming to slide 13, total expenses decreased $6.9 million, producing an efficiency ratio of 63.2% for the quarter. Personnel expenses were down $11.6 million. From payroll taxes and merit increases were more than offset by lower incentive compensation, as well as the benefits of the realignment actions we took in late 2020. Non-personnel expense increased $4.7 million. However, during the fourth quarter, we experienced a $9.5 million benefit from the updated FDIC special. Excluding that prior quarter benefit, non-personnel expense decreased. The team provides our outlook for full year 2020. We continue to produce strong results. Our pipelines are healthy, and our borrower sentiment and our footprint remains upbeat. We expect to see loan growth near 10% for full year 2020. Our guidance for total revenue has not changed. We expect growth to be in the mid-single-digit range. The mix of that revenue between NII and fees is somewhat rate curve-dependent as trading income can shift between the two. Our current forecast reflects no rate cuts in 2026 versus the two cuts reflected in our prior guidance. Our NII expectations for 2026 are now slightly lower at 1.42 to 1.0, and our fee income expectations are now similarly higher, at $820 to $845 million. We continue to anticipate the growth rate for expenses to be in the low single digits. This should result in a 2026 full-year average efficiency ratio in the 63% area. We expect 2026 provision expense to be in the $15 to $35 million range. Portfolio credit quality continues to be exceptionally strong, and we see no tangible evidence of credit normalization. Our guide does allow for some amount of normalization. Lastly, I'll note that Visa announced on April 13th that its second exchange program for Visa Class B shares has officially commenced. This allows us to monetize 50% of our remaining Visa B shares. We currently hold the equivalent of approximately 190,000 common shares, and monetizing half that position would equate to roughly a $29 million pre-tax benefit based on Visa's April 13 closing price of $309. While this potential gain is not reflected in our guidance, we expect to participate in the exchange and recognize a gain based on the market value at the time of the exchange. With that, I would like to hand the call back to the operator for Q&A, which will be followed by closing remarks from State.
Operator
Thank you. We will now begin the question and answer session.
If you would like to ask a question, please press star 1 on your telephone keypad to raise your hand and join the queue. and if you'd like to draw that question again press star 1 your first question comes from Michael Rose with Raymond James please go ahead hey good afternoon everyone thanks for taking my questions maybe Marty if we can go back to the margin it seems like there was just a confluence of factors this quarter that you know drove the compression but I think if I heard you right you'd expect margin kind of expansion from here can you just give us some some details behind that, you know, what you'd expect in terms of deposit betas as we move forward, loan pricing, and, you know, fixed asset repricing opportunities is just kind of the puts and takes as we kind of contemplate no rate cuts this year. Thanks.
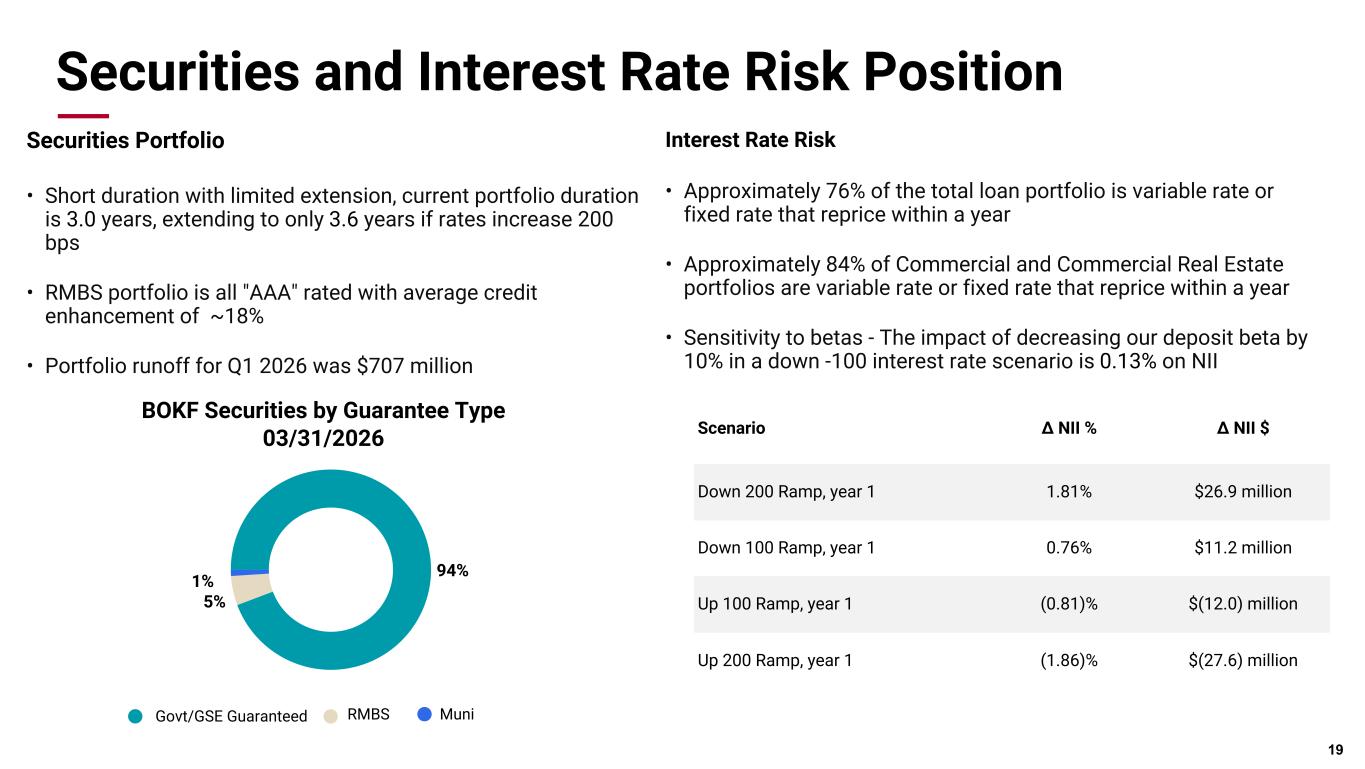
Sure, you bet. So as you think about, you know, each of those factors, you know, the one that will be durable, has been durable, and will continue to be durable is the fixed rate asset repricing. You'll see both bond portfolio and a fixed-rate loan portfolio continue to pick up spread there. You know, deposit betas, you know, the competition in the market is kind of like it's been for the last few quarters. So without rate moves, you know, I don't think you're going to see a lot in the betas, but to the extent that we have, you know, incremental rate moves, you know, we'd still see, you know, our cumulative down beta has been 66% in deposits. We continue to see that play out as it would relate to future rate moves to the extent you have them. You know, a couple of the things that affected this quarter, loan fees and the DDA, you know, you'll see both those. What's typical is for loan competition. You know, we've seen some of that. I mean, it's always competitive behavior enough to really move the needle. You know, one thing I might add on margin, if you think long term, you know, one thing you can do, If you just take our 290 margin that we printed this quarter and take both runs this quarter with those at their kind of mature rates where we're replacing, you know, at about 450, if that recaps our margin at just a little over 350, it'll take some time to get there, you know, on what the really long, you know, big picture of what the long run looks like.
Marty, that's great context. Very, very helpful. Maybe just as my follow-up, you mentioned the Visa Class B. period has now commenced. I think you said about half of that position would equate to a roughly $29 million pre-tax benefit. Is the plan to monetize half of that? And then, you know, would you look to potentially repurchase shares with the proceeds? Or, you know, historically, you've used some of these gains to, you know, either pay down debt or repurchase shares, things like that, just trying to better understand what the plan of action would be for those shares. Thanks.
Yeah, so our expectation is that that program will officially start transacting shares later this quarter, and so we'd be able to recognize that, you know, we have not yet determined exactly the disposition of what will.
Michael, we'll let the year play out and kind of see what, this is Stacy, we'll let the year play out and kind of see what opportunities may unfold to, if you will, reinvest those gains. If you recall, when we did the Visa B before, there was some really kind of good opportunities in our investment portfolio to get really good IRRs by essentially using those gains to do that and keep earnings relatively flat as a result of that. Our run rate earnings relatively flat. That equation isn't as compelling this time. The IRRs aren't very good relative to where they were before. Obviously, the unrealized losses in the portfolio are much smaller today than they were when we had this opportunity before. The other piece that we've looked at historically is contributing those to our foundation. There have been some changes to kind of corporate tax policy that makes that a little bit more challenging to do and get the tax benefit for it. And so, for now, it's kind of all of the above in terms of options that are on the table, including do nothing. So we'll see as the year unfolds, you know, if we want to invest that gain or if we just don't see an opportunity that merits the return profile that we should consider there.
Appreciate the caller in contact. I'll step back.
Operator
Your next question comes from the line of John Arstrom with RBC Capital Markets. Please go ahead.
Hey, thanks. Good afternoon, everyone. Hey, John. Hey. Great. I guess I wanted to ask you a little bit about the loan growth environment, Stacey. You talk a little bit about the general business drivers, just kind of the general business balance drivers. And then on energy, you use the term not yet in describing energy clients seeking to add production. What do you think needs to happen there for that to show a little bit more of a growth profile?
Yeah, so let me start with just, you know, obviously the loan growth was broad-based by geography, by loan type. You know that we've been, during significant effort, really, really excited to see that expansion continue. We continue to invest there. We're excited about what we see, the future there as well. Obviously, it's been nice to see a little bit of a bounce back on the energy side. We kind of troughed, I think, around this time last year, and we've been stable to increasing since then. I think, you know, if you look at where it would have to go for folks to continue to drill, and if you look, I looked at rig counts. I mean, rig counts are down from last week. Rig counts are down, you know, by, you know, over 40 rigs from this time of year ago. So, you know, my view generally is you're going to have to have, The folks are awfully focused on the prompt month or the near spot price, but it's really the strip price out two to three years, really three years, that's going to create the incentive for people to drill for oil. And so if you look out three years, you know, oil is below 70 bucks, and I think 70 is kind of a magic number. And so my view is you're not going to see folks drilling unless they can lock in a return with oil above 70 out that long. And so, obviously, things are volatile, things could change, and the curve has moved a lot. But I think it's more important to look at the curve, you know, three years out than it is to look at the prompt month in terms of what drill or behavior will look like. So, I don't see, obviously, the EBTC and the Rick Count, there's no impetus right now for folks to drill, given the backwardation of the curve. That could change, but we're not seeing that today.
Yep, fair enough. And then, Marty, for you, just a follow-up on Michael's deposit beta question. You had a nice step down in the interest-bearing deposit call I think you have, you know, in an environment without any further cuts.
Yeah, there's probably still a little bit of room. But, you know, as we've been chipping away at that over the declining returns, not as much as there was clearly a year ago, you know, relative to where.
Operator
The question comes from the line of Peter Winter with DA Davidson.
Please go ahead. uh thanks good afternoon stefie i wanted to ask uh there's been a lot of merger activity uh in your markets are you seeing opportunities for for team lift out something that you've done successfully in the past as you know that that's a strategy for us you know the some of the periods of most rapid growth in our history have been when there's been broad dislocation is created for mergers and acquisitions.
You have both employees and clients of those institutions who didn't choose to be a part of that institution, and so they may select to go somewhere else. So what I would tell you is obviously we see it. It's prevalent in our footprint, and you can assume that we're being very active in attempting to collect prospect for both employees and customers in this environment, but nothing specific to report today.
And then, Marty, you guys have always maintained really strong capital levels. I was wondering, could you quantify the estimated impact and benefits from the new regulatory proposals?
Yeah, Peter, we don't at this juncture have a number yet, but it's definitely going to be a benefit to us both, you know, on the loan book and particularly in the real estate secured loan book. You know, those LTV parameters, because of where our LTVs and FICOs and so forth are, that's going to be a benefit to us on RWAs and the loan book. And then actually in the trading book, we'll get a little benefit there too based on our read at this point.
Got it. Thanks for taking the questions. Thanks for you.
Operator
Your next question comes from the line of David Chivarini with Jeffries. Please go ahead.
Hi. Thanks for taking the question. So back on deposits, I think you mentioned that the non-interest-bearing DDA deposits should bottom in the first quarter. I was curious about the driver of the rebound in the second quarter and potentially the magnitude, and then should this rebound continue through?
Yeah, David, a little bit of context on that. So, you know, DDA was pretty steady for us last year and, you know, kind of that rate-seeking behavior that you'd seen in prior years that had, you know, kind of come to an end. and what's typical for us is to see a little bit of seasonal increase at the end of the fourth quarter, which we did see, and then a seasonal decrease in the first quarter, which we did see. We did also see a little bit of our commercial customers, kind of middle market customers, just deploy some of their cash into their businesses, and that's certainly healthy for business growth. But, you know, if you look at several years where you haven't really had a nice normal history of EDA to look at, But what is typical for us, and to some extent the industry, is to see EDA climb more in the back half of the year. So that's our expectation.
Thanks for that. And then on to mortgage finance. So we did see balances grow nicely on a percentage of building that business. Previously, you mentioned about getting to a billion in commitments by the end of this year. But now that the forward curve, we know what's happened there. With a higher-for-longer environment, but with that billion commitment level?
Yeah, I think so. I think, you know, what we talked about was by the end of the year being at a billion commitments with roughly 50% of that committed, outstanding. So, about that. Obviously, there's going to be some seasonality in this business. Second and third quarters tend to be pretty good, and then just like the mortgage business. So it'll track that. And so, you know, we're not going to be perfect there on the estimate, but I still feel good about that.
Operator
Your next question comes from the line of Matt Only with Stevens. Please go ahead.
Yeah, hey, guys. Thanks for taking the question. Just want to go back to the liability side of the balance sheet. I think in the deck you mentioned you moved from wholesale deposits into more wholesale borrowings, I think, this past quarter. was hoping you could just expand on that strategy. Yeah, so let me talk about that a little bit, Matt. Good question. So if you go back to Q4, when you had a couple of rate cuts and some of the market spreads got a little dislocated, we were able to find some deposits. They're technically deposits, but they're wholesale in the way we get them. And so we put on a little over a billion of deposits in Q4 at prices that were actually better than wholesale funding, which is rare, but we found that opportunity, and obviously we took it. And so we mentioned that would probably run off in Q1 when we talked on the call, and it did. So that ran off in Q1, and so that's the main driver of the deposit plastic line that you see. The opportunistic wholesale deposit trade we did in Q4. Thanks for trying to find that, Marty. And then just, I guess, as a follow-up going forward on that same topic, How should we think about funding the loan growth from here as far as, you know, core funding, wholesale deposits versus – Yeah, so at a – you know, at the loans and deposit ratio we have, we certainly have some flexibility on how we do that. Our expectation for this year is to see, you know, loan growth be, as we guided, you know, very good and consistent with our history. Deposit growth will probably be a little bit less than that, but we will see deposit growth this year so we can end with a little bit lower. or, you know, a little higher loan-to-deposit ratio at the end of the year. But, you know, going forward, you know, generally speaking, just knowing that we've got flexibility that many others don't to let that float around a little bit.
Yep, makes sense. Thanks, Marty.
Operator
Next question comes from the line of Jared Shaw with Barclays. Please go ahead.
Hey, everybody. A lot of them have been answered. I guess could you, Marty, maybe just give the dollar impact of the loan fee reduction quarter over quarter that you called out?
It's basically two basis points, and that's something that's a quarter over quarter, just two basis points, and, you know, that's, you know, quarter to quarter, there's a little bit of noise in there, but, you know, broadly speaking, that's, you know, year over year a good growth area for us.
Okay. And then are you seeing – what are the trends you're seeing in customer hedging activity as we're going through 2Q? Is that staying pretty strong?
Yeah, this is Scott. We have, obviously, with volatility in the global setting, it creates some spurred activity on the energy side. We have seen less activity on our interest rate side because we've got relatively stable rate environment.
But we're continuing to see good demand really across all the hedging opportunities. with the biggest focus being on – And I guess finally for me, when we look at the guidance for provision for the year, should we think that that's sort of, you know, the next three quarters equal contribution, or is that a little more back-end weighted with growth?
Yeah, you know, you don't want to get too cute with quarterly, but certainly the way the portfolio looks right now, it's very logical to think that there's a little back-end waiting there, They're just, you know, the portfolio today just looks so clean. And you can always have a little bit of visibility in the next quarter or two, and after that it's a little harder. So I think that's the right way to think about it.
Operator
This question comes from the line of Woody Lay with KBW. Please go ahead.
Thanks for taking my questions. Wanted to start on expenses. You know, they are very well managed. It was good to see the run rate come in following some of the actions you've taken in the fourth quarter. You touched the efficiency ratio down a little bit. Is there conviction that you could be on kind of the lower end of the stated range, or is it too early to tell just given some of the hiring question marks?
Yeah, well, we feel really good about how Q1 turns out just in terms of that nice, you know, run rate that that displays for what the first quarter had in expenses. And just in terms of, you know, how that plays into the second quarter, basically, you know, pretty straightforward. I mean, you'll have a little bit, you know, the rest of the merit increase will flow through in the second quarter, but then that's, you know, there's an offset there for how payroll taxes play out. And, you know, we're always looking to hire producers, as you know, But, you know, those are kind of the main things you'd point to in how that transpires. And so we feel pretty good about the guidance of 63 areas.
And then maybe last for me, I know you mentioned oil prices factored into the ACL. Can you just walk through how that's included in y'all's TISA model?
And is there any risk that if oil prices normalize lower, it could require a catch-up provision in the future? Yeah, so here's the way to think about that. So higher oil prices means the credit quality. That's supportive for the energy loan, both the valuation of the collateral and the cash flows in the business. So that's a nice positive, and that's easy to think through. But there's also, you know, the impact that higher input prices to, you know, basically the bulk of the C&I book. And there's a little bit of extra part of the portfolio. And so we recognize that as well. And so those are kind of natural offsets if you think about how we manage the CECL book. And so there's probably not a whole lot of risk of, you know, on a net basis of that being a particular driver that would drive an adverse outcome in the future. All right, makes sense. Thanks for taking my question.
Operator
Your next question comes from the line of Brett Rabbitin with StoneX. Please go ahead.
Hey, good afternoon, everyone. I wanted to go back to guidance and just talking about the fee income guidance. And I get that the change is partly a function of interest rates and how you guys account for the income. But wanted to see if this seems like the 820 to 845, you know, seasonal investment banking in the first quarter, it seems like that could have been a higher number. Are there any other businesses that maybe you're expecting to not grow this year, or are there any other factors in that?
Now, Brett, this is Marty. So I'd give you the following thoughts. You know, we feel very good about the fee business. You know, that group, the trajectory there is really good. We feel very confident in, you know, the history there and the outlook in really all those businesses across the board. And we can talk through each one if you want. I think it's important to think through that for the trading business, part of that revenue stream is in the fee line and part of that revenue stream is in the NII line. And so you really kind of have to combine those two when you think about the veracity of all the fee businesses, any changes in, you know, multi-year, if you're looking at a multi-year trend, you know, some of that business, some of that revenue has moved into the NII.
And then, Stacey, you talked about, you know, producer ads and possibly, you know, adding people with disruption. Would you guys happen to have, you know, a net producer ad number for the quarter?
That's not the way we think about it. We think about adding a talent. We don't have a goal around adding X number of net new producers each quarter. We have a perpetual goal of adding the best talent in every market that we're in. And those discussions have been ongoing for years in many cases. And so as we have an opportunity to add talent, we do it. And if it's not the A talent in the market, then we don't. We don't track it that way or think about it that way, and so I don't have anything to report on.
Fair enough. If I could stick in one last one, the decrease on the provisioning for the year, despite a little bit better loan growth expectations. I know, Stacey, late last year we had the conversation about, you know, eventually credit will normalize, but it doesn't look like 26 was going to be that year. But is the reduction, is that just better visibility that that's actually, like, the case? The 26 is going to continue to be fairly benign, and you're just not seeing anything at all?
The reduction is pretty small, and it's really just a reflection that we've already got one quarter behind us now. And so, you know, when I was in credit, I used to tell people, you know, either crystal ball was pretty good for, you know, three to six months, and then it got really foggy after that. And I think that's just a reflection that we've got one quarter in the bag, and so we just have just a little bit more visibility going forward, and so we brought the guidance down there just a little bit. But it's not that different, really.
Appreciate the cover, guys.
Operator
That concludes our question and answer session. I will now turn the conference back over to Stacy for closing comments.
To wrap up, the first quarter has set the stage with solid core operating results, diversified loan growth, resilient fee performance, excellent credit quality, and disciplined expense management. We're off to a strong start for 2026, and we're well positioned for growth as the year progresses. We appreciate your interest in BOK Financial and your willingness to spend time with us this afternoon. Please reach out to Heather King if you have any further questions at h.king at boks.com.
Operator
Ladies and gentlemen, this does conclude today's conference call. Thank you for your participation, and you may now disconnect.