
DiamondRock Hospitality Co 8-K, filed Feb 21, 2023
DiamondRock Hospitality Co (DRH)
8-K
2023-02-21
For: 2023-02-21
View Original
Added on
April 11, 2026
About this 8-K
DiamondRock Hospitality Co filed this 8-K on February 21, 2023.
Items reported
- Item 2.02: Financial results
- Item 7.01: Regulation FD disclosure
- Item 9.01: Financial statements and exhibits
UNITED STATES
SECURITIES AND EXCHANGE COMMISSION
Washington, D.C. 20549
FORM 8-K
CURRENT REPORT PURSUANT TO
SECTION 13 OR 15(d) OF THE
SECURITIES EXCHANGE ACT OF 1934
Date of Report (Date of earliest event reported):
(Exact name of registrant as specified in charter)
| (State or Other Jurisdiction of Incorporation) | (Commission File Number) | (IRS Employer Identification No.) | ||||||||||||
(Address of Principal Executive Offices) (Zip Code)
(Registrant’s telephone number, including area code): (240 ) 744-1150
Check the appropriate box below if the Form 8-K filing is intended to simultaneously satisfy the filing obligation of the registrant under any of the following provisions (see General Instruction A.2. below):
| Written communications pursuant to Rule 425 under the Securities Act (17 CFR 230.425) | |||||
| Soliciting material pursuant to Rule 14a-12 under the Exchange Act (17 CFR 240.14a-12) | |||||
| Pre-commencement communications pursuant to Rule 14d-2(b) under the Exchange Act (17 CFR 240.14d-2(b)) | |||||
| Pre-commencement communications pursuant to Rule 13e-4(c) under the Exchange Act (17 CFR 240.13e-4(c)) | |||||
Securities registered pursuant to Section 12(b) of the Act:
| Title of each class | Trading Symbol(s) | Name of each exchange on which registered | ||||||||||||
Indicate by check mark whether the registrant is an emerging growth company as defined in Rule 405 of the Securities Act of 1933 (§230.405 of this chapter) or Rule 12b-2 of the Securities Exchange Act of 1934 (§240.12b-2 of this chapter).
If an emerging growth company, indicate by check mark if the registrant has elected not to use the extended transition period for complying with any new or revised financial accounting standards provided pursuant to Section 13(a) of the Exchange Act. ☐
This Current Report on Form 8-K (“Current Report”) contains forward-looking statements within the meaning of federal securities laws and regulations. These forward-looking statements are identified by their use of terms and phrases such as “believe,” “expect,” “intend,” “project,” “anticipate,” “position,” and other similar terms and phrases, including references to assumptions and forecasts of future results. Forward-looking statements are not guarantees of future performance and involve known and unknown risks, uncertainties and other factors which may cause the actual results to differ materially from those anticipated at the time the forward-looking statements are made. These risks include, but are not limited to national and local economic and business conditions, including the impact of COVID-19 on occupancy rates at our hotels and the demand for hotel products and services, and those risks and uncertainties described from time to time in our filings with the Securities and Exchange Commission, including our Annual Report on Form 10-K filed on February 22, 2022 and our Quarterly Reports on Form 10-Q filed on May 6, 2022, August 4, 2022 and November 4, 2022. Although we believe the expectations reflected in such forward-looking statements are based upon reasonable assumptions, we can give no assurance that the expectations will be attained or that any deviation will not be material. All information in this Current Report is as of the date of this Current Report, and we undertake no obligation to update any forward-looking statement to conform the statement to actual results or changes in our expectations.
ITEM 2.02. Results of Operations and Financial Condition.
On February 21, 2023, DiamondRock Hospitality Company (the "Company") issued a press release announcing its financial results for the quarter and year ended December 31, 2022. A copy of that press release is furnished as Exhibit 99.1 and is incorporated by reference herein.
The information furnished pursuant to this Item 2.02, including Exhibit 99.1, shall not be deemed “filed” for any purpose, including for the purposes of Section 18 of the Securities Exchange Act of 1934, as amended (the “Exchange Act”), or otherwise subject to the liabilities of that Section, and shall not be deemed to be incorporated by reference into any filing under the Securities Act of 1933, as amended (the "Securities Act"), or the Exchange Act, regardless of any general incorporation language in such filing.
ITEM 7.01 Regulation FD Disclosure.
A copy of a slide presentation that the Company intends to use at investor meetings is attached as Exhibit 99.2 to this Current Report and is incorporated by reference herein. Additionally, the Company has posted the slide presentation in the investor relations/presentations section of its website at www.drhc.com.
The information in this Item 7.01, including Exhibit 99.2 attached hereto, is being furnished and shall not be deemed “filed” for purposes of Section 18 of the Securities Exchange Act of 1934, as amended (the “Exchange Act”), or otherwise subject to the liabilities of such section. The information in this Current Report, including Exhibit 99.2, shall not be incorporated by reference into any filing under the Securities Act of 1933, as amended, or the Exchange Act, regardless of any incorporation by reference language in any such filing. This Current Report will not be deemed an admission as to the materiality of any information in this Current Report that is required to be disclosed solely by Regulation FD.
ITEM 9.01. Financial Statements and Exhibits.
(d) Exhibits.
The following exhibits are included with this report:
Exhibit No. Description
101.SCH Inline XBRL Taxonomy Extension Schema Document
101.CAL Inline XBRL Taxonomy Extension Calculation Linkbase Document
101.DEF Inline XBRL Taxonomy Extension Definition Linkbase Document
101.LAB Inline XBRL Taxonomy Extension Label Linkbase Document
101.PRE Inline XBRL Taxonomy Extension Presentation Linkbase Document
104 Cover Page Interactive Data File
SIGNATURE
Pursuant to the requirements of the Securities Exchange Act of 1934, the Registrant has duly caused this report to be signed on its behalf by the undersigned hereunto duly authorized.
| DIAMONDROCK HOSPITALITY COMPANY | ||||||||||||||||||||
| Dated: February 21, 2023 | By: | /s/ Briony R. Quinn | ||||||||||||||||||
| Briony R. Quinn | ||||||||||||||||||||
| Senior Vice President and Treasurer | ||||||||||||||||||||

COMPANY CONTACTS
Jeff Donnelly
Chief Financial Officer
(240) 744-1190
Briony Quinn
Senior Vice President
(240) 744-1196
FOR IMMEDIATE RELEASE
DIAMONDROCK HOSPITALITY COMPANY REPORTS FOURTH QUARTER AND FULL YEAR 2022 RESULTS
Full Year 2022 Revenues 6.8% Above 2019
RevPAR Exceeds 2019 for 11th Consecutive Month
BETHESDA, Maryland, Tuesday, February 21, 2023 – DiamondRock Hospitality Company (the “Company”) (NYSE: DRH), a lodging-focused real estate investment trust that owns a portfolio of 35 premium hotels and resorts in the United States, today announced results of operations for the quarter and year ended December 31, 2022.
Fourth Quarter 2022 Highlights
•Net Income: Net income was $18.4 million and earnings per diluted share was $0.07.
•Comparable Revenues: Comparable total revenues were $256.9 million, a 22.6% increase over 2021 and a 9.5% increase over 2019.
•Comparable RevPAR: Comparable RevPAR was $195.99, an 18.4% increase over 2021 and a 6.7% increase over 2019.
•Comparable Hotel Adjusted EBITDA: Comparable Hotel Adjusted EBITDA was $77.0 million, a 61.8% increase over 2021 and a 17.0% increase over 2019.
•Comparable Hotel Adjusted EBITDA Margin: Comparable Hotel Adjusted EBITDA margin was 29.96%, a 724 basis point increase over 2021 and a 192 basis point increase over 2019.
•Adjusted EBITDA: Adjusted EBITDA was $67.4 million, a 95.9% increase over 2021 and a 7.5% increase over 2019.
•Adjusted FFO: Adjusted FFO was $48.0 million and Adjusted FFO per diluted share was $0.23.
•Share Repurchases: In October 2022, the Company repurchased 1.6 million shares of its common stock at an average price of $7.81 per share.
•Hotel Acquisition: The Company acquired the Lake Austin Spa Resort in Austin, Texas for a net purchase price of $75.8 million on November 21, 2022.
Full Year 2022 Highlights
•Net Income: Net income was $109.7 million and earnings per diluted share was $0.47.
•Comparable Revenues: Comparable total revenues were $1.0 billion, a 54.8% increase over 2021 and a 7.0% increase over 2019.
•Comparable RevPAR: Comparable RevPAR was $198.37, a 50.6% increase over 2021 and a 5.5% increase over 2019.
•Comparable Hotel Adjusted EBITDA: Comparable Hotel Adjusted EBITDA was $319.8 million, a 121.9% increase over 2021 and a 13.6% increase over 2019.
•Comparable Hotel Adjusted EBITDA Margin: Comparable Hotel Adjusted EBITDA margin was 31.36%, a 947 basis point increase over 2021 and a 184 basis point increase over 2019.
•Adjusted EBITDA: Adjusted EBITDA was $280.6 million, a 236.0% increase over 2021 and a 7.8% increase over 2019.
•Adjusted FFO: Adjusted FFO was $215.9 million and Adjusted FFO per diluted share was $1.01.
•Hotel Acquisitions: The Company completed three transactions for a total of $174 million of high-quality, unencumbered, independent resorts in 2022
•Credit Facility Refinancing: In September 2022, the Company successfully completed a $1.2 billion refinancing of its primary unsecured credit facility to address its near-term debt maturities.
•Dividends: The Company reinstated its quarterly common dividend, declaring $0.09 per common share in 2022.
“DiamondRock’s portfolio delivered record-setting revenues and hotel profit margins in 2022,” said Mark W. Brugger, President and Chief Executive Officer of DiamondRock Hospitality Company. “These outstanding results were enabled by our multi-year strategy to invest in the right types of hotels and resorts in the right types of markets for today’s traveler. We continue to see encouraging travel trends throughout our portfolio. For 2023, we expect U.S. hotel industry demand will likely reach 1.3 billion occupied room nights, surpassing pre-pandemic 2019.”
Operating Results
Please see “Non-GAAP Financial Measures” attached to this press release for an explanation of the terms “EBITDAre,” “Adjusted EBITDA,” “Hotel Adjusted EBITDA,” “Hotel Adjusted EBITDA Margin,” “FFO” and “Adjusted FFO” and a reconciliation of these measures to net income. Comparable operating results include all hotels currently owned, except the Kimpton Fort Lauderdale Beach Resort, which opened in April 2021, for all periods presented. See “Reconciliation of Comparable Operating Results” attached to this press release for a reconciliation to historical amounts.
2
| Quarter Ended December 31, | Change From | |||||||||||||||||||||||||||||||
| 2022 | 2021 | 2019 | 2021 | 2019 | ||||||||||||||||||||||||||||
| ($ amounts in millions, except hotel statistics and per share amounts) | ||||||||||||||||||||||||||||||||
Comparable Operating Results (1) | ||||||||||||||||||||||||||||||||
| ADR | $ | 291.05 | $ | 270.21 | $ | 244.35 | 7.7 | % | 19.1 | % | ||||||||||||||||||||||
| Occupancy | 67.3 | % | 61.2 | % | 75.1 | % | 6.1 | % | (7.8) | % | ||||||||||||||||||||||
| RevPAR | $ | 195.99 | $ | 165.47 | $ | 183.60 | 18.4 | % | 6.7 | % | ||||||||||||||||||||||
| Total RevPAR | $ | 293.64 | $ | 239.93 | $ | 268.73 | 22.4 | % | 9.3 | % | ||||||||||||||||||||||
| Revenues | $ | 256.9 | $ | 209.5 | $ | 234.6 | 22.6 | % | 9.5 | % | ||||||||||||||||||||||
| Hotel Adjusted EBITDA | $ | 77.0 | $ | 47.6 | $ | 65.8 | 61.8 | % | 17.0 | % | ||||||||||||||||||||||
| Hotel Adjusted EBITDA Margin | 29.96 | % | 22.72 | % | 28.04 | % | 724 bps | 192 bps | ||||||||||||||||||||||||
| Available Rooms | 875,012 | 873,264 | 872,896 | 1,748 | 2,116 | |||||||||||||||||||||||||||
Actual Operating Results (2) | ||||||||||||||||||||||||||||||||
| Revenues | $ | 255.1 | $ | 189.9 | $ | 237.5 | 34.3 | % | 7.4 | % | ||||||||||||||||||||||
| Net income (loss) | $ | 18.4 | $ | (2.9) | $ | 134.6 | 734.5 | % | (86.3) | % | ||||||||||||||||||||||
| Income (loss) per diluted share | $ | 0.07 | $ | (0.03) | $ | 0.66 | 333.3 | % | (89.4) | % | ||||||||||||||||||||||
| Adjusted EBITDA | $ | 67.4 | $ | 34.4 | $ | 62.7 | 95.9 | % | 7.5 | % | ||||||||||||||||||||||
| Adjusted FFO | $ | 48.0 | $ | 19.1 | $ | 54.7 | 151.3 | % | (12.2) | % | ||||||||||||||||||||||
| Adjusted FFO per diluted share | $ | 0.23 | $ | 0.09 | $ | 0.27 | 155.6 | % | (14.8) | % | ||||||||||||||||||||||
| Year Ended December 31, | Change From | |||||||||||||||||||||||||||||||
| 2022 | 2021 | 2019 | 2021 | 2019 | ||||||||||||||||||||||||||||
| ($ amounts in millions, except hotel statistics and per share amounts) | ||||||||||||||||||||||||||||||||
Comparable Operating Results (1) | ||||||||||||||||||||||||||||||||
| ADR | $ | 290.21 | $ | 255.40 | $ | 242.03 | 13.6 | % | 19.9 | % | ||||||||||||||||||||||
| Occupancy | 68.4 | % | 51.6 | % | 77.7 | % | 16.8 | % | (9.3) | % | ||||||||||||||||||||||
| RevPAR | $ | 198.37 | $ | 131.74 | $ | 188.07 | 50.6 | % | 5.5 | % | ||||||||||||||||||||||
| Total RevPAR | $ | 294.03 | $ | 190.11 | $ | 275.36 | 54.7 | % | 6.8 | % | ||||||||||||||||||||||
| Revenues | $ | 1,019.8 | $ | 658.6 | $ | 953.3 | 54.8 | % | 7.0 | % | ||||||||||||||||||||||
| Hotel Adjusted EBITDA | $ | 319.8 | $ | 144.1 | $ | 281.4 | 121.9 | % | 13.6 | % | ||||||||||||||||||||||
| Hotel Adjusted EBITDA Margin | 31.36 | % | 21.89 | % | 29.52 | % | 947 bps | 184 bps | ||||||||||||||||||||||||
| Available Rooms | 3,468,479 | 3,464,371 | 3,462,080 | 4,108 | 6,399 | |||||||||||||||||||||||||||
Actual Operating Results (2) | ||||||||||||||||||||||||||||||||
| Revenues | $ | 1,001.5 | $ | 567.1 | $ | 938.1 | 76.6 | % | 6.8 | % | ||||||||||||||||||||||
| Net income (loss) | $ | 109.7 | $ | (195.4) | $ | 184.2 | 156.1 | % | (40.4) | % | ||||||||||||||||||||||
| Income (loss) per diluted share | $ | 0.47 | $ | (0.96) | $ | 0.90 | 149.0 | % | (47.8) | % | ||||||||||||||||||||||
| Adjusted EBITDA | $ | 280.6 | $ | 83.5 | $ | 260.4 | 236.0 | % | 7.8 | % | ||||||||||||||||||||||
| Adjusted FFO | $ | 215.9 | $ | 26.3 | $ | 217.0 | 720.9 | % | (0.5) | % | ||||||||||||||||||||||
| Adjusted FFO per diluted share | $ | 1.01 | $ | 0.12 | $ | 1.07 | 741.7 | % | (5.6) | % | ||||||||||||||||||||||
(1) Amounts represent the pre-acquisition operating results for Bourbon Orleans Hotel from January 1, 2019 to July 28, 2021, Henderson Park Inn from January 1, 2019 to July 29, 2021, Henderson Beach Resort from January 1, 2019 to December 22, 2021, Tranquility Bay Beachfront Resort from January 1, 2019 to January 5, 2022 and Lake Austin Spa Resort from January 1, 2019 to November 20, 2022 and exclude the operating results of the Kimpton Fort Lauderdale Beach Resort as the hotel opened in April 2021. The pre-acquisition operating results were obtained from the sellers of the hotels during the acquisition due diligence process. We have made no adjustments
3
to the amounts provided to us by the seller. The pre-acquisition operating results were not audited or reviewed by the Company's independent auditors.
(2) Actual operating results include the operating results of hotels acquired and disposed of for the Company's respective ownership periods.
The following tables provide comparable monthly operating information for the Company's portfolio:
| January 2022 | February 2022 | March 2022 | April 2022 | May 2022 | June 2022 | |||||||||||||||||||||||||||||||||
| Number of Hotels | 34 | 34 | 34 | 34 | 34 | 34 | ||||||||||||||||||||||||||||||||
| Number of Rooms | 9,494 | 9,494 | 9,494 | 9,494 | 9,494 | 9,511 | ||||||||||||||||||||||||||||||||
| Occupancy | 41.4 | % | 58.0 | % | 68.5 | % | 72.5 | % | 72.9 | % | 79.3 | % | ||||||||||||||||||||||||||
| ADR | $250.66 | $287.85 | $300.47 | $295.36 | $300.86 | $305.36 | ||||||||||||||||||||||||||||||||
| RevPAR | $103.66 | $166.95 | $205.78 | $214.06 | $219.43 | $242.27 | ||||||||||||||||||||||||||||||||
| Total RevPAR | $160.52 | $249.28 | $306.36 | $311.60 | $322.69 | $350.33 | ||||||||||||||||||||||||||||||||
| 2022 vs 2019 | ||||||||||||||||||||||||||||||||||||||
| Occupancy change in bps | (2,205) bps | (1,623) bps | (1,050) bps | (868) bps | (732) bps | (626) bps | ||||||||||||||||||||||||||||||||
| ADR % change | 22.2 | % | 29.8 | % | 22.3 | % | 18.0 | % | 16.6 | % | 19.6 | % | ||||||||||||||||||||||||||
| RevPAR % change | (20.3) | % | 1.4 | % | 6.0 | % | 5.4 | % | 5.9 | % | 10.8 | % | ||||||||||||||||||||||||||
| Total RevPAR % change | (20.5) | % | (1.3) | % | 7.1 | % | 5.4 | % | 7.8 | % | 10.9 | % | ||||||||||||||||||||||||||
| July 2022 | August 2022 | September 2022 | October 2022 | November 2022 | December 2022 | |||||||||||||||||||||||||||||||||
| Number of Hotels | 34 | 34 | 34 | 34 | 34 | 34 | ||||||||||||||||||||||||||||||||
| Number of Rooms | 9,511 | 9,511 | 9,511 | 9,511 | 9,511 | 9,511 | ||||||||||||||||||||||||||||||||
| Occupancy | 74.9 | % | 74.5 | % | 75.9 | % | 74.9 | % | 66.6 | % | 60.5 | % | ||||||||||||||||||||||||||
| ADR | $288.71 | $263.45 | $299.65 | $310.58 | $273.78 | $285.27 | ||||||||||||||||||||||||||||||||
| RevPAR | $216.29 | $196.34 | $227.40 | $232.50 | $182.29 | $172.73 | ||||||||||||||||||||||||||||||||
| Total RevPAR | $311.60 | $289.52 | $334.77 | $343.91 | $277.96 | $258.55 | ||||||||||||||||||||||||||||||||
| 2022 vs 2019 | ||||||||||||||||||||||||||||||||||||||
| Occupancy change in bps | (744) bps | (681) bps | (383) bps | (657) bps | (864) bps | (821) bps | ||||||||||||||||||||||||||||||||
| ADR % change | 21.7 | % | 15.2 | % | 15.7 | % | 16.9 | % | 19.1 | % | 21.6 | % | ||||||||||||||||||||||||||
| RevPAR % change | 10.7 | % | 5.5 | % | 10.1 | % | 7.5 | % | 5.4 | % | 7.1 | % | ||||||||||||||||||||||||||
| Total RevPAR % change | 12.8 | % | 9.6 | % | 12.7 | % | 8.6 | % | 7.4 | % | 12.2 | % | ||||||||||||||||||||||||||
Hotel Acquisition
On November 21, 2022, the Company purchased the 40-room Lake Austin Spa Resort in Austin, Texas for a net purchase price of $75.8 million. The luxury waterfront, all-inclusive wellness resort has extensive spa services, water sports, dining and experiential activities.
Capital Expenditures
The Company invested approximately $67.7 million in capital improvements at its hotels during the year ended December 31, 2022. Significant projects in 2022 included the following:
4
•Hotel Clio: The Company completed renovations in March 2022 to rebrand the JW Marriott Denver Cherry Creek as the Hotel Clio, a Luxury Collection Hotel.
•Kimpton Hotel Palomar Phoenix: The Company completed a comprehensive rebranding and repositioning of the rooftop bar and pool at the hotel.
The Company expects to spend $100 million to $115 million on capital improvements at its hotels in 2023, which includes the completion of certain projects that commenced in 2022. Significant projects in 2023 include the following:
•Hilton Boston Downtown/Faneuil Hall: The Company commenced a comprehensive renovation in the fourth quarter of 2022 to reposition the hotel as an experiential lifestyle property with completion expected in mid-2023.
•Hilton Burlington Lake Champlain: The Company has commenced a repositioning of the hotel to rebrand it as a Curio Collection hotel. The repositioning is expected to be completed in early 2023 and includes a new restaurant concept by a well-known and award-winning chef.
Credit Facility Refinancing
The Company entered into an amendment and restatement of its existing $750 million credit facility, increasing the total credit facility to $1.2 billion and extending the Company's maturity schedule on September 27, 2022. The credit facility is comprised of a $400 million revolving credit facility, a $300 million term loan with a maturity in January 2026, inclusive of a one-year extension option, and a $500 million term loan maturing in January 2028. The revolving credit facility matures in September 2027, inclusive of two six-month extension options. The facilities bear interest pursuant to a leverage-based pricing grid ranging from 1.35% to 2.25% over the applicable adjusted term SOFR. Based upon the Company's current leverage, the pricing is at the lowest end of the grid.
The Company utilized the proceeds from the term loans to repay the $350 million term loan in the prior facility, the $50 million term loan facility that was scheduled to mature in October 2023 and the $150 million that was outstanding on its revolving credit facility. During the fourth quarter of 2022, the Company utilized the remaining proceeds to repay $178.1 million of mortgage loans encumbering the Salt Lake City Marriott Downtown at City Creek, Westin Washington D.C. City Center, The Lodge at Sonoma Resort and the Westin San Diego Bayview, which were all scheduled to mature in 2023. The Company has no debt maturities until August 2024.
Balance Sheet and Liquidity
The Company ended the year with $589.5 million of liquidity, comprised of $67.6 million of unrestricted corporate cash, $121.9 million of unrestricted cash at its hotels and full capacity on its $400 million senior unsecured credit facility. As of December 31, 2022, the Company had $1.2 billion of total debt outstanding, which consisted of $387.7 million of property-specific, non-recourse mortgage debt and $800.0 million of unsecured term loans.
Share Repurchase Program
On September 29, 2022, the Company's Board of Directors approved a $200 million share repurchase program through February 28, 2025. During the quarter ended December 31, 2022, the Company repurchased 1.6 million shares of its common stock at an average price of $7.81 per share for a total purchase price of $12.3 million. The Company has $187.7 million of remaining authorized capacity under the share repurchase program.
Dividends
The Company declared a quarterly cash dividend of $0.06 per common share, which is comprised of its recurring quarterly dividend of $0.03 per common share and a special dividend of $0.03 per common share. The dividend was paid on January 12, 2023 to shareholders of record as of December 30, 2022.
5
The Company declared a quarterly dividend of $0.515625 per share on its 8.250% Series A Cumulative Redeemable Preferred Stock to shareholders of record as of December 19, 2022. The dividend was paid on December 30, 2022.
Earnings Call
The Company will host a conference call to discuss its fourth quarter results on Tuesday, February 21, 2023, at 10:00 a.m. Eastern Time (ET). The conference call will be accessible by telephone and through the internet. Interested individuals are requested to register for the call by visiting https://investor.drhc.com. A replay of the conference call webcast will be archived and available online.
About the Company
DiamondRock Hospitality Company is a self-advised real estate investment trust (REIT) that is an owner of a leading portfolio of geographically diversified hotels concentrated in leisure destinations and top gateway markets. The Company currently owns 35 premium quality hotels with over 9,600 rooms. The Company has strategically positioned its portfolio to be operated both under leading global brand families as well as independent boutique hotels in the lifestyle segment. For further information on the Company and its portfolio, please visit DiamondRock Hospitality Company’s website at www.drhc.com.
This press release contains forward-looking statements within the meaning of federal securities laws and regulations. These forward-looking statements are identified by their use of terms and phrases such as “believe,” “expect,” “intend,” “project,” “forecast,” “plan” and other similar terms and phrases, including references to assumptions and forecasts of future results. Forward-looking statements are not guarantees of future performance and involve known and unknown risks, uncertainties and other factors which may cause the actual results to differ materially from those anticipated at the time the forward-looking statements are made. These risks include, but are not limited to: the adverse impact of the novel coronavirus (COVID-19) on the U.S., regional and global economies, travel, the hospitality industry, and the financial condition and results of operations of the Company and its hotels; national and local economic and business conditions, including the potential for additional terrorist attacks, that will affect occupancy rates at the Company’s hotels and the demand for hotel products and services; operating risks associated with the hotel business; relationships with property managers; the ability to compete effectively in areas such as access, location, quality of accommodations and room rate structures; changes in travel patterns, taxes and government regulations which influence or determine wages, prices, construction procedures and costs; and other risk factors contained in the Company’s filings with the Securities and Exchange Commission. Although the Company believes the expectations reflected in such forward-looking statements are based upon reasonable assumptions, it can give no assurance that the expectations will be attained or that any deviation will not be material. All information in this release is as of the date of this release, and the Company undertakes no obligation to update any forward-looking statement to conform the statement to actual results or changes in the Company’s expectations.
6
DIAMONDROCK HOSPITALITY COMPANY
CONSOLIDATED BALANCE SHEETS
CONSOLIDATED BALANCE SHEETS
(in thousands, except share and per share amounts)
| December 31, 2022 | December 31, 2021 | ||||||||||
| ASSETS | (unaudited) | ||||||||||
| Property and equipment, net | $ | 2,748,476 | $ | 2,651,444 | |||||||
| Right-of-use assets | 99,047 | 100,212 | |||||||||
| Restricted cash | 39,614 | 36,887 | |||||||||
| Due from hotel managers | 176,708 | 120,671 | |||||||||
| Prepaid and other assets | 76,131 | 17,472 | |||||||||
| Cash and cash equivalents | 67,564 | 38,620 | |||||||||
Total assets | $ | 3,207,540 | $ | 2,965,306 | |||||||
| LIABILITIES AND EQUITY | |||||||||||
| Liabilities: | |||||||||||
| Mortgage and other debt, net of unamortized debt issuance costs | $ | 386,655 | $ | 578,651 | |||||||
| Unsecured term loans, net of unamortized debt issuance costs | 799,138 | 398,572 | |||||||||
| Senior unsecured credit facility | — | 90,000 | |||||||||
| Total debt | 1,185,793 | 1,067,223 | |||||||||
| Lease liabilities | 110,875 | 108,605 | |||||||||
| Due to hotel managers | 123,682 | 85,493 | |||||||||
| Deferred rent | 65,097 | 60,800 | |||||||||
| Unfavorable contract liabilities, net | 61,069 | 62,780 | |||||||||
| Accounts payable and accrued expenses | 43,120 | 51,238 | |||||||||
| Distributions declared and unpaid | 12,946 | — | |||||||||
| Deferred income related to key money, net | 8,780 | 8,203 | |||||||||
Total liabilities | 1,611,362 | 1,444,342 | |||||||||
| Equity: | |||||||||||
| Preferred stock, $0.01 par value; 10,000,000 shares authorized; | |||||||||||
| 8.250% Series A Cumulative Redeemable Preferred Stock (liquidation preference $25.00 per share), 4,760,000 shares issued and outstanding at December 31, 2022 and 2021 | 48 | 48 | |||||||||
| Common stock, $0.01 par value; 400,000,000 shares authorized; 209,374,830 and 210,746,895 shares issued and outstanding at December 31, 2022 and 2021, respectively | 2,094 | 2,107 | |||||||||
| Additional paid-in capital | 2,288,433 | 2,293,990 | |||||||||
| Distributions in excess of earnings | (700,694) | (780,931) | |||||||||
Total stockholders’ equity | 1,589,881 | 1,515,214 | |||||||||
| Noncontrolling interests | 6,297 | 5,750 | |||||||||
Total equity | 1,596,178 | 1,520,964 | |||||||||
Total liabilities and equity | $ | 3,207,540 | $ | 2,965,306 | |||||||
7
DIAMONDROCK HOSPITALITY COMPANY
CONSOLIDATED STATEMENTS OF OPERATIONS
(in thousands, except share and per share amounts)
(unaudited)
| Three Months Ended December 31, | Year Ended December 31, | ||||||||||||||||||||||
| 2022 | 2021 | 2022 | 2021 | ||||||||||||||||||||
Revenues: | |||||||||||||||||||||||
Rooms | $ | 171,080 | $ | 133,004 | $ | 681,269 | $ | 399,055 | |||||||||||||||
Food and beverage | 61,940 | 41,690 | 238,234 | 117,742 | |||||||||||||||||||
Other | 22,035 | 15,240 | 82,000 | 50,337 | |||||||||||||||||||
Total revenues | 255,055 | 189,934 | 1,001,503 | 567,134 | |||||||||||||||||||
Operating Expenses: | |||||||||||||||||||||||
Rooms | 42,688 | 34,447 | 163,062 | 102,183 | |||||||||||||||||||
Food and beverage | 43,703 | 31,704 | 163,622 | 89,795 | |||||||||||||||||||
Other hotel expenses | 79,624 | 73,610 | 313,949 | 240,818 | |||||||||||||||||||
Management fees | 6,410 | 3,694 | 23,439 | 10,208 | |||||||||||||||||||
Franchise fees | 9,471 | 6,472 | 32,683 | 18,665 | |||||||||||||||||||
Depreciation and amortization | 27,752 | 25,754 | 108,849 | 102,963 | |||||||||||||||||||
Impairment losses | — | — | 2,843 | 126,697 | |||||||||||||||||||
Corporate expenses | 9,515 | 8,762 | 31,790 | 32,552 | |||||||||||||||||||
| Business interruption insurance income | — | (705) | (499) | (705) | |||||||||||||||||||
Total operating expenses, net | 219,163 | 183,738 | 839,738 | 723,176 | |||||||||||||||||||
Interest and other expense (income), net | 360 | (487) | 1,404 | (947) | |||||||||||||||||||
Interest expense | 15,417 | 7,797 | 38,283 | 37,043 | |||||||||||||||||||
Loss on early extinguishment of debt | 68 | — | 9,766 | — | |||||||||||||||||||
Total other expenses, net | 15,845 | 7,310 | 49,453 | 36,096 | |||||||||||||||||||
Income (loss) before income taxes | 20,047 | (1,114) | 112,312 | (192,138) | |||||||||||||||||||
Income tax expense | (1,658) | (1,834) | (2,607) | (3,267) | |||||||||||||||||||
Net income (loss) | 18,389 | (2,948) | 109,705 | (195,405) | |||||||||||||||||||
Less: Net (income) loss attributable to noncontrolling interests | (62) | 9 | (377) | 821 | |||||||||||||||||||
Net income (loss) attributable to the Company | 18,327 | (2,939) | 109,328 | (194,584) | |||||||||||||||||||
| Distributions to preferred stockholders | (2,454) | (2,455) | (9,817) | (9,817) | |||||||||||||||||||
| Net income (loss) attributable to common stockholders | $ | 15,873 | $ | (5,394) | $ | 99,511 | $ | (204,401) | |||||||||||||||
Earnings (loss) per share: | |||||||||||||||||||||||
Earnings (loss) per share available to common stockholders - basic | $ | 0.08 | $ | (0.03) | $ | 0.47 | $ | (0.96) | |||||||||||||||
Earnings (loss) per share available to common stockholders - diluted | $ | 0.07 | $ | (0.03) | $ | 0.47 | $ | (0.96) | |||||||||||||||
Weighted-average number of common shares outstanding: | |||||||||||||||||||||||
Basic | 211,497,277 | 212,323,852 | 212,423,873 | 212,056,923 | |||||||||||||||||||
Diluted | 212,439,150 | 212,323,852 | 213,188,987 | 212,056,923 | |||||||||||||||||||
8
Non-GAAP Financial Measures
We use the following non-GAAP financial measures that we believe are useful to investors as key measures of our operating performance: EBITDA, EBITDAre, Adjusted EBITDA, Hotel EBITDA, Hotel Adjusted EBITDA, FFO and Adjusted FFO. These measures should not be considered in isolation or as a substitute for measures of performance in accordance with U.S. GAAP. EBITDA, EBITDAre, Adjusted EBITDA, Hotel EBITDA, Hotel Adjusted EBITDA, FFO and Adjusted FFO, as calculated by us, may not be comparable to other companies that do not define such terms exactly as the Company.
Use and Limitations of Non-GAAP Financial Measures
Our management and Board of Directors use EBITDA, EBITDAre, Adjusted EBITDA, Hotel EBITDA, Hotel Adjusted EBITDA, FFO and Adjusted FFO to evaluate the performance of our hotels and to facilitate comparisons between us and other lodging REITs, hotel owners who are not REITs and other capital intensive companies. The use of these non-GAAP financial measures has certain limitations. These non-GAAP financial measures as presented by us, may not be comparable to non-GAAP financial measures as calculated by other real estate companies. These measures do not reflect certain expenses or expenditures that we incurred and will incur, such as depreciation, interest and capital expenditures. We compensate for these limitations by separately considering the impact of these excluded items to the extent they are material to operating decisions or assessments of our operating performance. Our reconciliations to the most comparable U.S. GAAP financial measures, and our consolidated statements of operations and cash flows, include interest expense, capital expenditures, and other excluded items, all of which should be considered when evaluating our performance, as well as the usefulness of our non-GAAP financial measures.
These non-GAAP financial measures are used in addition to and in conjunction with results presented in accordance with U.S. GAAP. They should not be considered as alternatives to operating profit, cash flow from operations, or any other operating performance measure prescribed by U.S. GAAP. These non-GAAP financial measures reflect additional ways of viewing our operations that we believe, when viewed with our U.S. GAAP results and the reconciliations to the corresponding U.S. GAAP financial measures, provide a more complete understanding of factors and trends affecting our business than could be obtained absent this disclosure. We strongly encourage investors to review our financial information in its entirety and not to rely on a single financial measure.
EBITDA, EBITDAre and FFO
EBITDA represents net income (calculated in accordance with U.S. GAAP) excluding: (1) interest expense; (2) provision for income taxes, including income taxes applicable to sale of assets; and (3) depreciation and amortization. The Company computes EBITDAre in accordance with the National Association of Real Estate Investment Trusts ("Nareit") guidelines, as defined in its September 2017 white paper "Earnings Before Interest, Taxes, Depreciation and Amortization for Real Estate." EBITDAre represents net income (calculated in accordance with U.S. GAAP) adjusted for: (1) interest expense; (2) provision for income taxes, including income taxes applicable to sale of assets; (3) depreciation and amortization; (4) gains or losses on the disposition of depreciated property including gains or losses on change of control; (5) impairment write-downs of depreciated property and of investments in unconsolidated affiliates caused by a decrease in value of depreciated property in the affiliate; and (6) adjustments to reflect the entity's share of EBITDAre of unconsolidated affiliates.
We believe EBITDA and EBITDAre are useful to an investor in evaluating our operating performance because they help investors evaluate and compare the results of our operations from period to period by removing the impact of our capital structure (primarily interest expense) and our asset base (primarily depreciation and amortization, and in the case of EBITDAre, impairment and gains or losses on dispositions of depreciated property) from our operating results. In addition, covenants included in our debt agreements use EBITDA as a measure of financial compliance. We also use EBITDA and EBITDAre as measures in determining the value of hotel acquisitions and dispositions.
The Company computes FFO in accordance with standards established by the Nareit, which defines FFO as net income determined in accordance with U.S. GAAP, excluding gains or losses from sales of properties and impairment losses, plus real estate related depreciation and amortization. The Company believes that the presentation of FFO provides useful information to investors regarding its operating performance because it is a measure of the Company's operations without regard to specified non-cash items, such as real estate related depreciation and amortization and gains or losses on the sale of assets. The Company also uses FFO as one measure in assessing its operating results.
9
Hotel EBITDA
Hotel EBITDA represents net income excluding: (1) interest expense, (2) income taxes, (3) depreciation and amortization, (4) corporate general and administrative expenses (shown as corporate expenses on the consolidated statements of operations), and (5) hotel acquisition costs. We believe that Hotel EBITDA provides our investors a useful financial measure to evaluate our hotel operating performance, excluding the impact of our capital structure (primarily interest), our asset base (primarily depreciation and amortization), and our corporate-level expenses (corporate expenses and hotel acquisition costs). With respect to Hotel EBITDA, we believe that excluding the effect of corporate-level expenses provides a more complete understanding of the operating results over which individual hotels and third-party management companies have direct control. We believe property-level results provide investors with supplemental information on the ongoing operational performance of our hotels and effectiveness of the third-party management companies operating our business on a property-level basis.
Adjustments to EBITDAre, FFO and Hotel EBITDA
We adjust EBITDAre, FFO and Hotel EBITDA when evaluating our performance because we believe that the exclusion of certain additional items described below provides useful supplemental information to investors regarding our ongoing operating performance and that the presentation of Adjusted EBITDA, Adjusted FFO and Hotel Adjusted EBITDA when combined with U.S. GAAP net income, EBITDAre, FFO and Hotel EBITDA, is beneficial to an investor's complete understanding of our consolidated and property-level operating performance. Hotel Adjusted EBITDA margins are calculated as Hotel Adjusted EBITDA divided by total hotel revenues. We adjust EBITDAre, FFO and Hotel EBITDA for the following items:
•Non-Cash Lease Expense and Other Amortization: We exclude the non-cash expense incurred from the straight line recognition of expense from our ground leases and other contractual obligations and the non-cash amortization of our favorable and unfavorable contracts, originally recorded in conjunction with certain hotel acquisitions. We exclude these non-cash items because they do not reflect the actual cash amounts due to the respective lessors and service providers in the current period and they are of lesser significance in evaluating our actual performance for that period.
•Cumulative Effect of a Change in Accounting Principle: The Financial Accounting Standards Board promulgates new accounting standards that require or permit the consolidated statement of operations to reflect the cumulative effect of a change in accounting principle. We exclude the effect of these adjustments, which include the accounting impact from prior periods, because they do not reflect the Company’s actual underlying performance for the current period.
•Gains or Losses from Early Extinguishment of Debt: We exclude the effect of gains or losses recorded on the early extinguishment of debt because these gains or losses result from transaction activity related to the Company’s capital structure that we believe are not indicative of the ongoing operating performance of the Company or our hotels.
•Hotel Acquisition Costs: We exclude hotel acquisition costs expensed during the period because we believe these transaction costs are not reflective of the ongoing performance of the Company or our hotels.
•Severance Costs: We exclude corporate severance costs, or reversals thereof, incurred with the termination of corporate-level employees and severance costs incurred at our hotels related to lease terminations or structured severance programs because we believe these costs do not reflect the ongoing performance of the Company or our hotels.
•Hotel Manager Transition Items: We exclude the transition items associated with a change in hotel manager because we believe these items do not reflect the ongoing performance of the Company or our hotels.
•Other Items: From time to time we incur costs or realize gains that we consider outside the ordinary course of business and that we do not believe reflect the ongoing performance of the Company or our hotels. Such items may include, but are not limited to, the following: pre-opening costs incurred with newly developed hotels; lease preparation costs incurred to prepare vacant space for marketing; management or franchise contract termination fees; gains or losses from legal settlements; costs incurred related to natural disasters; and gains on property insurance claim settlements, other than income related to business interruption insurance.
In addition, to derive Adjusted FFO we exclude any fair value adjustments to interest rate swaps. We exclude these non-cash amounts because they do not reflect the underlying performance of the Company.
10
Reconciliations of Non-GAAP Measures
EBITDA, EBITDAre and Adjusted EBITDA
The following tables are reconciliations of our GAAP net income to EBITDA, EBITDAre and Adjusted EBITDA (in thousands):
| Three Months Ended December 31, | |||||||||||||||||||||||||||||
| 2022 | 2021 | 2019 | |||||||||||||||||||||||||||
| Net income (loss) | $ | 18,389 | $ | (2,948) | $ | 134,583 | |||||||||||||||||||||||
| Interest expense | 15,417 | 7,797 | 8,320 | ||||||||||||||||||||||||||
| Income tax expense | 1,658 | 1,834 | 20,089 | ||||||||||||||||||||||||||
| Real estate related depreciation and amortization | 27,752 | 25,754 | 30,305 | ||||||||||||||||||||||||||
| EBITDA | 63,216 | 32,437 | 193,297 | ||||||||||||||||||||||||||
Loss on sale of hotel properties (1) | 1,659 | — | — | ||||||||||||||||||||||||||
EBITDAre | 64,875 | 32,437 | 193,297 | ||||||||||||||||||||||||||
| Non-cash lease expense and other amortization | 1,551 | 1,666 | 1,765 | ||||||||||||||||||||||||||
Professional fees and pre-opening costs related to Frenchman's Reef (2) | — | — | 9,079 | ||||||||||||||||||||||||||
| Gain on property insurance settlement | — | — | (144,192) | ||||||||||||||||||||||||||
| Hotel manager transition items | 916 | — | 2,708 | ||||||||||||||||||||||||||
| Uninsured costs related to natural disasters | — | 111 | — | ||||||||||||||||||||||||||
| Loss on early extinguishment of debt | 68 | — | — | ||||||||||||||||||||||||||
Severance costs (3) | — | 179 | — | ||||||||||||||||||||||||||
| Adjusted EBITDA | $ | 67,410 | $ | 34,393 | $ | 62,657 | |||||||||||||||||||||||
| Year Ended December 31, | |||||||||||||||||||||||||||||
| 2022 | 2021 | 2019 | |||||||||||||||||||||||||||
| Net income (loss) | $ | 109,705 | $ | (195,405) | $ | 184,211 | |||||||||||||||||||||||
| Interest expense | 38,283 | 37,043 | 46,584 | ||||||||||||||||||||||||||
| Income tax expense | 2,607 | 3,267 | 22,028 | ||||||||||||||||||||||||||
| Real estate related depreciation and amortization | 108,849 | 102,963 | 118,110 | ||||||||||||||||||||||||||
| EBITDA | 259,444 | (52,132) | 370,933 | ||||||||||||||||||||||||||
| Impairment losses | 2,843 | 126,697 | — | ||||||||||||||||||||||||||
Loss on sale of hotel properties (1) | 1,659 | — | — | ||||||||||||||||||||||||||
EBITDAre | 263,946 | 74,565 | 370,933 | ||||||||||||||||||||||||||
| Non-cash lease expense and other amortization | 6,226 | 6,673 | 7,013 | ||||||||||||||||||||||||||
Professional fees and pre-opening costs related to Frenchman's Reef (2) | — | 1,388 | 20,524 | ||||||||||||||||||||||||||
| Uninsured costs related to natural disasters | — | 298 | — | ||||||||||||||||||||||||||
| Gain on property insurance settlement | — | — | (144,192) | ||||||||||||||||||||||||||
| Loss on early extinguishment of debt | 9,766 | — | 2,373 | ||||||||||||||||||||||||||
Severance costs (3) | (532) | (37) | — | ||||||||||||||||||||||||||
| Hotel manager transition items | 1,164 | 651 | 3,758 | ||||||||||||||||||||||||||
| Adjusted EBITDA | $ | 280,570 | $ | 83,538 | $ | 260,409 | |||||||||||||||||||||||
(1)During the year ended December 31, 2022, we recognized an incremental loss of $1.7 million due to post-closing adjustments related to hotels sold in 2021.
(2)Represents pre-opening costs related to the re-opening of Frenchman's Reef, as well as legal and professional fees and other costs incurred at Frenchman's Reef as a result of Hurricane Irma that are not covered by insurance.
(3)Consists of severance costs incurred, and adjustments thereto, associated with the elimination of positions at our hotels, which are classified within other hotel expenses on the consolidated statement of operations.
11
Hotel EBITDA and Hotel Adjusted EBITDA
The following table is a reconciliation of our GAAP net income to Hotel EBITDA and Hotel Adjusted EBITDA (in thousands):
| Three Months Ended December 31, | |||||||||||||||||||||||||||||
| 2022 | 2021 | 2019 | |||||||||||||||||||||||||||
| Net income (loss) | $ | 18,389 | $ | (2,948) | $ | 134,583 | |||||||||||||||||||||||
| Interest expense | 15,417 | 7,797 | 8,320 | ||||||||||||||||||||||||||
| Income tax expense | 1,658 | 1,834 | 20,089 | ||||||||||||||||||||||||||
| Real estate related depreciation and amortization | 27,752 | 25,754 | 30,305 | ||||||||||||||||||||||||||
| EBITDA | 63,216 | 32,437 | 193,297 | ||||||||||||||||||||||||||
| Corporate expenses | 9,515 | 8,762 | 7,446 | ||||||||||||||||||||||||||
| Interest and other income, net | (1,299) | (487) | (687) | ||||||||||||||||||||||||||
| Uninsured costs related to natural disasters | — | 111 | — | ||||||||||||||||||||||||||
Professional fees and pre-opening costs related to Frenchman's Reef (1) | — | — | 9,079 | ||||||||||||||||||||||||||
| Loss on early extinguishment of debt | 68 | — | — | ||||||||||||||||||||||||||
Loss on sale of hotel properties (2) | 1,659 | — | — | ||||||||||||||||||||||||||
| Gain on property insurance settlement | — | — | (144,192) | ||||||||||||||||||||||||||
| Hotel EBITDA | 73,159 | 40,823 | 64,943 | ||||||||||||||||||||||||||
| Non-cash lease expense and other amortization | 1,551 | 1,666 | 1,765 | ||||||||||||||||||||||||||
| Hotel manager transition items | 916 | — | 2,708 | ||||||||||||||||||||||||||
Severance costs (3) | — | 179 | — | ||||||||||||||||||||||||||
| Hotel Adjusted EBITDA | $ | 75,626 | $ | 42,668 | $ | 69,416 | |||||||||||||||||||||||
| Year Ended December 31, | |||||||||||||||||||||||||||||
| 2022 | 2021 | 2019 | |||||||||||||||||||||||||||
| Net income (loss) | $ | 109,705 | $ | (195,405) | $ | 184,211 | |||||||||||||||||||||||
| Interest expense | 38,283 | 37,043 | 46,584 | ||||||||||||||||||||||||||
| Income tax expense | 2,607 | 3,267 | 22,028 | ||||||||||||||||||||||||||
| Real estate related depreciation and amortization | 108,849 | 102,963 | 118,110 | ||||||||||||||||||||||||||
| EBITDA | 259,444 | (52,132) | 370,933 | ||||||||||||||||||||||||||
| Corporate expenses | 31,790 | 32,552 | 28,231 | ||||||||||||||||||||||||||
| Interest and other income, net | (255) | (947) | (1,197) | ||||||||||||||||||||||||||
| Uninsured costs related to natural disasters | — | 298 | — | ||||||||||||||||||||||||||
| Loss on early extinguishment of debt | 9,766 | — | 2,373 | ||||||||||||||||||||||||||
Professional fees and pre-opening costs related to Frenchman's Reef (1) | — | 1,388 | 20,524 | ||||||||||||||||||||||||||
| Impairment losses | 2,843 | 126,697 | — | ||||||||||||||||||||||||||
Loss on sale of hotel properties (2) | 1,659 | — | — | ||||||||||||||||||||||||||
| Gain on property insurance settlement | — | — | (144,192) | ||||||||||||||||||||||||||
| Hotel EBITDA | 305,247 | 107,856 | 276,672 | ||||||||||||||||||||||||||
| Non-cash lease expense and other amortization | 6,226 | 6,673 | 7,013 | ||||||||||||||||||||||||||
| Hotel manager transition items | 1,164 | 651 | 3,758 | ||||||||||||||||||||||||||
Severance costs (2) | (532) | (37) | — | ||||||||||||||||||||||||||
| Hotel Adjusted EBITDA | $ | 312,105 | $ | 115,143 | $ | 287,443 | |||||||||||||||||||||||
(1)Represents pre-opening costs related to the re-opening of Frenchman's Reef, as well as legal and professional fees and other costs incurred at Frenchman's Reef as a result of Hurricane Irma that are not covered by insurance.
(2)During the year ended December 31, 2022, we recognized an incremental loss of $1.7 million due to post-closing adjustments related to hotels sold in 2021.
(3)Consists of severance costs incurred, or adjustments thereto, associated with the elimination of positions at our hotels, which are classified within other hotel expenses on the consolidated statement of operations.
12
FFO and Adjusted FFO
The following tables are reconciliations of our GAAP net income to FFO and Adjusted FFO (in thousands):
| Three Months Ended December 31, | |||||||||||||||||||||||||||||
| 2022 | 2021 | 2019 | |||||||||||||||||||||||||||
| Net income (loss) | $ | 18,389 | $ | (2,948) | $ | 134,583 | |||||||||||||||||||||||
| Real estate related depreciation and amortization | 27,752 | 25,754 | 30,305 | ||||||||||||||||||||||||||
Loss on sale of hotel properties (1) | 1,659 | — | — | ||||||||||||||||||||||||||
| FFO | 47,800 | 22,806 | 164,888 | ||||||||||||||||||||||||||
| Distribution to preferred stockholders | (2,454) | (2,455) | — | ||||||||||||||||||||||||||
| FFO available to common stock and unit holders | 45,346 | 20,351 | 164,888 | ||||||||||||||||||||||||||
| Non-cash lease expense and other amortization | 1,551 | 1,666 | 1,765 | ||||||||||||||||||||||||||
| Uninsured costs related to natural disasters | — | 111 | — | ||||||||||||||||||||||||||
Professional fees and pre-opening costs related to Frenchman's Reef (2) | — | — | 9,079 | ||||||||||||||||||||||||||
| Gain on property insurance settlement, net of income tax | — | — | (121,525) | ||||||||||||||||||||||||||
| Loss on early extinguishment of debt | 68 | — | — | ||||||||||||||||||||||||||
Severance costs (3) | — | 179 | — | ||||||||||||||||||||||||||
| Hotel manager transition items | 916 | — | 2,708 | ||||||||||||||||||||||||||
| Fair value adjustments to interest rate swaps | 88 | (3,202) | (2,245) | ||||||||||||||||||||||||||
| Adjusted FFO available to common stock and unit holders | $ | 47,969 | $ | 19,105 | $ | 54,670 | |||||||||||||||||||||||
| Adjusted FFO available to common stock and unit holders, per diluted share | $ | 0.23 | $ | 0.09 | $ | 0.27 | |||||||||||||||||||||||
| Year Ended December 31, | |||||||||||||||||||||||||||||
| 2022 | 2021 | 2019 | |||||||||||||||||||||||||||
| Net income (loss) | $ | 109,705 | $ | (195,405) | $ | 184,211 | |||||||||||||||||||||||
| Real estate related depreciation and amortization | 108,849 | 102,963 | 118,110 | ||||||||||||||||||||||||||
| Impairment losses, net of tax | 2,843 | 127,282 | — | ||||||||||||||||||||||||||
Loss on sale of hotel properties (1) | 1,659 | — | — | ||||||||||||||||||||||||||
| FFO | 223,056 | 34,840 | 302,321 | ||||||||||||||||||||||||||
| Distribution to preferred stockholders | (9,817) | (9,817) | — | ||||||||||||||||||||||||||
| FFO available to common stock and unit holders | 213,239 | 25,023 | 302,321 | ||||||||||||||||||||||||||
| Non-cash lease expense and other amortization | 6,226 | 6,673 | 7,013 | ||||||||||||||||||||||||||
| Uninsured costs related to natural disasters | — | 298 | — | ||||||||||||||||||||||||||
Professional fees and pre-opening costs related to Frenchman's Reef (2) | — | 1,388 | 20,524 | ||||||||||||||||||||||||||
| Hotel manager transition items | 1,164 | 651 | 3,758 | ||||||||||||||||||||||||||
| Gain on property insurance settlement, net of income tax | — | — | (121,525) | ||||||||||||||||||||||||||
| Loss on early extinguishment of debt | 9,766 | — | 2,373 | ||||||||||||||||||||||||||
Severance costs (3) | (532) | (37) | — | ||||||||||||||||||||||||||
| Fair value adjustments to interest rate swaps | (13,914) | (7,690) | 2,545 | ||||||||||||||||||||||||||
| Adjusted FFO available to common stock and unit holders | $ | 215,949 | $ | 26,306 | $ | 217,009 | |||||||||||||||||||||||
| Adjusted FFO available to common stock and unit holders, per diluted share | $ | 1.01 | $ | 0.12 | $ | 1.07 | |||||||||||||||||||||||
(1)During the year ended December 31, 2022, we recognized an incremental loss of $1.7 million due to post-closing adjustments related to hotels sold in 2021.
(2)Represents pre-opening costs related to the re-opening of Frenchman's Reef, as well as legal and professional fees and other costs incurred at Frenchman's Reef as a result of Hurricane Irma that are not covered by insurance.
(3)Consists of severance costs incurred, or adjustments thereto, associated with the elimination of positions at our hotels, which are classified within other hotel expenses on the consolidated statement of operations.
13
Reconciliation of Comparable Operating Results
The following presents the revenues, Hotel Adjusted EBITDA and Hotel Adjusted EBITDA Margin together with comparable prior year results, which excludes the results for our 2021 dispositions (in thousands):
| Three Months Ended December 31, | ||||||||||||||||||||||||||
| 2022 | 2021 | 2019 | ||||||||||||||||||||||||
| Revenues | $ | 255,055 | $ | 189,934 | $ | 237,519 | ||||||||||||||||||||
Hotel revenues from prior ownership (1) | 1,883 | 19,587 | 18,067 | |||||||||||||||||||||||
Hotel revenues from sold hotels (2) | — | — | (21,013) | |||||||||||||||||||||||
| Comparable Revenues | $ | 256,938 | $ | 209,521 | $ | 234,573 | ||||||||||||||||||||
| Hotel Adjusted EBITDA | $ | 75,626 | $ | 42,668 | $ | 69,416 | ||||||||||||||||||||
Hotel Adjusted EBITDA from prior ownership (1) | 1,355 | 4,923 | 2,511 | |||||||||||||||||||||||
Hotel Adjusted EBITDA from sold hotels (2) | — | 12 | (6,148) | |||||||||||||||||||||||
| Comparable Hotel Adjusted EBITDA | $ | 76,981 | $ | 47,603 | $ | 65,779 | ||||||||||||||||||||
| Hotel Adjusted EBITDA Margin | 29.65 | % | 22.46 | % | 29.23 | % | ||||||||||||||||||||
| Comparable Hotel Adjusted EBITDA Margin | 29.96 | % | 22.72 | % | 28.04 | % | ||||||||||||||||||||
| Year Ended December 31, | ||||||||||||||||||||||||||
| 2022 | 2021 | 2019 | ||||||||||||||||||||||||
| Revenues | $ | 1,001,503 | $ | 567,134 | $ | 938,091 | ||||||||||||||||||||
Hotel revenues from prior ownership (1) | 18,344 | 91,544 | 84,130 | |||||||||||||||||||||||
Hotel revenues from sold hotels (2) | — | (60) | (68,886) | |||||||||||||||||||||||
| Comparable Revenues | $ | 1,019,847 | $ | 658,618 | $ | 953,335 | ||||||||||||||||||||
| Hotel Adjusted EBITDA | $ | 312,105 | $ | 115,143 | $ | 287,443 | ||||||||||||||||||||
Hotel Adjusted EBITDA from prior ownership (1) | 7,733 | 24,323 | 17,885 | |||||||||||||||||||||||
Hotel Adjusted EBITDA from sold hotels (2) | — | 4,675 | (23,904) | |||||||||||||||||||||||
| Comparable Hotel Adjusted EBITDA | $ | 319,838 | $ | 144,141 | $ | 281,424 | ||||||||||||||||||||
| Hotel Adjusted EBITDA Margin | 31.16 | % | 20.30 | % | 30.64 | % | ||||||||||||||||||||
| Comparable Hotel Adjusted EBITDA Margin | 31.36 | % | 21.89 | % | 29.52 | % | ||||||||||||||||||||
(1) Amounts represent the pre-acquisition operating results for Bourbon Orleans Hotel from January 1, 2019 to July 28, 2021, Henderson Park Inn from January 1, 2019 to July 29, 2021, Henderson Beach Resort from January 1, 2019 to December 22, 2021, Tranquility Bay Beachfront Resort from January 1, 2019 to January 5, 2022 and Lake Austin Spa Resort from January 1, 2019 to November 20, 2022. The pre-acquisition operating results of the Kimpton Fort Lauderdale Beach Resort are excluded from all periods as the hotel opened in April 2021. The pre-acquisition operating results were obtained from the sellers of the hotels during the acquisition due diligence process. We have made no adjustments to the amounts provided to us by the seller. The pre-acquisition operating results were not audited or reviewed by the Company's independent auditors.
(2) Amounts represent the operating results of Frenchman's Reef and The Lexington Hotel.
14
Selected Quarterly Comparable Operating Information
The following tables are presented to provide investors with selected quarterly comparable operating information. The operating information includes historical quarterly operating results for our portfolio, excluding the Kimpton Fort Lauderdale Beach Resort as the hotel opened in April 2021.
| Quarter 1, 2019 | Quarter 2, 2019 | Quarter 3, 2019 | Quarter 4, 2019 | Full Year 2019 | |||||||||||||
| ADR | $ | 225.75 | $ | 254.63 | $ | 241.37 | $ | 244.35 | $ | 242.03 | |||||||
| Occupancy | 72.1 | % | 82.3 | % | 81.2 | % | 75.1 | % | 77.7 | % | |||||||
| RevPAR | $ | 162.86 | $ | 209.59 | $ | 195.88 | $ | 183.60 | $ | 188.07 | |||||||
| Total RevPAR | $ | 246.70 | $ | 306.75 | $ | 278.99 | $ | 268.73 | $ | 275.36 | |||||||
| Revenues (in thousands) | $ | 210,503 | $ | 264,731 | $ | 243,528 | $ | 234,573 | $ | 953,335 | |||||||
| Hotel Adjusted EBITDA (in thousands) | $ | 51,767 | $ | 90,392 | $ | 73,486 | $ | 65,779 | $ | 281,424 | |||||||
| Hotel Adjusted EBITDA Margin | 24.59 | % | 34.14 | % | 30.18 | % | 28.04 | % | 29.52 | % | |||||||
| Available Rooms | 853,274 | 863,014 | 872,896 | 872,896 | 3,462,080 | ||||||||||||
| Quarter 1, 2021 | Quarter 2, 2021 | Quarter 3, 2021 | Quarter 4, 2021 | Full Year 2021 | |||||||||||||
| ADR | $ | 240.56 | $ | 247.43 | $ | 254.06 | $ | 270.21 | $ | 255.40 | |||||||
| Occupancy | 29.7 | % | 49.4 | % | 65.5 | % | 61.2 | % | 51.6 | % | |||||||
| RevPAR | $ | 71.39 | $ | 122.34 | $ | 166.31 | $ | 165.47 | $ | 131.74 | |||||||
| Total RevPAR | $ | 104.84 | $ | 178.55 | $ | 235.13 | $ | 239.93 | $ | 190.11 | |||||||
| Revenues (in thousands) | $ | 89,542 | $ | 154,224 | $ | 205,331 | $ | 209,521 | $ | 658,618 | |||||||
| Hotel Adjusted EBITDA (in thousands) | $ | 2,265 | $ | 38,601 | $ | 55,672 | $ | 47,603 | $ | 144,141 | |||||||
| Hotel Adjusted EBITDA Margin | 2.53 | % | 25.03 | % | 27.11 | % | 22.72 | % | 21.89 | % | |||||||
| Available Rooms | 854,100 | 863,743 | 873,264 | 873,264 | 3,464,371 | ||||||||||||
| Quarter 1, 2022 | Quarter 2, 2022 | Quarter 3, 2022 | Quarter 4, 2022 | Full Year 2022 | |||||||||||||||||||||||||
| ADR | $ | 283.70 | $ | 300.68 | $ | 283.87 | $ | 291.05 | $ | 290.21 | |||||||||||||||||||
| Occupancy | 55.9 | % | 74.9 | % | 75.1 | % | 67.3 | % | 68.4 | % | |||||||||||||||||||
| RevPAR | $ | 158.52 | $ | 225.19 | $ | 213.19 | $ | 195.99 | $ | 198.37 | |||||||||||||||||||
| Total RevPAR | $ | 238.37 | $ | 331.56 | $ | 311.71 | $ | 293.64 | $ | 294.03 | |||||||||||||||||||
| Revenues (in thousands) | $ | 203,672 | $ | 286,578 | $ | 272,659 | $ | 256,938 | $ | 1,019,847 | |||||||||||||||||||
| Hotel Adjusted EBITDA (in thousands) | $ | 53,399 | $ | 103,654 | $ | 85,804 | $ | 76,981 | $ | 319,838 | |||||||||||||||||||
| Hotel Adjusted EBITDA Margin | 26.22 | % | 36.17 | % | 31.47 | % | 29.96 | % | 31.36 | % | |||||||||||||||||||
| Available Rooms | 854,442 | 864,323 | 874,702 | 875,012 | 3,468,479 | ||||||||||||||||||||||||
15
| Market Capitalization as of December 31, 2022 | ||||||||
| (in thousands) | ||||||||
| Enterprise Value | ||||||||
| Common equity capitalization (at December 31, 2022 closing price of $8.19/share) | $ | 1,748,628 | ||||||
| Preferred equity capitalization (at liquidation value of $25.00/share) | 119,000 | |||||||
| Consolidated debt (face amount) | 1,187,734 | |||||||
| Cash and cash equivalents | (67,564) | |||||||
Total enterprise value | $ | 2,987,798 | ||||||
| Share Reconciliation | ||||||||
| Common shares outstanding | 209,375 | |||||||
| Operating partnership units | 818 | |||||||
| Unvested restricted stock held by management and employees | 1,357 | |||||||
| Share grants under deferred compensation plan | 1,958 | |||||||
| Combined shares and units | 213,508 | |||||||
| Debt Summary as of December 31, 2022 | ||||||||||||||||||||||||||
| (dollars in thousands) | ||||||||||||||||||||||||||
| Loan | Interest Rate | Term | Outstanding Principal | Maturity | ||||||||||||||||||||||
| Courtyard New York Manhattan / Midtown East | 4.40% | Fixed | 76,153 | August 2024 | ||||||||||||||||||||||
| Worthington Renaissance Fort Worth Hotel | 3.66% | Fixed | 75,625 | May 2025 | ||||||||||||||||||||||
| Hotel Clio | 4.33% | Fixed | 57,469 | July 2025 | ||||||||||||||||||||||
| Westin Boston Seaport District | 4.36% | Fixed | 178,487 | November 2025 | ||||||||||||||||||||||
| Unamortized debt issuance costs | (1,079) | |||||||||||||||||||||||||
| Total mortgage debt, net of unamortized debt issuance costs | 386,655 | |||||||||||||||||||||||||
| Unsecured term loan | SOFR + 1.35% | Variable | 500,000 | January 2028 | ||||||||||||||||||||||
| Unsecured term loan | SOFR + 1.35% | Variable | 300,000 | January 2025 (1) | ||||||||||||||||||||||
| Unamortized debt issuance costs | (862) | |||||||||||||||||||||||||
| Unsecured term loans, net of unamortized debt issuance costs | 799,138 | |||||||||||||||||||||||||
| Senior unsecured credit facility | SOFR + 1.40% | Variable | — | September 2026 (1) | ||||||||||||||||||||||
| Total debt, net of unamortized debt issuance costs | $ | 1,185,793 | ||||||||||||||||||||||||
| Weighted-average interest rate of fixed rate debt | 3.87% | |||||||||||||||||||||||||
Total weighted-average interest rate (2) | 4.83% | |||||||||||||||||||||||||
(1) May be extended for an additional year upon the payment of applicable fees and the satisfaction of certain customary conditions.
(2) Weighted-average interest rate includes effect of interest rate swaps.
16
Monthly Operating Statistics (1) | |||||||||||||||||||||||||||||||||||||||||||||||||||||
| Number of Rooms | ADR | Occupancy | RevPAR | ||||||||||||||||||||||||||||||||||||||||||||||||||
| October 2022 | October 2021 | B/(W) 2021 | October 2022 | October 2021 | B/(W) 2021 | October 2022 | October 2021 | B/(W) 2021 | |||||||||||||||||||||||||||||||||||||||||||||
| Total - 34 Hotels | 9,511 | $ | 310.58 | $ | 276.43 | 12.4 | % | 74.9 | % | 66.9 | % | 8.0 | % | $ | 232.50 | $ | 184.85 | 25.8 | % | ||||||||||||||||||||||||||||||||||
| Resort/Lifestyle - 21 Hotels | 3,696 | $ | 378.06 | $ | 369.83 | 2.2 | % | 70.0 | % | 67.4 | % | 2.6 | % | $ | 264.53 | $ | 249.10 | 6.2 | % | ||||||||||||||||||||||||||||||||||
| Number of Rooms | October 2022 | October 2019 | B/(W) 2019 | October 2022 | October 2019 | B/(W) 2019 | October 2022 | October 2019 | B/(W) 2019 | ||||||||||||||||||||||||||||||||||||||||||||
| Total - 34 Hotels | 9,511 | $ | 310.58 | $ | 265.57 | 16.9 | % | 74.9 | % | 81.4 | % | (6.5) | % | $ | 232.50 | $ | 216.26 | 7.5 | % | ||||||||||||||||||||||||||||||||||
| Resort/Lifestyle - 21 Hotels | 3,696 | $ | 378.06 | $ | 281.15 | 34.5 | % | 70.0 | % | 74.1 | % | (4.1) | % | $ | 264.53 | $ | 208.20 | 27.1 | % | ||||||||||||||||||||||||||||||||||
| Number of Rooms | November 2022 | November 2021 | B/(W) 2021 | November 2022 | November 2021 | B/(W) 2021 | November 2022 | November 2021 | B/(W) 2021 | ||||||||||||||||||||||||||||||||||||||||||||
| Total - 34 Hotels | 9,511 | $ | 273.78 | $ | 249.02 | 9.9 | % | 66.6 | % | 60.4 | % | 6.2 | % | $ | 182.29 | $ | 150.42 | 21.2 | % | ||||||||||||||||||||||||||||||||||
| Resort/Lifestyle - 21 Hotels | 3,696 | $ | 333.89 | $ | 336.22 | (0.7) | % | 62.3 | % | 62.1 | % | 0.2 | % | $ | 207.98 | $ | 208.84 | (0.4) | % | ||||||||||||||||||||||||||||||||||
| Number of Rooms | November 2022 | November 2019 | B/(W) 2019 | November 2022 | November 2019 | B/(W) 2019 | November 2022 | November 2019 | B/(W) 2019 | ||||||||||||||||||||||||||||||||||||||||||||
| Total - 34 Hotels | 9,511 | $ | 273.78 | $ | 229.90 | 19.1 | % | 66.6 | % | 75.2 | % | (8.6) | % | $ | 182.29 | $ | 172.94 | 5.4 | % | ||||||||||||||||||||||||||||||||||
| Resort/Lifestyle - 21 Hotels | 3,696 | $ | 333.89 | $ | 251.37 | 32.8 | % | 62.3 | % | 73.0 | % | (10.7) | % | $ | 207.98 | $ | 183.62 | 13.3 | % | ||||||||||||||||||||||||||||||||||
| Number of Rooms | December 2022 | December 2021 | B/(W) 2021 | December 2022 | December 2021 | B/(W) 2021 | December 2022 | December 2021 | B/(W) 2021 | ||||||||||||||||||||||||||||||||||||||||||||
| Total - 34 Hotels | 9,511 | $ | 285.27 | $ | 284.81 | 0.2 | % | 60.5 | % | 56.4 | % | 4.1 | % | $ | 172.73 | $ | 160.65 | 7.5 | % | ||||||||||||||||||||||||||||||||||
| Resort/Lifestyle - 21 Hotels | 3,696 | $ | 376.14 | $ | 391.68 | (4.0) | % | 61.0 | % | 64.5 | % | (3.5) | % | $ | 229.48 | $ | 252.65 | (9.2) | % | ||||||||||||||||||||||||||||||||||
| Number of Rooms | December 2022 | December 2019 | B/(W) 2019 | December 2022 | December 2019 | B/(W) 2019 | December 2022 | December 2019 | B/(W) 2019 | ||||||||||||||||||||||||||||||||||||||||||||
| Total - 34 Hotels | 9,511 | $ | 285.27 | $ | 234.53 | 21.6 | % | 60.5 | % | 68.8 | % | (8.3) | % | $ | 172.73 | $ | 161.27 | 7.1 | % | ||||||||||||||||||||||||||||||||||
| Resort/Lifestyle - 21 Hotels | 3,696 | $ | 376.14 | $ | 280.73 | 34.0 | % | 61.0 | % | 69.9 | % | (8.9) | % | $ | 229.48 | $ | 196.16 | 17.0 | % | ||||||||||||||||||||||||||||||||||
(1) All periods presented include the pre-acquisition operating results of hotels acquired in 2021 and 2022 and excludes the Kimpton Fort Lauderdale Beach Resort as the hotel opened during 2021.
17
| Operating Statistics – Fourth Quarter | |||||||||||||||||||||||||||||||||||||||||||||||||||||
| Number of Rooms | ADR | Occupancy | RevPAR | ||||||||||||||||||||||||||||||||||||||||||||||||||
| 4Q 2022 | 4Q 2021 | B/(W) 2021 | 4Q 2022 | 4Q 2021 | B/(W) 2021 | 4Q 2022 | 4Q 2021 | B/(W) 2021 | |||||||||||||||||||||||||||||||||||||||||||||
| Atlanta Marriott Alpharetta | 318 | $ | 148.40 | $ | 127.04 | 16.8 | % | 59.5 | % | 43.9 | % | 15.6 | % | $ | 88.25 | $ | 55.71 | 58.4 | % | ||||||||||||||||||||||||||||||||||
| Bourbon Orleans Hotel | 220 | $ | 248.34 | $ | 240.42 | 3.3 | % | 85.5 | % | 54.9 | % | 30.6 | % | $ | 212.25 | $ | 132.04 | 60.7 | % | ||||||||||||||||||||||||||||||||||
| Cavallo Point, The Lodge at the Golden Gate | 142 | $ | 657.57 | $ | 688.59 | (4.5) | % | 49.6 | % | 58.1 | % | (8.5) | % | $ | 326.02 | $ | 400.33 | (18.6) | % | ||||||||||||||||||||||||||||||||||
| Chicago Marriott Downtown Magnificent Mile | 1,200 | $ | 244.72 | $ | 201.94 | 21.2 | % | 56.5 | % | 49.2 | % | 7.3 | % | $ | 138.33 | $ | 99.41 | 39.2 | % | ||||||||||||||||||||||||||||||||||
| Courtyard Denver Downtown | 177 | $ | 193.56 | $ | 167.00 | 15.9 | % | 71.5 | % | 61.5 | % | 10.0 | % | $ | 138.40 | $ | 102.73 | 34.7 | % | ||||||||||||||||||||||||||||||||||
| Courtyard New York Manhattan/Fifth Avenue | 189 | $ | 349.45 | $ | 251.62 | 38.9 | % | 97.3 | % | 94.1 | % | 3.2 | % | $ | 339.90 | $ | 236.81 | 43.5 | % | ||||||||||||||||||||||||||||||||||
| Courtyard New York Manhattan/Midtown East | 321 | $ | 402.88 | $ | 285.50 | 41.1 | % | 91.3 | % | 81.3 | % | 10.0 | % | $ | 368.00 | $ | 232.12 | 58.5 | % | ||||||||||||||||||||||||||||||||||
| Embassy Suites by Hilton Bethesda | 272 | $ | 142.39 | $ | 118.24 | 20.4 | % | 62.1 | % | 46.3 | % | 15.8 | % | $ | 88.41 | $ | 54.70 | 61.6 | % | ||||||||||||||||||||||||||||||||||
| Havana Cabana Key West | 106 | $ | 293.06 | $ | 290.90 | 0.7 | % | 77.5 | % | 87.5 | % | (10.0) | % | $ | 227.07 | $ | 254.45 | (10.8) | % | ||||||||||||||||||||||||||||||||||
| Henderson Beach Resort | 233 | $ | 369.73 | $ | 382.14 | (3.2) | % | 39.4 | % | 50.4 | % | (11.0) | % | $ | 145.78 | $ | 192.43 | (24.2) | % | ||||||||||||||||||||||||||||||||||
| Henderson Park Inn | 37 | $ | 543.39 | $ | 530.83 | 2.4 | % | 59.5 | % | 76.6 | % | (17.1) | % | $ | 323.26 | $ | 406.38 | (20.5) | % | ||||||||||||||||||||||||||||||||||
| Hilton Boston Downtown/Faneuil Hall | 403 | $ | 299.79 | $ | 225.47 | 33.0 | % | 73.9 | % | 81.8 | % | (7.9) | % | $ | 221.67 | $ | 184.42 | 20.2 | % | ||||||||||||||||||||||||||||||||||
| Hilton Burlington Lake Champlain | 258 | $ | 243.82 | $ | 253.04 | (3.6) | % | 70.8 | % | 64.9 | % | 5.9 | % | $ | 172.58 | $ | 164.34 | 5.0 | % | ||||||||||||||||||||||||||||||||||
| Hilton Garden Inn New York/Times Square Central | 282 | $ | 356.84 | $ | 252.83 | 41.1 | % | 98.3 | % | 95.0 | % | 3.3 | % | $ | 350.75 | $ | 240.11 | 46.1 | % | ||||||||||||||||||||||||||||||||||
| Hotel Clio | 199 | $ | 300.50 | $ | 272.93 | 10.1 | % | 70.1 | % | 69.6 | % | 0.5 | % | $ | 210.55 | $ | 190.06 | 10.8 | % | ||||||||||||||||||||||||||||||||||
| Hotel Emblem San Francisco | 96 | $ | 212.07 | $ | 168.26 | 26.0 | % | 69.0 | % | 62.8 | % | 6.2 | % | $ | 146.40 | $ | 105.66 | 38.6 | % | ||||||||||||||||||||||||||||||||||
| Hotel Palomar Phoenix | 242 | $ | 240.63 | $ | 197.76 | 21.7 | % | 59.5 | % | 68.2 | % | (8.7) | % | $ | 143.22 | $ | 134.95 | 6.1 | % | ||||||||||||||||||||||||||||||||||
| Kimpton Fort Lauderdale Beach Resort | 96 | $ | 222.36 | $ | 222.37 | — | % | 65.8 | % | 72.5 | % | (6.7) | % | $ | 146.25 | $ | 161.29 | (9.3) | % | ||||||||||||||||||||||||||||||||||
| Kimpton Shorebreak Resort | 157 | $ | 307.10 | $ | 277.50 | 10.7 | % | 77.5 | % | 69.6 | % | 7.9 | % | $ | 238.02 | $ | 193.06 | 23.3 | % | ||||||||||||||||||||||||||||||||||
| L'Auberge de Sedona | 88 | $ | 1,091.78 | $ | 1,120.22 | (2.5) | % | 67.9 | % | 77.4 | % | (9.5) | % | $ | 741.43 | $ | 867.42 | (14.5) | % | ||||||||||||||||||||||||||||||||||
Lake Austin Spa Resort (1) | 40 | $ | 1,366.90 | $ | 1,131.96 | 20.8 | % | 49.0 | % | 61.0 | % | (12.0) | % | $ | 670.12 | $ | 690.91 | (3.0) | % | ||||||||||||||||||||||||||||||||||
| Margaritaville Beach House Key West | 186 | $ | 379.48 | $ | 386.14 | (1.7) | % | 70.0 | % | 83.0 | % | (13.0) | % | $ | 265.72 | $ | 320.61 | (17.1) | % | ||||||||||||||||||||||||||||||||||
| Orchards Inn Sedona | 70 | $ | 319.54 | $ | 350.14 | (8.7) | % | 66.9 | % | 77.6 | % | (10.7) | % | $ | 213.76 | $ | 271.58 | (21.3) | % | ||||||||||||||||||||||||||||||||||
| Renaissance Charleston Historic District Hotel | 167 | $ | 367.50 | $ | 332.51 | 10.5 | % | 81.5 | % | 88.2 | % | (6.7) | % | $ | 299.40 | $ | 293.43 | 2.0 | % | ||||||||||||||||||||||||||||||||||
| Salt Lake City Marriott Downtown at City Creek | 510 | $ | 174.07 | $ | 157.49 | 10.5 | % | 57.2 | % | 43.4 | % | 13.8 | % | $ | 99.54 | $ | 68.33 | 45.7 | % | ||||||||||||||||||||||||||||||||||
| The Gwen Hotel | 311 | $ | 301.01 | $ | 265.16 | 13.5 | % | 75.0 | % | 71.0 | % | 4.0 | % | $ | 225.70 | $ | 188.28 | 19.9 | % | ||||||||||||||||||||||||||||||||||
| The Hythe Vail | 344 | $ | 490.05 | $ | 480.03 | 2.1 | % | 42.6 | % | 43.0 | % | (0.4) | % | $ | 208.62 | $ | 206.53 | 1.0 | % | ||||||||||||||||||||||||||||||||||
| The Landing Lake Tahoe Resort & Spa | 82 | $ | 434.09 | $ | 472.96 | (8.2) | % | 37.8 | % | 29.9 | % | 7.9 | % | $ | 164.11 | $ | 141.19 | 16.2 | % | ||||||||||||||||||||||||||||||||||
| The Lodge at Sonoma Resort | 182 | $ | 458.72 | $ | 396.54 | 15.7 | % | 60.2 | % | 66.7 | % | (6.5) | % | $ | 276.15 | $ | 264.58 | 4.4 | % | ||||||||||||||||||||||||||||||||||
| Tranquility Bay Beachfront Resort | 103 | $ | 598.88 | $ | 716.95 | (16.5) | % | 65.5 | % | 72.6 | % | (7.1) | % | $ | 392.16 | $ | 520.54 | (24.7) | % | ||||||||||||||||||||||||||||||||||
| Westin Boston Waterfront | 793 | $ | 246.54 | $ | 224.12 | 10.0 | % | 74.8 | % | 62.5 | % | 12.3 | % | $ | 184.34 | $ | 140.09 | 31.6 | % | ||||||||||||||||||||||||||||||||||
| Westin Fort Lauderdale Beach Resort | 433 | $ | 259.28 | $ | 257.68 | 0.6 | % | 66.1 | % | 60.7 | % | 5.4 | % | $ | 171.44 | $ | 156.33 | 9.7 | % | ||||||||||||||||||||||||||||||||||
| Westin San Diego Bayview | 436 | $ | 194.75 | $ | 163.59 | 19.0 | % | 69.0 | % | 56.1 | % | 12.9 | % | $ | 134.45 | $ | 91.76 | 46.5 | % | ||||||||||||||||||||||||||||||||||
| Westin Washington D.C. City Center | 410 | $ | 225.07 | $ | 171.38 | 31.3 | % | 63.8 | % | 40.5 | % | 23.3 | % | $ | 143.63 | $ | 69.43 | 106.9 | % | ||||||||||||||||||||||||||||||||||
| Worthington Renaissance Fort Worth Hotel | 504 | $ | 195.60 | $ | 172.91 | 13.1 | % | 71.5 | % | 60.6 | % | 10.9 | % | $ | 139.84 | $ | 104.70 | 33.6 | % | ||||||||||||||||||||||||||||||||||
Comparable Total (2) | 9,511 | $ | 291.05 | $ | 270.21 | 7.7 | % | 67.3 | % | 61.2 | % | 6.1 | % | $ | 195.99 | $ | 165.47 | 18.4 | % | ||||||||||||||||||||||||||||||||||
(1) Hotel was acquired on November 21, 2022. Amounts reflect the operating results for the period from November 21, 2022 to December 31, 2022 and the comparable period of 2021.
(2) Amounts include the pre-acquisition operating results of hotels acquired in 2021 and 2022 and excludes the Kimpton Fort Lauderdale Beach Resort as the hotel opened during 2021.
18
19
| Operating Statistics – Fourth Quarter | |||||||||||||||||||||||||||||||||||||||||||||||||||||
| Number of Rooms | ADR | Occupancy | RevPAR | ||||||||||||||||||||||||||||||||||||||||||||||||||
| 4Q 2022 | 4Q 2019 | B/(W) 2019 | 4Q 2022 | 4Q 2019 | B/(W) 2019 | 4Q 2022 | 4Q 2019 | B/(W) 2019 | |||||||||||||||||||||||||||||||||||||||||||||
| Atlanta Marriott Alpharetta | 318 | $ | 148.40 | $ | 160.31 | (7.4) | % | 59.5 | % | 65.9 | % | (6.4) | % | $ | 88.25 | $ | 105.72 | (16.5) | % | ||||||||||||||||||||||||||||||||||
| Bourbon Orleans Hotel | 220 | $ | 248.34 | $ | 224.82 | 10.5 | % | 85.5 | % | 80.5 | % | 5.0 | % | $ | 212.25 | $ | 181.06 | 17.2 | % | ||||||||||||||||||||||||||||||||||
| Cavallo Point, The Lodge at the Golden Gate | 142 | $ | 657.57 | $ | 490.30 | 34.1 | % | 49.6 | % | 63.5 | % | (13.9) | % | $ | 326.02 | $ | 311.28 | 4.7 | % | ||||||||||||||||||||||||||||||||||
| Chicago Marriott Downtown Magnificent Mile | 1,200 | $ | 244.72 | $ | 231.59 | 5.7 | % | 56.5 | % | 74.0 | % | (17.5) | % | $ | 138.33 | $ | 171.27 | (19.2) | % | ||||||||||||||||||||||||||||||||||
| Courtyard Denver Downtown | 177 | $ | 193.56 | $ | 189.47 | 2.2 | % | 71.5 | % | 70.7 | % | 0.8 | % | $ | 138.40 | $ | 133.97 | 3.3 | % | ||||||||||||||||||||||||||||||||||
| Courtyard New York Manhattan/Fifth Avenue | 189 | $ | 349.45 | $ | 289.47 | 20.7 | % | 97.3 | % | 92.1 | % | 5.2 | % | $ | 339.90 | $ | 266.52 | 27.5 | % | ||||||||||||||||||||||||||||||||||
| Courtyard New York Manhattan/Midtown East | 321 | $ | 402.88 | $ | 310.44 | 29.8 | % | 91.3 | % | 97.5 | % | (6.2) | % | $ | 368.00 | $ | 302.61 | 21.6 | % | ||||||||||||||||||||||||||||||||||
| Embassy Suites by Hilton Bethesda | 272 | $ | 142.39 | $ | 171.89 | (17.2) | % | 62.1 | % | 71.4 | % | (9.3) | % | $ | 88.41 | $ | 122.69 | (27.9) | % | ||||||||||||||||||||||||||||||||||
| Havana Cabana Key West | 106 | $ | 293.06 | $ | 212.18 | 38.1 | % | 77.5 | % | 88.1 | % | (10.6) | % | $ | 227.07 | $ | 186.96 | 21.5 | % | ||||||||||||||||||||||||||||||||||
| Henderson Beach Resort | 233 | $ | 369.73 | $ | 236.89 | 56.1 | % | 39.4 | % | 37.4 | % | 2.0 | % | $ | 145.78 | $ | 88.71 | 64.3 | % | ||||||||||||||||||||||||||||||||||
| Henderson Park Inn | 37 | $ | 543.39 | $ | 397.77 | 36.6 | % | 59.5 | % | 65.7 | % | (6.2) | % | $ | 323.26 | $ | 261.29 | 23.7 | % | ||||||||||||||||||||||||||||||||||
| Hilton Boston Downtown/Faneuil Hall | 403 | $ | 299.79 | $ | 278.31 | 7.7 | % | 73.9 | % | 87.3 | % | (13.4) | % | $ | 221.67 | $ | 243.07 | (8.8) | % | ||||||||||||||||||||||||||||||||||
| Hilton Burlington Lake Champlain | 258 | $ | 243.82 | $ | 181.60 | 34.3 | % | 70.8 | % | 79.2 | % | (8.4) | % | $ | 172.58 | $ | 143.81 | 20.0 | % | ||||||||||||||||||||||||||||||||||
| Hilton Garden Inn New York/Times Square Central | 282 | $ | 356.84 | $ | 311.91 | 14.4 | % | 98.3 | % | 99.1 | % | (0.8) | % | $ | 350.75 | $ | 309.21 | 13.4 | % | ||||||||||||||||||||||||||||||||||
| Hotel Clio | 199 | $ | 300.50 | $ | 239.49 | 25.5 | % | 70.1 | % | 77.0 | % | (6.9) | % | $ | 210.55 | $ | 184.42 | 14.2 | % | ||||||||||||||||||||||||||||||||||
| Hotel Emblem San Francisco | 96 | $ | 212.07 | $ | 244.13 | (13.1) | % | 69.0 | % | 84.0 | % | (15.0) | % | $ | 146.40 | $ | 204.96 | (28.6) | % | ||||||||||||||||||||||||||||||||||
| Hotel Palomar Phoenix | 242 | $ | 240.63 | $ | 192.45 | 25.0 | % | 59.5 | % | 82.8 | % | (23.3) | % | $ | 143.22 | $ | 159.40 | (10.2) | % | ||||||||||||||||||||||||||||||||||
| Kimpton Shorebreak Resort | 157 | $ | 307.10 | $ | 229.55 | 33.8 | % | 77.5 | % | 68.2 | % | 9.3 | % | $ | 238.02 | $ | 156.62 | 52.0 | % | ||||||||||||||||||||||||||||||||||
| L'Auberge de Sedona | 88 | $ | 1,091.78 | $ | 724.32 | 50.7 | % | 67.9 | % | 76.5 | % | (8.6) | % | $ | 741.43 | $ | 553.98 | 33.8 | % | ||||||||||||||||||||||||||||||||||
Lake Austin Spa Resort (1) | 40 | $ | 1,366.90 | $ | 681.73 | 100.5 | % | 49.0 | % | 50.7 | % | (1.7) | % | $ | 670.12 | $ | 345.85 | 93.8 | % | ||||||||||||||||||||||||||||||||||
| Margaritaville Beach House Key West | 186 | $ | 379.48 | $ | 262.62 | 44.5 | % | 70.0 | % | 57.9 | % | 12.1 | % | $ | 265.72 | $ | 152.03 | 74.8 | % | ||||||||||||||||||||||||||||||||||
| Orchards Inn Sedona | 70 | $ | 319.54 | $ | 268.22 | 19.1 | % | 66.9 | % | 69.4 | % | (2.5) | % | $ | 213.76 | $ | 186.13 | 14.8 | % | ||||||||||||||||||||||||||||||||||
| Renaissance Charleston Historic District Hotel | 167 | $ | 367.50 | $ | 272.57 | 34.8 | % | 81.5 | % | 85.0 | % | (3.5) | % | $ | 299.40 | $ | 231.57 | 29.3 | % | ||||||||||||||||||||||||||||||||||
| Salt Lake City Marriott Downtown at City Creek | 510 | $ | 174.07 | $ | 168.38 | 3.4 | % | 57.2 | % | 65.5 | % | (8.3) | % | $ | 99.54 | $ | 110.37 | (9.8) | % | ||||||||||||||||||||||||||||||||||
| The Gwen Hotel | 311 | $ | 301.01 | $ | 265.22 | 13.5 | % | 75.0 | % | 83.9 | % | (8.9) | % | $ | 225.70 | $ | 222.61 | 1.4 | % | ||||||||||||||||||||||||||||||||||
| The Hythe Vail | 344 | $ | 490.05 | $ | 342.90 | 42.9 | % | 42.6 | % | 51.5 | % | (8.9) | % | $ | 208.62 | $ | 176.63 | 18.1 | % | ||||||||||||||||||||||||||||||||||
| The Landing Lake Tahoe Resort & Spa | 82 | $ | 434.09 | $ | 327.30 | 32.6 | % | 37.8 | % | 50.9 | % | (13.1) | % | $ | 164.11 | $ | 166.60 | (1.5) | % | ||||||||||||||||||||||||||||||||||
| The Lodge at Sonoma Resort | 182 | $ | 458.72 | $ | 302.54 | 51.6 | % | 60.2 | % | 71.9 | % | (11.7) | % | $ | 276.15 | $ | 217.47 | 27.0 | % | ||||||||||||||||||||||||||||||||||
| Tranquility Bay Beachfront Resort | 103 | $ | 598.88 | $ | 361.44 | 65.7 | % | 65.5 | % | 82.0 | % | (16.5) | % | $ | 392.16 | $ | 296.56 | 32.2 | % | ||||||||||||||||||||||||||||||||||
| Westin Boston Waterfront | 793 | $ | 246.54 | $ | 244.57 | 0.8 | % | 74.8 | % | 74.6 | % | 0.2 | % | $ | 184.34 | $ | 182.36 | 1.1 | % | ||||||||||||||||||||||||||||||||||
| Westin Fort Lauderdale Beach Resort | 433 | $ | 259.28 | $ | 197.38 | 31.4 | % | 66.1 | % | 84.2 | % | (18.1) | % | $ | 171.44 | $ | 166.20 | 3.2 | % | ||||||||||||||||||||||||||||||||||
| Westin San Diego Bayview | 436 | $ | 194.75 | $ | 175.45 | 11.0 | % | 69.0 | % | 69.9 | % | (0.9) | % | $ | 134.45 | $ | 122.63 | 9.6 | % | ||||||||||||||||||||||||||||||||||
| Westin Washington D.C. City Center | 410 | $ | 225.07 | $ | 205.91 | 9.3 | % | 63.8 | % | 84.4 | % | (20.6) | % | $ | 143.63 | $ | 173.78 | (17.3) | % | ||||||||||||||||||||||||||||||||||
| Worthington Renaissance Fort Worth Hotel | 504 | $ | 195.60 | $ | 185.65 | 5.4 | % | 71.5 | % | 71.8 | % | (0.3) | % | $ | 139.84 | $ | 133.25 | 4.9 | % | ||||||||||||||||||||||||||||||||||
Comparable Total (2) | 9,511 | $ | 291.05 | $ | 244.35 | 19.1 | % | 67.3 | % | 75.1 | % | (7.8) | % | $ | 195.99 | $ | 183.60 | 6.7 | % | ||||||||||||||||||||||||||||||||||
(1) Hotel was acquired on November 21, 2022. Amounts reflect the operating results for the period from November 21, 2022 to December 31, 2022 and the comparable period of 2019.
(2) Amounts include the pre-acquisition operating results of hotels acquired in 2021 and 2022 and excludes the Kimpton Fort Lauderdale Beach Resort as the hotel opened during 2021.
20
21
| Operating Statistics – Year to Date | |||||||||||||||||||||||||||||||||||||||||||||||||||||
| Number of Rooms | ADR | Occupancy | RevPAR | ||||||||||||||||||||||||||||||||||||||||||||||||||
| YTD 2022 | YTD 2021 | B/(W) 2021 | YTD 2022 | YTD 2021 | B/(W) 2021 | YTD 2022 | YTD 2021 | B/(W) 2021 | |||||||||||||||||||||||||||||||||||||||||||||
| Atlanta Marriott Alpharetta | 318 | $ | 150.24 | $ | 113.77 | 32.1 | % | 56.0 | % | 44.9 | % | 11.1 | % | $ | 84.16 | $ | 51.14 | 64.6 | % | ||||||||||||||||||||||||||||||||||
| Bourbon Orleans Hotel | 220 | $ | 236.79 | $ | 209.31 | 13.1 | % | 67.1 | % | 32.8 | % | 34.3 | % | $ | 158.86 | $ | 68.58 | 131.6 | % | ||||||||||||||||||||||||||||||||||
| Cavallo Point, The Lodge at the Golden Gate | 142 | $ | 700.56 | $ | 652.13 | 7.4 | % | 51.1 | % | 45.5 | % | 5.6 | % | $ | 358.26 | $ | 296.95 | 20.6 | % | ||||||||||||||||||||||||||||||||||
| Chicago Marriott Downtown Magnificent Mile | 1,200 | $ | 242.34 | $ | 197.29 | 22.8 | % | 54.6 | % | 31.2 | % | 23.4 | % | $ | 132.20 | $ | 61.53 | 114.9 | % | ||||||||||||||||||||||||||||||||||
| Courtyard Denver Downtown | 177 | $ | 204.49 | $ | 156.54 | 30.6 | % | 74.2 | % | 60.0 | % | 14.2 | % | $ | 151.80 | $ | 93.99 | 61.5 | % | ||||||||||||||||||||||||||||||||||
| Courtyard New York Manhattan/Fifth Avenue | 189 | $ | 277.34 | $ | 211.93 | 30.9 | % | 93.3 | % | 54.3 | % | 39.0 | % | $ | 258.80 | $ | 115.08 | 124.9 | % | ||||||||||||||||||||||||||||||||||
| Courtyard New York Manhattan/Midtown East | 321 | $ | 328.22 | $ | 201.68 | 62.7 | % | 83.8 | % | 76.9 | % | 6.9 | % | $ | 275.05 | $ | 155.12 | 77.3 | % | ||||||||||||||||||||||||||||||||||
| Embassy Suites by Hilton Bethesda | 272 | $ | 143.75 | $ | 113.93 | 26.2 | % | 52.2 | % | 34.6 | % | 17.6 | % | $ | 75.01 | $ | 39.37 | 90.5 | % | ||||||||||||||||||||||||||||||||||
| Havana Cabana Key West | 106 | $ | 327.22 | $ | 285.74 | 14.5 | % | 85.3 | % | 90.2 | % | (4.9) | % | $ | 279.15 | $ | 257.78 | 8.3 | % | ||||||||||||||||||||||||||||||||||
| Henderson Park Resort | 233 | $ | 473.56 | $ | 441.61 | 7.2 | % | 61.8 | % | 64.3 | % | (2.5) | % | $ | 292.87 | $ | 283.76 | 3.2 | % | ||||||||||||||||||||||||||||||||||
| Henderson Park Inn | 37 | $ | 642.69 | $ | 526.46 | 22.1 | % | 73.1 | % | 85.5 | % | (12.4) | % | $ | 469.90 | $ | 450.33 | 4.3 | % | ||||||||||||||||||||||||||||||||||
| Hilton Boston Downtown/Faneuil Hall | 403 | $ | 293.11 | $ | 204.39 | 43.4 | % | 77.7 | % | 60.2 | % | 17.5 | % | $ | 227.79 | $ | 122.97 | 85.2 | % | ||||||||||||||||||||||||||||||||||
| Hilton Burlington Lake Champlain | 258 | $ | 245.87 | $ | 236.55 | 3.9 | % | 73.7 | % | 60.8 | % | 12.9 | % | $ | 181.23 | $ | 143.78 | 26.0 | % | ||||||||||||||||||||||||||||||||||
| Hilton Garden Inn New York/Times Square Central | 282 | $ | 276.71 | $ | 204.33 | 35.4 | % | 93.2 | % | 57.0 | % | 36.2 | % | $ | 257.91 | $ | 116.51 | 121.4 | % | ||||||||||||||||||||||||||||||||||
| Hotel Clio | 199 | $ | 304.01 | $ | 261.17 | 16.4 | % | 69.7 | % | 63.9 | % | 5.8 | % | $ | 211.87 | $ | 166.79 | 27.0 | % | ||||||||||||||||||||||||||||||||||
| Hotel Emblem San Francisco | 96 | $ | 223.96 | $ | 158.29 | 41.5 | % | 72.4 | % | 44.5 | % | 27.9 | % | $ | 162.14 | $ | 70.38 | 130.4 | % | ||||||||||||||||||||||||||||||||||
| Hotel Palomar Phoenix | 242 | $ | 221.10 | $ | 169.73 | 30.3 | % | 65.8 | % | 58.8 | % | 7.0 | % | $ | 145.48 | $ | 99.73 | 45.9 | % | ||||||||||||||||||||||||||||||||||
Kimpton Fort Lauderdale Beach Resort (1) | 96 | $ | 207.24 | $ | 208.45 | (0.6) | % | 62.8 | % | 52.6 | % | 10.2 | % | $ | 130.24 | $ | 109.60 | 18.8 | % | ||||||||||||||||||||||||||||||||||
| Kimpton Shorebreak Resort | 157 | $ | 345.17 | $ | 311.01 | 11.0 | % | 80.7 | % | 66.9 | % | 13.8 | % | $ | 278.42 | $ | 208.15 | 33.8 | % | ||||||||||||||||||||||||||||||||||
| L'Auberge de Sedona | 88 | $ | 995.34 | $ | 920.04 | 8.2 | % | 71.4 | % | 80.0 | % | (8.6) | % | $ | 710.81 | $ | 736.34 | (3.5) | % | ||||||||||||||||||||||||||||||||||
Lake Austin Spa Resort (2) | 40 | $ | 1,366.90 | $ | 1,131.96 | 20.8 | % | 49.0 | % | 61.0 | % | (12.0) | % | $ | 670.12 | $ | 690.91 | (3.0) | % | ||||||||||||||||||||||||||||||||||
| Margaritaville Beach House Key West | 186 | $ | 449.79 | $ | 384.58 | 17.0 | % | 79.8 | % | 84.6 | % | (4.8) | % | $ | 358.95 | $ | 325.51 | 10.3 | % | ||||||||||||||||||||||||||||||||||
| Orchards Inn Sedona | 70 | $ | 303.69 | $ | 304.71 | (0.3) | % | 66.5 | % | 71.8 | % | (5.3) | % | $ | 201.95 | $ | 218.91 | (7.7) | % | ||||||||||||||||||||||||||||||||||
| Renaissance Charleston Historic District Hotel | 167 | $ | 360.02 | $ | 308.52 | 16.7 | % | 85.4 | % | 81.5 | % | 3.9 | % | $ | 307.37 | $ | 251.36 | 22.3 | % | ||||||||||||||||||||||||||||||||||
| Salt Lake City Marriott Downtown at City Creek | 510 | $ | 176.24 | $ | 145.42 | 21.2 | % | 59.4 | % | 43.3 | % | 16.1 | % | $ | 104.70 | $ | 63.04 | 66.1 | % | ||||||||||||||||||||||||||||||||||
| The Gwen Hotel | 311 | $ | 297.88 | $ | 251.51 | 18.4 | % | 73.0 | % | 54.3 | % | 18.7 | % | $ | 217.59 | $ | 136.68 | 59.2 | % | ||||||||||||||||||||||||||||||||||
| The Hythe Vail | 344 | $ | 431.18 | $ | 356.33 | 21.0 | % | 53.2 | % | 45.2 | % | 8.0 | % | $ | 229.35 | $ | 161.20 | 42.3 | % | ||||||||||||||||||||||||||||||||||
| The Landing Lake Tahoe Resort & Spa | 82 | $ | 509.26 | $ | 484.40 | 5.1 | % | 49.0 | % | 45.0 | % | 4.0 | % | $ | 249.63 | $ | 217.76 | 14.6 | % | ||||||||||||||||||||||||||||||||||
| The Lodge at Sonoma Resort | 182 | $ | 462.85 | $ | 360.12 | 28.5 | % | 62.6 | % | 59.2 | % | 3.4 | % | $ | 289.59 | $ | 213.28 | 35.8 | % | ||||||||||||||||||||||||||||||||||
Tranquility Bay Beachfront Resort (3) | 103 | $ | 742.42 | $ | 647.18 | 14.7 | % | 73.3 | % | 81.4 | % | (8.1) | % | $ | 544.46 | $ | 526.78 | 3.4 | % | ||||||||||||||||||||||||||||||||||
| Westin Boston Waterfront | 793 | $ | 240.49 | $ | 196.14 | 22.6 | % | 75.3 | % | 44.6 | % | 30.7 | % | $ | 181.09 | $ | 87.51 | 106.9 | % | ||||||||||||||||||||||||||||||||||
| Westin Fort Lauderdale Beach Resort | 433 | $ | 269.09 | $ | 242.16 | 11.1 | % | 75.9 | % | 60.3 | % | 15.6 | % | $ | 204.22 | $ | 146.01 | 39.9 | % | ||||||||||||||||||||||||||||||||||
| Westin San Diego Bayview | 436 | $ | 201.64 | $ | 159.11 | 26.7 | % | 72.8 | % | 52.5 | % | 20.3 | % | $ | 146.88 | $ | 83.49 | 75.9 | % | ||||||||||||||||||||||||||||||||||
| Westin Washington D.C. City Center | 410 | $ | 214.53 | $ | 150.37 | 42.7 | % | 60.1 | % | 29.5 | % | 30.6 | % | $ | 128.87 | $ | 44.34 | 190.6 | % | ||||||||||||||||||||||||||||||||||
| Worthington Renaissance Fort Worth Hotel | 504 | $ | 188.68 | $ | 155.68 | 21.2 | % | 68.9 | % | 53.6 | % | 15.3 | % | $ | 129.95 | $ | 83.37 | 55.9 | % | ||||||||||||||||||||||||||||||||||
Comparable Total (4) | 9,511 | $ | 290.21 | $ | 255.40 | 13.6 | % | 68.4 | % | 51.6 | % | 16.8 | % | $ | 198.37 | $ | 131.74 | 50.6 | % | ||||||||||||||||||||||||||||||||||
(1) Hotel was acquired on April 1, 2022. Amounts reflect the operating results for the period from April 1, 2022 to December 31, 2022 and the comparable period of 2021.
(2) Hotel was acquired on November 21, 2022. Amounts reflect the operating results for the period from November 21, 2022 to December 31, 2022 and the comparable period of 2021.
(3) Hotel was acquired on January 6, 2022. Amounts reflect the operating results for the period from January 6, 2022 to December 31, 2022 and the comparable period of 2021.
(4) Amounts include the pre-acquisition operating results of hotels acquired in 2021 and 2022 and excludes the Kimpton Fort Lauderdale Beach Resort as the hotel opened during 2021.
22
.
23
| Operating Statistics – Year to Date | |||||||||||||||||||||||||||||||||||||||||||||||||||||
| Number of Rooms | ADR | Occupancy | RevPAR | ||||||||||||||||||||||||||||||||||||||||||||||||||
| YTD 2022 | YTD 2019 | B/(W) 2019 | YTD 2022 | YTD 2019 | B/(W) 2019 | YTD 2022 | YTD 2019 | B/(W) 2019 | |||||||||||||||||||||||||||||||||||||||||||||
| Atlanta Marriott Alpharetta | 318 | $ | 150.24 | $ | 165.41 | (9.2) | % | 56.0 | % | 71.0 | % | (15.0) | % | $ | 84.16 | $ | 117.46 | (28.4) | % | ||||||||||||||||||||||||||||||||||
| Bourbon Orleans Hotel | 220 | $ | 236.79 | $ | 219.08 | 8.1 | % | 67.1 | % | 82.2 | % | (15.1) | % | $ | 158.86 | $ | 180.17 | (11.8) | % | ||||||||||||||||||||||||||||||||||
| Cavallo Point, The Lodge at the Golden Gate | 142 | $ | 700.56 | $ | 466.43 | 50.2 | % | 51.1 | % | 64.8 | % | (13.7) | % | $ | 358.26 | $ | 302.02 | 18.6 | % | ||||||||||||||||||||||||||||||||||
| Chicago Marriott Downtown Magnificent Mile | 1,200 | $ | 242.34 | $ | 227.32 | 6.6 | % | 54.6 | % | 73.0 | % | (18.4) | % | $ | 132.20 | $ | 165.98 | (20.4) | % | ||||||||||||||||||||||||||||||||||
| Courtyard Denver Downtown | 177 | $ | 204.49 | $ | 198.23 | 3.2 | % | 74.2 | % | 78.4 | % | (4.2) | % | $ | 151.80 | $ | 155.50 | (2.4) | % | ||||||||||||||||||||||||||||||||||
| Courtyard New York Manhattan/Fifth Avenue | 189 | $ | 277.34 | $ | 259.33 | 6.9 | % | 93.3 | % | 88.1 | % | 5.2 | % | $ | 258.80 | $ | 228.35 | 13.3 | % | ||||||||||||||||||||||||||||||||||
| Courtyard New York Manhattan/Midtown East | 321 | $ | 328.22 | $ | 261.60 | 25.5 | % | 83.8 | % | 96.1 | % | (12.3) | % | $ | 275.05 | $ | 251.32 | 9.4 | % | ||||||||||||||||||||||||||||||||||
| Embassy Suites by Hilton Bethesda | 272 | $ | 143.75 | $ | 175.72 | (18.2) | % | 52.2 | % | 72.6 | % | (20.4) | % | $ | 75.01 | $ | 127.58 | (41.2) | % | ||||||||||||||||||||||||||||||||||
| Havana Cabana Key West | 106 | $ | 327.22 | $ | 210.68 | 55.3 | % | 85.3 | % | 89.7 | % | (4.4) | % | $ | 279.15 | $ | 189.07 | 47.6 | % | ||||||||||||||||||||||||||||||||||
| Henderson Beach Resort | 233 | $ | 473.56 | $ | 302.16 | 56.7 | % | 61.8 | % | 54.4 | % | 7.4 | % | $ | 292.87 | $ | 164.26 | 78.3 | % | ||||||||||||||||||||||||||||||||||
| Henderson Park Inn | 37 | $ | 642.69 | $ | 462.04 | 39.1 | % | 73.1 | % | 74.2 | % | (1.1) | % | $ | 469.90 | $ | 342.81 | 37.1 | % | ||||||||||||||||||||||||||||||||||
| Hilton Boston Downtown/Faneuil Hall | 403 | $ | 293.11 | $ | 301.21 | (2.7) | % | 77.7 | % | 88.5 | % | (10.8) | % | $ | 227.79 | $ | 266.64 | (14.6) | % | ||||||||||||||||||||||||||||||||||
| Hilton Burlington Lake Champlain | 258 | $ | 245.87 | $ | 190.61 | 29.0 | % | 73.7 | % | 81.1 | % | (7.4) | % | $ | 181.23 | $ | 154.50 | 17.3 | % | ||||||||||||||||||||||||||||||||||
| Hilton Garden Inn New York/Times Square Central | 282 | $ | 276.71 | $ | 255.13 | 8.5 | % | 93.2 | % | 98.6 | % | (5.4) | % | $ | 257.91 | $ | 251.68 | 2.5 | % | ||||||||||||||||||||||||||||||||||
| Hotel Clio | 199 | $ | 304.01 | $ | 253.48 | 19.9 | % | 69.7 | % | 72.4 | % | (2.7) | % | $ | 211.87 | $ | 183.45 | 15.5 | % | ||||||||||||||||||||||||||||||||||
| Hotel Emblem San Francisco | 96 | $ | 223.96 | $ | 241.09 | (7.1) | % | 72.4 | % | 80.2 | % | (7.8) | % | $ | 162.14 | $ | 193.28 | (16.1) | % | ||||||||||||||||||||||||||||||||||
| Hotel Palomar Phoenix | 242 | $ | 221.10 | $ | 187.43 | 18.0 | % | 65.8 | % | 82.7 | % | (16.9) | % | $ | 145.48 | $ | 155.00 | (6.1) | % | ||||||||||||||||||||||||||||||||||
| Kimpton Shorebreak Resort | 157 | $ | 345.17 | $ | 259.74 | 32.9 | % | 80.7 | % | 76.0 | % | 4.7 | % | $ | 278.42 | $ | 197.50 | 41.0 | % | ||||||||||||||||||||||||||||||||||
| L'Auberge de Sedona | 88 | $ | 995.34 | $ | 627.73 | 58.6 | % | 71.4 | % | 78.1 | % | (6.7) | % | $ | 710.81 | $ | 489.99 | 45.1 | % | ||||||||||||||||||||||||||||||||||
Lake Austin Spa Resort (1) | 40 | $ | 1,366.90 | $ | 681.73 | 100.5 | % | 49.0 | % | 50.7 | % | (1.7) | % | $ | 670.12 | $ | 345.85 | 93.8 | % | ||||||||||||||||||||||||||||||||||
| Margaritaville Beach House Key West | 186 | $ | 449.79 | $ | 260.28 | 72.8 | % | 79.8 | % | 74.8 | % | 5.0 | % | $ | 358.95 | $ | 194.70 | 84.4 | % | ||||||||||||||||||||||||||||||||||
| Orchards Inn Sedona | 70 | $ | 303.69 | $ | 249.86 | 21.5 | % | 66.5 | % | 75.6 | % | (9.1) | % | $ | 201.95 | $ | 188.99 | 6.9 | % | ||||||||||||||||||||||||||||||||||
| Renaissance Charleston Historic District Hotel | 167 | $ | 360.02 | $ | 263.88 | 36.4 | % | 85.4 | % | 84.2 | % | 1.2 | % | $ | 307.37 | $ | 222.23 | 38.3 | % | ||||||||||||||||||||||||||||||||||
| Salt Lake City Marriott Downtown at City Creek | 510 | $ | 176.24 | $ | 172.21 | 2.3 | % | 59.4 | % | 68.5 | % | (9.1) | % | $ | 104.70 | $ | 117.88 | (11.2) | % | ||||||||||||||||||||||||||||||||||
| The Gwen Hotel | 311 | $ | 297.88 | $ | 258.98 | 15.0 | % | 73.0 | % | 83.5 | % | (10.5) | % | $ | 217.59 | $ | 216.13 | 0.7 | % | ||||||||||||||||||||||||||||||||||
| The Hythe Vail | 344 | $ | 431.18 | $ | 307.45 | 40.2 | % | 53.2 | % | 62.1 | % | (8.9) | % | $ | 229.35 | $ | 190.86 | 20.2 | % | ||||||||||||||||||||||||||||||||||
| The Landing Lake Tahoe Resort & Spa | 82 | $ | 509.26 | $ | 322.45 | 57.9 | % | 49.0 | % | 61.7 | % | (12.7) | % | $ | 249.63 | $ | 198.80 | 25.6 | % | ||||||||||||||||||||||||||||||||||
| The Lodge at Sonoma Resort | 182 | $ | 462.85 | $ | 308.37 | 50.1 | % | 62.6 | % | 73.7 | % | (11.1) | % | $ | 289.59 | $ | 227.27 | 27.4 | % | ||||||||||||||||||||||||||||||||||
Tranquility Bay Beachfront Resort (2) | 103 | $ | 742.42 | $ | 404.57 | 83.5 | % | 73.3 | % | 86.0 | % | (12.7) | % | $ | 544.46 | $ | 347.85 | 56.5 | % | ||||||||||||||||||||||||||||||||||
| Westin Boston Waterfront | 793 | $ | 240.49 | $ | 249.76 | (3.7) | % | 75.3 | % | 77.4 | % | (2.1) | % | $ | 181.09 | $ | 193.34 | (6.3) | % | ||||||||||||||||||||||||||||||||||
| Westin Fort Lauderdale Beach Resort | 433 | $ | 269.09 | $ | 202.58 | 32.8 | % | 75.9 | % | 82.4 | % | (6.5) | % | $ | 204.22 | $ | 166.99 | 22.3 | % | ||||||||||||||||||||||||||||||||||
| Westin San Diego Bayview | 436 | $ | 201.64 | $ | 190.09 | 6.1 | % | 72.8 | % | 79.0 | % | (6.2) | % | $ | 146.88 | $ | 150.12 | (2.2) | % | ||||||||||||||||||||||||||||||||||
| Westin Washington D.C. City Center | 410 | $ | 214.53 | $ | 206.61 | 3.8 | % | 60.1 | % | 86.3 | % | (26.2) | % | $ | 128.87 | $ | 178.26 | (27.7) | % | ||||||||||||||||||||||||||||||||||
| Worthington Renaissance Fort Worth Hotel | 504 | $ | 188.68 | $ | 186.10 | 1.4 | % | 68.9 | % | 74.5 | % | (5.6) | % | $ | 129.95 | $ | 138.67 | (6.3) | % | ||||||||||||||||||||||||||||||||||
Comparable Total (3) | 9,511 | $ | 290.21 | $ | 242.03 | 19.9 | % | 68.4 | % | 77.7 | % | (9.3) | % | $ | 198.37 | $ | 188.07 | 5.5 | % | ||||||||||||||||||||||||||||||||||
(1) Hotel was acquired on November 21, 2022. Amounts reflect the operating results for the period from November 21, 2022 to December 31, 2022 and the comparable period of 2019.
(2) Hotel was acquired on January 6, 2022. Amounts reflect the operating results for the period from January 6, 2022 to December 31, 2022 and the comparable period of 2019.
(3) Amounts include the pre-acquisition operating results of hotels acquired in 2021 and 2022 and excludes the Kimpton Fort Lauderdale Beach Resort as the hotel opened during 2021.
24
| Hotel Adjusted EBITDA Reconciliation - Fourth Quarter 2022 | |||||||||||||||||||||||||||||
| Days of Operation | Net Income / (Loss) | Plus: | Plus: | Plus: | Equals: Hotel Adjusted EBITDA | ||||||||||||||||||||||||
| Total Revenues | Depreciation | Interest Expense | Adjustments (1) | ||||||||||||||||||||||||||
| Atlanta Marriott Alpharetta | 92 | $ | 3,798 | $ | 837 | $ | 366 | $ | — | $ | — | $ | 1,203 | ||||||||||||||||
| Bourbon Orleans Hotel | 92 | $ | 5,477 | $ | 1,558 | $ | 836 | $ | — | $ | 6 | $ | 2,400 | ||||||||||||||||
| Cavallo Point, The Lodge at the Golden Gate | 92 | $ | 11,037 | $ | (48) | $ | 1,998 | $ | — | $ | 94 | $ | 2,044 | ||||||||||||||||
| Chicago Marriott Downtown Magnificent Mile | 92 | $ | 24,334 | $ | 6,615 | $ | 3,828 | $ | 6 | $ | (397) | $ | 10,052 | ||||||||||||||||
| Courtyard Denver Downtown | 92 | $ | 2,554 | $ | 610 | $ | 378 | $ | — | $ | — | $ | 988 | ||||||||||||||||
| Courtyard New York Manhattan/Fifth Avenue | 92 | $ | 5,975 | $ | 1,250 | $ | 339 | $ | — | $ | 253 | $ | 1,842 | ||||||||||||||||
| Courtyard New York Manhattan/Midtown East | 92 | $ | 11,202 | $ | 3,029 | $ | 507 | $ | 910 | $ | — | $ | 4,446 | ||||||||||||||||
| Embassy Suites by Hilton Bethesda | 92 | $ | 2,659 | $ | (1,948) | $ | 562 | $ | — | $ | 1,477 | $ | 91 | ||||||||||||||||
| Havana Cabana Key West | 92 | $ | 2,894 | $ | 633 | $ | 281 | $ | — | $ | — | $ | 914 | ||||||||||||||||
| Henderson Beach Resort | 92 | $ | 6,881 | $ | (638) | $ | 993 | $ | — | $ | — | $ | 355 | ||||||||||||||||
| Henderson Park Inn | 92 | $ | 1,582 | $ | 26 | $ | 233 | $ | — | $ | — | $ | 259 | ||||||||||||||||
| Hilton Boston Downtown/Faneuil Hall | 92 | $ | 9,321 | $ | 1,629 | $ | 1,046 | $ | — | $ | — | $ | 2,675 | ||||||||||||||||
| Hilton Burlington Lake Champlain | 92 | $ | 5,485 | $ | 1,775 | $ | 564 | $ | — | $ | — | $ | 2,339 | ||||||||||||||||
| Hilton Garden Inn New York/Times Square Central | 92 | $ | 9,940 | $ | 3,262 | $ | 638 | $ | — | $ | — | $ | 3,900 | ||||||||||||||||
| Hotel Clio | 92 | $ | 7,132 | $ | 257 | $ | 878 | $ | 647 | $ | 5 | $ | 1,787 | ||||||||||||||||
| Hotel Emblem San Francisco | 92 | $ | 1,630 | $ | (250) | $ | 296 | $ | — | $ | — | $ | 46 | ||||||||||||||||
| Hotel Palomar Phoenix | 92 | $ | 5,288 | $ | 409 | $ | 726 | $ | — | $ | 181 | $ | 1,316 | ||||||||||||||||
| Kimpton Fort Lauderdale Beach Resort | 92 | $ | 1,987 | $ | (378) | $ | 302 | $ | — | $ | — | $ | (76) | ||||||||||||||||
| Kimpton Shorebreak Resort | 92 | $ | 5,294 | $ | 1,095 | $ | 389 | $ | — | $ | — | $ | 1,484 | ||||||||||||||||
| L'Auberge de Sedona | 92 | $ | 9,444 | $ | 3,361 | $ | 374 | $ | — | $ | — | $ | 3,735 | ||||||||||||||||
| Lake Austin Spa Resort | 41 | $ | 1,944 | $ | 132 | $ | 212 | $ | — | $ | — | $ | 344 | ||||||||||||||||
| Margaritaville Beach House Key West | 92 | $ | 6,342 | $ | 522 | $ | 795 | $ | — | $ | — | $ | 1,317 | ||||||||||||||||
| Orchards Inn Sedona | 92 | $ | 2,336 | $ | 580 | $ | 89 | $ | — | $ | 42 | $ | 711 | ||||||||||||||||
| Renaissance Charleston Historic District Hotel | 92 | $ | 5,667 | $ | 2,150 | $ | 441 | $ | — | $ | — | $ | 2,591 | ||||||||||||||||
| Salt Lake City Marriott Downtown at City Creek | 92 | $ | 7,173 | $ | 1,336 | $ | 567 | $ | 225 | $ | 11 | $ | 2,139 | ||||||||||||||||
| The Gwen Hotel | 92 | $ | 9,482 | $ | 3,204 | $ | 1,077 | $ | — | $ | — | $ | 4,281 | ||||||||||||||||
| The Hythe Vail | 92 | $ | 9,200 | $ | 913 | $ | 1,176 | $ | — | $ | — | $ | 2,089 | ||||||||||||||||
| The Landing Lake Tahoe Resort & Spa | 92 | $ | 2,323 | $ | 98 | $ | 222 | $ | — | $ | — | $ | 320 | ||||||||||||||||
| The Lodge at Sonoma Resort | 92 | $ | 7,900 | $ | 1,273 | $ | 714 | $ | 88 | $ | — | $ | 2,075 | ||||||||||||||||
| Tranquility Bay Beachfront Resort | 92 | $ | 4,671 | $ | 1,104 | $ | 432 | $ | — | $ | — | $ | 1,536 | ||||||||||||||||
| Westin Boston Seaport District | 92 | $ | 21,076 | $ | 233 | $ | 2,481 | $ | 2,036 | $ | (122) | $ | 4,628 | ||||||||||||||||
| Westin Fort Lauderdale Beach Resort | 92 | $ | 16,147 | $ | 3,590 | $ | 1,011 | $ | — | $ | — | $ | 4,601 | ||||||||||||||||
| Westin San Diego Bayview | 92 | $ | 7,333 | $ | 287 | $ | 860 | $ | 421 | $ | — | $ | 1,568 | ||||||||||||||||
| Westin Washington D.C. City Center | 92 | $ | 7,141 | $ | (38) | $ | 1,023 | $ | 25 | $ | — | $ | 1,010 | ||||||||||||||||
| Worthington Renaissance Fort Worth Hotel | 92 | $ | 12,406 | $ | 2,770 | $ | 1,118 | $ | 731 | $ | 1 | $ | 4,620 | ||||||||||||||||
| Total | $ | 255,055 | $ | 41,238 | $ | 27,752 | $ | 5,089 | $ | 1,551 | $ | 75,626 | |||||||||||||||||
Prior Ownership Results (2) | $ | 3,870 | $ | 1,191 | $ | 88 | $ | — | $ | — | $ | 1,279 | |||||||||||||||||
Less: Non Comparable Hotel (3) | $ | (1,987) | $ | 378 | $ | (302) | $ | — | $ | — | $ | 76 | |||||||||||||||||
| Comparable Total | $ | 256,938 | $ | 42,807 | $ | 27,538 | $ | 5,089 | $ | 1,551 | $ | 76,981 | |||||||||||||||||
(1) Includes non-cash expenses incurred by the hotels due to the straight lining of the rent from ground lease obligations and the non-cash amortization of intangible assets and liabilities.
(2) Represents the pre-acquisition operating results of our 2021 and 2022 acquisitions (excluding the Kimpton Fort Lauderdale Beach Resort).
(3) Represents the operating results of the Kimpton Fort Lauderdale Beach Resort, which is non-comparable since the hotel opened during 2021.
25
| Hotel Adjusted EBITDA Reconciliation - Fourth Quarter 2021 | |||||||||||||||||||||||||||||
| Days of Operation | Net Income / (Loss) | Plus: | Plus: | Plus: | Equals: Hotel | ||||||||||||||||||||||||
| Total Revenues | Depreciation | Interest Expense | Adjustments (1) | Adjusted EBITDA | |||||||||||||||||||||||||
| Atlanta Marriott Alpharetta | 92 | $ | 2,466 | $ | 472 | $ | 337 | $ | — | $ | — | $ | 809 | ||||||||||||||||
| Bourbon Orleans Hotel | 92 | $ | 3,306 | $ | 361 | $ | 807 | $ | — | $ | 7 | $ | 1,175 | ||||||||||||||||
| Cavallo Point, The Lodge at the Golden Gate | 92 | $ | 11,833 | $ | 1,756 | $ | 1,884 | $ | — | $ | 94 | $ | 3,734 | ||||||||||||||||
| Chicago Marriott Downtown Magnificent Mile | 92 | $ | 16,085 | $ | (2,764) | $ | 4,063 | $ | 6 | $ | (397) | $ | 908 | ||||||||||||||||
| Courtyard Denver Downtown | 92 | $ | 1,995 | $ | 298 | $ | 377 | $ | — | $ | — | $ | 675 | ||||||||||||||||
| Courtyard New York Manhattan/Fifth Avenue | 92 | $ | 4,232 | $ | (575) | $ | 331 | $ | — | $ | 253 | $ | 9 | ||||||||||||||||
| Courtyard New York Manhattan/Midtown East | 92 | $ | 7,077 | $ | 174 | $ | 501 | $ | 929 | $ | — | $ | 1,604 | ||||||||||||||||
| Embassy Suites by Hilton Bethesda | 92 | $ | 1,778 | $ | (2,224) | $ | 546 | $ | — | $ | 1,489 | $ | (189) | ||||||||||||||||
| Frenchman's Reef & Morning Star Marriott Beach Resort | — | $ | — | $ | — | $ | — | $ | — | $ | — | $ | — | ||||||||||||||||
| Havana Cabana Key West | 92 | $ | 3,288 | $ | 1,039 | $ | 268 | $ | — | $ | — | $ | 1,307 | ||||||||||||||||
| Henderson Beach Resort | 9 | $ | 788 | $ | 212 | $ | — | $ | — | $ | — | $ | 212 | ||||||||||||||||
| Henderson Park Inn | 92 | $ | 1,864 | $ | 414 | $ | 214 | $ | — | $ | — | $ | 628 | ||||||||||||||||
| Hilton Boston Downtown/Faneuil Hall | 92 | $ | 7,600 | $ | 1,160 | $ | 1,057 | $ | — | $ | — | $ | 2,217 | ||||||||||||||||
| Hilton Burlington Lake Champlain | 92 | $ | 4,703 | $ | 1,156 | $ | 569 | $ | — | $ | — | $ | 1,725 | ||||||||||||||||
| Hilton Garden Inn New York/Times Square Central | 92 | $ | 6,391 | $ | 650 | $ | 641 | $ | — | $ | — | $ | 1,291 | ||||||||||||||||
| Hotel Clio | 92 | $ | 5,683 | $ | (226) | $ | 786 | $ | 661 | $ | 5 | $ | 1,226 | ||||||||||||||||
| Hotel Emblem San Francisco | 92 | $ | 1,172 | $ | (409) | $ | 307 | $ | — | $ | — | $ | (102) | ||||||||||||||||
| Hotel Palomar Phoenix | 92 | $ | 5,303 | $ | 716 | $ | 671 | $ | — | $ | 282 | $ | 1,669 | ||||||||||||||||
| Kimpton Shorebreak Resort | 92 | $ | 4,248 | $ | 673 | $ | 410 | $ | — | $ | — | $ | 1,083 | ||||||||||||||||
| L'Auberge de Sedona | 92 | $ | 9,894 | $ | 2,886 | $ | 417 | $ | — | $ | — | $ | 3,303 | ||||||||||||||||
| Margaritaville Beach House Key West | 92 | $ | 6,697 | $ | 1,797 | $ | 745 | $ | — | $ | — | $ | 2,542 | ||||||||||||||||
| Orchards Inn Sedona | 92 | $ | 2,793 | $ | 762 | $ | 86 | $ | — | $ | 42 | $ | 890 | ||||||||||||||||
| Renaissance Charleston Historic District Hotel | 92 | $ | 5,638 | $ | 1,787 | $ | 460 | $ | — | $ | — | $ | 2,247 | ||||||||||||||||
| Salt Lake City Marriott Downtown at City Creek | 92 | $ | 4,861 | $ | 13 | $ | 508 | $ | 513 | $ | 11 | $ | 1,045 | ||||||||||||||||
| The Gwen Hotel | 92 | $ | 7,860 | $ | (1,111) | $ | 1,088 | $ | — | $ | — | $ | (23) | ||||||||||||||||
| The Hythe Vail | 92 | $ | 8,210 | $ | (2) | $ | 1,144 | $ | — | $ | — | $ | 1,142 | ||||||||||||||||
| The Landing Lake Tahoe Resort & Spa | 92 | $ | 1,816 | $ | 578 | $ | 428 | $ | — | $ | — | $ | 1,006 | ||||||||||||||||
| The Lexington Hotel | — | $ | — | $ | (12) | $ | — | $ | — | $ | — | $ | (12) | ||||||||||||||||
| The Lodge at Sonoma Resort | 92 | $ | 6,857 | $ | 754 | $ | 624 | $ | 268 | $ | — | $ | 1,646 | ||||||||||||||||
| Westin Boston Seaport District | 92 | $ | 15,547 | $ | (2,344) | $ | 2,490 | $ | 2,083 | $ | (122) | $ | 2,107 | ||||||||||||||||
| Westin Fort Lauderdale Beach Resort | 92 | $ | 13,144 | $ | 1,848 | $ | 1,083 | $ | — | $ | — | $ | 2,931 | ||||||||||||||||
| Westin San Diego Bayview | 92 | $ | 4,904 | $ | (398) | $ | 801 | $ | 600 | $ | — | $ | 1,003 | ||||||||||||||||
| Westin Washington D.C. City Center | 92 | $ | 3,289 | $ | (1,902) | $ | 1,003 | $ | 611 | $ | — | $ | (288) | ||||||||||||||||
| Worthington Renaissance Fort Worth Hotel | 92 | $ | 8,612 | $ | 1,287 | $ | 1,108 | $ | 748 | $ | 2 | $ | 3,145 | ||||||||||||||||
| Total | $ | 189,934 | $ | 8,826 | $ | 25,754 | $ | 6,419 | $ | 1,666 | $ | 42,668 | |||||||||||||||||
Add: Prior Ownership Results (2) | $ | 19,587 | $ | 3,447 | $ | 1,476 | $ | — | $ | — | $ | 4,923 | |||||||||||||||||
Less: Sold Hotels (3) | $ | — | $ | 12 | $ | — | $ | — | $ | — | $ | 12 | |||||||||||||||||
| Comparable Total | $ | 209,521 | $ | 12,285 | $ | 27,230 | $ | 6,419 | $ | 1,666 | $ | 47,603 | |||||||||||||||||
(1) Includes non-cash expenses incurred by the hotels due to the straight lining of the rent from ground lease obligations and the non-cash amortization of intangible assets and liabilities.
(2) Represents the pre-acquisition operating results of our 2021 and 2022 acquisitions (excluding the Kimpton Fort Lauderdale Beach Resort).
(3) Represents the operating results of Frenchman's Reef and The Lexington Hotel.
26
| Hotel Adjusted EBITDA Reconciliation - Fourth Quarter 2019 | |||||||||||||||||||||||||||||
| Days of Operation | Net Income / (Loss) | Plus: | Plus: | Plus: | Equals: Hotel | ||||||||||||||||||||||||
| Total Revenues | Depreciation | Interest Expense | Adjustments (1) | Adjusted EBITDA | |||||||||||||||||||||||||
| Atlanta Marriott Alpharetta | 92 | $ | 4,627 | $ | 1,159 | $ | 407 | $ | — | $ | — | $ | 1,566 | ||||||||||||||||
| Cavallo Point, The Lodge at the Golden Gate | 92 | $ | 10,010 | $ | 924 | $ | 1,814 | $ | — | $ | 94 | $ | 2,832 | ||||||||||||||||
| Chicago Marriott Downtown Magnificent Mile | 92 | $ | 29,038 | $ | 4,750 | $ | 4,248 | $ | 5 | $ | (397) | $ | 8,606 | ||||||||||||||||
| Courtyard Denver Downtown | 92 | $ | 2,425 | $ | 726 | $ | 325 | $ | — | $ | — | $ | 1,051 | ||||||||||||||||
| Courtyard New York Manhattan/Fifth Avenue | 92 | $ | 4,770 | $ | 545 | $ | 451 | $ | — | $ | 253 | $ | 1,249 | ||||||||||||||||
| Courtyard New York Manhattan/Midtown East | 92 | $ | 9,211 | $ | 1,385 | $ | 704 | $ | 965 | $ | — | $ | 3,054 | ||||||||||||||||
| Embassy Suites by Hilton Bethesda | 92 | $ | 4,288 | $ | (660) | $ | 468 | $ | — | $ | 1,516 | $ | 1,324 | ||||||||||||||||
| Frenchman's Reef & Morning Star Marriott Beach Resort | — | $ | — | $ | — | $ | — | $ | — | $ | — | $ | — | ||||||||||||||||
| Havana Cabana Key West | 92 | $ | 2,420 | $ | 412 | $ | 238 | $ | — | $ | — | $ | 650 | ||||||||||||||||
| Hilton Boston Downtown/Faneuil Hall | 92 | $ | 10,002 | $ | 2,660 | $ | 1,223 | $ | — | $ | — | $ | 3,883 | ||||||||||||||||
| Hilton Burlington Lake Champlain | 92 | $ | 4,542 | $ | 1,217 | $ | 501 | $ | — | $ | — | $ | 1,718 | ||||||||||||||||
| Hilton Garden Inn New York/Times Square Central | 92 | $ | 8,153 | $ | 2,185 | $ | 840 | $ | — | $ | — | $ | 3,025 | ||||||||||||||||
| Hotel Clio | 92 | $ | 5,049 | $ | (235) | $ | 823 | $ | 688 | $ | 6 | $ | 1,282 | ||||||||||||||||
| Hotel Emblem San Francisco | 92 | $ | 2,254 | $ | 320 | $ | 285 | $ | — | $ | — | $ | 605 | ||||||||||||||||
| Hotel Palomar Phoenix | 92 | $ | 6,693 | $ | 1,159 | $ | 681 | $ | 38 | $ | 293 | $ | 2,171 | ||||||||||||||||
| Kimpton Shorebreak Resort | 92 | $ | 3,661 | $ | 246 | $ | 439 | $ | — | $ | 40 | $ | 725 | ||||||||||||||||
| L'Auberge de Sedona | 92 | $ | 7,610 | $ | 1,936 | $ | 594 | $ | — | $ | — | $ | 2,530 | ||||||||||||||||
| Margaritaville Beach House Key West | 92 | $ | 2,989 | $ | (177) | $ | 534 | $ | — | $ | — | $ | 357 | ||||||||||||||||
| Orchards Inn Sedona | 92 | $ | 1,840 | $ | 176 | $ | 238 | $ | — | $ | 42 | $ | 456 | ||||||||||||||||
| Renaissance Charleston Historic District Hotel | 92 | $ | 4,172 | $ | 1,225 | $ | 423 | $ | — | $ | (32) | $ | 1,616 | ||||||||||||||||
| Salt Lake City Marriott Downtown at City Creek | 92 | $ | 7,968 | $ | 1,676 | $ | 549 | $ | 603 | $ | — | $ | 2,828 | ||||||||||||||||
| The Gwen Hotel | 92 | $ | 8,722 | $ | 1,156 | $ | 1,157 | $ | — | $ | — | $ | 2,313 | ||||||||||||||||
| The Hythe Vail | 92 | $ | 8,139 | $ | 764 | $ | 1,098 | $ | — | $ | — | $ | 1,862 | ||||||||||||||||
| The Landing Lake Tahoe Resort & Spa | 92 | $ | 1,904 | $ | (176) | $ | 411 | $ | — | $ | — | $ | 235 | ||||||||||||||||
| The Lexington Hotel | 92 | $ | 21,013 | $ | 2,524 | $ | 3,610 | $ | 6 | $ | 8 | $ | 6,148 | ||||||||||||||||
| The Lodge at Sonoma Resort | 92 | $ | 5,622 | $ | 537 | $ | 505 | $ | 279 | $ | — | $ | 1,321 | ||||||||||||||||
| Westin Boston Seaport District | 92 | $ | 22,364 | $ | 796 | $ | 2,551 | $ | 2,171 | $ | (60) | $ | 5,458 | ||||||||||||||||
| Westin Fort Lauderdale Beach Resort | 92 | $ | 12,746 | $ | 1,860 | $ | 1,634 | $ | — | $ | — | $ | 3,494 | ||||||||||||||||
| Westin San Diego Bayview | 92 | $ | 7,227 | $ | 170 | $ | 1,151 | $ | 633 | $ | — | $ | 1,954 | ||||||||||||||||
| Westin Washington D.C. City Center | 92 | $ | 8,004 | $ | 444 | $ | 1,370 | $ | 658 | $ | — | $ | 2,472 | ||||||||||||||||
| Worthington Renaissance Fort Worth Hotel | 92 | $ | 10,056 | $ | 781 | $ | 1,033 | $ | 781 | $ | 2 | $ | 2,597 | ||||||||||||||||
| Total | $ | 237,519 | $ | 30,485 | $ | 30,305 | $ | 6,827 | $ | 1,765 | $ | 69,416 | |||||||||||||||||
Add: Prior Ownership Results (2) | $ | 18,067 | $ | 472 | $ | 2,039 | $ | — | $ | — | $ | 2,511 | |||||||||||||||||
Less: Sold Hotels (3) | $ | (21,013) | $ | (2,524) | $ | (3,610) | $ | (6) | $ | (8) | $ | (6,148) | |||||||||||||||||
| Comparable Total | $ | 234,573 | $ | 28,433 | $ | 28,734 | $ | 6,821 | $ | 1,757 | $ | 65,779 | |||||||||||||||||
(1) Includes non-cash expenses incurred by the hotels due to the straight lining of the rent from ground lease obligations and the non-cash amortization of intangible assets and liabilities.
(2) Represents the pre-acquisition operating results of our 2021 and 2022 acquisitions (excluding the Kimpton Fort Lauderdale Beach Resort).
(3) Represents the operating results of Frenchman's Reef and The Lexington Hotel.
27
| Hotel Adjusted EBITDA Reconciliation - Year to Date 2022 | |||||||||||||||||||||||||||||
| Days of Operation | Total Revenues | Net Income / (Loss) | Plus: Depreciation | Plus: Interest Expense | Plus: Adjustments (1) | Equals: Hotel Adjusted EBITDA | |||||||||||||||||||||||
| Atlanta Marriott Alpharetta | 365 | $ | 13,706 | $ | 2,847 | $ | 1,478 | $ | — | $ | — | $ | 4,325 | ||||||||||||||||
| Bourbon Orleans Hotel | 365 | $ | 16,503 | $ | 2,986 | $ | 3,321 | $ | — | $ | 25 | $ | 6,332 | ||||||||||||||||
| Cavallo Point, The Lodge at the Golden Gate | 365 | $ | 45,030 | $ | 4,663 | $ | 7,533 | $ | — | $ | 375 | $ | 12,571 | ||||||||||||||||
| Chicago Marriott Downtown Magnificent Mile | 365 | $ | 91,934 | $ | 19,420 | $ | 15,514 | $ | 23 | $ | (1,589) | $ | 33,368 | ||||||||||||||||
| Courtyard Denver Downtown | 365 | $ | 11,007 | $ | 3,527 | $ | 1,508 | $ | — | $ | — | $ | 5,035 | ||||||||||||||||
| Courtyard New York Manhattan/Fifth Avenue | 365 | $ | 18,119 | $ | 1,108 | $ | 1,333 | $ | — | $ | 1,014 | $ | 3,455 | ||||||||||||||||
| Courtyard New York Manhattan/Midtown East | 365 | $ | 33,251 | $ | 4,207 | $ | 1,963 | $ | 3,640 | $ | — | $ | 9,810 | ||||||||||||||||
| Embassy Suites by Hilton Bethesda | 365 | $ | 8,892 | $ | (9,254) | $ | 2,243 | $ | — | $ | 5,928 | $ | (1,083) | ||||||||||||||||
| Havana Cabana Key West | 365 | $ | 14,014 | $ | 4,677 | $ | 1,111 | $ | — | $ | — | $ | 5,788 | ||||||||||||||||
| Henderson Beach Resort | 365 | $ | 42,287 | $ | 4,961 | $ | 3,906 | $ | — | $ | — | $ | 8,867 | ||||||||||||||||
| Henderson Park Inn | 365 | $ | 8,769 | $ | 2,286 | $ | 899 | $ | — | $ | — | $ | 3,185 | ||||||||||||||||
| Hilton Boston Downtown/Faneuil Hall | 365 | $ | 37,420 | $ | 8,194 | $ | 4,118 | $ | — | $ | — | $ | 12,312 | ||||||||||||||||
| Hilton Burlington Lake Champlain | 365 | $ | 21,836 | $ | 6,464 | $ | 2,262 | $ | — | $ | — | $ | 8,726 | ||||||||||||||||
| Hilton Garden Inn New York/Times Square Central | 365 | $ | 29,078 | $ | 6,610 | $ | 2,517 | $ | — | $ | — | $ | 9,127 | ||||||||||||||||
| Hotel Clio | 365 | $ | 26,726 | $ | 966 | $ | 3,405 | $ | 2,588 | $ | 19 | $ | 6,978 | ||||||||||||||||
| Hotel Emblem San Francisco | 365 | $ | 6,927 | $ | (362) | $ | 1,187 | $ | — | $ | — | $ | 825 | ||||||||||||||||
| Hotel Palomar Phoenix | 365 | $ | 20,622 | $ | 2,387 | $ | 2,722 | $ | — | $ | 729 | $ | 5,838 | ||||||||||||||||
| Kimpton Fort Lauderdale Beach Resort | 275 | $ | 5,224 | $ | (925) | $ | 911 | $ | — | $ | — | $ | (14) | ||||||||||||||||
| Kimpton Shorebreak Resort | 365 | $ | 23,015 | $ | 6,987 | $ | 1,590 | $ | — | $ | — | $ | 8,577 | ||||||||||||||||
| L'Auberge de Sedona | 365 | $ | 34,564 | $ | 10,417 | $ | 1,475 | $ | — | $ | — | $ | 11,892 | ||||||||||||||||
| Lake Austin Spa Resort | 41 | $ | 1,944 | $ | 132 | $ | 212 | $ | — | $ | — | $ | 344 | ||||||||||||||||
| Margaritaville Beach House Key West | 365 | $ | 31,866 | $ | 10,145 | $ | 3,182 | $ | — | $ | — | $ | 13,327 | ||||||||||||||||
| Orchards Inn Sedona | 365 | $ | 9,124 | $ | 2,304 | $ | 343 | $ | — | $ | 168 | $ | 2,815 | ||||||||||||||||
| Renaissance Charleston Historic District Hotel | 365 | $ | 23,340 | $ | 8,677 | $ | 1,813 | $ | — | $ | — | $ | 10,490 | ||||||||||||||||
| Salt Lake City Marriott Downtown at City Creek | 365 | $ | 27,506 | $ | 5,400 | $ | 2,224 | $ | 1,803 | $ | 42 | $ | 9,469 | ||||||||||||||||
| The Gwen Hotel | 365 | $ | 36,784 | $ | 8,372 | $ | 4,284 | $ | — | $ | — | $ | 12,656 | ||||||||||||||||
| The Hythe Vail | 365 | $ | 41,726 | $ | 8,404 | $ | 4,783 | $ | — | $ | — | $ | 13,187 | ||||||||||||||||
| The Landing Lake Tahoe Resort & Spa | 365 | $ | 12,269 | $ | 3,354 | $ | 1,015 | $ | — | $ | — | $ | 4,369 | ||||||||||||||||
| The Lodge at Sonoma Resort | 365 | $ | 31,633 | $ | 5,607 | $ | 2,619 | $ | 870 | $ | — | $ | 9,096 | ||||||||||||||||
| Tranquility Bay Beachfront Resort | 360 | $ | 24,321 | $ | 6,429 | $ | 1,709 | $ | — | $ | — | $ | 8,138 | ||||||||||||||||
| Westin Boston Seaport District | 365 | $ | 84,186 | $ | 3,105 | $ | 9,825 | $ | 8,148 | $ | (490) | $ | 20,588 | ||||||||||||||||
| Westin Fort Lauderdale Beach Resort | 365 | $ | 70,104 | $ | 20,129 | $ | 3,953 | $ | — | $ | — | $ | 24,082 | ||||||||||||||||
| Westin San Diego Bayview | 365 | $ | 30,310 | $ | 3,794 | $ | 3,344 | $ | 2,177 | $ | — | $ | 9,315 | ||||||||||||||||
| Westin Washington D.C. City Center | 365 | $ | 24,956 | $ | (1,182) | $ | 4,101 | $ | 1,806 | $ | — | $ | 4,725 | ||||||||||||||||
| Worthington Renaissance Fort Worth Hotel | 365 | $ | 42,510 | $ | 6,210 | $ | 4,446 | $ | 2,928 | $ | 5 | $ | 13,589 | ||||||||||||||||
| Total | $ | 1,001,503 | $ | 173,046 | $ | 108,849 | $ | 23,983 | $ | 6,226 | $ | 312,105 | |||||||||||||||||
Less: Non-Comparable Hotel (2) | $ | (5,224) | $ | 925 | $ | (911) | $ | — | $ | — | $ | 14 | |||||||||||||||||
Add: Prior Ownership Results (3) | $ | 23,568 | $ | 6,721 | $ | 998 | $ | — | $ | — | $ | 7,719 | |||||||||||||||||
| Comparable Total | $ | 1,019,847 | $ | 180,692 | $ | 108,936 | $ | 23,983 | $ | 6,226 | $ | 319,838 | |||||||||||||||||
(1) Includes non-cash expenses incurred by the hotels due to the straight lining of the rent from ground lease obligations and the non-cash amortization of intangible assets and liabilities.
(2) Represents the operating results of the Kimpton Fort Lauderdale Beach Resort, which is non-comparable since the hotel opened during 2021.
(3) Represents the pre-acquisition operating results of our 2021 and 2022 acquisitions (excluding the Kimpton Fort Lauderdale Beach Resort).
| Hotel Adjusted EBITDA Reconciliation - Year to Date 2021 | |||||||||||||||||||||||||||||
| Days of Operation | Net Income /(Loss) | Plus: | Plus: | Plus: | Equals: Hotel | ||||||||||||||||||||||||
| Total Revenues | Depreciation | Interest Expense | Adjustments (1) | Adjusted EBITDA | |||||||||||||||||||||||||
| Atlanta Marriott Alpharetta | 365 | $ | 7,840 | $ | 164 | $ | 1,373 | $ | — | $ | — | $ | 1,537 | ||||||||||||||||
| Bourbon Orleans Hotel | 156 | $ | 4,951 | $ | 270 | $ | 1,350 | $ | — | $ | 11 | $ | 1,631 | ||||||||||||||||
| Cavallo Point, The Lodge at the Golden Gate | 365 | $ | 33,511 | $ | 2,641 | $ | 7,583 | $ | — | $ | 375 | $ | 10,599 | ||||||||||||||||
| Chicago Marriott Downtown Magnificent Mile | 263 | $ | 38,629 | $ | (13,058) | $ | 16,310 | $ | 59 | $ | (1,589) | $ | 1,722 | ||||||||||||||||
| Courtyard Denver Downtown | 365 | $ | 7,036 | $ | 994 | $ | 1,512 | $ | — | $ | — | $ | 2,506 | ||||||||||||||||
| Courtyard New York Manhattan/Fifth Avenue | 214 | $ | 8,212 | $ | (4,759) | $ | 1,317 | $ | — | $ | 1,014 | $ | (2,428) | ||||||||||||||||
| Courtyard New York Manhattan/Midtown East | 365 | $ | 18,617 | $ | (5,052) | $ | 1,940 | $ | 3,716 | $ | — | $ | 604 | ||||||||||||||||
| Embassy Suites by Hilton Bethesda | 365 | $ | 4,897 | $ | (9,707) | $ | 2,116 | $ | — | $ | 5,976 | $ | (1,615) | ||||||||||||||||
| Frenchman's Reef & Morning Star Marriott Beach Resort | — | $ | — | $ | — | $ | — | $ | — | $ | — | $ | — | ||||||||||||||||
| Havana Cabana Key West | 365 | $ | 13,523 | $ | 5,028 | $ | 1,075 | $ | — | $ | — | $ | 6,103 | ||||||||||||||||
| Henderson Beach Resort | 9 | $ | 788 | $ | 212 | $ | — | $ | — | $ | — | $ | 212 | ||||||||||||||||
| Henderson Park Inn | 155 | $ | 3,677 | $ | 1,110 | $ | 365 | $ | — | $ | — | $ | 1,475 | ||||||||||||||||
| Hilton Boston Downtown/Faneuil Hall | 365 | $ | 19,999 | $ | (1,475) | $ | 4,251 | $ | — | $ | — | $ | 2,776 | ||||||||||||||||
| Hilton Burlington Lake Champlain | 365 | $ | 15,188 | $ | 3,342 | $ | 2,389 | $ | — | $ | — | $ | 5,731 | ||||||||||||||||
| Hilton Garden Inn New York/Times Square Central | 243 | $ | 12,260 | $ | (4,305) | $ | 3,086 | $ | — | $ | — | $ | (1,219) | ||||||||||||||||
| Hotel Clio | 365 | $ | 19,613 | $ | (1,045) | $ | 3,137 | $ | 2,645 | $ | 19 | $ | 4,756 | ||||||||||||||||
| Hotel Emblem San Francisco | 365 | $ | 2,971 | $ | (2,070) | $ | 1,229 | $ | — | $ | — | $ | (841) | ||||||||||||||||
| Hotel Palomar Phoenix | 365 | $ | 14,794 | $ | (202) | $ | 2,697 | $ | — | $ | 1,133 | $ | 3,628 | ||||||||||||||||
| Kimpton Shorebreak Resort | 365 | $ | 17,349 | $ | 4,092 | $ | 1,645 | $ | — | $ | — | $ | 5,737 | ||||||||||||||||
| L'Auberge de Sedona | 365 | $ | 33,791 | $ | 10,696 | $ | 1,701 | $ | — | $ | — | $ | 12,397 | ||||||||||||||||
| Margaritaville Beach House Key West | 365 | $ | 27,639 | $ | 10,845 | $ | 2,905 | $ | — | $ | — | $ | 13,750 | ||||||||||||||||
| Orchards Inn Sedona | 365 | $ | 9,285 | $ | 2,664 | $ | 332 | $ | — | $ | 168 | $ | 3,164 | ||||||||||||||||
| Renaissance Charleston Historic District Hotel | 365 | $ | 19,129 | $ | 5,806 | $ | 1,838 | $ | — | $ | — | $ | 7,644 | ||||||||||||||||
| Salt Lake City Marriott Downtown at City Creek | 365 | $ | 16,356 | $ | (194) | $ | 2,064 | $ | 2,068 | $ | 32 | $ | 3,970 | ||||||||||||||||
| The Gwen Hotel | 365 | $ | 23,517 | $ | (2,022) | $ | 4,361 | $ | — | $ | — | $ | 2,339 | ||||||||||||||||
| The Hythe Vail | 365 | $ | 26,393 | $ | 3,210 | $ | 4,163 | $ | — | $ | — | $ | 7,373 | ||||||||||||||||
| The Landing Lake Tahoe Resort & Spa | 365 | $ | 9,844 | $ | 2,745 | $ | 1,696 | $ | — | $ | — | $ | 4,441 | ||||||||||||||||
| The Lexington Hotel | — | $ | 60 | $ | (6,629) | $ | 1,925 | $ | 13 | $ | 16 | $ | (4,675) | ||||||||||||||||
| The Lodge at Sonoma Resort | 365 | $ | 21,478 | $ | 1,474 | $ | 2,253 | $ | 1,067 | $ | — | $ | 4,794 | ||||||||||||||||
| Westin Boston Seaport District | 365 | $ | 37,211 | $ | (18,188) | $ | 10,097 | $ | 8,333 | $ | (490) | $ | (248) | ||||||||||||||||
| Westin Fort Lauderdale Beach Resort | 365 | $ | 48,956 | $ | 8,144 | $ | 4,303 | $ | — | $ | — | $ | 12,447 | ||||||||||||||||
| Westin San Diego Bayview | 365 | $ | 16,676 | $ | (2,740) | $ | 3,268 | $ | 2,406 | $ | — | $ | 2,934 | ||||||||||||||||
| Westin Washington D.C. City Center | 365 | $ | 7,953 | $ | (9,528) | $ | 4,231 | $ | 2,459 | $ | — | $ | (2,838) | ||||||||||||||||
| Worthington Renaissance Fort Worth Hotel | 365 | $ | 24,991 | $ | (2,764) | $ | 4,451 | $ | 2,995 | $ | 8 | $ | 4,690 | ||||||||||||||||
| Total | $ | 567,134 | $ | (20,301) | $ | 102,963 | $ | 25,761 | $ | 6,673 | $ | 115,143 | |||||||||||||||||
Add: Prior Ownership Results (2) | $ | 91,544 | $ | 17,106 | $ | 7,217 | $ | — | $ | — | $ | 24,323 | |||||||||||||||||
Less: Sold Hotels (3) | $ | (60) | $ | 6,629 | $ | (1,925) | $ | (13) | $ | (16) | $ | 4,675 | |||||||||||||||||
| Comparable Total | $ | 658,618 | $ | 3,434 | $ | 108,255 | $ | 25,748 | $ | 6,657 | $ | 144,141 | |||||||||||||||||
(2) Represents the pre-acquisition operating results of our 2021 and 2022 acquisitions (excluding the Kimpton Fort Lauderdale Beach Resort).
(3) Represents the operating results of Frenchman's Reef and The Lexington Hotel.
| Hotel Adjusted EBITDA Reconciliation - Year to Date 2019 | |||||||||||||||||||||||||||||
| Plus: | Plus: | Plus: | Equals: | ||||||||||||||||||||||||||
| Days of Operation | Total Revenues | Net Income / (Loss) | Depreciation | Interest Expense | Adjustments (1) | Hotel Adjusted EBITDA | |||||||||||||||||||||||
| Atlanta Marriott Alpharetta | 365 | $ | 19,586 | $ | 5,050 | $ | 1,796 | $ | — | $ | — | $ | 6,846 | ||||||||||||||||
| Cavallo Point, The Lodge at the Golden Gate | 365 | $ | 40,610 | $ | 3,298 | $ | 7,371 | $ | — | $ | 315 | $ | 10,984 | ||||||||||||||||
| Chicago Marriott Downtown Magnificent Mile | 365 | $ | 112,262 | $ | 16,876 | $ | 16,710 | $ | 116 | $ | (1,589) | $ | 32,113 | ||||||||||||||||
| Courtyard Denver Downtown | 365 | $ | 11,306 | $ | 4,133 | $ | 1,206 | $ | — | $ | — | $ | 5,339 | ||||||||||||||||
| Courtyard New York Manhattan/Fifth Avenue | 365 | $ | 16,187 | $ | 26 | $ | 1,781 | $ | — | $ | 1,014 | $ | 2,821 | ||||||||||||||||
| Courtyard New York Manhattan/Midtown East | 365 | $ | 30,424 | $ | 1,315 | $ | 2,781 | $ | 3,856 | $ | — | $ | 7,952 | ||||||||||||||||
| Embassy Suites by Hilton Bethesda | 365 | $ | 17,339 | $ | (2,691) | $ | 1,890 | $ | — | $ | 6,068 | $ | 5,267 | ||||||||||||||||
| Frenchman's Reef & Morning Star Marriott Beach Resort | — | $ | — | $ | 8,799 | $ | — | $ | — | $ | — | $ | 8,799 | ||||||||||||||||
| Havana Cabana Key West | 365 | $ | 9,771 | $ | 2,447 | $ | 979 | $ | — | $ | — | $ | 3,426 | ||||||||||||||||
| Hilton Boston Downtown/Faneuil Hall | 365 | $ | 42,339 | $ | 11,784 | $ | 4,931 | $ | — | $ | — | $ | 16,715 | ||||||||||||||||
| Hilton Burlington Lake Champlain | 365 | $ | 18,572 | $ | 5,134 | $ | 2,002 | $ | — | $ | — | $ | 7,136 | ||||||||||||||||
| Hilton Garden Inn New York/Times Square Central | 365 | $ | 26,375 | $ | 3,916 | $ | 3,349 | $ | — | $ | — | $ | 7,265 | ||||||||||||||||
| Hotel Clio | 365 | $ | 19,429 | $ | (1,179) | $ | 2,798 | $ | 2,751 | $ | 24 | $ | 4,394 | ||||||||||||||||
| Hotel Emblem San Francisco | 365 | $ | 7,904 | $ | 643 | $ | 1,153 | $ | — | $ | — | $ | 1,796 | ||||||||||||||||
| Hotel Palomar Phoenix | 365 | $ | 24,701 | $ | 3,478 | $ | 2,671 | $ | 154 | $ | 1,177 | $ | 7,480 | ||||||||||||||||
| Kimpton Shorebreak Resort | 365 | $ | 17,365 | $ | 3,832 | $ | 1,485 | $ | — | $ | 162 | $ | 5,479 | ||||||||||||||||
| L'Auberge de Sedona | 365 | $ | 26,868 | $ | 5,623 | $ | 2,119 | $ | — | $ | — | $ | 7,742 | ||||||||||||||||
| Margaritaville Beach House Key West | 365 | $ | 15,895 | $ | 3,380 | $ | 1,567 | $ | — | $ | — | $ | 4,947 | ||||||||||||||||
| Orchards Inn Sedona | 365 | $ | 7,730 | $ | 1,061 | $ | 951 | $ | — | $ | 168 | $ | 2,180 | ||||||||||||||||
| Renaissance Charleston Historic District Hotel | 365 | $ | 15,738 | $ | 4,663 | $ | 1,665 | $ | — | $ | (126) | $ | 6,202 | ||||||||||||||||
| Salt Lake City Marriott Downtown at City Creek | 365 | $ | 31,554 | $ | 6,796 | $ | 2,228 | $ | 2,421 | $ | — | $ | 11,445 | ||||||||||||||||
| The Gwen Hotel | 365 | $ | 34,431 | $ | 5,185 | $ | 4,442 | $ | — | $ | — | $ | 9,627 | ||||||||||||||||
| The Hythe Vail, a Luxury Collection Resort | 365 | $ | 36,128 | $ | 6,827 | $ | 4,133 | $ | — | $ | — | $ | 10,960 | ||||||||||||||||
| The Landing Lake Tahoe Resort & Spa | 365 | $ | 9,522 | $ | 118 | $ | 1,590 | $ | — | $ | — | $ | 1,708 | ||||||||||||||||
| The Lexington Hotel | 365 | $ | 68,886 | $ | 745 | $ | 14,305 | $ | 23 | $ | 32 | $ | 15,105 | ||||||||||||||||
| The Lodge at Sonoma Resort | 365 | $ | 24,645 | $ | 3,771 | $ | 2,076 | $ | 1,119 | $ | — | $ | 6,966 | ||||||||||||||||
| Westin Boston Seaport District | 365 | $ | 93,355 | $ | 7,082 | $ | 9,817 | $ | 8,677 | $ | (240) | $ | 25,336 | ||||||||||||||||
| Westin Fort Lauderdale Beach Resort | 365 | $ | 50,992 | $ | 9,083 | $ | 6,487 | $ | — | $ | — | $ | 15,570 | ||||||||||||||||
| Westin San Diego Bayview | 365 | $ | 33,560 | $ | 4,939 | $ | 4,548 | $ | 2,534 | $ | — | $ | 12,021 | ||||||||||||||||
| Westin Washington D.C. City Center | 365 | $ | 33,242 | $ | 2,518 | $ | 5,319 | $ | 2,643 | $ | — | $ | 10,480 | ||||||||||||||||
| Worthington Renaissance Fort Worth Hotel | 365 | $ | 41,375 | $ | 6,378 | $ | 3,960 | $ | 3,120 | $ | 8 | $ | 13,466 | ||||||||||||||||
| Total | $ | 938,091 | $ | 135,030 | $ | 118,110 | $ | 27,414 | $ | 7,013 | $ | 287,443 | |||||||||||||||||
Add: Prior Ownership Results (2) | $ | 84,130 | $ | 9,731 | $ | 8,154 | $ | — | $ | — | $ | 17,885 | |||||||||||||||||
Less: Sold Hotels (3) | $ | (68,886) | $ | (9,544) | $ | (14,305) | $ | (23) | $ | (32) | $ | (23,904) | |||||||||||||||||
| Comparable Total | $ | 953,335 | $ | 135,217 | $ | 111,959 | $ | 27,391 | $ | 6,981 | $ | 281,424 | |||||||||||||||||
(1) Includes non-cash expenses incurred by the hotels due to the straight lining of the rent from ground lease obligations and the non-cash amortization of intangible assets and liabilities.
(2) Represents the pre-acquisition operating results of our 2021 and 2022 acquisitions (excluding the Kimpton Fort Lauderdale Beach Resort).
(3) Represents the operating results of Frenchman's Reef and The Lexington Hotel.
INVESTOR UPDATE FEBRUARY 2023 LAKE AUSTIN SPA RESORT
FORWARD LOOKING STATEMENTS & USE OF NON-GAAP FINANCIAL MEASURES FORWARD LOOKING STATEMENTS Certain statements made during this presentation are forward-looking statements that are subject to risks and uncertainties. Forward-looking statements generally include the words “believe,” “expect,” “anticipate,” “plan,” “estimate,” “project,” “will,” “intend” or other similar expressions. Forward-looking statements include, without limitation, statements regarding industry outlook, results of operations, cash flows, business strategies, growth and value opportunities, capital and other expenditures, financing plans, expense reduction initiatives and projected dispositions. Factors that could cause actual results to materially differ from those contained in the forward-looking statements include, without limitation, national and local economic and business conditions, including the impact of COVID-19 on occupancy rates at DiamondRock Hospitality Company’s (the "Company“) hotels and the demand for hotel products and services, and those risks and uncertainties discussed in the most recent Annual Report on Form 10-K, which the Company has filed with the Securities and Exchange Commission, and in our other public filings which you should carefully review. The forward-looking statements made are based on our beliefs, assumptions and expectations of future performance, taking into account all information currently available to the Company. Actual results could differ materially from the forward-looking statements made in this presentation. The forward-looking statements made in this presentation are subject to the safe harbor of the Private Securities Litigation Reform Act of 1995. Any forward-looking statement speaks only as of the date on which it is made. Although the Company believes the expectations reflect ed in such forward-looking statements are based upon reasonable assumptions, it can give no assurance that the expectations will be attained or that any deviation will not be material. All information in this presentation is as of the date of this presentation, and the Company undertakes no obligation to update any forward-looking statement to conform the statement to actual results or changes in the Company’s expectations. This presentation contains statistics and other data that has been obtained or compiled from information made available by third-party service providers and believed to be reliable, but the accuracy and completeness of the information is not assured. The Company has not independently verified any such information. 2 USE OF NON-GAAP FINANCIAL MEASURES We use the following non-GAAP financial measures that we believe are useful to investors as key measures of our operating performance: EBITDA, EBITDAre, Adjusted EBITDA, Hotel EBITDA, Hotel Adjusted EBITDA, FFO and Adjusted FFO. These measures should not be considered in isolation or as a substitute for measures of performance in accordance with U.S. GAAP. EBITDA, EBITDAre, Adjusted EBITDA, Hotel EBITDA, Hotel Adjusted EBITDA, FFO and Adjusted FFO, as calculated by us, may not be comparable to other companies that do not define such terms exactly as the Company. A detailed explanation of these non-GAAP financial measures and the reconciliation of such measures to the most directly comparable financial measures prepared in accordance with U.S. GAAP can be found in the Company’s fourth quarter 2022 earnings press release dated February 21, 2023.
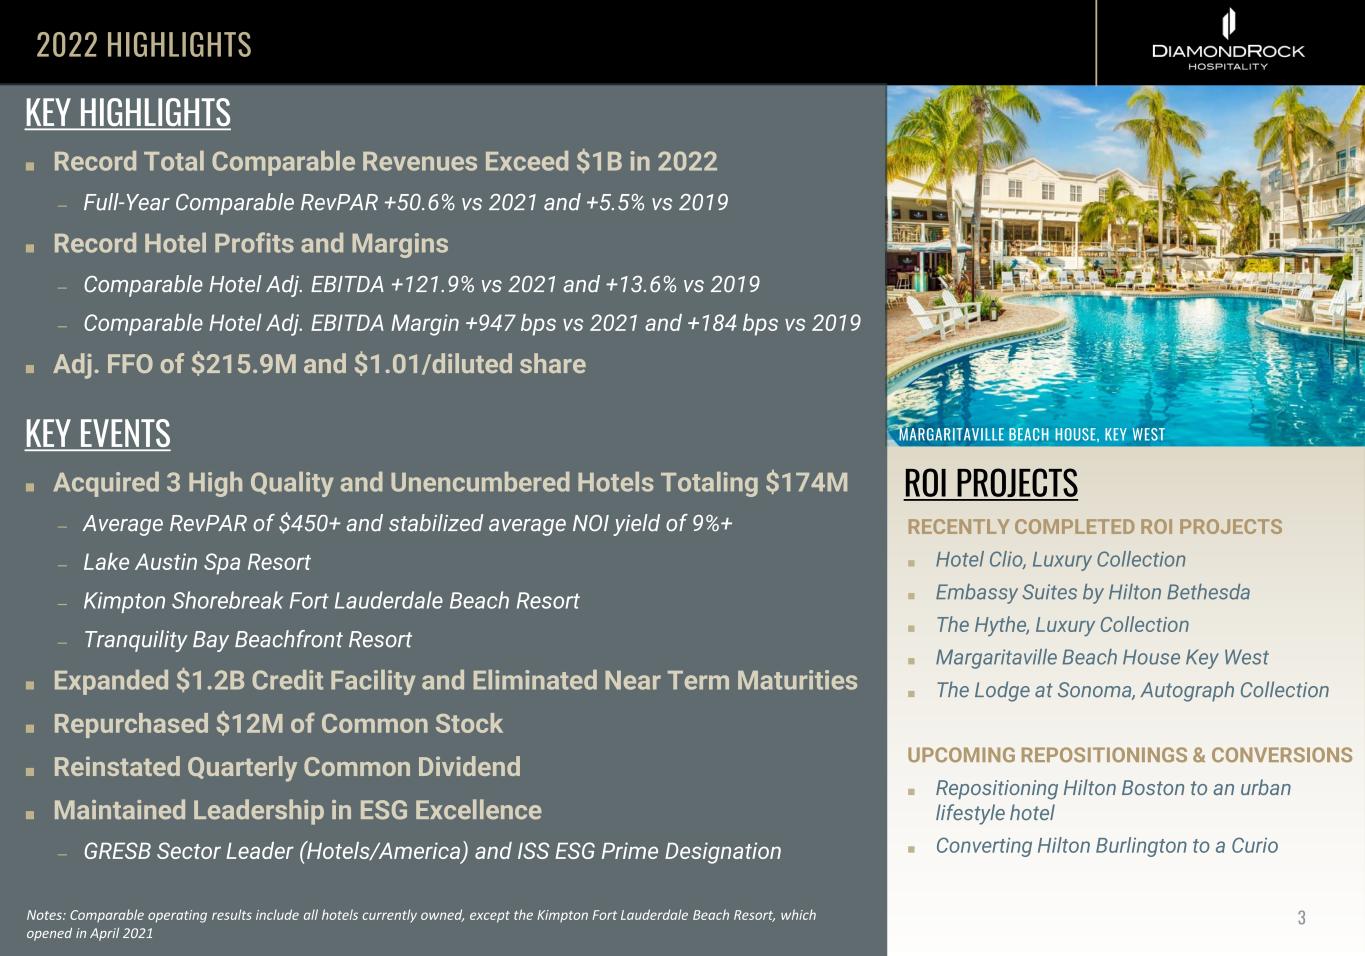
2022 HIGHLIGHTS ROI PROJECTS 3 RECENTLY COMPLETED ROI PROJECTS ■ Hotel Clio, Luxury Collection ■ Embassy Suites by Hilton Bethesda ■ The Hythe, Luxury Collection ■ Margaritaville Beach House Key West ■ The Lodge at Sonoma, Autograph Collection UPCOMING REPOSITIONINGS & CONVERSIONS ■ Repositioning Hilton Boston to an urban lifestyle hotel ■ Converting Hilton Burlington to a Curio MARGARITAVILLE BEACH HOUSE, KEY WEST KEY HIGHLIGHTS ■ Record Total Comparable Revenues Exceed $1B in 2022 ̶ Full-Year Comparable RevPAR +50.6% vs 2021 and +5.5% vs 2019 ■ Record Hotel Profits and Margins ̶ Comparable Hotel Adj. EBITDA +121.9% vs 2021 and +13.6% vs 2019 ̶ Comparable Hotel Adj. EBITDA Margin +947 bps vs 2021 and +184 bps vs 2019 ■ Adj. FFO of $215.9M and $1.01/diluted share KEY EVENTS ■ Acquired 3 High Quality and Unencumbered Hotels Totaling $174M ̶ Average RevPAR of $450+ and stabilized average NOI yield of 9%+ ̶ Lake Austin Spa Resort ̶ Kimpton Shorebreak Fort Lauderdale Beach Resort ̶ Tranquility Bay Beachfront Resort ■ Expanded $1.2B Credit Facility and Eliminated Near Term Maturities ■ Repurchased $12M of Common Stock ■ Reinstated Quarterly Common Dividend ■ Maintained Leadership in ESG Excellence ̶ GRESB Sector Leader (Hotels/America) and ISS ESG Prime Designation Notes: Comparable operating results include all hotels currently owned, except the Kimpton Fort Lauderdale Beach Resort, which opened in April 2021

OPERATIONAL EXCELLENCE THE GWEN, A LUXURY COLLECTION HOTEL
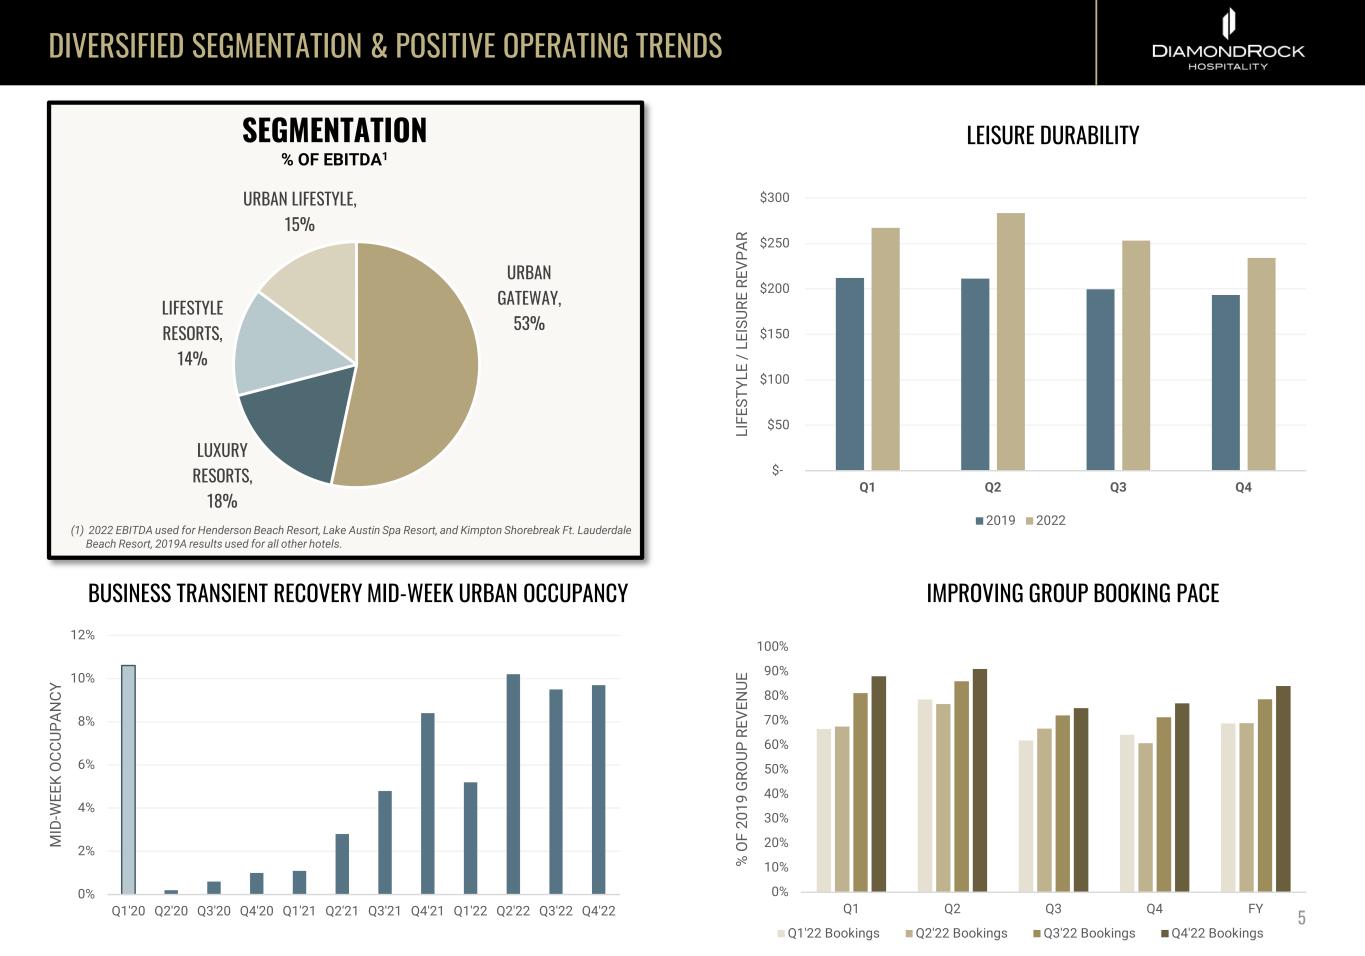
DIVERSIFIED SEGMENTATION & POSITIVE OPERATING TRENDS SEGMENTATION % OF EBITDA1 BUSINESS TRANSIENT RECOVERY MID-WEEK URBAN OCCUPANCY IMPROVING GROUP BOOKING PACE LEISURE DURABILITY 5 $- $50 $100 $150 $200 $250 $300 Q1 Q2 Q3 Q4 LI FE ST YL E / LE IS UR E RE VP AR 2019 2022 0% 2% 4% 6% 8% 10% 12% Q1'20 Q2'20 Q3'20 Q4'20 Q1'21 Q2'21 Q3'21 Q4'21 Q1'22 Q2'22 Q3'22 Q4'22 M ID -W EE K O CC UP AN CY 0% 10% 20% 30% 40% 50% 60% 70% 80% 90% 100% Q1 Q2 Q3 Q4 FY % O F 20 19 G RO UP R EV EN UE Q1'22 Bookings Q2'22 Bookings Q3'22 Bookings Q4'22 Bookings LUXURY RESORTS, 18% LIFESTYLE RESORTS, 14% URBAN LIFESTYLE, 15% URBAN GATEWAY, 53% (1) 2022 EBITDA used for Henderson Beach Resort, Lake Austin Spa Resort, and Kimpton Shorebreak Ft. Lauderdale Beach Resort, 2019A results used for all other hotels.
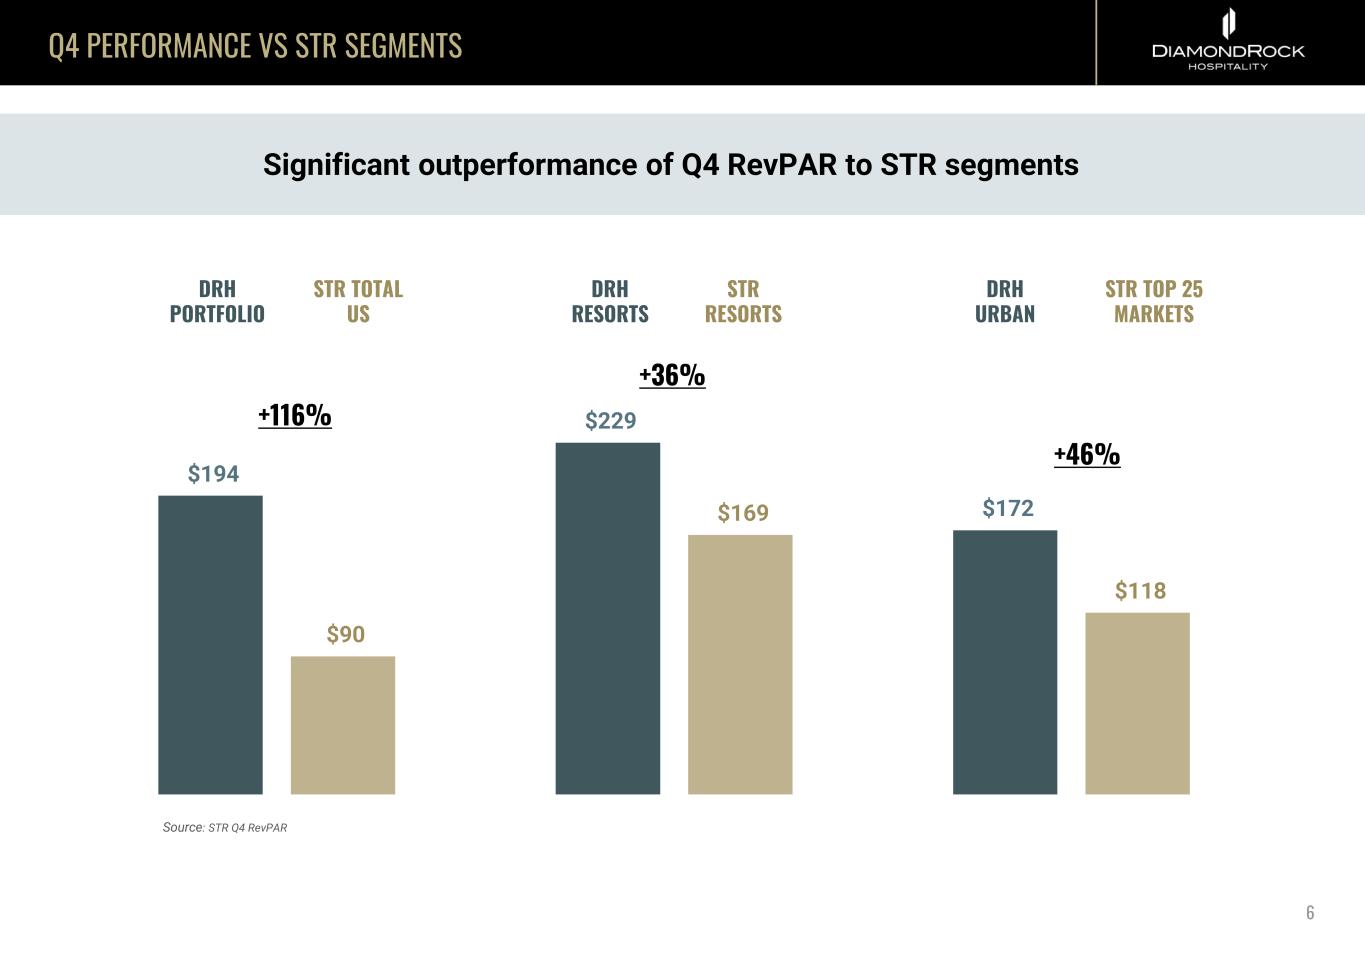
Q4 PERFORMANCE VS STR SEGMENTS 6 $194 $90 $229 $169 $172 $118 Significant outperformance of Q4 RevPAR to STR segments DRH PORTFOLIO STR TOTAL US DRH RESORTS STR RESORTS DRH URBAN STR TOP 25 MARKETS +116% +36% +46% Source: STR Q4 RevPAR
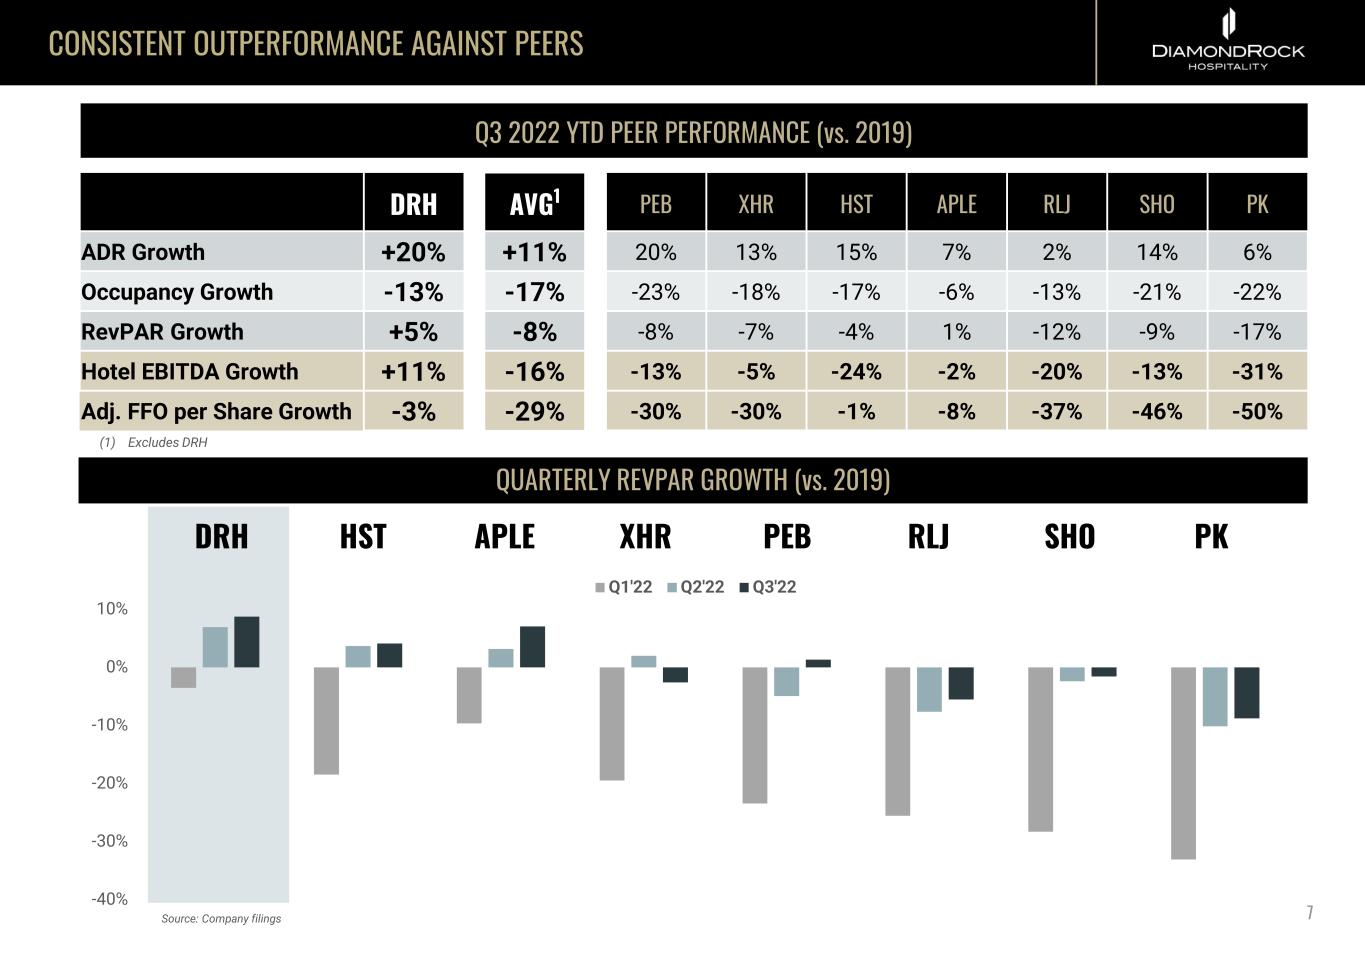
CONSISTENT OUTPERFORMANCE AGAINST PEERS QUARTERLY REVPAR GROWTH (vs. 2019) 7Source: Company filings (1) Excludes DRH -40% -30% -20% -10% 0% 10% Q1'22 Q2'22 Q3'22 DRH HST APLE XHR PEB RLJ SHO PK Q3 2022 YTD PEER PERFORMANCE (vs. 2019) DRH AVG1 PEB XHR HST APLE RLJ SHO PK ADR Growth +20% +11% 20% 13% 15% 7% 2% 14% 6% Occupancy Growth -13% -17% -23% -18% -17% -6% -13% -21% -22% RevPAR Growth +5% -8% -8% -7% -4% 1% -12% -9% -17% Hotel EBITDA Growth +11% -16% -13% -5% -24% -2% -20% -13% -31% Adj. FFO per Share Growth -3% -29% -30% -30% -1% -8% -37% -46% -50%
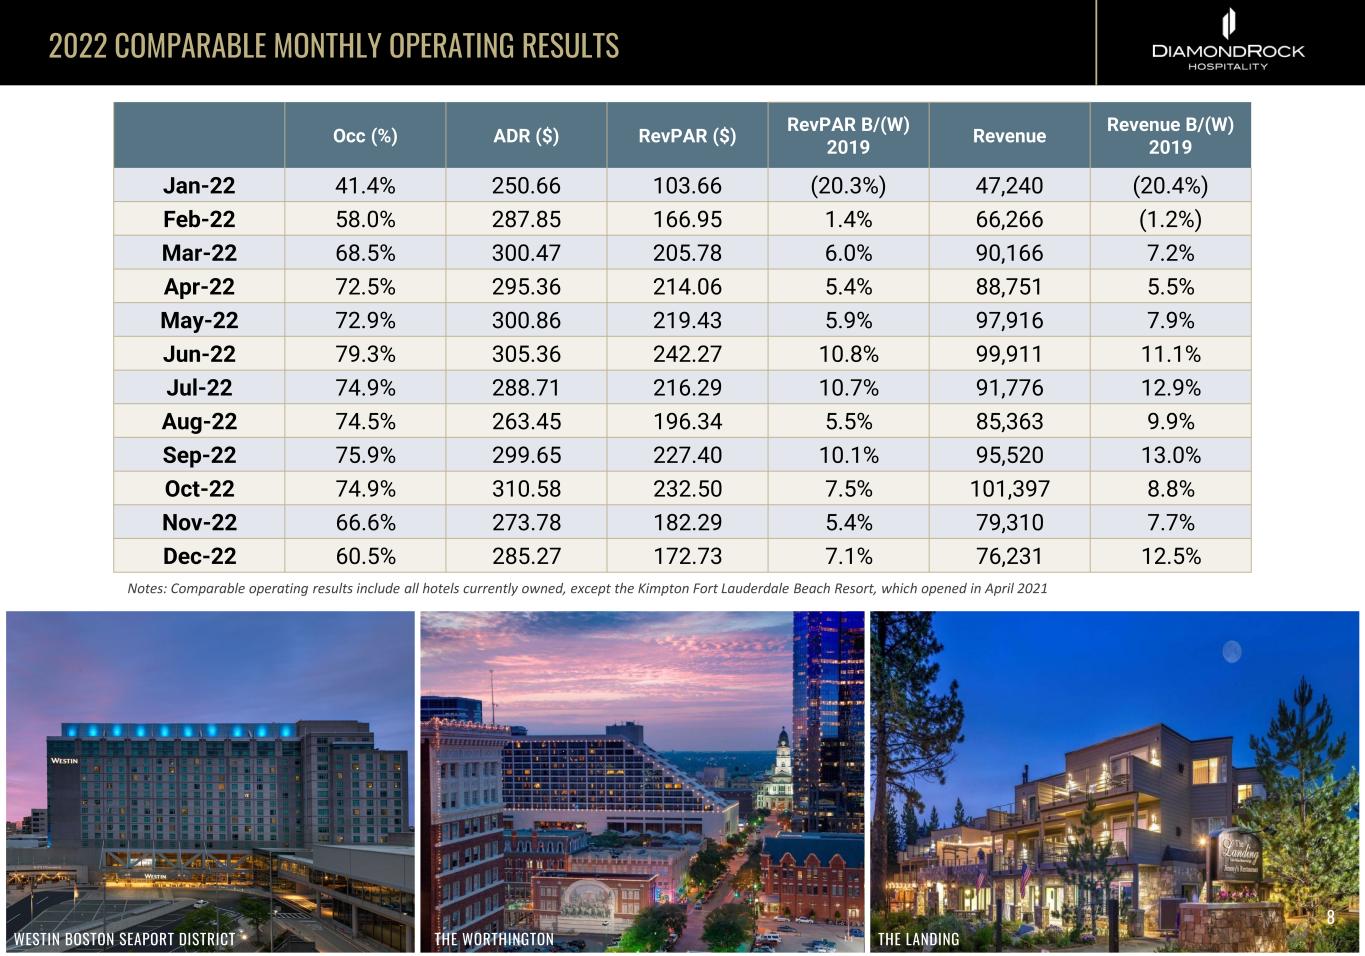
2022 COMPARABLE MONTHLY OPERATING RESULTS Occ (%) ADR ($) RevPAR ($) RevPAR B/(W) 2019 Revenue Revenue B/(W) 2019 Jan-22 41.4% 250.66 103.66 (20.3%) 47,240 (20.4%) Feb-22 58.0% 287.85 166.95 1.4% 66,266 (1.2%) Mar-22 68.5% 300.47 205.78 6.0% 90,166 7.2% Apr-22 72.5% 295.36 214.06 5.4% 88,751 5.5% May-22 72.9% 300.86 219.43 5.9% 97,916 7.9% Jun-22 79.3% 305.36 242.27 10.8% 99,911 11.1% Jul-22 74.9% 288.71 216.29 10.7% 91,776 12.9% Aug-22 74.5% 263.45 196.34 5.5% 85,363 9.9% Sep-22 75.9% 299.65 227.40 10.1% 95,520 13.0% Oct-22 74.9% 310.58 232.50 7.5% 101,397 8.8% Nov-22 66.6% 273.78 182.29 5.4% 79,310 7.7% Dec-22 60.5% 285.27 172.73 7.1% 76,231 12.5% Notes: Comparable operating results include all hotels currently owned, except the Kimpton Fort Lauderdale Beach Resort, which opened in April 2021 8 WESTIN BOSTON SEAPORT DISTRICT THE WORTHINGTON THE LANDING
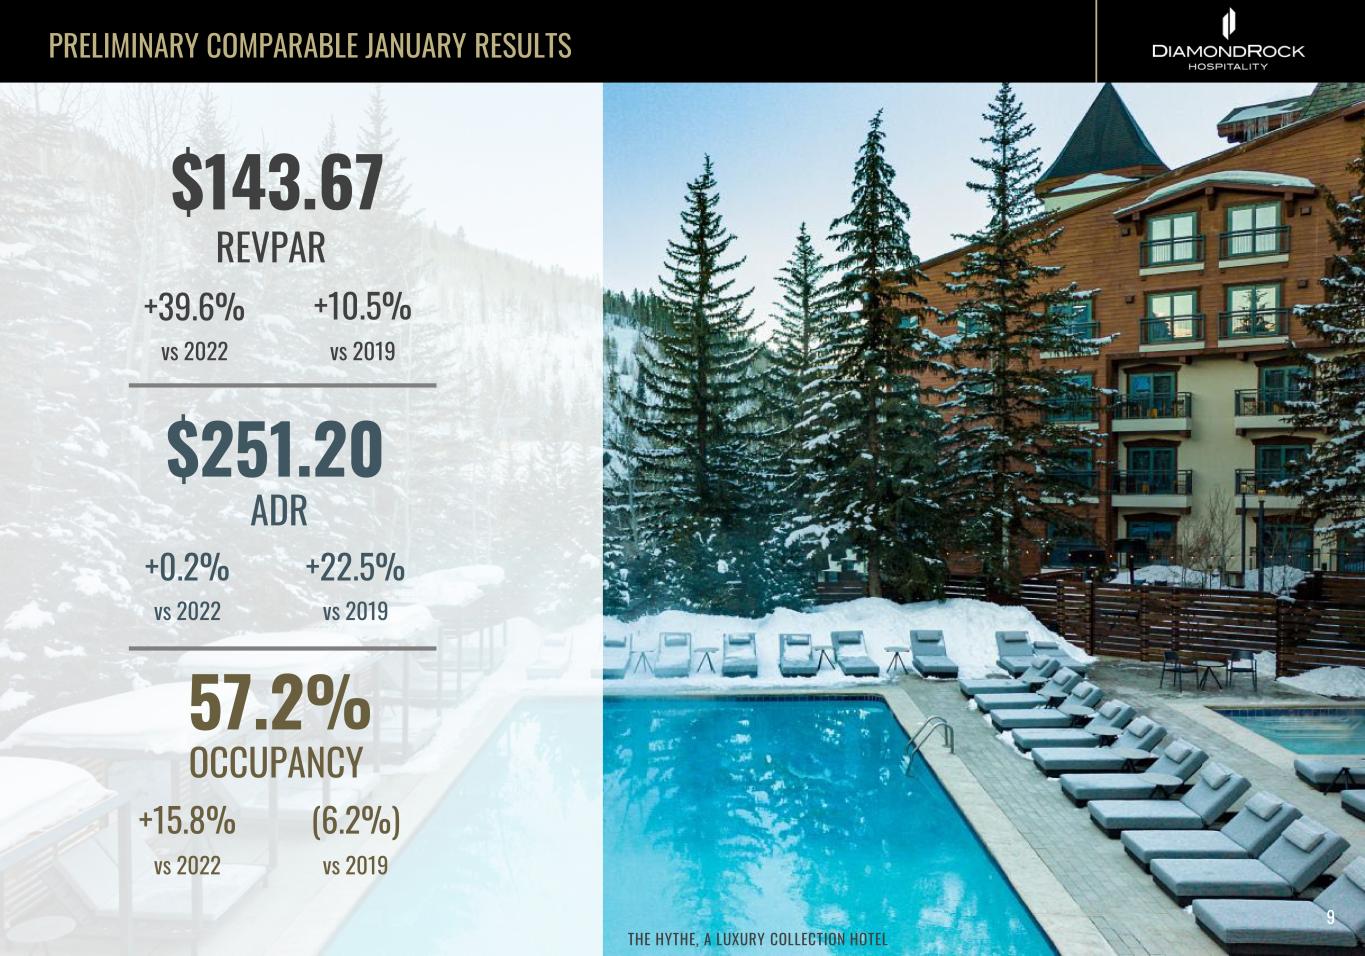
PRELIMINARY COMPARABLE JANUARY RESULTS ADR OCCUPANCY REVPAR +0.2% +22.5% $251.20 vs 2022 vs 2019 57.2% $143.67 +15.8% (6.2%) vs 2022 vs 2019 +39.6% +10.5% vs 2022 vs 2019 THE HYTHE, A LUXURY COLLECTION HOTEL 9
L’Auberge de Sedona CAPACITY FOR GROWTH THE HYTHE, A LUXURY COLLECTION HOTEL
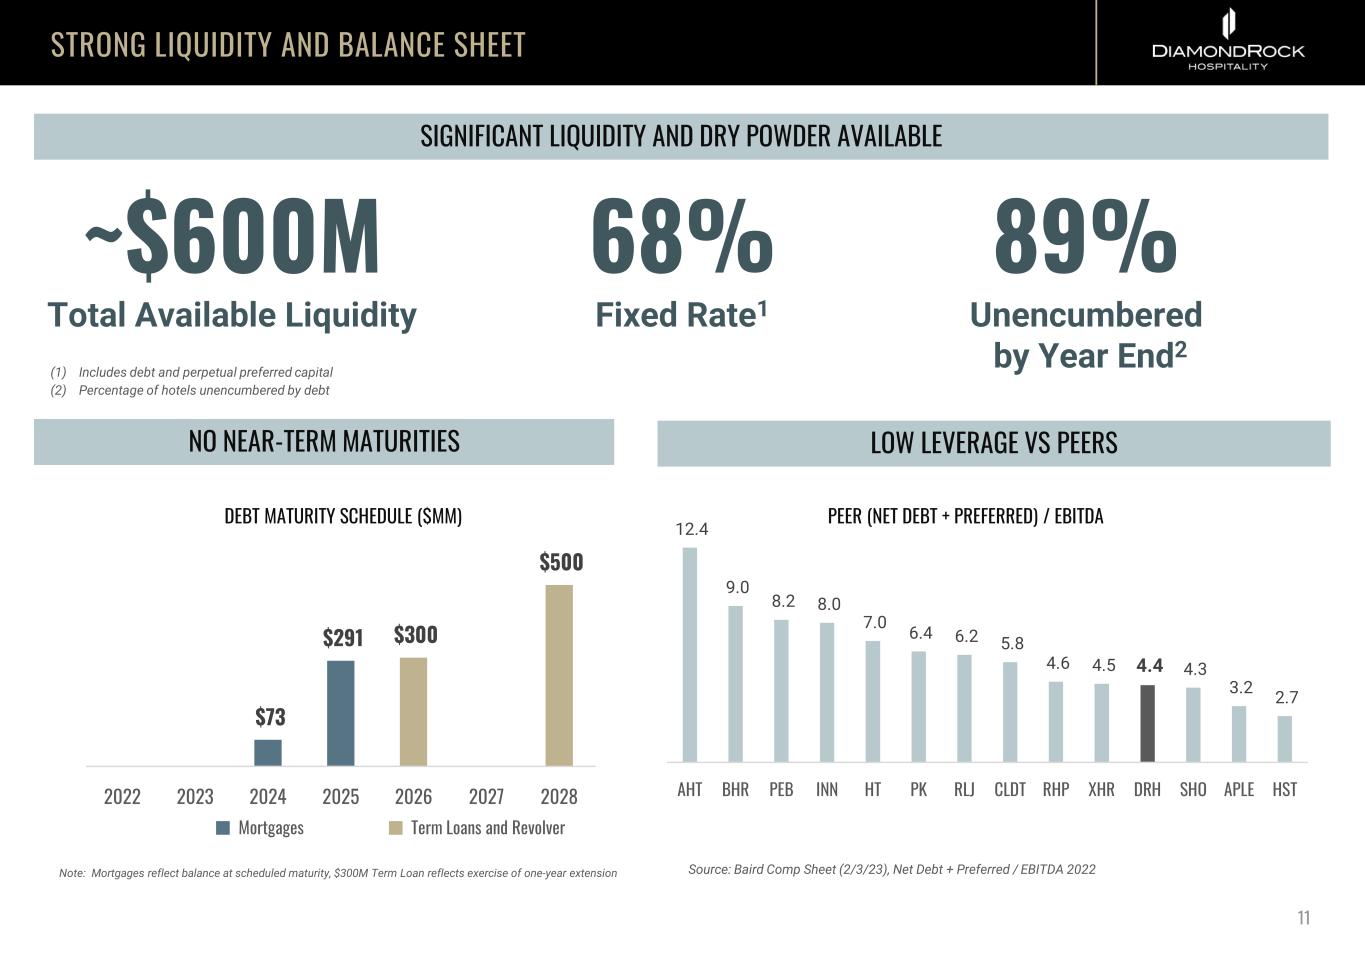
NO NEAR-TERM MATURITIES STRONG LIQUIDITY AND BALANCE SHEET Note: Mortgages reflect balance at scheduled maturity, $300M Term Loan reflects exercise of one-year extension $73 $291 $300 $500 2022 2023 2024 2025 2026 2027 2028 Mortgages Term Loans and Revolver ~$600M Total Available Liquidity 68% Fixed Rate1 89% Unencumbered by Year End2 (1) Includes debt and perpetual preferred capital (2) Percentage of hotels unencumbered by debt LOW LEVERAGE VS PEERS Source: Baird Comp Sheet (2/3/23), Net Debt + Preferred / EBITDA 2022 PEER (NET DEBT + PREFERRED) / EBITDADEBT MATURITY SCHEDULE ($MM) 12.4 9.0 8.2 8.0 7.0 6.4 6.2 5.8 4.6 4.5 4.4 4.3 3.2 2.7 AHT BHR PEB INN HT PK RLJ CLDT RHP XHR DRH SHO APLE HST SIGNIFICANT LIQUIDITY AND DRY POWDER AVAILABLE 11
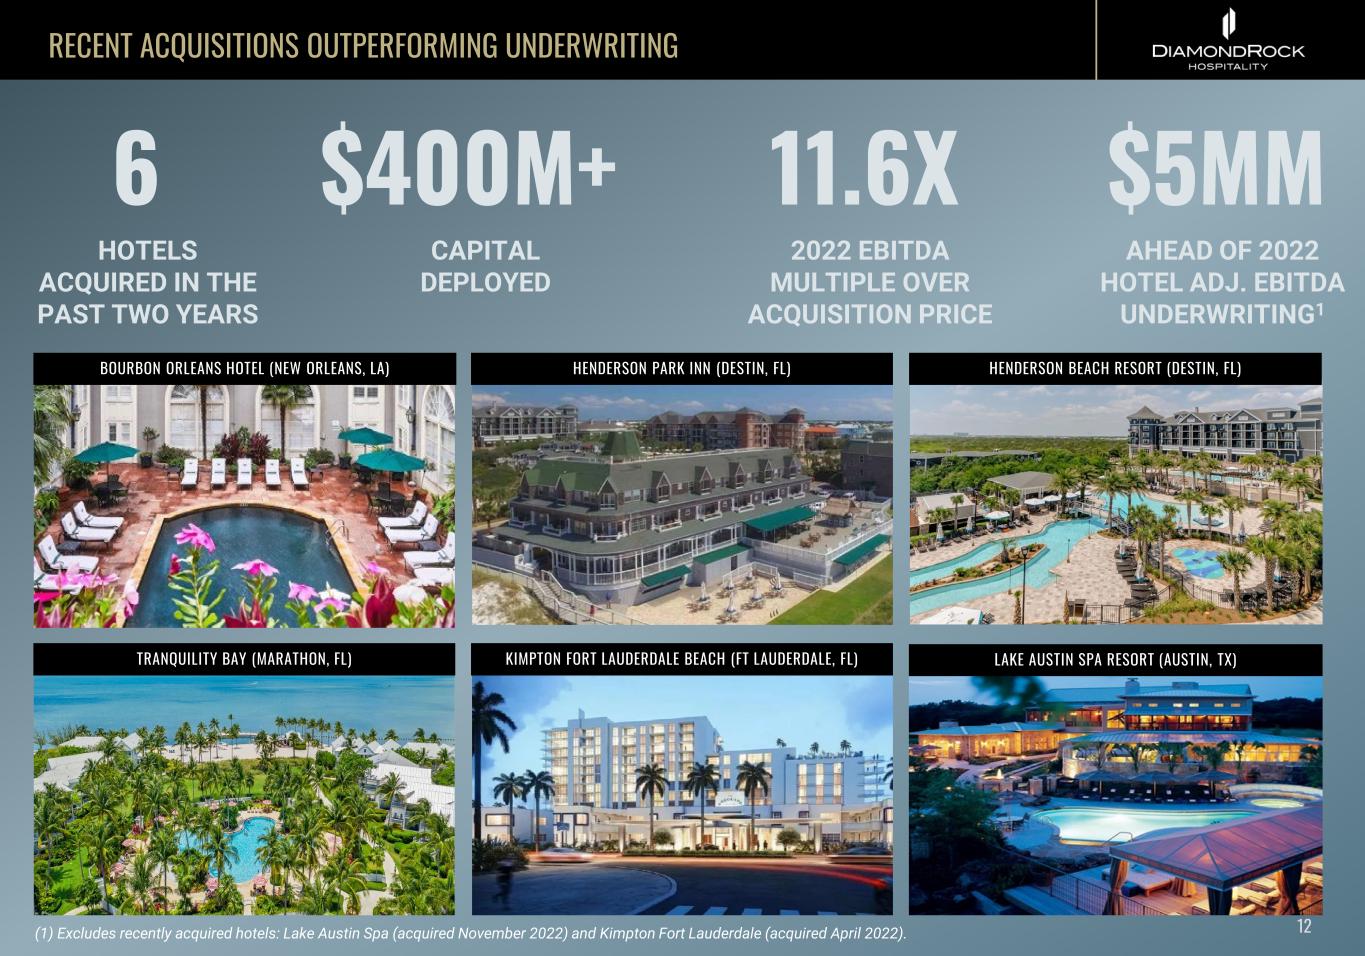
(1) Excludes recently acquired hotels: Lake Austin Spa (acquired November 2022) and Kimpton Fort Lauderdale (acquired April 2022). RECENT ACQUISITIONS OUTPERFORMING UNDERWRITING BOURBON ORLEANS HOTEL (NEW ORLEANS, LA) HENDERSON PARK INN (DESTIN, FL) HENDERSON BEACH RESORT (DESTIN, FL) TRANQUILITY BAY (MARATHON, FL) KIMPTON FORT LAUDERDALE BEACH (FT LAUDERDALE, FL) 12 LAKE AUSTIN SPA RESORT (AUSTIN, TX) 6 HOTELS ACQUIRED IN THE PAST TWO YEARS $5MM AHEAD OF 2022 HOTEL ADJ. EBITDA UNDERWRITING1 $400M+ CAPITAL DEPLOYED 11.6X 2022 EBITDA MULTIPLE OVER ACQUISITION PRICE
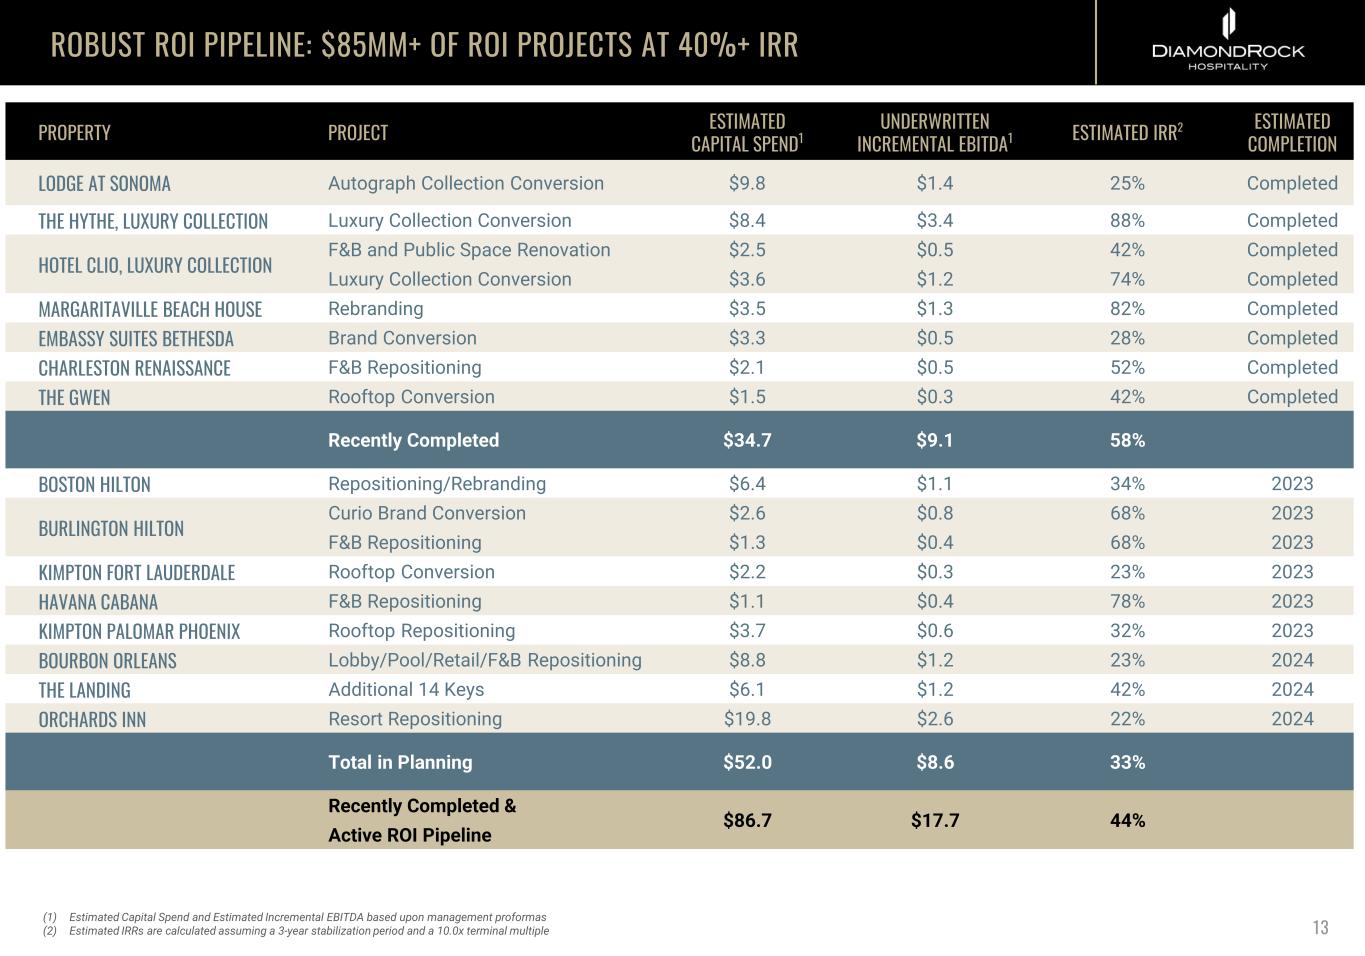
ROBUST ROI PIPELINE: $85MM+ OF ROI PROJECTS AT 40%+ IRR 13(1) Estimated Capital Spend and Estimated Incremental EBITDA based upon management proformas (2) Estimated IRRs are calculated assuming a 3-year stabilization period and a 10.0x terminal multiple PROPERTY PROJECT ESTIMATED CAPITAL SPEND1 UNDERWRITTEN INCREMENTAL EBITDA1 ESTIMATED IRR2 ESTIMATED COMPLETION LODGE AT SONOMA Autograph Collection Conversion $9.8 $1.4 25% Completed THE HYTHE, LUXURY COLLECTION Luxury Collection Conversion $8.4 $3.4 88% Completed HOTEL CLIO, LUXURY COLLECTION F&B and Public Space Renovation $2.5 $0.5 42% Completed Luxury Collection Conversion $3.6 $1.2 74% Completed MARGARITAVILLE BEACH HOUSE Rebranding $3.5 $1.3 82% Completed EMBASSY SUITES BETHESDA Brand Conversion $3.3 $0.5 28% Completed CHARLESTON RENAISSANCE F&B Repositioning $2.1 $0.5 52% Completed THE GWEN Rooftop Conversion $1.5 $0.3 42% Completed Recently Completed $34.7 $9.1 58% BOSTON HILTON Repositioning/Rebranding $6.4 $1.1 34% 2023 BURLINGTON HILTON Curio Brand Conversion $2.6 $0.8 68% 2023 F&B Repositioning $1.3 $0.4 68% 2023 KIMPTON FORT LAUDERDALE Rooftop Conversion $2.2 $0.3 23% 2023 HAVANA CABANA F&B Repositioning $1.1 $0.4 78% 2023 KIMPTON PALOMAR PHOENIX Rooftop Repositioning $3.7 $0.6 32% 2023 BOURBON ORLEANS Lobby/Pool/Retail/F&B Repositioning $8.8 $1.2 23% 2024 THE LANDING Additional 14 Keys $6.1 $1.2 42% 2024 ORCHARDS INN Resort Repositioning $19.8 $2.6 22% 2024 Total in Planning $52.0 $8.6 33% Recently Completed & $86.7 $17.7 44% Active ROI Pipeline
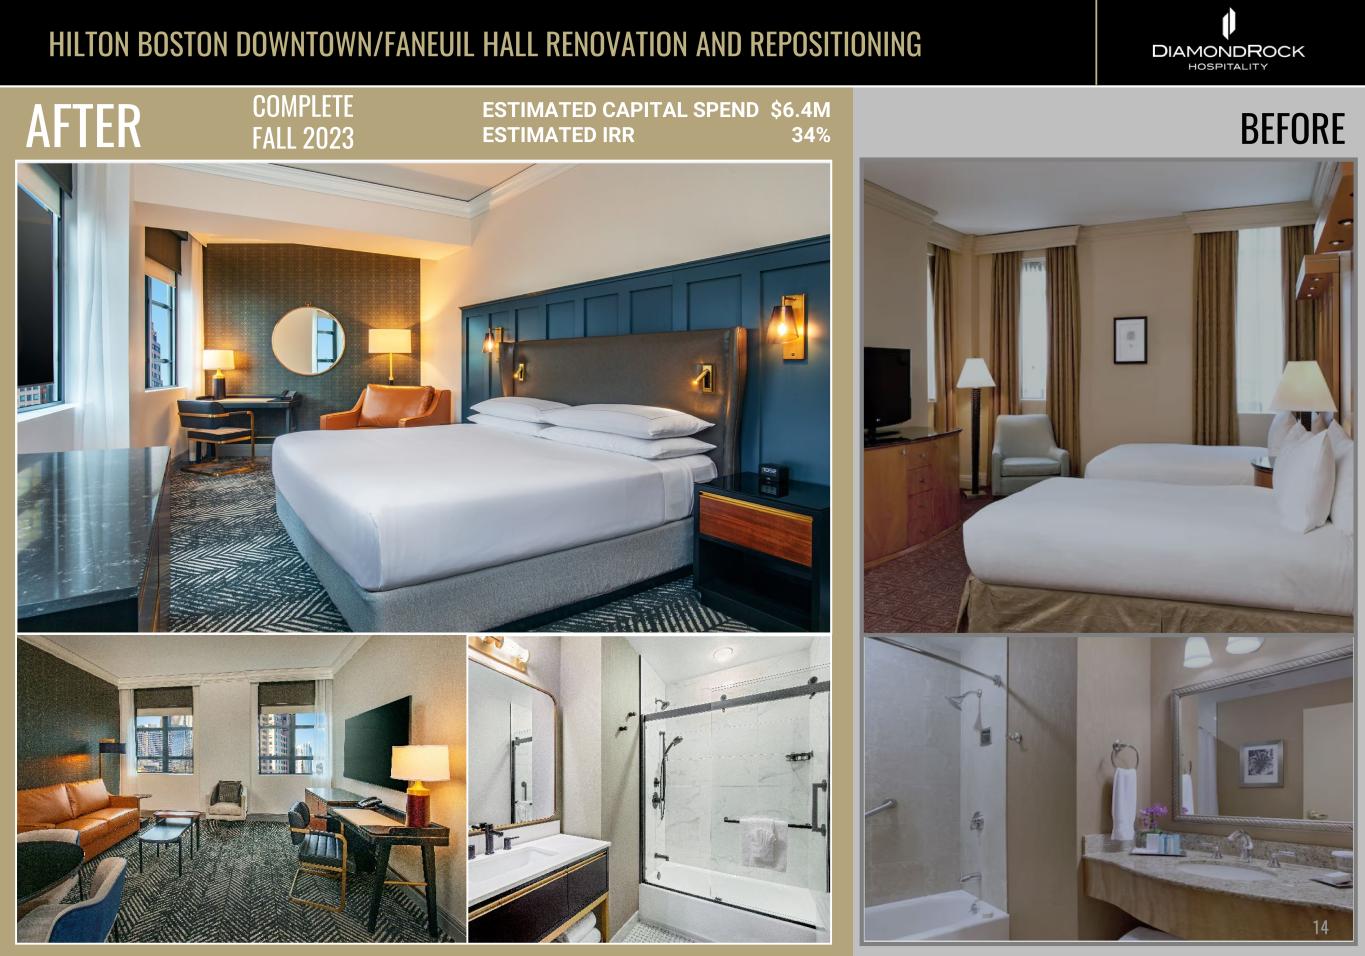
HILTON BOSTON DOWNTOWN/FANEUIL HALL RENOVATION AND REPOSITIONING AFTER BEFORE 14 ESTIMATED CAPITAL SPEND $6.4M ESTIMATED IRR 34% COMPLETE FALL 2023
POSITIVE MARKET OUTLOOK THE LODGE AT SONOMA, AUTOGRAPH COLLECTION
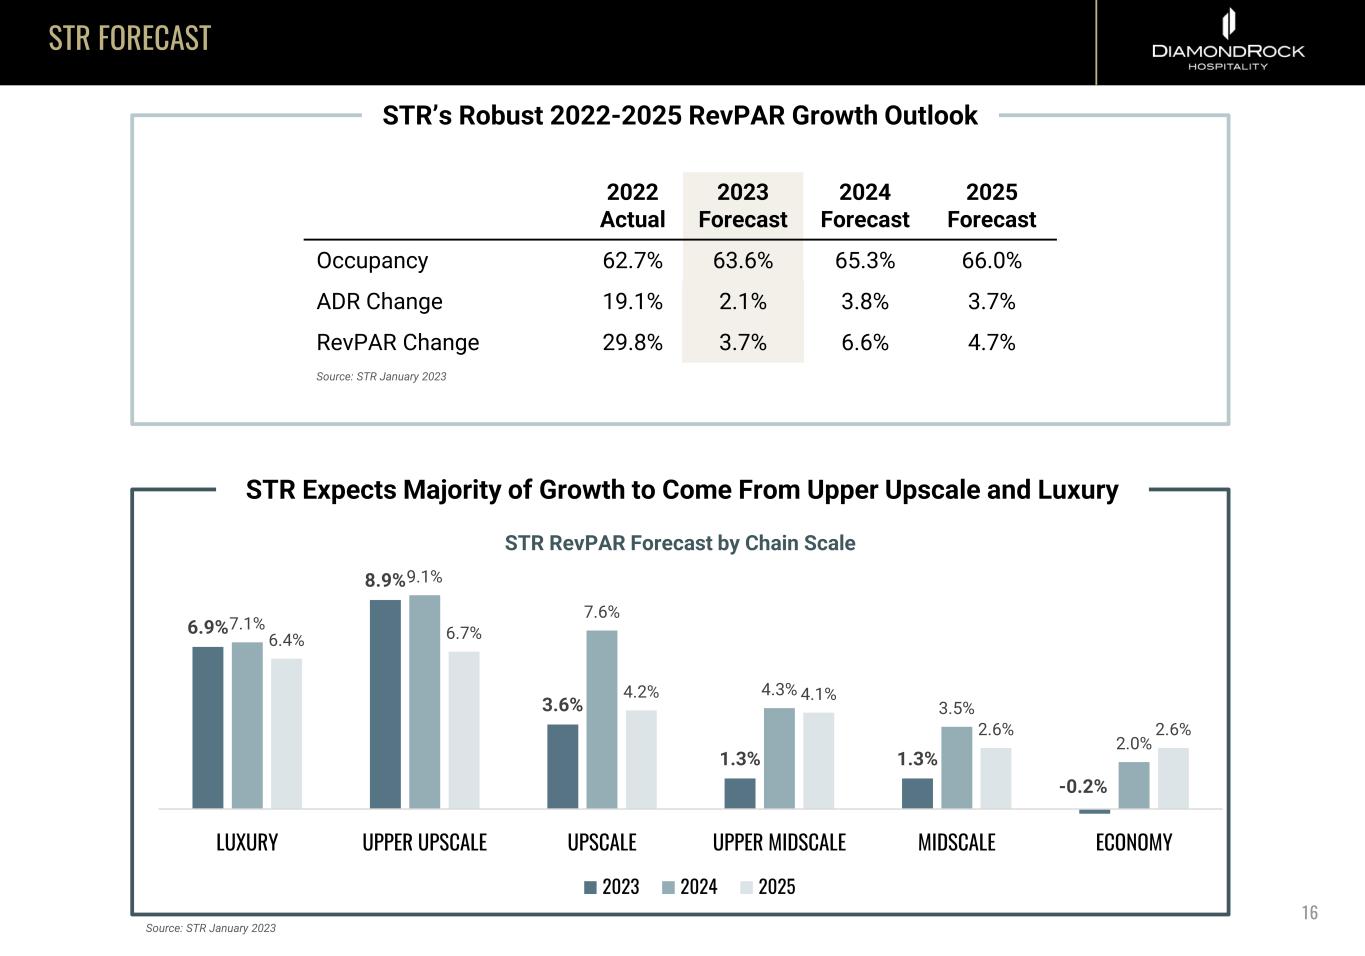
STR FORECAST STR’s Robust 2022-2025 RevPAR Growth Outlook 2022 Actual 2023 Forecast 2024 Forecast 2025 Forecast Occupancy 62.7% 63.6% 65.3% 66.0% ADR Change 19.1% 2.1% 3.8% 3.7% RevPAR Change 29.8% 3.7% 6.6% 4.7% 6.9% 8.9% 3.6% 1.3% 1.3% -0.2% 7.1% 9.1% 7.6% 4.3% 3.5% 2.0% 6.4% 6.7% 4.2% 4.1% 2.6% 2.6% LUXURY UPPER UPSCALE UPSCALE UPPER MIDSCALE MIDSCALE ECONOMY 2023 2024 2025 STR Expects Majority of Growth to Come From Upper Upscale and Luxury STR RevPAR Forecast by Chain Scale 16 Source: STR January 2023 Source: STR January 2023

DIVERSIFIED PORTFOLIO COURTYARD DENVER DOWNTOWN
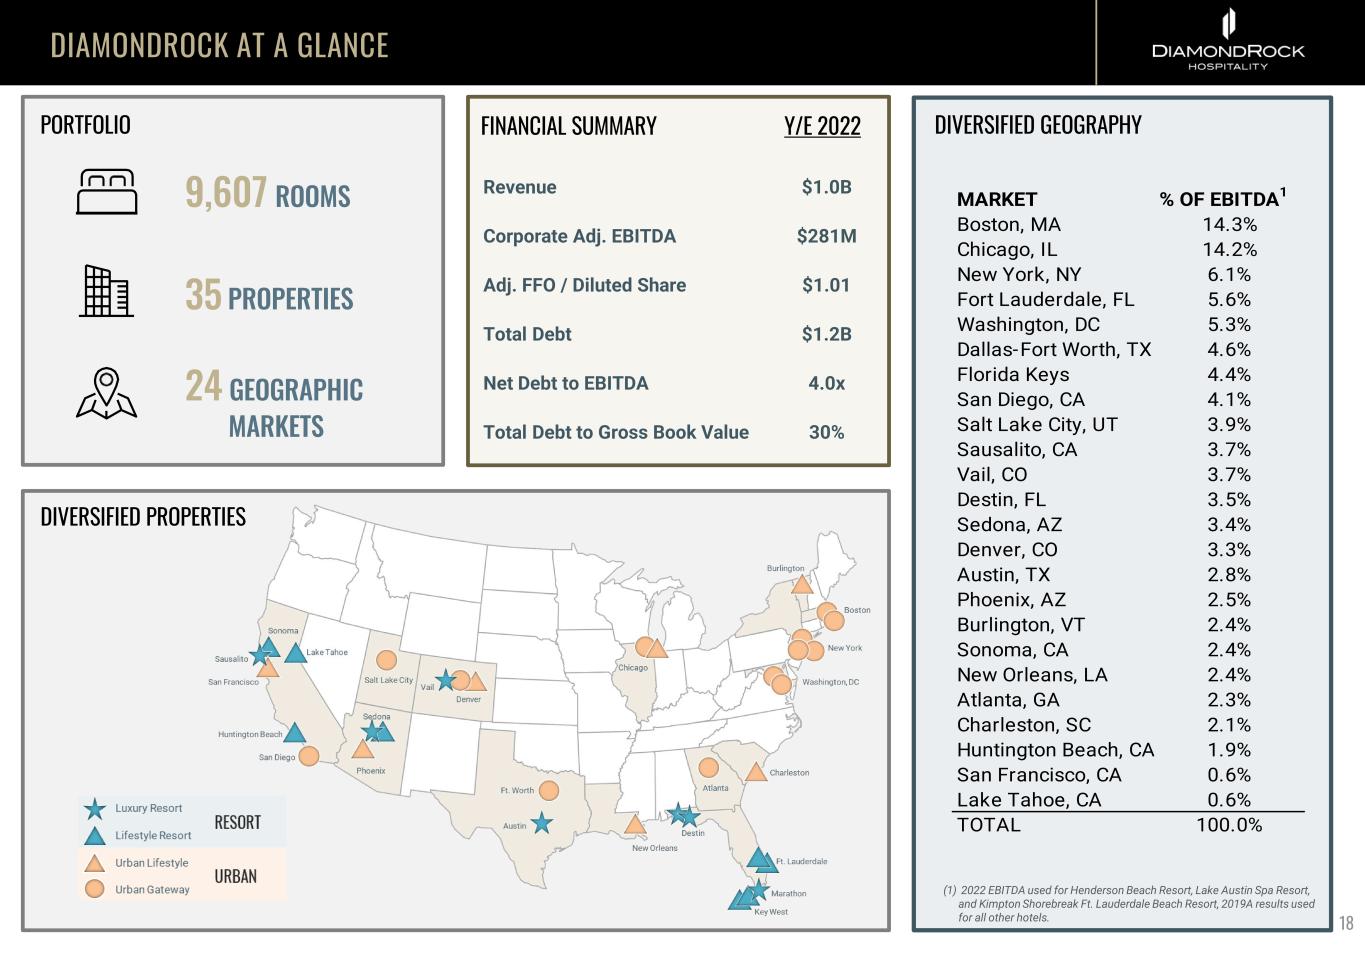
DIAMONDROCK AT A GLANCE 9,607 ROOMS 35 PROPERTIES 24 GEOGRAPHIC MARKETS DIVERSIFIED GEOGRAPHY 18 (1) 2022 EBITDA used for Henderson Beach Resort, Lake Austin Spa Resort, and Kimpton Shorebreak Ft. Lauderdale Beach Resort, 2019A results used for all other hotels. DIVERSIFIED PROPERTIES FINANCIAL SUMMARY Net Debt to EBITDA Total Debt $1.2B 4.0x Total Debt to Gross Book Value 30% Revenue $1.0B Corporate Adj. EBITDA $281M Y/E 2022PORTFOLIO MARKET % OF EBITDA1 Boston, MA 14.3% Chicago, IL 14.2% New York, NY 6.1% Fort Lauderdale, FL 5.6% Washington, DC 5.3% Dallas-Fort Worth, TX 4.6% Florida Keys 4.4% San Diego, CA 4.1% Salt Lake City, UT 3.9% Sausalito, CA 3.7% Vail, CO 3.7% Destin, FL 3.5% Sedona, AZ 3.4% Denver, CO 3.3% Austin, TX 2.8% Phoenix, AZ 2.5% Burlington, VT 2.4% Sonoma, CA 2.4% New Orleans, LA 2.4% Atlanta, GA 2.3% Charleston, SC 2.1% Huntington Beach, CA 1.9% San Francisco, CA 0.6% Lake Tahoe, CA 0.6% TOTAL 100.0% Adj. FFO / Diluted Share $1.01
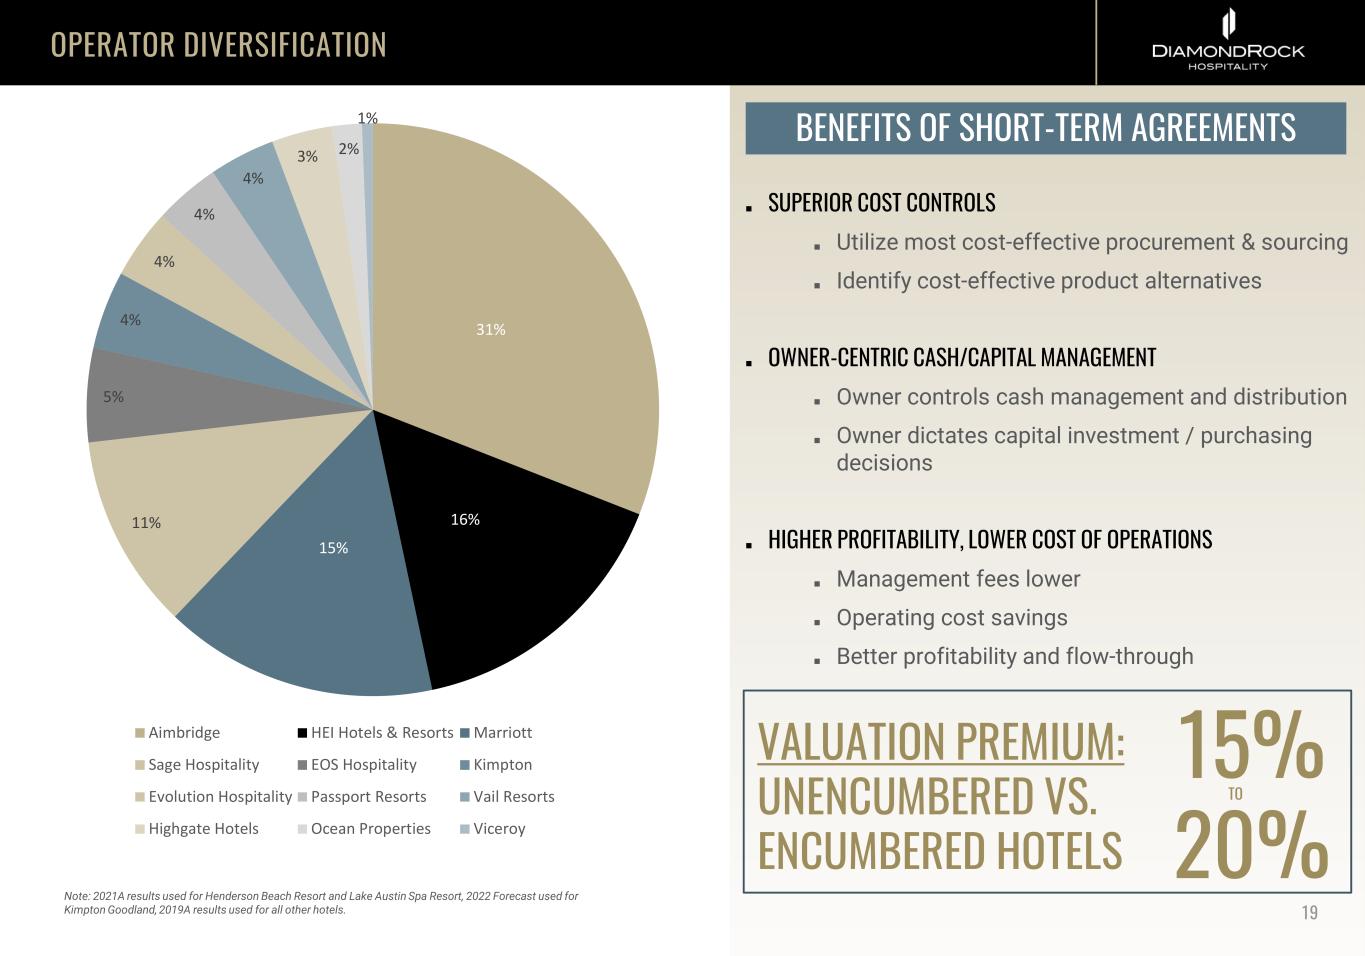
OPERATOR DIVERSIFICATION 19 BENEFITS OF SHORT-TERM AGREEMENTS ■ SUPERIOR COST CONTROLS ■ Utilize most cost-effective procurement & sourcing ■ Identify cost-effective product alternatives ■ OWNER-CENTRIC CASH/CAPITAL MANAGEMENT ■ Owner controls cash management and distribution ■ Owner dictates capital investment / purchasing decisions ■ HIGHER PROFITABILITY, LOWER COST OF OPERATIONS ■ Management fees lower ■ Operating cost savings ■ Better profitability and flow-through VALUATION PREMIUM: UNENCUMBERED VS. ENCUMBERED HOTELS 15% 20% TO 31% 16% 15% 11% 5% 4% 4% 4% 4% 3% 2% 1% Aimbridge HEI Hotels & Resorts Marriott Sage Hospitality EOS Hospitality Kimpton Evolution Hospitality Passport Resorts Vail Resorts Highgate Hotels Ocean Properties Viceroy Note: 2021A results used for Henderson Beach Resort and Lake Austin Spa Resort, 2022 Forecast used for Kimpton Goodland, 2019A results used for all other hotels.
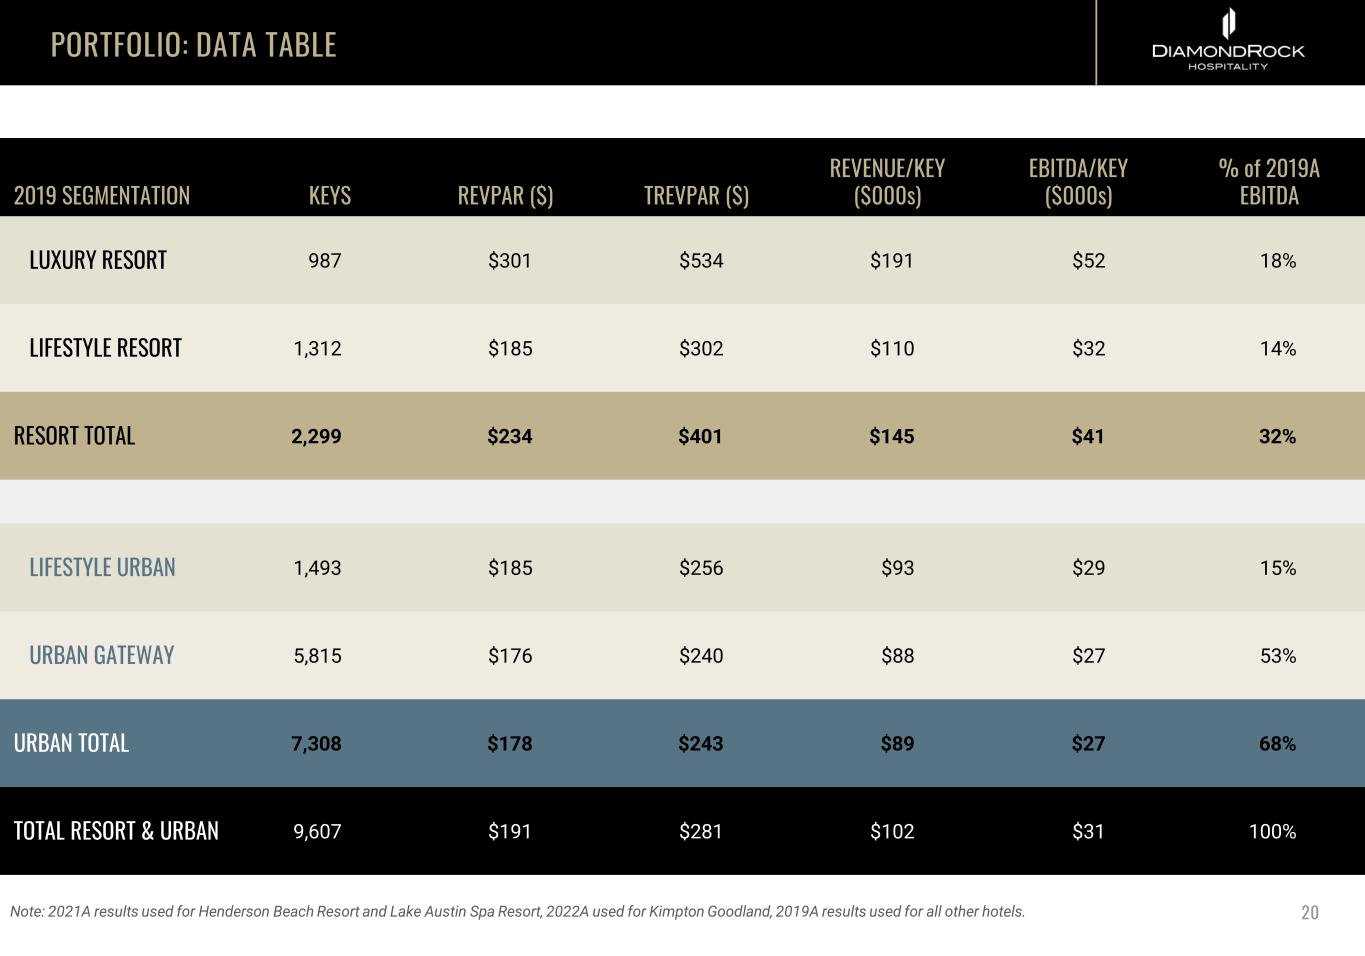
PORTFOLIO: DATA TABLE 20 20Note: 2021A results used for Henderson Beach Resort and Lake Austin Spa Resort, 2022A used for Kimpton Goodland, 2019A results used for all other hotels. 2019 SEGMENTATION KEYS REVPAR ($) TREVPAR ($) REVENUE/KEY ($000s) EBITDA/KEY ($000s) % of 2019A EBITDA LUXURY RESORT 987 $301 $534 $191 $52 18% LIFESTYLE RESORT 1,312 $185 $302 $110 $32 14% RESORT TOTAL 2,299 $234 $401 $145 $41 32% LIFESTYLE URBAN 1,493 $185 $256 $93 $29 15% URBAN GATEWAY 5,815 $176 $240 $88 $27 53% URBAN TOTAL 7,308 $178 $243 $89 $27 68% TOTAL RESORT & URBAN 9,607 $191 $281 $102 $31 100%
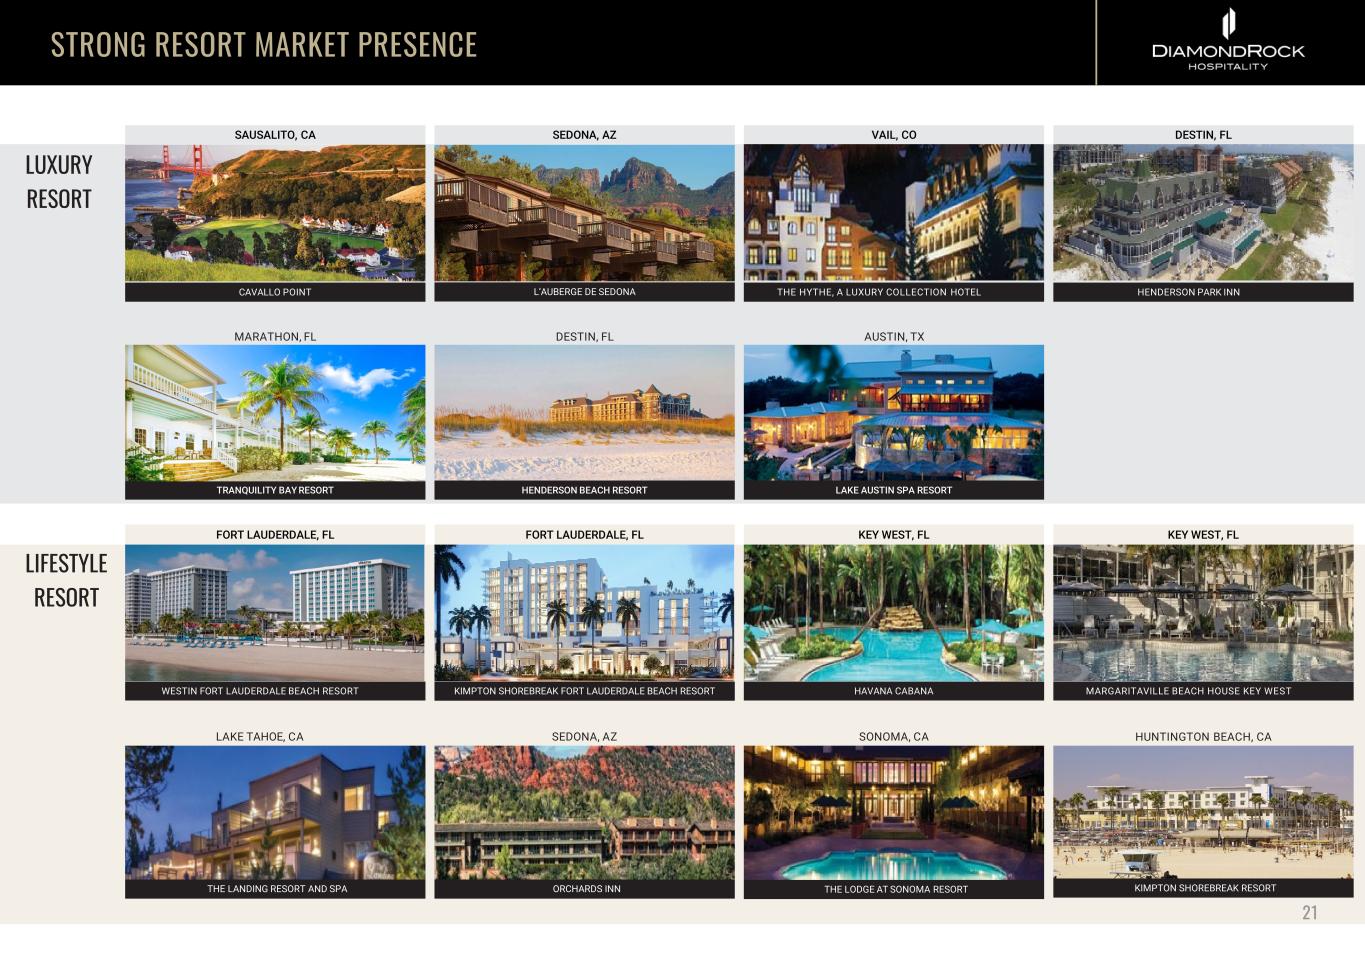
STRONG RESORT MARKET PRESENCE SAUSALITO, CA FORT LAUDERDALE, FL MARATHON, FL SEDONA, AZ DESTIN, FL CAVALLO POINT TRANQUILITY BAY RESORT VAIL, CO DESTIN, FL THE HYTHE, A LUXURY COLLECTION HOTEL HENDERSON PARK INN SEDONA, AZ SONOMA, CALAKE TAHOE, CA LUXURY RESORT LIFESTYLE RESORT THE LODGE AT SONOMA RESORT 21 L’AUBERGE DE SEDONA ORCHARDS INNTHE LANDING RESORT AND SPA KIMPTON SHOREBREAK RESORT HUNTINGTON BEACH, CA AUSTIN, TX WESTIN FORT LAUDERDALE BEACH RESORT HAVANA CABANA MARGARITAVILLE BEACH HOUSE KEY WEST HENDERSON BEACH RESORT LAKE AUSTIN SPA RESORT FORT LAUDERDALE, FL KEY WEST, FL KEY WEST, FL KIMPTON SHOREBREAK FORT LAUDERDALE BEACH RESORT
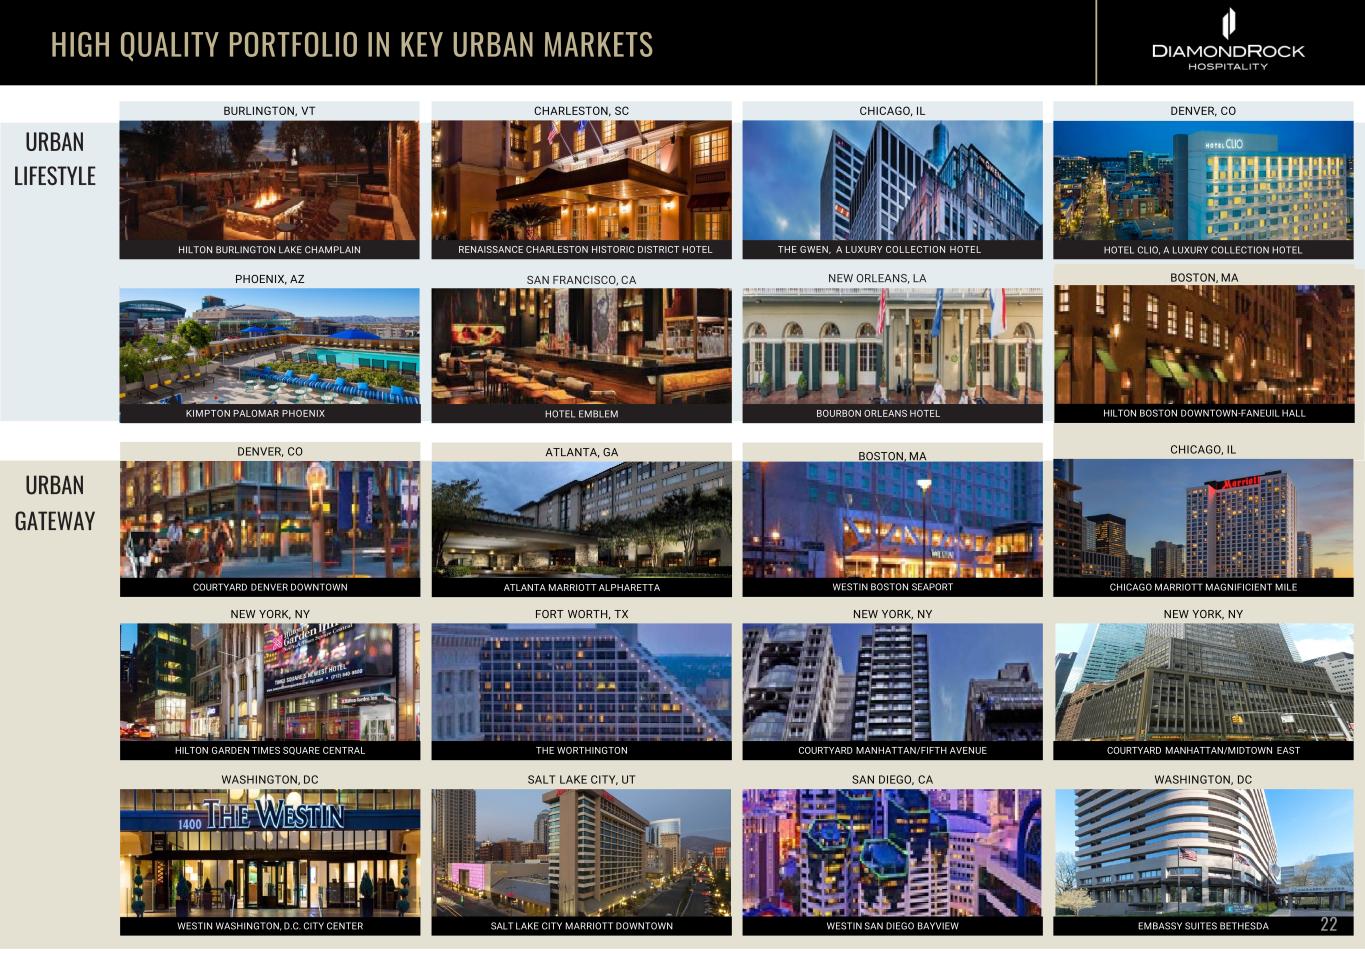
HIGH QUALITY PORTFOLIO IN KEY URBAN MARKETS DENVER, CO SAN DIEGO, CA COURTYARD DENVER DOWNTOWN WESTIN WASHINGTON, D.C. CITY CENTER WESTIN SAN DIEGO BAYVIEW URBAN GATEWAY SALT LAKE CITY, UT SALT LAKE CITY MARRIOTT DOWNTOWN URBAN LIFESTYLE BOURBON ORLEANS HOTELHOTEL EMBLEM HILTON BURLINGTON LAKE CHAMPLAIN KIMPTON PALOMAR PHOENIX NEW YORK, NY HILTON GARDEN TIMES SQUARE CENTRAL WASHINGTON, DC EMBASSY SUITES BETHESDA WASHINGTON, DC RENAISSANCE CHARLESTON HISTORIC DISTRICT HOTEL THE GWEN, A LUXURY COLLECTION HOTEL HOTEL CLIO, A LUXURY COLLECTION HOTEL THE WORTHINGTON COURTYARD MANHATTAN/FIFTH AVENUE COURTYARD MANHATTAN/MIDTOWN EAST FORT WORTH, TX NEW YORK, NYNEW YORK, NY CHICAGO MARRIOTT MAGNIFICIENT MILE BOSTON, MA BOSTON, MA HILTON BOSTON DOWNTOWN-FANEUIL HALL WESTIN BOSTON SEAPORT 22 CHICAGO, IL BURLINGTON, VT CHARLESTON, SC DENVER, COCHICAGO, IL PHOENIX, AZ SAN FRANCISCO, CA NEW ORLEANS, LA ATLANTA MARRIOTT ALPHARETTA ATLANTA, GA
ESG FOCUS THE LANDING LAKE TAHOE
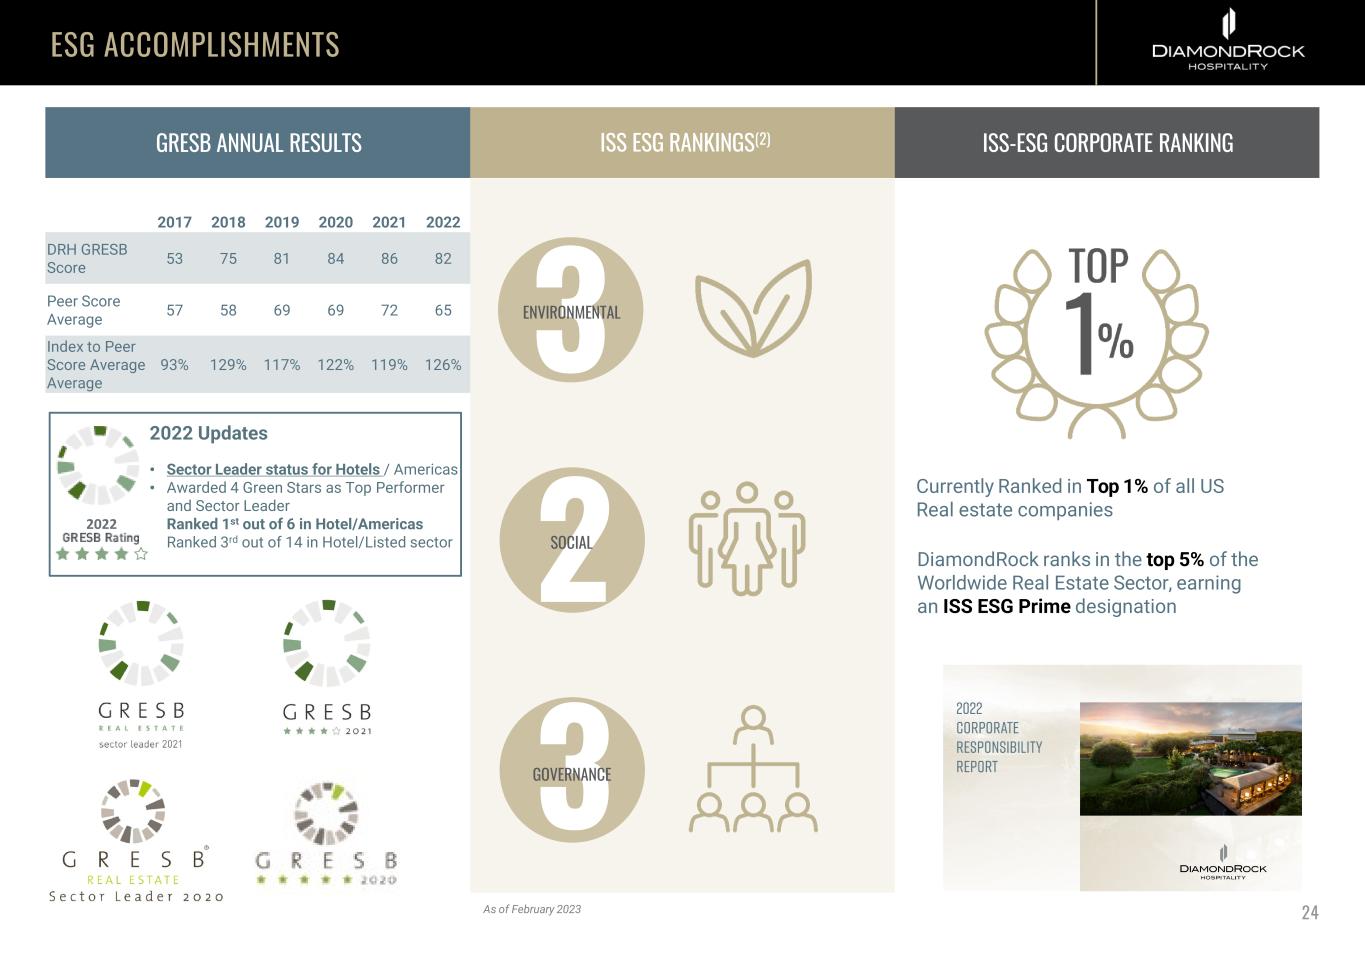
ISS ESG RANKINGS(2) ISS-ESG CORPORATE RANKING Currently Ranked in Top 1% of all US Real estate companies DiamondRock ranks in the top 5% of the Worldwide Real Estate Sector, earning an ISS ESG Prime designation 3ENVIRONMENTAL 2SOCIAL 3GOVERNANCE GRESB ANNUAL RESULTS 2017 2018 2019 2020 2021 2022 DRH GRESB Score 53 75 81 84 86 82 Peer Score Average 57 58 69 69 72 65 Index to Peer Score Average Average 93% 129% 117% 122% 119% 126% ESG ACCOMPLISHMENTS 24As of February 2023 2022 Updates • Sector Leader status for Hotels / Americas • Awarded 4 Green Stars as Top Performer and Sector Leader • Ranked 1st out of 6 in Hotel/Americas • Ranked 3rd out of 14 in Hotel/Listed sector 2022
SEASONED MANAGEMENT TEAM THE HYTHE, A LUXURY COLLECTION HOTEL

EXTENSIVE MANAGEMENT AND HOSPITALITY EXPERIENCE MARK W. BRUGGER CO-FOUNDER PRESIDENT, CEO AND DIRECTOR • Co-founded DRH in 2004 and successfully led its IPO in 2005 • Named Forbes’ list of America’s Most Powerful CEOs 40 and Under and a finalist for the E&Y Entrepreneur of the Year Award • Extensive background in real estate, capital markets, and structured finance JEFFREY J. DONNELLY EXECUTIVE VP AND CFO JUSTIN L. LEONARD EXECUTIVE VP AND COO WILLIAM J. TENNIS EXECUTIVE VP, GENERAL COUNSEL AND CORPORATE SECRETARY TROY G. FURBAY EXECUTIVE VP AND CIO BRIONY R. QUINN SENIOR VP AND TREASURER 26 • Joined as CFO in 2019 • Previously Managing Director at Wells Fargo Securities where he co- founded Real Estate & Lodging Equity Research • Served as AVP at AEW Capital Management, LP overseeing asset management and capital market transactions for diversified commercial real estate portfolio • Joined as COO in 2022 • Previously was at Walton Street Capital, LLC for 23 years, most recently as Senior Principal overseeing hotel investments. During his tenure, he oversaw hotel asset management which included 60 branded and independent hotels totaling over 20,000 rooms • Joined as General Counsel in 2010 • Previously worked for Marriott for 17 years initially as Assistant General Counsel and then as Senior Vice President for the Global Asset Management Group • Prior to joining Marriott, worked as an Associate at a New York law firm • Joined as CIO in 2014 • Previously was Chief Investment Officer at Loews Hotels & Resorts • Prior to that, served in senior investment roles with Kimpton Hotels and MeriStar Hospitality Corporation • Joined DRH in 2007 • Promoted to Chief Accounting Officer in 2014 and Treasurer in 2018 • Prior to DRH, was VP of Finance and Accounting for MeriStar Hospitality Corporation