Operator
good morning my name is julie and i will be your conference operator today at this time i would like to welcome everyone to the energizers first fiscal year 2026 conference call after the speaker's remarks there will be a question and answer session if you'd like to ask a question please press star followed by the number one on your touchstone phone if you'd like to withdraw your question please press star followed by two. As a reminder, this call is being recorded. I would now like to turn the conference over to John Polden, Vice President, Treasurer, and Investor Relations. Please go ahead.
Good morning, and welcome to Energizer's first quarter fiscal 2026 conference call. Joining me today are Mark Levine, President and Chief Executive Officer, and John Dravet, Executive Vice President and Chief Financial Officer. In just a moment, Mark will share a few opening comments and then we'll take your questions. A replay of this call will be available on the Investor Relations section of our website, energizerholdings.com. In addition, please note that our earnings release, prepared remarks, and a slide deck are also posted on our website. During the call, we will make forward-looking statements about the company's future business and financial performance, among other matters. These statements are based on management's current expectations and are subject to risks and uncertainties, which may cause actual results to differ materially from these statements. We do not undertake to update these forward-looking statements. Other factors that could cause actual results to differ materially from these statements are included in reports we file with the SEC. We also refer in our presentation to non-GAAP financial measures. The reconciliation of non-GAAP financial measures to comparable GAAP measures is shown in our press release issued earlier today, which is available on our website. Information concerning our categories and estimated market share discussed on this call relates to the categories where we compete and is based on Energizer's internal data, data from industry analysis, and estimates we believe to be reasonable. The battery category information includes both brick-and-mortar and e-commerce retail sales. As always noted, all comments regarding the quarter and year pertain to Energizer's fiscal year and all comparisons to prior year relate to the same period in fiscal 2025. With that, I would like to turn the call over to Mark.
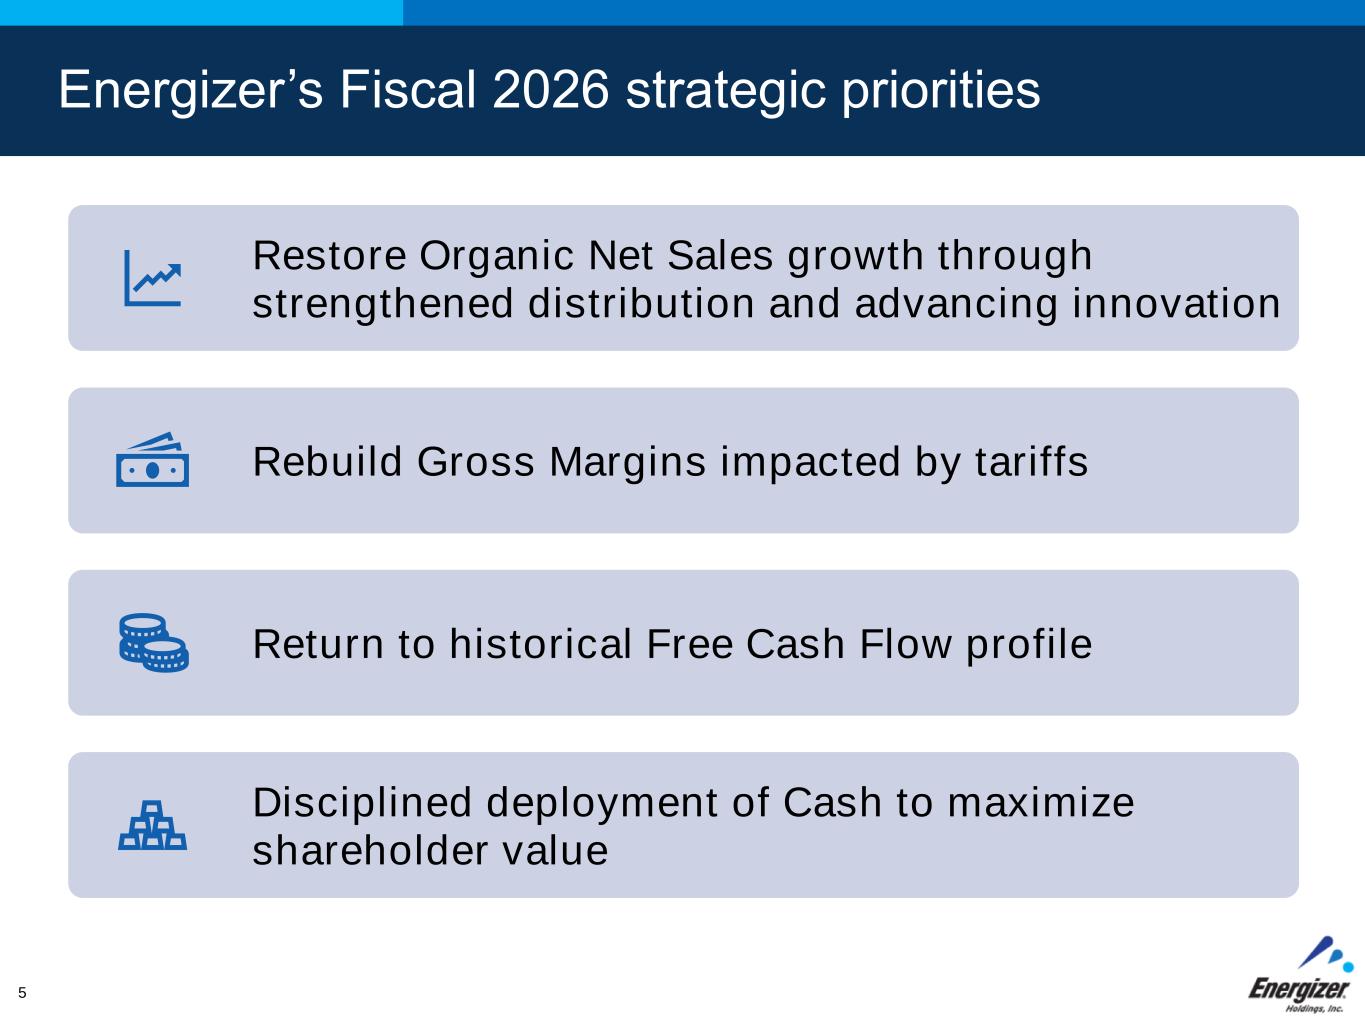
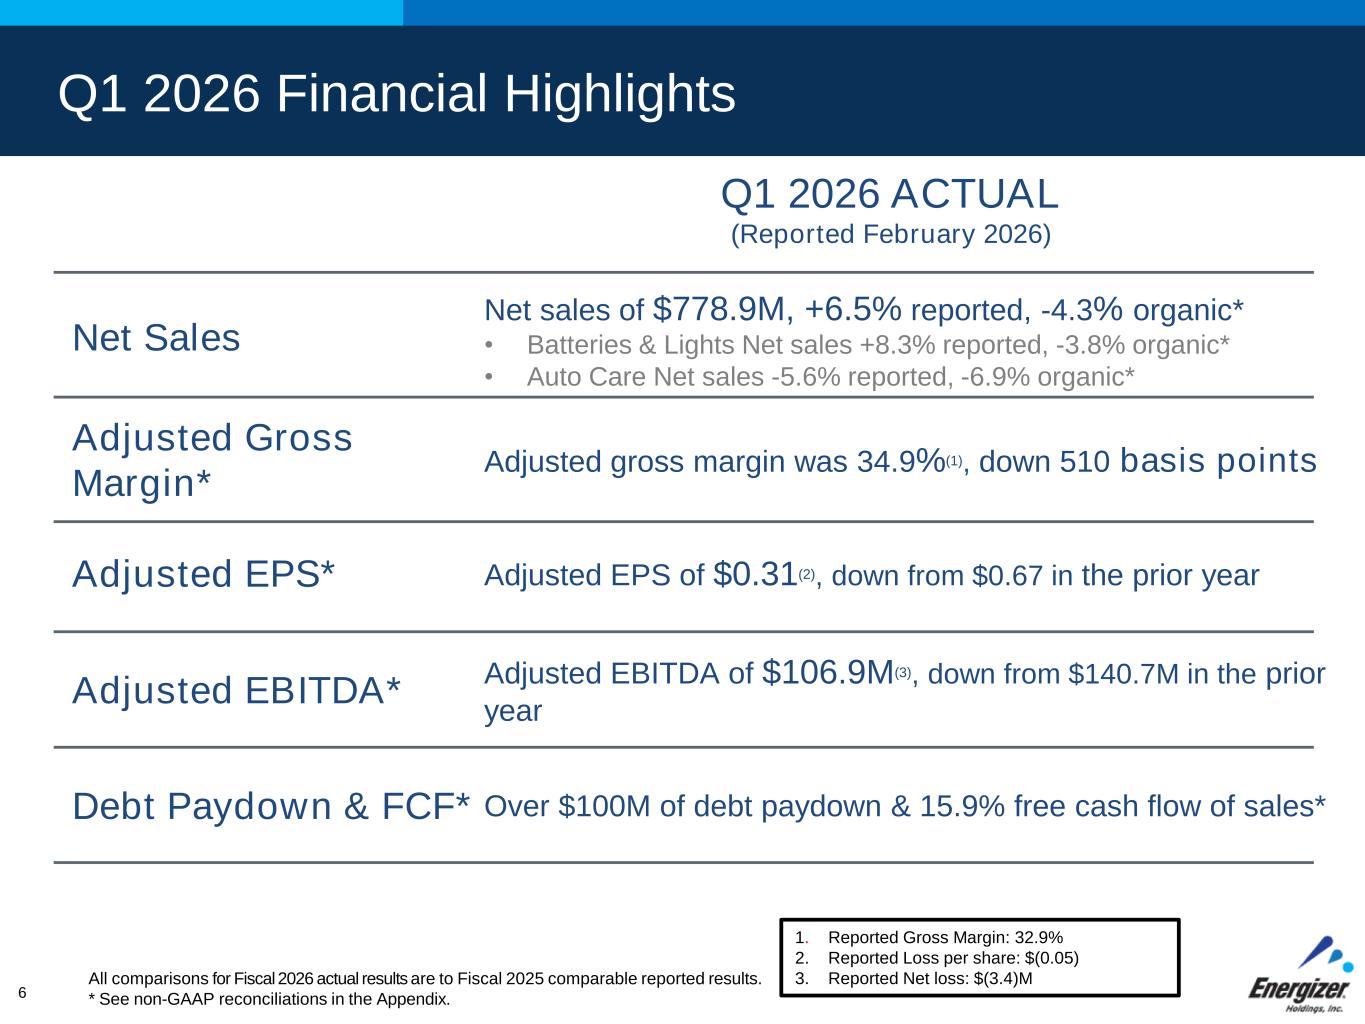
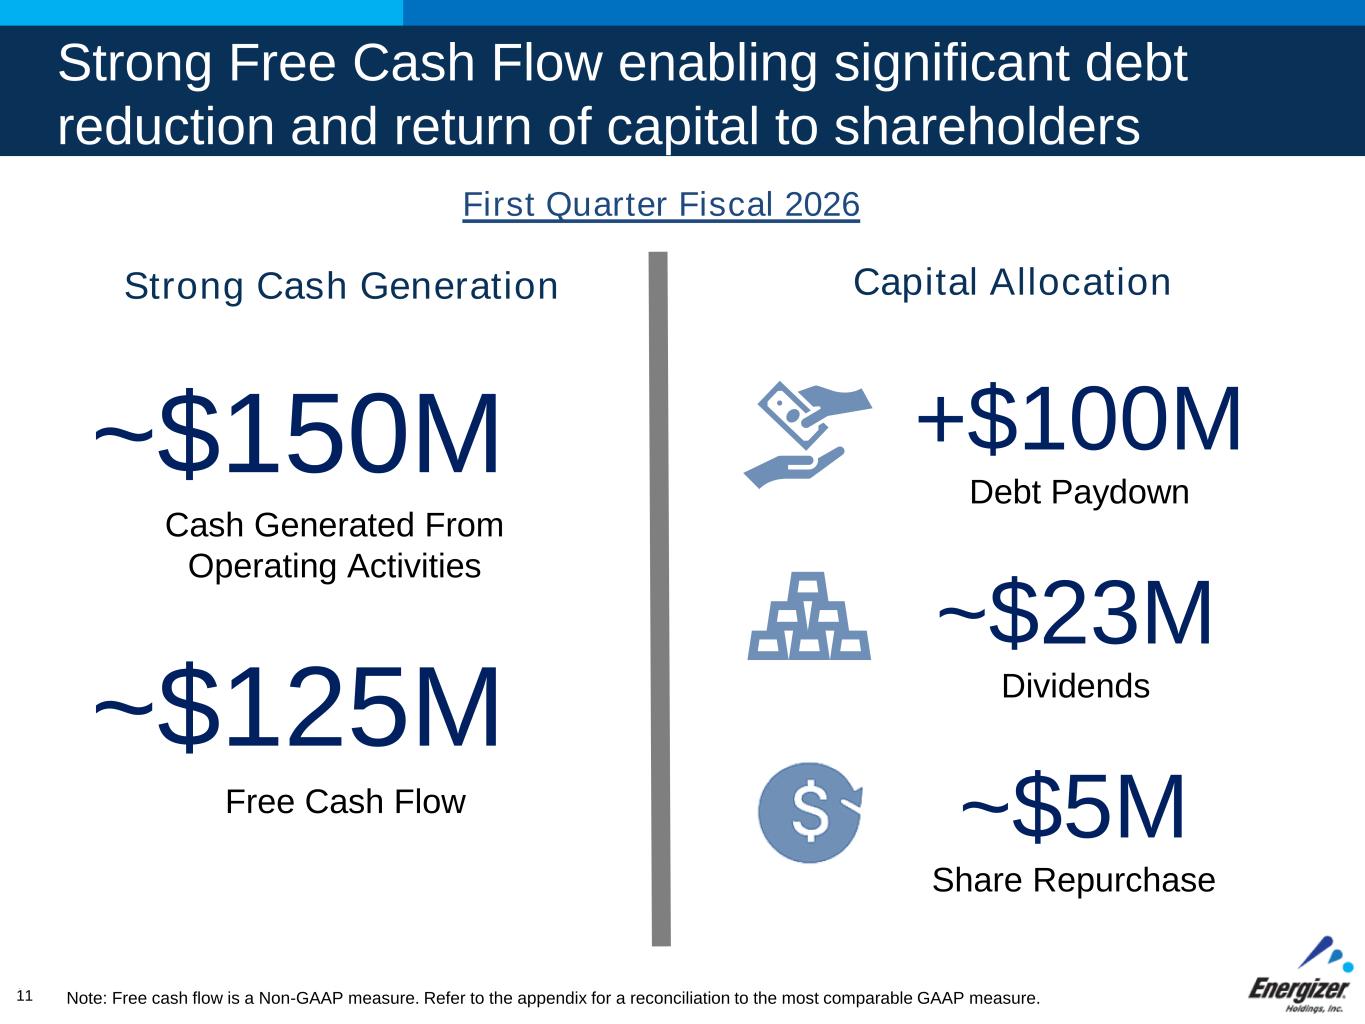
Good morning, and thanks for joining us today. As we've done in prior quarters, we've posted prepared remarks on our website, which provides a comprehensive overview of our achievements this quarter and our forward outlook. But I first wanted to open the call with just a few comments before we head into Q&A. As we close our first quarter of 2026, our agenda unchanged and firmly aligned with long-term value creation, restore growth, rebuild margins that were pressured by tariffs, and return the business to our historical cash flow profile. In the first quarter, we made meaningful progress on all fronts. Our performance exceeded expectations, and we've established a clear foundation for sequential gross margin expansion and a return to meaningful earnings growth in the back half of the year. The quarter demonstrated that our strategy is working. We secured final customer decisions on the APS to Energizer brand transition, which is expected to contribute over 30 million of organic growth in the year most of it landing in the third and fourth quarters we strengthen distribution across our value and premium brands with key US retailers advanced innovation across both batteries and lights and auto care and substantially completed the supply chain realignment that is central to restoring margin these actions position us to deliver over 300 basis points of gross margin expansion from Q1 to Q2, with another 300 to 400 basis points anticipated by year end. We also delivered robust cash generation that allowed us to pay down over a hundred million of debt while returning nearly 28 million in capital to shareholders through dividends and share repurchases, reinforcing the durability of our cash flow model. And finally, I wanted to spend a brief moment on our capital allocation strategy which remains a cornerstone of long-term value creation. We will continue to prioritize reducing debt which directly shifts value to equity holders while strengthening our balance sheet. In addition to reducing leverage, our free cash flow supports a balanced shareholder-first capital allocation strategy. We intend to return capital through an attractive dividend, which reflects our confidence in ongoing cash generation, and through share repurchases when market conditions create attractive entry points. This disciplined deployment of cash, paying down debt, maintaining an attractive dividend, and buying back shares reinforces our commitment to maximizing long-term shareholder value. Thank you for your continued confidence in Energizer, and with that, let's open the call for questions.
Operator
Thank you. As a reminder, if you'd like to ask a question, press star one on your touch-tone phone. If you'd like to withdraw your question, press star two. One moment, please, for your first question. Your first question comes from Lauren Lieberman from Barclays. Please go ahead.
Thanks so much. So, one quarter into the year, wanted to just get a sense for how you're thinking about things broadly versus what you might have said three months ago, so thinking about the consumer backdrop, maybe what you're seeing in terms of category trends, any kind of uptick from private label. We know the continued pressure on the lower end consumer has been a dynamic, and it just It feels like there's a lot of moving parts and now a very back half-weighted year, so just kind of degree of confidence in hitting that ramp in the second half.
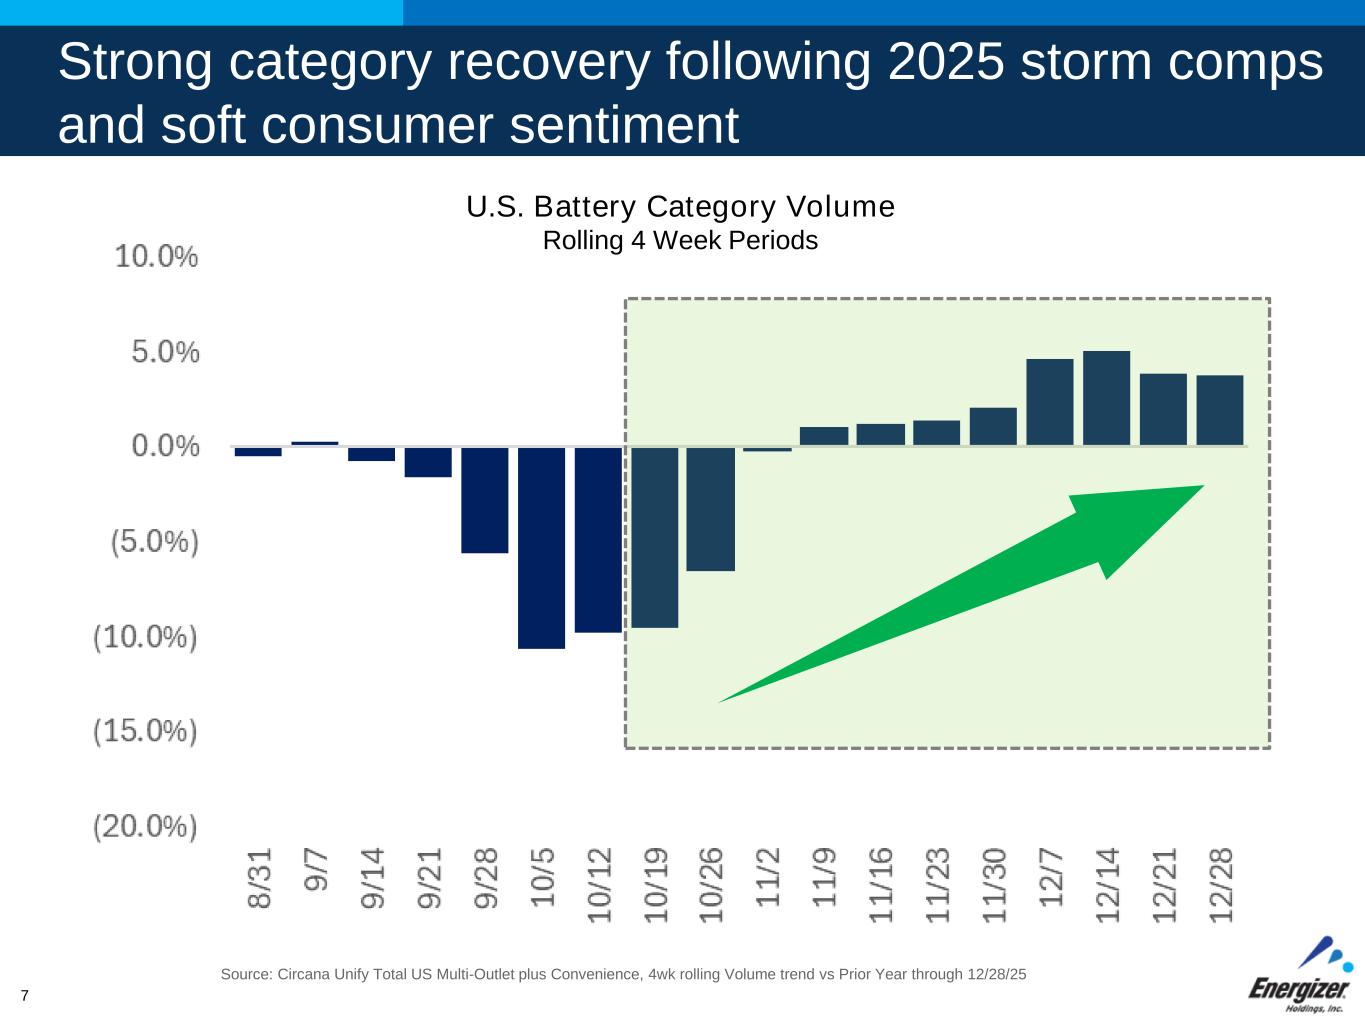
Good morning, Lauren. Let me start high level. So when we were building our plan for 26, we knew it was going to be a transitional start to the year. We saw softening consumer trends in October and November. We were lapping last year's hurricane-driven demand, and we had some orders which were planned for the first quarter, which benefited the fourth quarter of fiscal 25. On the cost side, we were managing through elevated tariff pressures, which were the result of tariffs, which were levied at higher than the current rates. And in light of that, we were reshaping our network, which also created some short-term operational inefficiencies, including some absorption. These affected the results at the end of last year, and we expected them to continue into the first half of 26. These were understood going in, were fully embedded in our plan, and the year has thus far unfolded largely as we expected. Looking ahead, we're encouraged by the trends we're seeing in the business. Consumer demand has stabilized. We saw a strong rebound in December volumes in the U.S., which remains our largest market. We also strengthened our in-store presence with broader and higher-quality distribution across major retailers, which you'll see over the back half of the year. At the same time, we've done additional work to reposition our cost structure, and that's starting to take hold. We are starting to cycle through inventory, which were impacted by those higher rates, and our mitigation efforts are starting to come to fruition. That includes relocating production capacity in the U.S., diversifying sourcing, and investing in efficiencies to make the network more efficient. We've taken targeted steps to increase production, to increase the tax credits, which we expect to earn this year, which should drive a benefit of roughly 50% above last year. These dynamics are all coming together and setting us up for a strong acceleration of net sales and earnings in the back half. So while the first half reflects the short-term factors, the underlying trajectory is improving. This year is really about restoring growth, restoring margins, restoring free cash flow, And thus far, we're off to a great start. Specific, Lauren, to your question on battery consumption trends, we saw meaningful improvement in the quarter, as I just mentioned. December inflected the volume growth. You've seen in the standard trends, the 13-week volume was slightly negative. But then when you see the December data in the four weeks, that was where volume inflected the positive. Obviously, January is going to have a very positive volume growth with the winter storms in the U.S. For the balance of the year, we expect the category to be stable, and the trajectory of the category is essentially what we assume going into the year. Anything I missed?
No, I think that was perfect.
Operator
Your next question comes from Peter Grom from UBS. Please go ahead.
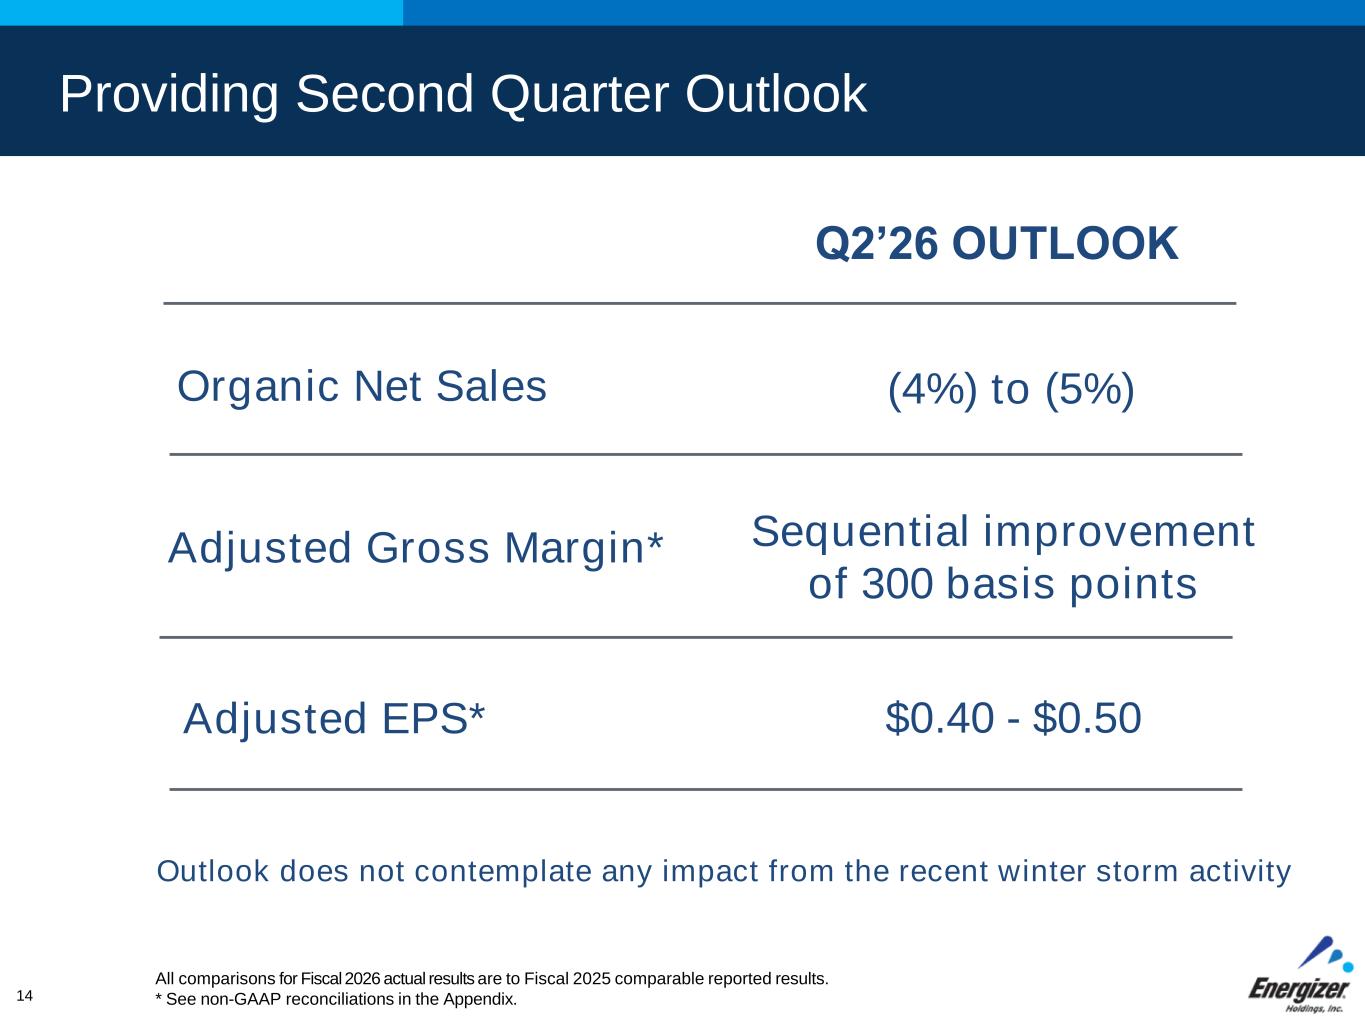
Great. Thank you. Good morning, guys. I guess I wanted to follow up on that last point, right, just on the January trends and kind of the impact of weathers. And so I asked this in the context of, you know, you mentioned in the release that your outlook does not contemplate any impact from the recent winter storm activity. So just whether it's based on what you've seen thus far, maybe what you've seen over time, maybe it's helped us understand what this could do to your guidance as a release to either the second quarter or for the full-year outlook?
Sure, Peter. Why don't I start with the storm impact and then maybe John can bridge a little bit of kind of the front half, back half dynamic that we're seeing. I mean, the storm volume in the U.S. clearly was the benefits of POS. I mean, the one-week numbers were significant, category value north of 50 percent. It's really too early to quantify the impact that this will have on our business as we'll need to work through replenishment orders. We need to manage through any shipments which may have been disrupted because of the weather, as well as work through resulting inventory levels at retailer inventory levels. It will certainly be a benefit for our business, but it's just too early to tell how much. I would say there's just more to come on that in connection with the Q2 earnings call. John, you want to walk through kind of the bridge as we think through the balance of Yeah, Mark, I can take us down maybe a level from where you were setting it up.
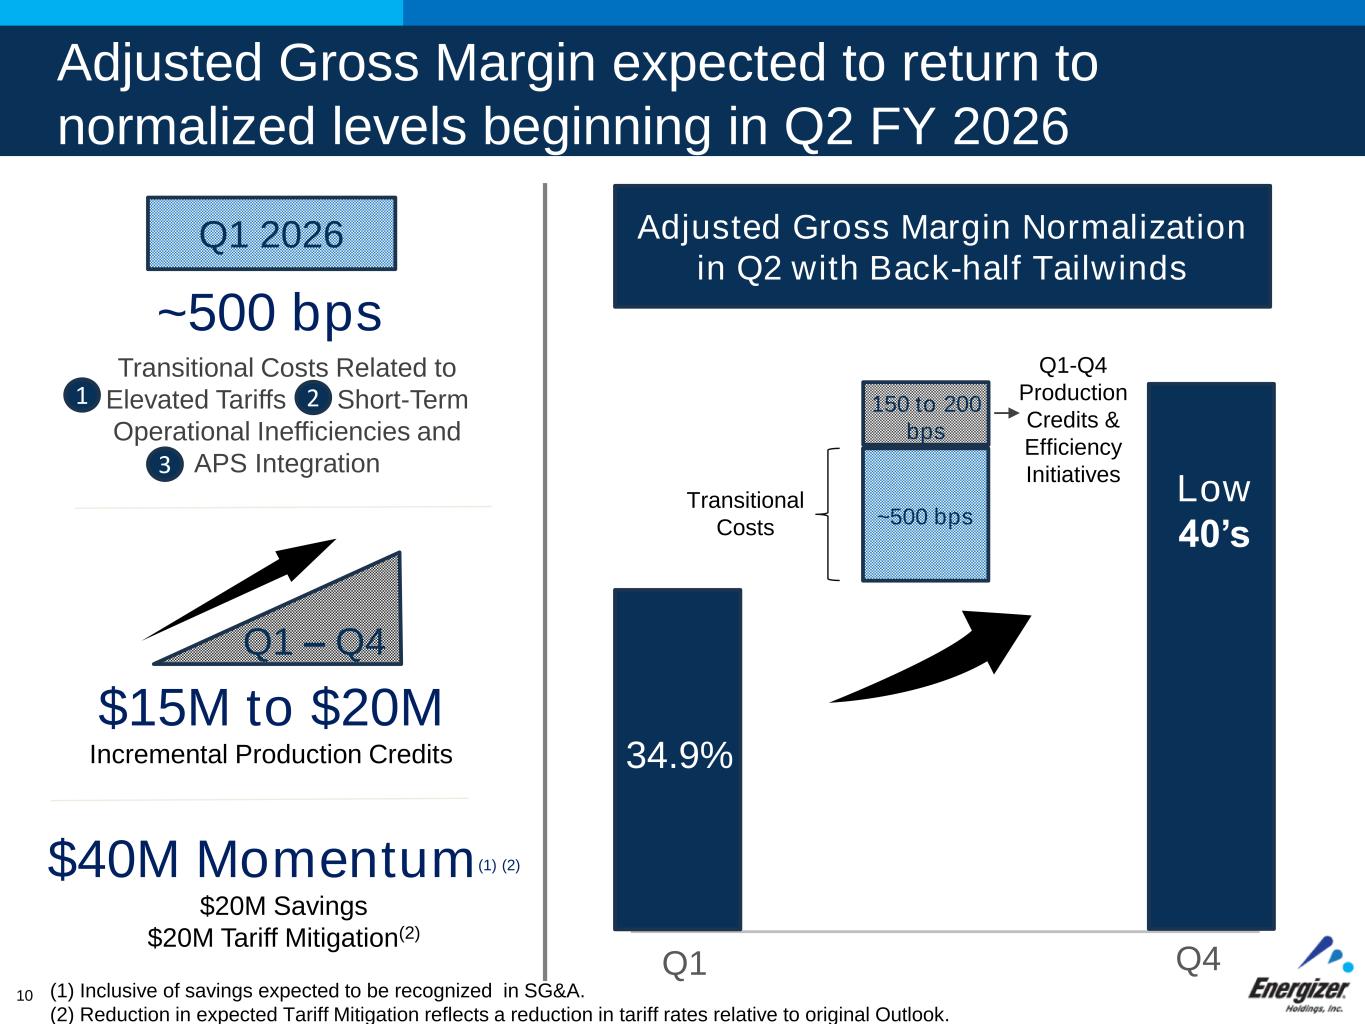
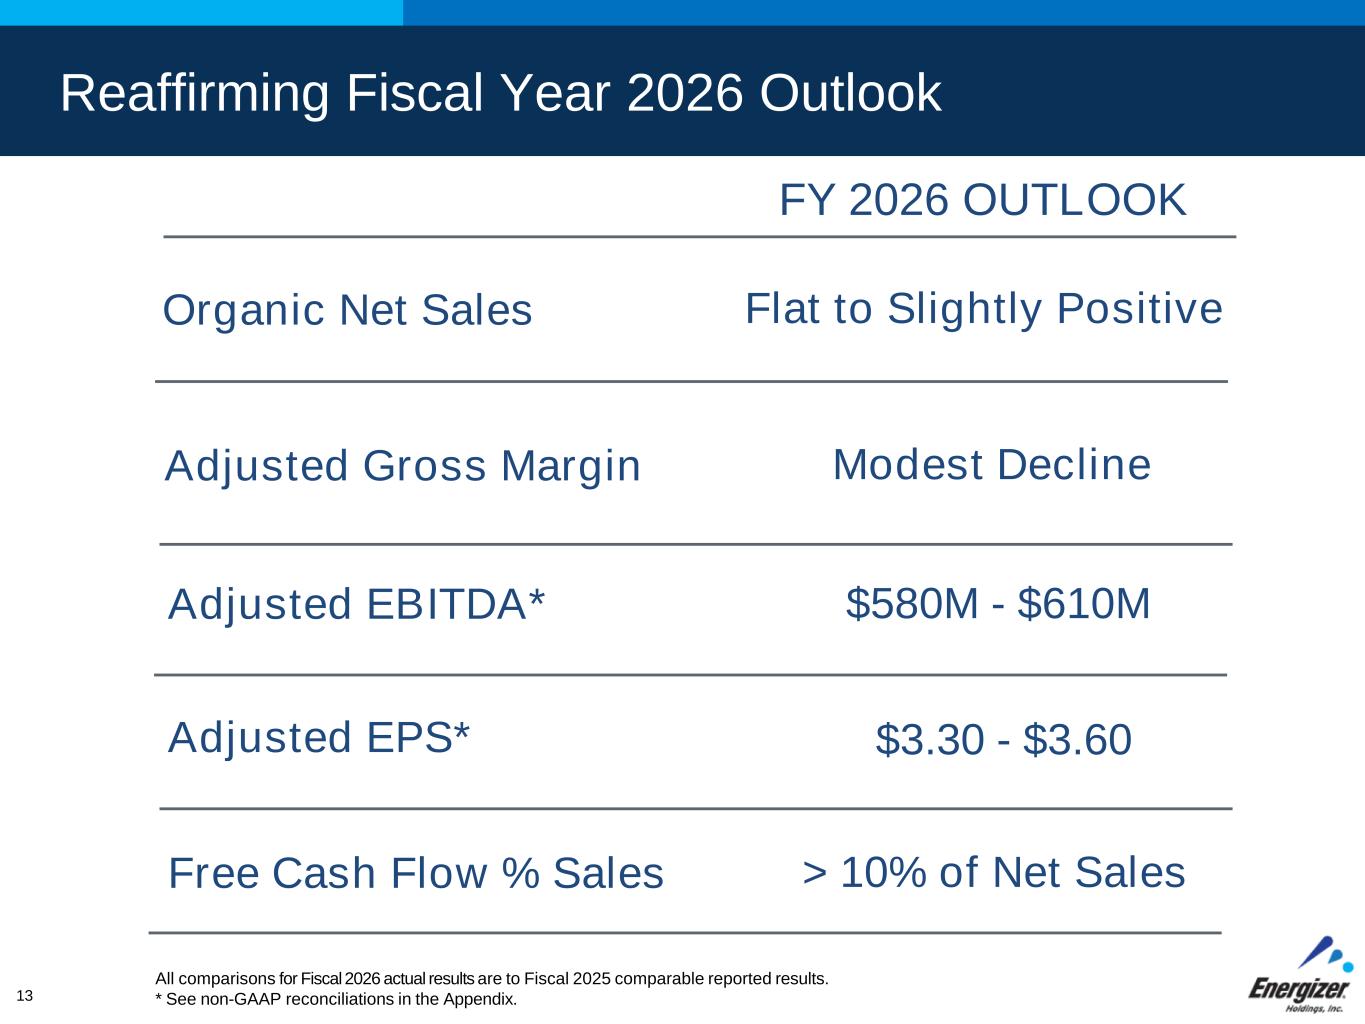
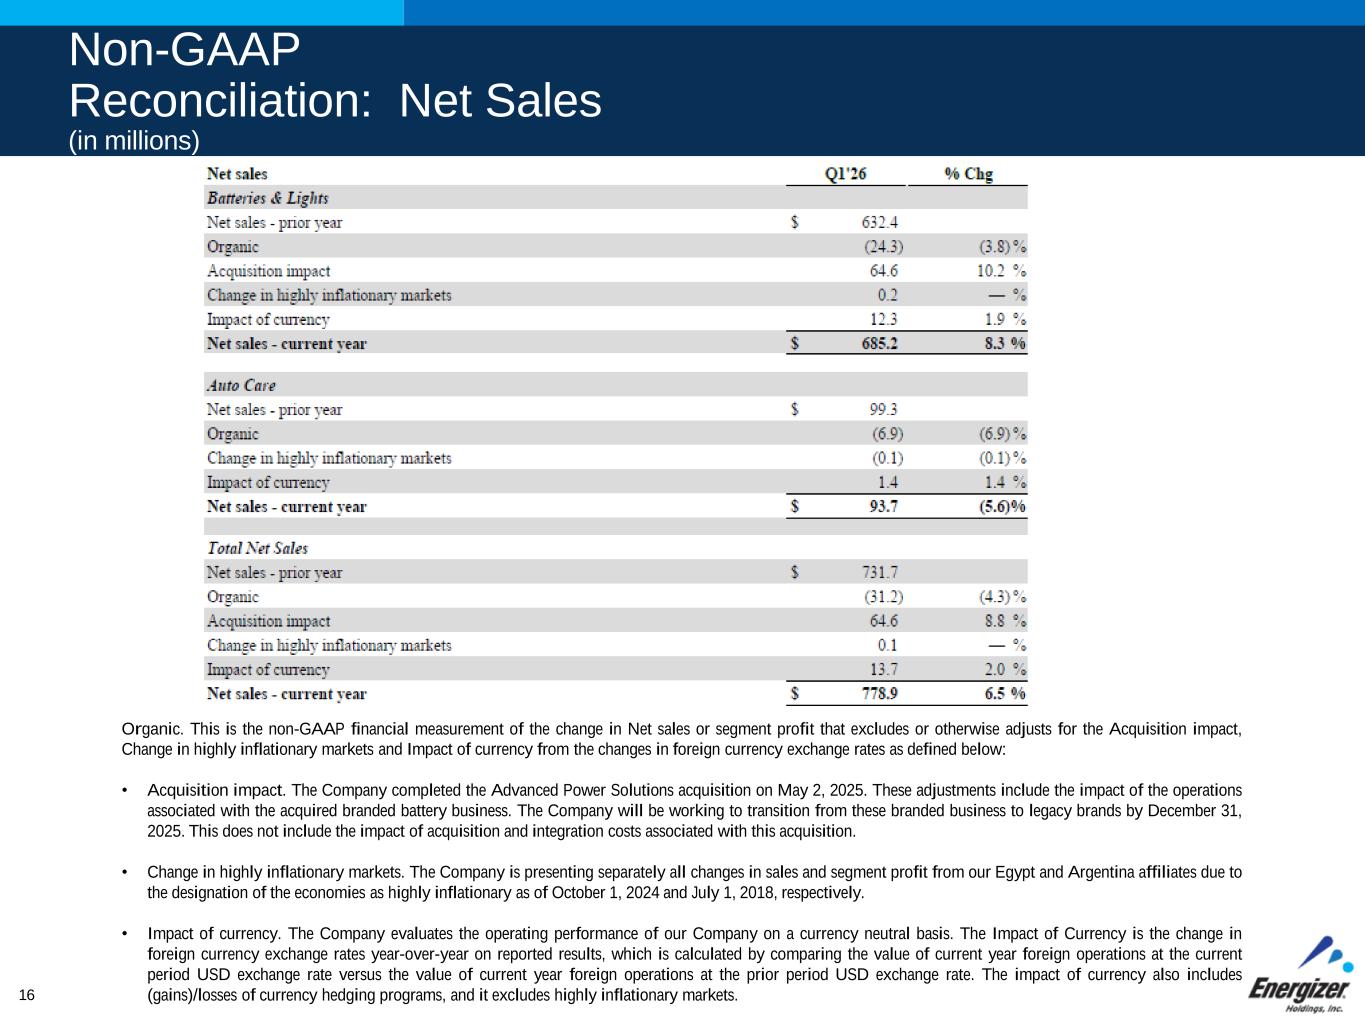
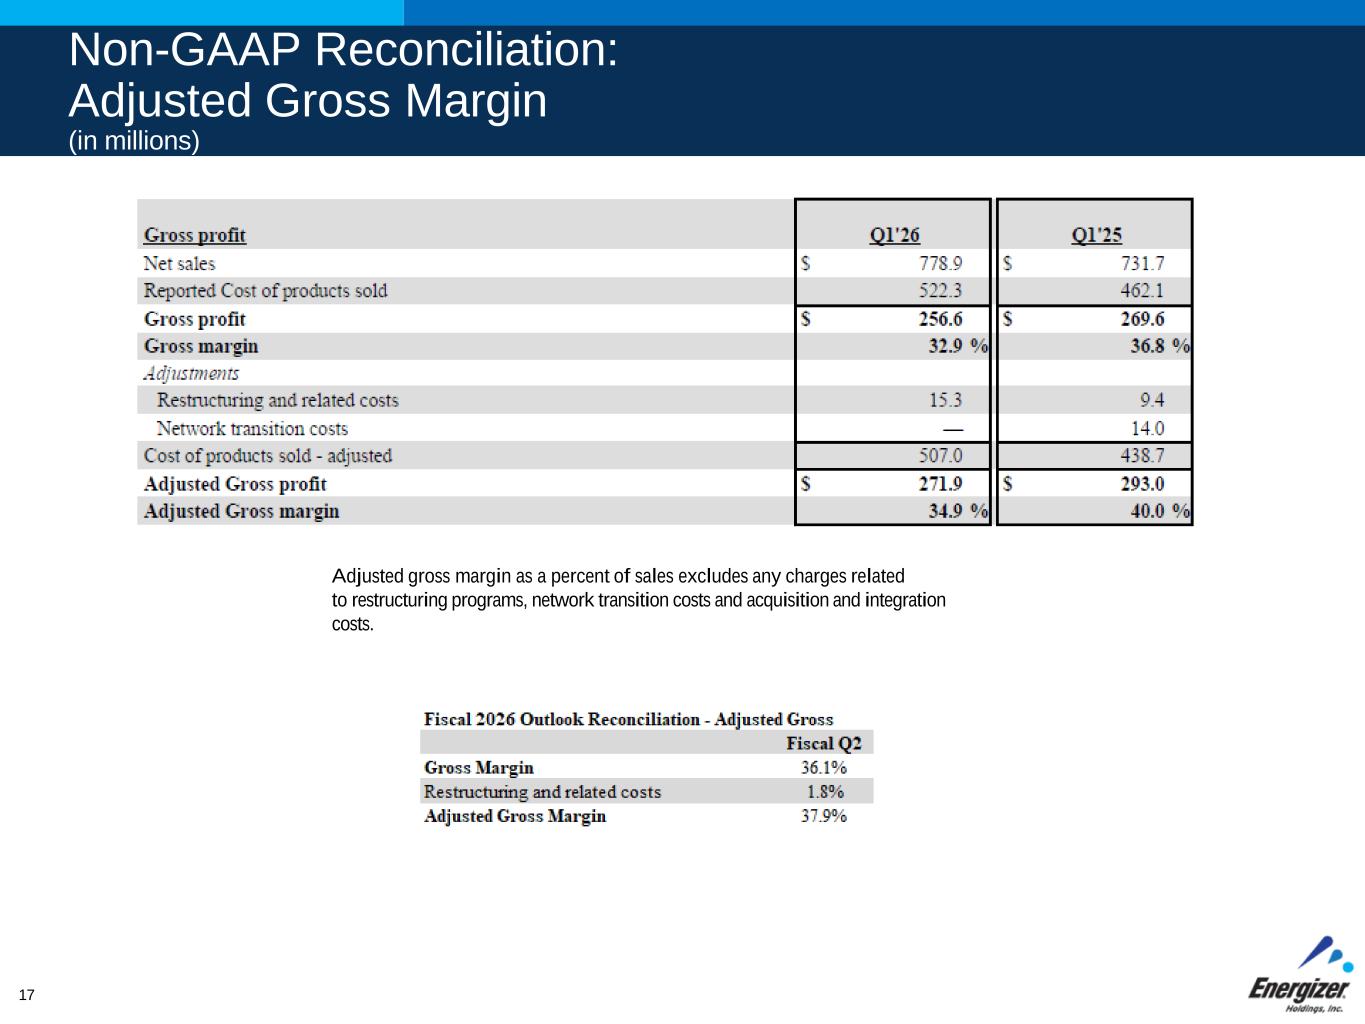
So, you know, our view for the back half of the year or the rest of the year is really that the category is relatively flattish. And as Mark said, that's kind of what we've seen in December and into January. So we've got a good base to build on. Some of the key drivers on the top line that we're looking at, we've called out, you know, the transition of APS customers to Energizer branded product. That's like we expect that to contribute, you know, $30 million or roughly 200 basis points of organic growth. One of the other things, we have plans to really increase distribution in the back half of the year, and that's by leveraging innovation and leading into our full portfolio. That's across both brick-and-mortar and fast-growing e-commerce. So based on current planogram changes that we've got as well as NPD sell-in and then that e-com growth, we're expecting 400 to 500 basis points of growth in the back half. And then we've got some carryover pricing as well as some targeted tactical pricing that we expect to have kind of a 50 to 100 basis point benefit as we go in the back half of the year. So we're seeing, you know, good things within our plan on the top line. And then gross margin, obviously, first quarter was really impacted by a number of factors. A lot of them are not going to continue, so we kind of wanted to give some color around that. I mean, the first one is, you know, the tariffs were almost a 300 basis point impact in the first quarter. We're still flushing through some of that inventory that we bought in the spring and in the summer. So, you know, the rate was higher at that point. We expect that to improve as we go throughout, you know, second quarter and into the rest of the year. We also, you'll see in our report, we sold about $65 million of Panasonic branded product in Q1. That's really related to the APS transition. So we sold through. We're losing that market, you know, at 1231 and we've lost it already. We sold through all that inventory and worked with our customers there in Europe to try to transition that had a pretty big impact on gross margin so that was a 200 basis point hit that's not going to recur as we go throughout the rest of the year the other big one that we've been talking about for a while are the transitional product cost impacts those were you know almost 100 basis points we've done a lot of work to reset the global supply chain you know we should you know flush through most of that as we get through q2 and then the rest of the year we should be in really good shape so you know as we look at q2 we expect 300 basis points of sequential improvement and then we can you know see continued expansion as we go through into q3 and q4 I think you know our plan is to get back into the low 40s which is kind of where we were you know before the tariffs really hit and I think we're going to get you know past these transitional one-time costs and you know leverage targeted pricing and then optimize production credits really in the back half of the year so we've got some good good trends going on Peter, we brought in your question a little bit.
We thought it was important to sort of highlight that front half, that back half.
No, that is helpful. I mean, I guess one follow-ups are really helpful, but it remains a pretty volatile, uncertain environment. So, you know, how would you characterize or how did you think about wearing in flexibility or cushion as you think about the guidance from here?
Yeah, Peter, we always try to build in enough flexibility in the plan to be able to deal with uncertainty. I mean, what you just described has been a constant over the last five or six years. So every year evolves differently than you expect going in. I think one thing this organization has developed over that time period is the muscle memory to be able to read and react the situation and adjust your plans accordingly. And that's a daily occurrence around here. So I think we've got the right plans in place. we're confident in the outlook that we provided. It may not play out exactly as we forecast sitting here today, but ultimately we feel like we can deliver the financials we've laid out.
Great. Well, thank you so much for that and best luck. Thanks, Peter.
Operator
Your next question comes from Rob Oatenstein from Avrocar. Please go ahead.
Great. Thank you. I think you may have just answered my question, but I want to make sure. So batteries, much stronger than we would have expected, less increase in gross profit than we would have expected. Have you just basically totally explained what happened there in terms of Panasonic and the tariffs, or are there other factors, or do I just have that all wrong?
No, that's right, Robert. It's the three items. It's the higher tariffs. APS was really a 200 basis point drag on its own in the quarter. And then it's the product cost transitional nature of some of those changes that we've got going on that should continue to improve.
And then can you talk about the strength in December? Was that the category or was it more you? and does that tell us anything about, you know, potential market share gains in 26? And maybe you could touch on what you see in calendar 26 in terms of shelf space, points of distribution, you know, those sorts of drivers.
Sure, Robert. The category certainly improved in December, but, you know, we also have gained share in the latest reporting periods as well. So that's continuing to be – so the category is improving, and we're improving slightly ahead of the category. As we look ahead in calendar 26, we do expect our distribution footprint to increase both in to be a broader distribution footprint, but also higher quality distribution. We're leveraging our full portfolio to do that from value to premium to make sure that we're meeting consumers where they are.
We also sold in some exciting innovation in both batteries and auto care that you're going to see in Q2 and Q3 so we're excited about the plans we have with our retailers as we head into the rest of the year thank you very much thanks Robert your next question comes from Andrea Tixera from JP Morgan please go ahead hi good morning everyone thank you for taking the question I just want to just drill down a little bit on the top line and obviously you said at stable categories and you're also taking pricing selective pricing I was curious to see how the dynamics within private label in particular obviously at the largest e-commerce partner that you have like how you're thinking of pricing against volume within that that guide and and from there like what what is your expectation in terms of shelf resets you did say I believe you did say as usual like some additional shelf space so just thinking of that and since we haven't discussed the autos yet like just a state of the Union there that would be great thank you.
Sure Andrea let me start with auto I mean it's the smallest quarter we have in auto in Q1 there was a slight impact from weather as well as some timing as well within the auto business we're heading into peak season. We're really excited about your Cura Podium Series. We have additional innovation that we're launching across the portfolio. We always are excited about the prospects of international growth as well as growth in e-commerce. You are seeing a little bit more of a bifurcated consumer in the auto category where higher-end parts of the category are showing growth. We're middle to lower ends of the category. You're having some consumers that are delaying purchases or opting out altogether. I think that makes the Podium Series launch all the more timely for us, which we're participating now in growth at the high end. So as we head into the auto care for the balance of year, still expecting growth, but you are seeing a little bit more of a pronounced bifurcated consumer in that part than maybe what you're seeing in batteries. Now, if I want to switch over to batteries, I mean, let's just talk consumers generally. I mean, consumers are continuing to search for value. You are seeing consumers stressed about finances. In light of those dynamics, they're comfortable switching channels, retailers, brands, pack So they're willing to rotate their purchases to meet their needs. It's critical that we meet them where they are, and this is where Energizer is uniquely positioned with our full portfolio. Private label plays a role in the category. Certainly some retailers are looking to connect with consumers in light of those trends. in the first quarter, we did see an increase in private label at certain retailers as well as some aggressive pricing. This results in volume growth for those retailers, but actually arose category value at the same time. And our view is this is all about balance, and we've already seen some retailers recalibrate their approach and bring more balance to both private label value and premium equation. Even with those dynamics, we gained share over the holiday period, and we're excited about some of the plans that we're leveraging in order to be able to compete with private label but also leverage our value brands and our premium brands to connect with consumers.
Operator
Your next question comes from Carla Casillas from JP Morgan. Please go ahead.
Hi I'm wondering if you're with your guidance do you have a leverage target where you think you would like to get to by the end of this year?
Yeah I think by the end of this year we're expecting to you know get five or a little bit below you know we're going to continue to prioritize debt pay down we feel like we can can you know we pay down over a hundred million dollars in the first quarter still targeting 150 to 200 so I think that's what we'll drive the you know the leverage level over the rest of the year okay great and should do should we assume that M&A is you know back burner and tell you the lever or are you looking at M&A opportunities we will We'll always look at M&A opportunities.
I think any deals that we would look at would be leverage neutral and not impact our debt pay down trajectory that we're looking to achieve. So, that would be on the smaller side.
Okay, great. And then I know in the past you've often talked about storms affecting, you know, the hurricanes, winter storms. Are there distinct differences between winter storms and summer storms? Do you prefer one or the other? Just curious.
Well, I mean, hurricanes tend to be a little more isolated in terms of impact, and whereas this winter storm that we saw over the last couple of weeks really covered a broad section of the country, which is a little different. So the response is going to be different, and the impact on our business will be different. But I wouldn't say we prefer either, but we make sure that we can deliver products when consumers need them. And, you know, obviously, this is something that the organization excels at.
Great. Yes, I couldn't figure out how to word that was horribly worded, but thank you. You got my guess. Don't worry.
We struggle with that, too.
Operator
Pardon me. As a reminder, if you'd like to ask a question, press star 1 on your touchstone phone. Your next question comes from William Reuter from Bank of America. Please go ahead.
Good morning. The first, you mentioned that there were impacts of products that were produced during periods when tariffs were elevated, which have since normalized to the current levels. Can you talk about what the amount of impact that we should kind of normalize this quarter's EBITDA buy based upon the elevated tariff rates?
Like I think I'd probably, I think we're calling for something like 60 to $70 million of tariffs or around 60 was maybe the last where we were. I still, I think that'd be relatively fixed as you go through. We took maybe a bigger hit in the first quarter, but that should be the run rate.
So, I guess I thought you guys had highlighted that there were, you know, the elevated tariff rates, the 145 probably on some products impacted you. Did I misunderstand that?
Yeah, it will go down a bit as you go through the year. I don't have the exact when the tariff hit the first quarter. Got it. We'll come back to you on that exact number, but it does get a little bit better. Plus, remember, we've got pricing and credits, and the credits, the tax credits that we've got will continue to grow as we go throughout the year. So, you know, the total impact that we're calling for tariffs will improve as we go Got it.
And then on the gross margins, you were explicit that the second quarter will improve 300 basis points. And then you said an additional 300 to 400 by the end of the year. So does that mean you will see a sequential improvement from the second to the third and fourth quarters of three to 400 basis points in each? Okay.
That's exactly right, Bill. It'll be sequential. And we did, I mean, our first quarter tariff impact was about 300 basis points. That That will get better on a margin rate as we go forward, for sure.
And Bill, just to clarify, just to make sure you're not walking away with a different model, so it's 300 basis points from Q1 to Q2, and then 300 to 400 between Q3 and Q4, not in each of Q3 and Q4.
Not in each. I might send you an email just to make sure I understand that correctly. Lastly, for your input costs, certainly there's some inflation in some of those metals. Can you talk about what you're seeing now, how much you have locked in, and then what that might mean for, you know, necessary price increases next year for products which you haven't hedged if these elevated input costs remain?
Yeah, we did see a bit of a drag in the first quarter. It was about 80 basis points, and we had some momentum offset to that. But it was really input costs, especially freight and some of our production inefficiencies. Raw materials right now were about a bit of a push, but spot prices we're seeing, especially zinc, has gone up. We've also seen some negative moves in lithium, obviously silver, and then R134A, which is the gas and a lot of our refrigerant products. On zinc, we're over 90% fixed for 26. We've got between contracts and inventory, we're probably in a decent position on a lot of these. You know, I think we'll continue to see pressure as we go more into 27. We've also taken some targeted pricing, especially on the auto side, for some of those cost impacts that should come in in the second and third quarter, and that's a little bit what we alluded to earlier. So, all in, the trends are slightly negative. I don't expect it to be a huge impact at 26, but it's something that we've got to continue to manage.
Got it. All right. That's all for me. Thank you.
Hey, Bill, one follow-up on your question on margin. We have a slide within the earnings deck that provides a little bit more color on the margin progression over the balance of the year, which I think you may find helpful, but I'm happy to connect after the call as well.
Great. I'll take a look at that. Thank you.
Operator
Thanks. And there are no further questions at this time. I will turn the call back over to Marc Lavigne for closing remarks.
Thanks for joining us today. Hope everyone has a great rest of the day.
Operator
Ladies and gentlemen, this concludes today's conference call. You may now disconnect. Thank you.