Operator
Good day, and welcome to the East-West Bancorp's first quarter 2026 earnings call. All participants will be in a listen-only mode. Should you need assistance, please signal a conference specialist by pressing the star key followed by zero. After today's presentation, there will be an opportunity to ask questions. To ask a question, you may press star, then one on a touch-tone phone. To withdraw your question, please press star, and then two. Please note this event is being recorded. I would now like to turn the conference over to Adrienne Atkinson, Director of Investor Relations. Please go ahead.
Thank you, Operator. Good afternoon, and thank you, everyone, for joining us to review EastWest Bancorp's first quarter 2026 financial results. With me are Dominic Ng, Chairman and Chief Executive Officer, Chris Del Moral-Niles, Chief Financial Officer, and Irene Oh, our Chief Risk Officer. This call is being recorded and will be available for replay on our Investor Relations website. The slide deck referenced during this call is available on our Investor Relations site. Management may make projections or other forward looking statements which may differ materially from the actual results due to a number of risks and uncertainties. Management may discuss non-GAAP financial measures. For a more detailed description of the risk factors and a reconciliation of GAAP to non-GAAP financial measures, please refer to our filings with the Securities and Exchange Commission, including the Form 8-K filed today. I will now turn the call over to Dominic.
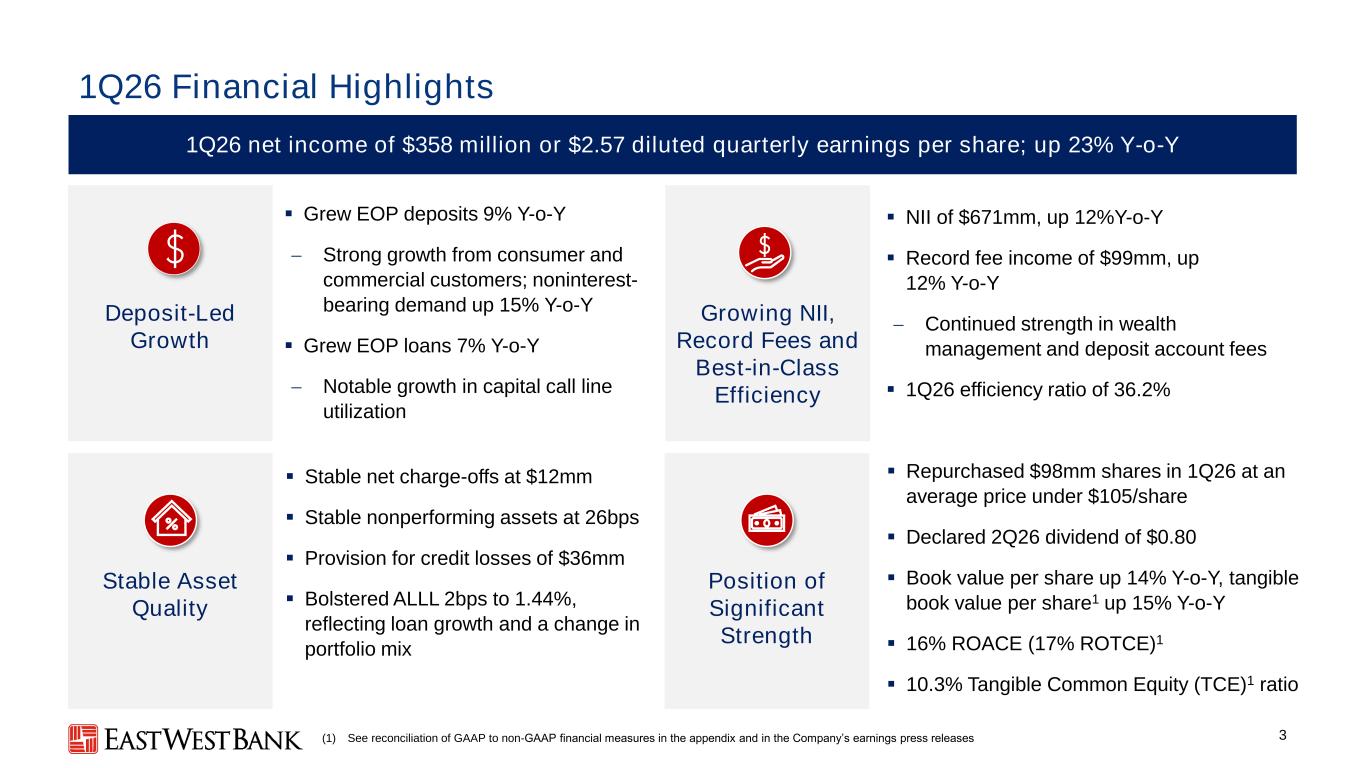
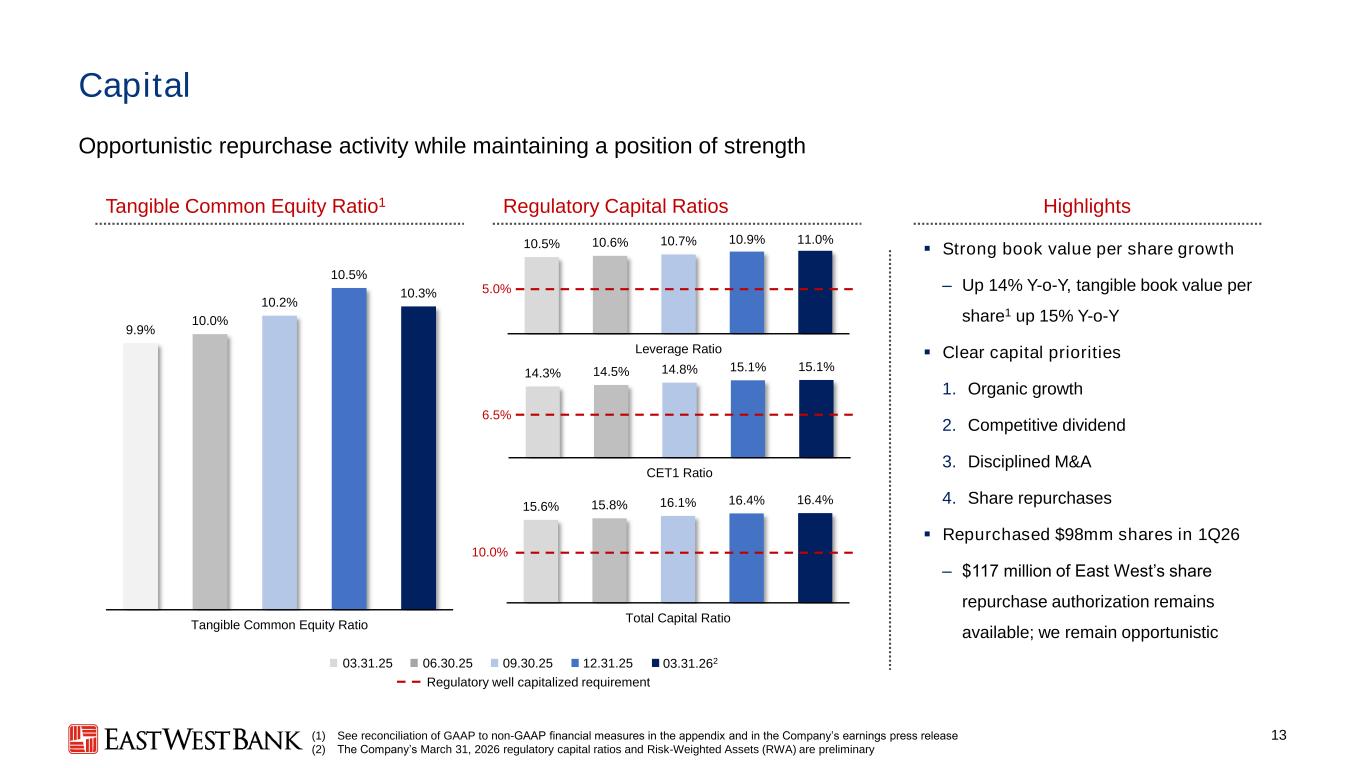
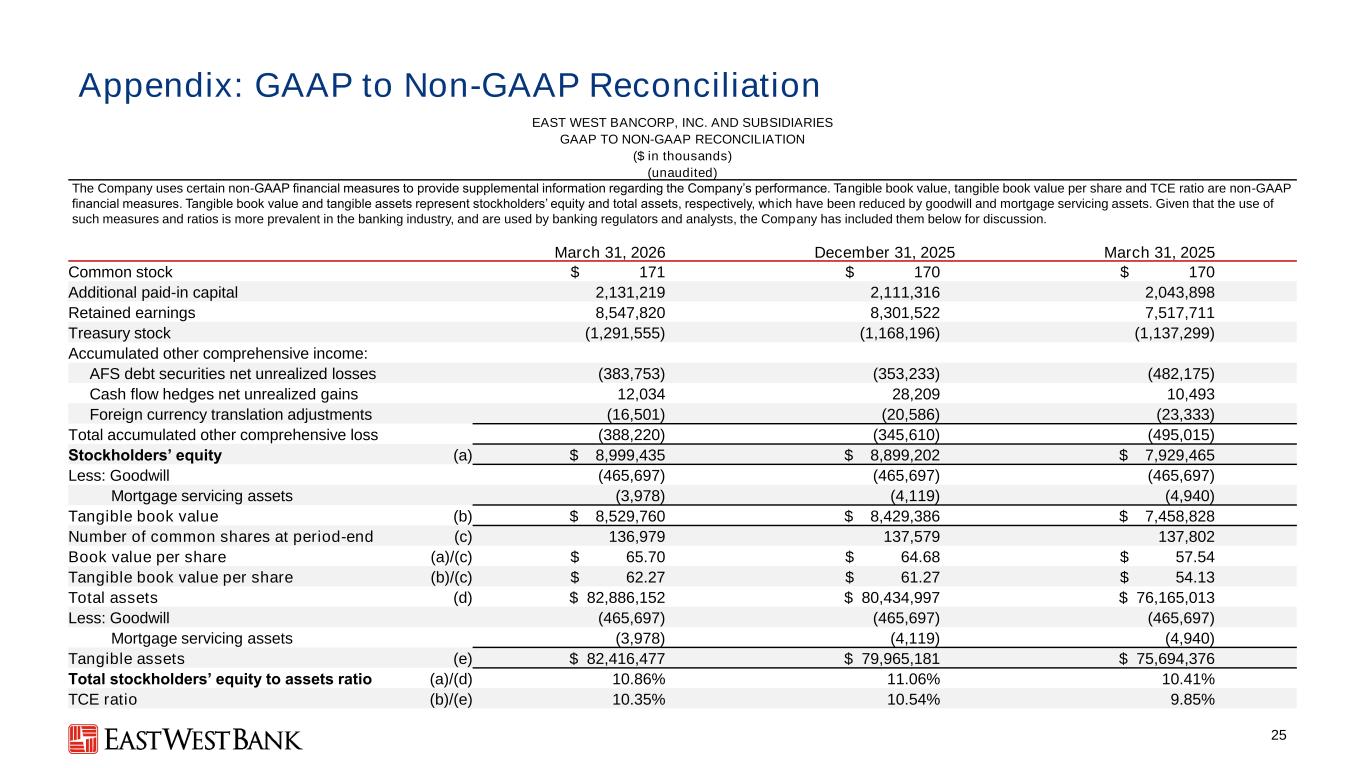
Thank you, Adrian. Good afternoon, and thank you for joining us for our first quarter earnings call. I'm pleased to report that EastWest had another record quarter for loans, deposits, and fee income. Our consumer and commercial depositors continue to place their trust in us, helping grow total deposits by 9% year-over-year. Growth in non-interest-bearing deposits was particularly strong this quarter, up nearly $800 million, driven by our continued focus on providing solutions to retail and small business customers. We also delivered 7% year-over-year loan growth. CNI loans increased by more than $900 million quarter-over-quarter, driven by a higher line utilization, particularly among capital call borrowers. We also achieved a record quarter of fee income, growing 12% year-over-year. We saw strong momentum and wealth management this quarter as we stayed closely engaged with clients. We continue to see opportunity to grow and diversify our fee revenues over time. Credit performance remains stable. Net chargeouts and non-performing assets were low in absolute terms, consistent with our expectations, and reflecting our disciplined approach to risk management. Our capital position remains a key advantage for East-West, with a tangible capital ratio of 10.3%. We maintain this capital level while growing our balance sheet, increasing our dividend, and opportunistically repurchasing shares. We continue to be focused on being disciplined stewards of our customers' trust and our shareholders' capital. I will now turn the call over to Chris to provide more details on our first quarter financial performance. Chris?
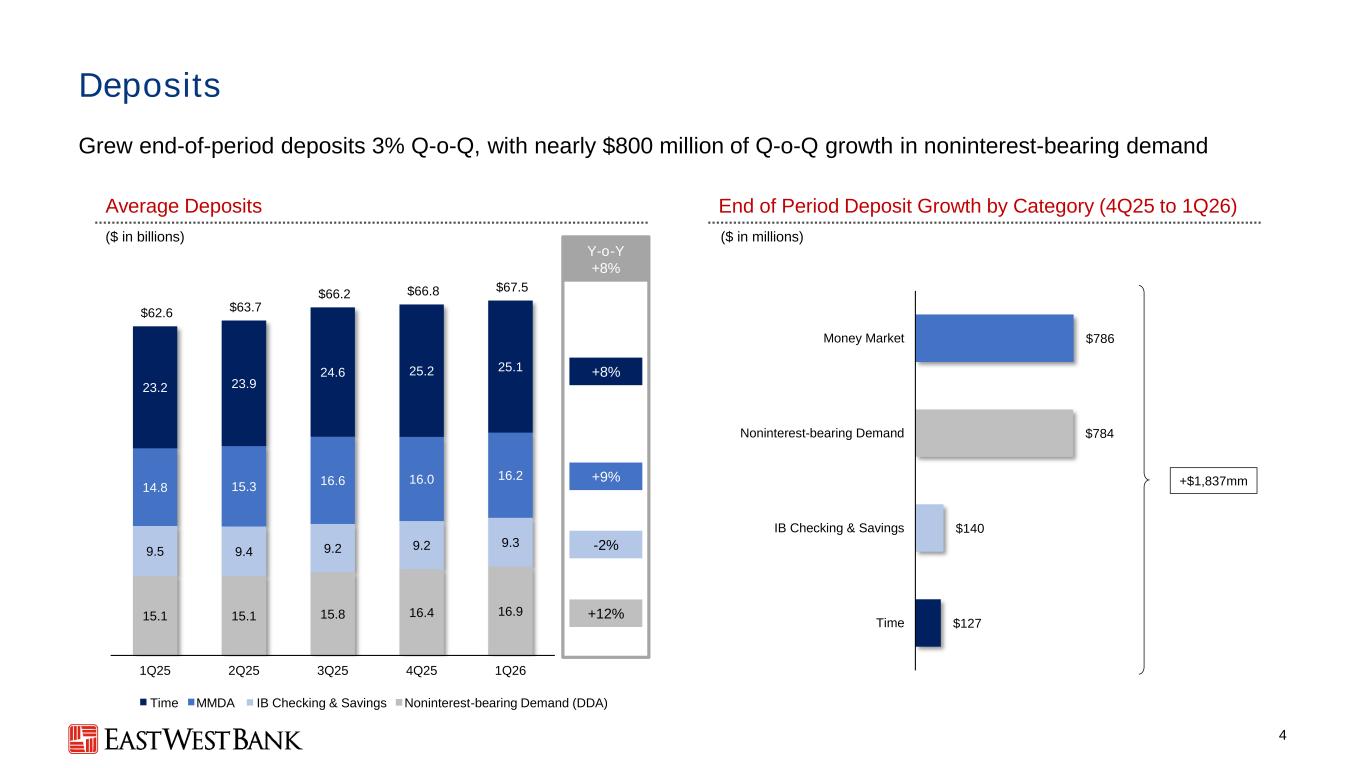
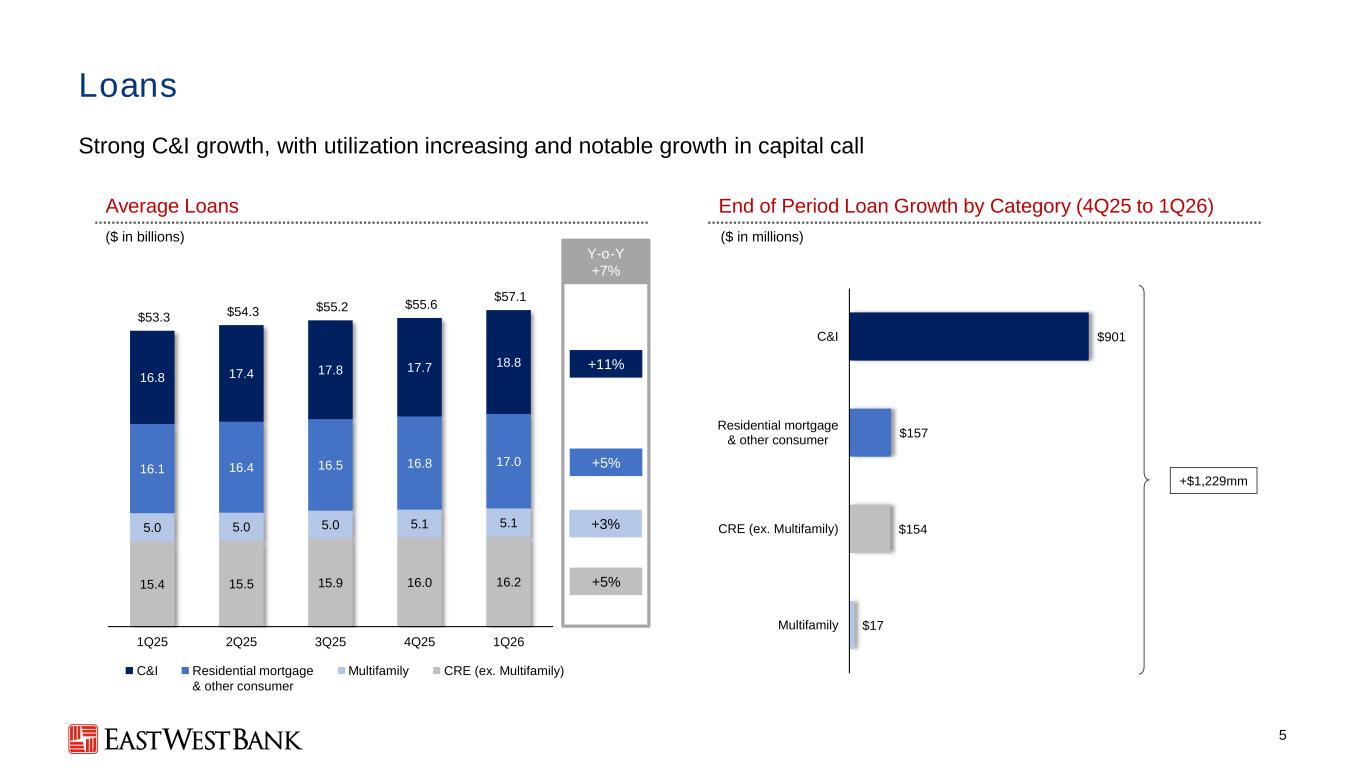
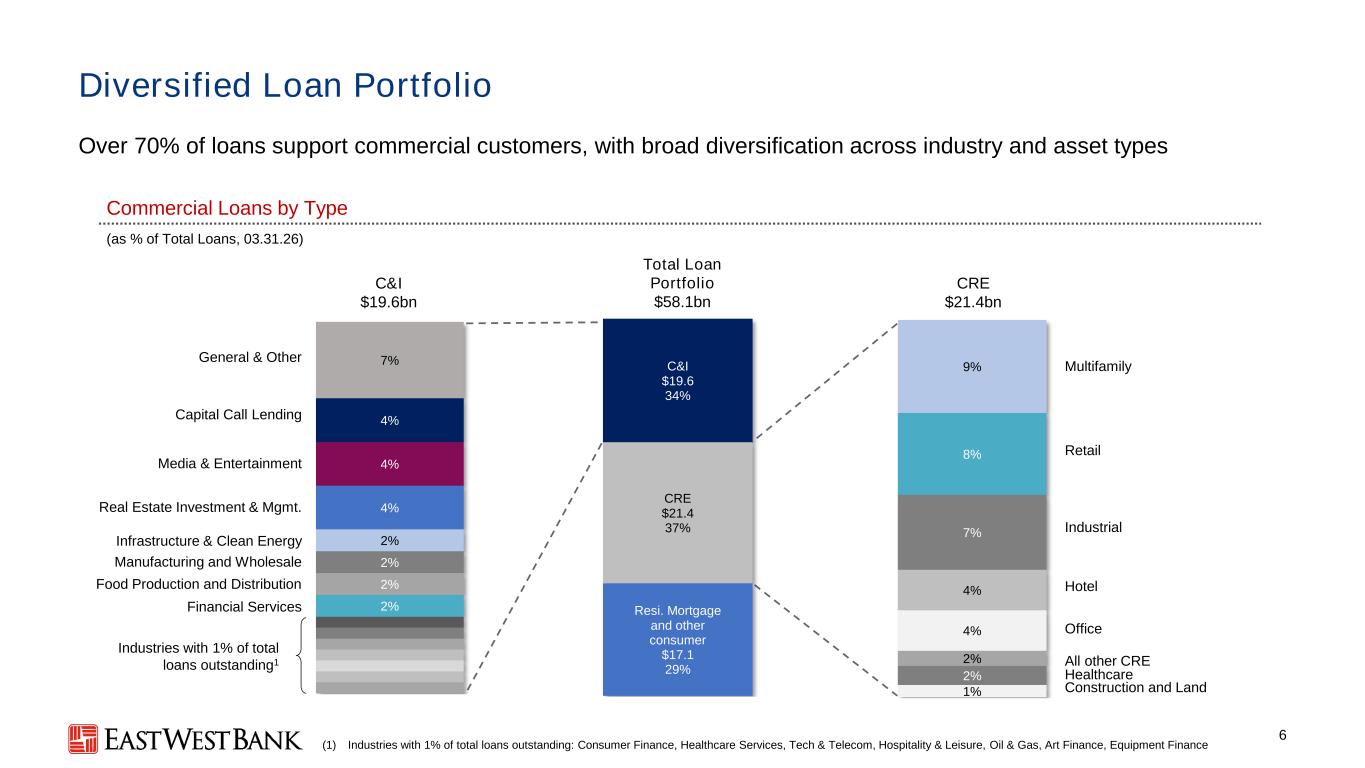
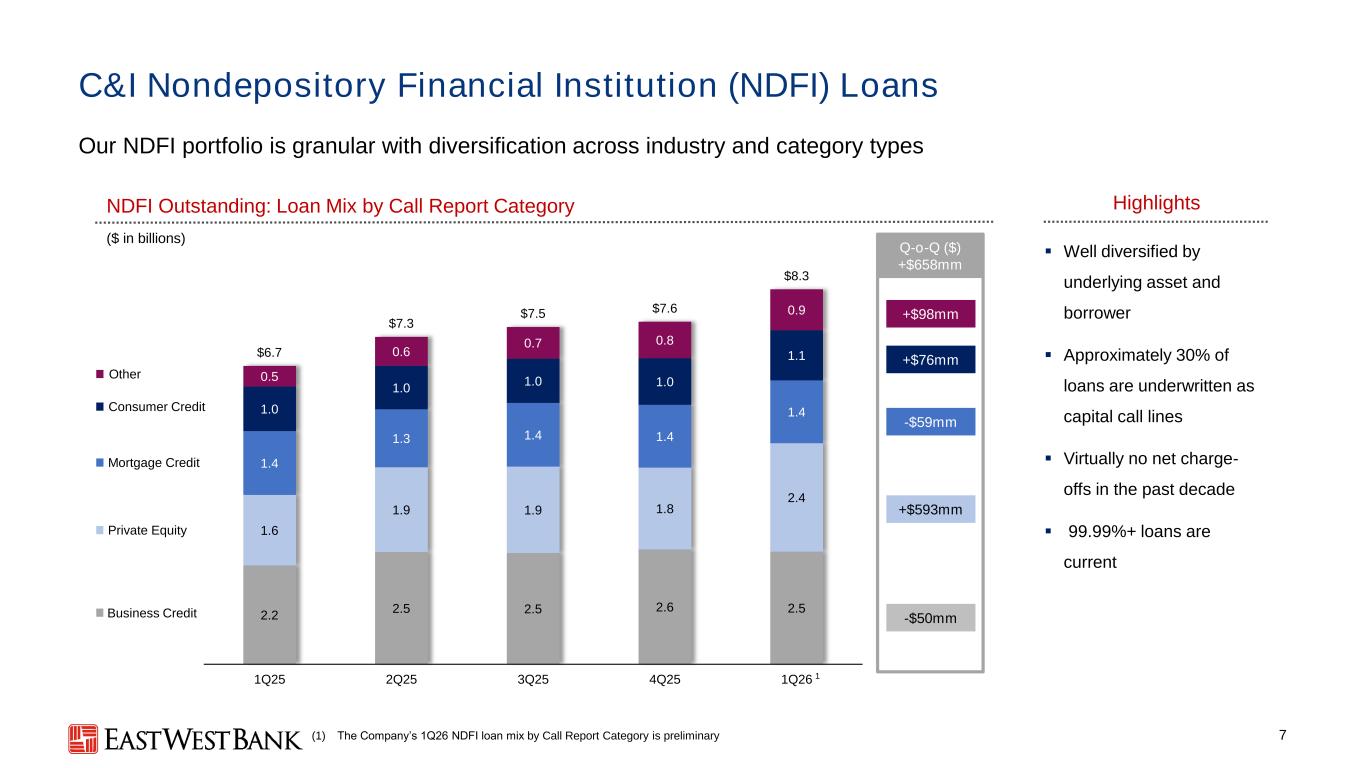
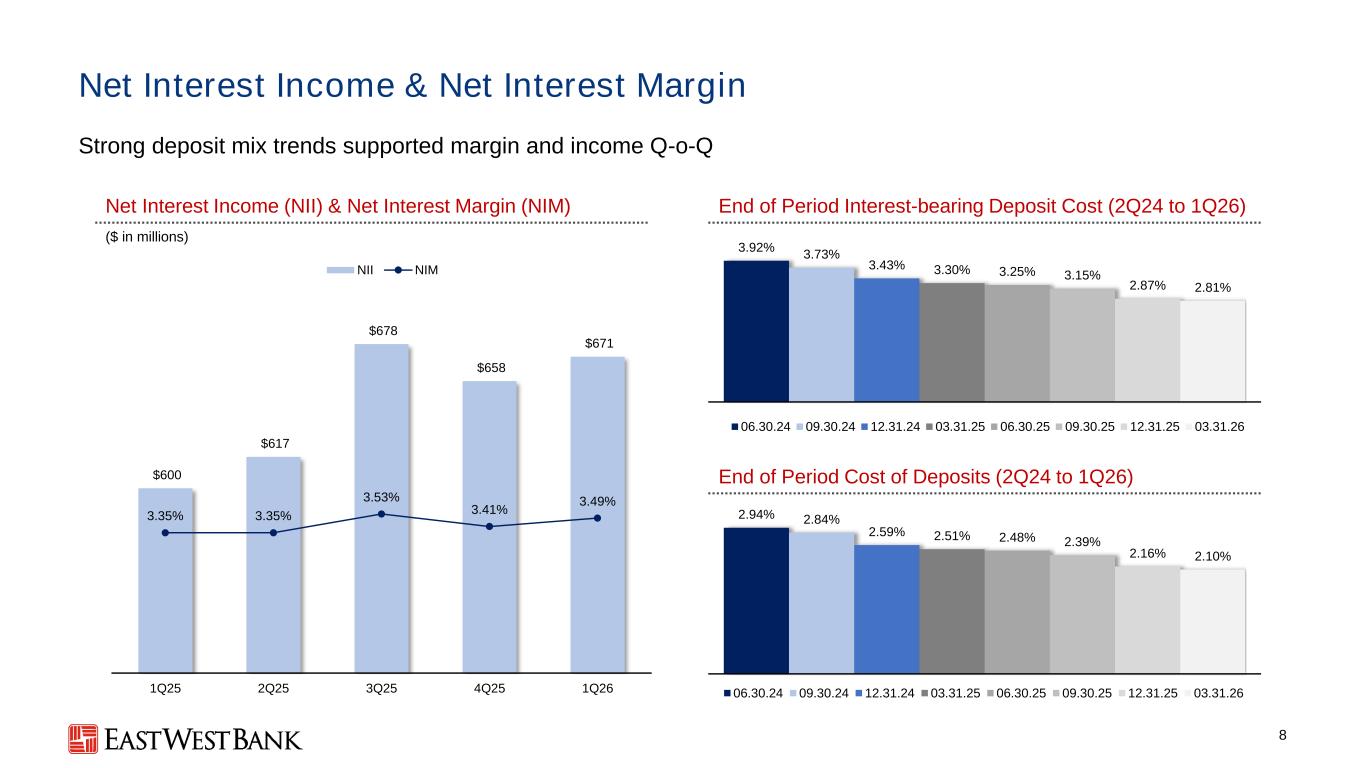
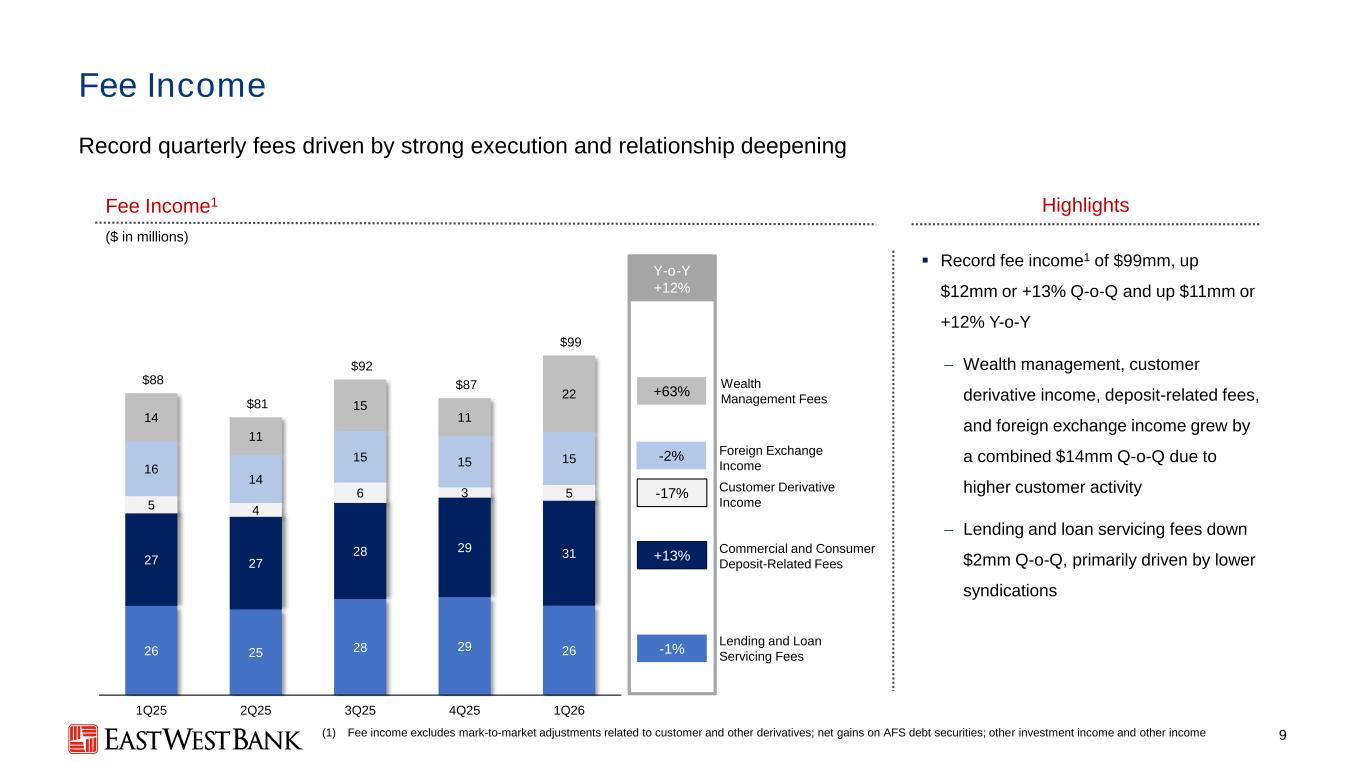
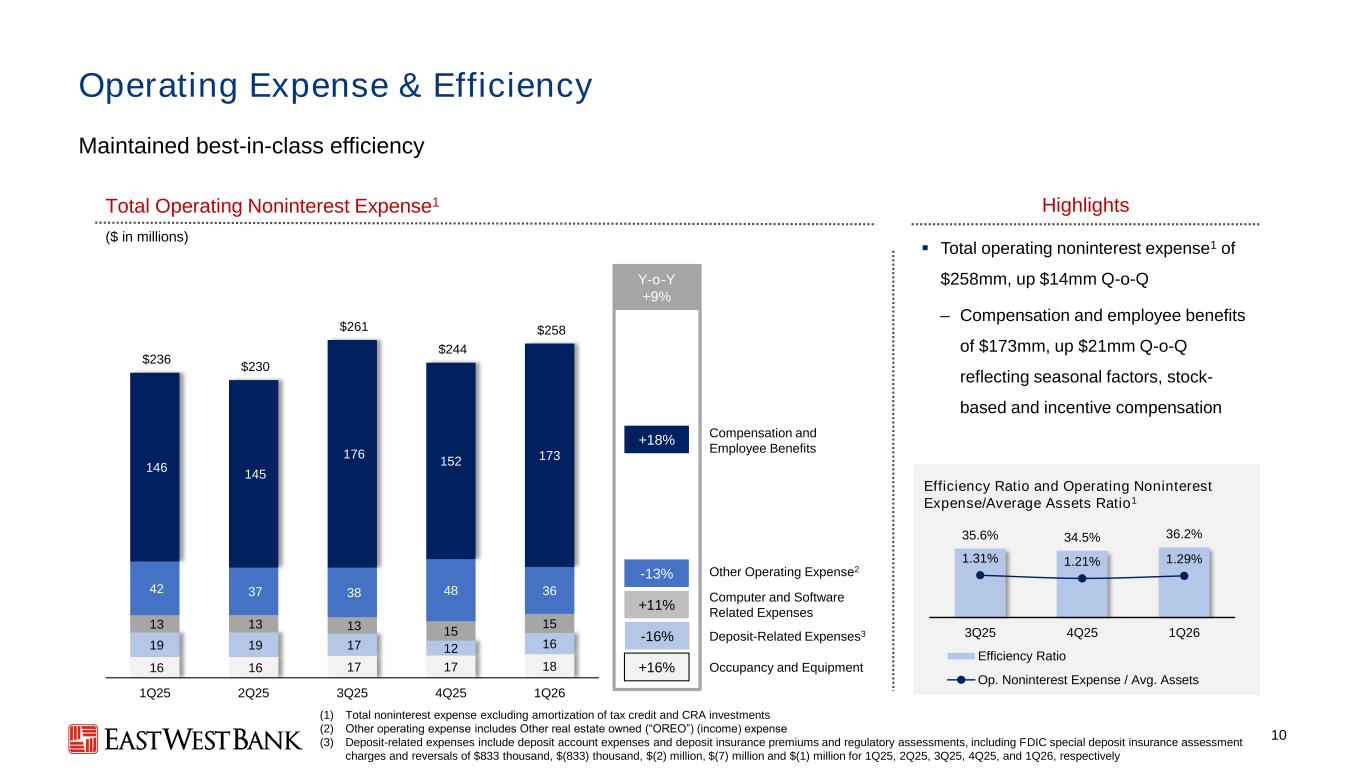
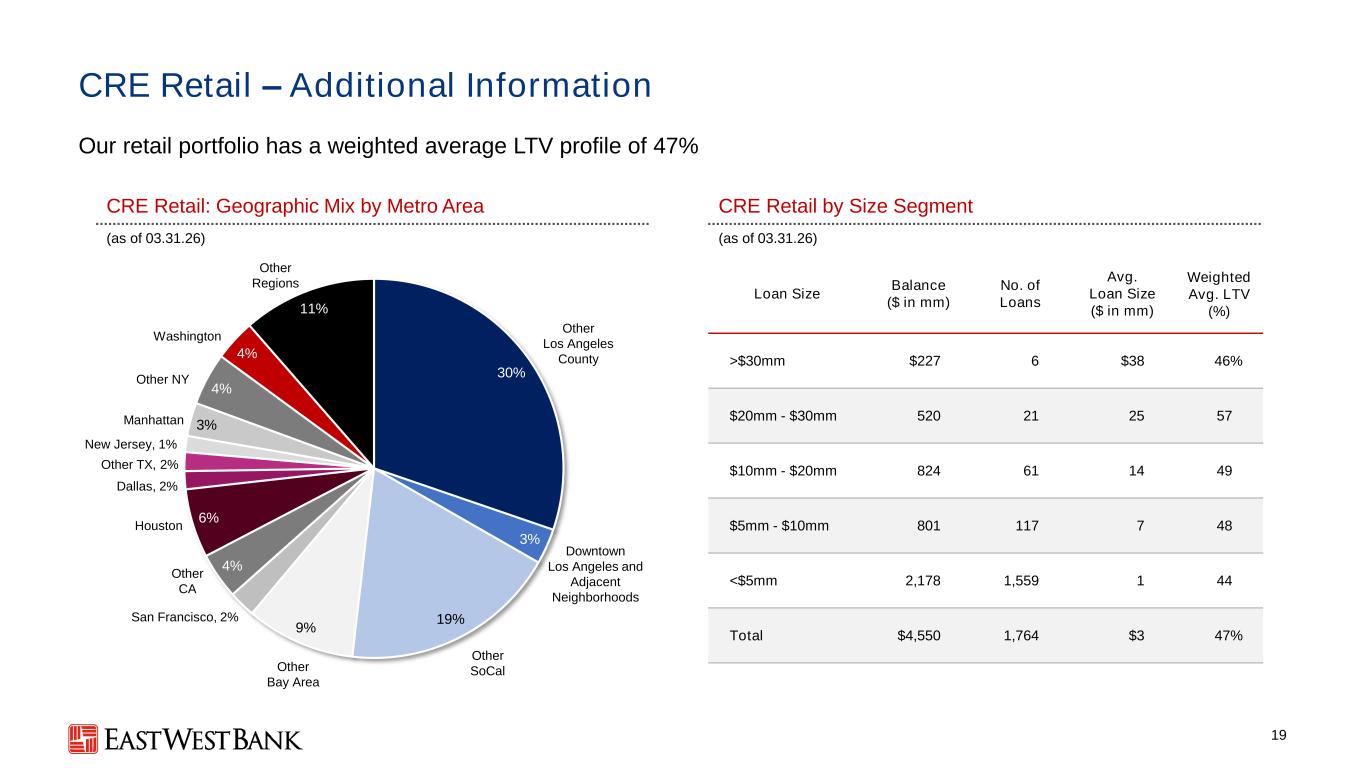
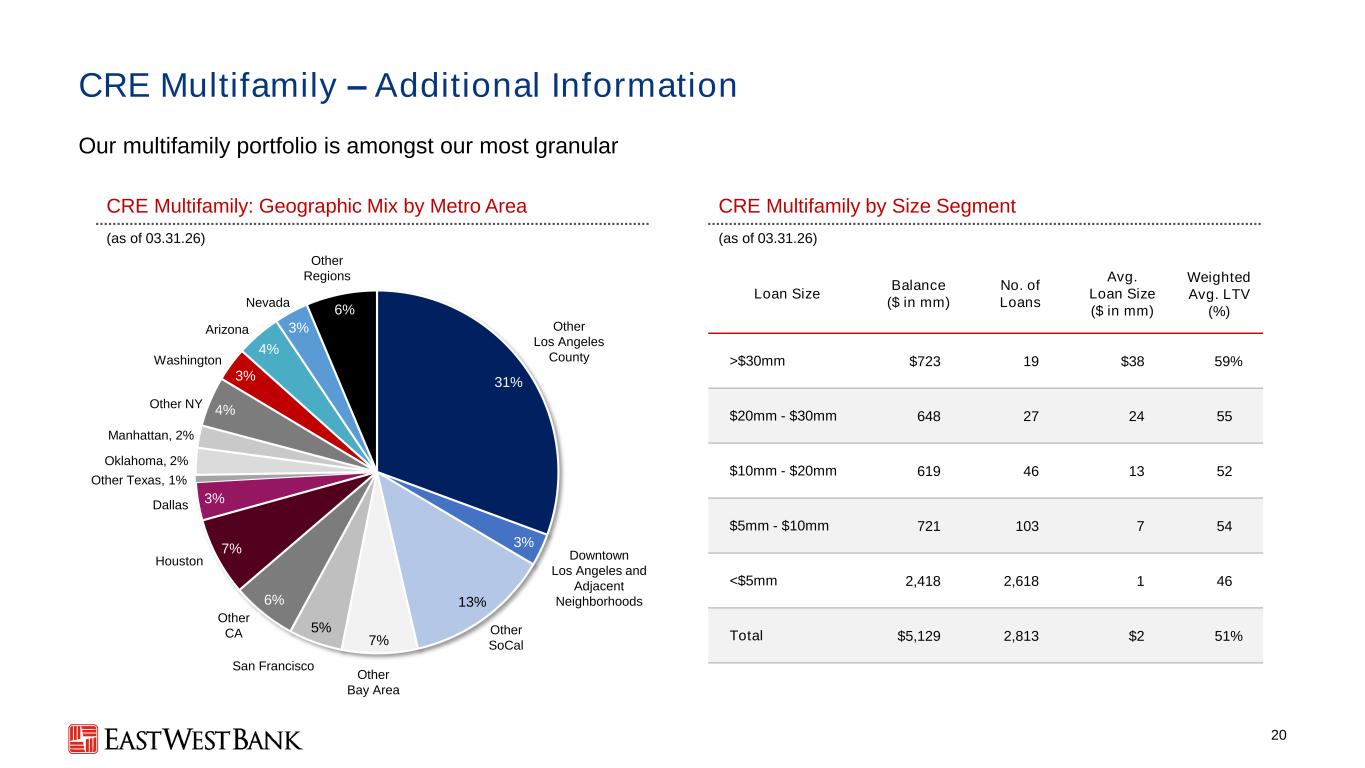
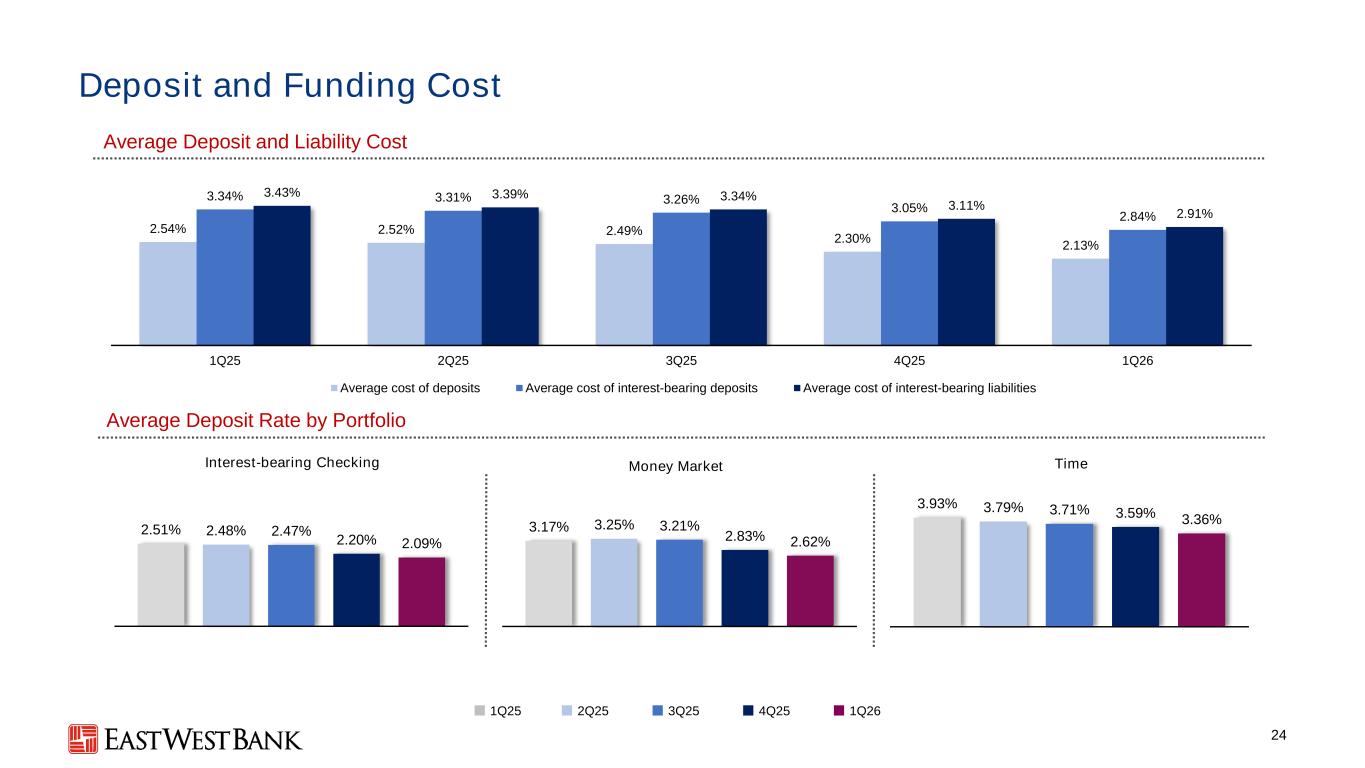
Thanks, Dominic. Let's start with deposit growth on slide four. Our end of period deposits grew by 1.8 billion quarter over quarter. Average GDA growth was up 12% year over year and nearly half a billion on average basis. This checking account growth led us to price our Lunar New Year CD campaign more conservatively this year, allowing us to focus on CD balance retention and drive a better mix of deposit costs for the quarter and going into the rest of 2026. Money market deposits were also up 9% year-over-year as we continue to further diversify away from CDs and other higher-cost deposits. Turning to loans on slide 5, as we emphasized before, our focus has been and continues to be on growing our C&I portfolio. And C&I was the primary driver of growth in Q1. Most of the increase was driven by net line draws from existing customers. While utilization picked up across a range of industries, as Dominic mentioned, capital call-related borrowing made up the lion's share of the first quarter's net growth. The quarter's net draws on capital call lines reflected fraud-based increases in M&A and real estate property acquisitions across the quarter. While some of these lines have already been paid down here in the second quarter, private equity markets and real estate markets remain active and we expect to continue to participate in this activity during the remainder of the year. Residential mortgage experienced a seasonally slower Q1 than we expected, but our pipelines have grown and continue to grow into Q2, and we expect residential mortgage to be a consistent contributor to our overall loan growth during the year. We also grew commercial real estate balances this quarter. Our priority continues to be on supporting our long-standing real estate relationship clients. Given the level of net growth we saw in the first quarter and the pipelines we see going into Q2, we are comfortable reiterating our guidance for the full-year loan growth to be in the range of 5% to 7%. Now turning to 6%, our loan portfolio remains well-diversified with over 70% of our loans to commercial customers across a broad range of industries and commercial real estate asset types. C&I now represents 34% of our total loan, reflecting the results of our focus and emphasis on balanced growth across our balance sheets. Our CRE portfolio remains diversified by a number of product types, with an emphasis on multifamily, retail, and industrial projects. As we look ahead, we remain focused on growing the portfolio in a disciplined way that enhances diversification and remains aligned with our overall risk appetite. Turning to slide 7, we have provided incremental disclosure on our NDFI portfolio. Growth in this portfolio this quarter has been driven primarily by capital call lines. Our NDFI portfolio is granular, with diversification across industry and category types. 99.99% of our NDFI loans are current, and in the past decade, there have been virtually no net charge-offs in this portfolio. Approximately 30 percent of this portfolio is made up of capital call lines. Capital call is not a regulatory classification, and our capital call loans are spread across a range of private equity, mortgage credit, and business credit borrowers. I'll now turn to net interest income and margin discussion on slide eight. Quarterly dollar net interest income increased to 671 million reflecting our ability to grow our balance sheet while overcoming the headwinds of rate cuts in q4 and two fewer days in q1 our short-term liability sensitivity on deposit pricing dynamics and our positive deposit remixing during the quarter allowed us to continue to reduce our deposit costs driving period end cost down a further of six basis points quarter over quarter. Looking back to the start of the cutting cycle, we have decreased interest-bearing deposit costs by 111 basis points, comfortably exceeding our 50% beta guidance shared in prior periods. Moving on to fees on slide nine, fee income grew 12% year-over-year to a new record $99 million for the quarter, with significant growth in wealth management fees driven by structured note and annuity sales, and deposit-related fees driven by higher customer activity. We will remain focused on driving this road and further diversifying our revenue overall, and are quite encouraged by the pace of growth in fee revenues so far this year. We continue to aspire to deliver double-digit year-over-year growth in fee income in 2026. Now turning to expenses on slide 10, East-West continues to deliver industry-leading efficiencies while investing for future growth. The Q1 efficiency ratio was 36.2%. Total operating non-extricense was $258 million for the first quarter and included seasonally higher payroll-related costs, some increased stock-based compensation costs, and higher incentive comps, reflecting increased commissions for wealth management activities. Nonetheless, overall, we continue to expect expenses will come in line with our guidance for the year. Now, let me hand the call over to Irene for comments on credit and capital.
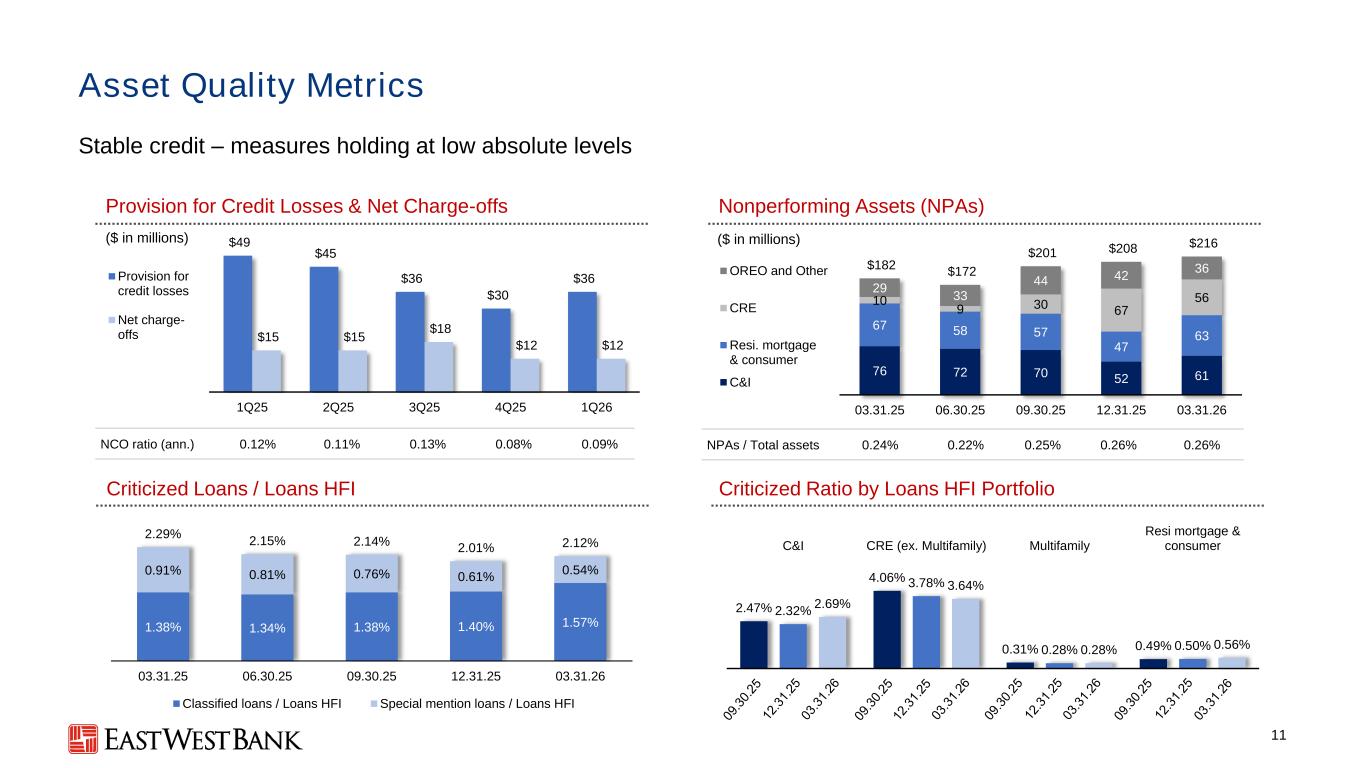
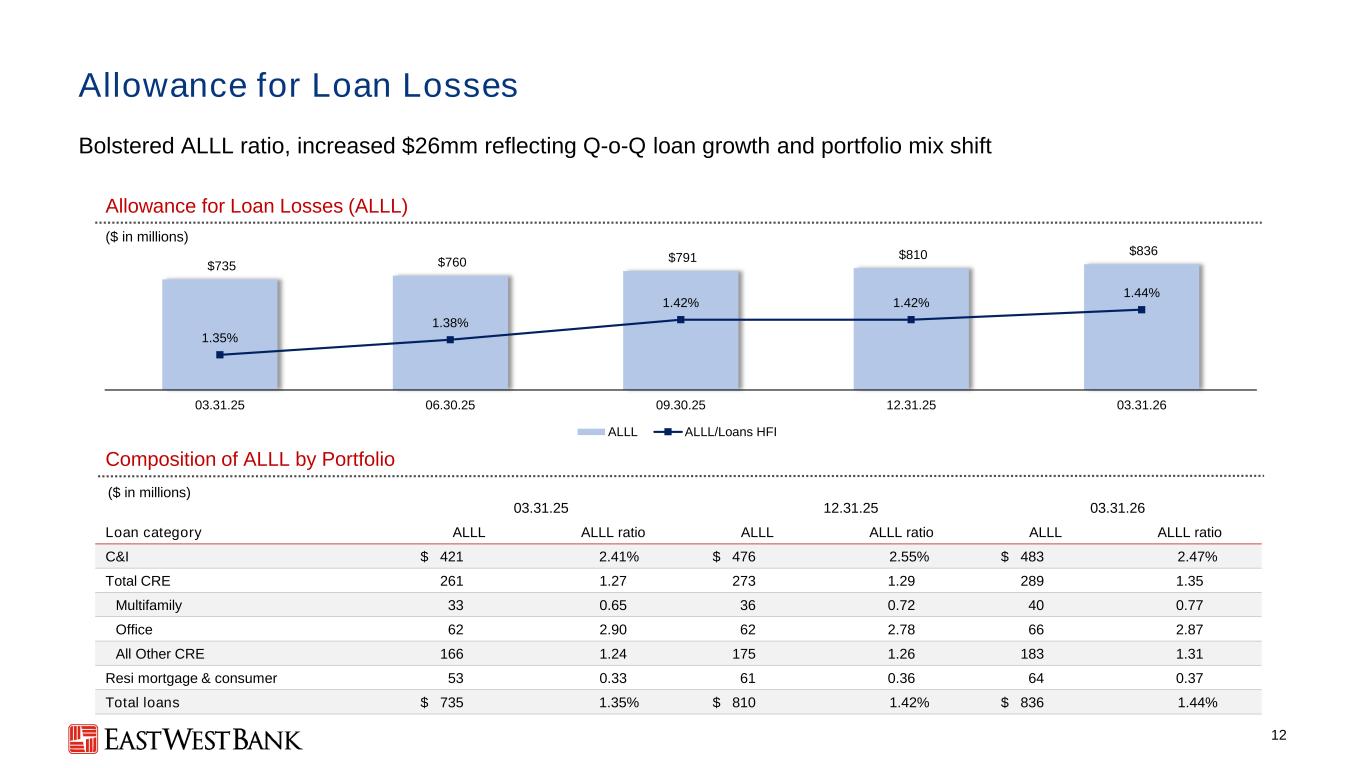
Thank you, Chris. Good afternoon to all on the call. As you can see on slide 11, our asset quality metrics held stable and continue to broadly outperform the industry. Quarter over quarter, non-performing assets remain stable at 26 basis points as of March 31st 2026 we recorded net charge off of just nine basis points in the first quarter of 2026 or 12 million compared to eight basis points in the fourth quarter we recorded a higher provision for credit losses of 36 million in the first quarter compared with 30 million for the fourth quarter we remain vigilant and proactive in managing our credit risk turning to slide 12 The allowance for credit losses increased $26 million to $836 million, or 1.44% of total loans as of March 31st, reflecting quarter-over-quarter loan growth and the portfolio mix shift. We believe we are adequately reserved for the content of our loan portfolio, given the current economic outlook. Turning to slide 13, all of East-West regulatory capital ratios remain well in excess of regulatory requirements for well-capitalized institutions and well above regional and national bank averages. East-West common equity tier 1 capital ratio stands at a robust 15.1% while the tangible common equity ratio now sits at 10.3%. These capital levels continue to place us amongst the best capitalized banks in the industry. In the first quarter, EastWest repurchased approximately 938,000 shares of common stock during the first quarter for $98 million. We currently have $117 million of repurchase authorization that remains available for future buybacks. East-West also distributed approximately $111 million to shareholders via quarterly dividends. East-West's second quarter 2026 dividend will be payable on May 18th, 2026 to stockholders of record on May 4th, 2026. I will now turn it back to Chris to share our outlook.
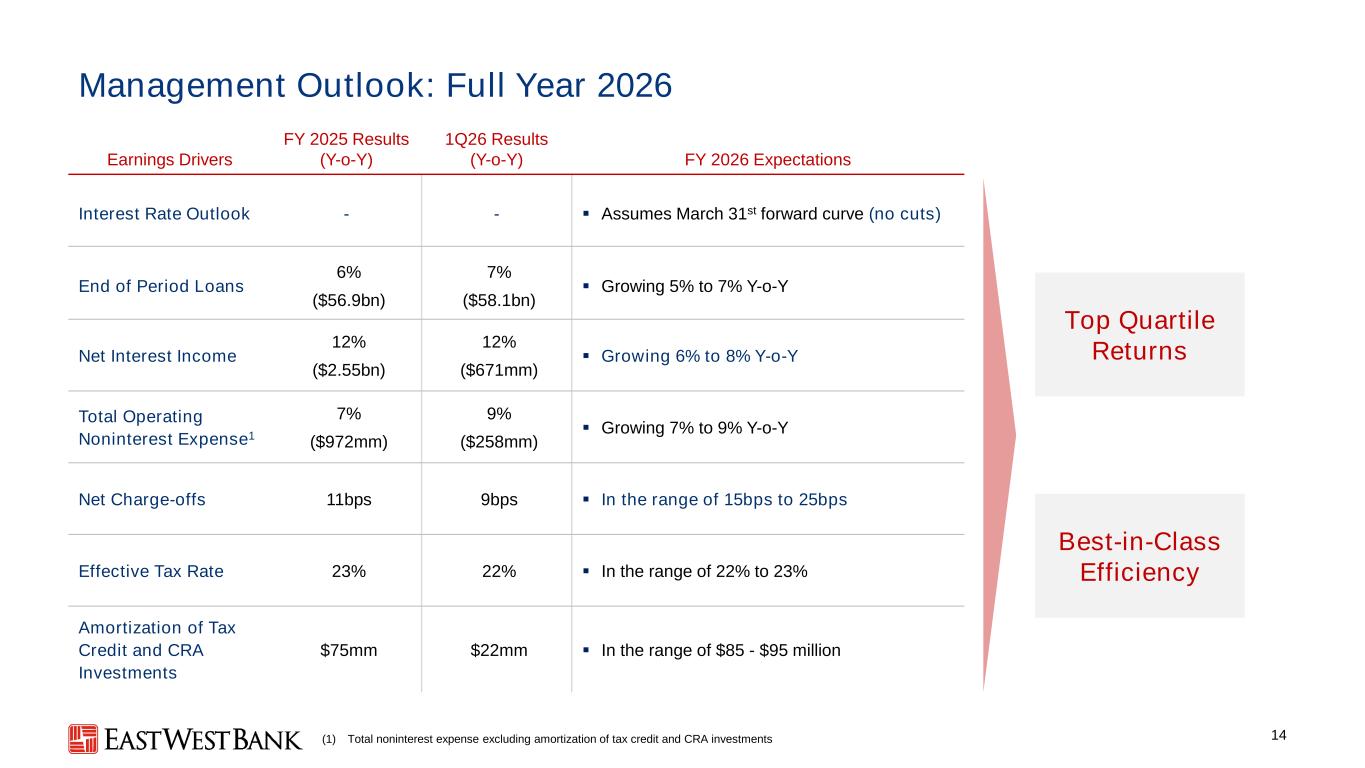
Thank you, Irene. We've assumed the forward curve as is March 31st, which models no rate cuts, and therefore we're updating our full year 2026 net income guidance to grow between 6% to 8%, up from our prior expectations of growth between 5% and 7%. We're also updating our net charge-offs and now projected to fall between 15 and 25 basis points for the full year. With that, we'll be happy to open the call for questions. Operator?
Operator
Thank you. We will now begin the question and answer session. To ask a question, you may press star, then 1 on your touchtone phone. If you are using a speakerphone, please pick up your handset before pressing the keys. If at any time your question has been addressed and you would like to withdraw your question, please press star, then 2. Please limit yourself to one question and one follow-up. If you have any additional questions, you may rejoin the queue. And the first question will come from Ibrahim Poonawala with Bank of America. Please go ahead.
Good afternoon. I guess maybe the first question, just given the capital proposals that were put out by the Fed last month, I'm wondering if you can quantify what impact you expect to your capital ratios, and yeah, I guess as first, just what's the impact that you expect for what are really strong capital levels, and where is this headed if the proposal becomes a final rule?
Yeah, EB, we're happy to cover that for you. The risk-weighted asset adjustment from what's been put out there as Bob will be endgame is roughly a $7 billion reduction in our current risk-weighted assets. It's tied to our current balances, and that would probably translate to something on the order of magnitude of 1.6% to 1.8% increase in our various respective regulatory capital issue.
So are you going to use all that excess capital to start another bank?
Dominic is very opportunistic, and I think we are very comfortable maintaining very strong capital levels, and having more capital has never served this bank badly.
E.B., we're going to use that capital to grow organically.
That's the best answer, so I hope you do. And maybe, I guess, moving to the P&L strong deposit growth. I wanted to get on the private capital call line lending, lots of focus on just private equity, that space. One, it didn't sound like that any of that drawdowns on capital call line lending was stress-driven. It felt like there was more activity that drove that, if you can confirm that. And why are we not seeing more diversified CNI growth pick up, given just the broader momentum? I understand the macro volatility. but are you seeing at least green shoots of other areas where CNI is picking up?
Well, sure. So, EB, I think on the capital call lines, it was pretty diversified. It was the lion's share of the total growth, but it was across a range of industries, and that gives us comfort that things are happening out there and there are green shoots in general. And, of course, there was a component that wasn't capital call lines, which was well over $300 million, And that was all encouraging evidence of continued activity across a range of industries. So we saw activity in food distribution. We saw some cross-border. We saw commercial real estate. We saw a lot of areas that had positive momentum and continue to have positive momentum going into Q2.
And maybe I'll just add, to clarify, at the clarifying point, None of the drawdowns that we saw in the quarter were for anything to stress. Opportunity really is the timing of that. And I think as Chris alluded to, some of those, you know, there's a timing component of this, right? Some of those did pay off in early part of the second quarter, normal activity.
Operator
The next question will come from Dave Rochester with Cantor Fitzgerald. Please go ahead.
Hey, good afternoon, guys. Good afternoon, Dave. I just wanted to ask about the deposit growth. Very solid this quarter. Can you just get an update on the competitive environment there? Do you find yourself having an easier time growing core deposits? I mean, normally this is a softer quarter for that for most banks. The DDA trends looked really good. How do you feel about that going into 2Q and the rest of the year, especially on the DDA side?
I think the DDA growth that you saw has been the result of it. now more than years-long campaign to really deepen our connection with retail, small business customers across our footprint. That's been successful and continues to bear fruit into Q1 26. We're not letting up on that strategy. That campaign has been working arguably better than we expected here, going after it for more than a year, but in a way that we are continuing to devote more time and effort to to make sure we nurture it even more the landscape for deposits however is not easy it is a very competitive landscape and from a pricing perspective the fact that we move from an outlook with multiple cuts in it to a outlook with no cuts means that deposit pricing pressure is real and coming upon us and so the reality is it's doubly impressive from our perspective, that our teams are able to go out there and win non-industry-bearing DDA money in an environment where rates aren't expected to come down anytime soon. So kudos to our retail team, kudos to our small business team, kudos to all our commercial RMs out there working their customers to find opportunities for us to add value. Really paid off here in the first quarter, but no, I don't think pricing is going to get any easier, and I don't think competition is going to get any easier.
All right. I appreciate that. Just a follow-up on wealth management. You talked about staying close to the customer and that helping you guys out this quarter. It was a really big number this quarter. Can you just talk about how you see that trending moving forward? If you've added new people that are helping boost that number, if you've got new products, anything else that can help us figure this out going forward?
There was a fair amount of volatility in Q1, and some of our clients decided that some structured notes were a good thing. and we added some notable volume and structure notes. We also added some annuities during the quarter as people moved out of equities at record highs into annuity products. But we also added people late in the quarter, so they don't add a big impact to the Q1 numbers, but we expect they'll continue to support continued growth and wealth management as we roll through the rest of the year.
All right, great, thanks, and nice buyback.
Operator
Thank you. The next question will come from Jared Shaw with Barclays. Please go ahead.
Hey, good afternoon. Hey, thanks. I guess sticking on the deposit theme, you know, with the good growth that you're seeing in the mix shift, how should we think about sort of the trend of deposit pricing costs in a flat environment? I mean, do you think you're still going to be able to continue to march that lower as we go forward?
I think, Jared, in some prior calls or meetings, I had alluded to the fact that we have been benefiting from rolling down the hill and that there would come a point in time where the hill would stop to be so steep and flatten out, and I think we've hit that point now. So, no, my comments earlier that I don't think deposit pricing is going to get easier alludes to the fact that I think our ability to march down or roll down the next wave of CDs has sort of run its course to a large extent. That having been said, I'll just remind you all, we are asset sensitive, which is why when we're changing our guidance from cuts to a flat rate environment, we're also upping our NII guidance because higher for longer is net better for East West Bank.
Okay, that's a good color, thanks. And then any color, maybe Irene, on the growth in resi non-performers? Are you seeing any areas of stress there, maybe from, you know, tech worker disruption from AI or anything that you're spending a little more time looking at?
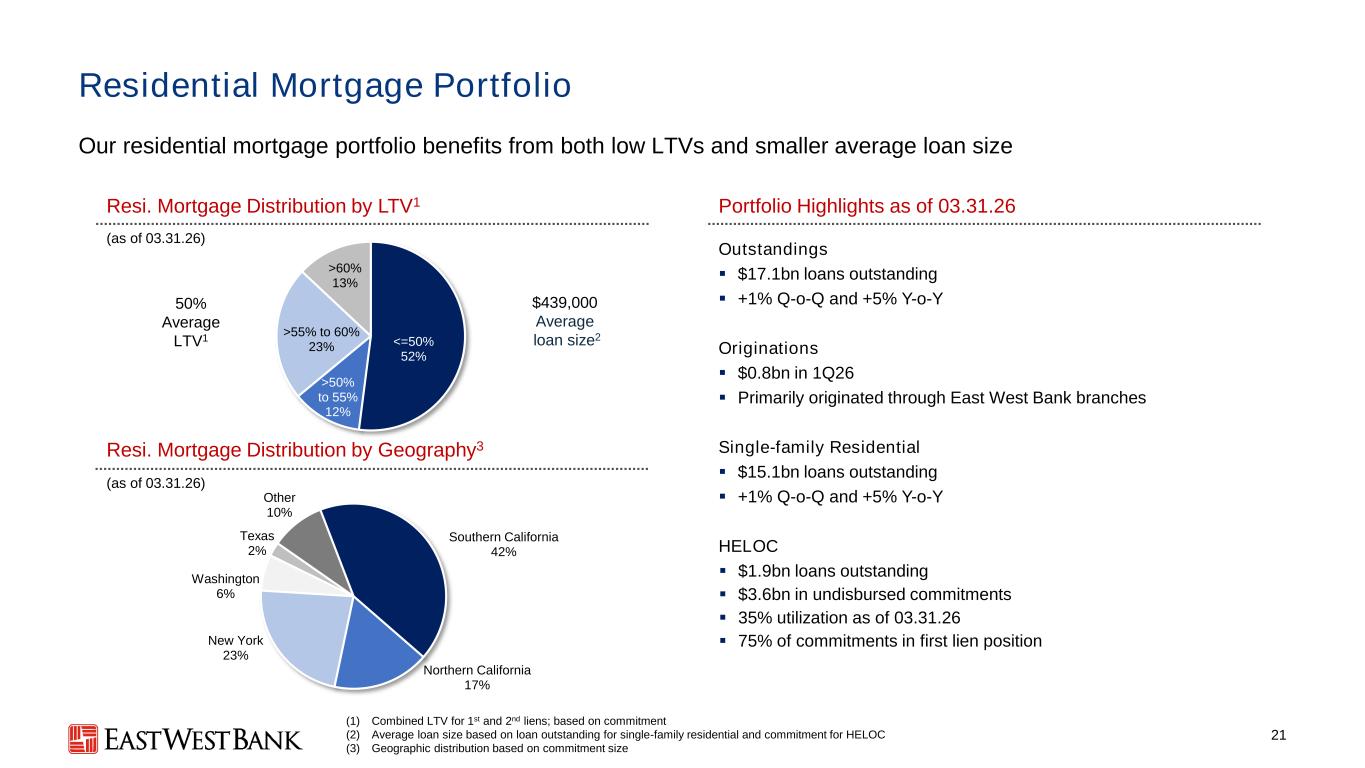
Yeah, that's a great question. You know, we have seen a little bit increases in that. Ultimately, though, you know, there isn't anything that we view as systemic. It really is customer by customer, loan by loan. And ultimately for us, given the low loan-to-values we've underrated, we don't see a lot of loss content there.
Operator
The next question will come from Casey Hare with Autonomous Research. Please go ahead.
Good afternoon, Casey. Good afternoon, everyone. I wanted to touch on loan growth. Apologies if I missed this. So the guide of 5 to 7 off of a quarter where you're growing at 8% annualized and pipelines sound pretty constructive, kind of a recurring question with you guys, but why is that a little conservative or what are we missing here?
I would point to page 9 of our press release tables which says that from March 31st of last year to March 31st of this year, we grew by exactly 7.0% on total loans, so that felt like it was in the range of 5 to 7 and warranted holding the range.
Okay, yeah, I mean last year was a much different I mean, we had the tariff, and obviously the macro is okay. I get it. All right. Just moving back to the capital discussion, Irene, I heard you say you're going to grow organically. I've also heard you guys talk about some M&A aspirations on the East Coast where, you know, there's pockets of Chinese-American populations that would fit well with the strategy here. Just some updated thoughts around that. And, you know, just given the excess capital under the Basel III proposal, what, you know, if you were to find an opportunity that you did like, what are some parameters around earn back and tangible book value dilution?
Well, I'll start, and maybe Dominic and Chris can chime in afterwards. We have a kind of hierarchy. Organic, right? Organic growth is our priority, and we've been able to show over many, many years the ability to grow our franchise through organic growth, although, as you know, we have a history many years ago also of being able to do successful, well-priced strategic acquisitions as well. So organic growth is our number one priority. I think certainly when it's opportunistic, stock buybacks, you know what the return is. And then also acquisitions, well-priced, strategic, makes sense for the franchise, something that ultimately has to be a better return than our ability to grow organically.
And we complement that, of course, with a regular dividend, and we review the dividend at least annually. and dividend is our second go-to after organic growth and it's where we have most recently increased our dividend you'll recall in the first quarter by a third and we'll continue to look at that to make sure it remains competitive and then as Irene mentioned, follow up the organic growth with dividends and then inorganic opportunities at the right price and then share buybacks perhaps in the future, opportunistically. Great, thank you.
Operator
The next question will come from Manan Gasalia with Morgan Stanley. Please go ahead.
Hey, good afternoon. Hey, good afternoon. On the deposit growth side, the question is, do you typically see some sort of flight to safety from clients, you know, clients just holding more liquidity at times when there's elevated geopolitical risk? And I guess the question is, do you see any of that this quarter? You know, I'm just trying to assess how much of the strength in DDA growth is seasonal or idiosyncratic versus how much of that, you know, do you see this as a new base to grow off of?
Clearly, East-West Bank over the last 15 years has been the beneficiary of a very strong, well-capitalized, and highly liquid bank of net deposit loans from our customers and increased balances from other banks in the region, from other banks in the country, and even some pockets outside. All of that has served the East-West benefit and continues to be. And it does feel like whenever there's an errant headline, we see more opportunities to engage with more customers and have been successful at gathering more deposits. So we like the position that we have. It apparently pays dividends to be the best capitalized bank in the industry and one of the most profitable banks in the industry, and for everybody to recognize that and trust us in that way. And so I think we are well-positioned, and I don't think it's temporary. But, yes, we do see flows come in and out, and tax flows do happen on April 15th, and we saw some of those flow out. But we feel good about the base that we've built and the over-a-year growth in deposits that we've been seeing for almost 15 straight years.
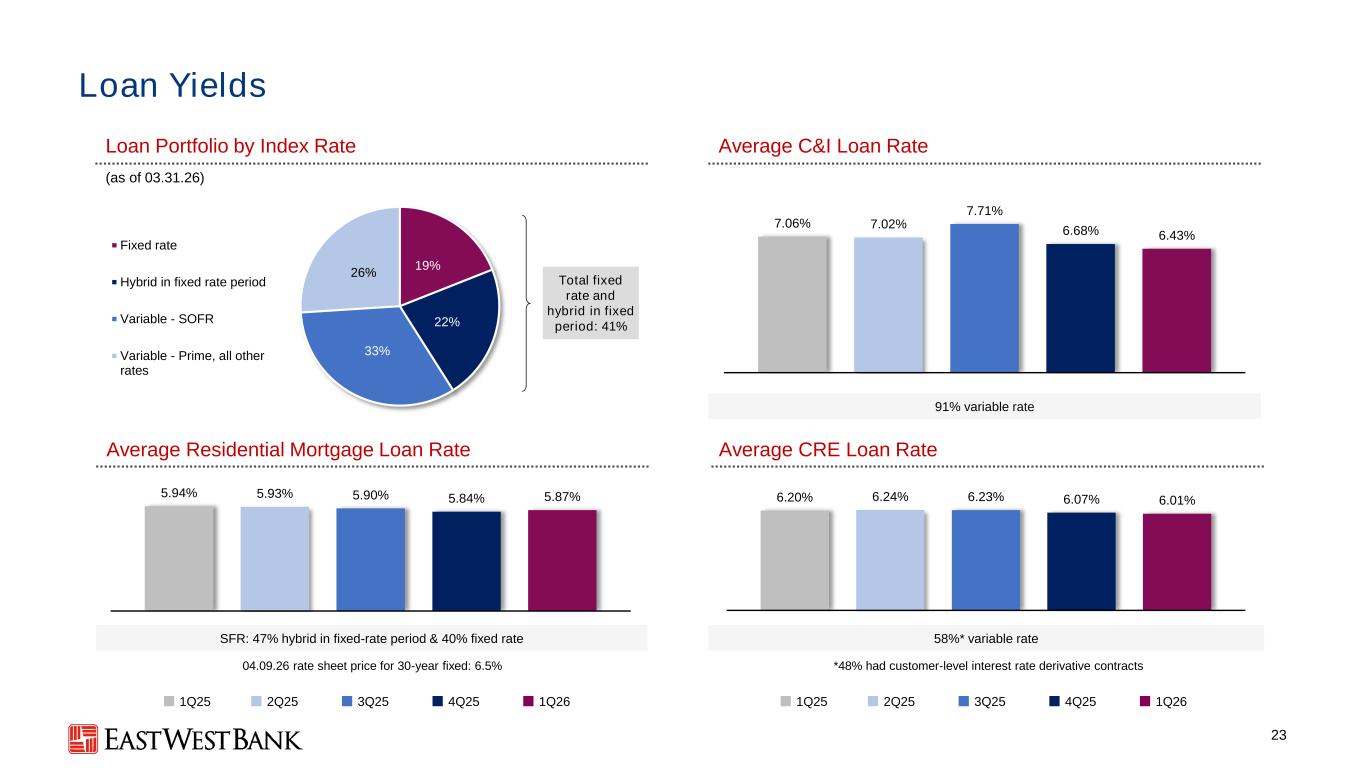
Right, perfect. And then you guys give the CNI loan yields at the back, and I'm not surprised to see that edge down slightly. Is that all just rate-related, or is there anything that comes there from makeshift, you know, maybe to capital call or investment-grade clients, or is there anything you're seeing in terms of competition impacting spreads?
I think we have seen competition broadly impact spreads over the course of the last year. we also provide the net interest margin table on pages 10 and 11 of the press release and what you'll see there is you know a broad um you know repricing downward because most of our portfolio is floating rates and that just comes through as those naturally move forward with the rate cuts that we saw last year including the ones that happened in december but as we've mentioned And our resets here sometimes don't kick in for about 45 days late. So we saw still repricing impact in Q1 related to the December rate cuts.
Operator
The next question will come from Bernard von Kizicki with Deutsche Bank. Please go ahead. Good afternoon, Bernard.
Hey, good afternoon. Chris, you know, you mentioned the checking account growth led to pricing the Lunar New Year CD campaign more conservatively this year, allowing you to focus on CD retention. Can you just remind us how much CDs rolled off during the quarter, how much was retained, any color unexpected improvement in pricing from rolling forward CDs in 2Q?
Yeah, so we had a little over $10 billion roll over during Q1, and we net grew CDs, as presented on slide 4, by $127 million. So we essentially priced for retention and achieved retention. And then from a pricing perspective, as I mentioned earlier, we've been benefiting from rolling downhill, but we sort of flattened out that roll. And as we said here today, I'm not sure incremental new CDs will be necessarily repricing with much of a benefit as we roll into Q2 and Q3. We're currently pricing our CD special at $360, which is not going to necessarily move the needle a lot on our CD price.
Okay. And just as my follow-up, I think in last quarter you mentioned the impact from hedging impact. There was a headwind of about $2 million. What was it this quarter? Any expectations for full year you can provide?
Yes. The rest will be flat, and all those hedges today are in the money. Looking forward, given the backup of the money, we're still in the money. The market-to-market value of all the trades is positive, so they're going to add value moving forward.
Okay, great. Thanks for taking my questions.
Operator
The next question will come from David Chiaverini with Jeffries. Please go ahead.
Hi, how's it going? Thanks for taking the question. On the NII outlook, so you raised it, you know, 6% to 8% from 5% to 7%, you alluded to higher for longer being good for East-West. Was this the main contributor to raising the guide, or was the loan outlook also part of it? Can you unpack that a little bit?
We would attribute the guide increase exclusively to the change in the rate outlook. And as I noted earlier, we're not raising our loan guidance at this point in time. So that's still baked in there at 5% to 7%.
Got it. And on the net interest margin, how should we think about the outlook from here, based on your commentary on the deposit front? Is a dip, you know, a reasonable way to think of it? Or how should we think about the NIM going forward?
So we're thinking about the margin and dollar NII as moving higher, they'll probably both crack at least flat to positive.
So the NIM flat to positive from here.
Correct. Even though there's incremental deposit pressure, the fact that loans will be yielding higher for longer this year means it will still end up with a better net interest income and likely slightly better net interest margin than we were previously projected.
I would remind you though that the first quarter has fewer days, so don't index off of the Q1 number. That's the index off of the day count adjusted number.
Operator
The next question will come from Chris McGrady with KBW. Please go ahead. Good afternoon, Chris. Hey, Chris.
Good morning, everybody. Good afternoon, everybody. Long day. The tweak in the credit guidance is a tweak, but I think it's a fairly important vote of confidence or statement. Can you unpack what drove you to change the charge-off guide after one quarter?
Yeah, that's, it's simply put, right, when we look at the portfolio, when we look at kind of what we're seeing, you know, this is our view as far as at least today, where we think the net chart books are going to be.
Okay, so good visibility on the outlook. Okay. And then within the seven to nine expense growth, I'm wondering if you could parse out, you know, run the bank versus invest in the bank and how over time, you know, this level of growth, I think this was a similar guide you gave last year at the beginning of the year, how AI might influence that over the medium term.
In the short to medium term, AI is a cost because we all have to run to figure out how we're going to combat mythos and everything else that the market is throwing at us. And so the reality is we're spending time to make sure we're, as we have been for the last year, investing in our cyber defense, investing in our monitoring tools, investing in our daily operating capability to make sure we're as resilient as possible. And those are investments that I'll highlight are not regulatory-driven. They're investments that are driving us to be the best bank we can be every day for our customers, and we're going to continue to make those investments every day. And that's why we will continue to believe 7% to 9% expense growth is the right level. While delivering the best efficiency ratio in the industry. Exactly. Okay, great. Thank you.
Operator
The next question will come from David Smith with Truist Securities. Please go ahead.
Hey, good afternoon. Good afternoon. I was wondering if you'd give us any updates on how you're looking at blockchain or stable coins as you look at ways to, you know, better help your clients with international business needs transfer money more efficiently. Thank you.
We continue to see the vast majority of our customers wanting and continuing to transact in fiat currencies. But we do have customers that hold a variety of crypto and stablecoin, and we're monitoring those continued conversations, development, new products, and new solutions. We have put some projects sort of into the hopper that we think we'll be able to deliver at the appropriate time when there's a little more market acceptance to those. And we've been working with one or two clients on select opportunities to be supporting them on a back office basis. and so we'll continue to be active around the space but have not yet rolled anything out to customers.
Are tokenized deposits part of that potentially or anything there?
We have explored those. We have not yet rolled out or put something like that on the shelf, but that's one of the things that we've looked at in concert with, I think, some larger industry vendors that have proposed solutions and we're trying to figure out if we want to use those or something different. So we're just exploring that and monitoring those development cycles. Thank you.
Operator
The next question will come from Janet Lee with TD Cowan. Please go ahead. Good afternoon, Janet.
Good afternoon. So in recent years, you generally were able to grow deposits at a pace that's modestly above loans. Is it fair to assume that your deposit growth for 2026 would be the same as in coming in line to above your loan growth guide for the year, given the strong results, especially given the strong results from the first quarter?
Janet, I would note that on page three of our financial highlights, we led with deposit-led growth as the story. And so we continue to see deposit-led growth as the story and continue to expect deposits to help us drive a better funding mix, a better liquidity profile, and more reservoir of dollars available to meet our clients' needs as borrowers are retiring. But, yes, it's been a deposit-led story.
Okay. Thank you. And maybe I'm missing something here, but if you were able to keep your net interest margin flat to modestly improving versus the first quarter, I guess, excluding the day count impact and then loans growing at six and a half to, sorry, what was your loan growth guide? Okay. Loan growth in the 5% to 7%. Your NII, what would be the puts and takes around you getting to that lower end versus the high end? It looks like you're tracking at least at the higher end and potentially better?
I think some of those things are true, but the other things that we talked about are that deposit pricing pressure continues to build, and we would expect that to eat into some of the benefit that we might see from higher for longer as in the course of the year. If the economy is strong enough or inflation levels are strong enough such that rates are not even lower, then probably there's more net funding going on in the industry and deposit pricing competition strengthens or becomes more rigid or even increases and makes that more costly. And we've factored that into our models for 2026.
Operator
The next question will come from Timur Brasilia with UBS. Please go ahead. Hey, Timur. Good afternoon. Hey.
Good afternoon, everyone. Chris, just circling back on the loan growth, maybe specifically for the coming quarter, appreciate the comment that some of the capital call lines had already paid down. That's going to be offset with improvement in the mortgage warehouse business. I guess net-net and 2Q, are you still expecting those loan balances to grow? And are we still thinking that 1Q is kind of seasonally softer for some of the traditional commercial business lines?
So unpack that question again, because you said something about warehouse, and we don't do a lot of warehouse. So repeat your question for me, Timur, sorry.
Yeah, just the puts and takes on some of the lines being paid down in 1Q versus the growth that you're expecting in the second quarter and whether or not that's going to net positive balances in 2Q and then just the seasonality on some of the commercial pieces.
Sure. So on the private equity capital call line activity that we saw in Q1, Irene mentioned and I mentioned we'd already seen some of that pay off here in April. And we probably expect more than a third of it to pay off, frankly, in the ordinary course during the ordinary second quarter. So that uptick that we saw should be, in the ordinary course, paid down to some extent. However, we continue to see continued activity in private equity and in mortgage private capital. And those two areas may, therefore, offset those paydowns and allow us to deliver additional growth in Q2. As we sit here today, we would expect that. Got it. And then too much seasonality per se in the other areas of our commercial business.
Got it. And then one on credit, ACL has been building over the last couple of quarters. I think you guys called out some mix ships here in the first quarter. Just give us a sense of where you are likely in that ACL build, and should we expect that to start settling out and being utilized here at some point or is that going to remain fairly conservative in holding up at these current levels?
I think the bank has traditionally approached ACL as being, you know, making sure it was appropriate and perhaps on the margin making sure it was modestly conservative. I think we continue to do so. From a bill perspective, it was two basis points for the quarter. I'll defer to Irene on specific comments around the portfolio. But I think the reality is, with our visibility that we do have in the charge-offs, we feel pretty good about where we stand. Irene?
Yeah, maybe I'll just add just a little bit on the technical side of it. We do use a multi-scenario model for calculating our allowance. And as of March 31st, the downside scenario did change quite substantially from what it was at year-end, that certainly was one of the factors.
Operator
Great. Thank you. This concludes our question and answer session. I would like to turn the conference back over to Dominic Ng for any closing remarks.
Thank you to everyone for joining us today. I want to thank our team for their continual hard work and dedication, which continues to show in our results. We appreciate everyone, your time and interest, and looking forward to speaking with you again next quarter. Goodbye.
Operator
The conference is now concluded. Thank you for attending today's presentation. You may now disconnect.