
Gap Inc 8-K, filed Mar 9, 2023
Gap Inc (GAP)
8-K
2023-03-09
For: 2023-03-03
View Original
Added on
April 10, 2026
About this 8-K
Gap Inc filed this 8-K on March 9, 2023, reporting on events of March 3, 2023.
Items reported
- Item 2.02: Financial results
- Item 5.02: Director or officer change, or executive pay
- Item 9.01: Financial statements and exhibits
UNITED STATES
SECURITIES AND EXCHANGE COMMISSION
Washington, D.C. 20549
FORM 8-K
CURRENT REPORT
Pursuant to Section 13 or 15(d) of the
Securities Exchange Act of 1934
Date of Report
(Date of earliest event reported)
(Exact name of registrant as specified in its charter)
| (State or other jurisdiction of incorporation) | (Commission File Number) | (IRS Employer Identification No.) | ||||||||||||
| (Address of principal executive offices) | (Zip Code) | ||||||||||
(415 ) 427-0100
(Registrant’s telephone number, including area code)
N/A
(Former name or former address, if changed since last report.)
Check the appropriate box below if the Form 8-K filing is intended to simultaneously satisfy the filing obligation of the registrant under any of the following provisions (see General Instruction A.2. below):
| Written communications pursuant to Rule 425 under the Securities Act (17 CFR 230.425) | ||||||||
| Soliciting material pursuant to Rule 14a-12 under the Exchange Act (17 CFR 240.14a-12) | ||||||||
Pre-commencement communications pursuant to Rule 14d-2(b) under the Exchange Act (17 CFR 240.14d-2(b)) | ||||||||
Pre-commencement communications pursuant to Rule 13e-4(c) under the Exchange Act (17 CFR 240.13e-4(c)) | ||||||||
Securities registered pursuant to Section 12(b) of the Act:
| Title of each class | Trading Symbol | Name of each exchange on which registered | ||||||
| Indicate by check mark whether the registrant is an emerging growth company as defined in Rule 405 of the Securities Act of 1933 (§230.405 of this chapter) or Rule 12b-2 of the Securities Exchange Act of 1934 (§240.12b-2 of this chapter). | |||||
| Emerging growth company | |||||
| If an emerging growth company, indicate by check mark if the registrant has elected not to use the extended transition period for complying with any new or revised financial accounting standards provided pursuant to Section 13(a) of the Exchange Act. | ☐ | ||||
Item 2.02 Results of Operations and Financial Condition.
On March 9, 2023, The Gap, Inc. (the “Company”) issued a press release announcing the Company’s earnings for the fourth quarter and fiscal year ended January 28, 2023. A copy of such press release is furnished as Exhibit 99.1 to this Current Report on Form 8-K and is incorporated herein by reference. A slide presentation, which includes supplemental information relating to the Company’s fourth quarter and fiscal year earnings, is furnished as Exhibit 99.2 to this Current Report on Form 8-K.
The information provided pursuant to this Item 2.02, including Exhibits 99.1 and 99.2 attached hereto, is being furnished to the Securities and Exchange Commission and shall not be deemed “filed” for purposes of Section 18 of the Securities Exchange Act of 1934, as amended (the “Exchange Act”), or otherwise subject to the liabilities of that Section, nor shall it be deemed incorporated by reference into any filing under the Securities Act of 1933, as amended, or the Exchange Act, except as expressly set forth by specific reference in such filing.
Item 5.02 Departure of Directors or Certain Officers; Election of Directors; Appointment of Certain Officers; Compensatory Arrangements of Certain Officers.
In connection with the Company's cost and operating structure optimization efforts announced today, the Company has decided to eliminate Asheesh Saksena's role as the Company's Chief Growth Officer, effective March 9, 2023. His last day with the Company will be March 24, 2023.
In addition, Mary Beth Laughton, a named executive officer of the Company, will be leaving her role as President and Chief Executive Officer of Athleta, effective March 9, 2023. Her last day with the Company will be March 24, 2023.
Item 9.01 Financial Statements and Exhibits.
(d) Exhibits.
| Exhibit No. | Exhibit Description | |||||||
| Press Release dated March 9, 2023 announcing the Company’s earnings for the fourth quarter and fiscal year ended January 28, 2023 | ||||||||
| Supplemental slides provided in connection with the Company’s fourth quarter 2022 earnings call | ||||||||
| 104 | Cover Page Interactive Data File (embedded within the Inline XBRL document) | |||||||
SIGNATURES
Pursuant to the requirements of the Securities Exchange Act of 1934, the registrant has duly caused this report to be signed on its behalf by the undersigned hereunto duly authorized.
| THE GAP, INC. | |||||||||||
| Date: March 9, 2023 | By: | /s/ Katrina O’Connell | |||||||||
Katrina O’Connell | |||||||||||
| Executive Vice President and | |||||||||||
| Chief Financial Officer | |||||||||||
Exhibit 99.1

GAP INC. REPORTS FOURTH QUARTER AND FISCAL 2022 RESULTS
Announces Further Cost Structure Optimization and Efforts to Simplify Operating Model; Company Has Identified $550 Million in Annualized Savings To Date
Announces Changes to Executive Leadership Team
SAN FRANCISCO – March 9, 2023 – Gap Inc. (NYSE: GPS), a portfolio of purpose-led, billion-dollar lifestyle brands including Old Navy, Gap, Banana Republic, and Athleta, and the largest specialty apparel company in the U.S., today reported financial results for its fourth quarter and fiscal year ended January 28, 2023. The company is also announcing several changes to its executive leadership team.
“To enter fiscal 2023 in a more competitive position, we took quick and effective action to clear excess inventory, improve assortment balance, particularly at Old Navy, and to meaningfully optimize our cost structure, resulting in $550 million in annualized savings identified to date,” said Bob Martin, Gap Inc. Executive Chairman and Interim CEO. "The Board is getting close to choosing the next CEO for Gap Inc. As a result of the work we have underway to build a stronger foundation and restore the company’s creative muscle, we are optimistic that this will provide our new leader with a quicker ramp in driving consistent, profitable growth over the long term."
Fourth Quarter Fiscal 2022 - Financial Results
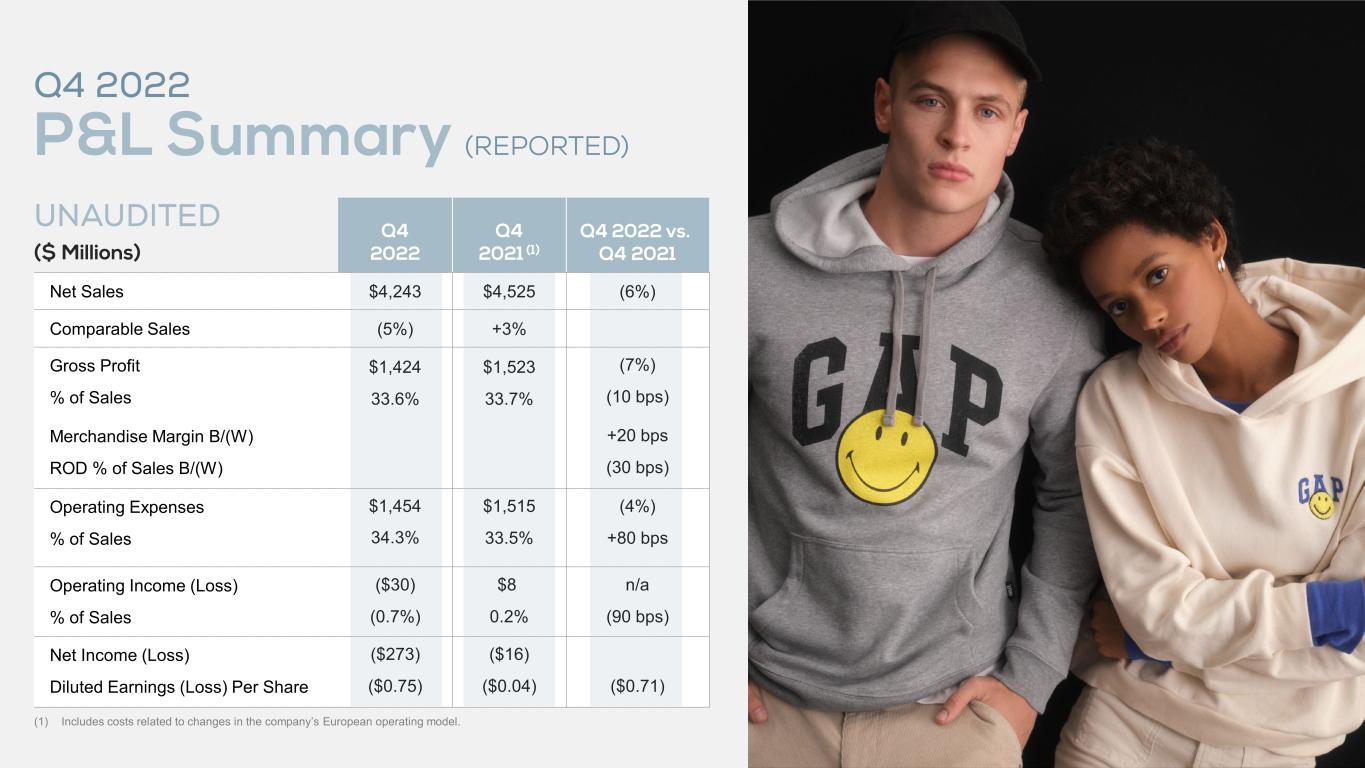
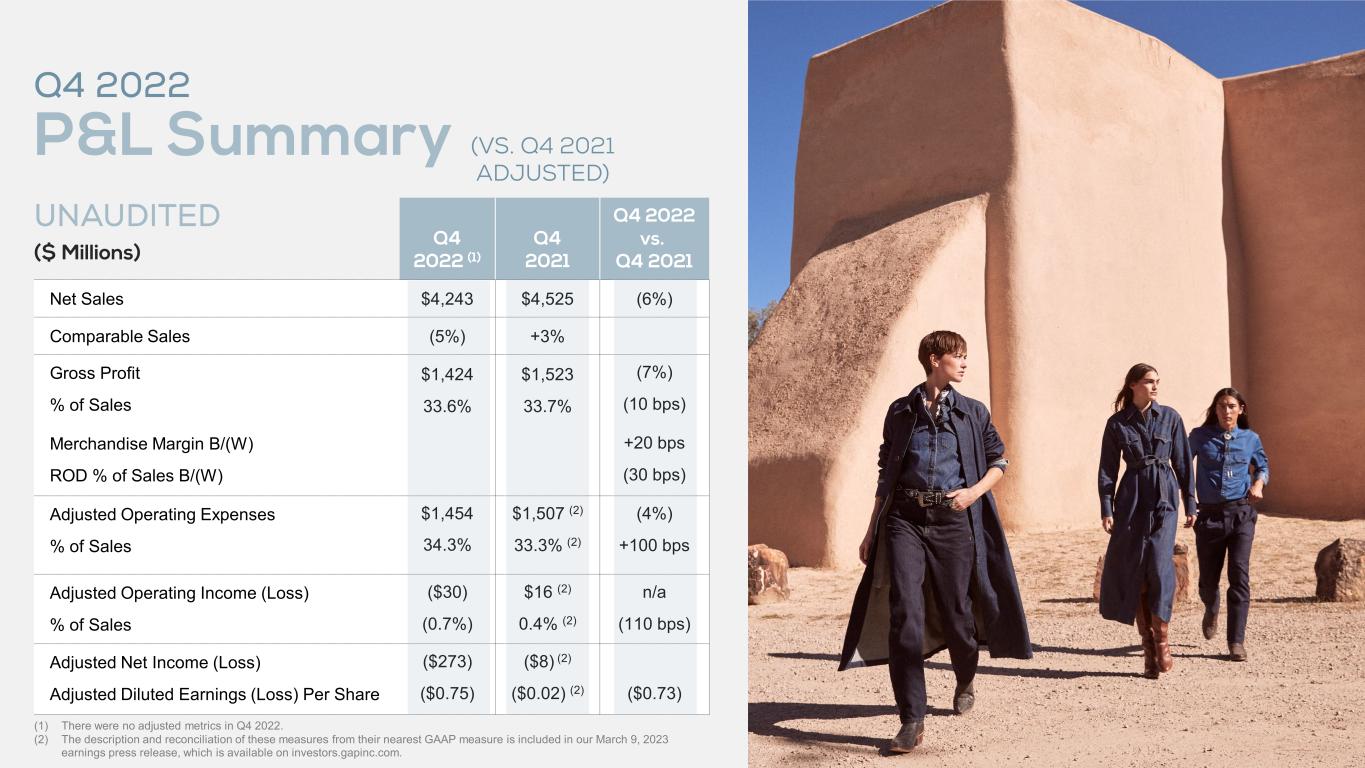
•Net sales of $4.24 billion, down 6% compared to last year, inclusive of an estimated 1-point foreign exchange headwind. Net sales were in-line with the company’s expectations for mid-single digit declines in the quarter.
◦Comparable sales down 5% year-over-year.
◦Store sales decreased 3% compared to last year.
◦Online sales decreased 10% compared to last year and represented 41% of total net sales.
•Gross margin was 33.6%, deleveraging 10 basis points versus last year.
◦Merchandise margin increased 20 basis points versus last year as higher discounting and inflationary commodity price increases were offset by lower air freight expense.
◦Rent, occupancy, and depreciation (ROD) deleveraged 30 basis points versus last year primarily due to lower online sales in the quarter.
•Operating loss was $30 million; operating margin of negative 0.7%.
•The effective tax rate was negative 535%.
•Net loss of $273 million; diluted loss per share of $0.75.
Fourth Quarter Fiscal 2022 - Global Brand Results
Old Navy:
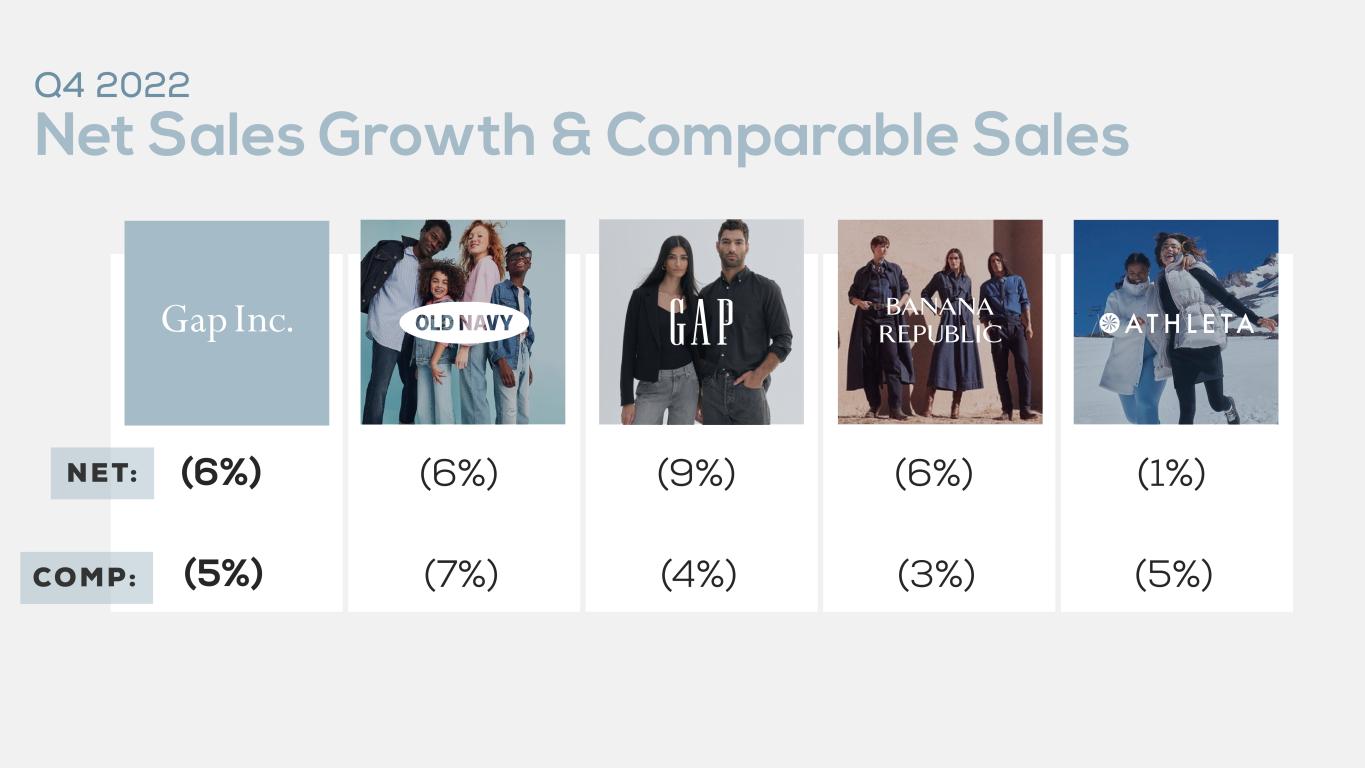
•Fourth quarter net sales of $2.2 billion were down 6% compared to last year. Comparable sales were down 7%. Performance was driven by demand softness from the lower-income consumer and in the kids and baby category partially offset by strength in the women’s category. As stated last quarter, the company believes that Old Navy pulled forward sales from the fourth quarter to October as a result of its efforts to get out earlier than typical with its first holiday promotional event, which also impacted growth in the quarter.
Gap:
•Fourth quarter net sales of $1.1 billion were down 9% compared to last year. Fourth quarter comparable sales were down 4%. North America comparable sales were down 5% in the fourth quarter. The shutdown of Yeezy Gap negatively impacted growth in North America by approximately 2 percentage points. Performance was driven by softness in the kids and baby category offset by strength in the women’s category.
Banana Republic:
•Fourth quarter net sales of $578 million were down 6% compared to last year. Fourth quarter comparable sales were down 3% driven by softness in outerwear and sweaters as well as its holiday gifting assortment. While dresses and suiting drove comp growth in the quarter, the company remains mindful of the fact that BR has been a beneficiary of the shift in consumer preferences to occasion and work-based categories as people go back to work and events post-COVID.
Athleta:
•Fourth quarter net sales of $436 million were down 1% compared to last year. Fourth quarter comparable sales were down 5% driven by continued product acceptance challenges.
Fiscal 2022 - Financial Results
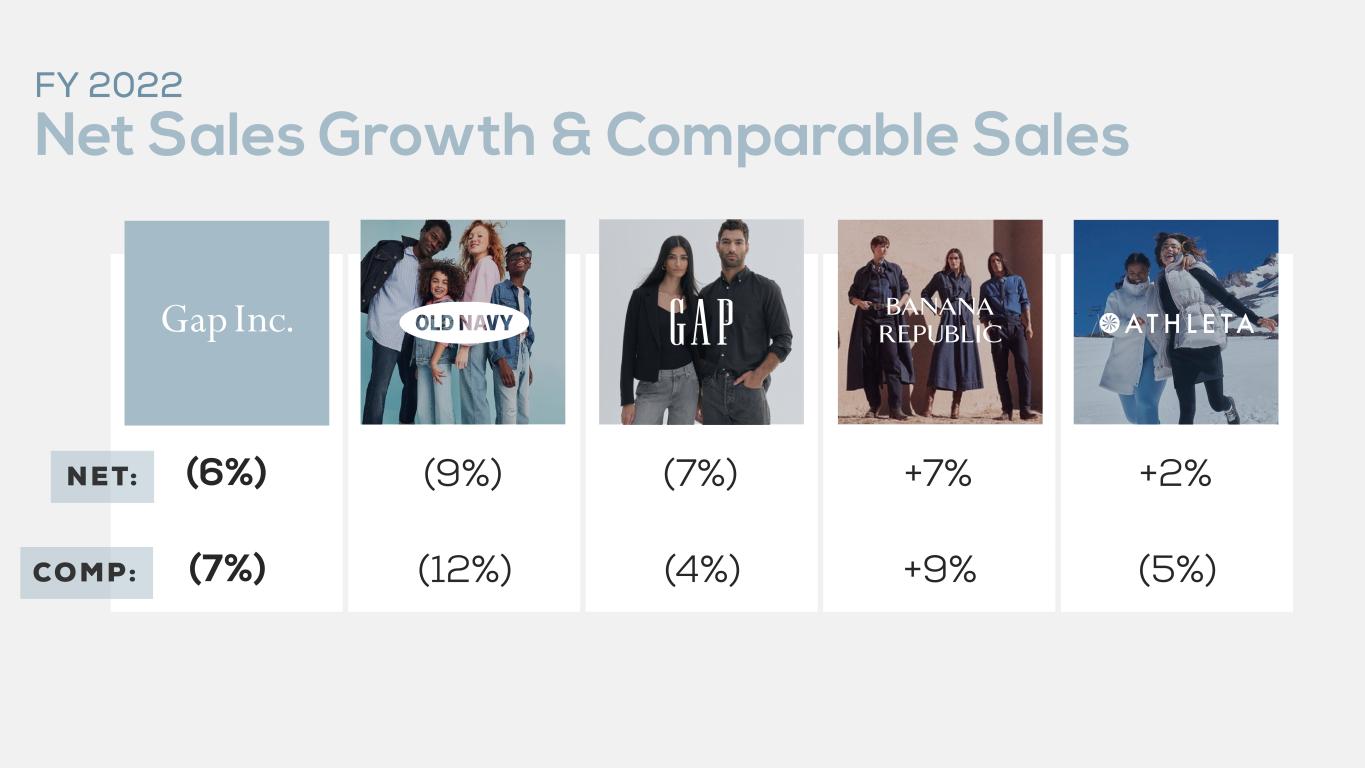
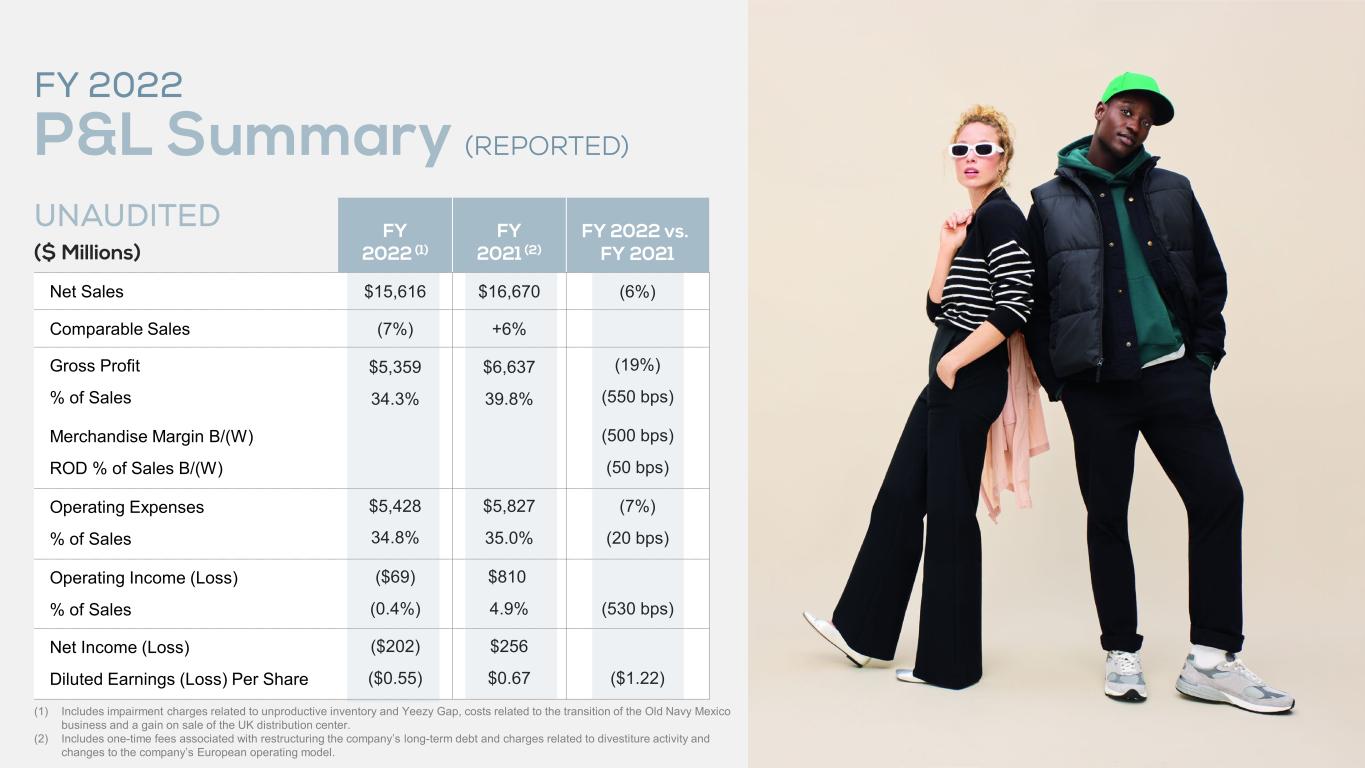
•Net sales of $15.6 billion, down 6% compared to last year, inclusive of an estimated 1-point foreign exchange headwind.
◦Comparable sales down 7% year-over-year.
◦Store sales decreased 6% compared to last year. The company ended the year with 3,352 store locations in over 40 countries, of which 2,685 were company operated.
◦Online sales decreased 7% compared to last year and represented 38% of total net sales.
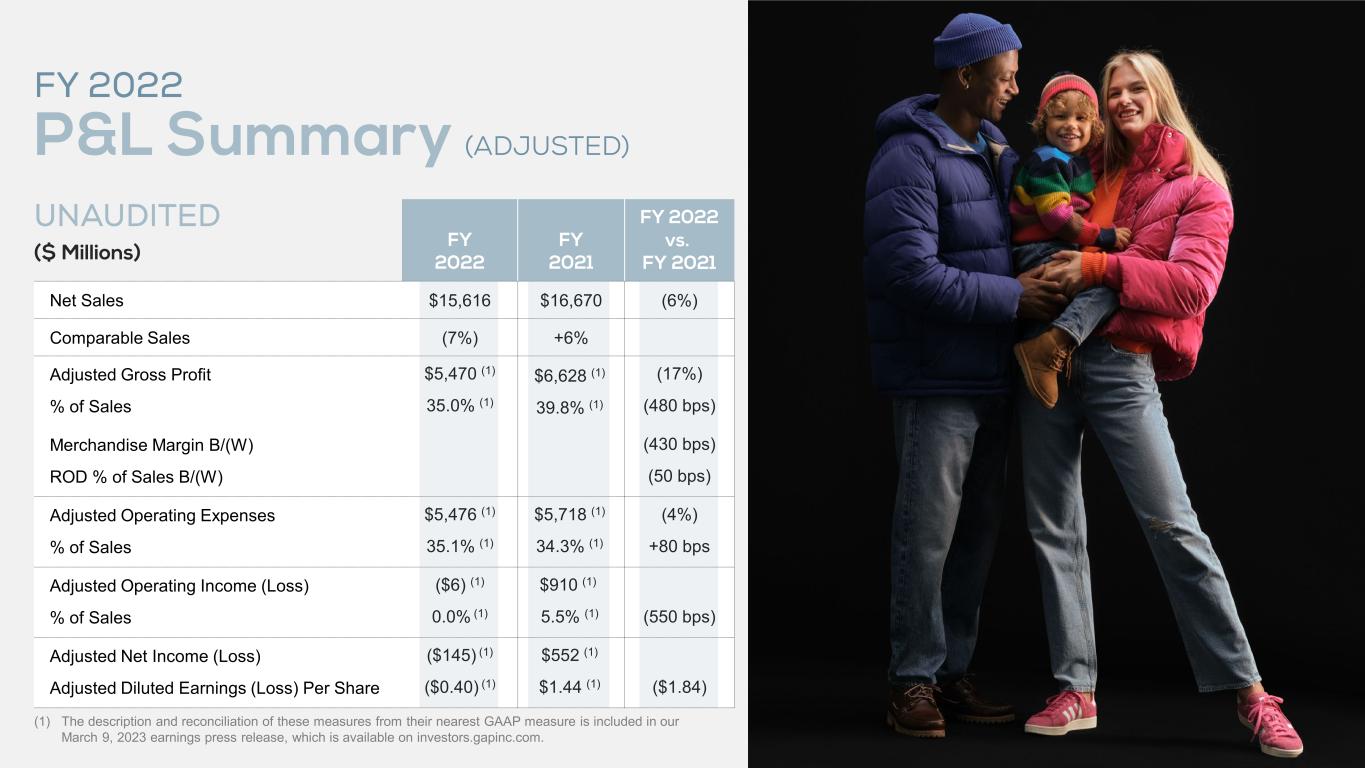
•Reported gross margin was 34.3%; adjusted gross margin, excluding $111 million in impairment charges primarily related to inventory, was 35.0%, deleveraging 480 basis points versus last year.
◦On a reported basis, merchandise margin declined 500 basis points versus last year; adjusted for the impairment charges, merchandise margin declined 430 basis points. Merchandise margins were negatively impacted by higher discounting and inflationary commodity price increases and partially offset by lower air freight expense.
◦Rent, occupancy, and depreciation (ROD) deleveraged 50 basis points versus last year primarily due to lower comparable sales.
•Reported operating loss was $69 million; reported operating margin of negative 0.4%.
•Adjusted operating loss was $6 million, excluding impairment charges primarily related to inventory, $35 million in costs related to the transition of Old Navy Mexico, and an $83 million gain on sale related to a UK distribution center; adjusted operating margin of 0.0%.
•The effective tax rate was negative 45%.
•Reported net loss was $202 million; reported diluted loss per share of $0.55.
•Adjusted net loss was $145 million, excluding the impairment charges, costs related to the Old Navy Mexico transition, and gain on sale; adjusted diluted loss per share of $0.40.
Fiscal 2022 Balance Sheet and Cash Flow Highlights
•Ended the year with cash and cash equivalents of $1.2 billion.
•Fiscal year 2022 net cash from operating activities was $607 million. Fiscal year 2022 free cash flow, defined as net cash from operating activities less purchases of property and equipment, was negative $78 million.
•Ending inventory of $2.39 billion was down 21% year-over-year.
•Fiscal year 2022 capital expenditures were $685 million.
•Paid fourth quarter dividend of $0.15 per share, totaling $54 million. Paid dividends totaling $220 million in fiscal year 2022. Board of Directors approved first quarter fiscal 2023 dividend of $0.15 per share.
Additional information regarding adjusted gross margin, adjusted operating income (loss), adjusted operating margin, adjusted net income (loss), adjusted diluted earnings (loss) per share, and free cash flow, all of which are non-GAAP financial measures, is provided at the end of this press release along with a reconciliation of these measures from the most directly comparable GAAP financial measures for the applicable period.
Further Actions to Optimize Operating Structure
The company announced today actions to further simplify and optimize its operating model and structure, including actions such as increasing spans of control and decreasing management layers to improve quality and speed of decision making, as well as creating a consistent organizational structure across all four brands focused on elevating its product and customer experience across all channels. These actions are estimated to result in $300 million in annualized savings, of which roughly half is expected to be realized in the back half of fiscal 2023. These actions will incur severance and other related costs which the company anticipates adjusting out of its reported operating and net income.
As a result of the company optimizing its operating structure, the role of Chief Growth Officer held by Asheesh Saksena will be eliminated effective today.
These actions are on top of the $250 million in annualized savings the company announced in the third quarter of fiscal 2022. Accordingly, over the last six months, the company has identified $550 million in annualized savings in total. The company continues to believe there are opportunities to further optimize its marketing spend and rationalize its technology investments over the next few years. Gap Inc.'s leadership has been working with external advisors on these efforts with the overall intention of optimizing and simplifying its operating structure to drive profitability and cash flow over the long term.
Other Executive Leadership Updates
The company also announced today that Mary Beth Laughton, President and CEO of Athleta is exiting the business, effective today.
“We believe Athleta has incredible potential, but it has suffered from product acceptance challenges over the past several quarters. As we look to capitalize on this potential and remain competitive amidst a dynamic landscape, we believe now is the right time to bring in a new leader who can position Athleta for long-term success,” Mr. Martin concluded. “I want to thank Mary Beth for her leadership and commitment to igniting the limitless potential of women and girls.”
While a search is underway, Gap Inc. Executive Chairman and Interim CEO, Bob Martin, will work closely with the Athleta team to lead through this transition until a new Brand President is identified.
The company also announced that Sheila Peters, Chief People Officer, will leave the company at the end of the year. As a critical part of our transformation efforts, Sheila will continue in her role enabling our people and culture through experiences and practices needed to fuel our business, while helping to identify and transition her successor.
Fiscal 2023 Outlook
“We moved swiftly in fiscal 2022 to manage the levers in our control and took action to drive immediate and long-term improvements in our business during what proved to be a challenging year. While we are better positioned as we enter fiscal 2023, we continue to take a prudent approach to planning and managing our business in light of the continued uncertain consumer and macro environment,” said Katrina O’Connell, Executive Vice President and Chief Financial Officer, Gap Inc. “We are confident that
our continued actions to further optimize our operating model and cost structure are key steps toward positioning Gap Inc. back on its path towards sustainable, profitable growth and delivering value for our shareholders over the long term.”
The company’s outlook takes into consideration the continued uncertain consumer and macro environment.
The company is estimating first quarter net sales could decrease in the mid-single digit range compared to last year’s net sales of $3.5 billion. The sale of Gap China to Baozun closed on January 31, 2023. First quarter 2022 net sales included approximately $60 million in sales for Gap China.
The company anticipates that fiscal 2023 net sales could decrease in the low to mid-single digit range compared to last year’s net sales of $15.6 billion. Fiscal 2022 net sales included approximately $300 million in sales for Gap China. Fiscal 2023 will include a 53rd week estimated to positively impact net sales by $150 million.
The company expects first quarter and fiscal 2023 gross margin expansion compared to the prior year. At the estimated level of sales described above, the company is planning SG&A of approximately $1.2 billion in the first quarter and approximately $5.2 billion in fiscal 2023.
The company anticipates fiscal 2023 capital expenditures in the range of $500 million to $550 million reflecting lower technology project investments as well as fewer store openings.
Webcast and Conference Call Information
Cammeron McLaughlin, Head of Investor Relations at Gap Inc., will host a conference call to review the company’s fourth quarter and fiscal year 2022 results beginning at approximately 2:00 p.m. Pacific Time today. Ms. McLaughlin will be joined by Interim Chief Executive Officer Bob Martin, Chief Financial Officer Katrina O’Connell and Old Navy Chief Executive Officer Haio Barbeito.
A live webcast of the conference call will be available online at investors.gapinc.com. A replay of the webcast will be available at the same location.
Non-GAAP Disclosure
This press release includes financial measures that have not been calculated in accordance with U.S. generally accepted accounting principles (GAAP) and are therefore referred to as non-GAAP financial measures. The non-GAAP measures described below are intended to provide investors with additional useful information about the company’s financial performance, to enhance the overall understanding of its past performance and future prospects and to allow for greater transparency with respect to important metrics used by management for financial and operating decision-making. The company presents these non-GAAP financial measures to assist investors in seeing its financial performance from management's view and because it believes they provide an additional tool for investors to use in computing the company's core financial performance over multiple periods with other companies in its industry. Additional information regarding the intended use of each non-GAAP measure included in this press release is provided in the tables to this press release.
This press release includes financial measures that have not been calculated in accordance with U.S. generally accepted accounting principles (GAAP) and are therefore referred to as non-GAAP financial measures. The non-GAAP measures described below are intended to provide investors with additional useful information about the company’s financial performance, to enhance the overall understanding of its past performance and future prospects and to allow for greater transparency with respect to important metrics used by management for financial and operating decision-making. The company presents these non-GAAP financial measures to assist investors in seeing its financial performance from management's view and because it believes they provide an additional tool for investors to use in computing the company's core financial performance over multiple periods with other companies in its industry. Additional information regarding the intended use of each non-GAAP measure included in this press release is provided in the tables to this press release.
The non-GAAP measures included in this press release are adjusted gross margin, adjusted operating income (loss), adjusted operating margin, adjusted net income (loss), adjusted diluted earnings (loss) per share, and free cash flow. These non-GAAP measures exclude the impact of certain items that are set forth in the tables to this press release.
The non-GAAP measures used by the company should not be considered as a substitute for, or superior to, measures of financial performance prepared in accordance with GAAP and may not be the same as similarly titled measures used by other companies due to possible differences in method and in items or events being adjusted. The company urges investors to review the reconciliation of these non-GAAP financial measures to the most directly comparable GAAP financial measures included in the tables to this press release below, and not to rely on any single financial measure to evaluate its business. The non-GAAP financial measures used by the company have limitations in their usefulness to investors because they have no standardized meaning prescribed by GAAP and are not prepared under any comprehensive set of accounting rules or principles.
Forward-Looking Statements
This press release and related conference call and webcast contain forward-looking statements within the “safe harbor” provisions of the Private Securities Litigation Reform Act of 1995. All statements other than those that are purely historical are forward-looking statements. Words such as “expect,” “anticipate,” “believe,” “estimate,” “intend,” “plan,” “project,” and similar expressions also identify forward-looking statements. Forward-looking statements include statements regarding the following: our competitive positioning in 2023; driving change enabling a healthier core and organization; optimizing cost and organizational effectiveness; enabling a return to creative focus; delivering brand and cultural relevance to customers; cost savings initiatives and the timing of expected benefits therefrom; driving material change in our operating model; rationalizing technology investments; optimizing marketing; reinstated responsive capabilities at Gap brand; Banana Republic’s long-term strategy; growth at Banana Republic in 2023; Old Navy’s customer value proposition; Old Navy’s potential and market leadership; improved performance at Old Navy; momentum in the Old Navy women’s business; improvement in sales trend at Old Navy; Old Navy stores net promoter score; demand softness at Old Navy; the impact of shifting consumer preferences at Banana Republic; Athleta’s long-term growth and profitability; leaning into responsive levers; integrating pack and hold inventory; buying lower receipts; paying down our asset-backed credit line draw; our dividend strategy; dilution in 2023; share repurchase activity in 2023; first quarter and fiscal 2023 sales; first quarter and fiscal 2023 gross margin; inflationary headwinds and tailwinds in 2023; discounting and promotional activity in the first quarter and fiscal 2023; inventory in fiscal 2023; first quarter and fiscal 2023 ROD; first quarter and fiscal 2023 SG&A; incentive compensation in the first quarter and fiscal 2023; wage inflation in 2023; severance and related costs in 2023; capital expenditures in 2023; planned store openings and closings in 2023; and delivering long-term shareholder value.
Because these forward-looking statements involve risks and uncertainties, there are important factors that could cause our actual results to differ materially from those in the forward-looking statements. These factors include, without limitation, the following risks, any of which could have an adverse effect on our financial condition, results of operations, and reputation: the overall global economic and geopolitical environment, consumer spending patterns and risks associated with the COVID-19 pandemic; the risk that inflationary pressures continue to negatively impact gross margins or that we are unable to pass along price increases; the risk that we or our franchisees may be unsuccessful in gauging apparel trends and changing consumer preferences or responding with sufficient lead time; the risk that we may be unable to manage or protect our inventory effectively and the resulting impact on our gross margins, sales and results of operations; the risk that we fail to manage key executive succession and retention and to continue to attract qualified personnel; engaging in or seeking to engage in strategic transactions, or adjusting our business strategies, all of which is subject to various risks and uncertainties; the risk that we fail to maintain, enhance and protect our brand image and reputation; the highly competitive nature of our business in the United States and internationally; the risk that our investments in customer, digital, and omni-channel shopping initiatives may not deliver the results we anticipate; the risks to our business, including our costs and supply chain, associated with global sourcing and manufacturing; the risks to our reputation or operations associated with importing
merchandise from foreign countries, including failure of our vendors to adhere to our Code of Vendor Conduct; the risk of data or other security breaches or vulnerabilities that may result in increased costs, violations of law, significant legal and financial exposure, and a loss of confidence in our security measures; the risk that failures of, or updates or changes to, our IT systems may disrupt our operations; natural disasters, public health crises, political crises, negative global climate patterns, or other catastrophic events; the ongoing conflict between Russia and Ukraine and the impact on global market stability; the risk that our efforts to expand internationally may not be successful; the risk that our franchisees and licensees could impair the value of our brands or fail to make payments for which we are liable; the risk that trade matters could increase the cost or reduce the supply of apparel available to us; the risk of foreign currency exchange rate fluctuations; the risk that comparable sales and margins will experience fluctuations, or that the seasonality of our business will experience changes; the risk that we or our franchisees may be unsuccessful in identifying, negotiating, and securing new store locations and renewing, modifying, or terminating leases for existing store locations effectively; the adverse effects of climate change on our operations and those of our franchisees, vendors and other business partners; the risk that we will not be successful in defending various proceedings, lawsuits, disputes, and claims; our failure to comply with applicable laws and regulations and changes in the regulatory or administrative landscape; our failure to satisfy regulations and market expectations related to our ESG initiatives; reductions in income and cash flow from our credit card arrangement related to our private label and co-branded credit cards; the risk that worsening global economic and geopolitical conditions could result in changes to the assumptions and estimates used when preparing our financial statements; the risk that changes in the geographic mix and level of income or losses, the expected or actual outcome of audits, changes in deferred tax valuation allowances, and new legislation could impact our effective tax rate; the risk that our level of indebtedness may impact our ability to operate and expand our business; the risk that we and our subsidiaries may be unable to meet our obligations under our indebtedness agreements; the risk that changes in our credit profile or deterioration in market conditions may limit our access to the capital markets; the risk that the adoption of new accounting pronouncements will impact future results; the risk that we do not repurchase some or all of the shares we anticipate purchasing pursuant to our repurchase program; and the risk that additional information may arise during our close process or as a result of subsequent events that would require us to make adjustments to our financial information.
Additional information regarding factors that could cause results to differ can be found in our Annual Report on Form 10-K filed with the Securities and Exchange Commission on March 15, 2022, as well as our subsequent filings with the Securities and Exchange Commission.
These forward-looking statements are based on information as of March 9, 2023. We assume no obligation to publicly update or revise our forward-looking statements even if experience or future changes make it clear that any projected results expressed or implied therein will not be realized.
About Gap Inc.
Gap Inc., a collection of purpose-led lifestyle brands, is the largest American specialty apparel company offering clothing, accessories, and personal care products for men, women, and children under the Old Navy, Gap, Banana Republic, and Athleta brands. The company uses omni-channel capabilities to bridge the digital world and physical stores to further enhance its shopping experience. Gap Inc. is guided by its purpose, Inclusive, by Design, and takes pride in creating products and experiences its customers love while doing right by its employees, communities, and planet. Gap Inc. products are available for purchase worldwide through company-operated stores, franchise stores, and e-commerce sites. Fiscal year 2022 net sales were $15.6 billion. For more information, please visit www.gapinc.com.
Investor Relations Contact:
Nina Bari
Investor_relations@gap.com
Media Relations Contact:
Megan Foote
Press@gap.com
Press@gap.com
The Gap, Inc.
CONDENSED CONSOLIDATED BALANCE SHEETS
UNAUDITED
| ($ in millions) | January 28, 2023 | January 29, 2022 | |||||||||||||||
| ASSETS | |||||||||||||||||
| Current assets: | |||||||||||||||||
| Cash and cash equivalents | $ | 1,215 | $ | 877 | |||||||||||||
| Merchandise inventory | 2,389 | 3,018 | |||||||||||||||
| Other current assets | 1,013 | 1,270 | |||||||||||||||
| Total current assets | 4,617 | 5,165 | |||||||||||||||
| Property and equipment, net | 2,688 | 3,037 | |||||||||||||||
| Operating lease assets | 3,173 | 3,675 | |||||||||||||||
| Other long-term assets | 908 | 884 | |||||||||||||||
| Total assets | $ | 11,386 | $ | 12,761 | |||||||||||||
| LIABILITIES AND STOCKHOLDERS' EQUITY | |||||||||||||||||
| Current liabilities: | |||||||||||||||||
| Accounts payable | $ | 1,320 | $ | 1,951 | |||||||||||||
| Accrued expenses and other current liabilities | 1,219 | 1,367 | |||||||||||||||
Current portion of operating lease liabilities | 667 | 734 | |||||||||||||||
| Income taxes payable | 50 | 25 | |||||||||||||||
| Total current liabilities | 3,256 | 4,077 | |||||||||||||||
| Long-term liabilities: | |||||||||||||||||
| Revolving credit facility | 350 | — | |||||||||||||||
| Long-term debt | 1,486 | 1,484 | |||||||||||||||
| Long-term operating lease liabilities | 3,517 | 4,033 | |||||||||||||||
| Other long-term liabilities | 544 | 445 | |||||||||||||||
| Total long-term liabilities | 5,897 | 5,962 | |||||||||||||||
| Total stockholders' equity | 2,233 | 2,722 | |||||||||||||||
| Total liabilities and stockholders' equity | $ | 11,386 | $ | 12,761 | |||||||||||||
The Gap, Inc.
CONDENSED CONSOLIDATED STATEMENTS OF OPERATIONS
UNAUDITED
| 13 Weeks Ended | 52 Weeks Ended | ||||||||||||||||||||||||||||||||||
| ($ and shares in millions except per share amounts) | January 28, 2023 | January 29, 2022 | January 28, 2023 | January 29, 2022 | |||||||||||||||||||||||||||||||
| Net sales | $ | 4,243 | $ | 4,525 | $ | 15,616 | $ | 16,670 | |||||||||||||||||||||||||||
| Cost of goods sold and occupancy expenses | 2,819 | 3,002 | 10,257 | 10,033 | |||||||||||||||||||||||||||||||
| Gross profit | 1,424 | 1,523 | 5,359 | 6,637 | |||||||||||||||||||||||||||||||
| Operating expenses | 1,454 | 1,515 | 5,428 | 5,827 | |||||||||||||||||||||||||||||||
| Operating income (loss) | (30) | 8 | (69) | 810 | |||||||||||||||||||||||||||||||
| Loss on extinguishment of debt | — | — | — | 325 | |||||||||||||||||||||||||||||||
| Interest, net | 13 | 16 | 70 | 162 | |||||||||||||||||||||||||||||||
| Income (loss) before income taxes | (43) | (8) | (139) | 323 | |||||||||||||||||||||||||||||||
| Income tax expense (benefit) | 230 | 8 | 63 | 67 | |||||||||||||||||||||||||||||||
| Net income (loss) | $ | (273) | $ | (16) | $ | (202) | $ | 256 | |||||||||||||||||||||||||||
| Weighted-average number of shares - basic | 366 | 373 | 367 | 376 | |||||||||||||||||||||||||||||||
| Weighted-average number of shares - diluted | 366 | 373 | 367 | 383 | |||||||||||||||||||||||||||||||
| Earnings (loss) per share - basic | $ | (0.75) | $ | (0.04) | $ | (0.55) | $ | 0.68 | |||||||||||||||||||||||||||
| Earnings (loss) per share - diluted | $ | (0.75) | $ | (0.04) | $ | (0.55) | $ | 0.67 | |||||||||||||||||||||||||||
The Gap, Inc.
CONDENSED CONSOLIDATED STATEMENTS OF CASH FLOWS
UNAUDITED
| 52 Weeks Ended | |||||||||||
| ($ in millions) | January 28, 2023 (a) | January 29, 2022 (a) | |||||||||
| Cash flows from operating activities: | |||||||||||
| Net income (loss) | $ | (202) | $ | 256 | |||||||
| Depreciation and amortization | 540 | 504 | |||||||||
| Loss on extinguishment of debt | — | 325 | |||||||||
| Loss on divestiture activity | 35 | 59 | |||||||||
| Gain on sale of building | (83) | — | |||||||||
| Change in merchandise inventory | 554 | (593) | |||||||||
| Change in accounts payable | (540) | 186 | |||||||||
| Change in accrued expenses and other current liabilities | (243) | 172 | |||||||||
| Change in income taxes payable, net of receivables and other tax-related items | 417 | (85) | |||||||||
| Other, net | 129 | (15) | |||||||||
| Net cash provided by operating activities | 607 | 809 | |||||||||
| Cash flows from investing activities: | |||||||||||
| Purchases of property and equipment | (685) | (694) | |||||||||
| Net proceeds from sale of buildings | 458 | — | |||||||||
| Purchases of short-term investments | — | (753) | |||||||||
| Proceeds from sales and maturities of short-term investments | — | 1,162 | |||||||||
| Payments for acquisition activity, net of cash acquired | — | (135) | |||||||||
| Net cash paid for divestiture activity | — | (21) | |||||||||
| Other | — | (5) | |||||||||
| Net cash used for investing activities | (227) | (446) | |||||||||
| Cash flows from financing activities: | |||||||||||
| Proceeds from revolving credit facility | 350 | — | |||||||||
| Proceeds from issuance of long-term debt | — | 1,500 | |||||||||
| Payments to extinguish debt | — | (2,546) | |||||||||
| Payments for debt issuance costs | (6) | (16) | |||||||||
| Proceeds from issuances under share-based compensation plans | 27 | 54 | |||||||||
| Withholding tax payments related to vesting of stock units | (20) | (36) | |||||||||
| Repurchases of common stock | (123) | (201) | |||||||||
| Cash dividends paid | (220) | (226) | |||||||||
| Other | (2) | — | |||||||||
| Net cash provided by (used for) financing activities | 6 | (1,471) | |||||||||
| Effect of foreign exchange rate fluctuations on cash, cash equivalents, and restricted cash | (15) | (6) | |||||||||
| Net increase (decrease) in cash, cash equivalents, and restricted cash | 371 | (1,114) | |||||||||
| Cash, cash equivalents, and restricted cash at beginning of period | 902 | 2,016 | |||||||||
| Cash, cash equivalents, and restricted cash at end of period | $ | 1,273 | $ | 902 | |||||||
__________
(a) For the fifty-two weeks ended January 28, 2023 and January 29, 2022, total cash, cash equivalents, and restricted cash includes $58 million and $25 million, respectively, of restricted cash recorded within other current assets and other long-term assets on the Condensed Consolidated Balance Sheets.
The Gap, Inc.
NON-GAAP FINANCIAL MEASURES
UNAUDITED
FREE CASH FLOW
Free cash flow is a non-GAAP financial measure. We believe free cash flow is an important metric because it represents a measure of how much cash a company has available for discretionary and non-discretionary items after the deduction of capital expenditures. We require regular capital expenditures including technology improvements to automate processes, engage with customers, and optimize our supply chain in addition to building and maintaining stores. We use this metric internally, as we believe our sustained ability to generate free cash flow is an important driver of value creation. However, this non-GAAP financial measure is not intended to supersede or replace our GAAP results.
| 52 Weeks Ended | ||||||||||||||
| ($ in millions) | January 28, 2023 | January 29, 2022 | ||||||||||||
| Net cash provided by operating activities | $ | 607 | $ | 809 | ||||||||||
| Less: Purchases of property and equipment | (685) | (694) | ||||||||||||
| Free cash flow | $ | (78) | $ | 115 | ||||||||||
The Gap, Inc.
NON-GAAP FINANCIAL MEASURES
UNAUDITED
ADJUSTED STATEMENT OF OPERATIONS METRICS FOR FISCAL YEAR 2022
The following adjusted statement of operations metrics are non-GAAP financial measures. These measures are provided to enhance visibility into the Company's underlying results for the period excluding the impact of impairment of certain inventory, impairment related to the Yeezy Gap business, a loss on divestiture activity, and a gain on sale of building. Management believes the adjusted metrics are useful for the assessment of ongoing operations as we believe the adjusted items are not indicative of our ongoing operations, and provide additional information to investors to facilitate the comparison of results against past and future years. However, these non-GAAP financial measures are not intended to supersede or replace the GAAP measures.
| Gross Profit | Gross Margin | Operating Expenses | Operating Expenses as a % of Net Sales | Operating Income (Loss) | Operating Margin | Income Taxes | Net Income (Loss) | Earnings per Share - Diluted | ||||||||||||||||||||||||||||||||||||||||||||||||
| ($ in millions) 52 Weeks Ended January 28, 2023 | ||||||||||||||||||||||||||||||||||||||||||||||||||||||||
| GAAP metrics, as reported | $ | 5,359 | 34.3 | % | $ | 5,428 | 34.8 | % | $ | (69) | (0.4) | % | $ | 63 | $ | (202) | $ | (0.55) | ||||||||||||||||||||||||||||||||||||||
| Adjustments for: | ||||||||||||||||||||||||||||||||||||||||||||||||||||||||
| Inventory impairment charges (a) | 58 | 0.4 | % | — | — | % | 58 | 0.4 | % | 9 | 49 | 0.13 | ||||||||||||||||||||||||||||||||||||||||||||
| Yeezy Gap impairment charges (b) | 53 | 0.3 | % | — | — | % | 53 | 0.3 | % | 9 | 44 | 0.12 | ||||||||||||||||||||||||||||||||||||||||||||
| Loss on divestiture activity (c) | — | — | % | (35) | (0.2) | % | 35 | 0.2 | % | 5 | 30 | 0.08 | ||||||||||||||||||||||||||||||||||||||||||||
| Gain on sale of building (d) | — | — | % | 83 | 0.5 | % | (83) | (0.5) | % | (17) | (66) | (0.18) | ||||||||||||||||||||||||||||||||||||||||||||
| Non-GAAP metrics | $ | 5,470 | 35.0 | % | $ | 5,476 | 35.1 | % | $ | (6) | — | % | $ | 69 | $ | (145) | $ | (0.40) | ||||||||||||||||||||||||||||||||||||||
(a) Represents the inventory impairment charges as a result of delayed seasonal product and extended size product, primarily at Old Navy.
(b) Represents the impairment charges as a result of the decision to discontinue the Yeezy Gap business, primarily related to inventory.
(c) Represents the impact of the loss on divestiture activity related to the transition of the Old Navy Mexico business.
(d) Represents the impact of a gain on sale of our distribution center located in the United Kingdom.
The Gap, Inc.
NON-GAAP FINANCIAL MEASURES
UNAUDITED
ADJUSTED STATEMENT OF OPERATIONS METRICS FOR THE FOURTH QUARTER AND FISCAL YEAR 2021
The following adjusted statement of operations metrics are non-GAAP financial measures. These measures are provided to enhance visibility into the Company's underlying results for the period excluding the impacts of strategic changes related to our operating model in Europe, the loss on extinguishment of debt, and the loss on divestiture activity. Management believes that excluding certain items from statement of operations metrics that are not part of the Company's core operations provides additional information to investors to facilitate the comparison of results against past and future years. However, these non-GAAP financial measures are not intended to supersede or replace the GAAP measures.
| Operating Expenses | Operating Expenses as a % of Net Sales | Operating Income | Operating Margin | Income Taxes | Net Income (Loss) | Earnings (Loss) per Share - Diluted | ||||||||||||||||||||||||||||||||||||||
| ($ in millions) 13 Weeks Ended January 29, 2022 | ||||||||||||||||||||||||||||||||||||||||||||
| GAAP metrics, as reported | $ | 1,515 | 33.5 | % | $ | 8 | 0.2 | % | $ | 8 | $ | (16) | $ | (0.04) | ||||||||||||||||||||||||||||||
| Adjustments for: | ||||||||||||||||||||||||||||||||||||||||||||
| Strategic actions in Europe (a) | (8) | (0.2) | % | 8 | 0.2 | % | — | 8 | 0.02 | |||||||||||||||||||||||||||||||||||
| Non-GAAP metrics | $ | 1,507 | 33.3 | % | $ | 16 | 0.4 | % | $ | 8 | $ | (8) | $ | (0.02) | ||||||||||||||||||||||||||||||
| Gross Profit | Gross Margin (c) | Operating Expenses | Operating Expenses as a % of Net Sales | Operating Income | Operating Margin | Loss on Extinguishment of Debt | Income Taxes | Net Income (Loss) | Earnings per Share - Diluted | |||||||||||||||||||||||||||||||||||||||||||||||||||||
| ($ in millions) 52 Weeks Ended January 29, 2022 | ||||||||||||||||||||||||||||||||||||||||||||||||||||||||||||||
| GAAP metrics, as reported | $ | 6,637 | 39.8 | % | $ | 5,827 | 35.0 | % | $ | 810 | 4.9 | % | $ | 325 | $ | 67 | $ | 256 | $ | 0.67 | ||||||||||||||||||||||||||||||||||||||||||
| Adjustments for: | ||||||||||||||||||||||||||||||||||||||||||||||||||||||||||||||
| Strategic actions in Europe (a) | (9) | (0.1) | % | (50) | (0.3) | % | 41 | 0.2 | % | — | 9 | 32 | 0.08 | |||||||||||||||||||||||||||||||||||||||||||||||||
| Loss on extinguishment of debt | — | — | % | — | — | % | — | — | % | (325) | 83 | 242 | 0.63 | |||||||||||||||||||||||||||||||||||||||||||||||||
| Loss on divestiture activity (b) | — | — | % | $ | (59) | (0.4) | % | $ | 59 | 0.4 | % | — | $ | 37 | $ | 22 | 0.06 | |||||||||||||||||||||||||||||||||||||||||||||
| Non-GAAP metrics | $ | 6,628 | 39.8 | % | $ | 5,718 | 34.3 | % | $ | 910 | 5.5 | % | $ | — | $ | 196 | $ | 552 | $ | 1.44 | ||||||||||||||||||||||||||||||||||||||||||
__________
(a) Represents the net impacts from changes to our European operating model. These impacts primarily include employee-related and lease-related costs.
(b) Represents the impact of the loss on divestiture activity for the Janie and Jack and Intermix brands.
(c) Metrics were computed individually for each line item; therefore, the sum of the individual lines may not equal the total.
The Gap, Inc.
NET SALES RESULTS
UNAUDITED
The following table details the Company’s fourth quarters and fiscal years 2022 and 2021 net sales (unaudited):
| ($ in millions) | Old Navy Global | Gap Global | Banana Republic Global | Athleta Global | Other (2) | Total | |||||||||||||||||||||||||||||
| 13 Weeks Ended January 28, 2023 | |||||||||||||||||||||||||||||||||||
| U.S. (1) | $ | 1,982 | $ | 709 | $ | 505 | $ | 423 | $ | 2 | $ | 3,621 | |||||||||||||||||||||||
| Canada | 165 | 91 | 49 | 10 | — | 315 | |||||||||||||||||||||||||||||
| Europe | — | 35 | 1 | 1 | — | 37 | |||||||||||||||||||||||||||||
| Asia | — | 181 | 17 | — | — | 198 | |||||||||||||||||||||||||||||
| Other regions | 19 | 45 | 6 | 2 | — | 72 | |||||||||||||||||||||||||||||
| Total | $ | 2,166 | $ | 1,061 | $ | 578 | $ | 436 | $ | 2 | $ | 4,243 | |||||||||||||||||||||||
| ($ in millions) | Old Navy Global | Gap Global | Banana Republic Global | Athleta Global | Other (2) | Total | |||||||||||||||||||||||||||||
| 13 Weeks Ended January 29, 2022 | |||||||||||||||||||||||||||||||||||
| U.S. (1) | $ | 2,097 | $ | 761 | $ | 532 | $ | 428 | $ | 2 | $ | 3,820 | |||||||||||||||||||||||
| Canada | 178 | 100 | 54 | 9 | — | 341 | |||||||||||||||||||||||||||||
| Europe | 1 | 54 | 2 | 1 | — | 58 | |||||||||||||||||||||||||||||
| Asia | 1 | 219 | 21 | — | — | 241 | |||||||||||||||||||||||||||||
| Other regions | 30 | 30 | 4 | 1 | — | 65 | |||||||||||||||||||||||||||||
| Total | $ | 2,307 | $ | 1,164 | $ | 613 | $ | 439 | $ | 2 | $ | 4,525 | |||||||||||||||||||||||
| ($ in millions) | Old Navy Global | Gap Global | Banana Republic Global | Athleta Global | Other (2) | Total | |||||||||||||||||||||||||||||
| 52 Weeks Ended January 28, 2023 | |||||||||||||||||||||||||||||||||||
| U.S. (1) | $ | 7,471 | $ | 2,461 | $ | 1,829 | $ | 1,428 | $ | 12 | $ | 13,201 | |||||||||||||||||||||||
| Canada | 679 | 332 | 192 | 33 | — | 1,236 | |||||||||||||||||||||||||||||
| Europe | 2 | 198 | 5 | 4 | — | 209 | |||||||||||||||||||||||||||||
| Asia | 1 | 606 | 65 | — | — | 672 | |||||||||||||||||||||||||||||
| Other regions | 81 | 177 | 25 | 15 | — | 298 | |||||||||||||||||||||||||||||
| Total | $ | 8,234 | $ | 3,774 | $ | 2,116 | $ | 1,480 | $ | 12 | $ | 15,616 | |||||||||||||||||||||||
| ($ in millions) | Old Navy Global | Gap Global | Banana Republic Global | Athleta Global | Other (3) | Total | |||||||||||||||||||||||||||||
| 52 Weeks Ended January 29, 2022 | |||||||||||||||||||||||||||||||||||
| U.S. (1) | $ | 8,272 | $ | 2,608 | $ | 1,703 | $ | 1,432 | $ | 102 | $ | 14,117 | |||||||||||||||||||||||
| Canada | 713 | 349 | 178 | 12 | — | 1,252 | |||||||||||||||||||||||||||||
| Europe | 2 | 328 | 8 | 2 | — | 340 | |||||||||||||||||||||||||||||
| Asia | 2 | 658 | 70 | — | — | 730 | |||||||||||||||||||||||||||||
| Other regions | 93 | 120 | 17 | 1 | — | 231 | |||||||||||||||||||||||||||||
| Total | $ | 9,082 | $ | 4,063 | $ | 1,976 | $ | 1,447 | $ | 102 | $ | 16,670 | |||||||||||||||||||||||
__________
(1) U.S. includes the United States and Puerto Rico.
(2) Primarily consists of net sales from revenue-generating strategic initiatives.
(3) Primarily consists of net sales for the Intermix and Janie and Jack brands. The divestiture of Janie and Jack was completed on April 8, 2021. The divestiture of Intermix was completed on May 21, 2021. Additionally, beginning in the fourth quarter of fiscal 2021, other revenue-generating strategic initiatives are also included.
The Gap, Inc.
REAL ESTATE
Store count, openings, closings, and square footage for our stores are as follows:
| January 29, 2022 | 52 Weeks Ended January 28, 2023 | January 28, 2023 | |||||||||||||||||||||||||||
| Number of Store Locations | Number of Stores Opened | Number of Stores Closed | Number of Store Locations | Square Footage (in millions) | |||||||||||||||||||||||||
| Old Navy North America (1) | 1,252 | 30 | 20 | 1,238 | 19.8 | ||||||||||||||||||||||||
| Gap North America | 520 | 10 | 37 | 493 | 5.2 | ||||||||||||||||||||||||
| Gap Asia | 329 | 5 | 102 | 232 | 2.0 | ||||||||||||||||||||||||
| Gap Europe (2) | 11 | — | — | — | — | ||||||||||||||||||||||||
| Banana Republic North America | 446 | 2 | 29 | 419 | 3.5 | ||||||||||||||||||||||||
| Banana Republic Asia | 50 | 3 | 7 | 46 | 0.2 | ||||||||||||||||||||||||
| Athleta North America | 227 | 40 | 10 | 257 | 1.1 | ||||||||||||||||||||||||
| Company-operated stores total | 2,835 | 90 | 205 | 2,685 | 31.8 | ||||||||||||||||||||||||
| Franchise (1) (2) | 564 | 138 | 70 | 667 | N/A | ||||||||||||||||||||||||
| Total | 3,399 | 228 | 275 | 3,352 | 31.8 | ||||||||||||||||||||||||
__________
(1) The 24 Old Navy Mexico stores that were transitioned to Grupo Axo during the period are not included as store closures or openings for Company-operated and Franchise store activity. The ending balance for Old Navy North America excludes these stores and the ending balance for Franchise includes these stores.
(2) The 11 Gap Italy stores that were transitioned to OVS S.p.A. during the period are not included as store closures or openings for Company-operated and Franchise store activity. The ending balance for Gap Europe excludes these stores and the ending balance for Franchise includes these stores.

Gap Inc. Fiscal 2022 Katrina O’Connell CHIEF FINANCIAL OFFICER Bob Martin INTERIM CHIEF EXECUTIVE OFFICER FOURTH QUARTER EARNINGS RESULTS Haio Barbeito OLD NAVY CHIEF EXECUTIVE OFFICER
Forward Looking Statements / Non-GAAP Financial Measures FORWARD LOOKING STATEMENTS This conference call and webcast contain forward-looking statements within the "safe harbor" provisions of the Private Securities Litigation Reform Act of 1995. All statements other than those that are purely historical are forward-looking statements. Forward-looking statements include statements identified as such in our March 9, 2023 earnings press release. Because these forward-looking statements involve risks and uncertainties, there are important factors that could cause our actual results to differ materially from those in the forward-looking statements. Additional information regarding factors that could cause results to differ can be found in the Company's Annual Report on Form 10-K for the fiscal year ended January 29, 2022, as well as the Company’s subsequent filings with the Securities and Exchange Commission. These forward-looking statements are based on information as of March 9, 2023. We assume no obligation to publicly update or revise our forward-looking statements even if experience or future changes make it clear that any projected results expressed or implied therein will not be realized. SEC REGULATION G This conference call and webcast include the non-GAAP measures adjusted gross profit, adjusted gross margin, adjusted operating expenses/adjusted SG&A, adjusted operating income (loss), adjusted operating margin, adjusted net income (loss), and adjusted diluted earnings (loss) per share. The description and reconciliation of these measures from the most directly comparable GAAP measure is included in our March 9, 2023 earnings press release, which is available on investors.gapinc.com.

THE POWER OF SHE A SPIRIT OF ADVENTURE MODERN AMERICAN OPTIMISM Our purpose-led, billion-dollar lifestyle brands WE BELIEVE IN THE DEMOCRACY OF STYLE
Q4 2022 Net Sales Growth & Comparable Sales (6%) (6%)(9%)(6%) (1%) CO MP: (7%) (3%)(4%)(5%) (5%) NE T:
Q4 2022 Q4 2021 (1) Q4 2022 vs. Q4 2021 Net Sales $4,243 $4,525 (6%) Comparable Sales (5%) +3% Gross Profit % of Sales $1,424 33.6% $1,523 33.7% (7%) (10 bps) Merchandise Margin B/(W) ROD % of Sales B/(W) +20 bps (30 bps) Operating Expenses % of Sales $1,454 34.3% $1,515 33.5% (4%) +80 bps Operating Income (Loss) % of Sales ($30) (0.7%) $8 0.2% n/a (90 bps) Net Income (Loss) Diluted Earnings (Loss) Per Share ($273) ($0.75) ($16) ($0.04) ($0.71) Q4 2022 P&L Summary (REPORTED) ($ Millions) UNAUDITED (1) Includes costs related to changes in the company’s European operating model.
Q4 2022 (1) Q4 2021 Q4 2022 vs. Q4 2021 Net Sales $4,243 $4,525 (6%) Comparable Sales (5%) +3% Gross Profit % of Sales $1,424 33.6% $1,523 33.7% (7%) (10 bps) Merchandise Margin B/(W) ROD % of Sales B/(W) +20 bps (30 bps) Adjusted Operating Expenses % of Sales $1,454 34.3% $1,507 (2) 33.3% (2) (4%) +100 bps Adjusted Operating Income (Loss) % of Sales ($30) (0.7%) $16 (2) 0.4% (2) n/a (110 bps) Adjusted Net Income (Loss) Adjusted Diluted Earnings (Loss) Per Share ($273) ($0.75) ($8) (2) ($0.02) (2) ($0.73) Q4 2022 P&L Summary ($ Millions) UNAUDITED (1) There were no adjusted metrics in Q4 2022. (2) The description and reconciliation of these measures from their nearest GAAP measure is included in our March 9, 2023 earnings press release, which is available on investors.gapinc.com. (VS. Q4 2021 ADJUSTED)
FY 2022 Net Sales Growth & Comparable Sales (9%) +7%(7%)(6%) +2% (12%) +9%(4%)(7%) (5%)CO MP: NE T:
FY 2022 (1) FY 2021 (2) FY 2022 vs. FY 2021 Net Sales $15,616 $16,670 (6%) Comparable Sales (7%) +6% Gross Profit % of Sales $5,359 34.3% $6,637 39.8% (19%) (550 bps) Merchandise Margin B/(W) ROD % of Sales B/(W) (500 bps) (50 bps) Operating Expenses % of Sales $5,428 34.8% $5,827 35.0% (7%) (20 bps) Operating Income (Loss) % of Sales ($69) (0.4%) $810 4.9% (530 bps) Net Income (Loss) Diluted Earnings (Loss) Per Share ($202) ($0.55) $256 $0.67 ($1.22) FY 2022 P&L Summary (REPORTED) ($ Millions) UNAUDITED (1) Includes impairment charges related to unproductive inventory and Yeezy Gap, costs related to the transition of the Old Navy Mexico business and a gain on sale of the UK distribution center. (2) Includes one-time fees associated with restructuring the company’s long-term debt and charges related to divestiture activity and changes to the company’s European operating model.
FY 2022 FY 2021 FY 2022 vs. FY 2021 Net Sales $15,616 $16,670 (6%) Comparable Sales (7%) +6% Adjusted Gross Profit % of Sales $5,470 (1) 35.0% (1) $6,628 (1) 39.8% (1) (17%) (480 bps) Merchandise Margin B/(W) ROD % of Sales B/(W) (430 bps) (50 bps) Adjusted Operating Expenses % of Sales $5,476 (1) 35.1% (1) $5,718 (1) 34.3% (1) (4%) +80 bps Adjusted Operating Income (Loss) % of Sales ($6) (1) 0.0% (1) $910 (1) 5.5% (1) (550 bps) Adjusted Net Income (Loss) Adjusted Diluted Earnings (Loss) Per Share ($145) (1) ($0.40) (1) $552 (1) $1.44 (1) ($1.84) (1) The description and reconciliation of these measures from their nearest GAAP measure is included in our March 9, 2023 earnings press release, which is available on investors.gapinc.com. ($ Millions) FY 2022 P&L Summary (ADJUSTED) UNAUDITED
OVER 40 MILLION ACTIVE LOYALTY MEMBERS (1) Spend 2X more annually (2) 3X more likely to shop across channels (2) 3X more likely to shop multiple brands (2) (1) Defined as loyalty members who have made a purchase in the past 12 months, includes credit card holders. (2) Based on rolling 12-month data through January 2023. Improving Value by Turning Customers into Lifetime Loyalists
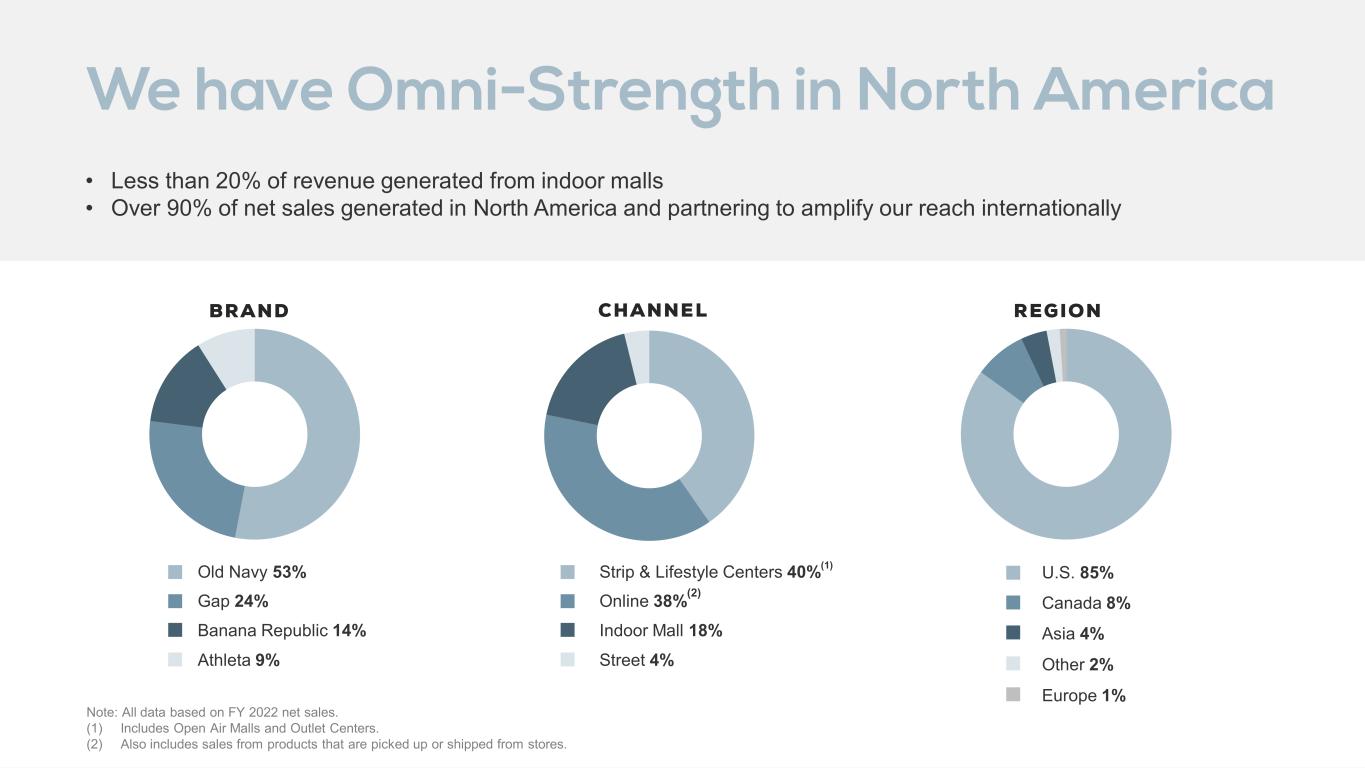
We have Omni-Strength in North America CHANNEL REGION • Less than 20% of revenue generated from indoor malls • Over 90% of net sales generated in North America and partnering to amplify our reach internationally ■ Old Navy 53% ■ Gap 24% ■ Banana Republic 14% ■ Athleta 9% ■ U.S. 85% ■ Canada 8% ■ Asia 4% ■ Other 2% ■ Europe 1% BRAND ■ Strip & Lifestyle Centers 40%(1) ■ Online 38%(2) ■ Indoor Mall 18% ■ Street 4% Note: All data based on FY 2022 net sales. (1) Includes Open Air Malls and Outlet Centers. (2) Also includes sales from products that are picked up or shipped from stores.
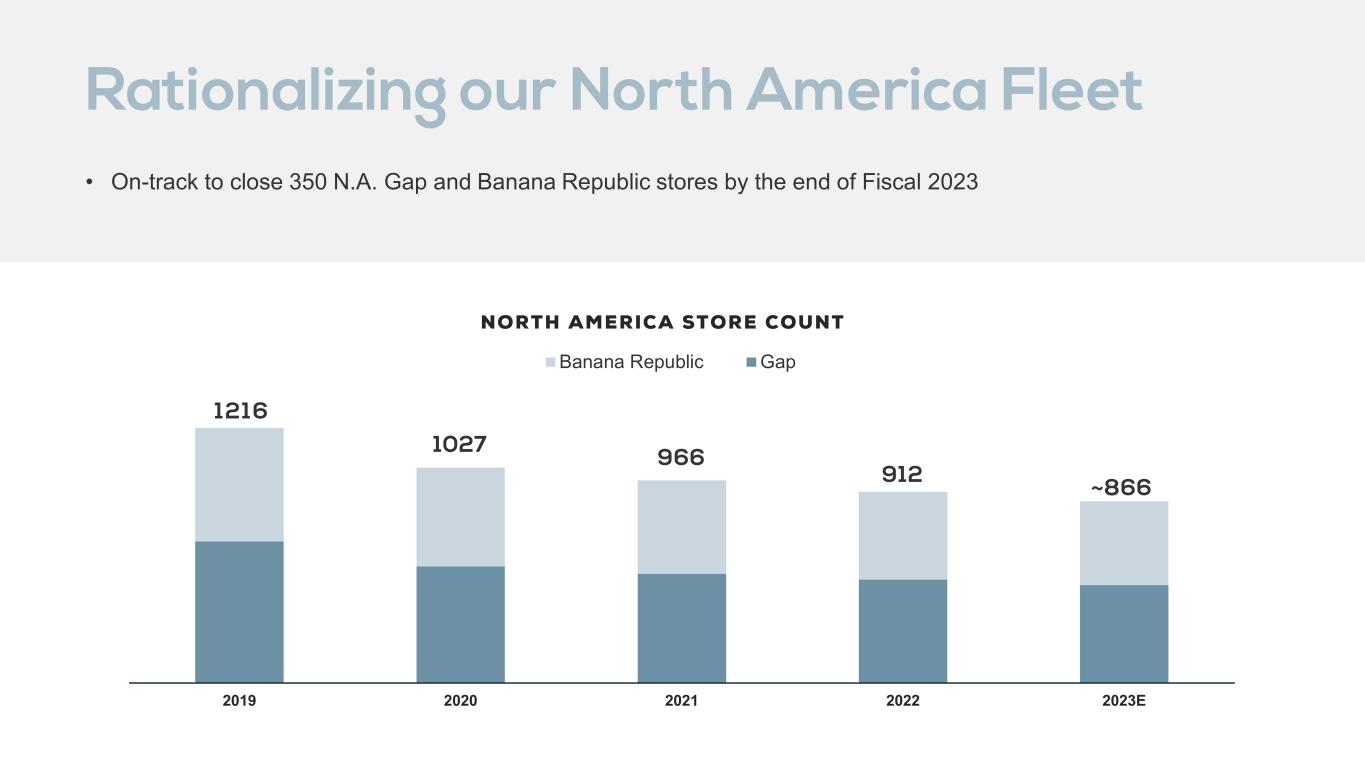
Rationalizing our North America Fleet • On-track to close 350 N.A. Gap and Banana Republic stores by the end of Fiscal 2023 121 6 1027 966 912 ~866 2019 2020 2021 2022 2023E NORTH AMERICA STORE COUNT Banana Republic Gap
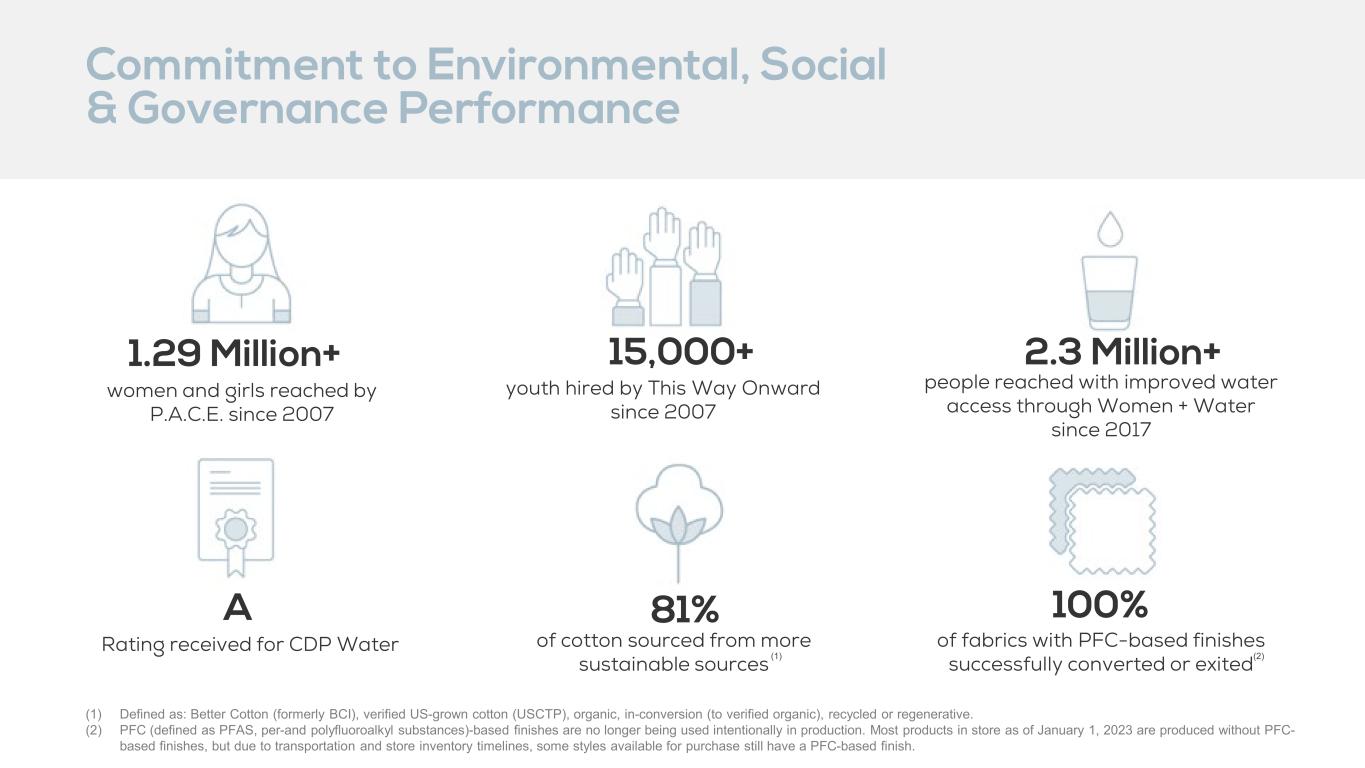
Commitment to Environmental, Social & Governance Performance (1) Defined as: Better Cotton (formerly BCI), verified US-grown cotton (USCTP), organic, in-conversion (to verified organic), recycled or regenerative. (2) PFC (defined as PFAS, per-and polyfluoroalkyl substances)-based finishes are no longer being used intentionally in production. Most products in store as of January 1, 2023 are produced without PFC- based finishes, but due to transportation and store inventory timelines, some styles available for purchase still have a PFC-based finish. 1.29 Million+ 15,000+ 2.3 Million+ 100%81%A Rating received for CDP Water of cotton sourced from more sustainable sources (1) of fabrics with PFC-based finishes successfully converted or exited women and girls reached by P.A.C.E. since 2007 youth hired by This Way Onward since 2007 people reached with improved water access through Women + Water since 2017 (2)