
Integra Resources Corp 6-K, filed Nov 14, 2023
Integra Resources Corp. (ITRG)
About this 6-K
Integra Resources Corp filed this 6-K on November 14, 2023.
UNITED STATES
SECURITIES AND EXCHANGE COMMISSION
Washington, D.C. 20549
Form 6-K
REPORT OF FOREIGN PRIVATE ISSUER PURSUANT TO RULE 13a-16 or 15d-16 UNDER THE SECURITIES EXCHANGE ACT OF 1934
For the month of November 2023.
Commission File Number 001-39372
INTEGRA RESOURCES CORP.
(Exact Name of Registrant as Specified in Charter)
1050-400 Burrard Street
Vancouver, British Columbia V6C 3A6
Canada
(Address of principal executive office)
Indicate by check mark whether the registrant files or will file annual reports under cover Form 20-F or Form 40-F
Form 20-F ☒ Form 40-F ☐
Indicate by check mark if the registrant is submitting the Form 6-K in paper as permitted by Regulation S-T Rule 101(b)(1): ☐
Note: Regulation S-T Rule 101(b)(1) only permits the submission in paper of a Form 6-K if submitted solely to provide an attached annual report to security holders.
Indicate by check mark if the registrant is submitting the Form 6-K in paper as permitted by Regulation S-T Rule 101(b)(7): ☐
Note: Regulation S-T Rule 101(b)(7) only permits the submission in paper of a Form 6-K if submitted to furnish a report or other document that the registrant foreign private issuer must furnish and make public under the laws of the jurisdiction in which the registrant is incorporated, domiciled or legally organized (the registrant's "home country"), or under the rules of the home country exchange on which the registrant's securities are traded, as long as the report or other document is not a press release, is not required to be and has not been distributed to the registrant's security holders, and, if discussing a material event, has already been the subject of a Form 6-K submission or other Commission filing on EDGAR.
EXPLANATORY NOTE
Exhibits 99.1, 99.2, 99.5, and 99.6 submitted with this Form 6-K are hereby incorporated by reference into Integra Resources Corp's Registration Statements on Form S-8 (File Nos. 333-242495 and 333-267507).
SIGNATURE
Pursuant to the requirements of the Securities Exchange Act of 1934, the registrant has duly caused this report to be signed on its behalf by the undersigned, thereunto duly authorized.
| Integra Resources Corp. | |
| /s/ Andree St-Germain | |
| Date: November 14, 2023 | Andree St-Germain Chief Financial Officer |
INDEX TO EXHIBITS
Integra Resources Corp.
Management's Discussion and Analysis
For the Three and Nine-Month Periods Ended
September 30, 2023 and 2022
Expressed in US Dollars

MANAGEMENT’S DISCUSSION & ANALYSIS
For the Three and Nine-Month Periods Ended September 30, 2023 and 2022
This portion of this quarterly report provides Management's Discussion and Analysis ("MD&A") of the financial condition and results of operations, to enable a reader to assess material changes in financial condition and results of operations as at, and for the three and nine-month periods ended September 30, 2023, in comparison to the corresponding prior-year periods. The MD&A is intended to help the reader understand Integra Resources Corp. ("Integra", "we", "our" or the "Company"), our operations, financial performance, and present and future business environment.
This MD&A has been prepared by management as at November 14, 2023 and should be read in conjunction with the unaudited interim condensed consolidated financial statements of Integra for the three and nine-month periods ended September 30, 2023 and 2022 and the Company's audited consolidated financial statements for the years ended December 31, 2022 and 2021 prepared in accordance with International Financial Reporting Standards ("IFRS") as issued by the International Accounting Standards Board (the "IASB"). Further information on the Company can be found on SEDAR+ at www.sedarplus.ca and the Company's website, www.integraresources.com.
For the purposes of preparing our MD&A, we consider the materiality of information. Information is considered material if: (i) such information results in, or would reasonably be expected to result in, a significant change in the market price or value of our shares; or (ii) there is a substantial likelihood that a reasonable investor would consider it important in making an investment decision; or (iii) it would significantly alter the total mix of information available to investors. We evaluate materiality with reference to all relevant circumstances, including potential market sensitivity.
| CORPORATE SUMMARY |
Integra Resources Corp. is one of the largest precious metals exploration and development companies in the Great Basin of the Western USA. Integra is currently focused on advancing its three flagship oxide heap leach projects: the past producing DeLamar Project located in southwestern Idaho and the Wildcat and Mountain View Projects located in western Nevada. The Company also holds a portfolio of highly prospective early-stage exploration projects in Idaho, Nevada and Arizona. Integra's long-term vision is to become a leading USA focused mid-tier high margin gold and silver producer.
As of November 14, 2023, the senior executives and directors of the Company were:
| George Salamis | Executive Chair |
| Jason Kosec | President, CEO and Director |
| Andrée St-Germain | Chief Financial Officer |
| Timothy Arnold |
Chief Operating Officer |
| Stephen de Jong | Lead Director |
| Timo Jauristo | Director |
| Anna Ladd-Kruger | Director |
| C.L. "Butch" Otter | Director |
| Carolyn Clark Loder | Director |
| Sara Heston | Director |
| Eric Tremblay | Director |
The Company is incorporated under the Business Corporations Act (British Columbia) (the "BCBCA").
The Company's head office is located at 1050 - 400 Burrard Street, Vancouver, BC V6C 3A6 and its registered office is located at 2200 HSBC Building, 885 West Georgia Street Vancouver, BC V6C 3E8.
The Company trades on the TSX Venture Exchange ("TSX-V"), under the trading symbol "ITR" and trades in the United States on the NYSE American under the stock symbol "ITRG".
MANAGEMENT’S DISCUSSION & ANALYSIS
For the Three and Nine-Month Periods Ended September 30, 2023 and 2022
The Company's warrants trade on the TSX-V under the symbol MPM.WT. Each warrant can be exercised for 0.092 Integra share.
The Company completed a 2.5 to 1 share consolidation on May 26, 2023. As a result, the share figures disclosed in this MD&A have been adjusted for the consolidation.
The Company completed on May 4, 2023 its previously announced at-market merger with Millennial Precious Metals Corp ("Millennial"). As a result of the transaction, Millennial has become a wholly-owned subsidiary of Integra. The following diagram illustrates the intercorporate relationships among Integra and its subsidiaries, as well as the jurisdiction of incorporation of each entity.

| Q3 2023 IN REVIEW AND RECENT EVENTS |
EXPLORATION
DeLamar Updated Resources
On September 26, 2023 the Company announced an updated NI43-101 mineral resources estimate ("MRE") for the DeLamar Project that incorporates the results from the highly successful stockpile drill program completed in April 2023. The stockpile drill program added a Measured and Indicated ("M&I") resource of 504,000 ounces ("oz") gold equivalent ("AuEq")* and an Inferred resource of 46,000 oz AuEq. The mineral resources added from this drilling were successfully within the Company's previously shared guidance range. The mineralized stockpile and backfill material that was incorporated into the updated DeLamar MRE demonstrates the potential for this material to significantly increase the heap leach mine life in future phases of planned production. The updated DeLamar MRE increased the total heap leachable oxide-and-mixed ounces within the M&I category by ~25% and increased the total Inferred ounces by ~31%. In total, ~90% of the updated MRE falls within the M&I category. Subject to future studies, management believes that these resources will most likely enhance the already robust economics of the DeLamar gold-silver project.
*AuEq = Au + (Ag / 77.7)
MANAGEMENT’S DISCUSSION & ANALYSIS
For the Three and Nine-Month Periods Ended September 30, 2023 and 2022
Mineral Resource Estimation Overview:
- The gold and silver MRE at DeLamar were modeled and estimated by Michael Gustin of RESPEC, an independent Qualified Person as defined in NI 43-101. Mr. Gustin evaluated the drill data statistically, separately interpreting gold and silver mineral domains on sets of 30 m spaced cross sections. Analysis was completed on the modeled mineralization spatially and statistically to aid in the establishment of estimation and classification parameters, interpolating grades into a three-dimensional block model using 3D gold and silver mineral domains to constrain the estimation (Inverse Distance Cubed). Mineral resources were constrained to lie within resource pit shells then classified based on geometrical and statistical parameters.
- The Oxide, Mixed and Non-Oxide material was modeled in 3D using both geological and analytical data ('cyanide solubility checks'). Different recoveries and economical parameters were applied to each of these oxidation domains.
- The reported MRE have been constrained within optimized pit shells using a gold price of US$1,800/oz Au and a silver price of US$21/oz Ag. These metal prices, as well as the metal recoveries summarized below, were used to calculate gold equivalent cut-off grade and contained ounces.
- Geotechnical pit slope angle varies per rock type between 30 degrees and 45 degrees.
- Additional inputs for Whittle pit-optimization include: mining costs from US$1.70 to US$2.00/tonne mined; heap leach costs from US$3.00 to US$5.00/tonne, milling costs from US$9.75 to US$16.75/tonne, and general and administrative costs of US$0.40/tonne processed.
- Recoveries for the MRE are as follows:
- DeLamar In-situ recoveries: heap leach Oxide 90%/40% for Au/Ag; heap leach Mixed 70%/50% for Au/Ag.
- Florida Mountain In-situ recoveries: heap leach Oxide 90%/55% for Au/Ag; heap leach Mixed 75%/60% for Au/Ag.
- North DeLamar Stockpile recoveries: heap leach 70%/60% for Au/Ag; Stockpile 1 heap leach recoveries: 80%/50% for Au/Ag; Stockpile 2 heap leach recoveries: 80%/55% for Au/Ag; Jacobs Gulch Stockpile and Florda Mountain backfill recoveries: 90%/45% for Au/Ag.
- Glen Silver In-situ Non-Oxide recoveries: 78%/78% for Au/Ag; Milestone In-situ Non-Oxide recoveries: 70%/75% for Au/Ag; Other mill areas In-situ Non-Oxide recoveries: 87%/87% for Au/Ag; Florida Mountain In-situ Non-Oxide recoveries: 95%/92% for Au/Ag.
- The MRE is based on 372,888 m in 3,185 drill holes, either drilled by Integra or previous owners.
- In 2022, Integra initiated the stockpile drill campaign which concluded in April 2023. In total, the Company drilled 12,588 m in 321 drill holes using both reverse circulation and sonic drills. The drill campaign covered approximately 80% to 90% of the 60 million tonnes of mineralized stockpiles and backfill. The remaining tonnes of mineralized stockpiles and backfill were not drilled primarily due to safety concerns related to winter weather. The Company believes that the remaining tonnes can be drilled in the future and converted into resources.
MANAGEMENT’S DISCUSSION & ANALYSIS
For the Three and Nine-Month Periods Ended September 30, 2023 and 2022
Table 1: 2023 DeLamar Project Mineral Resources Estimate: Measured, Indicated and Inferred
| Type | Class | Tonnes | Au g/t | Au oz | Ag g/t | Ag oz |
| Oxide | Measured | 6,313,000 | 0.36 | 74,000 | 16.9 | 3,427,000 |
| Indicated | 42,346,000 | 0.35 | 471,000 | 13.4 | 18,291,000 | |
| Inferred | 11,132,000 | 0.28 | 99,000 | 7.8 | 2,795,000 | |
| Meas + Ind | 48,659,000 | 0.35 | 545,000 | 13.9 | 21,718,000 | |
| Oxide | Measured | 6,313,000 | 0.36 | 74,000 | 16.9 | 3,427,000 |
| Indicated Inferred |
42,346,000 11,132,000 |
0.35 0.28 |
471,000 99,000 |
13.4 7.8 |
18,291,000 2,795,000 |
|
| Meas + Ind | 48,659,000 | 0.35 | 545,000 | 13.9 | 21,718,000 | |
| NonOxide | Measured | 21,056,000 | 0.51 | 345,000 | 32.8 | 22,198,000 |
| Indicated Inferred |
65,486,000 18,561,000 |
0.45 0.38 |
943,000 229,000 |
22.2 14.0 |
46,640,000 8,371,000 |
|
| Meas + Ind | 86,542,000 | 0.46 | 1,288,000 | 24.7 | 68,838,000 | |
| Stockpiles | Measured | - | - | - | - | - |
| Indicated Inferred |
42,455,000 4,877,000 |
0.22 0.17 |
296,000 26,000 |
11.8 9.8 |
16,149,000 1,535,000 |
|
| Meas + Ind | 42,455,000 | 0.22 | 296,000 | 11.8 | 16,149,000 | |
| Total Resources | Measured | 37,412,000 | 0.46 | 554,000 | 27.2 | 32,657,000 |
| Indicated Inferred |
210,424,000 43,101,000 |
0.35 0.31 |
2,381,000 428,000 |
16.3 10.8 |
110,091,000 15,002,000 |
|
| Meas + Ind | 247,836,000 | 0.37 | 2,935,000 | 18.1 | 142,748,000 |
Notes:
1. Mineral resources that are not mineral reserves do not have demonstrated economic viability.
2. Michael M. Gustin, C.P.G. and Principal Consultant for RESPEC, is a Qualified Person as defined in NI 43-101, and is responsible for reporting mineral resources in this technical report. Mr. Gustin is independent of Integra.
3. In-Situ Oxide and Mixed and all Stockpile mineral resources are reported at a 0.17 and 0.1 g AuEq/t cut-off, respectively, in consideration of potential open-pit mining and heap-leach processing.
4. Non-Oxide mineral resources are reported at a 0.3 g AuEq/t cut-off at DeLamar and 0.2 g AuEq/t at Florida Mountain in consideration of potential open pit mining and grinding, flotation, ultra-fine regrind of concentrates, and either Albion or agitated cyanide-leaching of the reground concentrates.
5. The mineral resources are constrained by pit optimizations.
6. Gold equivalent grades were calculated using the metal prices and recoveries presented in Table 14.18 and Table 14.19.
7. Rounding as required by reporting guidelines may result in apparent discrepancies between tonnes, grades, and contained metal content.
8. The effective date of the mineral resources is August 25, 2023.
9. The estimate of mineral resources may be materially affected by geology, environment, permitting, legal, title, taxation, sociopolitical, marketing, or other relevant issues.
Sampling and QA/QC Procedure
Thorough QA/QC protocols are followed on the Project, including insertion of duplicate, blank and standard samples in the assay stream for all drill holes. The samples are submitted directly to American Assay Labs in Reno, Nevada for preparation and analysis. Analysis of gold is performed using fire assay method with atomic absorption finish on a 1 assay ton aliquot. Gold results over 5 g/t are re-run using a gravimetric finish. Silver analysis is performed using ICP for results up to 100 g/t on a 5-acid digestion, with a fire assay, gravimetric finish for results over 100 g/t silver.
NI 43-101 Technical Report
A NI 43-101 technical report dated October 31, 2023 is available on the Company's website and SEDAR+ profile at www.sedarplus.ca
The results of the PFS on DeLamar included in the technical report titled "Technical Report and Preliminary Feasibility Study for the DeLamar and Florida Mountain Gold-Silver project, Owyhee County, Idaho, USA" dated March 22, 2022 with an effective date of January 24, 2022, remain unaffected by this MRE update and have been included in the Report.
MANAGEMENT’S DISCUSSION & ANALYSIS
For the Three and Nine-Month Periods Ended September 30, 2023 and 2022
DEVELOPMENT
DeLamar Project Development Drilling:
Metallurgical and Highwall Geotechnical Drilling: The Company drilled approximately 2,800m in Q3 2023, for a total of 3,288m year to date.
Condemnation Drilling: The Company drilled approximately 914m in Q3 2023, for a total of 1,604m year to date.
Facility Geotechnical Drilling: The company drilled nearly 200m for facility design and clay resource development. Nine test pits were completed for heap leach design geotechnical investigations and 6 test pits were dug for sand and gravel resource exploration. Three additional test pits were excavated in the legacy dumps and backfill to aid in Development Rock Storage Facility (DRSF) design.
This critical work is designed to further de-risk the project and to prepare it for next year's Feasibility Study and future development.
DeLamar Project Engineering/Metallurgical Work:
The Florida Mountain DRSF was moved back to the PFS location in Q3. Jacob's Gulch legacy waste material will be mined prior to the portion of the DRSF being filled. The final Mine Plan of Operations (MPO) production schedule was also completed. Cross sections were generated for the pits, DRSF's and backfill areas for the MPO document. Cap and cover design for the flat and sloped surfaces of DRSF's and the heap leach facility were evaluated, as well as water handling, storage, and management plans. Heap Leach pond sizing progressed in Q3, and a meeting was conducted with Idaho Department of Water Resources to align on design specifications. A review meeting was also conducted with the Bureau of Land Management (BLM) and other state agencies on draft sections of the MPO document for incorporation into the final version.
The highwall geotechnical and metallurgical drill program progressed in Q3. This will provide material needed to fill existing data gaps from the PFS and complete feasibility study (FS) level testing. The planned condemnation program was also completed in Q3. Geotechnical test pits were completed in legacy waste materials for DRSF design. Test pitting and geotechnical drilling progressed in the areas of the heap leach pads, DRSF's, clay resource, and sand and gravel resources in Q3.
A preliminary Traffic Study of Trout Creek and Cow Creek Roads was completed in Q3, and an internal economic trade off of Cow Creek road upgrades progressed for review in Q4.
The Power Supply Study was received in Q3 and several revisions have been made. The final report will be delivered in Q4, but information necessary for the MPO has been received.
Inputs for the resource update were delivered in Q3, as well as the applicable chapters for the report. Other work included gathering inputs for mine plan optimization work is expected in Q4.
Q3 metallurgical work included the completion of column tests on 3 materials from 2 different areas of the DeLamar deposit that have not previously been column tested, and 2 composites from Florida Mountain previously leached at 2", re-crushed to ½" for size comparison and all were incorporated into the recovery model. A column on a master composite of mixed material ~1/4" for DeLamar was also completed to better define the size sensitivity and potential for recovery improvements, but did not show significant opportunity.
Bottle roll tests continue on composites from the legacy dump and backfill drilling, and column leach test composites were prepared in Q3. This critical work is designed to further de-risk the project and to prepare it for next year's Feasibility Study and future development.
MANAGEMENT’S DISCUSSION & ANALYSIS
For the Three and Nine-Month Periods Ended September 30, 2023 and 2022
DeLamar Permitting:
Integra continued to coordinate monthly meetings with BLM, state agencies and the third party NEPA firm. All field activities associated with the 2023 baseline studies for aquatic resources, wetlands, wildlife, cultural resources, vegetation, noise monitoring in Silver City, visual resources for proposed mine features and soils were completed by mid September. All subconsultants will be submitting their baseline technical reports by the end of Q4 2023.
Integra continued its primary focus on the MPO which is scheduled to be submitted to the BLM in Q4 2023. Primary critical path items including hydrogeologic modeling focused on pit water interactions with meteoric and groundwater, pit water and rock geochemistry for proposed pits and DRSFs, with a focus on fate and transport modeling of groundwater in these areas. Efforts were focused on reclamation and closure planning, backfill sequencing for closure, site wide water balance and sources of makeup water for mine operations. Integra continued weekly coordination meetings with internal personnel and subconsultants with the primary focus on water geochemistry, closure/reclamation of in pit backfill, DRSF engineering design concepts for encapsulating potential acid generating (PAG) material for post closure reclamation strategy and design for final water management strategies after site closure and Heap Leach drawdown geochemical modeling. Additional sections of the MPO were submitted in draft format to the agencies for initial review and comment prior to submittal of the full document to support a timely completeness review by the agencies in Q1 2024.
Integra continued to advance the groundwater Hydrogeologic Conceptual Site Model (HCSM) by continued refinement and calibration to the updated mine site features proposed in the Mine Plan of Operations. Model development continued for pit and DRSF geochemistry and reclamation activities associated with groundwater/surface water infiltration and runoff interactions.
Integra continued to monitor the previously installed Vibrating Wire Piezometers (VWPs) as well as installing four of the proposed 6 VWPs in the proposed Florida Mountain and DeLamar Pits. These VWPs are being installed in select metallurgical or geotechnical areas to monitor groundwater elevations below the pits in proximity to underground workings and to further refine the model parameters and to better understand groundwater flows and elevations in these critical areas.
Integra conducted an audit on land status and claim maps to confirm mineral/surface holdings and land lease agreements in preparation for MPO submittal. The Company finalized an internal audit of existing surface and groundwater water rights within the company portfolio and the availability of these water right to be used for make-up water during mining. We also installed new flow measuring devices along Jordan Creek at the defunct US Geological Survey (USGS) gauging station and in Long Gulch to monitor and determine the quantity of water available within the basin that will be available during mining.
Integra completed Q3 surface water and groundwater sampling events in late July and early August. Several of the surface water sample locations had already dried up despite high springtime runoff conditions, further supporting the short lived nature of the surface water hydraulic system in the project area. Integra continued coordination with BLM, IDL and OEMR to present a draft version of the MPO, focusing on the proposed pit and development rock storage facilities locations and configurations for agency review in preparation for submittal in Q4.
Integra continued reclamation and reconciliation activities for all exploration drilling conducted on federal and private lands during the 2020 to 2023's winter drilling campaigns. Integra conducted site tours with IDL and BLM personnel to review and coordinate site activities to initiate the release of historic disturbance acreage in Q4 2023. Integra received approval on previously submitted amendments to the Stone Cabin EIS and conduct additional test pits and drilling on BLM administered lands in mid to late Q3.
MANAGEMENT’S DISCUSSION & ANALYSIS
For the Three and Nine-Month Periods Ended September 30, 2023 and 2022
SOCIAL AND ENVIRONMENTAL
During Q3 the external affairs team oversaw its busiest quarter of the year, conducting extensive engagement with stakeholders from across the Company's project portfolio during the summer months. These engagements included but are not limited to meetings and events with local community members, representatives from Tribal Nations, NGO's, youth, educational institutions, civic groups, state and federal agency personnel, local elected government officials, and Member of Congress and Agency representatives in Washington, D.C. August saw the Company's most successful DeLamar Day event to date with 250 attendees, highlighting the local cultures of Tribal Nations, Basque, and Ranchers, and celebrated an official proclamation issued by Governor Brad Little proclaiming August 18, 2023 as "DeLamar Day" in the state of Idaho. The external affairs team continued supporting efforts with the MPO team, particularly surrounding future mine access routes and tribal engagement.
During the three-month period ending September 30, 2023, Integra engaged with ~ 1,500 stakeholders, and made approximately $31,000 in direct investments into its local communities. Notable events supported and/or attended include the Silver City Property Owners Annual Meeting, the Owyhee Cattleman's Association AGM, DeLamar Day, the Idaho Mining Association's Washington DC congressional visit, and the American Mining Association AGM.
Engagement with Tribal Nations with current and/or ancestral ties to the lands surrounding Integra's projects have remained a high priority this quarter. Engagements included meetings with Tribal leaders, the coordination of Tribal cultural monitoring on project sites, supporting opportunities for resource gathering, site visits, and ceremonial events.
The Culture Committee held monthly meetings, and the Quarterly Women of Integra events have continued to see involvement from employees across the Company.
Water treatment operations followed their regular course at the DeLamar Project, and no material environmental or health and safety incidents were reported for the quarter across the Company's project portfolio.
| 2023 OUTLOOK |
The Company closed its acquisition of Millennial on May 4, 2023. The combination of Integra and Millennial creates one of the largest precious metals exploration and development companies in the Great Basin, US. The combined company features a diversified portfolio of assets including Integra's past producing oxide heap leach focused gold-silver DeLamar Project in southwest Idaho and Millennial's oxide heap leach focused Wildcat and Mountain View Projects in western Nevada. The combined company boasts one of the largest gold-silver endowments in the Great Basin not controlled by a major mining company. In addition to the development pipeline, meaningful exploration potential exists in the BlackSheep, War Eagle and non-oxide targets at DeLamar and the Dune, Eden, Marr, Ocelot, Cerro Colorado and Red Canyon Projects. The combined company allows for significant resource growth potential while de-risking and permitting its flagship assets.
DeLamar Project - Revised Mineral Resources Estimate
The Company completed in April 2023 its stockpile drilling program started in 2022. This program, designed to expand oxide and mixed gold-silver resources for future heap leach mine plans, was initiated on low-grade gold-silver stockpiles that were below the previous operators cut off grade which was dictated by much lower metal prices at the time.
The Company announced its DeLamar revised oxide resource estimate on September 26, 2023. The stockpile drill program added a measured and indicated resource of 504,000 oz AuEq and an inferred resource of 46,000 oz AuEq (see "Q3 in Review" section above for further details). The program successfully identified and delivered gold equivalent resources meeting and exceeding guidance and most importantly, with ~90% of the resources residing in an Indicated category. As a result, very little if any further drilling will be required to get these additional resources into a future mine plan at a feasibility level.
MANAGEMENT’S DISCUSSION & ANALYSIS
For the Three and Nine-Month Periods Ended September 30, 2023 and 2022
The results from the stockpile drill program and preliminary metallurgical test work support the Company's view that the material stockpiled and/or used as backfill at DeLamar and Florida Mountain from previous operations could potentially substantially increase the heap leach mine life, allows for more operational flexibility and optimization, subject to additional studies and mine plans to be conducted. The stockpiled/backfill material is located at surface in multiple areas around the DeLamar Project, close to in-situ gold-silver mineralisation as defined in the PFS and planned mine infrastructure.
DeLamar Project - Permitting and Engineering
Permitting and engineering work at DeLamar will continue and is focused on a fully developed stand-alone heap leach gold-silver operation. Baseline study work is ongoing to support the submittal of a Mine Plan of Operations in late Q4 2023.
Wildcat and Mountain View Projects - Revised Mineral Resources Estimate and Maiden Preliminary Economic Assessment.
On June 28, 2023 the Company announced an updated NI 43-101 resource (the "Revised Wildcat and Mountain View Resource"), concurrently with a maiden preliminary economic assessment ("PEA") for Wildcat and Mountain View. The PEA demonstrates the potential for a low-cost, high-margin, heap leach gold-silver operation with a phased development and production strategy and robust economics. In short, this maiden PEA for the Wildcat and Mtn View projects successfully met and/or exceeded the company's guidance to its shareholders.
Wildcat & Mountain View PEA highlights include:
- After-tax NPV(5%) of $309.6 million (C$408.6 million) and 36.9% after-tax IRR using base case metal prices of $1,700/oz Au and $21.50/oz Ag
- After-tax NPV(5%) of $442.1 million (C$583.6 million) and 49.7% after-tax IRR using spot metal prices on June 27, 2023 of $1,920/oz Au and $22.00/oz Ag
- Wildcat & Mountain View generate combined annual production of ~94koz AuEq from year 1-5 with average annual production of 80koz AuEq over the 13 year Life-of-Mine ("LOM")
- LOM payable metals from Wildcat & Mountain View of 1,043koz AuEq
- LOM site level cash costs of $882/oz AuEq on a co-product basis; LOM site level all-in sustaining cash costs ("AISC") of $973/oz AuEq on a co-product basis
- Year -1 initial capex of $115 million to begin operations at Wildcat
- Average oxide and transitional heap leach Au Recovery of 71.4% at Wildcat and 77.1% at Mountain View
- Low combined LOM strip ratio of 1.21 (Wildcat standalone strip ratio of 0.28)
- Total net free cash flow generated of $485 million over the LOM with average net annual free cash flow of $46 million from year 1-13
MANAGEMENT’S DISCUSSION & ANALYSIS
For the Three and Nine-Month Periods Ended September 30, 2023 and 2022
As part of the PEA, Integra completed an updated resource estimate for each of Wildcat and Mountain View. This resource update incorporates drilling from the 2021-2022 drill programs and is based on a new geological interpretation for lithological, structural, alteration and oxidation models. In addition to new drilling, which included validation of historical drill holes, the relogging and re-assaying of the available historical data provided enough information to upgrade the majority of the resources from the Inferred category into the Indicated category. Classification of the resources was interpreted manually considering various information such as geology, grade and recovery continuity as well as interpolation parameters and drilling spacing. The Company utilized a general guideline of 50m by 50m spacing for the Indicated resource and 100m by 100m for the Inferred resource. The resources were then constrained using Lerchs-Grossmann pit optimization to respect the definition of reasonable prospects for economic extraction. The updated resource estimate saw an increase in total in-pit gold equivalent ("AuEq") ounces driven primarily by the drilling that took place in 2021-2022 which allowed for the re-interpretation of the oxidation profile at Wildcat and a better constraint of the high-grade breccia body at Mountain View, new geotechnical parameters and metallurgical recoveries, and a higher Au price assumption. As a result of this geological and modeling work, approximately 80% of the resources for Wildcat & Mountain View are now upgraded to Indicated. This demonstrates ~85-90% conversion rate on the tonnage and ounces basis.
Please see "Properties" section below for further details on the updated NI 43-101 resource and the PEA. A NI 43-101 technical report dated July 30, 2023 is available on the Company's website and SEDAR+ profile at www.sedarplus.ca
Wildcat and Mountain View Projects - Exploration
The Company has submitted an exploration plan of operations ("EPO") for both Wildcat and Mountain View to the Bureau of Land Management which will increase the area of disturbance at both Wildcat and Mountain View from 5 acres to 400 acres. When received, the EPO will allow for significantly increased resource expansion drilling (2024 drilling program) through planned step-out drill holes. Resource growth at Wildcat and Mountain View has the potential to further enhance the economics and mine life demonstrated in the PEA results.
| PROPERTIES |
The combination of Integra and Millennial in May 2023 created one of the largest precious metals development and exploration companies in the Great Basin. The combined company features a diversified portfolio of assets including Integra's past producing oxide heap-leach focused gold-silver DeLamar Project in southwest Idaho and Millennial's oxide heap leach focused Wildcat and Mountain View Projects in western Nevada. In addition to the development pipeline, meaningful exploration potential exists in the BlackSheep, War Eagle and non-oxide targets at DeLamar and the Dune, Eden, Marr, Ocelot, Cerro Colorado and Red Canyon Projects from Millennial. The combined company allows for significant resource growth potential while de-risking and permitting its flagship assets.
The Company's material properties are the DeLamar Project, the Wildcat Property and the Mountain View Property.
Idaho:
DeLamar Project - Development stage (see page 11)
BlackSheep District - Exploration (see page 26)
War Eagle Property - Exploration (see page 27)
Nevada:
Wildcat Property - Development/Exploration stage (see page 20)
Mountain View Property - Development/Exploration stage (see page20)
Red Canyon Property - Exploration (see page 28)
MANAGEMENT’S DISCUSSION & ANALYSIS
For the Three and Nine-Month Periods Ended September 30, 2023 and 2022
Ocelot Property - Exploration (see page 29)
Marr Property - Exploration (see page 29)
Eden Property - Exploration (see page 29)
Dune Property - Exploration (see page 29)
Arizona:
Cerro Colorado Property - Exploration (see page 30)
(1) DeLamar Project, Idaho
The DeLamar Project consists of the neighboring DeLamar Deposit and Florida Mountain Deposit.
The bulk of the information in this section is derived from the "Technical Report for the DeLamar and Florida Mountain Gold - Silver Project, Owyhee County, Idaho, USA", dated October 31, 2023 with an effective date of August 25, 2023 (the "DeLamar Report"). The DeLamar Report is available for review under the Company's issuer profile on SEDAR+ at www.sedarplus.ca.
The DeLamar Report also includes the results of a PFS and mineral reserve statement on the DeLamar project previously included in the NI 43-101 technical report titled "Technical Report and Preliminary Feasibility Study for the DeLamar and Florida Mountain Gold - Silver Project, Owyhee County, Idaho, USA" dated March 22, 2022 with an effective date of January 24, 2022. The results of the PFS and the mineral reserve statement included therein and reproduced in the DeLamar Report remain unaffected by the updated mineral resource included in the DeLamar Report. The PFS and mineral reserve statement have an effective date of January 24, 2022. Sections 15, 16, 17, 18, 19, 21, 22, 23, and 24 have been reproduced in the DeLamar Report and have an effective date of January 24, 2022.
Economic Analysis
Economic highlights of the PFS for the DeLamar Project include:
- Initial construction period is anticipated to be 18 months;
- After-tax NPV (5%) of $407.8 million with a 27% after-tax IRR using $1,700 and $21.50 per ounce gold and silver prices, respectively;
- After-tax payback period of 3.34 years;
- Year 1 to 8 AuEq1 average production of 163,000 ounces (average 121,000 oz Au/year and 3,312,000 oz Ag/year);
- Year 1 to 16 AuEq average production of 110,000 ounces (average 71,000 oz Au/year and 3,085,000 oz Ag/year);
- After-tax LOM cumulative cash flow of $689.3 million; and
- Average annual after-tax free cash flow of $59.8 million during production.
Economic sensitivities of the DeLamar Project to changes in metal prices were evaluated based on constant gold to silver ratios as shown in the below table.
1 Gold equivalent = oz Au + (oz Ag ÷ 79.07)
MANAGEMENT’S DISCUSSION & ANALYSIS
For the Three and Nine-Month Periods Ended September 30, 2023 and 2022
Project Sensitivity to Metal Prices
| $/oz Au | $/oz Ag | NPV (5%) | NPV (8%) | NPV (10%) | IRR | Payback |
| $ 1,500 | $ 18.97 | $198,811 | $123,406 | $84,281 | 16% | 4.30 |
| $ 1,550 | $ 19.60 | $251,296 | $167,213 | $123,450 | 19% | 3.94 |
| $ 1,600 | $ 20.24 | $304,035 | $211,159 | $162,701 | 22% | 3.72 |
| $ 1,650 | $ 20.87 | $355,830 | $254,247 | $201,148 | 24% | 3.52 |
| $ 1,700 | $ 21.50 | $407,817 | $297,519 | $239,771 | 27% | 3.34 |
| $ 1,750 | $ 22.13 | $459,528 | $340,561 | $278,192 | 29% | 3.19 |
| $ 1,800 | $ 22.76 | $510,589 | $383,015 | $316,060 | 32% | 3.05 |
| $ 1,850 | $ 23.40 | $561,343 | $425,183 | $353,653 | 34% | 2.93 |
| $ 1,900 | $ 24.03 | $611,998 | $467,275 | $391,183 | 36% | 2.83 |
| $ 1,950 | $ 24.66 | $662,697 | $509,428 | $428,785 | 39% | 2.73 |
| $ 2,000 | $ 25.29 | $713,650 | $551,851 | $466,659 | 41% | 2.64 |
Mineral Resources and Reserves
Mineral Resource Estimate
Mineral resources have been estimated for both the Florida Mountain and DeLamar areas of the DeLamar project. These in situ gold and silver resources were modeled and estimated by:
-
evaluating the drill data statistically and spatially to determine natural gold and silver populations;
-
creating low-, medium-, and high-grade mineral-domain polygons for both gold and silver on sets of cross sections spaced at 30-meter (98.4-foot) intervals;
-
projecting the sectional mineral-domain polygons horizontally to the drill data within each sectional window;
-
slicing the three-dimensionally projected mineral-domain polygons along 6-meter-spaced (19.7-foot) horizontal planes at the DeLamar area and 8-meter-spaced (26.3-foot) planes at Florida Mountain and using these slices to rectify the gold and silver mineral-domain polygons on a set of level plans for each resource area;
-
coding a block model to the gold and silver mineral domains for each of the two deposit areas using the level-plan mineral-domain polygons;
-
analyzing the modeled mineralization geostatistically to aid in the establishment of estimation and classification parameters; and
-
interpolating gold and silver grades by inverse-distance to the third power into 6 x 6 x 6-meter (19.7 x 19.7 x 19.7-foot) blocks for the DeLamar area and 6 x 8 x 8-meter (19.7 x 26.3 x 26.3-foot) blocks at Florida Mountain, using the coded gold and silver mineral-domain percentages to explicitly constrain the grade estimations.
The first-time estimate of stockpile resources, which are comprised of historically mined but not processed materials, were modeled similarly to the in-situ resources, but solids or closely spaced long sections were used instead of level plans.
The DeLamar project mineral resources were estimated to reflect potential open-pit extraction and processing by: crushing and heap leaching of oxide, mixed, and all stockpile materials at both the DeLamar and Florida Mountain areas; grinding, flotation, ultra-fine regrind of concentrates, and Albion cyanide-leach processing of the reground concentrates for the non-oxide materials at the DeLamar area; and grinding, flotation, ultra-fine regrind of concentrates, and agitated cyanide-leaching of non-oxide materials at Florida Mountain. To meet the requirement of having reasonable prospects for eventual economic extraction by open-pit methods, pit optimizations for the DeLamar and Florida Mountain areas were run using the parameters summarized in Table 1.1 and Table 1.2, and the resulting pits were used to constrain the project resources.
MANAGEMENT’S DISCUSSION & ANALYSIS
For the Three and Nine-Month Periods Ended September 30, 2023 and 2022
Table 1-1 Resource Pit Optimization Cost Parameters

Table 1-2 Resource Pit-Optimization Metal Recoveries by Deposit and Oxidation State
| DeLamar In Situ | Florida Mountain In Situ | DeLamar Stockpiles |
Florida Mtn Stockpiles |
|||||||
| Process Type | Oxide | Mixed | Non- Oxide |
Oxide | Mixed | Non- Oxide |
N DM- SC |
DM #1 | DM #2 | ALL |
| Heap Leach - Au | 90% | 70% | - | 90% | 75% | - | 70% | 80% | 80% | 90% |
| Heap Leach - Ag | 40% | 50% | - | 55% | 60% | - | 60% | 50% | 55% | 45% |
| Mill - Albion - Glen Silver - Au | - | - | 78% | - | - | - | - | - | - | - |
| Mill - Albion - Glen Silver - Ag | - | - | 78% | - | - | - | - | - | - | - |
| Mill - Albion - Milestone - Au | - | - | 70% | - | - | - | - | - | - | - |
| Mill - Albion - Milestone - Ag | - | - | 75% | - | - | - | - | - | - | - |
| Mill - Albion - Other Areas - Au | - | - | 87% | - | - | - | - | - | - | - |
| Mill - Albion - Other Areas - Ag | - | - | 87% | - | - | - | - | - | - | - |
| Mill - Agitated Leach - Au | - | - | - | - | - | 95% | - | - | - | - |
| Mill - Agitated Leach - Au | - | - | - | - | - | 92% | - | - | - | - |
The pit shells created using these optimization parameters were applied to constrain the DeLamar project resources. The in-pit resources were further constrained by the application of a gold-equivalent cutoff of 0.17 g/t to all in-situ model blocks lying within the optimized pits that are coded as oxide or mixed, a 0.1 g/t gold-equivalent cutoff to all stockpile material, a 0.3 g/t gold-equivalent cutoff for in-situ blocks coded as non-oxide at DeLamar, and a 0.2 g/t cutoff for in-situ blocks coded as non-oxide at Florida Mountain. Gold-equivalent grades were used solely for the purpose of applying the resource cutoffs, are a function of metal prices (Table 1.1) and metal recoveries, with the recoveries varying by deposit and oxidation state (Table 1.2).
MANAGEMENT’S DISCUSSION & ANALYSIS
For the Three and Nine-Month Periods Ended September 30, 2023 and 2022
The total DeLamar project resources are summarized in Table 1.3.
Table 1-3 Total DeLamar Project Gold and Silver Resources
| Type | Class | Tonnes | Au g/t | Au oz | Ag g/t | Ag oz |
| Oxide | Measured | 6,313,000 | 0.36 | 74,000 | 16.9 | 3,427,000 |
| Indicated Inferred |
42,346,000 11,132,000 |
0.35 0.28 |
471,000 99,000 |
13.4 7.8 |
18,291,000 2,795,000 |
|
| Meas + Ind | 48,659,000 | 0.35 | 545,000 | 13.9 | 21,718,000 | |
| Mixed | Measured | 10,043,000 | 0.42 | 136,000 | 21.8 | 7,032,000 |
| Indicated Inferred |
60,136,000 8,533,000 |
0.35 0.27 |
672,000 74,000 |
15.0 8.4 |
29,010,000 2,302,000 |
|
| Meas + Ind | 70,179,000 | 0.37 | 808,000 | 16.5 | 36,042,000 | |
| NonOxide | Measured | 21,056,000 | 0.51 | 345,000 | 32.8 | 22,198,000 |
| Indicated Inferred |
65,486,000 18,561,000 |
0.45 0.38 |
943,000 229,000 |
22.2 14.0 |
46,640,000 8,371,000 |
|
| Meas + Ind | 86,542,000 | 0.46 | 1,288,000 | 24.7 | 68,838,000 | |
| Stockpiles | Measured | - | - | - | - | - |
| Indicated Inferred |
42,455,000 4,877,000 |
0.22 0.17 |
296,000 26,000 |
11.8 9.8 |
16,149,000 1,535,000 |
|
| Meas + Ind | 42,455,000 | 0.22 | 296,000 | 11.8 | 16,149,000 | |
| Total Resources | Measured | 37,412,000 | 0.46 | 554,000 | 27.2 | 32,657,000 |
| Indicated Inferred |
210,424,000 43,101,000 |
0.35 0.31 |
2,381,000 428,000 |
16.3 10.8 |
110,091,000 15,002,000 |
|
| Meas + Ind | 247,836,000 | 0.37 | 2,935,000 | 18.1 | 142,748,000 |
Notes:
1. Mineral resources that are not mineral reserves do not have demonstrated economic viability.
2. Michael M. Gustin, C.P.G. and Principal Consultant for RESPEC, is a Qualified Person as defined in NI 43-101, and is responsible for reporting mineral resources in this technical report. Mr. Gustin is independent of Integra.
3. In-Situ Oxide and Mixed and all Stockpile mineral resources are reported at a 0.17 and 0.1 g AuEq/t cut-off, respectively, in consideration of potential open-pit mining and heap-leach processing.
4. Non-Oxide mineral resources are reported at a 0.3 g AuEq/t cut-off at DeLamar and 0.2 g AuEq/t at Florida Mountain in consideration of potential open pit mining and grinding, flotation, ultra-fine regrind of concentrates, and either Albion or agitated cyanide-leaching of the reground concentrates.
5. The mineral resources are constrained by pit optimizations.
6. Gold equivalent grades were calculated using the metal prices and recoveries presented in Table 14.18 and Table 14.19.
7. Rounding as required by reporting guidelines may result in apparent discrepancies between tonnes, grades, and contained metal content.
8. The effective date of the mineral resources is August 25, 2023.
9. The estimate of mineral resources may be materially affected by geology, environment, permitting, legal, title, taxation, sociopolitical, marketing, or other relevant issues.
The project mineral resources are inclusive of the mineral reserves discussed herein. The mineral reserve statement included herein has an effective date of January 24, 2022 and is unaffected by the mineral resource update included herein. Mineral resources that are not mineral reserves do not have demonstrated economic viability.
MANAGEMENT’S DISCUSSION & ANALYSIS
For the Three and Nine-Month Periods Ended September 30, 2023 and 2022
Mineral Reserve Estimate
Mineral Resources have been estimated for both the Florida Mountain and DeLamar Areas of the DeLamar Project. The relevant author of the DeLamar Report has used Measured and Indicated Mineral Resources as the basis to define Mineral Reserves for both the DeLamar and Florida Mountain Areas. Mineral Reserve definition was done by first identifying ultimate pit limits using economic parameters and pit optimization techniques. The resulting optimized pit shells were then used for guidance in pit design to allow access for equipment and personnel. The relevant author of the DeLamar Report then considered mining, processing, metallurgical, infrastructure, economic, marketing, legal, environmental, social, and governmental factors for defining the estimated Mineral Reserves.
The economic parameters and cutoff grades used in the estimation of the Mineral Reserves are shown in the table below. The overall leaching process rate is planned to be 35,000 tpd (38,581 tons) or 12,600,000 tonnes (13,889,123 tons) per year for both Florida Mountain and DeLamar Area oxide and mixed material. DeLamar Area leach processing will also include agglomeration. Initially only the oxide and mixed material will be processed, then starting in year 3, non-oxide will be processed through a plant constructed to operate at a rate of 6,000 tpd (6,614 tons) or 2,160,000 tonnes (2,380,992 tons) per year.
The cutoff grades applied reflect the cost to process material along with G&A and incremental haulage costs. Note that royalties are built into the block values and are considered in determining whether to process the material. While the DeLamar Area non-oxide breakeven cutoff grade would be $11.44/t according to the applicable costs, a cutoff of $15.00 was assigned to enhance the project's economic performance.
DeLamar and Florida Mountain Area Economic Parameters
| DeLamar | Florida Mnt | ||||||
| Oxide | Mixed | Non-Oxide | Oxide | Mixed | Non-Oxide | Units | |
| Mining Cost | $ 2.00 | $ 2.00 | $ 2.00 | $ 2.00 | $ 2.00 | $ 2.00 | $/t Mined |
| Incremental Ore Haulage | $ 0.20 | $ 0.20 | $ 0.20 | $ 0.20 | $ 0.20 | $ 0.20 | $/t Processed |
| Process Cost | $ 3.00 | $ 4.00 | $ 11.02 | $ 2.75 | $ 3.50 | $ 9.00 | $/t Processed |
| G&A | $ 0.44 | $ 0.44 | $ 0.22 | $ 0.45 | $ 0.45 | $ 0.25 | $/t Processed |
| GMV Breakeven COG | $ 3.64 | $ 4.64 | $ 11.44 | $ 3.40 | $ 4.15 | $ 9.45 | $/t Processed |
| GMV COG Used | $ 3.65 | $ 4.65 | $ 15.00 | $ 3.55 | $ 4.20 | $ 10.35 | $/t Processed |
| Final Process Costs | $ 4.27 | $ 4.29 | $ 11.91 | $ 2.98 | $ 3.67 | $ 10.60 | $/t Processed |
GMV = gross metal value; COG = cutoff grade.
Total Proven and Probable Mineral Reserves for the DeLamar Project from all pit phases are 123,483,000 tonnes at an average grade of 0.45 g Au/t and 23.27 g Ag/t, for 1,787,000 ounces of gold and 92,403,000 ounces of silver. The Mineral Reserves point of reference is the point where material is fed into the crusher.
MANAGEMENT’S DISCUSSION & ANALYSIS
For the Three and Nine-Month Periods Ended September 30, 2023 and 2022
Total Proven and Probable Mineral Reserves, DeLamar and Florida Mountain Area
| Classification | K Tonnes | g Au/t | K Ozs Au | g Ag/t | K Ozs Ag | Block Value | |
| Oxide | Proven Probable |
3,295 31,486 |
0.39 0.37 |
41 375 |
17.39 15.24 |
1,842 15,426 |
19.34 17.93 |
| P&P | 34,782 | 0.37 | 416 | 15.44 | 17,268 | $ 18.06 | |
| Mixed | Proven Probable |
7,741 49,718 |
0.49 0.40 |
122 637 |
25.75 17.29 |
6,409 27,632 |
23.72 18.29 |
| P&P | 57,459 | 0.41 | 759 | 18.43 | 34,042 | $ 19.02 | |
| Non-oxide | Proven Probable |
7,321 23,921 |
0.65 0.60 |
153 459 |
53.15 37.16 |
12,511 28,582 |
39.33 33.81 |
| P&P | 31,243 | 0.61 | 612 | 40.91 | 41,093 | $ 35.11 | |
| Total | Proven Probable |
18,358 105,126 |
0.54 0.44 |
316 1,471 |
35.18 21.20 |
20,763 71,640 |
$ 29.16 $ 21.71 |
| P&P | 123,483 | 0.45 | 1,787 | 23.27 | 92,403 | $ 22.82 |
(1) All estimates of Mineral Reserves have been prepared in accordance with NI 43-101 and are included within the current Measured and Indicated Mineral Resources.
(2) Mineral Reserves are based on prices of $1,650 per ounce Au and $21.00 per ounce Ag. The Mineral Reserves were defined based on pit designs that were created to follow optimized pit shells created in Whittle.
(3) Mineral Reserves are reported using block value cutoff grades representing the cost of processing:
Florida Mountain Area oxide leach cutoff grade value of $3.55/t.
Florida Mountain Area mixed leach cutoff grade value of $4.20/t.
Florida Mountain Area non-oxide mill cutoff grade value of $10.35/t.
DeLamar Area oxide leach cutoff grade value of $3.65/t
DeLamar Area mixed leach cutoff grade value of $4.65/t.
DeLamar Area non-oxide mill cutoff grade value of $15.00/t.
(4) The Mineral Reserves point of reference is the point where is material is fed into the crusher.
(5) The effective date of the Mineral Reserves estimate is January 24, 2022.
(6) All ounces reported herein represent troy ounces, "g/t Au" represents grams per gold tonne and "g/t Ag" represents grams per silver tonne.
(7) Columns may not sum due to rounding.
(8) The estimate of Mineral Reserves may be materially affected by geology, environment, permitting, legal, title, taxation, sociopolitical, marketing or other relevant issues.
(9) Energy prices of $2.50 per gallon of diesel and $0.065 per kWh were used.
Mining Operations
The PFS presented in the DeLamar Report considers open-pit mining of the DeLamar and Florida Mountain Areas. Mining will utilize 23-cubic meter (30-cubic yard) hydraulic shovels along with 13-cubic meter (16.7-cubic yard) loaders to load 136-tonne capacity haul trucks. The haul trucks will haul waste and ore out of the pit and to dumping locations. Due to the length of ore hauls, the ore will be stockpiled near the pits followed by loading into a Railveyor system which will convey the ore into a crusher. The Railveyor system will be supplemented with haul trucks on an as needed basis.
Waste material will be stored in waste-rock storage facilities ("WRSFs") located near each of the Florida Mountain and DeLamar Areas, as well as backfilled into pits where available. The exception is the Milestone pit, from which waste material will be fully utilized for construction material for the tailing storage facility ("TSF").
Production scheduling was completed using Geovia's MineSched™ (version 2021) software. Proven and Probable Mineral Reserves along with waste material inside pit designs were used to schedule mine production. The production schedule considers the processing of DeLamar and Florida Mountain Area oxide and mixed material by crushing and heap leaching, with some of the DeLamar Area material requiring agglomeration prior to leaching. DeLamar and Florida Mountain Area non-oxide material would be processed using flotation followed by cyanide leaching of the flotation concentrate.
An autonomous Railveyor light-rail haulage system is planned to be used to transport ore from the open pits to the crusher facility. Utilizing the Railveyor system allows the opportunity to realize cost savings compared to typical truck haulage. This system, in conjunction with the planned solar and liquid natural gas electrical microgrid will reduce the overall fuel consumption and carbon footprint of the DeLamar Project.
MANAGEMENT’S DISCUSSION & ANALYSIS
For the Three and Nine-Month Periods Ended September 30, 2023 and 2022
The PFS has assumed owner mining instead of the more expensive contract mining. The production schedule was used along with additional efficiency factors, performance curves, and productivity rates to develop the first-principal hours required for primary mining equipment to achieve the production schedule. Primary mining equipment includes drills, loaders, hydraulic shovels, and haul trucks. Support, blasting, and mine maintenance equipment will be required in addition to the primary mining equipment.
Processing and Recovery Operations
Processing
The PFS envisions the use of two process methods for the recovery of gold and silver:
1. Lower-grade oxide and mixed materials will be processed by crushed-ore cyanide heap leaching; and
2. Non-oxide material will be processed using grinding followed by flotation, and very fine grinding of flotation concentrate for agitated cyanide leaching.
Heap-leach and milling ores will be coming from both the Florida Mountain and DeLamar Areas. Pregnant solutions from the heap-leach operation and from the milling operation will be processed by the same Merrill-Crowe zinc cementation plant. Processing will start with heap leaching in the first two years of operation. Milling of higher-grade non-oxide ore will start in the third year of operation.
Both Florida Mountain and DeLamar Area oxide and mixed ore types have been shown to be amenable to heap-leach processing following crushing. Material will be crushed in three stages to a nominal size of 80% finer than (P80) 12.7-millimeter (0.5 inches), at a rate of 35,000 tpd. About 45% of DeLamar Area ore is expected to require agglomeration.
Crushed and prepared ore will be transferred to the heap-leach pad using overland conveyors and stacked on the heap using portable or grasshopper conveyors and a radial stacking system. Pregnant leach solution will be collected at the base on the heap leach and transferred to the Merrill-Crowe processing plant for recovery of precious metals by zinc precipitation. The precipitate will be filtered, dried, and smelted to produce gold and silver doré bullion for shipment off site.
The milling process will start with primary crushing of the ore to a nominal P80 of 120 millimeter (4.72 inches), followed by grinding in a SAG mill-ball mill circuit to a P80 of 150 microns. The ball mill discharge will be pumped to hydrocyclones, with the hydrocyclone overflow advancing to flotation and the underflow returning to the ball mill. The mill will have a nominal capacity of 6,000 tpd.
The flotation circuit will produce a sulfide concentrate that will recover gold and silver from the ore. This flotation concentrate will be reground to a nominal P80 of 20 microns before being leached in agitated leach tanks. Pregnant solution will be separated using a CCD circuit that employs dewatering cyclones and thickeners. The pregnant solution is then sent to the Merrill-Crowe plant and gold smelting facility to produce gold and silver doré bullion.
The flotation tailing stream will be thickened and pumped to the tailing storage facility. The concentrate leach residue will be sent to cyanide destruction, then stored in a separate concentrate leach tailing storage facility.
Recovery
Recoveries were applied based on recommendations of the relevant author of the DeLamar Report. Recoveries are shown in the table below. The oxide and mixed recoveries assume crushed heap leaching for oxide and mixed material, and flotation milling for non-oxide material.
MANAGEMENT’S DISCUSSION & ANALYSIS
For the Three and Nine-Month Periods Ended September 30, 2023 and 2022
DeLamar and Florida Mountain Area Recoveries
| Recoveries by Area | Oxide | Mixed | Non-Oxide | |||
| Au | Ag | Au | Ag | Au | Ag | |
| Florida Mountain | 89% | 49% | 72% | 47% | Eq. 1 | Eq. 2 |
| Sullivan Gulch | 86% | 20% | 61% | 39% | 38% | 73% |
| DeLamar | 78% | 11% | 61% | 42% | 39% | 87% |
| Sommercamp | 87% | 15% | 58% | 44% | 39% | 87% |
| Glen Silver | 70% | 18% | 63% | 30% | 28% | 64% |
| South Wahl | 77% | 37% | 50% | 74% | 39% | 87% |
| Milestone | 75% | 18% | 45% | 18% | 39% | 87% |
Capital and Operating Costs
The table below summarizes the estimated capital costs for the DeLamar Project. The LOM total capital costs are estimated as $589.5 million, including $307.6 million in preproduction capital (including working capital and reclamation bond) and $281.8 million for expansion and sustaining capital. Sustaining capital includes $30.8 million in reclamation costs. The estimated capital costs are inclusive of sales tax, engineering, procurement and construction management ("EPCM") and contingency.
Capital Cost Summary
| Mine | Pre-Production | Sustaining Yr 1 to Yr 17 |
Total LOM |
| Mining Equipment | $ 28,859 | $ 88,544 | $ 117,403 |
| Pre-Stripping | $ 12,712 | $ - | $ 12,712 |
| Other Mine Capital | $ 1,919 | $ 225 | $ 2,144 |
| Sub-Total Mine | $ 43,490 | $ 88,769 | $ 132,260 |
| Processing | |||
| Leach Pad Construction Cost | $ 42,296 | $ 11,035 | $ 53,331 |
| Oxide Plant Construction | $ 165,198 | $ 8,842 | $ 174,040 |
| Non Oxide Mill Construction | $ - | $ 132,005 | $ 132,005 |
| Tailings Storage Facility Construction | $ 3,836 | $ 58,793 | $ 62,629 |
| Sub-Total Processing | $ 211,330 | $ 210,675 | $ 422,005 |
| Infrastructure | |||
| Power | $ 3,500 | $ - | $ 3,500 |
| Access Road | $ 8,957 | $ - | $ 8,957 |
| Other | $ 7,652 | $ 974 | $ 8,626 |
| Sub-Total Infrastructure | $ 20,109 | $ 974 | $ 21,083 |
| Owner's Costs | $ 7,001 | $ - | $ 7,001 |
| SUB-TOTAL | $ 281,930 | $ 300,418 | $ 582,349 |
| Other | |||
| Working Capital | $ 19,518 | $ (19,518) | $ - |
| Cash Deposit for Reclamation Bonding | $ 6,167 | $ (6,167) | $ - |
| Salvage Value | $ - | $ (23,729) | $ (23,729) |
| TOTAL | $ 307,615 | $ 251,004 | $ 558,620 |
| Reclamation | $ - | $ 30,835 | $ 30,835 |
| Total Including Reclamation Costs | $ 307,615 | $ 281,839 | $ 589,454 |
(1) Capital costs include contingency and EPCM costs.
(2) Mining equipment includes cost of Railveyor.
MANAGEMENT’S DISCUSSION & ANALYSIS
For the Three and Nine-Month Periods Ended September 30, 2023 and 2022
(3) Major mining equipment assumes financing by equipment vendor with 10% down; principal payments included under sustaining capital column and interest payments included in operating costs.
(4) Sustaining capital showed in this table includes expansion capital (non-oxide plant) and principal payment of mining equipment leases (see note 3 above).
(5) Working capital is returned in year 17.
(6) Cash deposit = 20% of bonding requirement. Released once reclamation is completed.
(7) Salvage value for mining equipment and plant.
The table below shows the estimated LOM operating costs for the DeLamar Project. Operating costs are estimated to be $12.93 per tonne processed for the LOM. This includes mining costs, which are estimated to be $1.90 per tonne mined. The total cash cost is estimated to be $923 per ounce of AuEq2 and site level AISC are estimated to be $955 per ounce of AuEq.
Operating and Total Cost Summary
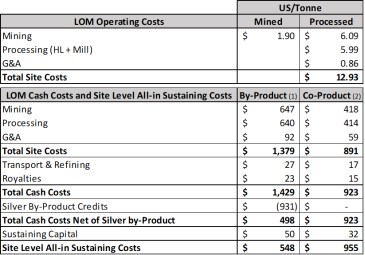
(1) By-Product costs are shown as US dollars per gold ounces sold with silver as a credit.
(2) Co-Product costs are shown as US dollars per gold equivalent ounce.
Exploration and Development
Please see "2023 Outlook" section above for further details on the Company's current and contemplated exploration and development activities.
Opportunities
There is the potential to lower project capital costs by foregoing mill processing and instead operate a heap-leach only project. In this scenario, a high percentage of the current heap-leach reserves would be processed at the 35,000 tpd rate envisioned in the PFS. LOM capital expenditures would decrease significantly as expansion capital, such as non-oxide treatment plant and tailing facilities, would not be required. A decision to construct and initiate mill processing (stage 2) could be exercised at any time, providing the flexibility to respond to changing market conditions and thereby reducing project risk.
2 Gold equivalent = oz Au + (oz Ag ÷ 79.07)
MANAGEMENT’S DISCUSSION & ANALYSIS
For the Three and Nine-Month Periods Ended September 30, 2023 and 2022
A heap-leach only approach will reduce risk and provide greater flexibility to respond to the prevailing economic environment in connection with a decision to pursue a milling scenario later.
Please see "Q3 2023 in Review" and "2023 Outlook" sections above for further details on the Company's heap leach only strategy.
Please see the DeLamar Report on the Company's website at www.integraresources.com for additional details on potential opportunities.
MANAGEMENT’S DISCUSSION & ANALYSIS
For the Three and Nine-Month Periods Ended September 30, 2023 and 2022
(2) Wildcat and Mountain View Properties, Nevada
The bulk of the information in this section is derived from the "Technical Report and Preliminary Economic Assessment for the Wildcat and Mountain View Projects, Nevada, USA", dated July 30, 2023 with an effective date of June 28, 2023 (the "Wildcat and Mountain View Report"). The Wildcat and Mountain View Report is available for review under the Company's issuer profile on SEDAR+ at www.sedarplus.ca.
Economic Analysis
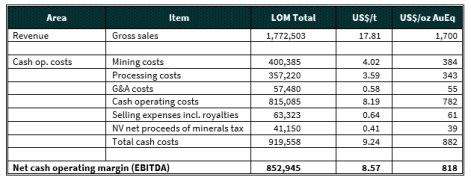
The life-of-mine (LOM) base case cash flow is summarized in the table below:
Summary LOM Cash Flow, Wildcat and Mountain View Projects

This preliminary economic assessment is preliminary in nature; it includes inferred mineral resources that are considered too speculative geologically to have the economic considerations applied to them that would enable them to be categorized as mineral reserves, and there is no certainty that the preliminary economic assessment will be realized.
The average annual LOM production at Wildcat and Mountain View is expected to be 80,000 oz AuEq per year which, at the base case metal prices of $1,700/oz Au and $21.50/oz Ag will generate total LOM net free cash flow of $485 million and average annual free cash flow of $46 million from year 1 to year 13. Corporate office general and administrative costs were not included in the LOM costs for the Projects.
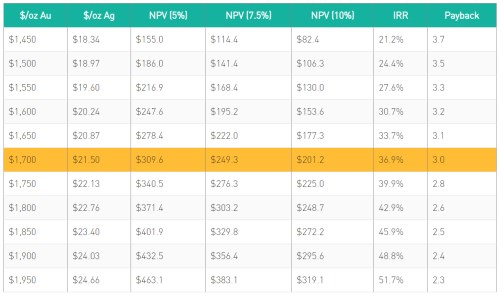
The base case cash flow is equivalent to an after-tax net present value (NPV) of $309.6 million at a discount rate of 5% and yields an internal rate of return (IRR) of 36.9%. Over the LOM period, the operating margin averages 48.1%.
MANAGEMENT’S DISCUSSION & ANALYSIS
For the Three and Nine-Month Periods Ended September 30, 2023 and 2022
At the time of announcement (June 27, 2023) spot prices of $1,920/oz gold and $22.00/oz silver, the forecast cash flow evaluates to an after-tax NPV5% of $442.1 million at an annual discount rate of 5% and yields an internal rate of return (IRR) of 49.7%.
The Projects are expected to have direct cash costs of $882/oz gold equivalent (AuEq) an All-in-Sustaining Cost (AISC) of $973/oz AuEq, and All-in-Costs (AIC) of $1,175/oz AuEq.
After-Tax NPV, IRR and Payback Sensitivity Table
Mineral Resources
Wildcat Mineral Resource Estimate
The QPs have classified the Wildcat Project mineral resource estimate as indicated, and inferred mineral resources, based on data density, search ellipse criteria and interpolation parameters. The resource estimate is considered to be a reasonable representation of the mineral resources of the Wildcat deposit, based on the currently available data and geological knowledge. The mineral resource estimate follows the 2014 CIM Definition Standards on Mineral Resources and Reserves. The effective date of the Mineral Resource Estimate is June 28, 2023. William Lewis P. Geo, of Micon is the QP responsible for the Wildcat mineral resource estimate.
The table below displays the results of the mineral resource estimate at a 0.15 g/t Au cut-off grade for the Wildcat deposit.
Wildcat Deposit June, 2023, Mineral Resource Estimate Statement

MANAGEMENT’S DISCUSSION & ANALYSIS
For the Three and Nine-Month Periods Ended September 30, 2023 and 2022
Table Notes:
(1) Effective date of the Mineral Resource Estimate is June 28, 2023.
(2) Mineral Resources that are not Mineral Reserves do not have demonstrated economic viability.
(3) William J. Lewis, P.Geo., of Micon has reviewed and verified the Mineral Resource Estimate for the Wildcat Project. Mr. Lewis is an independent Qualified Person, as defined in National Instrument 43-101 Standards of Disclosure for Mineral Projects (NI 43-101).
(4) The estimate is reported for an open-pit mining scenario, based upon reasonable assumptions. The cut-off grade of 0.15 g/t Au was calculated using a gold price of $1,800/oz, mining costs of $2.4/t, processing cost of $3.7/t, G&A costs of $0.5/t, and metallurgical gold recoveries varying from 73.0% to 52.0% and silver recoveries of 18%. The gold equivalent figures in the resource estimate are calculated using the formula (g/t Au + (g/t Ag ÷ 77.7)).
(5) An average bulk density of 2.6 g/cm3 was assigned to all mineralized rock types.
(6) The Inverse Distance cubed interpolation was used with a parent block size of 15.24 m x 15.24 m x 9.144 m.
(7) Rounding as required by reporting guidelines may result in minor apparent discrepancies between tonnes, grades, and contained metal content.
(8) The estimate of mineral resources may be materially affected by geological, environmental, permitting, legal, title, taxation, sociopolitical, marketing, or other relevant issues.
(9) Neither Integra nor Micon's QP is aware of any known environmental, permitting, legal, title-related, taxation, socio-political, marketing or other relevant issue that could materially affect the mineral resource estimate other than any information already disclosed in this report.
For the Wildcat deposit, a reasonable economic cut-off grade for the resource estimate was determined to be 0.15 g/t Au. This cut-off grade was determined using the parameters presented in the table below. The QP considers the selected cut-off grade of 0.15 g/t Au to be reasonable based on the current knowledge of the Project.
In addition to the cut-off grade, an open pit optimizer program was run on the block model to constrain the mineral resources within a pit shell.
Wildcat Project Mineral Resource Estimate Economic Parameters

Mountain View Mineral Resource Estimate
The QPs have classified the Mountain View Project mineral resource estimate as indicated and inferred mineral resources, based on data density, search ellipse criteria and interpolation parameters. The estimate is considered to be a reasonable representation of the mineral resources of the Mountain View deposit, based on the currently available data and geological knowledge. The mineral resource estimate follows the 2014 CIM Definition Standards on Mineral Resources and Reserves. The effective date of the mineral resource estimate is June 28, 2023.
The table below displays the results of the mineral resource estimate at a gold cut-off grade of 0.15 g/t for the Mountain View deposit. William Lewis, P. Geo. of Micon is the QP responsible for the Mountain View mineral resource estimate.
MANAGEMENT’S DISCUSSION & ANALYSIS
For the Three and Nine-Month Periods Ended September 30, 2023 and 2022
Mountain View Deposit June, 2023, Mineral Resource Estimate Statement
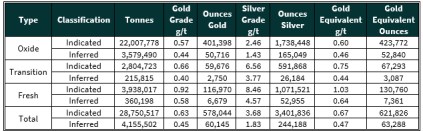
Table Notes:
(1) Effective date of the Mineral Resource Estimate is June 28, 2023.
(2) Mineral Resources that are not Mineral Reserves do not have demonstrated economic viability.
(3) William J. Lewis, P.Geo., of Micon has reviewed and verified the Mineral Resource Estimate for the Mountain View Project. Mr. Lewis is an independent Qualified Person, as defined in National Instrument 43-101 Standards of Disclosure for Mineral Projects (NI 43-101).
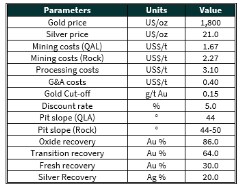
(4) The estimate is reported for an open-pit mining scenario, based upon reasonable assumptions. The cut-off grade of 0.15 g/t Au was calculated using a gold price of $1,800/oz, mining costs of $1.67/t to $2.27/t, processing cost of $3.1/t, G&A costs of $0.4/t, and metallurgical gold recoveries varying from 30.0% to 86.0% with a silver recovery of 20%. Gold equivalent in the Resource Estimate is calculated using the formula (g/t Au + (g/t Ag ÷ 77.7)).
(5) An average bulk density of 2.6 g/cm³ was assigned to all mineralized rock types.
(6) Inverse Distance cubed interpolation was used with a parent block size of 7.62 m x 7.62 m x 6.10 m.
(7) Rounding as required by reporting guidelines may result in minor apparent discrepancies between tonnes, grades, and contained metal content.
(8) The estimate of mineral resources may be materially affected by geological, environmental, permitting, legal, title, taxation, sociopolitical, marketing, or other relevant issues.
(9) Neither Integra nor Micon' QP is aware of any known environmental, permitting, legal, title-related, taxation, socio-political, marketing, or other relevant issue that could materially affect the mineral resource estimate other than any information already disclosed in this report.
A reasonable economic cut-off grade for resource evaluation at the Mountain View deposit is 0.15 g/t Au. This was determined using the parameters presented in the table below.
In addition to the cut-off grade, an open pit shell optimization was undertaken on the block model to constrain the mineral resources within a conceptual pit shell.
Mountain View Project, Mineral Resource Economic Parameters
Mining Operations
The mine production schedule was created with a cutoff grade of 0.15 g/t of gold applied to all material across both Projects. Various scenarios were run to determine the optimal processing rate. The scenarios ranged from 10,000 t/d to 30,000 t/d, in increments of 5,000 t/d. The best net present value (NPV) for the Wildcat Project was achieved at a processing rate of 30,000 t/d, while the Mountain View Project showed the highest NPV at a rate of 20,000 t/d.
MANAGEMENT’S DISCUSSION & ANALYSIS
For the Three and Nine-Month Periods Ended September 30, 2023 and 2022
To minimize capital requirements and maximize NPV, the two Projects have been designed to share mining and processing resources. Consequently, a processing rate of 30,000 t/d was retained for both Projects. However, due to factors such as high stripping ratios, bench advance rates, and mining rate constraints, the processing capacity at the Mountain View Project is not optimized.
The scheduling process was designed to optimize NPV and internal rate of return (IRR). There is synergy between the Wildcat and Mountain View operations, with shared resources enhancing operational efficiency.
Production at the Wildcat Project is scheduled to commence in Year 1, with construction of Phase 1 of the heap leach pad. The objective is to maximize the processing rate and generate cash to fund the expansion of the leach pad. Additional mining resources will be acquired and allocated to the Mountain View Project from Year 5 to Year 7, during which pre-stripping activities will be initiated. Leachable material will be stockpiled during this period. In Year 7, the Wildcat Project will be completed, and the remaining mining resources will be relocated to the Mountain View Project to increase the mining rate. The processing facilities, including the crusher and plant, will also be relocated from Wildcat to Mountain View, and metal production will commence at the Mountain View site in Year 7.
For the current PEA, owner mining was selected over more costly contract mining. The production schedule, along with additional efficiency factors, performance curves, and productivity rates, was utilized to calculate the hours required for primary mining equipment to meet the production schedule. The primary mining equipment includes drills, loaders, hydraulic shovels, and haul trucks.
In addition to the primary mining equipment, provision has been made for support equipment, blasting equipment, and mine maintenance facilities.
Processing Operations
Run-of-mine (ROM) material will be truck dumped into the primary jaw crusher feed hopper. The undersize ore will be scalped prior to the jaw crusher by a grizzly screen and deposited on the secondary crusher feed conveyor. The undersize ore and primary crushed ore will be screened with oversize crushed by secondary and tertiary cone crushers. Material will then be dosed with lime and conveyor stacked on the leach pad.
The stacked ore will be leveled and ripped by a dozer prior to the deployment of drip emitters. Dilute cyanide solution (NaCN) will be applied to the mineralization. The cyanide solution will flow through the heap by gravity and report to a pregnant solution tank within the pregnant solution pond.
The pregnant solution will be pumped through a series of activated carbon beds to remove the gold. The barren solution will be dosed with additional cyanide and anti-scalant and recirculated back to the heap. The activated carbon will be advanced counter-current to the solution. The loaded carbon will be transferred to an acid wash / elution circuit to remove contaminants and gold from the carbon. The carbon will then be re-introduced to the adsorption circuit. After year 7 of operation, loaded carbon from Wildcat will be shipped by tanker trailers for acid wash / elution at the Mountain View facility.
After stripping of metals at the Adsorption, Desorption, Recovery (ADR) plant, the carbon will be sized, washed in dilute hydrochloric acid, neutralized, regenerated in a kiln, and then recycled into the carbon column. Some additional carbon will be added to account for carbon losses in the system.
Material from the elution circuit will be smelted into doré bars to be sold to a gold refinery.
For each of the Projects, facilities will include a single large leach pad, a single process pond (barren/pregnant pond), an emergency drain-down pond, carbon columns, an ADR plant, a laboratory and the other associated facilities.
Energy requirements were estimated at approximately 49,000,000 kWh/y for Wildcat and approximately 40,400,000 kWh/y for Mountain View. Power will be generated on site, using LNG generators, at an estimated cost of US$0.13/kWh.
MANAGEMENT’S DISCUSSION & ANALYSIS
For the Three and Nine-Month Periods Ended September 30, 2023 and 2022
Reagents and consumables were estimated using the metallurgical testwork performed at McClelland laboratory. Reagent costs were estimated using actual quotes for lime, cyanide and carbon) and benchmark costs for lesser items.
Water will be supplied from wells near the processing facility.
The Wildcat Project processing facility will need approximately 800 gpm (600 gpm at Mountain View) of make-up water to saturate new mineralization stacked, provide dust control, and off-set evaporation. In addition, it is estimated that 100,000 m3 (approximately 80 acre-feet) per year will be required for mining activities (including dust control) per year.
Capital and Operating Costs
The capital cost estimate was developed using current and historical quotes and bulk materials costs based on similar projects, with allowances for the location of the Wildcat and Mountain View Projects relative to materials manufacturing and delivery, available work force and contractor support resources. Two scenarios have been evaluated for the Mountain View Project. The first scenario starts mining at Mountain View two years after Wildcat and progresses concurrently. The relative proximity of the two Projects allows the carbon from Mountain View to be processed at Wildcat. The second scenario begins mining at the Mountain View Project sequentially, following the completion of mining at the Wildcat Project. This scenario allows the mining fleet at Wildcat and most of the processing equipment to be relocated to Mountain View. This scenario is favourable due to the lower capital expenditures.
An operating cost estimate was developed for both the Wildcat and the Mountain View Projects using current reagent market price quotes from local vendors, leaching parameters from metallurgical testing performed by McClelland Laboratories, and operational experience in the local area.
The tables below are from the Company's June 28, 2023 press release and highlights capital expenditures and operating costs.
Wildcat & Mountain View Project Capital Cost Breakdown
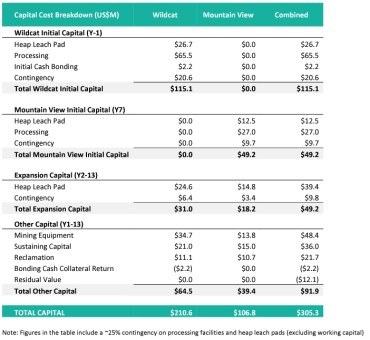
MANAGEMENT’S DISCUSSION & ANALYSIS
For the Three and Nine-Month Periods Ended September 30, 2023 and 2022
Operating Cost, AISC and AIC Breakdown

(1) Includes private royalties and state-level cash taxes
(2) Expansion capital includes heap leach expansion at Wildcat in year 2 and Mountain View in year 9
(3) Non-Sustaining Capital includes initial capital at Wildcat and Mountain View and equipment leases Note: Costs may not reconcile exactly due to rounding
Cash Costs include site operating costs (mining, processing, site G&A), refinery costs and royalties, but exclude corporate G&A and exploration expenses. All-in Sustaining Cost (AISC) includes Cash Costs, sustaining and expansion capital, but excludes corporate G&A and exploration expenses. All-in Cost (AIC) includes AISC level costs, initial capital and equipment finance costs associated with initial capital.
Exploration and Development
Please see "Q3 2023 in Review" and "2023 Outlook" sections above for further details on the Company's current and contemplated exploration and development activities.
Please see the Wildcat and Mountain View technical Report on the Company's website at www.integraresources.com for additional details.
(3) BlackSheep District, Idaho
On February 14, 2019, Integra announced the acquisition of a highly prospective trend of multiple epithermal centers 6 km to the northwest of the DeLamar Project, a trend now referred to as the BlackSheep District ("BlackSheep" or the "District"). The District was identified in part during site visits and research by renowned epithermal geologists Dr. Jeff Hedenquist and Dr. Richard Sillitoe. Dr. Sillitoe and Dr. Hedenquist, along with Integra's exploration team led by Dr. Max Baker, mapped the area and interpreted the District to have undergone very limited erosion since the mid-Miocene mineralization event, suggesting the productive zone of mineralization is potentially located approximately 200 m beneath the surface. Minimal historical exploration did encounter gold-silver in BlackSheep; however, historic drilling was shallow, less than 100 m vertical on average, and did not enter the theorized productive zone.
The BlackSheep District to the northwest of DeLamar is comparable in geographical size to both the DeLamar and Florida Mountain Deposits combined. The nature of the mineralization and alteration in BlackSheep includes extensive sinter deposits surrounding centers of hydrothermal eruption breccia vents associated with high-level coliform banded amorphous to chalcedonic silica with highly anomalous gold, silver arsenic, mercury, antimony and selenium values. In addition to some preliminary rock chip sampling, Integra completed an extensive soil geochemistry grid over the BlackSheep District showing highly anomalous gold and silver trends over significant lengths.
MANAGEMENT’S DISCUSSION & ANALYSIS
For the Three and Nine-Month Periods Ended September 30, 2023 and 2022
The Company completed an extensive regional exploration program at BlackSheep in 2019 and 2020. This regional exploration program included:
• Additional rock-chip sampling and prospect scale mapping
• A regional airborne magnetic and radiometric survey
• Commissioning of the Idaho Geology Department to undertake 1:24,000 scale geological mapping of the DeLamar, Florida Mountain and BlackSheep Districts
• Induced polarization ("IP") survey currently underway
(4) War Eagle Property, Idaho
On January 21, 2019, Integra announced that, through its wholly owned subsidiary, DeLamar Mining Company, it entered into an option agreement with Nevada Select Royalty, Inc. ("Nevada Select"), a wholly owned subsidiary of Ely Gold Royalties, Inc ("Ely Gold") to acquire Nevada Select's interest in a State of Idaho Mineral Lease encompassing the War Eagle gold-silver Deposit ("War Eagle") situated 3 km east of Integra's Florida Mountain Deposit. On June 21, 2021, Gold Royalty Corp. ("GRC") and Ely Gold announced that they have entered into a definitive agreement pursuant to which GRC will acquire all of the issued and outstanding common shares of Ely Gold by way of a statutory plan of arrangement under the Business Corporations Act (British Columbia). The transaction was completed on August 23, 2021.
In the War Eagle Mountain District, Integra had previously acquired the Carton Claim group comprising of six patented mining claims covering 45 acres and located 750 m north of the State Lease.
War Eagle Mountain has a rich history of high-grade gold-silver production dating back to the late 1800's. The War Eagle-Florida-DeLamar geological settings, all hosting low sulphidation epithermal gold-silver are genetically related to the same mineralization forming event that occurred roughly 16 million years ago. The local geology and ore mineralogy found within the low sulphidation epithermal veins on War Eagle Mountain are similar to the regimes found at DeLamar and Florida Mountain to the west. The key difference is the host rock. Historically mined gold and silver in high grade veins at War Eagle was predominately mined and hosted by late Cretaceous age granitic rock. It should be noted that historically, the veins of War Eagle Mountain were of far higher grade compared to any other mining operations in the district, including DeLamar and Florida Mountain. Past production on these high-grade vein systems has outlined strike lengths in excess of 1 km and depth extents of up to 750 meters or more.
The following table highlights several of the best intercepts drilled by Integra at War Eagle.
MANAGEMENT’S DISCUSSION & ANALYSIS
For the Three and Nine-Month Periods Ended September 30, 2023 and 2022
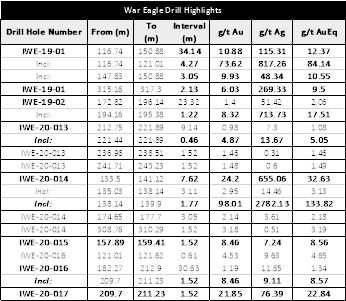
(1) Downhole thickness; true width varies depending on drill hole dip; most drill holes are aimed at intersecting the vein structures close to perpendicular therefore true widths are close to downhole widths (approximately 70% conversion ratio)
(2) Gold equivalent = g Au/t + (g Ag/t ÷ 77.70)
(3) Intervals reported are uncapped
(5) Red Canyon Property, Nevada
Red Canyon is located within the Antelope (Eureka) mining district in Nevada, 52 km northwest of Eureka. The property can be accessed from the town of Eureka by following US Highway 50 west for 40km to 3 Bar Road. This road is then followed north for approximately 50km to the intersection with the Red Canyon access road. Local roads and dirt tracks lead south and east to the main areas of interest on the Red Canyon property. The 6,650-acre land package consists of 348 unpatented claims. The claims are publicly owned lands administered by the U.S. BLM. Gold mineralization at Red Canyon is sediment-hosted, Carlin-style, including deeply oxidized bodies overlying sulfide mineralization. Currently there are no defined mineral resources at Red Canyon, but there are 10 drill-ready targets.
Phase 1 drilling was completed in May 2021. The Phase 1 program consisted of 12 drill holes, totaling ~2,300m, in the Heavenly Target Zone, which is one of ten target areas currently identified on the property.
Observations:
• Drilling has confirmed that the mineralization found at the Heavenly Target Zone consists of stratabound Au mineralization hosted in calcareous siltstone units of the lower plate members of the Roberts Mountains Formation.
• Mineralization is dipping moderately to the southeast and is consistent with the Company's working geological model.
• Mineralization in the Heavenly Target Zone is open to the south and southeast, down-dip in units hosting mineralization.
• Millennial's team is currently conducting data interpretation to refine the Company's 3D Leapfrog geological model focused on favorable structures and stratigraphy to help design the Phase 2 campaign, aimed at expanding the footprint for oxidized Au mineralization at the Heavenly Target Zone.
• Millennial is also mapping and soil sampling other, previously identified, target areas of interest at Red Canyon to identify high-quality drill targets with potential to host oxidized gold mineralization.
MANAGEMENT’S DISCUSSION & ANALYSIS
For the Three and Nine-Month Periods Ended September 30, 2023 and 2022
Red Canyon Drilling Highlights:
• HVN-2021-002RD returned high-grade intercepts of 4.54 g/t Au over 54m, including 9.18 g/t Au over 22m, with local high grades of 19.16 g/t Au over 5m.
• HVN-2021-003 returned high-grade intercepts of 3.01 g/t Au over 11m, including 10.32 g/t Au over 3m, with local high grades of 20.5 g/t Au over 1m.
• HVN-2021-005 returned high-grade intercepts of 4.61 g/t Au over 18m, including 7.42 g/t Au over 8m, with local high grades of 11.47 g/t Au over 1m.
(6) Ocelot Property, Nevada
The Ocelot (historically known as Zeno) property is located within the Shoshone Mountains in Nevada, 57km southwest from the world class Au deposits at Pipeline/Cortez. The 3,515-acre land package consists of 172 unpatented claims on publicly owned lands administered by the U.S. Bureau of Land Management (BLM). Mineralization at Ocelot is strongly representative of a low sulfidation epithermal Au/Ag system, hosted in the Valmy Formation and volcano-sedimentary units overlying local quartzite basement rocks. Several target areas display broad zones of alteration including argilization (quartz-illite) and intense silicification with boiling textures, characteristic of the upper levels in epithermal systems. Several promising target zones at Ocelot display encouraging Au, As, Hg, and other pathfinder element data from previous sampling programs. Mapping reports broad zones of silicification and sinter on the property with assays up to 200 ppb Au. Historical shallow drilling reported intersections up to 0.01 opt Au associated with micro breccia veinlets.
(7) Marr Property, Nevada
The Marr Property is located within Antelope Valley, Nevada, located 60km southwest from the world-class Pipeline deposit. The 1,921-acre land package consists of 93 unpatented claims. The claims are publicly owned lands administered by the U.S. Bureau of Land Management (BLM). Mineralization at Marr is believed to be a low sulfidation, epithermal Au/Ag epithermal. The target area is covered, with historical drilling reporting zones of broad argillic alteration and high-level exposures of a low-sulfidation system, as characterized by chalcedony and opaline veining with sinter terraces. Anomalous Au and pathfinder elements in high-level quartz-chalcedony veins with boiling textures are common.
(8) Eden Property, Nevada
The Eden Property is located on the northwestern side of the East Range in the western Nevada rift, along the Sleeper-Sandman trend. Eden is located 22km southwest of the Town of Winnemucca within Pershing and Humboldt Counties. The 1,223-acre land package consists of 68 unpatented lode claims. The claims are publicly owned lands administered by the U.S. Bureau of Land Management (BLM). Mineralization at Eden represents a low sulfidation, epithermal Au/Ag system. The property can be accessed by a frontage road along Interstate 80. The target is hosted in permeable Cenozoic volcanic and sedimentary rocks cut by basaltic dikes with quartz veins along through-going "plumbing structures".
(9) Dune Property, Nevada
The Dune Property is located in the Humboldt River Valley in the western Nevada rift, along the Sleeper - Sandman trend. Dune is located 18km southwest of the Town of Winnemucca within Humboldt County. The 644-acre land package consists of 36 unpatented claims. The claims are publicly owned lands administered by the U.S. Bureau of Land Management (BLM). Mineralization at Dune consists of low sulfidation, epithermal Au-Ag typical of significant economic Au-Ag deposits of this region of Nevada. The property can be accessed via Jungo Road west from Winnemucca and then by an unimproved road approximately 3km to the south. The target concept is a structurally- and stratigraphically-controlled low sulfidation gold system, hosted by permeable Cenozoic volcanic and sedimentary rocks. A large part of the property is covered by quaternary gravels.
MANAGEMENT’S DISCUSSION & ANALYSIS
For the Three and Nine-Month Periods Ended September 30, 2023 and 2022
(10) Cerro Colorado Property, Arizona
The Cerro Colorado Property is located within a historic silver mining district, 70km southwest of Tucson, Arizona and is situated along the Laramide porphyry copper belt. Cerro Colorado is located 26km southwest of the historical Pima Mining District, which contains several active porphyry copper and skarn mining operations. Seven distinct areas of interest comprise the combined 10,097-acre land package, consisting of 229 BLM claims and 14 Arizona State Land Department (ASLD) mineral exploration permits. Cerro Colorado hosts numerous historical mining operations that exploited Ag-Au (±Cu)-bearing veins hosted by Jurassic and early Laramide volcanic rocks. District-scale and local alteration patterns indicate potential for porphyry copper mineralization within intrusive units beneath the volcanic host rocks. Limited historical drilling in intrusive units adjacent to Integra's areas done by Phelps Dodge and Mine Finders reported weakly mineralized porphyry copper intrusions. Recent academic work in the area suggests a lack of Cenozoic extension and dismemberment in the district, preserving the Ag-Au veins and associated deeper porphyry copper systems upright and intact below older volcanic rocks.
| SELECTED CONSOLIDATED FINANCIAL INFORMATION |
The following table sets forth selected consolidation information of the Company as of September 30, 2023, December 31, 2022, and December 31, 2021, prepared in accordance with IFRS. The selected consolidated financial information should be read in conjunction with the Company's audited annual consolidated financial statements for the years ended December 31, 2022 and 2021.
| Nine-Months Ended September 30, 2023 $ |
Year Ended December 31, 2022 $ |
Year Ended December 31, 2021 $ |
|
| Exploration and evaluation expenses | (17,288,060) | (13,467,035) | (25,797,910) |
| Operating loss | (21,971,272) | (19,212,921) | (31,702,931) |
| Other income (expense) | (48,834) | (594,100) | (1,230,714) |
| Net loss | (22,020,106) | (19,807,021) | (32,933,645) |
| Net loss per share | (0.42) | (0.73) | (1.45) |
| Other comprehensive income (loss) | 103,747 | (663,590) | 480,751 |
| Comprehensive loss | (21,916,359) | (20,470,611) | (32,452,894) |
| Cash and cash equivalents | 14,912,869 | 15,919,518 | 14,337,078 |
| Exploration and evaluation assets | 64,406,445 | 40,801,924 | 56,491,140 |
| Total assets | 84,631,591 | 61,422,237 | 75,160,191 |
| Total current liabilities | 16,290,781 | 15,390,668 | 5,719,241 |
| Total non-current liabilities | 21,027,236 | 24,708,404 | 40,365,947 |
| Working capital (deficit) * | (402,023) | 1,603,220 | 9,387,223 |
| Working capital (deficit) - excluding convertible debt liability |
$9,604,757 | $11,651,434 |
*Working capital includes convertible debt liability. The convertible debt is required to be included under short term liabilities given that it is convertible at the option of the lender. The maturity of the convertible debt is August 2025.
The Company has changed its presentation currency as of December 31, 2021 from the Canadian dollar to the US dollar, to better reflect the Company's business activities and as most of the Company's assets and liabilities are held in its US subsidiaries hence denominated in US dollars. As a result, comparative figures in the consolidated financial statements have been translated into US dollars. No changes were made to the Company's functional currencies, as per the management's assessment based on the IAS 21 recommendations, which will continue to be performed on a quarterly basis.
MANAGEMENT’S DISCUSSION & ANALYSIS
For the Three and Nine-Month Periods Ended September 30, 2023 and 2022
In the current nine-month period, the Company reclassified its site support costs from general and administration expenses to exploration and evaluation expenses. The new classification has not impacted the operating loss, as the Company expenses all exploration and evaluation costs. Comparative numbers have been reclassified to conform with the current's period reclassification.
The operating losses for the nine-month period ended September 30, 2023 and years ended December 31, 2022 and 2021 were mostly driven by exploration and evaluation expenses, as well as head office G&A expenses.
Other income/expenses for the nine-month period ended September 30, 2023 was mostly driven by the interest and accretion expenses related to the convertible debt, and reclamation accretion expenses, partly offset by change in fair value of derivatives (non-cash), rent income, interest income, and foreign exchange gain. Other income/expenses for the year ended December 31, 2022 were mostly driven by the reclamation accretion expenses, interest and accretion expenses related to the convertible debt, partly offset by foreign exchange gain, interest and rent income, and change in fair value of derivatives (non-cash). Other expenses for the year ended December 31, 2021 were mostly due to foreign exchange loss and reclamation accretion expenses, partly offset by interest and rent income.
Other comprehensive income (loss) amounts are related to the foreign exchange translation adjustment.
Total assets in the current nine-month period increased compared to the year ended December 31, 2022, mostly due to an increase in exploration and evaluation assets (related to the acquisition of Millennial). Total assets in the current year ended December 31, 2022 decreased compared to the year ended December 31, 2021, mostly due to a decrease in exploration and evaluation assets (resulting from a reclamation adjustment), partially off-set by a slight increase in cash and pre-paid expenses.
Working capital in the current nine-month period ended September 30, 2023 decreased compared to the year ended December 31, 2022 mostly due to a decrease in cash (due to increased exploration and evaluation expenditures). The Company's working capital in the current period, excluding the convertible debt liability, was $9,604,757. Working capital in the year ended December 31, 2022 decreased compared to the year ended December 31, 2021 due to the convertible debt being classified as a current liability. The Company's working capital, excluding the convertible debt liability, was $11,651,434, which represents an increase compared to the year ended December 31, 2021, mostly due to an increase in cash in the year ended December 31, 2022, as a result of the Company's August 2022 equity financing and proceeds from convertible debt initial advance.
Total current liabilities slightly increased in the current nine-month period ended September 30, 2023 compared to the year ended December 31, 2022, as a result of an increase in convertible host liability (due to increased loan interest rate) as well as increases in trade and other payables. These increases were partially offset by a decrease in the convertible derivative component (due to a decrease in share price). Total current liabilities increased in the year ended December 31, 2022, when compared to the year ended December 31, 2021, due to the convertible debt loan being classified as a current liability, despite the fact that the maturity date of this loan is in August 2025. The Company adopted IAS 1 amendments in 2022 and classified the liability portion of the convertible debt as a current liability, in accordance with these amendments. As a result, the Company reported lower working capital in the year ended December 31, 2022. Total non-current liabilities decreased in the current nine-month period ended September 30, 2023 compared to the year ended December 31, 2022 mostly due to the reclamation liability decrease, partly offset by an increase in long-term lease liability, due to merger in the current period. Total non-current liabilities decreased in the current year ended December 31, 2022 compared to the year ended December 31, 2021 mostly due to a change in reclamation liability assumptions around inflation and discount rates.
The Company spent $17,288,060 in exploration and evaluation activities during the nine-month period ended September 30, 2023 (September 30, 2022 - $9,354,124). In the current nine-month period, the Company reclassified its site support costs to the Exploration and Evaluation expenses. These costs include all the support staff (such as accounting team, site management, safety, equipment operators, etc) and project related G&A costs (such a fee on surety bond, insurance, staff house, Boise office, rental apartment, software and other G&A fees).
MANAGEMENT’S DISCUSSION & ANALYSIS
For the Three and Nine-Month Periods Ended September 30, 2023 and 2022
Historically, the Company has classified those costs as "General & Administration" expenses in the Consolidated statements of operations and comprehensive loss. The reclassification does not impact the operating loss, as the Company also expenses Exploration and Evaluation costs. Comparative numbers have been reclassified to conform with the current's period reclassification. Recognizing that site support costs are integral to the exploration and development project activities, management has carefully evaluated this alignment and concluded that classifying these expenses under Exploration and Evaluation Expenses offers a more accurate and transparent reflection of the nature of those costs. The site support expenses are now reported in the table below.
The following tables outline the Company's exploration and evaluation expense summary for the nine-month periods ended September 30, 2023 and 2022:
Exploration and Evaluation Expense Summary (Nine-Month Ending September 20, 2023):
| Idaho Properties | ||||
| |
DeLamar Project |
Other Idaho deposits |
Joint expenses |
Total Idaho Properties |
| Contract exploration drilling | 2,056,797 | - | - | 2,056,797 |
| Contract met drilling | 1,113,706 | - | - | 1,113,706 |
| Contract condemnation drilling | 425,773 | - | - | 425,773 |
| Contract geotech drilling | 312,147 | - | - | 312,147 |
| Contract ground water drilling | 84,301 | - | - | 84,301 |
| Exploration drilling - other drilling labour & related costs | 949,834 | - | - | 949,834 |
| Met drilling - other drilling | 435,114 | - | - | 435,114 |
| labour & related costs | ||||
| Condemnation drilling - other | 188,013 | - | - | 188,013 |
| drilling labour & related costs | ||||
| Other exploration expenses* | 676,085 | 1,376 | - | 677,461 |
| Other development expenses** | 1,798,741 | - | - | 1,798,741 |
| Land*** | 332,489 | 22,602 | 192,225 | 547,316 |
| Permitting | 3,774,632 | - | - | 3,774,632 |
| Metallurgical test work | 324,250 | - | - | 324,250 |
| Technical reports and engineering | 1,371,587 | - | - | 1,371,587 |
| External affairs/Community engagement | 252,492 | - | - | 252,492 |
| Site support expenses**** | 1,482,942 | - | - | 1,482,942 |
| Total | $ 15,578,903 | $ 23,978 | $ 192,225 | $15,795,106 |
| |
Nevada/Arizona Properties | ||||||||||||||
| Wildcat | Mountain View |
Other Nevada & Arizona |
Joint expenses |
Total Nevada / Arizona Properties |
|||||||||||
| Contract exploration drilling | - | - | - | - | - | ||||||||||
| Contract met drilling | - | - | - | - | - | ||||||||||
| Contract condemnation drilling | - | - | - | - | - | ||||||||||
| Contract geotech drilling | - | - | - | - | - | ||||||||||
| Contract ground water drilling | - | - | - | - | - | ||||||||||
| Exploration drilling - other drilling labour & related costs | - | - | - | - | - | ||||||||||
| Met drilling - other drilling | - | - | - | - | - | ||||||||||
| labour & related costs | |||||||||||||||
| Condemnation drilling - other | - | - | - | - | - | ||||||||||
| drilling labour & related costs | |||||||||||||||
| Other exploration expenses* | 4,429 | 7,553 | 54,481 | - | 66,463 | ||||||||||
| Other development expenses** | 57,081 | 30,886 | - | 290,824 | 378,791 | ||||||||||
| Land*** | 171,503 | 60,478 | 249,345 | - | 481,326 | ||||||||||
| Permitting | 154,341 | 24,955 | - | - | 179,296 | ||||||||||
| Metallurgical test work | 5,497 | 1,727 | - | - | 7,224 | ||||||||||
| Technical reports and engineering | 115,780 | 70,380 | - | - | 186,160 | ||||||||||
| External affairs/Community engagement | - | - | - | 37,607 | 37,607 | ||||||||||
| Site support expenses**** | - | - | - | 156,087 | 156,087 | ||||||||||
| Total | $ | 508,631 | $ | 195,979 | $ | 303,826 | $ | 484,518 | $ | 1,492,954 | |||||
*Includes mapping, IP, sampling, payroll, exploration G&A expenses, consultants
**Includes development G&A expenses and payroll
***Includes BLM, Idaho Department of Land and Arizona State Lands Department annual fees, consulting, property taxes, legal, etc. expenses
****Includes site G&A expenses
MANAGEMENT’S DISCUSSION & ANALYSIS
For the Three and Nine-Month Periods Ended September 30, 2023 and 2022
Exploration and Evaluation Expense Summary (Nine-Month Ending September 20, 2022):
| Idaho Properties | ||||||||||||
| |
DeLamar Project |
Other Idaho deposits |
Joint expenses |
Total |
||||||||
| Contract exploration drilling | $ | 489,656 | $ | - | $ | - | $ | 489,656 | ||||
| Contract metallurgical drilling | 657,499 | - | - | 657,499 | ||||||||
| Contract condemnation drilling | 216,877 | - | - | 216,877 | ||||||||
| Exploration drilling - other drilling labour & related costs | 563,159 | 10,779 | - | 573,938 | ||||||||
| Metallurgical drilling - other drilling labour & related costs | 310,344 | - | - | 310,344 | ||||||||
| Condemnation drilling - other | 298,881 | - | - | 298,881 | ||||||||
| drilling - labour & related costs | ||||||||||||
| Other exploration expenses* | 751,627 | - | - | 751,627 | ||||||||
| Other development expenses** | 1,351,421 | - | - | 1,351,421 | ||||||||
| Land*** | 252,778 | 22,602 | 221,770 | 497,150 | ||||||||
| Permitting | 2,127,565 | - | - | 2,127,565 | ||||||||
| Metallurgical test work | 164,563 | - | - | 164,563 | ||||||||
| Technical reports and engineering | 624,665 | - | - | 624,665 | ||||||||
| External affairs/Community engagement | 196,527 | - | - | 196,527 | ||||||||
| Site support expenses**** | 1,093,411 | - | - | 1,093,411 | ||||||||
| Total | $ | 9,098,973 | $ | 33,381 | $ | 221,770 | $ | 9,354,124 | ||||
*Includes mapping, IP, sampling, payroll, exploration G&A expenses, consultants
**Includes development G&A expenses and payroll
***Includes BLM and IDL annual fees, consulting, property taxes, legal, etc. expenses
****Includes site G&A expenses
| RESULTS OF OPERATIONS |
NINE-MONTH PERIOD ENDED SEPTEMBER 30, 2023
Net loss for the nine-month period ended September 30, 2023 was $22,020,106 and the comprehensive loss $21,916,359, compared to a net loss of $13,602,301 and a comprehensive loss of $14,425,037 for the nine-month period ended September 30, 2022.
Overall, operating expenses were higher in the current nine-month period mostly due to an increase in exploration and development expenses. Other expenses were higher in the current nine-month period (other expenses) comparing to the same period last year (other income) mostly due to higher convertible debt interest and accretion expenses, partly offset by higher interest income and change in fair value of derivatives (non-cash).
MANAGEMENT’S DISCUSSION & ANALYSIS
For the Three and Nine-Month Periods Ended September 30, 2023 and 2022
In the current nine-month period, the Company reclassified its site support costs from general and administration expenses to the exploration and evaluation expenses. Comparative numbers have been reclassified to conform with the current's period reclassification.
The variances between these two periods were primarily due to the following items:
- Exploration and evaluation expenses: the Company incurred $17,288,060 in exploration and development expenses during the nine-month period ended September 30, 2023 (September 30, 2022 - $9,354,124). The difference is mostly due to increased drilling, permitting and engineering activities in the current nine-month period.
- Stock-based compensation: the Company incurred $758,154 in stock-based compensation in the current nine-month period (September 30, 2022 - $1,396,620). The variance is due to the timing of vesting of equity incentive awards granted from 2018 to 2023.
- Compensation and benefits: these expenses amounted to $1,744,665 in the current nine-month period (September 30, 2022 - $1,318,444). The increase is mostly due to the salary expenses and bonus accruals for the new corporate employees retained in connection with the Millennial Acquisition.
- Office and administration: the Company incurred $577,189 in expenses during the current nine-month period (September 30, 2022 - $342,475). The difference is mostly due to the higher costs related to the sustainability report, additional IT support, and increased travel to the project sites in the current nine-month period.
- Professional fees: the Company incurred $360,025 in expenses during the current nine-month period (September 30, 2022 - $228,170). The difference is mostly due to higher accounting, tax, and consulting fees in the current period. These fees are mostly related to the Millennial Acquisition.
- Corporate development and marketing: the Company incurred $303,359 in expenses during the current nine-month period (September 30, 2022 - $193,111). The difference is due to increased marketing activities in the current period.
THREE-MONTH PERIOD ENDED SEPTEMBER 30, 2023
Net loss for the three-month period ended September 30, 2023 was $8,073,415 and the comprehensive loss $7,734,095, compared to a net loss of $3,305,706 and a comprehensive loss of $4,049,874 for the three-month period ended September 30, 2022.
Overall, operating expenses were higher in the current three-month period mostly due to an increase in exploration and development expenses. Other expenses were higher in the current three-month period (other income) comparing to the same period last year (other income) mostly due to higher convertible interest and accretion expenses and foreign exchange loss vs foreign exchange gain in a comparative period, partially off-set by higher interest income and change in fair value of derivatives (non-cash). The variances between these two periods were primarily due to the following items:
- Exploration and evaluation expenses: the Company incurred $6,621,925 in exploration and development expenses during the current quarter (September 30, 2022 - $2,505,754). The difference is mostly due to increased drilling, permitting and engineering activities in the current three-month period.
- Stock-based compensation: the Company incurred $234,773 in stock-based compensation in the current three-month period (September 30, 2022 - $460,816). The variance is due to the timing of vesting of equity incentive awards granted from 2018 to 2023.
MANAGEMENT’S DISCUSSION & ANALYSIS
For the Three and Nine-Month Periods Ended September 30, 2023 and 2022
- Compensation and benefits: these expenses amounted to $599,885 in the current three-month period (September 30, 2022 - $421,841). The increase is mostly due to the salary expenses and bonus accruals for the new corporate employees retained in connection with the Millennial Acquisition.
- Office and administration: the Company incurred $202,211 in expenses during the current three-month period (September 30, 2022 - $103,193). The difference is mostly due to the higher costs related to the sustainability report, additional IT support, and increased travel to the project sites in the current quarter.
Operating Activities
Net cash used by the Company in operating activities for the nine-month period ended September 30, 2023 was $20,866,084 (September 30, 2022 - $13,775,594). The variance between these two periods was mostly driven by higher exploration and development expenditures in the current period.
Investing Activities
Net cash used in investing activities for the nine-month period ended September 30, 2023 was $3,908,883 (September 30, 2022 - $19,180 (provided by)). The difference between these two periods was mostly due a cash land payment of $2.5 million to Waterton (final acquisition payment related to Wildcat and Mtn View properties), $0.2 million for the Cerro Colorado (Arizona) option payment, and capitalized legal and due diligence fees related to the Millennial Acquisition.
Financing Activities
Net cash provided by financing activities in the current nine-month period ended September 30, 2023 was $23,768,318 (September 30, 2022 - $19,941,668). The difference between these two periods was mostly due to higher equity financings completed in 2023. The Company raised net proceeds of approximately $25 million in 2023 through the brokered and non-brokered private placements.
The Company raised net proceeds of approximately $19.3 million (net) in August 2022 through a bought deal financing and a convertible loan. The table below summarized the expected use of proceeds:
| August 2022 Financing |
Expected Use of Proceeds ($M) Mid-August 2022 to May 2023 |
Actual Use of Proceeds ($M) (1) September 2022 to June 2023 |
Variance ($M) |
| Exploration work, including drilling | $6.1 | $5.3 | ($0.8) |
| Development work, including engineering and permitting | $7.1 | $8.0 | $0.9 |
| Other Site Costs (field costs, land acquisition, land holdings, site G&A, infrastructure, etc.) | $2.1 | $2.3 | $0.2 |
| Site Ongoing Environmental Monitoring / Water Treatment | $1.2 | $1.0 | ($0.2) |
| Corporate G&A | $2.8 | $3.3 | $0.5 |
| Total | $19.3 | $19.9 | $0.6 |
(1) Actual Use of Proceeds includes actual expenditures from September 2022 to June 30, 2023.
The Company raised net proceeds of approximately $16.0 million (net) in September 2021 through a bought deal financing. The table below summarized the expected use of proceeds:
MANAGEMENT’S DISCUSSION & ANALYSIS
For the Three and Nine-Month Periods Ended September 30, 2023 and 2022
| September 2021 Financing |
Expected Use of Proceeds ($M) September 2021 to May 2022 |
Actual Use of Proceeds ($M) (1) September 2021 to August 2022 |
Variance ($M) |
| Exploration work, including drilling | $7.0 | $3.5 | ($3.5) |
| Development work, including engineering and permitting | $4.9 |
$5.7 | $0.8 |
| Other Site Costs (field costs, land acquisition, land holdings, site G&A, infrastructure, etc.) | $1.2 | $2.5 | $1.3 |
| Site Ongoing Environmental Monitoring / Water Treatment | $0.9 | $1.3 | $0.4 |
| Corporate G&A | $2.0 | $2.8 | $0.8 |
| Total | $16.0 | $15.8 | ($0.2) |
(1) Actual Use of Proceeds includes actual expenditures from September 2021 to August 2022.
| SUMMARY OF SELECTED QUARTERLY INFORMATION |
The following table sets forth selected quarterly financial information for each of the last eight quarters *.
| Quarter Ending | Revenue ($) |
Net Loss ($) |
Net Loss Per Share ($) |
| September 30, 2023 | Nil | (8,073,415) | (0.12) |
| June 30, 2023 | Nil | (7,303,460) | (0.11) |
| March 31, 2023 | Nil | (6,643,231) | (0.19) |
| December 31, 2022 | Nil | (6,204,720) | (0.20) |
| September 30, 2022 | Nil | (3,305,706) | (0.11) |
| June 30, 2022 | Nil | (4,509,761) | (0.17) |
| March 31, 2022 | Nil | (5,786,834) | (0.23) |
| December 31, 2021 | Nil | (7,200,497) | (0.28) |
*Previous quarters net loss per share data adjusted to reflect the 2.5 to 1 share consolidation completed in May 2023.
The net loss for last eight quarters was mostly driven by exploration and development expenses, corporate G&A expenses (such as compensation, corporate development and marketing, office and administration, professional, and regulatory fees), and stock-based compensation expenses (non-cash item), partly offset by interest and rent income. A foreign exchange gain was recorded in the first and second quarters of 2023 and second and third quarters of 2022. The net loss for all quarters since the third quarter of 2022 also included accretion expenses and interest expense accrual related to the convertible debt, as well as change in fair value of derivatives (all three are non-cash items)
| LIQUIDITY AND CAPITAL RESOURCES |
The Company does not have a mineral property in production and consequently does not receive revenue from the sale of precious metals. The Company currently has no operations that generates cash flow. The Company has financed its operations primarily through the issuance of share capital and convertible debt. The continued operations of the Company are dependent on its ability to complete sufficient public equity financing or generate profitable operations in the future.
The Company's working capital deficit, including the convertible debt liability as of September 30, 2023 was $402,023 (December 31, 2022 - working capital $1,603,220). The Company's working capital, excluding the convertible debt liability as of September 30, 2023 was $9,604,757 (December 31, 2022 - working capital $11,651,434). Working capital in the current nine-month period ended September 30, 2023 decreased compared to the year ended December 31, 2022 mostly due to a decrease in cash in 2023 (due to increased exploration and evaluation expenditures).
The Company actively manages its liquidity using budgeting based on expected cash flows to ensure there are appropriate funds for meeting short term obligations during the year.
MANAGEMENT’S DISCUSSION & ANALYSIS
For the Three and Nine-Month Periods Ended September 30, 2023 and 2022
| FINANCIAL INSTRUMENTS |
All financial instruments are required to be measured at fair value on initial recognition. The fair value is based on quoted market prices, unless the financial instruments are not traded in an active market. In this case, the fair value is determined by using valuation techniques like the Black-Scholes option pricing model or other valuation techniques. Measurement in subsequent periods depends on the classification of the financial instrument. A description of financial instruments and their fair value is included in the audited consolidated financial statements for the years ended December 31, 2022 and 2021, filed on SEDAR+ at www.sedarplus.ca and on Integra's website at www.integraresources.com.
| COMMITMENTS AND CONTRACTUAL OBLIGATIONS |
There are a number of the net smelter returns, royalties, advance minimum royalties, annual claim filings, and work commitments on the Company's properties. Summaries of all those commitments are included in Note 16 of the Company's unaudited interim condensed financial statements for the three and nine-month periods ended September 30, 2023 and 2022.
| ACQUISITION OF MILLENNIAL PRECIOUS METALS CORP. |
On February 26, 2023, the Company entered into a definitive plan of arrangement (the "Plan of Arrangement") with MPM pursuant to which Integra acquires all of the issued and outstanding common shares of MPM (the "Transaction"). Each MPM shareholder was entitled to receive 0.092 common share (post Consolidation) of Integra for each share of MPM held. Each stock option of MPM was exchanged in accordance with the Plan of Arrangement. The Transaction was approved by the securityholders of MPM on April 26, 2023 and closed on May 4, 2023. In connection with the Plan of Arrangement, the Company issued 16,872,050 shares in exchange of MPM common shares, 764,704 stock options to replace MPM stock options and assumed 21,903,504 MPM warrants (convertible into 2,015,122 Integra shares). Based on the closing share price of Integra on May 4, 2023, the fair value of the consideration, including transaction costs, was $23,996,732.
The transaction is accounted for as an asset acquisition and the allocation of the purchase price to the assets acquired and liabilities assumed is based on estimated fair values at the time of acquisition.
As Integra was required to replace Millennial's stock options under the terms of the Transaction, and it accounted for the exchange of instruments as a modification of share-based payment awards. The purchase consideration includes the portion of the fair value of the Integra replacement options that relates to services prior to the acquisition. The fair value of the replacement options was calculated using the Black Scholes option pricing model with the weighted average assumptions of expected volatility of 51.99% - 61.47%, risk free interest rate of 3.15% - 4.43% and expected life of 1.0 and 3.07 years. Integra also assumed 21,903,504 MPM warrants (convertible into 2,015,122 Integra shares). The fair value of the MPM warrants on May 4, 2023 was calculated using the Black Scholes option pricing model with the weighted average assumptions of expected volatility of 59.03%, risk free interest rate of 4.22% and expected life of 1.12 years.
MANAGEMENT’S DISCUSSION & ANALYSIS
For the Three and Nine-Month Periods Ended September 30, 2023 and 2022
Current allocation of the purchase price to the estimated fair value of the assets and liabilities of MPM is as follows:
| Purchase price: |
May 4, 2023 | Q3 2023 adjustments* |
Total - September 30, 2023 |
|||||||
| Issuance of 16,872,050 shares of Integra to Millennial's shareholders | $ | 22,697,554 | $ | - | $ | 22,697,554 | ||||
| Issuance of 764,704 options of Integra to Millennial's option holders | 31,888 | - | 31,888 | |||||||
| Fair value of Millennial warrants assumed by Integra | 44,630 | - | 44,630 | |||||||
| Transaction costs | 1,222,660 | - | 1,222,660 | |||||||
| $ | 23,996,732 | $ | - | $ | 23,996,732 | |||||
| Fair value of assets and liabilities acquired: |
||||||||||
| Cash | 323,884 | - | 323,884 | |||||||
| Receivables | 103,234 | (5,174 | ) | 98,060 | ||||||
| Prepaids | 19,278 | - | 19,278 | |||||||
| Restricted cash | 154,630 | - | 154,630 | |||||||
| Security and reclamation deposits | 45,395 | (2,080 | ) | 43,315 | ||||||
| Lease receivable | 208,701 | - | 208,701 | |||||||
| Right of use assets | 377,071 | - | 377,071 | |||||||
| PP & E | 264,375 | - | 264,375 | |||||||
| Exploration and evaluation assets | 24,484,463 | 10,497 | 24,494,960 | |||||||
| Accounts payable and accrued liabilities | (1,328,458 | ) | (3,243 | ) | (1,331,701 | ) | ||||
| Lease liability | (542,293 | ) | - | (542,293 | ) | |||||
| Provision for site reclamation and remediation | (113,548 | ) | - | (113,548 | ) | |||||
| $ | 23,996,732 | $ | - | $ | 23,996,732 | |||||
*Q3 2023 immaterial adjustments were due to May 4, 2023 accounts receivable/accounts payable reversals and invoices related to the merger, received post-closing, which resulted in a $10,497 increase of the exploration and evaluation assets.
| TRANSACTIONS WITH RELATED PARTIES |
Related parties include the Board of Directors, CEO, CFO, COO and enterprises that are controlled by these individuals.
As September 30, 2023, $650,313 (December 31, 2022 - $636,555) was due to related parties for payroll expenses, consulting fees, bonuses accruals, vacation accruals and other expenses. Receivables from related parties (related to rent and office expenses) as of September 30, 2023 were $26,285 (December 31, 2022 - $18,843) and was recorded in receivables.
Key Management Compensation:
Key management personnel include those persons having authority and responsibility for planning, directing, and controlling the activities of the Company as a whole. The Company has determined that key management personnel consist of executive and non-executive members of the Company's Board of Directors, CEO, CFO, and COO.
Remuneration attributed to executives and directors for the nine-month periods ended September 30, 2023 and 2022 were as follows:
| September 30, 2023 |
September 30, 2022 |
|||||
| Short-term benefits* | $ | 1,336,775 | $ | 1,230,308 | ||
| Associate companies** | 2,301 | (13,498 | ) | |||
| Stock-based compensation | 403,818 | 931,335 | ||||
| Total | $ | 1,742,894 | $ | 2,148,145 |
*Short-term employment benefits include salaries, consulting fees, vacation accruals and bonus accruals for key management. It also includes directors' fees for non-executive members of the Company's Board of Directors.
**Net of payable/receivable/GST due to/from entities for which Integra's directors are executives, mostly related to rent and office expenses.
MANAGEMENT’S DISCUSSION & ANALYSIS
For the Three and Nine-Month Periods Ended September 30, 2023 and 2022
In the current nine-month period ended September 30, 2023, the Company issued 58,756 deferred share units to certain directors, in lieu of their directors' fees, as elected by those directors. Each DSU has been fair valued at Integra's closing share price at the end of quarter. The share-based payment related to these DSUs is included in the above table under stock-based compensation.
In the nine-month period ended September 30, 2022, the Company issued 49,179 deferred share units to certain directors, in lieu of their directors' fees, as elected by those directors. Each DSU has been fair valued at Integra's closing share price at the end of quarter. The share-based payment related to these DSUs is included in the above table under stock-based compensation.
The option to receive DSUs in lieu of cash directors' fees was introduced in 2021 in order to encourage insiders' ownership. DSUs granted before December 2021 vested in full at the grant date. DSUs granted in December 2021 and going forward will vest in 12 months.
| CONVERTIBLE DEBT FACILITY |
On July 28, 2022, the Company executed a credit agreement with Beedie Investment Ltd. (the "Lender"), for the issuance of a non-revolving term convertible debt facility (the "Convertible Facility") in the principal amount up to $20 million. On August 4, 2022, an initial advance of $10 million was drawn under this facility, with the Company having the option to draw "subsequent advances" in increments of at least $2.5 million, up to an additional $10 million, subject to certain conditions.
In connection with the closing of the Merger with Millennial, the original Convertible Facility was amended on May 4, 2023 to accommodate the assets of Millennial and its subsidiaries, each of which, following the closing of the Merger, are loan parties and provide guarantees and security for the obligations under the loan agreement. The amended agreement modified the conversion price on the initial advance from $2.25 (adjusted for the Consolidation) to $1.73 (adjusted for the Consolidation) and increased the coupon interest rate from 8.75% to 9.25% per annum on the loan outstanding, which interest continues to be accrued for the first twenty-four (24) months from the date of the Loan Agreement, payable quarterly either in shares or in cash, at Integra's election.
Summaries of the convertible debt facility for the nine-month period ended September 30, 2023 and the year ended December 31, 2022 are included in the Company's unaudited interim condensed consolidated financial statements for the three and nine-month periods ended September 30, 2023 and 2022.
| OUTSTANDING SHARE DATA |
Share capital details are included in the Company's unaudited interim condensed consolidated financial statements for the three and nine-month periods ended September 30, 2023 and 2022.
The following table outlines the outstanding share data as of the date of this MD&A:
| November 14, 2023 |
|
| Issued and outstanding common shares | 68,777,526 |
| Outstanding Options/RSUs/DSUs to purchase common shares | 2,767,147 |
| Shares Issuable in exchange for Warrants ** | 2,015,122 |
| Issued and outstanding common shares (fully diluted) | 73,559,795 |
** 21,903,504 warrants outstanding, each exercisable for 0.092 ITR shares per 1 warrant.
MANAGEMENT’S DISCUSSION & ANALYSIS
For the Three and Nine-Month Periods Ended September 30, 2023 and 2022
| CRITICAL ACCOUNTING JUDGMENTS AND ESTIMATES |
The preparation of the consolidated financial statements in conformity with IFRS requires management to make judgments, estimates and assumptions which affect the reported amounts of assets and liabilities, the disclosure of contingent assets and liabilities at the date of the audited consolidated financial statements and the reported amounts of revenues and expenses during the reporting period. Estimates are based on historical experience and other factors considered to be reasonable and are reviewed on an ongoing basis. Revisions to estimates and the resulting effects on the carrying amounts of the Company's assets and liabilities are accounted for prospectively.
Measurement uncertainties are described in the Company's audited annual consolidated financial statements for the years ended December 31, 2022 and 2021.
| CHANGES IN ACCOUNTING POLICIES |
The Company's accounting policies are in accordance with IFRS and described in the Company's annual audited consolidated financial statements for the years ended December 31, 2022 and 2021.
| RISKS AND UNCERTAINTIES |
The Company is subject to a number of risks and uncertainties due to the nature of its business. The Company's exploration activities expose it to various financial and operational risks that could have a significant impact on its level of operating cash flows in the future.
Readers are advised to study and consider risk factors disclosed in the Company's Form 20-F for the fiscal year ended December 31, 2022, dated March 17, 2023 and available under the Company's issuer profile on SEDAR+ at www.sedarplus.ca.
Readers are also advised to study and consider risk factors disclosed in the Millennial Precious Metals Corp management's discussion and analysis for the fiscal year ended December 31, 2022, dated April 28, 2023 and available under Millennial Precious Metals Corp's issuer profile on SEDAR+ at www.sedarplus.ca.
Limitations on the Mineral Resource and Reserve Estimates
The Company's Mineral Resources and Mineral Reserves are estimates only and are based on estimates of mineral content and quantity derived from limited information acquired through drilling and other sampling methods and require judgmental interpretations of geology, structure, grade distributions and trends and other factors. The Company's Mineral Resource and Mineral Reserve estimates may be materially affected by environmental, permitting, legal, title, taxation, socio-political, marketing and other factors. There are numerous uncertainties inherent in estimating Mineral Resources and Mineral Reserves, including many factors beyond the Company's control. Estimation is a subjective process, and the accuracy of the Company's Mineral Resource or Mineral Reserve estimate is a function of the quantity and quality of available data, and of the assumptions made and judgments used in engineering and geological interpretation of that data and the level of congruence with the actual size and characteristics of the Company's deposits. No assurance can be given that the estimates are accurate or that the indicated level of metal will be produced. Actual mineralization or geological formations may be different from those predicted. Further, it may take many years before production is possible, and during that time the economic feasibility of exploiting a discovery may change. These estimates may, therefore, require adjustments or downward revisions based upon further exploration or development work, drilling or actual production experience.
Fluctuations in gold and silver prices, results of drilling, metallurgical testing and production, the evaluation of mine plans after the date of any estimate, permitting requirements or unforeseen technical or operational difficulties may require revision of the Company's Mineral Resource and Mineral Reserve estimates. Prolonged declines in the market price of gold or silver may render Mineral Reserves containing relatively lower grades of mineralization uneconomical to recover and could materially reduce the Company's Mineral Reserves. Mineral Resource estimates are based on drill hole information, which is not necessarily indicative of conditions between and around the drill holes. Accordingly, such Mineral Resource estimates may require revision as more geologic and drilling information becomes available and as actual production experience is gained. Mineral Resources and Mineral Reserves should not be interpreted as assurances of LOM or of the profitability of future operations. There is a degree of uncertainty in estimating Mineral Resources and Mineral Reserves and of the grades and tonnages that are forecast to be mined and, as a result, the grade and volume of gold or silver that the Company mines, processes and recovers may not be the same as currently anticipated. Any material reductions in estimates of Mineral Resources and Mineral Reserves, or of the Company's ability to economically extract these Mineral Reserves, could have a material adverse effect on the Company's projects and the Company's business, financial condition, results of operations, cash flows or prospects.
MANAGEMENT’S DISCUSSION & ANALYSIS
For the Three and Nine-Month Periods Ended September 30, 2023 and 2022
Mineral Resources are not Mineral Reserves and have a greater degree of uncertainty as to their existence and feasibility. Mineral Resources that are not Mineral Reserves do not have demonstrated economic viability. There is no assurance that Mineral Resources will be upgraded to Proven or Probable Mineral Reserves. Inferred Mineral Resources have a substantial degree of uncertainty as to their existence, and economic and legal feasibility. Accordingly, there is no assurance that Inferred Mineral Resources reported herein will ever be upgraded to a higher category. Investors are cautioned not to assume that part or all of an Inferred Mineral Resource exists, or is economically or legally mineable.
| CAUTIONARY NOTE TO US INVESTORS WITH RESPECT TO MINERAL RESOURCES |
National Instrument 43-101 - Standards of Disclosure for Mineral Projects ("NI 43-101") is a rule of the Canadian Securities Administrators which establishes standards for all public disclosure an issuer makes of scientific and technical information concerning mineral projects. Technical disclosure contained in this MD&A has been prepared in accordance with NI 43-101 and the Canadian Institute of Mining, Metallurgy and Petroleum Classification System. These standards differ from the requirements of the U.S. Securities and Exchange Commission ("SEC") and resource information contained in this MD&A may not be comparable to similar information disclosed by domestic United States companies subject to the SEC's reporting and disclosure requirements.
| NON-IFRS MEASURES |
Alternative performance measures in this MD&A such as "cash cost", "AISC" "free cash flow" are furnished to provide additional information. These non-IFRS performance measures are included in this MD&A because these statistics are used as key performance measures that management uses to monitor and assess performance of the Company's projects, and to plan and assess the overall effectiveness and efficiency of mining operations. These performance measures do not have a standard meaning within IFRS and, therefore, amounts presented may not be comparable to similar data presented by other mining companies. These performance measures should not be considered in isolation as a substitute for measures of performance in accordance with IFRS. As the Company has yet to commence production, the equivalent historical non-IFRS financial measure is $0.
Cash Costs
Cash costs include site operating costs (mining, processing, site G&A), refinery costs and royalties. While there is no standardized meaning of the measure across the industry, the Company believes that this measure is useful to external users in assessing operating performance.
MANAGEMENT’S DISCUSSION & ANALYSIS
For the Three and Nine-Month Periods Ended September 30, 2023 and 2022
All-In Sustaining Cost ("AISC")
Site level AISC include cash costs (see description above) and sustaining capital but excludes head office G&A and exploration expenses. The Company believes that this measure is useful to external users in assessing operating performance and the Company's ability to generate free cash flow from current operations.
Free Cash Flow
Free cash flows are revenues net of operating costs, royalties, capital expenditures and cash taxes. The Company believes that this measure is useful to the external users in assessing the Company's ability to generate cash flows from the Company's projects.
Working Capital
The Company has included a non-IFRS measure for "working capital" in this MD&A to supplement its financial statements, which are presented in accordance with IFRS. The Corporation believes that this measure provides investors with an improved ability to evaluate the performance of the Corporation. Non-IFRS measures do not have any standardized meaning prescribed under IFRS. Therefore, such measures may not be comparable to similar measures employed by other companies. The data is intended to provide additional information and should not be considered in isolation or as a substitute for measures of performance prepared in accordance with IFRS.
| TECHNICAL INFORMATION |
The scientific and technical information contained in this MD&A has been reviewed and approved by Raphael Dutaut (Ph.D., P.Geo, OGQ Membership 1301), Vice President Exploration, and Timothy Arnold (P.E.), Chief Operating Officer, who are a "Qualified Person" ("QP") as defined in National Instrument 43-101 - Standards of Disclosure for Mineral Projects.
| CORPORATE GOVERNANCE |
Management and the Board recognizes the value of good corporate governance and the need to adopt best practices. The Corporation is committed to continuing to improve its corporate governance practices in light of its stage of development and evolving best practices and regulatory guidance.
The Board has adopted a Board mandate outlining its responsibilities and defining its duties. The Board has five committees: the Audit Committee, the Compensation Committee, the Nomination and Corporate Governance Committee, the Technical and Safety Committee, and the Environmental Social Governance Committee. Each Committee has a committee charter, which outlines the Committee's mandate, procedures for calling a meeting, and provides access to outside resources.
The Board has also adopted a Code of Business Conduct and Ethics, which governs the ethical behavior of all employees, management, and directors. For more details on the Company's corporate governance practices, please refer to Integra's website (www.integraresources.com) and the statement of Corporate Governance contained in Integra's Management Information Circular dated May 16, 2022. The Management Information Circular is available on Integra's website (www.integraresources.com) and on SEDAR+ (www.sedarplus.ca).
The Corporation's Directors have expertise in exploration, metallurgy, mining, financial reporting and accounting, M&A, financing, permitting and government relations, mine development and mine operations, environmental considerations, human resources, governance, and relations with tribal nations and local communities. The Board meets at least four times per year.
MANAGEMENT’S DISCUSSION & ANALYSIS
For the Three and Nine-Month Periods Ended September 30, 2023 and 2022
| CONTROL AND PROCEDURES |
Disclosure Controls and Procedures
Disclosure controls and procedures are designed to provide reasonable assurance that material information is gathered and reported to management, as appropriate to allow for timely decisions about public disclosure. The Company has disclosure controls and procedures in place to provide reasonable assurance that any information required to be disclosed by the Company under securities legislation is recorded, processed, summarized, and reported within the applicable time periods and that required information is accumulated and communicated to the Company's management, so that decisions can be made about the timely disclosure of that information.
Management has evaluated the effectiveness of the design and operation of the Company's disclosure controls as of September 30, 2023 and concluded that the disclosure controls and procedures were effective.
Internal Controls over Financial Reporting
Management is responsible for establishing and maintaining adequate internal controls over financial reporting as such term is defined in the rules of the National Instrument 52-109 in Canada ("NI 52-109") and Rules 13a-15(f) and 15d-15(f) of the United States Securities Exchange Act of 1934, as amended. The Company's internal controls over financial reporting is designed to provide reasonable assurance regarding the reliability of the Company's financial reporting for external purposes in accordance with IFRS as issued by the IASB.
Based on the criteria set forth in Internal Control - Integrated Framework (2013) issued by the Committee of Sponsoring Organizations of the Treadway Commission, the Company's internal controls over financial reporting include:
(a) Maintaining records, that in reasonable detail, accurately and fairly reflect our transactions and dispositions of the assets of the Company;
(b) Providing reasonable assurance that transactions are recorded as necessary for preparation of the consolidated financial statements in accordance with IFRS as issued by the IASB;
(c) Providing reasonable assurance that receipts and expenditures are made in accordance with authorizations of management and the directors of the Company; and
(d) Providing reasonable assurance that unauthorized acquisition, use or disposition of Company assets that could have a material effect on the Company's consolidated financial statements would be prevented or detected on a timely basis.
Management has evaluated the effectiveness of the internal controls over financial reporting as of September 30, 2023 and concluded that those controls were effective.
Limitation of Controls and Procedures
Management believes that any disclosure controls and procedures or internal control over financial reporting, no matter how well designed and operated, have their inherent limitations. Due to those limitations (resulting from unrealistic or unsuitable objectives, human judgment in decision making, human errors, management overriding internal control, circumventing controls by the individual acts of some persons, by collusion of two or more people, external events beyond the entity's control), internal control can only provide reasonable assurance that the objectives of the control system are met.
The design of a control system must reflect the fact that there are resource constraints, and the benefits of controls must be considered relative to their costs. Due to the inherent limitations in a cost-effective control system, misstatements due to error or fraud may occur and not be detected.
MANAGEMENT’S DISCUSSION & ANALYSIS
For the Three and Nine-Month Periods Ended September 30, 2023 and 2022
There were no changes in internal controls of the Company during the nine-month period ended September 30, 2023 that have materially affected, or are likely to materially affect, the Company's internal control over financial reporting.
| INFORMATION REGARDING FORWARD-LOOKING STATEMENTS |
Certain information set forth in this MD&A contains "forward‐looking statements" and "forward‐looking information" within the meaning of applicable Canadian securities legislation and applicable United States securities laws (referred to herein as forward‐looking statements). Except for statements of historical fact, certain information contained herein constitutes forward‐looking statements which includes, but is not limited to, statements with respect to: the potential benefits to be derived from the Transaction, including, but not limited to, the goals, synergies, strategies, opportunities, profile, mineral resources and potential production, project timelines, prospective shareholding, integration and comparables to other transactions; the Consolidation; the future financial or operating performance of the Companies and the Companies' mineral properties and project portfolios; Integra's intended use of the net proceeds from the sale of Subscription Receipts; the results from work performed to date; the estimation of mineral resources and reserves; the realization of mineral resource and reserve estimates; the development, operational and economic results of technical reports on mineral properties referenced herein; magnitude or quality of mineral deposits; the anticipated advancement of the Companies' mineral properties and project portfolios; exploration expenditures, costs and timing of the development of new deposits; underground exploration potential; costs and timing of future exploration; the completion and timing of future development studies; estimates of metallurgical recovery rates; exploration prospects of mineral properties; requirements for additional capital; the future price of metals; government regulation of mining operations; environmental risks; the timing and possible outcome of pending regulatory matters; the realization of the expected economics of mineral properties; future growth potential of mineral properties; and future development plans.
Forward-looking statements are often identified by the use of words such as "may", "will", "could", "would", "anticipate", "believe", "expect", "intend", "potential", "estimate", "budget", "scheduled", "plans", "planned", "forecasts", "goals" and similar expressions. Forward-looking statements are based on a number of factors and assumptions made by management and considered reasonable at the time such information is provided. Assumptions and factors include: the integration of the Companies, and realization of benefits therefrom; the Companies' ability to complete its planned exploration programs; the Consolidation; the absence of adverse conditions at mineral properties; no unforeseen operational delays; no material delays in obtaining necessary permits; the price of gold remaining at levels that render mineral properties economic; the Companies' ability to continue raising necessary capital to finance operations; and the ability to realize on the mineral resource and reserve estimates. Forward‐looking statements necessarily involve known and unknown risks and uncertainties, which may cause actual performance and financial results in future periods to differ materially from any projections of future performance or result expressed or implied by such forward‐looking statements. These risks and uncertainties include, but are not limited to: integration risks; general business, economic and competitive uncertainties; the actual results of current and future exploration activities; conclusions of economic evaluations; meeting various expected cost estimates; benefits of certain technology usage; changes in project parameters and/or economic assessments as plans continue to be refined; future prices of metals; possible variations of mineral grade or recovery rates; the risk that actual costs may exceed estimated costs; geological, mining and exploration technical problems; failure of plant, equipment or processes to operate as anticipated; accidents, labour disputes and other risks of the mining industry; delays in obtaining governmental approvals or financing; the speculative nature of mineral exploration and development (including the risks of obtaining necessary licenses, permits and approvals from government authorities); title to properties; the impact of COVID-19 on the timing of exploration and development work and management's ability to anticipate and manage the foregoing factors and risks. Although the Companies have attempted to identify important factors that could cause actual actions, events or results to differ materially from those described in the forward-looking statements, there may be other factors that cause actions, events or results not to be as anticipated, estimated or intended.
This list is not exhaustive of the factors that may affect any of the Company's forward-looking statements. Although the Company believes its expectations are based upon reasonable assumptions and have attempted to identify important factors that could cause actual actions, events or results to differ materially from those described in forward-looking statements, there may be other factors that cause actions, events or results not to be as anticipated, estimated or intended. Readers are advised to study and consider risk factors disclosed in Integra's annual report on Form 20-F dated March 17, 2023 for the fiscal year ended December 31, 2022, and Millennial's management's discussion and analysis dated April 28, 2023 for the fiscal year ended December 31, 2022.
MANAGEMENT’S DISCUSSION & ANALYSIS
For the Three and Nine-Month Periods Ended September 30, 2023 and 2022
There can be no assurance that forward‐looking statements will prove to be accurate, as actual results and future events could differ materially from those anticipated in such statements. The Companies undertake no obligation to update forward‐looking statements if circumstances or management's estimates or opinions should change except as required by applicable securities laws. The forward-looking statements contained herein are presented for the purposes of assisting investors in understanding the Companies' plans, objectives and goals, including with respect to the Transaction, and may not be appropriate for other purposes. Forward-looking statements are not guarantees of future performance and the reader is cautioned not to place undue reliance on forward‐looking statements. This news release also contains or references certain market, industry and peer group data, which is based upon information from independent industry publications, market research, analyst reports, surveys, continuous disclosure filings and other publicly available sources. Although the Companies believes these sources to be generally reliable, such information is subject to interpretation and cannot be verified with complete certainty due to limits on the availability and reliability of raw data, the voluntary nature of the data gathering process and other inherent limitations and uncertainties. The Companies have not independently verified any of the data from third party sources referred to in this news release and accordingly, the accuracy and completeness of such data is not guaranteed.
Investors are cautioned not to put undue reliance on forward-looking statements. The forward-looking statements contained herein are made as of the date of this MD&A and, accordingly, are subject to change after such date. The Company disclaims any intent or obligation to update publicly or otherwise revise any forward-looking statements or the foregoing list of assumptions or factors, whether as a result of new information, future events or otherwise, except in accordance with applicable securities laws. Investors are urged to read the Company's filings with Canadian securities regulatory agencies, which can be viewed online under the Company's profile on SEDAR+ at www.sedarplus.ca.
| MANAGEMENT'S RESPONSIBILITY |
Management is responsible for all information contained in this MD&A. The unaudited interim condensed consolidated financial statements have been prepared in accordance with International Financial Reporting Standards as issued by the International Accounting Standards Board and include amounts based on management's informed judgments and estimates. The financial and operating information included in this MD&A is consistent with that contained in the unaudited interim condensed consolidated financial statements in all material aspects.
Management maintains internal controls to provide reasonable assurance that financial information is reliable and accurate, and assets are safeguarded.
The Audit Committee has reviewed the unaudited interim condensed consolidated financial statements with management. The Board of Directors has approved these unaudited interim condensed consolidated financial statements on the recommendation of the Audit Committee.
Jason Kosec
Chief Executive Officer
November 14, 2023
Integra Resources Corp.
Unaudited Interim Condensed Consolidated Financial Statements
For the Three and Nine-Month Periods Ended
September 30, 2023 and 2022
Expressed in US Dollars
MANAGEMENT'S RESPONSIBILITY FOR FINANCIAL REPORTING
The accompanying unaudited interim condensed consolidated financial statements of Integra Resources Corp. are the responsibility of the management and Board of Directors of the Company.
The unaudited interim condensed consolidated financial statements have been prepared by management, on behalf of the Board of Directors, in accordance with the accounting policies disclosed in the notes to the financial statements. Where necessary, management has made informed judgments and estimates in accounting for transactions which were not complete at the statement of financial position date. In the opinion of management, the financial statements have been prepared within acceptable limits of materiality and are in accordance with International Financial Reporting Standards using accounting policies consistent with International Financial Reporting Standards appropriate in the circumstances.
Management has established systems of internal control over the financial reporting process, which are designed to provide reasonable assurance that relevant and reliable financial information is produced.
The Board of Directors is responsible for reviewing and approving the financial statements together with other financial information of the Company and for ensuring that management fulfills its financial reporting responsibilities. An Audit Committee assists the Board of Directors in fulfilling this responsibility. The Audit Committee meets with management to review the financial reporting process and the unaudited interim condensed consolidated financial statements together with other financial information of the Company. The Audit Committee reports its findings to the Board of Directors for its consideration in approving the unaudited interim condensed consolidated financial statements together with other financial information of the Company for issuance to the shareholders.
Management recognizes its responsibility for conducting the Company's affairs in compliance with established financial standards, and applicable laws and regulations, and for maintaining proper standards of conduct for its activities.
| "Jason Kosec" (signed) | "Andrée St-Germain" (signed) |
| Jason Kosec, Chief Executive Officer | Andrée St-Germain, Chief Financial Officer |
Integra Resources Corp.
Unaudited Interim Condensed Consolidated Financial Statements
For the Three and Nine-Month Periods Ended
September 30, 2023 and 2022
Table of Contents
Integra Resources Corp.
Unaudited Interim Condensed Consolidated Statements of Financial Position
(Expressed in US Dollars)
| |
September 30, 2023 |
December 31, 2022 |
|||||
| Assets | |||||||
| Current Assets | |||||||
| Cash and cash equivalents (Note 5) | $ | 14,912,869 | $ | 15,919,518 | |||
| Receivables and prepaid expenses (Note 6) | 975,889 | 1,074,370 | |||||
| Total Current Assets | 15,888,758 | 16,993,888 | |||||
| Long-Term Deposits (Note 6) | 83,175 | 37,228 | |||||
| Restricted Cash (Note 7) | 61,264 | 46,001 | |||||
| Lease Receivable (Note 6) | 186,814 | - | |||||
| Property, Plant and Equipment (Note 8) | 2,291,421 | 2,216,487 | |||||
| Right-of-Use Assets (Note 9) | 985,046 | 824,023 | |||||
| Exploration and Evaluation Assets (Note 10) | 64,406,445 | 40,801,924 | |||||
| Deferred Transaction Costs - Convertible Debt (Note 15) | 728,668 | 502,686 | |||||
| Total Assets | $ | 84,631,591 | $ | 61,422,237 | |||
| Liabilities | |||||||
| Current Liabilities | |||||||
| Trade and other payables (Note 13) | $ | 3,411,393 | $ | 2,633,911 | |||
| Current lease liability (Note 9) | 425,131 | 231,526 | |||||
| Current equipment financing liability (Note 14) | 173,600 | 216,898 | |||||
| Convertible debt facility - liability component (Note 15) | 9,606,780 | 8,463,214 | |||||
| Convertible debt facility - derivative component (Note 15) | 400,000 | 1,585,000 | |||||
| Current reclamation and remediation liability (Note 17) | 1,623,564 | 1,623,564 | |||||
| Due to related parties (Note 12) | 650,313 | 636,555 | |||||
| Total Current Liabilities | 16,290,781 | 15,390,668 | |||||
| Long-Term Lease Liability (Note 9) | 844,629 | 622,795 | |||||
| Long-Term Equipment Financing Liability (Note 14) | 60,083 | 178,062 | |||||
| Reclamation and Remediation Liability (Note 17) | 20,122,524 | 23,907,547 | |||||
| Total Liabilities | 37,318,017 | 40,099,072 | |||||
| Shareholders' Equity | |||||||
| Share Capital (Note 18) | 172,451,761 | 125,079,150 | |||||
| Reserves (Note 18) | 9,198,058 | 8,364,642 | |||||
| Accumulated Other Comprehensive Income | 7,763,091 | 7,958,603 | |||||
| Accumulated Deficit | (142,099,336 | ) | (120,079,230 | ) | |||
| Total Equity | 47,313,574 | 21,323,165 | |||||
| Total Liabilities and Equity | $ | 84,631,591 | $ | 61,422,237 | |||
Nature of Operations (Note 1); Commitments (Note 16)
These unaudited interim condensed consolidated financial statements were authorized for issue by the Board of Directors on November 14, 2023. They are signed on the Company's behalf by:
| "Stephen de Jong" , Lead Director | "Anna Ladd-Kruger" , Director |
| The accompanying notes are an integral part of these unaudited interim condensed consolidated financial statements. |
Integra Resources Corp.
Unaudited Interim Condensed Consolidated Statements of Operations and Comprehensive Loss
(Expressed in US Dollars)
| Three-Month Periods Ended September 30, |
Nine- Month Periods Ended September 30, |
|||||||||||||
| 2023 | 2022 | 2023 | 2022 | |||||||||||
| Operating Expenses | ||||||||||||||
| General and Administrative Expenses | ||||||||||||||
| Depreciation - property, plant and equipment (Note 8) | $ | (154,056 | ) | $ | (138,011 | ) | $ | (440,468 | ) | $ | (415,124 | ) | ||
| Depreciation - right-of-use assets (Note 9) | (109,010 | ) | (83,058 | ) | (348,885 | ) | (320,227 | ) | ||||||
| Compensation and benefits | (599,885 | ) | (421,841 | ) | (1,744,665 | ) | (1,318,444 | ) | ||||||
| Corporate development and marketing | (107,182 | ) | (68,961 | ) | (303,359 | ) | (193,111 | ) | ||||||
| Office and administration expenses | (202,211 | ) | (103,193 | ) | (577,189 | ) | (342,475 | ) | ||||||
| Professional fees | (89,066 | ) | 39,902 | (360,025 | ) | (228,170 | ) | |||||||
| Regulatory fees | (47,509 | ) | (39,582 | ) | (150,467 | ) | (162,656 | ) | ||||||
| Stock-based compensation (Note 18) | (234,773 | ) | (460,816 | ) | (758,154 | ) | (1,396,620 | ) | ||||||
| Total General and Administration Expenses | (1,543,692 | ) | (1,275,560 | ) | (4,683,212 | ) | (4,376,827 | ) | ||||||
| Exploration and Evaluation Expenses (Note 10) | (6,621,925 | ) | (2,505,754 | ) | (17,288,060 | ) | (9,354,124 | ) | ||||||
| Operating Loss | (8,165,617 | ) | (3,781,314 | ) | (21,971,272 | ) | (13,730,951 | ) | ||||||
| Other Income (Expense) | ||||||||||||||
| Interest income | 230,485 | 84,587 | 666,487 | 103,189 | ||||||||||
| Rent income - sublease (Note 9) | 35,378 | 32,320 | 96,965 | 79,901 | ||||||||||
| Interest income - loan receivable | - | - | - | 3,551 | ||||||||||
| Right of first refusal interest (Note 16) | - | - | 37,158 | - | ||||||||||
| Interest expenses - leases (Note 9) | (30,654 | ) | (14,435 | ) | (77,252 | ) | (38,221 | ) | ||||||
| Interest expenses - equipment financing (Note 14) | (4,555 | ) | (8,166 | ) | (16,427 | ) | (27,076 | ) | ||||||
| Interest expense - convertible debt (Note 15) | (252,290 | ) | (136,644 | ) | (716,136 | ) | (136,644 | ) | ||||||
| Accretion expense - convertible debt (Note 15) | (150,865 | ) | (71,804 | ) | (424,780 | ) | (71,804 | ) | ||||||
| Accretion expenses - reclamation (Note 17) | (268,411 | ) | (190,428 | ) | (773,802 | ) | (646,494 | ) | ||||||
| Change in fair value of derivatives (Note 15) | 589,071 | 131,000 | 1,185,242 | 131,000 | ||||||||||
| Change in present value of host liability (Note 15) | - | - | (98,070 | ) | - | |||||||||
| Gain on equipment sold | 20 | 4,515 | 20 | 4,515 | ||||||||||
| Gain on lease returned | - | 1,178 | - | 14,335 | ||||||||||
| Foreign exchange income (loss) | (55,977 | ) | 643,485 | 71,761 | 712,398 | |||||||||
| Total Other Income (Expense) | 92,202 | 475,608 | (48,834 | ) | 128,650 | |||||||||
| Net Loss | (8,073,415 | ) | (3,305,706 | ) | (22,020,106 | ) | (13,602,301 | ) | ||||||
| Other Comprehensive Income (Loss) |
||||||||||||||
| Items that will not be reclassified to profit or loss in subsequent periods: | ||||||||||||||
| Foreign exchange translation | 3,470,837 | 7,182,414 | (195,512 | ) | 9,079,031 | |||||||||
| Presentation currency translation difference | (3,131,517 | ) | (7,926,582 | ) | 299,259 | (9,901,767 | ) | |||||||
| Other Comprehensive Income (Loss) | 339,320 | (744,168 | ) | 103,747 | (822,736 | ) | ||||||||
| Comprehensive Loss | $ | (7,734,095 | ) | $ | (4,049,874 | ) | $ | (21,916,359 | ) | $ | (14,425,037 | ) | ||
| Net Loss Per Share | ||||||||||||||
| - basic and diluted (Note 19) | $ | (0.12 | ) | $ | (0.11 | ) | $ | (0.42 | ) | $ | (0.51 | ) | ||
| Weighted Average Number of Shares (000's) | ||||||||||||||
| - basic and diluted (000's) (Note 19) | 68,778 | 29,306 | 52,165 | 26,436 | ||||||||||
| The accompanying notes are an integral part of these unaudited interim condensed consolidated financial statements. |
Integra Resources Corp.
Unaudited Interim Condensed Consolidated Statements of Changes in Equity
(Expressed in US Dollars, except share numbers)
| Share Capital | Reserves | |||||||||||||||||||||||||||||||||||
| Number of Shares * |
Amount | Equity Incentive Awards |
Warrants | Accumulated Other Comprehensive Income (Loss) |
Deficit | Total | ||||||||||||||||||||||||||||||
| Balance at December 31, 2021 | 24,868,085 | $ | 122,010,028 | $ | 6,399,479 | $ | 724,874 | $ | 212,831 | $ | (100,272,209 | ) | $ | 29,075,003 | ||||||||||||||||||||||
| Share issued for cash – ATM (Note 18) | 307,222 | 898,694 | - | - | - | - | 898,694 | |||||||||||||||||||||||||||||
| Share issued for cash – financing (Note 18) | 6,666,667 | 11,000,000 | - | - | - | - | 11,000,000 | |||||||||||||||||||||||||||||
| Share issue cost - cash | - | (845,941 | ) | - | - | - | - | (845,941 | ) | |||||||||||||||||||||||||||
| Share-based-payments – equity incentive | ||||||||||||||||||||||||||||||||||||
| awards | - | - | 1,396,620 | - | - | - | 1,396,620 | |||||||||||||||||||||||||||||
| RSU vested – cash redemption | - | - | (5,743 | ) | - | - | - | (5,743 | ) | |||||||||||||||||||||||||||
| Presentation currency translation difference | - | (9,901,767 | ) | - | - | - | - | (9,901,767 | ) | |||||||||||||||||||||||||||
| Other comprehensive income | - | - | - | - | 9,079,031 | - | 9,079,031 | |||||||||||||||||||||||||||||
| Net loss | - | - | - | - | - | (13,602,301 | ) | (13,602,301 | ) | |||||||||||||||||||||||||||
| Balance at September 30, 2022 | 31,841,974 | $ | 123,161,014 | $ | 7,790,356 | $ | 724,874 | $ | 9,291,862 | $ | (113,874,510 | ) | $ | 27,093,596 | ||||||||||||||||||||||
| Balance at December 31, 2022 | 31,905,476 | $ | 125,079,150 | $ | 7,639,768 | $ | 724,874 | $ | 7,958,603 | $ | (120,079,230 | ) | $ | 21,323,165 | ||||||||||||||||||||||
| Share issued for cash – financing (Note 18) | 20,000,000 | 25,887,574 | - | - | - | - | 25,887,574 | |||||||||||||||||||||||||||||
| Share issued – Millennial acquisition | 16,872,050 | 22,697,554 | - | - | - | - | 22,697,554 | |||||||||||||||||||||||||||||
| (Note 11) | ||||||||||||||||||||||||||||||||||||
| Share issue cost - cash | - | (1,511,776 | ) | - | - | - | - | (1,511,776 | ) | |||||||||||||||||||||||||||
| Share-based-payments – equity incentive | ||||||||||||||||||||||||||||||||||||
| awards | - | - | 758,154 | - | - | - | 758,154 | |||||||||||||||||||||||||||||
| Share-based-payments (replacement | ||||||||||||||||||||||||||||||||||||
| options – merger) | - | - | 31,888 | - | - | - | 31,888 | |||||||||||||||||||||||||||||
| RSU vested – cash redemption | - | - | (1,256 | ) | - | - | - | (1,256 | ) | |||||||||||||||||||||||||||
| Share-based-payments – warrants (merger) | - | 44,630 | - | - | 44,630 | |||||||||||||||||||||||||||||||
| Presentation currency translation difference | - | 299,259 | - | - | - | - | 299,259 | |||||||||||||||||||||||||||||
| Other comprehensive loss | - | - | - | - | (195,512 | ) | - | (195,512 | ) | |||||||||||||||||||||||||||
| Net loss | - | - | - | - | - | (22,020,106 | ) | (22,020,106 | ) | |||||||||||||||||||||||||||
| Balance at September 30, 2023 | 68,777,526 | $ | 172,451,761 | $ | 8,428,554 | $ | 769,504 | $ | 7,763,091 | $ | (142,099,336 | ) | $ | 47,313,574 | ||||||||||||||||||||||
*2021 and 2022 number of shares have been retroactively restated for effect of the Consolidation (as defined in Note 1)
| The accompanying notes are an integral part of these unaudited interim condensed consolidated financial statements. |
Integra Resources Corp.
Unaudited Interim Condensed Consolidated Statements of Cash Flows
(Expressed in US Dollars)
| Nine-Month Periods Ended September 30, | |||||||||
| 2023 | 2022 | ||||||||
| Operations | |||||||||
| Net loss | $ | (22,020,106 | ) | $ | (13,602,301 | ) | |||
| Adjustments to reconcile net loss to cash flow from operating activities: | |||||||||
| Depreciation - property, plant and equipment (Note 8) | 440,468 | 415,124 | |||||||
| Depreciation - right-of-use assets (Note 9) | 348,885 | 320,227 | |||||||
| Lease interest expenses (Note 9) | 77,252 | 38,221 | |||||||
| Convertible debt facility - accretion (Note 15) | 424,862 | 71,804 | |||||||
| Deferred transaction costs - convertible debt (Note 15) | (225,982 | ) | (433,757 | ) | |||||
| Convertible debt facility - interest (Note 15) | 716,285 | 136,644 | |||||||
| Change in fair value of derivatives (Note 15) | (1,185,000 | ) | (131,000 | ) | |||||
| Change in present value of host liability (Note 15) | 97,732 | - | |||||||
| Reclamation accretion expenses (Note 17) | 773,802 | 646,494 | |||||||
| Reclamation expenditures (Note 17) | (927,447 | ) | (807,597 | ) | |||||
| Unrealized foreign exchange (income) loss | 105,754 | (857,719 | ) | ||||||
| Share-based payment (Note 18) | 758,154 | 1,396,620 | |||||||
| Net changes in non-cash working capital items: | |||||||||
| Receivables, prepaid expenses, and other assets | 213,430 | (327,025 | ) | ||||||
| Lease receivable (Note 6) | 21,887 | - | |||||||
| Lease liabilities | (54,684 | ) | 127,764 | ||||||
| Trade and other payables | (445,119 | ) | (613,802 | ) | |||||
| Due to / receivable from related parties | 13,743 | (155,291 | ) | ||||||
| Cash flow used in operating activities | (20,866,084 | ) | (13,775,594 | ) | |||||
| Investing | |||||||||
| Additions to property, plant and equipment | (312,293 | ) | (37,046 | ) | |||||
| Long-term investments (Note 7) | 139,397 | (28,862 | ) | ||||||
| Loan receivable - principal portion | - | 167,438 | |||||||
| Property acquisition costs - merger (net of cash acquired) | (898,775 | ) | - | ||||||
| (Notes 10 & 11) | |||||||||
| Property acquisition costs - other (Note 10) | (2,837,212 | ) | (82,350 | ) | |||||
| Cash flow (used in) provided by investing activities | (3,908,883 | ) | 19,180 | ||||||
| Financing | |||||||||
| Issuance of common shares - ATM & financing (Note 18) | 25,887,574 | 11,898,694 | |||||||
| Issuance of common shares - cash received from exercise of | |||||||||
| options and used in RSU redemption (Note 18) | (1,256 | ) | (5,743 | ) | |||||
| Share issue costs | (1,576,776 | ) | (829,431 | ) | |||||
| Lease principal payments and adjustments (Note 9) | (284,392 | ) | (512,587 | ) | |||||
| Equipment financing principal payments (Note 14) | (161,277 | ) | (150,628 | ) | |||||
| Convertible debt facility - transaction costs (Note 15) | (95,555 | ) | (458,637 | ) | |||||
| Convertible debt facility - proceeds (Note 15) | - | 10,000,000 | |||||||
| Cash flow provided by financing activities | 23,768,318 | 19,941,668 | |||||||
| Decrease (Increase) in cash and cash equivalents | (1,006,649 | ) | 6,185,254 | ||||||
| Cash and cash equivalents at beginning of period | 15,919,518 | 14,337,078 | |||||||
| Cash and cash equivalents at end of period | $ | 14,912,869 | $ | 20,522,332 | |||||
| The accompanying notes are an integral part of these unaudited interim condensed consolidated financial statements. |
|
Integra Resources Corp. |
1. NATURE OF OPERATIONS
Integra Resources Corp. ("Integra" or the "Company"), formerly Mag Copper Limited, was incorporated on April 15, 1997 as Berkana Digital Studios Inc. On December 4, 1998, the name of the Company was changed to Claim Lake Resource Inc. and on March 31, 2005, the Company changed its name to Fort Chimo Minerals Inc. On January 1, 2009, the Company amalgamated with its wholly-owned subsidiary, Limestone Basin Exploration Ltd. The amalgamated company continued to operate as Fort Chimo Minerals Inc. On June 14, 2011, the Company changed its name to Mag Copper Limited and on August 11, 2017, the Company changed its name to Integra Resources Corp. The Company acquired Millennial Precious Metals Corp ("Millennial" or "MPM") on May 4, 2023 (see Note 11).
Integra Resources Corp. is one of the largest precious metals exploration and development companies in the Great Basin of the Western USA. Integra is currently focused on advancing its three flagship oxide heap leach projects: the past producing DeLamar Project located in southwestern Idaho and the Wildcat and Mountain View Projects located in western Nevada. The Company also holds a portfolio of highly prospective early-stage exploration projects in Idaho, Nevada, and Arizona. Integra's long-term vision is to become a leading USA focused mid-tier high margin gold and silver producer.
The Company's head office is located at 1050 - 400 Burrard Street, Vancouver, BC V6C 3A6 and its registered office is located at 2200 HSBC Building, 885 West Georgia Street Vancouver, BC V6C 3E8.
The Company trades on the TSX Venture under the trading symbol "ITR". The common shares of the Company began trading on the NYSE American under the ticker "ITRG" on July 31, 2020. The common shares ceased trading on the OTCQX concurrently with the NYSE American listing.
The Company's warrants trade on the TSX-V under the symbol MPM.WT.
On May 26, 2023, the Company consolidated its common shares on the basis of one (1) new post-consolidation common share for every two and a half (2.5) existing pre-consolidation common share (the "Consolidation"). The Consolidation reduces the number of outstanding common shares from 171,943,828 to approximately 68,777,526. Proportionate adjustments have been made to the Company's outstanding stock options, restricted share units, and deferred share units.
2. BASIS OF PREPARATION
2.1 Statement of Compliance
These unaudited interim condensed consolidated financial statements, including comparatives, have been prepared in accordance with International Accounting Standards ("IAS") 34 'Interim Financial Reporting' ("IAS 34") using accounting policies consistent with the International Financial Reporting Standards ("IFRS") issued by the International Accounting Standards Board ("IASB") and Interpretations of the International Financial Reporting Interpretations Committee ("IFRIC").
These unaudited interim condensed consolidated financial statements were authorized by the Board of Directors of the Company on November 14, 2023.
|
Integra Resources Corp. |
2. BASIS OF PREPARATION (continued)
2.2 Significant Accounting Policies
These unaudited interim condensed consolidated financial statements have been prepared on the basis of accounting policies and methods of computation consistent with those applied in the Company's December 31, 2022 audited consolidated annual financial statements.
Basis of Consolidation
These unaudited interim condensed consolidated financial statements include the accounts of the Company and its wholly owned subsidiaries: Integra Resources Holdings Canada Inc., Integra Resources Holdings U.S. Inc., DeLamar Mining Company, Millennial Precious Metals Corp., Millennial Silver Corp., Millennial Silver Nevada Inc., Millennial NV LLC, Millennial Red Canyon LLC, Millennial Development LLC, and Millennial Arizona LLC. All intercompany balances and transactions are eliminated upon consolidation.
Foreign Currency Translation
The functional currency is the currency of the primary economic environment in which the entity operates and has been determined for each entity within the Company. The functional currency of the Canadian parent company and its Canadian subsidiaries is the Canadian dollar ("CAD"). The functional currency of the Company's US subsidiaries is the US dollar ("USD").
The Company has changed its presentation currency as of December 31, 2021 from the Canadian dollar to the US dollar, to better reflect the Company's business activities and most of the Company's assets and liabilities are held in its US subsidiaries hence denominated in US dollars. No changes were made to the Company's functional currencies, as per the management's assessment based on the IAS 21 recommendations, which will be performed on a quarterly basis.
Foreign currency transactions are recorded initially at the exchange rates prevailing at the transactions' dates. At each subsequent reporting period:
- Foreign currency monetary items are reported at the closing rate at the date of the statement of financial position;
- Non-monetary items carried at historical rates are reported at the closing rate at transactions' dates;
- Non-monetary items carried at fair value are reported at the rates that existed when the fair values were determined.
Foreign exchange gains and losses resulting from the settlement of such transactions and from the translation at period-end exchange rates of monetary assets and liabilities denominated in foreign currencies are recognized in net income (loss), with one exception. Exchange differences arising from the translation of the net investment in foreign entities are recognized in a separate component of equity, foreign currency translation reserve. When a foreign operation is sold, such exchange differences are recognized in net income (loss) as part of the gain or loss on sale.
The operating results and statements of financial position of the parent company and its Canadian subsidiary which have the Canadian dollar as a functional currency have been translated into US dollars as follows:
|
Integra Resources Corp. |
2. BASIS OF PREPARATION (continued)
2.2 Significant Accounting Policies (continued)
Foreign Currency Translation (continued)
i) Assets and liabilities are translated at the closing rate at the date of the consolidated statement of financial position; Share capital amounts are translated at the same rate, except for common shares issuance in USD dollars and resulting differences are reported in the "presentation currency translation difference" line in the consolidated statements of changes in equity;
ii) Revenue and expenses are translated at the average exchange rates, unless there is significant fluctuation in the exchange rates. In that case revenue and expenses are translated at the exchange rate at the date of transaction, except depreciation, depletion, and amortization, which are translated at the exchange rates applicable to the related assets; Reserve items are also translated at the average exchange rates.
iii) All resulting translation differences are recognized in other comprehensive income (loss).
When a foreign operation is disposed of, the cumulative amount of the exchange differences recognized in other comprehensive income (loss) and accumulated in the separate component of equity relating to that foreign operation shall be recognized in profit or loss when the gain or loss on disposal is recognized.
Business Combination
The Company applies the acquisition method to account for business combination. The consideration transferred for the acquisition of a subsidiary is the fair value of the assets transferred, the liabilities incurred to the former owners of the acquiree and the equity interest issued by the Company. The consideration transferred includes the fair value of any asset or liability resulting from a contingent consideration arrangement. Identifiable assets acquired and liabilities and contingent liabilities assumed in a business combination are measured initially at their fair values at the acquisition date. Acquisition related costs are expensed as incurred.
Any contingent consideration to be transferred is recognized at fair value at the acquisition date. Subsequent changes to the fair value of the contingent consideration that is deemed to be an asset or liability is recognized either in profit or loss or as a change to other comprehensive income. Contingent consideration that is classified as equity is not re-measured, and its subsequent settlement is accounted for within equity.
2.3 Significant Accounting Estimates and Judgments
The preparation of the unaudited interim condensed consolidated financial statements in conformity with IFRS requires management to make judgments, estimates and assumptions which affect the reported amounts of assets and liabilities, the disclosure of contingent assets and liabilities at the date of the unaudited interim condensed consolidated financial statements and the reported amounts of revenues and expenses during the reporting period. Estimates are based on historical experience and other factors considered to be reasonable and are reviewed on an ongoing basis. Revisions to estimates and the resulting effects on the carrying amounts of the Company's assets and liabilities are accounted for prospectively.
|
Integra Resources Corp. |
2. BASIS OF PREPARATION (continued)
2.3 Significant Accounting Estimates and Judgments (continued)
There have been material revisions to the nature and amount of judgments or estimates as reported in the Company's audited consolidated financial statements for the year ended December 31, 2022 in the current period related to the merger.
Reclassification
Site support expenses have been reclassified from general and administrative expenses to exploration and evaluation expenses in the comparative periods in the interim condensed consolidated statements of operations and comprehensive loss, to conform with the current period presentation. That reclassification had no impact on the operating loss (see Note 10).
Accounting Treatment of the Millennial Acquisition
The assessment of whether acquisitions are considered business combinations or asset acquisitions requires management judgement, the outcome of which may result in different accounting treatments.
The Company completed an analysis to determine whether the set of activities and assets acquired in the Transaction meet the definition of a business under IFRS 3. The Company concluded that the acquisition of Millennial does not meet the definition of a business and therefore is accounted for as an asset acquisition (see Note 11).
Accounting Treatment of the Convertible Facility
The Company's Convertible Facility contains a financial liability (non-derivative host contract) and one or more embedded derivatives. The liability was initially recorded at residual value and is subsequently carried at amortized cost using the effective interest rate method; the liability is accreted to the face value over the term of the convertible debt. All accretion was expensed to the statement of operations and comprehensive loss.
The conversion feature within the convertible debt facility has been determined to be an embedded derivative that is not closely related to the liability host, and it is bifurcated and accounted for separately, by first valuing the derivative component. At each reporting period, the derivative is fair valued with changes in fair value recorded as a gain or loss in the consolidated statement of operations and comprehensive loss. The fair value of the derivative at the inception date and at each reporting period is calculated using the Finite Difference Method. The key assumptions used in the model are risk free rates, expected volatility, and credit spread. The expected volatility assumption is based on the historical volatility of the Company's stock over a term equal to the remaining term of corresponding debt instrument. The credit spread assumption in the model is based on the Company's cost of unsecured debt.
The Company early adopted IAS 1 amendments and classified the debt host as a "current" liability, as required by these amendments.
In connection with the closing of the Millennial acquisition, some terms of the Convertible Facility were modified (see Note 15).
|
Integra Resources Corp. |
2. BASIS OF PREPARATION (continued)
2.3 Significant Accounting Estimates and Judgments (continued)
Accounting Treatment of the Convertible Facility (continued)
Management analyzed the accounting treatment of these modifications under IFRS guidance. IFRS 9 requires an entity to derecognize a financial liability when it is extinguished, which is when the obligation specified in the contract is discharged, cancelled, or expires. IFRS 9 also requires an exchange between an existing borrower and lender of debt instruments with "substantially different" terms to be accounted for as an extinguishment of the original financial liability and the recognition of a new financial liability. Similarly, a substantial modification of the terms of an existing financial liability, or a part of it, shall be accounted for as an extinguishment of the original financial liability and the recognition of a new financial liability. However, IFRS 9 considers the terms of exchanged or modified debt as "substantially different" if the net present value of the cash flows under the new terms discounted at the original effective interest rate is at least 10% different from the discounted present value of the remaining cash flows of the original debt instrument.
Management performed the comparison commonly referred to as "the 10% test" to determine if this modifications to the original loan agreement would result in an extinguishment or modification of the original loan agreement, applying all available guidance. Management concluded that original terms and new terms of the convertible debt facility are not "substantially different" and therefore, the loan amendment would be accounted for as a modification and not as an extinguishment.
As the debt host is a financial liability measured at amortized cost, management determined that any adjustments to the carrying amount of the financial liability due to the modification will be recognized immediately in profit or loss. Also, management noted that there were no additional transaction costs associated with the Amendment that would require resetting the effective interest rate to allow such costs to be amortized over the remaining term.
As the bifurcated embedded derivatives are measured at fair value through profit and loss, management determined that any adjustments due to the modification will be recognized through profit or loss as part of the period end remeasurement. Management has determined the Company should present the modification gains and losses on the debt host as part of "other income (expense)" section and the modification gains and losses on the bifurcated derivative as part of the change in the fair value of derivatives.
3. CAPITAL MANAGEMENT
The Company's capital management goals are to: ensure there are adequate capital resources to safeguard the Company's ability to continue as a going concern; maintain sufficient funding to support the acquisition, exploration, and development of mineral properties and exploration and evaluation activities; maintain investors' and market confidence; and provide returns and benefits to shareholders and other stakeholders.
The Company classified the convertible debt liability as a current liability, in accordance with the early adopted IAS 1 Amendments even though the maturity of the loan is in 2025. This classification meaningfully impacts the Company's working capital.
The Company's working capital deficit, including the convertible debt liability as of September 30, 2023 was $402,023 (December 31, 2022 - working capital $1,603,220). The Company's working capital, excluding the convertible debt liability as of September 30, 2023 was $9,604,757 (December 31, 2022 - working capital $11,651,434).
|
Integra Resources Corp. |
3. CAPITAL MANAGEMENT (continued)
The Company's capital structure is adjusted based on the funds available to the Company such that it may continue exploration and development of its properties for the mining of minerals that are economically recoverable. The Board of Directors does not establish quantitative return on capital criteria, but rather relies on the expertise of management and other professionals to sustain future development of the business.
The Company's properties are in the exploration and development stage and, as a result, the Company currently has no source of operating cash flow. The Company intends to raise such funds as and when required to complete its projects.
There is no assurance that the Company will be able to raise additional funds on reasonable terms. The only sources of future funds presently available to the Company are through the exercise of options, convertible debt facility, the sale of equity capital of the Company, the sale of a metal stream, the sale of a royalty or the sale by the Company of an interest in any of its properties in whole or in part. The ability of the Company to arrange such financing in the future will depend in part upon the prevailing capital market conditions as well as the business performance of the Company. There can be no assurance that the Company will be successful in its efforts to arrange additional financing, if needed, on terms satisfactory to the Company.
Management reviews its capital management approach on an ongoing basis and believes that this approach, given the relative size of the Company, is reasonable. There were no changes in the Company's approach to capital management during the nine-month period ended September 30, 2023.
4. FINANCIAL INSTRUMENTS
All financial instruments are initially measured at fair value plus or minus transaction costs (in case of a financial asset or financial liability not at fair value through profit or loss). Subsequent measurements are designed either at amortized costs or fair value (gains and losses are either recognized in profit or loss (fair value through profit or loss, FVTPL), or recognized in other comprehensive income (fair value through other comprehensive income, FVTOCI)).
Fair Value
IFRS requires disclosures about the inputs to fair value measurements, including their classification within a hierarchy that prioritizes the inputs to fair value measurement. The three levels of the fair value hierarchy are:
Level 1 - Unadjusted quoted prices in active markets for identical assets or liabilities;
Level 2 - Inputs other than quoted prices that are observable for the asset or liability either directly or indirectly; and
Level 3 - Inputs that are not based on observable market data.
The Company's financial instruments are accounted for as follows under IFRS 9:
| FINANCIAL ASSETS: | CLASSIFICATION |
| Cash and cash equivalents | FVTPL |
| Receivables (excluding tax receivables) | Amortized cost, less any impairment |
| Restricted cash, long-term | Amortized cost, less any impairment |
|
Integra Resources Corp. |
4. FINANCIAL INSTRUMENTS (continued)
| FINANCIAL LIABILITIES: | CLASSIFICATION |
| Trade and other payables | Other financial liabilities, measured at amortized cost |
| Due to related parties | Other financial liabilities, measured at amortized cost |
| Lease liability | Other financial liabilities, measured at amortized cost |
| Convertible debt facility - host liability | Other financial liabilities, measured at amortized cost |
| Convertible debt facility - derivative component | FVTPL |
| Equipment financing liability | Other financial liabilities, measured at amortized cost |
The following table summarizes the Company's financial instruments classified as FVTPL as at September 30, 2023 and December 31, 2022:
| Level | September 30, 2023 | December 31, 2022 | |||||||
| FINANCIAL ASSETS: | |||||||||
| Cash and cash equivalents | 1 | $ | 14,912,869 | $ | 15,919,518 |
| Level | September 30, 2023 | December 31, 2022 | |||||||
| FINANCIAL LIABILITIES: | |||||||||
| Convertible debt facility - derivative component | 3 | $ | 400,000 | $ | 1,585,000 |
Fair value estimates of all financial instruments are made at a specific point in time, based on relevant market information and information about financial instruments. These estimates are subject to and involve uncertainties and matters of significant judgment, therefore cannot be determined with precision. Changes in assumptions could significantly affect the estimates.
Lease liability, non-derivative host liability of the convertible debt and equipment financing liabilities are initially measured at the present value of the payments to be made over the lease or financing term, using the implicit interest rate (if available) or incremental borrowing rate for the present value determination. These liabilities are subsequently recorded at amortized cost using effective interest method. For restricted cash, lease liabilities, equipment financing liability and non-derivative host liability of convertible debt, the carrying values approximate their fair values at the period end because the interest rates used to discount host contracts approximate market interest rates. The non-derivative host liability related to the convertible debt facility is initially measured at fair value and is carried at amortized cost using the effective interest rate method. That liability is accreted to the face value over the loan term. The carrying values of other financial assets, trade and other payables and due to related parties approximate their fair values due to the short-term nature of these items.
A summary of the Company's risk exposures as it relates to financial instruments are reflected below:
i) Credit Risk
Credit risk is the risk of loss associated with a counter-party's inability to fulfill its payment obligations. The credit risk is attributable to various financial instruments, as noted below. The credit risk is limited to the carrying value amount carried on the consolidated statements of financial position.
a. Cash and cash equivalents - Cash and cash equivalents are held with major Canadian and U.S. banks and other financial institutions, and therefore the risk of loss is minimal.
b. Receivables and restricted cash - these financial assets are immaterial and therefore the risk of loss is minimal.
|
Integra Resources Corp. |
4. FINANCIAL INSTRUMENTS (continued)
ii) Liquidity Risk
The Company's approach to managing liquidity risk is to ensure that it will have sufficient liquidity to meet liabilities as they become due. The Company intends on securing further financing to ensure that the obligations are properly discharged.
iii) Market Risk
Market risk is the risk of loss that may arise from changes in market factors such as interest rates, foreign exchange rates, commodity prices and/or stock market movements (price risk).
a. Interest Rate Risk
Interest rate risk is the risk that the fair value or future cash flows of a financial instrument will fluctuate as a result of changes in market interest rates. The Company has interest-bearing assets, where the risk is limited to potential decreases on the interest rate offered on cash and cash equivalents held with a chartered Canadian and US financial institutions. The Company's significant financial instruments valued using fluctuating risk-free interest rates is the derivative component of the convertible debt facility. The Company's operating cash flows are mostly independent of changes in market interest rates. Management considers this risk immaterial.
b. Share Price Risk
At each reporting period, the convertible debt derivative liability is fair valued using the Finite Difference Method. The Company's share price is a key assumption used in this valuation, hence share price fluctuations can meaningfully impact the value of the derivative liability.
c. Foreign Exchange Risk
The Company is exposed to currency fluctuations given that most of its expenditures are incurred in the US dollars and its convertible debt facility is denominated in the US dollars. To manage this risk and mitigate its exposure to exchange rates fluctuation, the Company holds a portion of its cash and short-term investments in USD (see Note 5).
During the nine-month period ended September 30, 2023, the Company recognized a net foreign exchange income of $71,761. Based on the Company's net foreign currency exposure at September 30, 2023, depreciation or appreciation of US dollar against the Canadian dollar would have resulted in the following increase or decrease in the Company's net loss:
| At September 30, 2023 | Possible exposure* | Impact on net loss | Impact on net loss | ||||||
| US dollar | +/-5% | $ | 680,568 | $ | (680,568 | ) |
*Possible exposure is based on management's best estimate of the reasonably possible fluctuations of foreign exchange rates in the next twelve months.
|
Integra Resources Corp. |
5. CASH AND CASH EQUIVALENTS
The balance at September 30, 2023 consists of $3,436,913 in cash and $11,475,956 held in short-term investments (December 31, 2022 - $2,662,316 in cash and $13,257,202 in short-term investments) on deposit with major Canadian and US banks and other financial institutions. Short-term investments are redeemable on a monthly basis, with the annual interest rates ranging between 5.00% and 5.20%. As of September 30, 2023, the Company held approximately 34% (December 31, 2022 - 97%) of its cash and short-term investments in US dollars.
6. RECEIVABLES, PREPAID EXPENSES, AND DEPOSITS
Receivables, Prepaid Expenses and Deposits
| Receivables and Prepaid Expenses As at | September 30, 2023 | December 31, 2022 | |||||
| Receivables | $ | 167,858 | $ | 98,138 | |||
| Prepaid expenses | 808,031 | 976,232 | |||||
| Total Receivables and Prepaid Expenses | $ | 975,889 | $ | 1,074,370 | |||
| Long-Term Deposits As at | September 30, 2023 | December 31, 2022 | ||||
| Long-term security deposits | $ | 83,175 | $ | 37,228 | ||
| Total Long-Term Deposits | $ | 83,175 | $ | 37,228 |
| Lease Receivable | September 30, 2023 | December 31, 2022 | ||||
| Lease receivable - opening balance as May 4, 2023 | $ | 208,701 | $ | - | ||
| Principal payments | (21,887 | ) | - | |||
| Total Lease Receivable | $ | 186,814 | $ | - |
The Company's lease receivable is related to the long-term sublease of one of the Company's Nevada warehouses, reported in the non-current asset section of the consolidated statements of financial position. Total lease interest income related to this sublease in the current quarter was $5,348, reported in the consolidated statement of operations and comprehensive loss, under the "interest income".
At September 30, 2023 and December 31, 2022, the Company anticipates full recovery or full utilization of its receivables, prepaid expenses, and long-term deposits and therefore no impairment has been recorded against these amounts. The Company holds no collateral for any receivable amounts outstanding as at September 30, 2023 and December 31, 2022.
7. RESTRICTED CASH
The Company's restricted cash at September 30, 2023 consists of $61,264 (December 31, 2022 - $46,001), in credit card security deposits and reclamation bond.
|
Integra Resources Corp. |
8. PROPERTY, PLANT AND EQUIPMENT
| Computers and software |
Office furniture and equipment |
Vehicles |
Buildings, well, road, and buildings improvements |
Equipment |
Total |
|||||||||||||
| Cost | ||||||||||||||||||
| Balance at December 31, 2021 | 242,254 | 43,238 | 219,266 | 1,443,039 | 1,648,542 | 3,596,339 | ||||||||||||
| Additions (adjustments) | 1,952 | 1,679 | 76,419 | 19,510 | 34,601 | 134,161 | ||||||||||||
| Translation difference | (4,343 | ) | (2,412 | ) | - | (3,613 | ) | - | (10,368 | ) | ||||||||
| Balance at December 31, 2022 | 239,863 | 42,505 | 295,685 | 1,458,936 | 1,683,143 | 3,720,132 | ||||||||||||
| Additions (adjustments) | 34,083 | - | 73,468 | 33,524 | 101,626 | 242,701 | ||||||||||||
| Additions - merger (Note 11) | - | 11,252 | 119,513 | 61,605 | 74,663 | 267,033 | ||||||||||||
| Translation difference | 116 | 67 | - | 95 | - | 278 | ||||||||||||
| Balance at September 30, 2023 | $ | 274,062 | $ | 53,824 | $ | 488,666 | $ | 1,554,160 | $ | 1,859,432 | $ | 4,230,144 | ||||||
| Accumulated Depreciation | ||||||||||||||||||
| Balance at December 31, 2021 | (178,703 | ) | (31,412 | ) | (82,157 | ) | (149,500 | ) | (522,740 | ) | (964,512 | ) | ||||||
| Depreciation | (35,068 | ) | (8,161 | ) | (56,530 | ) | (114,957 | ) | (330,269 | ) | (544,985 | ) | ||||||
| Translation difference | 3,569 | 1,769 | - | 514 | - | 5,852 | ||||||||||||
| Balance at December 31, 2022 | (210,202 | ) | (37,804 | ) | (138,687 | ) | (263,943 | ) | (853,009 | ) | (1,503,645 | ) | ||||||
| Depreciation | (20,899 | ) | (3,040 | ) | (74,252 | ) | (96,696 | ) | (240,011 | ) | (434,898 | ) | ||||||
| Translation difference | (104 | ) | (58 | ) | - | (18 | ) | - | (180 | ) | ||||||||
| Balance at September 30, 2023 | $ | (231,205 | ) | $ | (40,902 | ) | $ | (212,939 | ) | $ | (360,657 | ) | $ | (1,093,020 | ) | $ | (1,938,723 | ) |
| Carrying amounts |
||||||||||||||||||
| December 31, 2021 | $ | 63,551 | $ | 11,826 | $ | 137,109 | $ | 1 ,293,539 | $ | 1,125,802 | $ | 2,631,827 | ||||||
| December 31, 2022 | $ | 29,661 | $ | 4,701 | $ | 156,998 | $ | 1,194,993 | $ | 830,134 | $ | 2,216,487 | ||||||
| September 30, 2023 | $ | 42,857 | $ | 12,922 | $ | 275,727 | $ | 1,193,503 | $ | 766,412 | $ | 2,291,421 |
|
Integra Resources Corp. |
9. LEASES - OPERATING LEASES, RIGHT-OF-USE ASSETS, AND LEASE LIABILITIES
Operating Leases
The Company elected to apply recognition exemption under IFRS 16 on its short-term rent agreements related to its office and equipment rentals. For the nine-month period ended September 30, 2023, the Company expensed $178,466 (September 30, 2022 - $57,156) related to these operating leases. The Company's short-term lease commitment as of September 30, 2023 was $103,069 (December 31, 2022 - $30,461).
Right-of-Use Assets
Integra renewed its head office lease agreement on August 18, 2022, extending the lease term from January 31, 2023 to January 31, 2028. This has been accounted for as change of estimate of lease liabilities under IFRS 16. All balances related to the original right-of-use asset and lease liability were closed accordingly and replaced by the new right-of-use asset and lease liability amounts.
DeLamar renewed its Boise office lease agreement on March 1, 2023, extending the lease term from July 31, 2023 to July 30, 2024. This has been accounted for as change of estimate of lease liabilities under IFRS 16. All balances related to the original right-of-use asset and lease liability were closed accordingly and replaced by the new right-of-use asset and lease liability amounts.
Right-of-use assets are initially measured at cost, which comprise the initial amount of lease liabilities, adjusted for lease prepayments, lease incentive received, lease initial direct costs, and an estimate of restoration, removal, and dismantling costs. Those right-of-use assets are depreciated on a straight-line basis, over the lease terms.
A summary of the changes in right-of-use assets for the nine-month period ended September 30, 2023 and the year ended December 31, 2022 is as follows:
| Right-of-Use Assets |
Vancouver Head office |
Vehicles |
Equipment |
DeLamar Boise Office and JV Mining Camp |
Nevada Warehouses and Rental Property |
Total |
|||||||||||||||||
| Balance, December 31, 2021 | 205,240 | 290,690 | 38,310 | 225,471 | - | 759,711 | |||||||||||||||||
| Additions (change of estimate) | 522,797 | (38,928 | ) | - | - | - | 483,869 | ||||||||||||||||
| Depreciation | (122,817 | ) | (140,214 | ) | (38,310 | ) | (105,093 | ) | - | (406,434 | ) | ||||||||||||
| Translation differences | (13,123 | ) | - | - | - | - | (13,123 | ) | |||||||||||||||
| Balance, December 31, 2022 | 592,097 | 111,548 | - | 120,378 | - | 824,023 | |||||||||||||||||
| Additions (change of estimate) | - | 52,928 | - | 66,549 | 119,477 | ||||||||||||||||||
| Additions - merger (Note 11) | - | - | - | - | 377,071 | 377,071 | |||||||||||||||||
| Depreciation | (87,514 | ) | (89,682 | ) | - | (73,904 | ) | (85,476 | ) | (336,576 | ) | ||||||||||||
| Translation differences | 1,051 | - | - | - | - | 1,051 | |||||||||||||||||
| Balance, September 30, 2023 | $ | 505,634 | $ | 74,794 | $ | - | $ | 113,023 | $ | 291,595 | $ | 985,046 | |||||||||||
|
Integra Resources Corp. |
9. LEASES - OPERATING LEASES, RIGHT-OF-USE ASSETS, AND LEASE LIABILITIES (continued)
Lease Liabilities
Lease liabilities are initially measured at the present value of the lease payments to be made over the lease terms, using the effective interest method for the present value determination. When the rate implicit in the lease cannot be readily determined, the Company applied an estimated incremental borrowing rate. The applied interest rates in these leases ranged between 6.34% and 10.00%. Lease liability calculations were based on the assumption that no purchase option will be exercised at the end of the lease terms.
A summary of the changes in lease liabilities for the nine-month period ended September 30, 2023 and the year ended December 31, 2022 is as follows:
| Lease Liabilities |
Vancouver Head office |
Vehicles |
Equipment |
DeLamar Boise Office and JV Mining Camp |
Nevada Warehouses and Rental Property |
Total |
||||||||||||
| Balance, December 31, 2021 | 270,940 | 282,503 | 41,707 | 245,575 | - | 840,725 | ||||||||||||
| Short-term lease liability at initial recognition (change of estimate) | 100,510 | - | - | - | - | 100,510 | ||||||||||||
| Long-term lease liability at initial recognition (change of estimate) | 530,412 | - | - | - | - | 530,412 | ||||||||||||
| Payments - principal portion | (157,736 | ) | (131,550 | ) | (40,198 | ) | (106,778 | ) | - | (436,262 | ) | |||||||
| Adjustments (rent adjustments & final payment reconciliations) | (117,879 | ) | (41,508 | ) | (1,509 | ) | (2,845 | ) | - | (163,741 | ) | |||||||
| Translation differences | (17,323 | ) | - | - | - | - | (17,323 | ) | ||||||||||
| Balance, December 31, 2022 | 608,924 | 109,445 | - | 135,952 | - | 854,321 | ||||||||||||
| Short-term lease liability at initial recognition (change of estimate) | - | 17,643 | - | 74,359 | - | 92,002 | ||||||||||||
| Long-term lease liability at initial recognition (change of estimate) | - | 35,285 | - | 29,170 | - | 64,455 | ||||||||||||
| Additions (merger) | - | - | - | - | 542,293 | 542,293 | ||||||||||||
| Payments - principal portion | (31,338 | ) | (85,449 | ) | - | (89,550 | ) | (49,650 | ) | (255,987 | ) | |||||||
| Adjustments (rent adjustments & final payment reconciliations) | - | (9 | ) | - | (28,396 | ) | - | (28,405 | ) | |||||||||
| Translation differences | 1,081 | - | - | - | - | 1,081 | ||||||||||||
| Balance, September 30, 2023 | $ | 578,667 | $ | 76,915 | $ | - | $ | 121,535 | $ | 492,643 | $ | 1,269,760 |
Carrying lease liabilities amounts are as follows:
| |
Current lease liability |
Long-term lease liability |
Total lease liabilities |
||||||
| Balance, December 31, 2022 | 231,526 | 622,795 | 854,321 | ||||||
| Balance, September 30 2023 | $ | 425,131 | $ | 844,629 | $ | 1,269,760 |
Lease interest expenses for the nine-month periods ended September 30, 2023 and 2022 are as follows:
| Lease Interest expenses | |||
| Balance, September 30, 2022 | $ | 38,221 | |
| Balance, September 30, 2023 | $ | 77,252 |
|
Integra Resources Corp. |
9. LEASES - OPERATING LEASES, RIGHT-OF-USE ASSETS, AND LEASE LIABILITIES (continued)
The Company subleases on a short-term basis a portion of its Vancouver head office to four companies for a rent income of $90,665, in the current nine-month period ended September 30, 2023 (September 30, 2022 - $79,901). The income is recognized in the consolidated statement of operations and comprehensive loss, under the "Rent income - sublease". The Company also has a long-term lease receivable related to the sublease of one of the Company's Nevada warehouses, reported in the consolidated statements of financial position (see Note 6).
10. EXPLORATION AND EVALUATION ASSETS
DeLamar Project
The DeLamar Project comprises of the DeLamar and Florida Mountain deposits.
DeLamar Deposit
On November 3, 2017, the Company acquired 100% of interest in Kinross DeLamar Mining Company, a wholly-owned subsidiary of Kinross Gold Corporation ("Kinross"), which owned the DeLamar Deposit for $5.9 million ("mm") in cash and the issuance of 2,218,395 common shares of the Company that is equal to 9.9% of all of the issued and outstanding shares of the Company upon closing of the October 2017 $21.3mm financing. The 2,218,395 common shares issued were valued at $3.7mm on the closing date. The Company paid $2.0mm cash at closing of the acquisition transaction and issued a $3.5mm promissory note, which was originally due in May 2019. In February 2019, the maturity date of the promissory note was extended to November 3, 2019, and the promissory note was paid in full on October 31, 2019.
That payment represents payment-in-full for all amounts owing under the promissory note agreement and all obligations under the agreement with Kinross USA Inc. have been fully performed. As a result, Kinross USA Inc. has released its security on 25% of the shares of DeLamar Mining Company.
A portion of the DeLamar Deposit is subject to a 2.5% NSR payable to Triple Flag Precious Metals Corp ("Triple Flag"). The Triple Flag royalty applies to more than 90% of the current DeLamar area resources, but this royalty will be reduced to 1.0% upon Triple Flag receiving total cumulative royalty payments of $7.4mm (CAD$10mm).
Florida Mountain Deposit
Integra executed in December 2017 Purchase and Sale Agreements with two private entities (Empire and Banner) to acquire patented claims in the past-producing Florida Mountain Gold and Silver Deposit ("Florida Mountain") for a total consideration of $2.0mm in cash. The Company completed the purchase of the Florida Mountain Empire claims in January 2018 and paid $1.6mm at closing. The Company completed the acquisition of the Florida Mountain Banner claims in the second quarter of 2018 and paid $0.4mm at closing.
Wildcat, Mountain View, Marr, Ocelot, Eden and Dune Properties
On December 11, 2020, Millennial (which was acquired by Integra on May 4, 2023) entered into a definitive agreement with a subsidiary of Waterton Global Resource Management ("Waterton") pursuant to which Millennial acquired Waterton's interest in the Wildcat, Mountain View, Marr, Ocelot, Eden and Dune properties located in Nevada ("the Nevada Properties"). The agreement was subsequently amended on May 25, 2022. The consideration terms of the amended definitive agreement are as follows:
|
Integra Resources Corp. |
10. EXPLORATION AND EVALUATION ASSETS (continued)
- Total cash consideration of $10.0 million payable as follows:
- $5.0 million due on completion of the acquisitions of the Nevada Properties (paid);
- $2.5 million (paid) upon the earlier of (A) announcement of a maiden NI 43-101 compliant mineral resource prepared at any of the Nevada Properties, and (B) the date that is twelve (12) calendar months following the date that the material approvals for exploration drilling activities on the first of the Nevada Properties to be drilled have been obtained; and
- $2.5 million on or prior to June 23, 2023 (paid).
- Share consideration as follows:
- Millennial issued to Waterton the greater of (i) an amount of common shares of Millennial ("Shares") representing a 19.9% equity interest in the outstanding Shares on a basic basis, post completion of the RTO (issued), and (ii) an amount of Shares representing an indicative value of $9mm (issued)
The Nevada Properties are subject to multiple royalties (see Note 16 for details). Franco-Nevada Corporation ("Franco-Nevada") acquired the Waterton royalties in June 2023.
War Eagle Gold-Silver Deposit
In December 2018, the Company has entered into an option agreement with Nevada Select Royalty Inc. ("Nevada Select"), now a wholly owned subsidiary of Gold Royalty Corp. to acquire Nevada Select's interest in a State of Idaho Mineral Lease (the "State Lease") encompassing the War Eagle gold-silver Deposit ("War Eagle") situated in the DeLamar District, southwestern Idaho. Upon exercise of the option (exercised in December 2022), Nevada Select transferred its right, title and interest in the State Lease, subject to a 1.0% net smelter royalty on future production from the deposit payable to Gold Royalty Corp. Under the option agreement, Integra paid Nevada Select $200,000 over a period of four years in annual payments.
Integra made the final option payment of $70,000 in December 2022. The State Lease is subject to an underlying 5.0% net smelter royalty payable to the State of Idaho. In the War Eagle Mountain District, Integra had previously acquired the Carton Claim group comprising of six patented mining claims covering 45 acres and located 750m north of the State Lease.
BlackSheep District
The Company staked a number of the BlackSheep claims in 2018. The staking was completed in early 2019.
Red Canyon Property
On October 30, 2020, Millennial entered into a definitive agreement, pursuant to which Red Canyon Corporation will lease to Integra, and grant Integra the sole and exclusive right to acquire a 100% undivided legal and beneficial interest in, 254 unpatented lode mining claims located in Eureka County, Nevada.
Please refer to Note 16 for details on option payments, work commitments and royalty commitments.
|
Integra Resources Corp. |
10. EXPLORATION AND EVALUATION ASSETS (continued)
Cerro Colorado District
On July 26, 2021, Millennial entered into a definitive agreement with Tri Minerals Holdings Corp. ("Tri Minerals"), to grant Integra the sole and exclusive right to acquire from Tri Minerals a 100% undivided legal and beneficial interest in and to the Silver Hill, Mina del Tajo-west, La Colorada, Nuevo Colorado, Waterman, and Cyanide projects situated in the Cerro Colorado Mining District in Arizona.
Please refer to Note 16 for details on option payments, work commitments and royalty commitments.
Exploration and Evaluation Assets Summary:
| Total | |||
| Balance at December 31, 2021 | $ | 56,491,140 | |
| Land acquisitions/option payments | 90,000 | ||
| Legal | 14,987 | ||
| Reclamation adjustment* | (15,864,249 | ) | |
| Depreciation** | (7,404 | ) | |
| Total | 40,724,474 | ||
| Advance minimum royalty (Note 16) | 77,450 | ||
| Balance at December 31, 2022 | 40,801,924 | ||
| Land acquisitions/option payments *** | 27,209,960 | ||
| Legal | 52,674 | ||
| Reclamation adjustment* | (3,744,926 | ) | |
| Depreciation** | (5,537 | ) | |
| Total | 64,314,095 | ||
| Advance minimum royalty (Note 16) | 92,350 | ||
| Balance at September 30, 2023 | $ | 64,406,445 |
*Reclamation adjustment is the change in present value of the reclamation liability, mainly due to changes to inflation rate and discount rate. Also see Note 17.
**A staff house building with a carrying value of $187,150 has been included in the DeLamar property. This building is being depreciated.
*** Includes $24,494,960 related to the Millennial Acquisition (see Note 11).
The Company spent $17,288,060 in exploration and evaluation activities during the nine-month period ended September 30, 2023 (September 30, 2022 - $9,354,124). In the current nine-month period, the Company reclassified its site support costs to Exploration and Evaluation expenses. These costs include all the support staff (such as accounting team, site management, safety, equipment operators, etc) and project related G&A costs (such a fee on surety bond, insurance, staff house, mobile equipment rental, equipment maintenance and repairs, Boise office, rental apartment, software, and other site G&A expenses).
Historically, the Company has classified those costs as "General & Administration" expenses in the consolidated statements of operations and comprehensive loss. The reclassification does not impact the operating loss, as the Company also expenses exploration and evaluation costs. Comparative numbers have been reclassified to conform with the current period reclassification.
|
Integra Resources Corp. |
10. EXPLORATION AND EVALUATION ASSETS (continued)
Recognizing that site support costs are integral to the exploration and development project activities, management has carefully evaluated this alignment and concluded that classifying these expenses under Exploration and Evaluation Expenses offers a more accurate and transparent reflection of the nature of those costs. The site support expenses are now reported in the table below.
The following tables outline the Company's exploration and evaluation expense summary for the nine-month periods ended September 30, 2023 and 2022:
Exploration and Evaluation Expense Summary:
| Idaho Properties | Nevada & Arizona Properties | |||||||||||||||||||||||
| September 30, 2023 |
DeLamar Project |
Other Idaho deposits |
Joint expenses |
Wildcat |
Mountain View |
Other Nevada & Arizona |
Joint expenses |
Total |
||||||||||||||||
| Contract exploration drilling | 2,056,797 | - | - | - | - | - | - | 2,056,797 | ||||||||||||||||
| Contract met drilling | 1,113,706 | - | - | - | - | - | - | 1,113,706 | ||||||||||||||||
| Contract condemnation drilling | 425,773 | - | - | - | - | - | - | 425,773 | ||||||||||||||||
| Contract geotech drilling | 312,147 | - | - | - | - | - | - | 312,147 | ||||||||||||||||
| Contract ground water drilling | 84,301 | - | - | - | - | - | 84,301 | |||||||||||||||||
| Exploration drilling - other drilling labour & related costs | 949,834 | - | - | - | - | - | - | 949,834 | ||||||||||||||||
| Met drilling - other drilling labour & related costs | 435,114 | - | - | - | - | - | - | 435,114 | ||||||||||||||||
| Condemnation drilling - other drilling labour & related costs | 188,013 | - | - | - | - | - | - | 188,013 | ||||||||||||||||
| Other exploration expenses* | 676,085 | 1,376 | - | 4,429 | 7,553 | 54,481 | - | 743,924 | ||||||||||||||||
| Other development expenses** | 1,798,741 | - | - | 57,081 | 30,886 | - | 290,824 | 2,177,532 | ||||||||||||||||
| Land*** | 332,489 | 22,602 | 192,225 | 171,503 | 60,478 | 249,345 | - | 1,028,642 | ||||||||||||||||
| Permitting | 3,774,632 | - | - | 154,341 | 24,955 | - | - | 3,953,928 | ||||||||||||||||
| Metallurgical test work | 324,250 | - | - | 5,497 | 1,727 | - | - | 331,474 | ||||||||||||||||
| Technical reports and engineering | 1,371,587 | - | - | 115,780 | 70,380 | - | - | 1,557,747 | ||||||||||||||||
| External affairs / Community engagement | 252,492 | - | - | - | - | - | 37,607 | 290,099 | ||||||||||||||||
| Site support expenses**** | 1,482,942 | - | - | - | - | - | 156,087 | 1,639,029 | ||||||||||||||||
| Total | $ | 15,578,903 | $ | 23,978 | $ | 192,225 | $ | 508,631 | $ | 195,979 | $ | 303,826 | $ | 484,518 | $ | 17,288,060 | ||||||||
*Includes mapping, IP, sampling, payroll, exploration G&A expenses, consultants
**Includes development G&A expenses and payroll
***Includes BLM and IDL annual fees, consulting, property taxes, legal, etc. expenses
****Includes site G&A expenses
|
Integra Resources Corp. |
10. EXPLORATION AND EVALUATION ASSETS (continued)
Exploration and Evaluation Expense Summary:
| Idaho Properties | ||||||||||||
| September 30, 2022 |
DeLamar Project |
Other Idaho deposits |
Joint expenses |
Total |
||||||||
| Contract exploration drilling | $ | 489,656 | $ | - | $ | - | $ | 489,656 | ||||
| Contract metallurgical drilling | 657,499 | - | - | 657,499 | ||||||||
| Contract condemnation drilling | 216,877 | - | - | 216,877 | ||||||||
| Exploration drilling - other drilling labour & related costs | 563,159 | 10,779 | - | 573,938 | ||||||||
| Metallurgical drilling - other drilling labour & related costs | 310,344 | - | - | 310,344 | ||||||||
| Condemnation drilling - other drilling - labour & related costs | 298,881 | - | - | 298,881 | ||||||||
| Other exploration expenses* | 751,627 | - | - | 751,627 | ||||||||
| Other development expenses** | 1,351,421 | - | - | 1,351,421 | ||||||||
| Land*** | 252,778 | 22,602 | 221,770 | 497,150 | ||||||||
| Permitting | 2,127,565 | - | - | 2,127,565 | ||||||||
| Metallurgical test work | 164,563 | - | - | 164,563 | ||||||||
| Technical reports and engineering | 624,665 | - | - | 624,665 | ||||||||
| External affairs / Community engagement | 196,527 | - | - | 196,527 | ||||||||
| Site support expenses**** | 1,093,411 | - | - | 1,093,411 | ||||||||
| Total | $ | 9,098,973 | $ | 33,381 | $ | 221,770 | $ | 9,354,124 | ||||
*Includes mapping, IP, sampling, payroll, exploration G&A expenses, consultants
**Includes development G&A expenses and payroll
***Includes BLM and IDL annual fees, consulting, property taxes, legal, etc. expenses
****Includes site G&A expenses
11. ACQUISITION OF MILLENNIAL PRECIOUS METALS CORP.
On February 26, 2023, the Company entered into a definitive plan of arrangement (the "Plan of Arrangement") with MPM pursuant to which Integra acquires all of the issued and outstanding common shares of MPM (the "Transaction"). Each MPM shareholder was entitled to receive 0.092 common share (post Consolidation) of Integra for each share of MPM held. Each stock option of MPM was exchanged in accordance with the Plan of Arrangement. The Transaction was approved by the securityholders of MPM on April 26, 2023 and closed on May 4, 2023. In connection with the Plan of Arrangement, the Company issued 16,872,050 common shares in exchange of MPM common shares, 764,704 stock options to replace MPM stock options and assumed 21,903,504 MPM warrants (convertible into 2,015,122 Integra shares). Based on the closing share price of Integra on May 4, 2023, the fair value of the consideration, including transaction costs, was $23,996,732.
The transaction is accounted for as an asset acquisition and the allocation of the purchase price to the assets acquired and liabilities assumed is based on estimated fair values at the time of acquisition.
|
Integra Resources Corp. |
11. ACQUISITION OF MILLENNIAL PRECIOUS METALS CORP. (continued)
Current allocation of the purchase price to the estimated fair value of the assets and liabilities of MPM is as follows:
| Purchase price: |
May 4, 2023 |
Q3 2023 adjustments* |
Total - September 30, 2023 |
|||||||
| Issuance of 16,872,050 shares of Integra to Millennial's shareholders | $ | 22,697,554 | $ | - | $ | 22,697,554 | ||||
| Issuance of 764,704 options of Integra to Millennial's option holders | 31,888 | - | 31,888 | |||||||
| Fair value of Millennial warrants assumed by Integra | 44,630 | - | 44,630 | |||||||
| Transaction costs | 1,222,660 | - | 1,222,660 | |||||||
| $ | 23,996,732 | $ | - | $ | 23,996,732 | |||||
| Fair value of assets and liabilities acquired: |
||||||||||
| Cash | 323,884 | - | 323,884 | |||||||
| Receivables | 103,234 | (5,174 | ) | 98,060 | ||||||
| Prepaids | 19,278 | - | 19,278 | |||||||
| Restricted cash | 154,630 | - | 154,630 | |||||||
| Security and reclamation deposits | 45,395 | (2,080 | ) | 43,315 | ||||||
| Lease receivable | 208,701 | - | 208,701 | |||||||
| Right of use assets | 377,071 | - | 377,071 | |||||||
| PP & E | 264,375 | - | 264,375 | |||||||
| Exploration and evaluation assets | 24,484,463 | 10,497 | 24,494,960 | |||||||
| Accounts payable and accrued liabilities | (1,328,458 | ) | (3,243 | ) | (1,331,701 | ) | ||||
| Lease liability | (542,293 | ) | - | (542,293 | ) | |||||
| Provision for site reclamation and remediation | (113,548 | ) | - | (113,548 | ) | |||||
| $ | 23,996,732 | $ | - | $ | 23,996,732 | |||||
*Q3 2023 adjustments were due to May 4, 2023 accounts receivable/accounts payable reversals and invoices related to the merger, received post-closing, which resulted in a $10,497 increase of the exploration and evaluation assets.
As Integra was required to replace Millennial's stock options under the terms of the Transaction, and it accounted for the exchange of instruments as a modification of share-based payment awards. The purchase consideration includes the portion of the fair value of the Integra replacement options that relates to services prior to the acquisition. The fair value of the replacement options was calculated using the Black Scholes option pricing model with the weighted average assumptions of expected volatility of 51.99% - 61.47%, risk free interest rate of 3.15% - 4.43% and expected life of 1.0 and 3.07 years. Integra also assumed 21,903,504 MPM warrants (convertible into 2,015,122 Integra shares). The fair value of the MPM warrants on May 4, 2023 was calculated using the Black Scholes option pricing model with the weighted average assumptions of expected volatility of 59.03%, risk free interest rate of 4.22% and expected life of 1.12 years.
12. RELATED PARTY TRANSACTIONS AND KEY MANAGEMENT COMPENSATION
Related parties include the Board of Directors, CEO, CFO, COO and enterprises that are controlled by these individuals.
As September 30, 2023, $650,313 (December 31, 2022 - $636,555) was due to related parties for payroll expenses, consulting fees, bonuses accruals, vacation accruals and other expenses. Receivables from related parties (related to rent and office expenses) as of September 30, 2023 were $26,285 (December 31, 2022 - $18,843) and was recorded in receivables.
|
Integra Resources Corp. |
12. RELATED PARTY TRANSACTIONS AND KEY MANAGEMENT COMPENSATION (continued)
Key Management Compensation:
Key management personnel include those persons having authority and responsibility for planning, directing, and controlling the activities of the Company as a whole. The Company has determined that key management personnel consist of executive and non-executive members of the Company's Board of Directors, CEO, CFO, and COO.
Remuneration attributed to executives and directors for the nine-month periods ended September 30, 2023 and 2022 were as follows:
| September 30, 2023 |
September 30, 2022 |
|||||
| Short-term benefits* | $ | 1,336,775 | $ | 1,230,308 | ||
| Associate companies** | 2,301 | (13,498 | ) | |||
| Stock-based compensation | 403,818 | 931,335 | ||||
| Total | $ | 1,742,894 | $ | 2,148,145 |
*Short-term employment benefits include salaries, consulting fees, vacation accruals and bonus accruals for key management. It also includes directors' fees for non-executive members of the Company's Board of Directors.
**Net of payable/receivable/GST due to/from entities for which Integra's directors are executives, mostly related to rent and office expenses.
In the current nine-month period ended September 30, 2023, the Company issued 58,756 deferred share units to certain directors, in lieu of their directors' fees, as elected by those directors. Each DSU has been fair valued at Integra's closing share price at the end of quarter. The share-based payment related to these DSUs is included in the above table under stock-based compensation.
In the nine-month period ended September 30, 2022, the Company issued 49,179 deferred share units to certain directors, in lieu of their directors' fees, as elected by those directors. Each DSU has been fair valued at Integra's closing share price at the end of quarter. The share-based payment related to these DSUs is included in the above table under stock-based compensation.
The option to receive DSUs in lieu of cash directors' fees was introduced in 2021 in order to encourage insiders' ownership. DSUs granted before December 2021 vested in full at the grant date. DSUs granted in December 2021 and going forward will vest in 12 months.
13. TRADE AND OTHER PAYABLES
Trade and other payables of the Company are principally comprised of amounts outstanding for trade purchases relating to exploration activities and amounts payable for operating and financing activities. The usual credit period taken for trade purchases is 30 days. The majority of the Company's payables relates to development and exploration expenditures, legal and office expenses, and consulting fees.
The following is a breakdown of the trade and other payables:
| As at |
September 30, 2023 |
December 31, 2022 |
||||||
| Total Accounts Payable | $ | 2,181,352 | $ | 2,053,426 | ||||
| Accrued Liabilities | 1,230,041 | 580,485 | ||||||
| Total Trade and Other Payables | $ | 3,411,393 | $ | 2,633,911 | ||||
|
Integra Resources Corp. |
13. TRADE AND OTHER PAYABLES (continued)
Accrued liabilities at September 30, 2023 and December 31, 2022, include mostly accruals for project exploration and development expenditures, payroll, bonus, vacation, professional services, and office expenses.
14. EQUIPMENT FINANCING
During the 2020 fiscal year, the Company's wholly owned subsidiary, DeLamar Mining Company, purchased a dozer and two small excavators and entered into a 48-month mobile equipment financing agreement in the amount of $0.6mm. The mobile equipment financing is guaranteed by Integra Resources Corp.
During the second quarter of 2021, the Company's wholly owned subsidiary, DeLamar Mining Company, purchased a dozer and entered into a 48-month mobile equipment financing agreement in the amount of $0.3mm. The mobile equipment financing is guaranteed by Integra Resources Corp.
The equipment financing liability is initially measured at the present value of the payments to be made over the financing term, using the implicit interest rate of 7.0% per annum for the 2020 financing and the implicit interest rate of 6.5% for the 2021 financing. Subsequently, equipment financing liability is accreted to reflect interest and the liability is reduced to reflect financing payments.
A summary of the changes in the equipment financing liability for the nine-month period ended September 30, 2023 and the year ended December 31, 2022 is as follows:
| Equipment Financing Liability | |||
| Balance, December 31, 2021 | $ | 597,537 | |
| Principal payments | (202,577 | ) | |
| Balance, December 31, 2022 | 394,960 | ||
| Principal payments | (161,277 | ) | |
| Balance, September 30, 2023 | $ | 233,683 |
Carrying equipment financing liability amounts are as follows:
| September 30, 2023 | December 31, 2022 | |||||
| Current equipment financing liability | $ | 173,600 | $ | 216,898 | ||
| Long-term equipment financing liability | 60,083 | 178,062 | ||||
| Total equipment financing liability | $ | 233,683 | $ | 394,960 |
Equipment financing interest expenses for the nine-month periods ended September 30, 2023 and 2022 are as follows:
| Equipment Financing Interest Expenses |
|||
| September 30, 2022 | $ | 27,076 | |
| September 30, 2023 | $ | 16,427 |
|
Integra Resources Corp. |
15. CONVERTIBLE DEBT FACILITY
On July 28, 2022, the Company executed a credit agreement with Beedie Investment Ltd. (the "Lender"), for the issuance of a non-revolving term convertible debt facility (the "Convertible Facility") in the principal amount up to $20 million. Maturity date of the loan is set as 36 months following the closing date (August 4, 2022), which could be extended for an additional 12 months, if certain conditions are met. On August 4, 2022, an initial advance of $10 million was drawn under this facility, with the Company having the option to draw "subsequent advances" in increments of at least $2.5 million, up to an additional $10 million, subject to certain conditions (no default, event of default, or material adverse effect shall have occurred or be continuing, receipt of conditional exchange approval of the subsequent advance conversion price and the common shares issuable upon the conversion of such subsequent advance, lender satisfaction with all material authorizations, leases and licenses for the current stage of the DeLamar project and, in the case of a subsequent advance, with filing of the Plan of Operations for the DeLamar project, an amount of unrestricted cash of the loan parties is at all times a minimum of $2 million). The Convertible Facility is secured by the Company's material assets and guaranteed by the Company's subsidiaries.
In connection with the closing of the Merger with Millennial, the original Convertible Facility was amended on May 4, 2023 to accommodate the assets of Millennial and its subsidiaries, each of which, following the closing of the Merger, are loan parties and provide guarantees and security for the obligations under the loan agreement. The amended agreement modified the conversion price on the initial advance from $2.25 (adjusted for the Consolidation) to $1.73 (adjusted for the Consolidation) and increased the coupon interest rate from 8.75% to 9.25% per annum on the loan outstanding, which interest continues to be accrued for the first twenty-four (24) months from the date of the Loan Agreement, payable quarterly either in shares or in cash, at Integra's election.
Prior to July 31, 2024, interest will be accrued and shall be compounded quarterly and added to the principal at the end of each quarterly interest period. Commencing with the quarterly interest period ending September 30, 2024, interest shall be paid quarterly either in cash or shares, at the Company's election.
The Company is required to pay standby fees, of 2% (annual rate), calculated on the undrawn portion of the Convertible Facility, calculated on a daily basis, compounded quarterly, and payable in arrears on each interest payment date (quarterly) following the effective date commencing September 30, 2022. Those fees are deferred in full (and included in deferred transaction costs).
If for a period of 30 consecutive trading days, the Company's volume weighted average trading price ("VWAP") of the common shares measured on the close of the trading on each such day equals or exceeds a 50% premium above the initial advance conversion price or the subsequent advance conversion price for any subsequent advance, the Company shall, provided no event of default occurred and be continuing, be entitled to have a onetime right to elect to cause the lender to convert up to 50% of the outstanding principal amount.
The Company may, at any time so long as an event of default has not occurred and it is continuing, make a prepayment of the outstanding advances, a make whole fee equal to the interest that would have accrued on such principal amount being prepaid from the date such advance was made up to the earlier of the date that is 30 months following the date of such advance and the maturity date then in effect at the rate of interest applicable thereto less the amount of interest paid to date on such outstanding principal amount being prepaid; if the prepayment of any advance occurs after the date that is 30 months following the date such advance, a prepayment fee equal to 2% of the principal amount of such advance being prepaid; and all of other outstanding obligations if the Convertible Facility is prepaid in full.
|
Integra Resources Corp. |
15. CONVERTIBLE DEBT FACILITY (continued)
At any time prior to repayment of the outstanding principal amount, the lender is entitled to elect to convert all or any portion of the principal amount (together with all outstanding standby fees and interest) into such number of common shares in the capital of the Company at a conversion price of a) for the initial advance $1.73 (adjusted for Consolidation) b) for the subsequent advance conversion price (equal to the higher of i) closing price on the trading day immediately prior to the date of the advance or ii) a 20% premium on the 30-day VWAP immediately prior to the date of the advance).
A summary of the changes in the convertible facility for the nine-month period ended September 30, 2023 and the year ended December 31, 2022 is as follows:
| Convertible facility - liability component |
Convertible facility - derivative component |
Total convertible debt facility |
|||||||
| Balance, December 31, 2021 | $ | - | $ | - | $ | - | |||
| Fair value at initial recognition on August 4, 2022 | 8,381,000 | 1,619,000 | 10,000,000 | ||||||
| Transaction costs amortization | (472,221 | ) | - | (472,221 | ) | ||||
| Interest expense accrual | 360,205 | - | 360,205 | ||||||
| Accretion | 194,230 | - | 194,230 | ||||||
| Change in fair value of derivatives | - | (34,000 | ) | (34,000 | ) | ||||
| Balance, December 31, 2022 | 8,463,214 | 1,585,000 | 10,048,214 | ||||||
| Transaction costs amortization | (95,313 | ) | (95,313 | ) | |||||
| Interest expense accrual | 716,285 | 716,285 | |||||||
| Accretion | 424,862 | 424,862 | |||||||
| Change in PV of host liability | 97,732 | 97,732 | |||||||
| Change in fair value of derivatives | - | (1,185,000 | ) | (1,185,000 | ) | ||||
| Balance, September 30, 2023 | $ | 9,606,780 | $ | 400,000 | $ | 10,006,780 |
Upon the occurrence of an event of default which is continuing, all obligations shall at the option of the lender be accelerated and become immediately due and payable. As of September 30, 2023 the Company was in compliance with the covenants.
The assumptions used in this valuation model and the resulting fair value of the embedded derivatives at December 31, 2022 were as follows:
Maturity date: August 4, 2025
Risk-free rate: 4.24% - 4.29% (three years)
Exchange rate (USD$ to CAD$): 1.3544
Share price: $1.58 (Integra's December 30, 2022 closing share price)
Expected volatility: 53.4%
Dividend yield: %Nil
Annual interest rate: 8.75%
Conversion price: $2.25193 (CAD$3.05) per share
Conversion price cap: $3.44543
Credit spread: 13.94%
|
Integra Resources Corp. |
15. CONVERTIBLE DEBT FACILITY (continued)
The assumptions used in this valuation model and the resulting fair value of the embedded derivatives at September 30, 2023 as follows:
Maturity date: August 4, 2025
Risk-free rate: 5.24% - 5.22% (two years)
Exchange rate (USD$ to CAD$): 1.3520
Share price: $0.81 (Integra's September 29, 2023 closing share price)
Expected volatility: 58.6%
Dividend yield: %Nil
Annual interest rate: 9.25%
Conversion price: $1.73425 per share
Conversion price cap: $2.6014
Credit spread: 11.47%
16. COMMITMENTS AND CONTRACTUAL OBLIGATIONS
Net Smelter Return ("NSR")
There are multiple third-party landholders, and the royalty amounts due to each of them over the life of the projects varies with each property.
DeLamar Project: A portion of the DeLamar Project is subject to a 2.5% NSR payable to Triple Flag Precious Metals Corp ("Triple Flag"). The NSR will be reduced to 1.0% once Triple Flag has received a total cumulative royalty payment of CAD$10 million (US$7.4 million). Other NSRs ranging from 2.0% to 5.0% are also payable to third-party landholders on certain claims.
Wildcat Property: A 0.5% NSR on production from the Wildcat property is payable to Franco-Nevada*. Other NSRs ranging from 0.4% to 1.0% are also payable to third-party landholders on certain claims.
Mountain View Property: A 0.5% NSR on gold production from the Mountain View property is payable to Franco-Nevada*. Certain claims on the property are also subject to a 1.0% NSR to Franco-Nevada and a 1.5% NSR to Triple Flag. Other NSRs ranging from 0.05% to 1.5% are also payable to third-party landholders on certain claims.
War Eagle Deposit: a 1.0% net smelter royalty on future production from the deposit is payable to Gold Royalty Corp. and a 5.0% net smelter royalty payable to the State of Idaho
Marr, Ocelot, Eden and Dune Properties: Franco-Nevada* also has a 2.0% NSR on production from the Marr, Ocelot, Eden and Dune properties. Integra shall have an option at any time to buy down one-half of each royalty, thereby reducing the royalty to a 1.0% NSR royalty per property, for $1,500,000 per property.
Red Canyon Property: The Red Canyon property is subject to a 2.0% NSR royalty to Red Canyon Corporation, subject to Integra retaining an option to acquire 1.0% of the NSR for a cash payment of $1,500,000 for a period of two years following the royalty grant. A 0.5% NSR is also payable to a third-party landholder.
|
Integra Resources Corp. |
16. COMMITMENTS AND CONTRACTUAL OBLIGATIONS (continued)
Cerro Colorado District: The Cerro Colorado property is subject to a 1.0% NSR to Tri Minerals Holding Corp. For a period of five (5) years from the date the option is executed, and the royalty is granted, Integra shall have the option to buy back the royalty for a payment $1,500,000.
* Franco-Nevada Corporation ("Franco-Nevada") acquired these royalties from Waterton in June 2023.
In May 2023, Wheaton Precious Metals acquired from Integra a Right of First Refusal ("ROFR") on all future precious metals royalties, streams and pre-pays transactions on all properties owned by the Company as of May 4, 2023. The Company received compensation of $37,101 (C$50,000) in exchange for the ROFR. This has been recorded under the Statements of Operations and Comprehensive Loss as income from right of first refusal interest.
Advance Minimum Royalties ("AMR")
The Company's AMR obligation is expected to total $122,450 for 2023 (December 31, 2022 - $77,450), of which $92,350 was paid year to date.
Annual Claim Filings
The Company's obligation related to the Idaho Department of Lands ("IDL") rent payments is expected to total $30,907 for 2023 (December 31, 2022 - $30,670), which was paid in full in the current nine-month period ended September 30, 2023.
The Company's obligation related to the Arizona State Lands Dept ("ASLD") rent payments is expected to total $75,140 for 2023 (December 31, 2022 - $Nil), which was paid in full in the current nine-month period ended September 30, 2023.
The Company's obligation for BLM claim fees is expected to total $569,565 for 2023 (December 31, 2022 - $192,225), which was paid in full in the current nine-month period ended September 30, 2023.
Land Access Lease Payments
The Company's obligation related to land and road access lease payments is expected to total $284,744 for 2023 (December 31, 2022 - $352,999), of which $225,640 has been paid year to date.
Land Purchase Payments, Option Payments and Work Commitments
Wildcat, Mountain View, Marr, Ocelot, Eden and Dune Properties:
The Company paid the final land purchase payment of $2.5 million in June 2023.
|
Integra Resources Corp. |
16. COMMITMENTS AND CONTRACTUAL OBLIGATIONS (continued)
Red Canyon Property:
On October 30, 2020, Millennial (subsequently acquired by Integra) entered into a definitive agreement, pursuant to which Red Canyon Corporation will lease to Integra, and grant Integra the sole and exclusive right
to acquire a 100% undivided legal and beneficial interest in, 254 unpatented lode mining claims located in Eureka County, Nevada.
Under the terms of the definitive agreement, the Company will have an option to acquire a 100% undivided interest in the Red Canyon Property by completing the following:
• Total advance cash payments of $275,000 ("Advance Payments") to Red Canyon Corporation payable as follows:
o $25,000 due on signing of a definitive agreement - October 30, 2020 (paid);
o $25,000 due on or prior to 6 months from October 30, 2020 (paid);
o $50,000 due on or prior to the first anniversary (paid);
o $75,000 due on or prior to the second anniversary (paid); and
o $100,000 due on or prior to the third anniversary (paid subsequent to the current nine-month period ended September 30, 2023);
• Reimburse $44,970 due for federal annual mining claim maintenance (paid);
• On or before the 4th anniversary, Integra shall pay Red Canyon Corporation $2,000,000 less aggregate amount of Advance Payments paid by Integra.
• Issuing common shares to Red Canyon Corporation as follows:
o On or prior to the completion of Millennial's going public transaction by way of reverse take-over ("RTO"), issuing an amount of common shares to ensure Red Canyon owns 2% of the outstanding common shares immediately following completion of the RTO (issued);
o 1,000,000 common shares on or prior to the first anniversary (issued);
o 1,000,000 common shares on or prior to the second anniversary (issued); and
o 1,000,000 common shares on or prior to the third anniversary (issued).
• Spend an aggregate $1,500,000 in exploration expenditures as follows:
o $500,000 on or prior to the second anniversary (incurred);
o $500,000 on or prior to the third anniversary (incurred); and
o $500,000 on or prior to the fourth anniversary (incurred).
|
Integra Resources Corp. |
16. COMMITMENTS AND CONTRACTUAL OBLIGATIONS (continued)
Cerro Colorado District:
On August 23, 2021, Millennial (subsequently acquired by Integra) entered into a definitive agreement with Tri Minerals Holdings Corp. ("Tri Minerals"), to grant Integra the sole and exclusive right to acquire from Tri Minerals a 100% undivided legal and beneficial interest in and to the Silver Hill, Mina del Tajo-west, La Colorada, Nuevo Colorado, Waterman, and Cyanide projects situated in the Cerro Colorado Mining District in Arizona (together the "Arizona Properties").
Pursuant to the terms of the agreement, Tri Minerals will lease the Arizona Properties to Integra (the "Lease") for a period of up to four (4) years and grant Integra the sole and exclusive right to acquire a 100% undivided legal and beneficial interest in and to the Arizona Properties, free and clear of all charges, encumbrances and claims (the "Option"), subject to the following terms and conditions:
o $25,000 on the date that the LOI was executed by the Parties (the "Initial Payment"). The date that the Definitive Agreement was executed shall be the effective date ("Effective Date") (paid);
o $25,000 on or prior to the earlier of (i) the date that initial operations permits are received in respect of any of the Properties and (ii) the date that is six months after the Effective Date (the "Subsequent Payment") (paid);
o $50,000 on or prior to the 1st anniversary of the Effective Date (the "First Anniversary Payment') (paid); and
o $200,000 on or before the 2nd anniversary of the Effective Date (the "Second Anniversary Payment') (paid).
Lease Extension Payment: On or before the 3rd anniversary of the Effective Date, Integra may extend the Lease for a period of one (1) year by making a payment of $200,000 to Tri Minerals (the "Lease Extension Payment").
Option Exercise Payment: On or before the termination of the Lease, but no later than the 4th anniversary of the Effective Date, Integra may exercise the Option and, in such event, shall pay Tri Minerals $2,500,000, less the aggregate amount of Lease Payments paid by Integra to Tri Minerals.
Work Commitment: During the Term and provided all necessary State of Arizona (ASLD), BLM approvals, as appropriate, for exploration activities (including drilling) on the Arizona Properties have been obtained, Integra shall conduct exploration activities in accordance with all permit requirements and shall incur exploration expenditures on the Arizona Properties as follows:
o A minimum of $500,000 in exploration expenditures on or prior to the second anniversary of the Effective Date (the "First Work Commitment") (incurred);
o A minimum of $500,000 in exploration expenditures on or prior to the third anniversary of the Effective Date (the "Second Work Commitment") (incurred); and
o A minimum of $500,000 in exploration expenditures on or prior to the fourth anniversary of the Effective Date (the "Third Work Commitment").
|
Integra Resources Corp. |
17. RECLAMATION AND REMEDIATION LIABILITIES
The Company conducts its operations so as to protect the public health and the environment, and to comply with all applicable laws and regulations governing protection of the environment.
DeLamar Project
The site has been reclaimed by the former owner, Kinross, and the Company's environmental liabilities consist mostly of water treatment, general site maintenance and environmental monitoring costs.
The reclamation and remediation obligation represents the present value of the water treatment and environmental monitoring activities expected to be completed over the next 70 years. The cost projection has been prepared by an independent third party with expertise in mining site reclamation. Water treatment costs could be reduced in the event that mining at DeLamar resumes in the future. The Company's cost estimates do not currently assume any future mining activities. Assumptions based on the current economic environment have been made, which management believes are a reasonable basis upon which to estimate the future liability.
These estimates are reviewed regularly to take into account any material changes to the assumptions. However, actual water treatment and environmental monitoring costs will ultimately depend upon future market prices for the required activities that will reflect market conditions at the relevant time.
For the year ended December 31, 2022, the Company reviewed and revised some of its December 31, 2021 assumptions and estimates. The discount rate assumption changed in 2022, as it is based on the US Treasury rate. As a result, the discount rate increased from 1.90% to 3.97% in the current period, which decreased the present value of the reclamation liability. The inflation rates have been revised to 0% for 2023, as short-term inflation had already been factored in the 2023 cost estimates, 2.5% for 2024 and 2.0% for the following years. Market premium risk and future costs assumptions did not require adjustments.
For the nine-month period ended September 30, 2023, the Company reviewed and revised some of its December 31, 2022 assumptions and estimates. The discount rate assumption changed in 2023, as it is based on the US Treasury rate. As a result, the discount rate increased from 3.97% to 4.73% in the current period, which decreased the present value of the reclamation liability. The inflation rates have not been revised. Market premium risk and future costs assumptions did not require adjustments.
Changes resulting from the reclamation assumptions revision are recognized as a change in the carrying amount of the reclamation liability and the related asset retirement cost capitalized as part of the carrying amount of the related long-lived asset (see Note 10).
Mountain View, Wildcat and Red Canyon Projects
The provision was calculated using a weighted average risk-free interest rate of 2.0% (December 31, 2022 - 2.0%) and a weighted average inflation rate of 3.0% (December 31, 2022 - 3.0%).
|
Integra Resources Corp. |
17. RECLAMATION AND REMEDIATION LIABILITIES (continued)
Summary of Obligations
The following table details the changes in the reclamation and remediation liability.
| DeLamar Project |
Mountain View |
Wild Cat |
Red Canyon |
Total |
|||||||||||
| Liability balance at December 31, 2021 | $ | 41,466,250 | $ | - | $ | - | $ | - | $ | 41,466,250 | |||||
| Reclamation spending | (1,084,475 | ) | - | - | - | (1,084,475 | ) | ||||||||
| Accretion expenses | 1,013,585 | - | - | - | 1,013,585 | ||||||||||
| Reclamation adjustment | (15,864,249 | ) | - | - | - | (15,864,249 | ) | ||||||||
| Liability balance at December 31, 2022 | 25,531,111 | - | - | - | 25,531,111 | ||||||||||
| New reclamation liability (due to merger) | - | 29,086 | 58,593 | 25,869 | 113,548 | ||||||||||
| Reclamation spending | (927,447 | ) | - | - | - | (927,447 | ) | ||||||||
| Accretion expenses | 772,865 | 240 | 484 | 213 | 773,802 | ||||||||||
| Reclamation adjustment | (3,744,926 | ) | - | - | - | (3,744,926 | ) | ||||||||
| Balance at September 30, 2023 | $ | 21,631,603 | $ | 29,326 | $ | 59,077 | $ | 26,082 | $ | 21,746,088 |
| September 30, 2023 | December 31, 2022 | |||||
| Current reclamation and remediation liability | $ | 1,623,564 | $ | 1,623,564 | ||
| Non-current reclamation and remediation liability | 20,122,524 | 23,907,547 | ||||
| Total reclamation and remediation liability | $ | 21,746,088 | $ | 25,531,111 |
As at September 30, 2023, the current portion of the reclamation and remediation obligation of $1,623,564 represents the total water treatment, general site maintenance and environmental monitoring costs estimated to be incurred from January 1, 2023 - December 31, 2023. The Company has spent $927,447 in the current nine-month period ended September 30, 2023.
Reclamation Deposits
Regulatory authorities in certain jurisdictions require that security be provided to cover the estimated reclamation and remediation obligations.
The Company's reclamation and remediation bonds as of September 30, 2023 amount to $4.5mm.
| Reclamation and Remediation Bonds | September 30, 2023 | December 31, 2022 | ||||
| Idaho Department of Lands* | 3,431,978 | 2,918,829 | ||||
| Idaho Department of Environmental Quality* | 100,000 | 100,000 | ||||
| Bureau of Land Management - Idaho State Office* | 714,400 | 631,400 | ||||
| Bureau of Land Management - Nevada State Office* | 250,000 | - | ||||
| Arizona State Land Department** | 15,000 | - | ||||
| Total | $ | 4,511,378 | $ | 3,650,229 |
*Secured with surety bonds, which are subject to a 2.5% management fee. No cash collateral is required.
**Secured with restricted cash.
|
Integra Resources Corp. |
18. SHARE CAPITAL
Share Capital
On May 26, 2023, the Company consolidated its common shares on the basis of one (1) new post-consolidation common share for every two and a half (2.5) existing pre-consolidation common share (the "Consolidation"). The Consolidation reduces the number of outstanding common shares from 171,943,828 to approximately 68,777,526. Proportionate adjustments have been made to the Company's outstanding stock options, restricted share units, and deferred share units.
The Company is authorized to issue an unlimited number of common shares without par value. As at September 30, 2023, the number of total issued and outstanding common shares is 68,777,526 (December 31, 2022 - 31,905,476).
Activities during the nine-month period ended September 30, 2023
Millennial Acquisition:
The Company acquired Millennial on May 4, 2023. In aggregate, 16,872,050 Integra shares were issued to former Millennial shareholders as consideration for their Millennial shares, at a price of $1.35 for a total of $22,697,554 included in the PPA (see Note 11).
Equity Financings:
In connection with the closing of the acquisition of Millennial, 20,000,000 subscription receipts of Integra issued on March 16, 2023 at a price of C$1.75 per subscription receipt were converted into one Integra share for no additional consideration. The gross proceeds amounted to $26.4 million (C$35 million). The Company paid ~C$1,3 million in brokers' fee and C$0.7 million for various other expenses (mostly legal and filing fees) in connection with the equity financings.
Equity Incentives:
In April 2023, the Company approved a cash redemption of 938 vested RSUs, and as a result, no shares have been issued related to this transaction.
Activities during the year ended December 31, 2022
At the Market ("ATM") Sales:
In the first quarter of 2022, the Company sold 171,199 shares under its ATM at an average price of $3.93 for gross proceeds of $0.7 million and paid 2.75% brokers' fee in commission.
In the third quarter of 2022, the Company sold 136,023 shares under its ATM at an average price of $1.65 for gross proceeds of $0.2 million and paid 2.75% brokers' fee in commission.
Equity Financings:
On August 4, 2022, the Company completed a public bought deal of 6,666,667 common shares with a syndicate of underwriters, at an issue price of $1.65 per share for aggregate gross proceeds of $11.0 million. The Company paid $0.4 million in brokers' fee and $0.4 million for various other expenses (mostly legal and filing fees) in connection with this public bought deal.
|
Integra Resources Corp. |
18. SHARE CAPITAL (continued)
Activities during the year ended December 31, 2022 (continued)
Equity Incentives
In January 2022, the Company approved a cash redemption of 548 vested RSUs, and as a result, no shares have been issued related to this transaction.
In June 2022, the Company approved a cash redemption of 1,200 vested RSUs, and as a result, no shares have been issued related to this transaction.
In December 2022, the Company issued 63,502 shares related to its RSU December 15, 2020 and December 16, 2021 grants.
In December 2022, the Company approved cash redemption of 18,998 vested RSUs, and as a result, no shares have been issued for these RSUs.
Equity Incentive Awards
The Company has an equity incentive plan ("the Equity Incentive Plan") whereby the Company's Board of Directors, within its sole discretion, can grant to directors, officers, employees and consultants, stock options to purchase shares of the Company, restricted share units ("RSU") and deferred share units ("DSU") (together the "Awards"). The Equity Incentive Plan provides for the issuance of Awards to acquire up to 10% of the Company's issued and outstanding capital. The Equity Incentive Plan is a rolling plan as the number of shares reserved for issuance pursuant to the grant of Awards will increase as the Company's issued and outstanding share capital increases. As at September 30, 2023, the Company had 4,110,606 (December 31, 2022 - 1,225,118) awards available for issuance.
In addition, the aggregate number of shares that may be issued and issuable under this Equity Incentive Plan (when combined with all of the Company's other security-based compensation arrangements, as applicable):
(a) to any one participant, within any one-year period shall not exceed 5% of the Company's outstanding issue, unless the Company has received disinterested shareholder approval;
(b) to any one consultant (who is not otherwise an eligible director), within a one-year period shall not exceed 2% of the Company's outstanding issue;
(c) to eligible persons (as a group) retained to provide investor relations activities, within a one-year period shall not exceed 2% of the Company's outstanding issue;
(d) to insiders (as a group) shall not exceed 10% of the Company's outstanding issue from time to time;
(e) to insiders (as a group) within any one-year period shall not exceed 10% of the Company's outstanding issue; and
(f) to any one insider and his or her associates or affiliates within any one-year period shall not exceed 5% of the Company's outstanding issue from time to time.
|
Integra Resources Corp. |
18. SHARE CAPITAL (continued)
Equity Incentive Awards (continued)
In no event will the number of shares that may be issued to any one participant pursuant to Awards under this Equity Incentive Plan (when combined with all of the Company's other security-based compensation arrangement, as applicable) exceed 5% of the Company's outstanding issue from time to time.
Stock Options
A summary of the changes in stock options for the nine-month period ended September 30, 2023 and the year ended December 31, 2022 is as follows:
| Options | September 30, 2023 Weighted Average Exercise Price |
Options | December 31, 2022 Weighted Average Exercise Price |
|||||||||
| Outstanding at the beginning of period | 1,478,773 | $ | 5.35 | 2,037,313 | $ | 5.28 | ||||||
| Granted | 956,608 | 3.56 | 30,100 | 1.59 | ||||||||
| Forfeited/Expired | (406,109 | ) | 4.00 | (588,640 | ) | 4.90 | ||||||
| Outstanding at the end of period | 2,029,272 | $ | 4.78 | 1,478,773 | $ | 5.35 |
The following table provides additional information about outstanding stock options as September 30, 2023:
|
|
No. of |
Weighted |
Exercise price |
No. of |
Expiration date |
|
|
292,560 |
|
$3.78 |
292,560 |
November 23, 2023 |
|
|
40,000 |
|
$3.74 |
40,000 |
December 13, 2023 |
|
|
16,000 |
|
$4.10 |
16,000 |
January 11, 2024 |
|
|
20,000 |
|
$4.06 |
20,000 |
January 16, 2024 |
|
|
40,000 |
|
$6.18 |
40,000 |
September 16, 2024 |
|
|
544,227 |
|
$5.46 |
544,227 |
December 17, 2024 |
|
|
32,000 |
|
$3.49 |
32,000 |
March 16, 2025 |
|
|
16,000 |
|
$8.33 |
10,667 |
October 5, 2025 |
|
|
114,273 |
|
$9.26 |
87,848 |
December 15, 2025 |
|
|
40,000 |
|
$8.45 |
40,000 |
February 24, 2026 |
|
|
156,604 |
|
$5.10 |
69,802 |
December 16, 2026 |
|
|
30,100 |
|
$1.59 |
- |
December 15, 2027 |
|
|
191,904 |
|
$1.63 |
22,002 |
January 10, 2028 |
|
|
22,080* |
|
$5.29 |
22,080 |
May 4, 2024 |
|
|
18,400* |
|
$4.00 |
9,200 |
May 4, 2024 |
|
|
239,844* |
|
$4.00 |
119,922 |
May 28, 2026 |
|
|
13,800* |
|
$4.16 |
13,800 |
April 5, 2027 |
|
|
36,800* |
|
$5.29 |
36,800 |
January 5, 2027 |
|
|
164,680* |
|
$5.29 |
164,680 |
January 5, 2027 |
|
Total |
2,029,272 |
1.98 |
$4.78 |
1,581,588 |
|
*Replacement options issued in conjunction with the Millennial acquisition (see Note 11).
|
Integra Resources Corp. |
18. SHARE CAPITAL (continued)
Share-based payments - stock options
A summary of the changes in the Company's reserve for share-based payments related to the stock options for the nine-month periods ended September 30, 2023 and 2022 is set out below:
| September 30, 2023 | September 30, 2022 | |||||
| Balance at beginning of period | $ | 5,902,436 | $ | 5,470,552 | ||
| Share-based payments - replacement options | 31,888 | - | ||||
| Share-based payments - options | 148,860 | 352,471 | ||||
| Balance at the end of period | $ | 6,083,184 | $ | 5,823,023 |
Total stock-based compensation expenses related to the stock options included in the consolidated statements of operations and comprehensive loss and the consolidated statements of changes in equity in the nine-month period ended September 30, 2023 was $148,860 (September 30, 2022 - $352,471).
On May 4, 2023, the Company granted 764,704 replacement stock options to Millennial's employees and consultants (see Note 11), at the price range of $2.40 - $5.29. Of these replacement options, 207,000 expired on the following day and 62,100 expired on August 4, 2023. The share-based payment related to those replacement stock options was calculated as $31,888 and included in the PPA (see Note 11).
On January 10, 2023, the Company granted 191,904 stock options to its directors and officers, at an exercise price of $1.63 per option, with the expiry date January 10, 2028. The options were granted in accordance with the Company's Equity Incentive Plan and are subject to vesting provisions. The share-based payment related to these options was calculated as $137,900, to be amortized over the options vesting period.
On December 15, 2022, the Company granted 30,100 options to its employees and contractors, at an exercise price of $1.60 per option, with the expiry date December 15, 2027. The options were granted in accordance with the Company's Equity Incentive Plan and are subject to vesting provisions. The share-based payment related to these options was calculated as $22,366, to be amortized over the options vesting period.
The following assumptions were used for the Black-Scholes valuation of stock options granted during the nine-month periods ended September 30, 2023 and 2022:
| September 30, 2023 | September 30, 2022 | |||||
| Dividend rate | 0% | - | ||||
| Expected annualized volatility | 51.99% - 61.47% | - | ||||
| Risk free interest rate | 3.15% - 4.43% | - | ||||
| Expected life of options | 1 - 3.5 yr | - | ||||
| Weighted average of strike price of options granted | $3.56 | - |
Restricted Share Units
Restricted share units are the equity settled units, granted under the Company's Equity Incentive Plan and are accounted for based on the market value of the underlying shares on the date of grant and vest in equal installments annually over three years. The aggregate maximum number of shares available for issuance from treasury underlying restricted share units under the Equity Incentive Plan is 1,200,000 shares. These units are exercisable into one common share once vested, for no additional consideration. They can be redeemed in cash, at the Company's discretion.
|
Integra Resources Corp. |
18. SHARE CAPITAL (continued)
Restricted Share Units (continued)
A summary of the changes in restricted share units for the nine-month period ended September 30, 2023 and the year ended December 31, 2022 is as follows:
| Restricted share units |
Weighted average grant date FV |
|||||
| Outstanding, December 31, 2021* | 292,389 | $ | 7.03 | |||
| Vested - shares issued | (68,748 | ) | $ | 6.75 | ||
| Vested - cash redemption (no shares issued) | (20,747 | ) | $ | 6.75 | ||
| Forfeited/Expired | (12,148 | ) | $ | 5.40 | ||
| Granted | 101,300 | $ | 1.60 | |||
| Outstanding, December 31, 2022** | 292,046 | $ | 5.60 | |||
| Forfeited/Expired (unvested) | (21,723 | ) | $ | 3.08 | ||
| Vested - cash redemption (no shares issued) | (938 | ) | $ | 6.05 | ||
| Granted | 116,124 | $ | 1.64 | |||
| Outstanding, September 30, 2023 ** | 385,509 | $ | 4.55 |
*Included in the outstanding RSUs are 7,467 vested RSUs for which the settlement has been deferred.
**Included in the outstanding RSUs are 17,467 vested RSUs for which the settlement has been deferred in 2022 and 7,467 vested RSUs for which settlement has been deferred in 2021.
Share-based payments - restricted share units
A summary of the changes in the Company's reserve for share-based payments related to the restricted share units for the nine-month periods ended September 30, 2023 and 2022 is set out below:
| September 30, 2023 | September 30, 2022 | |||||
| Balance at beginning of period | $ | 898,463 | $ | 528,810 | ||
| Share-based payments - RSUs | 398,324 | 696,670 | ||||
| Share-based payments - RSUs vested | (1,256 | ) | (5,743 | ) | ||
| Balance at the end of period | $ | 1,295,531 | $ | 1,219,737 |
Total stock-based compensation expenses related to the restricted share units included in the consolidated statements of operations and comprehensive loss and the consolidated statements of changes in equity in the nine-month period ended September 30, 2023 was $398,324 (September 30, 2022 - $696,670).
On January 10, 2023, the Company granted 116,124 RSUs to its officers as a long-term incentives grant for the fiscal year 2022. The share-based payment related to these units was calculated as $188,884, to be amortized over the unit three-year vesting period.
During the year ended December 31, 2022, a total of 106,962 RSUs vested (including 17,467 RSUs for which the settlement was deferred to future years) and 12,148 RSUs were canceled.
On December 15, 2022, the Company granted 101,300 RSUs to its employees. The share-based payment related to these units was calculated as $169,318, to be amortized over the unit three-year vesting period.
|
Integra Resources Corp. |
18. SHARE CAPITAL (continued)
Deferred Share Units
Deferred share units are equity settled units, granted under the Company's Equity Incentive Plan and are accounted for based on the market value of the underlying shares on the date of grant. DSUs granted before Q4 2021 vested immediately. DSUs granted from Q4 2021 onward will vest one year post grant. The aggregate maximum number of shares available for issuance from treasury underlying deferred share units under the Equity Incentive Plan is 1,200,000 shares. These units are exercisable into one common share during the period commencing on the business day immediately following the retirement date and ending on the ninetieth day following the retirement date providing a written redemption notice to the Company, for no additional consideration. In the event a participant resigns or is otherwise no longer an eligible participant during the year, then any grant of DSUs that are intended to cover such year, the participant will only be entitled to a pro-rated DSU payment. These units can be redeemed in cash, at the Company's discretion.
A summary of the changes in deferred share units for the nine-month period ended September 30, 2023 and the year ended December 31, 2022 is as follows:
| Deferred share units |
Weighted average grant date FV |
Vested |
Not vested |
|||||||||
| Outstanding, December 31, 2021 | 126,267 | $ | 6.53 | 43,607 | 82,660 | |||||||
| Granted | 68,343 | $ | 1.80 | - | 68,343 | |||||||
| Vested | - | $ | 5.43 | 82,660 | (82,660 | ) | ||||||
| Outstanding, December 31, 2022 | 194,610 | $ | 4.73 | 126,267 | 68,343 | |||||||
| Granted | 157,756 | $ | 1.43 | - | 157,756 | |||||||
| Vested | - | $ | 1.80 | 49,179 | (49,179 | ) | ||||||
| Outstanding, September 30, 2023 | 352,366 | $ | 3.16 | 175,446 | 176,920 |
Share-based payments - deferred share units
A summary of the changes in the Company's reserve for share-based payments related to the deferred share units for the nine-month periods ended September 30, 2023 and 2022 is set out below:
| September 30, 2023 | September 30, 2022 | |||||
| Balance at beginning of period | $ | 838,869 | $ | 400,117 | ||
| Share-based payments - DSUs | 210,970 | 347,479 | ||||
| Balance at the end of period | $ | 1,049,839 | $ | 745,596 |
Total stock-based compensation expenses related to the deferred share units included in the consolidated statements of operations and comprehensive loss and the consolidated statements of changes in equity in the nine-month period ended September 30, 2023 was $210,970 (September 30, 2022 - $347,479).
In the current nine-month period ended September 30, 2023, the Company issued 58,756 deferred share units to certain directors, in lieu of their directors' fees, as elected by those directors. Each DSU has been fair valued at Integra's closing share price at the end of quarter. The Company also granted 99,000 DSUs in January 2023 as a long-term incentives grant for the fiscal year 2022. These DSUs will vest 12 months post grant. The share-based payment related to these DSUs was calculated as $304,049, to be amortized over 12 months.
|
Integra Resources Corp. |
18. SHARE CAPITAL (continued)
Share-based payments - deferred share units (continued)
In the year ended December 31, 2022, the Company issued 68,343 deferred share units to certain directors, in lieu of their directors' fees, as elected by those directors. Each DSU has been fair valued at Integra's closing share price at the end of quarter. These DSUs will vest 12 months post grant. The share-based payment related to these DSUs was calculated as $123,774, to be amortized over 12 months.
Share-based payments - summary
A summary of the changes in the Company's reserve for all share-based payment arrangements for the nine-month periods ended September 30, 2023 and 2022 is set out below:
| September 30, 2023 | September 30, 2022 | |||||
| Balance at beginning of period | $ | 7,639,768 | $ | 6,399,479 | ||
| Share-based payments - replacement options | 31,888 | - | ||||
| Share-based payments - options | 148,860 | 352,471 | ||||
| Share-based payments - RSUs | 398,324 | 696,670 | ||||
| Share-based payments - DSUs | 210,970 | 347,479 | ||||
| RSUs vested | (1,256 | ) | (5,743 | ) | ||
| Balance at the end of period | $ | 8,428,554 | $ | 7,790,356 |
Total stock-based compensation expenses related to the stock options, RSUs, and DSUs included in the consolidated statements of operations and comprehensive loss and the consolidated statements of changes in equity in the nine-month period ended September 30, 2023 was $758,154 (September 30, 2022 - $1,396,620).
Warrant reserve
The Company assumed 21,903,504 warrants as a result of the Millennial acquisition (see Note 11). Each warrant can be exercised for 0.092 Integra shares. As a result, a maximum of 2,015,122 Integra shares would be issuable upon exercise of the warrants.
The following warrants were outstanding as at September 30, 2023:
| Number and type of warrants outstanding | Issue date | Expiry Date | Exercise price |
|||||||||
| Warrants | 20,092,415 | June 16, 2022 | June 16, 2024 | C$0.55 | ||||||||
| Broker Warrants | 1,811,089 | June 16, 2022 | June 16, 2024 | C$0.40 | ||||||||
| 21,903,504 | C$0.54 |
A summary of the changes in the Company's reserve related to the warrants for the nine-month periods ended September 30, 2023 and 2022 is set out below:
| September 30, 2023 | September 30, 2022 | |||||
| Balance at beginning of period | $ | 724,874 | $ | 724,874 | ||
| Share-based payments - warrants (merger) | 44,630 | - | ||||
| Balance at the end of period | $ | 769,504 | $ | 724,874 |
|
Integra Resources Corp. |
19. NET LOSS PER SHARE
| September 30, 2023 |
September 30, 2022 |
|||||
| Net loss for the period | $ | (22,020,106 | ) | $ | (13,602,301 | ) |
| Basic weighted average numbers of share outstanding (000's) | 52,165 | 26,436 | ||||
| Diluted weighted average numbers of shares outstanding (000's) | 52,165 | 26,436 | ||||
| Loss per share: | ||||||
| Basic | $ | (0.42 | ) | $ | (0.51 | ) |
| Diluted* | $ | (0.42 | ) | $ | (0.51 | ) |
*Basic loss per share is computed by dividing net loss (the numerator) by the weighted average number of outstanding common shares for the period (the denominator). Options, RSUs, DSUs and warrants outstanding have been excluded from computing diluted loss per share because they are anti-dilutive or not in the money.
FORM 52-109F2
CERTIFICATION OF INTERIM FILINGS
FULL CERTIFICATE
I, Jason Kosec, Chief Executive Officer of Integra Resources Corp., certify the following:
1. Review: I have reviewed the interim financial report and interim MD&A (together, the "interim filings") of Integra Resources Corp. (the "issuer") for the interim period ended September 30, 2023.
2. No misrepresentations: Based on my knowledge, having exercised reasonable diligence, the interim filings do not contain any untrue statement of a material fact or omit to state a material fact required to be stated or that is necessary to make a statement not misleading in light of the circumstances under which it was made, with respect to the period covered by the interim filings.
3. Fair presentation: Based on my knowledge, having exercised reasonable diligence, the interim financial report together with the other financial information included in the interim filings fairly present in all material respects the financial condition, financial performance and cash flows of the issuer, as of the date of and for the periods presented in the interim filings.
4. Responsibility: The issuer's other certifying officer(s) and I are responsible for establishing and maintaining disclosure controls and procedures (DC&P) and internal control over financial reporting (ICFR), as those terms are defined in National Instrument 52-109 Certification of Disclosure in Issuers' Annual and Interim Filings, for the issuer.
5. Design: Subject to the limitations, if any, described in paragraphs 5.2 and 5.3, the issuer's other certifying officer(s) and I have, as at the end of the period covered by the interim filings
(a) designed DC&P, or caused it to be designed under our supervision, to provide reasonable assurance that
(i) material information relating to the issuer is made known to us by others, particularly during the period in which the interim filings are being prepared; and
(ii) information required to be disclosed by the issuer in its annual filings, interim filings or other reports filed or submitted by it under securities legislation is recorded, processed, summarized and reported within the time periods specified in securities legislation; and
(b) designed ICFR, or caused it to be designed under our supervision, to provide reasonable assurance regarding the reliability of financial reporting and the preparation of financial statements for external purposes in accordance with the issuer's GAAP.
5.1 Control framework: The control framework the issuer's other certifying officer(s) and I used to design the issuer's ICFR is the Internal Control - Integrated Framework (2013) (COSO Framework) published by The Committee of Sponsoring Organizations of the Treadway Commission (COSO).
5.2 ICFR - material weakness relating to design: N/A
5.3 Limitation on scope of design: N/A
6. Reporting changes in ICFR: The issuer has disclosed in its interim MD&A any change in the issuer's ICFR that occurred during the period beginning on July 1, 2023 and ended on September 30, 2023 that has materially affected, or is reasonably likely to materially affect, the issuer's ICFR.
Date: November 14, 2023
| /s/ Jason Kosec | |
| Jason Kosec | |
| Chief Executive Officer |
FORM 52-109F2
CERTIFICATION OF INTERIM FILINGS
FULL CERTIFICATE
I, Andree St-Germain, Chief Financial Officer of Integra Resources Corp., certify the following:
1. Review: I have reviewed the interim financial report and interim MD&A (together, the "interim filings") of Integra Resources Corp. (the "issuer") for the interim period ended September 30, 2023.
2. No misrepresentations: Based on my knowledge, having exercised reasonable diligence, the interim filings do not contain any untrue statement of a material fact or omit to state a material fact required to be stated or that is necessary to make a statement not misleading in light of the circumstances under which it was made, with respect to the period covered by the interim filings.
3. Fair presentation: Based on my knowledge, having exercised reasonable diligence, the interim financial report together with the other financial information included in the interim filings fairly present in all material respects the financial condition, financial performance and cash flows of the issuer, as of the date of and for the periods presented in the interim filings.
4. Responsibility: The issuer's other certifying officer(s) and I are responsible for establishing and maintaining disclosure controls and procedures (DC&P) and internal control over financial reporting (ICFR), as those terms are defined in National Instrument 52-109 Certification of Disclosure in Issuers' Annual and Interim Filings, for the issuer.
5. Design: Subject to the limitations, if any, described in paragraphs 5.2 and 5.3, the issuer's other certifying officer(s) and I have, as at the end of the period covered by the interim filings
(a) designed DC&P, or caused it to be designed under our supervision, to provide reasonable assurance that
(i) material information relating to the issuer is made known to us by others, particularly during the period in which the interim filings are being prepared; and
(ii) information required to be disclosed by the issuer in its annual filings, interim filings or other reports filed or submitted by it under securities legislation is recorded, processed, summarized and reported within the time periods specified in securities legislation; and
(b) designed ICFR, or caused it to be designed under our supervision, to provide reasonable assurance regarding the reliability of financial reporting and the preparation of financial statements for external purposes in accordance with the issuer's GAAP.
5.1 Control framework: The control framework the issuer's other certifying officer(s) and I used to design the issuer's ICFR is the Internal Control - Integrated Framework (2013) (COSO Framework) published by The Committee of Sponsoring Organizations of the Treadway Commission (COSO).
5.2 ICFR - material weakness relating to design: N/A
5.3 Limitation on scope of design: N/A
6. Reporting changes in ICFR: The issuer has disclosed in its interim MD&A any change in the issuer's ICFR that occurred during the period beginning on July 1, 2023 and ended on September 30, 2023 that has materially affected, or is reasonably likely to materially affect, the issuer's ICFR.
Date: November 14, 2023
| /s/ Andree St-Germain | |
| Andree St-Germain | |
| Chief Financial Officer |
CONSENT OF TIMOTHY ARNOLD
The undersigned hereby consents to:
(1) the inclusion in this Current Report on Form 6-K of Integra Resources Corp. (the "Company") of the scientific and/or technical information contained in the Company's Management's Discussion and Analysis dated November 14, 2023 (the "Technical Information") being filed with the United States Securities and Exchange Commission (the "SEC") under cover of Form 6-K; and
(2) the filing of this consent under cover of Form 6-K with the SEC and of the incorporation by reference of this consent, the use of my name and the Technical Information into the Company's Registration Statements on Form S-8 (File Nos. 333-242495 and 333-267507), and any amendments thereto, filed with the SEC.
| /s/ Timothy Arnold | |
| Name: Timothy Arnold (P.E.) | |
| Title: Chief Operating Officer, Integra Resources Corp. | |
| Date: November 14, 2023 |
CONSENT OF RAPHAEL DUTAUT
The undersigned hereby consents to:
(1) the inclusion in this Current Report on Form 6-K of Integra Resources Corp. (the "Company") of the scientific and/or technical information contained in the Company's Management's Discussion and Analysis dated November 14, 2023 (the "Technical Information") being filed with the United States Securities and Exchange Commission (the "SEC") under cover of Form 6-K; and
(2) the filing of this consent under cover of Form 6-K with the SEC and of the incorporation by reference of this consent, the use of my name and the Technical Information into the Company's Registration Statements on Form S-8 (File Nos. 333-242495 and 333-267507), and any amendments thereto, filed with the SEC.
| /s/ Raphael Dutaut | |
| Name: Raphael Dutaut (Ph.D., P.Geo, OGQ Membership 1301) |
|
| Title: VP Exploration, Integra Resources Corp. | |
| Date: November 14, 2023 |