
Keycorp /New/ 8-K, filed Apr 21, 2022
Keycorp /New/ (KEY)
8-K
2022-04-21
For: 2022-04-21
View Original
Added on
April 10, 2026
About this 8-K
Keycorp /New/ filed this 8-K on April 21, 2022.
Items reported
- Item 2.02: Financial results
- Item 9.01: Financial statements and exhibits
UNITED STATES SECURITIES AND EXCHANGE COMMISSION
Washington, D.C. 20549
FORM 8-K
CURRENT REPORT
Pursuant to Section 13 or 15(d) of the Securities Exchange Act of 1934 | ||
Date of Report (Date of earliest event reported): April 21, 2022

(Exact name of registrant as specified in its charter)
| State or other jurisdiction of incorporation or organization: | Commission File Number | I.R.S. Employer Identification Number: | ||||||||||||
| Address of principal executive offices: | Zip Code: | |||||||||||||
(216 ) 689-3000
Registrant’s telephone number, including area code:
| Check the appropriate box below if the Form 8-K filing is intended to simultaneously satisfy the filing obligation of the registrant under any of the following provisions (see General Instruction A.2. below): | |||||
| Written communications pursuant to Rule 425 under the Securities Act (17 CFR 230.425) | |||||
| Soliciting material pursuant to Rule 14a-12 under the Exchange Act (17 CFR 240.14a-12) | |||||
| Pre-commencement communications pursuant to Rule 14d-2(b) under the Exchange Act (17 CFR 240.14d-2(b)) | |||||
| Pre-commencement communications pursuant to Rule 13e-4(c) under the Exchange Act (17 CFR 240.13e-4(c)) | |||||
Securities Registered Pursuant to Section 12(b) of the Act:
| Title of each class | Trading Symbol(s) | Name of each exchange on which registered | ||||||
Indicate by check mark whether the registrant is an emerging growth company as defined in Rule 405 of the Securities Act of 1933 (§230.405 of this chapter) or Rule 12b-2 of the Securities Exchange Act of 1934 (§240.12b-2 of this chapter).
Emerging growth company ☐
If an emerging growth company, indicate by check mark if the registrant has elected not to use the extended transition period for complying with any new or revised financial accounting standards provided pursuant to Section 13(a) of the Exchange Act. ☐
Item 2.02 Results of Operations and Financial Condition.
On April 21, 2022, KeyCorp issued a press release announcing its financial results for the three-month period ended March 31, 2022 (the “Press Release”), and posted on its website its first quarter 2022 Supplemental Information Package (the “Supplemental Information Package”). The Press Release and Supplemental Information Package are being furnished as Exhibit 99.1 and Exhibit 99.2, respectively.
The information in the preceding paragraph, as well as Exhibit 99.1 and Exhibit 99.2 referenced therein, shall not be deemed “filed” for purposes of the Securities Exchange Act of 1934, as amended (the “Exchange Act”), nor shall it be incorporated by reference in any filing under the Securities Act of 1933, as amended (the “Securities Act”).
KeyCorp’s Consolidated Balance Sheets and Consolidated Statements of Income (collectively, the “Financial Statements”), included as part of the Press Release, are filed as Exhibit 99.3 to this report. Exhibit 99.3 is deemed “filed” for purposes of Section 18 of the Exchange Act and, therefore, may be incorporated by reference in filings under the Securities Act.
Item 9.01 Financial Statements and Exhibits.
(d) Exhibits
The following exhibits are furnished, or filed in the case of Exhibit 99.3, herewith:
104 Cover Page Interactive Data File (embedded within the Inline XBRL document).
| SIGNATURE | ||||||||
| Pursuant to the requirements of the Securities Exchange Act of 1934, the registrant has duly caused this report to be signed on its behalf by the undersigned hereunto duly authorized. | ||||||||
| KEYCORP | ||||||||
| (Registrant) | ||||||||
| Date: April 21, 2022 | /s/ Douglas M. Schosser | |||||||
| By: Douglas M. Schosser | ||||||||
| Chief Accounting Officer | ||||||||

KEYCORP REPORTS FIRST QUARTER 2022 NET INCOME OF $420 MILLION,
OR $.45 PER DILUTED COMMON SHARE
Strong loan growth driven by consumer and commercial businesses
Record loan originations from Laurel Road
Net interest income reflects strong loan growth and liquidity deployment
Noninterest income adversely impacted by market conditions late in the quarter
Credit quality remains strong with net charge-offs to average loans of 13 basis points
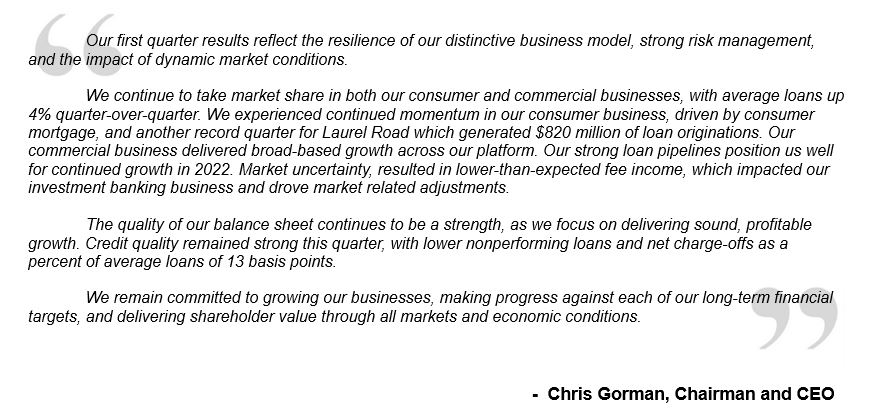
CLEVELAND, April 21, 2022 - KeyCorp (NYSE: KEY) today announced net income from continuing operations attributable to Key common shareholders of $420 million, or $.45 per diluted common share for the first quarter of 2022. This compared to $601 million, or $.64 per diluted common share, for the fourth quarter of 2021 and $591 million, or $.61 per diluted common share, for the first quarter of 2021.
KeyCorp Reports First Quarter 2022 Profit
April 21, 2022
Page 2
| Selected Financial Highlights | |||||||||||||||||||||||
| Dollars in millions, except per share data | Change 1Q22 vs. | ||||||||||||||||||||||
| 1Q22 | 4Q21 | 1Q21 | 4Q21 | 1Q21 | |||||||||||||||||||
| Income (loss) from continuing operations attributable to Key common shareholders | $ | 420 | $ | 601 | $ | 591 | (30.1) | % | (28.9) | % | |||||||||||||
Income (loss) from continuing operations attributable to Key common shareholders per common share — assuming dilution | .45 | .64 | .61 | (29.7) | (26.2) | ||||||||||||||||||
Return on average tangible common equity from continuing operations (a) | 14.12 | % | 18.69 | % | 18.25 | % | N/A | N/A | |||||||||||||||
| Return on average total assets from continuing operations | .99 | 1.34 | 1.44 | N/A | N/A | ||||||||||||||||||
Common Equity Tier 1 ratio (b) | 9.4 | 9.5 | 9.9 | N/A | N/A | ||||||||||||||||||
| Book value at period end | $ | 14.43 | $ | 16.76 | $ | 16.22 | (13.9) | (11.0) | |||||||||||||||
| Net interest margin (TE) from continuing operations | 2.46 | % | 2.44 | % | 2.61 | % | N/A | N/A | |||||||||||||||
(a)The table entitled “GAAP to Non-GAAP Reconciliations” in the attached financial supplement presents the computations of certain financial measures related to “Return on average tangible common equity from continuing operations.” The table reconciles the GAAP performance measures to the corresponding non-GAAP measures, which provides a basis for period-to-period comparisons.
(b)March 31, 2022 ratio is estimated.
TE = Taxable Equivalent, N/A = Not Applicable
| INCOME STATEMENT HIGHLIGHTS | ||||||||||||||||||||
| Revenue | ||||||||||||||||||||
| Dollars in millions | Change 1Q22 vs. | |||||||||||||||||||
| 1Q22 | 4Q21 | 1Q21 | 4Q21 | 1Q21 | ||||||||||||||||
| Net interest income (TE) | $ | 1,020 | $ | 1,038 | $ | 1,012 | (1.7) | % | .8 | % | ||||||||||
| Noninterest income | 676 | 909 | 738 | (25.6) | (8.4) | |||||||||||||||
| Total revenue | $ | 1,696 | $ | 1,947 | $ | 1,750 | (12.9) | % | (3.1) | % | ||||||||||
TE = Taxable Equivalent
Taxable-equivalent net interest income was $1.0 billion for the first quarter of 2022 and the net interest margin was 2.46%. Compared to the first quarter of 2021, net interest income increased $8 million, while the net interest margin decreased by 15 basis points. Net interest income and the net interest margin benefited from higher earning asset balances and a favorable balance sheet mix. Net interest income and the net interest margin were negatively impacted by lower reinvestment yields, the exit of the indirect auto loan portfolio, and lower loan fees from the Paycheck Protection Program ("PPP").
Compared to the fourth quarter of 2021, taxable-equivalent net interest income decreased by $18 million and the net interest margin increased by two basis points. Net interest income was negatively impacted by two fewer days in the first quarter of 2022. Additionally, net interest income and the net interest margin benefited from a favorable earning asset mix, including the deployment of liquidity into loans and higher-yielding investments and were negatively impacted by lower loan fees related to the PPP.
| Noninterest Income | ||||||||||||||||||||
| Dollars in millions | Change 1Q22 vs. | |||||||||||||||||||
| 1Q22 | 4Q21 | 1Q21 | 4Q21 | 1Q21 | ||||||||||||||||
| Trust and investment services income | $ | 136 | $ | 135 | $ | 133 | .7 | % | 2.3 | % | ||||||||||
| Investment banking and debt placement fees | 163 | 323 | 162 | (49.5) | .6 | |||||||||||||||
| Service charges on deposit accounts | 91 | 90 | 73 | 1.1 | 24.7 | |||||||||||||||
| Operating lease income and other leasing gains | 32 | 37 | 38 | (13.5) | (15.8) | |||||||||||||||
| Corporate services income | 90 | 73 | 64 | 23.3 | 40.6 | |||||||||||||||
| Cards and payments income | 80 | 86 | 105 | (7.0) | (23.8) | |||||||||||||||
| Corporate-owned life insurance income | 31 | 34 | 31 | (8.8) | — | |||||||||||||||
| Consumer mortgage income | 21 | 25 | 47 | (16.0) | (55.3) | |||||||||||||||
| Commercial mortgage servicing fees | 36 | 48 | 34 | (25.0) | 5.9 | |||||||||||||||
| Other income | (4) | 58 | 51 | (106.9) | (107.8) | |||||||||||||||
| Total noninterest income | $ | 676 | $ | 909 | $ | 738 | (25.6) | % | (8.4) | % | ||||||||||
KeyCorp Reports First Quarter 2022 Profit
April 21, 2022
Page 3
Compared to the first quarter of 2021, noninterest income decreased by $62 million. The decrease was primarily driven by other income, down $55 million, reflecting market related adjustments. Other drivers for the decrease include consumer mortgage income and cards and payments income, down $26 million and $25 million, respectively, reflecting lower gain on sale margins and lower levels of prepaid card activity. Partially offsetting the decrease was a $26 million increase in corporate services income, driven by higher derivatives trading income and an $18 million increase in service charges on deposit accounts.
Compared to the fourth quarter of 2021, noninterest income decreased by $233 million. The primary driver was investment banking and debt placement fees, which decreased $160 million, reflecting seasonality and slowing capital markets activity late in the quarter. Other income decreased $62 million, reflecting market related adjustments. Partially offsetting the decrease was a $17 million increase in corporate services income, driven by higher derivatives trading income.
| Noninterest Expense | ||||||||||||||||||||
| Dollars in millions | Change 1Q22 vs. | |||||||||||||||||||
| 1Q22 | 4Q21 | 1Q21 | 4Q21 | 1Q21 | ||||||||||||||||
| Personnel expense | $ | 630 | $ | 674 | $ | 624 | (6.5) | % | 1.0 | % | ||||||||||
| Nonpersonnel expense | 440 | 496 | 447 | (11.3) | (1.6) | |||||||||||||||
| Total noninterest expense | $ | 1,070 | $ | 1,170 | $ | 1,071 | (8.5) | % | (.1) | % | ||||||||||
Key’s noninterest expense was $1.1 billion for the first quarter of 2022, a decrease of $1 million from the year-ago period. Nonpersonnel expense decreased $7 million, reflecting a broad-based decline across several expense categories. Personnel expense increased $6 million, driven by higher salaries from merit increases and technology contract labor, partially offset by lower incentive compensation and employee benefits expense.
Compared to the fourth quarter of 2021, noninterest expense decreased $100 million. The decrease was primarily related to a $56 million decrease in nonpersonnel expense, reflecting lower professional fees as well as lower other expense. Additionally, personnel expense decreased $44 million, primarily driven by lower incentive compensation as a result of lower investment banking and debt placement fees.
| BALANCE SHEET HIGHLIGHTS | ||||||||||||||||||||
| Average Loans | ||||||||||||||||||||
| Dollars in millions | Change 1Q22 vs. | |||||||||||||||||||
| 1Q22 | 4Q21 | 1Q21 | 4Q21 | 1Q21 | ||||||||||||||||
Commercial and industrial (a) | $ | 51,574 | $ | 49,510 | $ | 52,581 | 4.2 | % | (1.9) | % | ||||||||||
| Other commercial loans | 20,556 | 19,743 | 18,848 | 4.1 | 9.1 | |||||||||||||||
| Total consumer loans | 31,632 | 30,144 | 29,299 | 4.9 | 8.0 | |||||||||||||||
| Total loans | $ | 103,762 | $ | 99,397 | $ | 100,728 | 4.4 | % | 3.0 | % | ||||||||||
(a)Commercial and industrial average loan balances include $141 million, $141 million, and $126 million of assets from commercial credit cards at March 31, 2022, December 31, 2021, and March 31, 2021, respectively.
Average loans were $103.8 billion for the first quarter of 2022, an increase of $3.0 billion compared to the first quarter of 2021. Consumer loans increased $2.3 billion, reflecting strength from Key's consumer mortgage business and Laurel Road, partly offset by the sale of the indirect auto loan portfolio. Additionally, commercial loans increased by $701 million, reflecting strength in commercial mortgage real estate loans and core commercial and industrial loans, partially offset by a decline in PPP balances.
Compared to the fourth quarter of 2021, average loans increased by $4.4 billion. Commercial loans increased $2.9 billion, reflecting strength in commercial and industrial loans and commercial mortgage real estate loans, partially offset by a decline in PPP balances. Consumer loans increased $1.5 billion, driven by continued strength in Key's consumer mortgage business and record Laurel Road originations.
KeyCorp Reports First Quarter 2022 Profit
April 21, 2022
Page 4
| Average Deposits | ||||||||||||||||||||
| Dollars in millions | Change 1Q22 vs. | |||||||||||||||||||
| 1Q22 | 4Q21 | 1Q21 | 4Q21 | 1Q21 | ||||||||||||||||
| Non-time deposits | $ | 146,426 | $ | 146,979 | $ | 132,267 | (.4) | % | 10.7 | % | ||||||||||
| Certificates of deposit ($100,000 or more) | 1,639 | 1,793 | 2,571 | (8.6) | (36.3) | |||||||||||||||
| Other time deposits | 2,098 | 2,233 | 2,902 | (6.0) | (27.7) | |||||||||||||||
| Total deposits | $ | 150,163 | $ | 151,005 | $ | 137,740 | (.6) | % | 9.0 | % | ||||||||||
| Cost of total deposits | .04 | % | .04 | % | .06 | % | N/A | N/A | ||||||||||||
N/A = Not Applicable
Average deposits totaled $150.2 billion for the first quarter of 2022, an increase of $12.4 billion compared to the year-ago quarter. The increase reflects growth from consumer and commercial relationships, including higher commercial escrow and retail deposits, partially offset by a decline in time deposits.
Compared to the fourth quarter of 2021, average deposits decreased by $842 million, driven by lower levels of commercial deposits, partly offset by seasonal retail deposit inflows.
| ASSET QUALITY | ||||||||||||||||||||
| Dollars in millions | Change 1Q22 vs. | |||||||||||||||||||
| 1Q22 | 4Q21 | 1Q21 | 4Q21 | 1Q21 | ||||||||||||||||
| Net loan charge-offs | $ | 33 | $ | 19 | $ | 114 | 73.7 | % | (71.1) | % | ||||||||||
| Net loan charge-offs to average total loans | .13 | % | .08 | % | .46 | % | N/A | N/A | ||||||||||||
| Nonperforming loans at period end | $ | 439 | $ | 454 | $ | 728 | (3.3) | (39.7) | ||||||||||||
| Nonperforming assets at period end | 467 | 489 | 790 | (4.5) | (40.9) | |||||||||||||||
| Allowance for loan and lease losses | 1,105 | 1,061 | 1,438 | 4.1 | (23.2) | |||||||||||||||
| Allowance for credit losses | 1,271 | 1,221 | 1,616 | 4.1 | (21.3) | |||||||||||||||
| Provision for credit losses | 83 | 4 | (93) | N/M | 189.2 | |||||||||||||||
| Allowance for loan and lease losses to nonperforming loans | 251.7 | % | 233.7 | % | 197.5 | % | N/A | N/A | ||||||||||||
| Allowance for credit losses to nonperforming loans | 289.5 | 268.9 | 222.0 | N/A | N/A | |||||||||||||||
N/A = Not Applicable; N/M = Not Meaningful
Key's provision for credit losses was $83 million, compared to a net benefit of $93 million in the first quarter of 2021 and provision of $4 million in the fourth quarter of 2021. The increase from prior periods reflects the uncertain economic outlook arising from the Ukraine conflict, risks associated with higher inflation, and loan growth.
Net loan charge-offs for the first quarter of 2022 totaled $33 million, or .13% of average total loans. These results compare to $114 million, or .46%, for the first quarter of 2021 and $19 million, or .08%, for the fourth quarter of 2021. Key’s allowance for credit losses was $1.3 billion, or 1.19% of total period-end loans at March 31, 2022, compared to 1.60% at March 31, 2021, and 1.20% at December 31, 2021.
At March 31, 2022, Key’s nonperforming loans totaled $439 million, which represented .41% of period-end portfolio loans. These results compare to .72% at March 31, 2021, and .45% at December 31, 2021. Nonperforming assets at March 31, 2022, totaled $467 million, and represented .44% of period-end portfolio loans and OREO and other nonperforming assets. These results compare to .78% at March 31, 2021, and .48% at December 31, 2021.
CAPITAL
Key’s estimated risk-based capital ratios included in the following table continued to exceed all “well-capitalized” regulatory benchmarks at March 31, 2022.
KeyCorp Reports First Quarter 2022 Profit
April 21, 2022
Page 5
| Capital Ratios | |||||||||||
| 3/31/2022 | 12/31/2021 | 3/31/2021 | |||||||||
Common Equity Tier 1 (a) | 9.4 | % | 9.5 | % | 9.9 | % | |||||
Tier 1 risk-based capital (a) | 10.7 | 10.8 | 11.3 | ||||||||
Total risk based capital (a) | 12.5 | 12.5 | 13.4 | ||||||||
Tangible common equity to tangible assets (b) | 6.0 | 6.9 | 7.5 | ||||||||
Leverage (a) | 8.7 | 8.5 | 8.9 | ||||||||
(a)March 31, 2022 ratio is estimated and reflects Key's election to adopt the CECL optional transition provision.
(b)The table entitled “GAAP to Non-GAAP Reconciliations” in the attached financial supplement presents the computations of certain financial measures related to “tangible common equity.” The table reconciles the GAAP performance measures to the corresponding non-GAAP measures, which provides a basis for period-to-period comparisons.
Key's capital position remained strong in the first quarter of 2022. As shown in the preceding table, at March 31, 2022, Key’s estimated Common Equity Tier 1 and Tier 1 risk-based capital ratios stood at 9.4% and 10.7%, respectively. Key's tangible common equity ratio was 6.0% at March 31, 2022.
Key elected the CECL phase-in option provided by regulatory guidance which delayed for two years the estimated impact of CECL on regulatory capital and phases it in over three years beginning in 2022. Effective for the first quarter 2022, Key is now in the three-year transition period, with the full impact of the CECL standard being phased-in to regulatory capital over the next three years. On a fully phased-in basis, Key's Common Equity Tier 1 ratio would be reduced by 13 basis points.
| Summary of Changes in Common Shares Outstanding | |||||||||||||||||||||||
| In thousands | Change 1Q22 vs. | ||||||||||||||||||||||
| 1Q22 | 4Q21 | 1Q21 | 4Q21 | 1Q21 | |||||||||||||||||||
| Shares outstanding at beginning of period | 928,850 | 930,544 | 975,773 | (.2) | % | (4.8) | % | ||||||||||||||||
| Open market repurchases, repurchases under the accelerated repurchase program, and return of shares under employee compensation plans | (1,707) | (2,482) | (9,277) | (31.2) | (81.6) | ||||||||||||||||||
| Shares issued under employee compensation plans (net of cancellations) | 5,255 | 788 | 6,091 | 566.9 | (13.7) | ||||||||||||||||||
| Shares outstanding at end of period | 932,398 | 928,850 | 972,587 | .4 | % | (4.1) | % | ||||||||||||||||
N/M = Not Meaningful
During the first quarter of 2022, Key declared a dividend of $.195 per common share.
LINE OF BUSINESS RESULTS
The following table shows the contribution made by each major business segment to Key’s taxable-equivalent revenue from continuing operations and income (loss) from continuing operations attributable to Key for the periods presented. For more detailed financial information pertaining to each business segment, see the tables at the end of this release.
KeyCorp Reports First Quarter 2022 Profit
April 21, 2022
Page 6
| Major Business Segments | |||||||||||||||||||||||
| Dollars in millions | Change 1Q22 vs. | ||||||||||||||||||||||
| 1Q22 | 4Q21 | 1Q21 | 4Q21 | 1Q21 | |||||||||||||||||||
| Revenue from continuing operations (TE) | |||||||||||||||||||||||
| Consumer Bank | $ | 799 | $ | 839 | $ | 864 | (4.8) | % | (7.5) | % | |||||||||||||
| Commercial Bank | 810 | 1,028 | 858 | (21.2) | (5.6) | ||||||||||||||||||
Other (a) | 87 | 80 | 28 | 8.7 | 210.7 | ||||||||||||||||||
| Total | $ | 1,696 | $ | 1,947 | $ | 1,750 | (12.9) | % | (3.1) | % | |||||||||||||
| Income (loss) from continuing operations attributable to Key | |||||||||||||||||||||||
| Consumer Bank | $ | 70 | $ | 161 | $ | 217 | (56.5) | % | (67.7) | % | |||||||||||||
| Commercial Bank | 283 | 449 | 383 | (37.0) | (26.1) | ||||||||||||||||||
Other (a) | 94 | 17 | 18 | 452.9 | 422.2 | ||||||||||||||||||
| Total | $ | 447 | $ | 627 | $ | 618 | (28.7) | % | (27.7) | % | |||||||||||||
(a)Other includes other segments that consists of corporate treasury, our principal investing unit, and various exit portfolios as well as reconciling items which primarily represents the unallocated portion of nonearning assets of corporate support functions. Charges related to the funding of these assets are part of net interest income and are allocated to the business segments through noninterest expense. Reconciling items also includes intercompany eliminations and certain items that are not allocated to the business segments because they do not reflect their normal operations.
TE = Taxable Equivalent, N/M = Not Meaningful
| Consumer Bank | ||||||||||||||||||||
| Dollars in millions | Change 1Q22 vs. | |||||||||||||||||||
| 1Q22 | 4Q21 | 1Q21 | 4Q21 | 1Q21 | ||||||||||||||||
| Summary of operations | ||||||||||||||||||||
| Net interest income (TE) | $ | 543 | $ | 569 | $ | 607 | (4.6) | % | (10.5) | % | ||||||||||
| Noninterest income | 256 | 270 | 257 | (5.2) | (.4) | |||||||||||||||
| Total revenue (TE) | 799 | 839 | 864 | (4.8) | (7.5) | |||||||||||||||
| Provision for credit losses | 43 | 14 | (23) | 207.1 | 287.0 | |||||||||||||||
| Noninterest expense | 663 | 613 | 601 | 8.2 | 10.3 | |||||||||||||||
| Income (loss) before income taxes (TE) | 93 | 212 | 286 | (56.1) | (67.5) | |||||||||||||||
| Allocated income taxes (benefit) and TE adjustments | 23 | 51 | 69 | (54.9) | (66.7) | |||||||||||||||
| Net income (loss) attributable to Key | $ | 70 | $ | 161 | $ | 217 | (56.5) | % | (67.7) | % | ||||||||||
| Average balances | ||||||||||||||||||||
| Loans and leases | $ | 38,637 | $ | 37,792 | $ | 39,249 | 2.2 | % | (1.6) | % | ||||||||||
| Total assets | 41,814 | 41,024 | 42,476 | 1.9 | (1.6) | |||||||||||||||
| Deposits | 91,468 | 90,271 | 85,033 | 1.3 | 7.6 | |||||||||||||||
| Assets under management at period end | $ | 53,707 | $ | 55,806 | $ | 48,288 | (3.8) | % | 11.2 | % | ||||||||||
TE = Taxable Equivalent
KeyCorp Reports First Quarter 2022 Profit
April 21, 2022
Page 7
| Additional Consumer Bank Data | ||||||||||||||||||||
| Dollars in millions | Change 1Q22 vs. | |||||||||||||||||||
| 1Q22 | 4Q21 | 1Q21 | 4Q21 | 1Q21 | ||||||||||||||||
| Noninterest income | ||||||||||||||||||||
| Trust and investment services income | $ | 106 | $ | 106 | $ | 101 | — | % | 5.0 | % | ||||||||||
| Service charges on deposit accounts | 54 | 55 | 39 | (1.8) | 38.5 | |||||||||||||||
| Cards and payments income | 57 | 64 | 54 | (10.9) | 5.6 | |||||||||||||||
| Consumer mortgage income | 21 | 26 | 47 | (19.2) | (55.3) | |||||||||||||||
| Other noninterest income | 18 | 19 | 16 | (5.3) | 12.5 | |||||||||||||||
| Total noninterest income | $ | 256 | $ | 270 | $ | 257 | (5.2) | % | (.4) | % | ||||||||||
| Average deposit balances | ||||||||||||||||||||
| NOW and money market deposit accounts | $ | 58,625 | $ | 57,197 | $ | 54,684 | 2.5 | % | 7.2 | % | ||||||||||
| Savings deposits | 7,233 | 6,951 | 5,878 | 4.1 | 23.1 | |||||||||||||||
| Certificates of deposit ($100,000 or more) | 1,520 | 1,669 | 2,424 | (8.9) | (37.3) | |||||||||||||||
| Other time deposits | 2,090 | 2,227 | 2,888 | (6.2) | (27.6) | |||||||||||||||
| Noninterest-bearing deposits | 22,000 | 22,227 | 19,159 | (1.0) | 14.8 | |||||||||||||||
| Total deposits | $ | 91,468 | $ | 90,271 | $ | 85,033 | 1.3 | % | 7.6 | % | ||||||||||
| Other data | ||||||||||||||||||||
| Branches | 993 | 999 | 1,068 | |||||||||||||||||
| Automated teller machines | 1,308 | 1,317 | 1,368 | |||||||||||||||||
Consumer Bank Summary of Operations (1Q22 vs. 1Q21)
•Net income attributable to Key of $70 million for the first quarter of 2022, compared to $217 million for the year-ago quarter
•Taxable-equivalent net interest income decreased by $64 million, compared to the first quarter of 2021, related to the sale of the indirect auto portfolio, partially offset by strong consumer mortgage and Laurel Road balance sheet growth
•Average loans and leases decreased $612 million, or 1.6%, from the first quarter of 2021, driven by the sale of the indirect auto loan portfolio, partially offset by growth in consumer mortgage and Laurel Road
•Average deposits increased $6.4 billion, or 7.6%, from the first quarter of 2021, driven by relationship growth and higher retail deposits
•Provision for credit losses increased $66 million, compared to the first quarter of 2021, driven by loan growth and uncertainty in the economic environment
•Noninterest income decreased $1 million, or 0.4%, from the year-ago quarter, driven by a decrease in consumer mortgage income, reflecting lower gain on sale margins. The decrease was partially offset by an increase in service charges on deposit accounts and trust and investment services income
•Noninterest expense increased $62 million, or 10.3%, from the year-ago quarter, driven by an increased level of digital investments and an increase in employee compensation and benefits related expenses
KeyCorp Reports First Quarter 2022 Profit
April 21, 2022
Page 8
| Commercial Bank | ||||||||||||||||||||
| Dollars in millions | Change 1Q22 vs. | |||||||||||||||||||
| 1Q22 | 4Q21 | 1Q21 | 4Q21 | 1Q21 | ||||||||||||||||
| Summary of operations | ||||||||||||||||||||
| Net interest income (TE) | $ | 415 | $ | 417 | $ | 411 | (.5) | % | 1.0 | % | ||||||||||
| Noninterest income | 395 | 611 | 447 | (35.4) | (11.6) | |||||||||||||||
| Total revenue (TE) | 810 | 1,028 | 858 | (21.2) | (5.6) | |||||||||||||||
| Provision for credit losses | 41 | (12) | (67) | 441.7 | 161.2 | |||||||||||||||
| Noninterest expense | 417 | 501 | 443 | (16.8) | (5.9) | |||||||||||||||
| Income (loss) before income taxes (TE) | 352 | 539 | 482 | (34.7) | (27.0) | |||||||||||||||
| Allocated income taxes and TE adjustments | 69 | 90 | 99 | (23.3) | (30.3) | |||||||||||||||
| Net income (loss) attributable to Key | $ | 283 | $ | 449 | $ | 383 | (37.0) | % | (26.1) | % | ||||||||||
| Average balances | ||||||||||||||||||||
| Loans and leases | $ | 64,701 | $ | 61,127 | $ | 61,221 | 5.8 | % | 5.7 | % | ||||||||||
| Loans held for sale | 1,323 | 1,962 | 1,237 | (32.6) | 7.0 | |||||||||||||||
| Total assets | 74,860 | 71,629 | 70,448 | 4.5 | 6.3 | |||||||||||||||
| Deposits | 57,289 | 59,537 | 51,894 | (3.8) | % | 10.4 | % | |||||||||||||
TE = Taxable Equivalent, N/M = Not Meaningful
| Additional Commercial Bank Data | ||||||||||||||||||||
| Dollars in millions | Change 1Q22 vs. | |||||||||||||||||||
| 1Q22 | 4Q21 | 1Q21 | 4Q21 | 1Q21 | ||||||||||||||||
| Noninterest income | ||||||||||||||||||||
| Trust and investment services income | $ | 30 | $ | 29 | $ | 32 | 3.4 | % | (6.3) | % | ||||||||||
| Investment banking and debt placement fees | 163 | 322 | 162 | (49.4) | 0.6 | |||||||||||||||
| Operating lease income and other leasing gains | 32 | 36 | 38 | (11.1) | (15.8) | |||||||||||||||
| Corporate services income | 82 | 65 | 56 | 26.2 | 46.4 | |||||||||||||||
| Service charges on deposit accounts | 36 | 34 | 33 | 5.9 | 9.1 | |||||||||||||||
| Cards and payments income | 22 | 26 | 52 | (15.4) | (57.7) | |||||||||||||||
| Payments and services income | 140 | 125 | 141 | 12.0 | (0.7) | |||||||||||||||
| Commercial mortgage servicing fees | 36 | 47 | 34 | (23.4) | 5.9 | |||||||||||||||
| Other noninterest income | (6) | 52 | 40 | (111.5) | (115.0) | |||||||||||||||
| Total noninterest income | $ | 395 | $ | 611 | $ | 447 | (35.4) | % | (11.6) | % | ||||||||||
N/M = Not Meaningful
Commercial Bank Summary of Operations (1Q22 vs. 1Q21)
•Net income attributable to Key of $283 million for the first quarter of 2022, compared to $383 million for the year-ago quarter
•Taxable-equivalent net interest income increased by $4 million, compared to the first quarter of 2021, reflecting core loan growth in commercial and industrial and commercial mortgage real estate loans, partially offset by lower loan fees from the PPP
•Average loan and lease balances increased $3.5 billion, compared to the first quarter of 2021, reflecting growth in core commercial and industrial and commercial mortgage real estate loans, partially offset by a decline in PPP balances
•Average deposit balances increased $5.4 billion, or 10.4%, compared to the first quarter of 2021, driven by growth in targeted relationships and higher commercial escrow deposits
•Provision for credit losses increased $108 million, compared to the first quarter of 2021, driven by uncertainty in the economic environment
•Noninterest income decreased $52 million from the year-ago quarter, largely driven by lower cards and payments income from lower prepaid card activity and other income reflecting market related adjustments
•Noninterest expense decreased by $26 million, or 5.9%, from the first quarter of 2021, driven by lower operating lease expense and lower incentive compensation
KeyCorp Reports First Quarter 2022 Profit
April 21, 2022
Page 9
*******************************************
KeyCorp's roots trace back nearly 200 years to Albany, New York. Headquartered in Cleveland, Ohio, Key is one of the nation’s largest bank-based financial services companies, with assets of approximately $181.2 billion at March 31, 2022.
Key provides deposit, lending, cash management, and investment services to individuals and businesses in 15 states under the name KeyBank National Association through a network of approximately 1,000 branches and approximately 1,300 ATMs. Key also provides a broad range of sophisticated corporate and investment banking products, such as merger and acquisition advice, public and private debt and equity, syndications and derivatives to middle market companies in selected industries throughout the United States under the KeyBanc Capital Markets trade name. For more information, visit https://www.key.com/. KeyBank is Member FDIC.
KeyCorp Reports First Quarter 2022 Profit
April 21, 2022
Page 10
| CONTACTS: | |||||
| ANALYSTS | MEDIA | ||||
| Vernon L. Patterson | Susan Donlan | ||||
| 216.689.0520 | 216.471.3133 | ||||
| Vernon_Patterson@KeyBank.com | Susan_E_Donlan@KeyBank.com | ||||
| Melanie S. Kaiser | Tracy Pesho | ||||
| 216.689.4545 | 216.471.2825 | ||||
| Melanie_S_Kaiser@KeyBank.com | Tracy_Pesho@KeyBank.com | ||||
| Halle A. Nichols | Twitter: @keybank | ||||
| 216.471.2184 | |||||
| Halle_A_Nichols@KeyBank.com | |||||
| INVESTOR RELATIONS: | KEY MEDIA NEWSROOM: | ||||
| www.key.com/ir | www.key.com/newsroom | ||||
| This earnings release contains forward-looking statements within the meaning of the Private Securities Litigation Reform Act of 1995. These statements do not relate strictly to historical or current facts. Forward-looking statements usually can be identified by the use of words such as “goal,” “objective,” “plan,” “expect,” “assume,” “anticipate,” “intend,” “project,” “believe,” “estimate,” or other words of similar meaning. Forward-looking statements provide our current expectations or forecasts of future events, circumstances, results, or aspirations. Forward-looking statements, by their nature, are subject to assumptions, risks and uncertainties, many of which are outside of our control. Our actual results may differ materially from those set forth in our forward-looking statements. There is no assurance that any list of risks and uncertainties or risk factors is complete. Factors that could cause Key’s actual results to differ from those described in the forward-looking statements can be found in KeyCorp’s Form 10-K for the year ended December 31, 2021, as well as in KeyCorp’s subsequent SEC filings, all of which have been or will be filed with the Securities and Exchange Commission (the “SEC”) and are or will be available on Key’s website (www.key.com/ir) and on the SEC’s website (www.sec.gov). These factors may include, among others, deterioration of commercial real estate market fundamentals, adverse changes in credit quality trends, declining asset prices, a worsening of the U.S. economy due to financial, political, or other shocks, the extensive regulation of the U.S. financial services industry, and the impact of the COVID-19 global pandemic on us, our clients, our third-party service providers, and the markets. Any forward-looking statements made by us or on our behalf speak only as of the date they are made and we do not undertake any obligation to update any forward-looking statement to reflect the impact of subsequent events or circumstances. | ||
Notes to Editors:
A live Internet broadcast of KeyCorp’s conference call to discuss quarterly results and currently anticipated earnings trends and to answer analysts’ questions can be accessed through the Investor Relations section at https://www.key.com/ir at 8:00 a.m. ET, on April 21, 2022. A replay of the call will be available through April 30, 2022.
For up-to-date company information, media contacts, and facts and figures about Key’s lines of business, visit our Media Newsroom at https://www.key.com/newsroom.
*****
KeyCorp Reports First Quarter 2022 Profit
April 21, 2022
Page 11
KeyCorp
First Quarter 2022
Financial Supplement
| Page | |||||
| Financial Highlights | |||||
| GAAP to Non-GAAP Reconciliation | |||||
| Consolidated Balance Sheets | |||||
| Consolidated Statements of Income | |||||
| Consolidated Average Balance Sheets, and Net Interest Income and Yields/Rates From Continuing Operations | |||||
| Noninterest Expense | |||||
| Personnel Expense | |||||
| Loan Composition | |||||
| Loans Held for Sale Composition | |||||
| Summary of Changes in Loans Held for Sale | |||||
| Summary of Loan and Lease Loss Experience From Continuing Operations | |||||
| Asset Quality Statistics From Continuing Operations | |||||
| Summary of Nonperforming Assets and Past Due Loans From Continuing Operations | |||||
| Summary of Changes in Nonperforming Loans From Continuing Operations | |||||
| Line of Business Results | |||||
KeyCorp Reports First Quarter 2022 Profit
April 21, 2022
Page 12
| Financial Highlights | |||||||||||||||||
| (Dollars in millions, except per share amounts) | |||||||||||||||||
| Three months ended | |||||||||||||||||
| 3/31/2022 | 12/31/2021 | 3/31/2021 | |||||||||||||||
| Summary of operations | |||||||||||||||||
| Net interest income (TE) | $ | 1,020 | $ | 1,038 | $ | 1,012 | |||||||||||
| Noninterest income | 676 | 909 | 738 | ||||||||||||||
Total revenue (TE) | 1,696 | 1,947 | 1,750 | ||||||||||||||
| Provision for credit losses | 83 | 4 | (93) | ||||||||||||||
| Noninterest expense | 1,070 | 1,170 | 1,071 | ||||||||||||||
| Income (loss) from continuing operations attributable to Key | 447 | 627 | 618 | ||||||||||||||
| Income (loss) from discontinued operations, net of taxes | 1 | 2 | 4 | ||||||||||||||
| Net income (loss) attributable to Key | 448 | 629 | 622 | ||||||||||||||
| Income (loss) from continuing operations attributable to Key common shareholders | 420 | 601 | 591 | ||||||||||||||
| Income (loss) from discontinued operations, net of taxes | 1 | 2 | 4 | ||||||||||||||
| Net income (loss) attributable to Key common shareholders | 421 | 603 | 595 | ||||||||||||||
| Per common share | |||||||||||||||||
| Income (loss) from continuing operations attributable to Key common shareholders | $ | .45 | $ | .65 | $ | .61 | |||||||||||
| Income (loss) from discontinued operations, net of taxes | — | — | — | ||||||||||||||
Net income (loss) attributable to Key common shareholders (a) | .46 | .65 | .62 | ||||||||||||||
| Income (loss) from continuing operations attributable to Key common shareholders — assuming dilution | .45 | .64 | .61 | ||||||||||||||
| Income (loss) from discontinued operations, net of taxes — assuming dilution | — | — | — | ||||||||||||||
Net income (loss) attributable to Key common shareholders — assuming dilution (a) | .45 | .64 | .61 | ||||||||||||||
| Cash dividends declared | .195 | .195 | .185 | ||||||||||||||
| Book value at period end | 14.43 | 16.76 | 16.22 | ||||||||||||||
| Tangible book value at period end | 11.41 | 13.72 | 13.30 | ||||||||||||||
| Market price at period end | 22.38 | 23.13 | 19.98 | ||||||||||||||
| Performance ratios | |||||||||||||||||
| From continuing operations: | |||||||||||||||||
| Return on average total assets | .99 | % | 1.34 | % | 1.44 | % | |||||||||||
| Return on average common equity | 11.45 | 15.31 | 14.98 | ||||||||||||||
Return on average tangible common equity (b) | 14.12 | 18.69 | 18.25 | ||||||||||||||
| Net interest margin (TE) | 2.46 | 2.44 | 2.61 | ||||||||||||||
Cash efficiency ratio (b) | 62.4 | 59.4 | 60.3 | ||||||||||||||
| From consolidated operations: | |||||||||||||||||
| Return on average total assets | .99 | % | 1.35 | % | 1.45 | % | |||||||||||
| Return on average common equity | 11.47 | 15.36 | 15.08 | ||||||||||||||
Return on average tangible common equity (b) | 14.15 | 18.75 | 18.37 | ||||||||||||||
| Net interest margin (TE) | 2.46 | 2.44 | 2.60 | ||||||||||||||
Loan to deposit (c) | 72.9 | 68.9 | 73.1 | ||||||||||||||
| Capital ratios at period end | |||||||||||||||||
| Key shareholders’ equity to assets | 8.5 | % | 9.4 | % | 10.0 | % | |||||||||||
| Key common shareholders’ equity to assets | 7.4 | 8.4 | 9.0 | ||||||||||||||
Tangible common equity to tangible assets (b) | 6.0 | 6.9 | 7.5 | ||||||||||||||
Common Equity Tier 1 (d) | 9.4 | 9.5 | 9.9 | ||||||||||||||
Tier 1 risk-based capital (d) | 10.7 | 10.8 | 11.3 | ||||||||||||||
Total risk-based capital (d) | 12.5 | 12.5 | 13.4 | ||||||||||||||
Leverage (d) | 8.7 | 8.5 | 8.9 | ||||||||||||||
Asset quality — from continuing operations | |||||||||||||||||
Net loan charge-offs | $ | 33 | $ | 19 | $ | 114 | |||||||||||
Net loan charge-offs to average loans | .13 | % | .08 | % | .46 | % | |||||||||||
Allowance for loan and lease losses | $ | 1,105 | $ | 1,061 | $ | 1,438 | |||||||||||
Allowance for credit losses | 1,271 | 1,221 | 1,616 | ||||||||||||||
Allowance for loan and lease losses to period-end loans | 1.04 | % | 1.04 | % | 1.42 | % | |||||||||||
Allowance for credit losses to period-end loans | 1.19 | 1.20 | 1.60 | ||||||||||||||
| Allowance for loan and lease losses to nonperforming loans | 251.7 | 233.7 | 197.5 | ||||||||||||||
| Allowance for credit losses to nonperforming loans | 289.5 | 268.9 | 222.0 | ||||||||||||||
| Nonperforming loans at period-end | $ | 439 | $ | 454 | $ | 728 | |||||||||||
| Nonperforming assets at period-end | 467 | 489 | 790 | ||||||||||||||
| Nonperforming loans to period-end portfolio loans | .41 | % | .45 | % | .72 | % | |||||||||||
| Nonperforming assets to period-end portfolio loans plus OREO and other nonperforming assets | .44 | .48 | .78 | ||||||||||||||
Trust assets | |||||||||||||||||
| Assets under management | $ | 53,707 | $ | 55,806 | $ | 48,288 | |||||||||||
Other data | |||||||||||||||||
Average full-time equivalent employees | 17,110 | 16,797 | 17,086 | ||||||||||||||
Branches | 993 | 999 | 1,068 | ||||||||||||||
Taxable-equivalent adjustment | $ | 6 | $ | 5 | $ | 7 | |||||||||||
KeyCorp Reports First Quarter 2022 Profit
April 21, 2022
Page 13
(a)Earnings per share may not foot due to rounding.
(b)The following table entitled “GAAP to Non-GAAP Reconciliations” presents the computations of certain financial measures related to “tangible common equity” and “cash efficiency.” The table reconciles the GAAP performance measures to the corresponding non-GAAP measures, which provides a basis for period-to-period comparisons.
(c)Represents period-end consolidated total loans and loans held for sale divided by period-end consolidated total deposits.
(d)March 31, 2022, ratio is estimated and reflects Key's election to adopt the CECL optional transition provision.
KeyCorp Reports First Quarter 2022 Profit
April 21, 2022
Page 14
GAAP to Non-GAAP Reconciliations
(Dollars in millions)
The table below presents certain non-GAAP financial measures related to “tangible common equity,” “return on average tangible common equity,” “pre-provision net revenue," and “cash efficiency ratio."
The tangible common equity ratio and the return on average tangible common equity ratio have been a focus for some investors, and management believes these ratios may assist investors in analyzing Key’s capital position without regard to the effects of intangible assets and preferred stock.
The table also shows the computation for pre-provision net revenue, which is not formally defined by GAAP. Management believes that eliminating the effects of the provision for credit losses makes it easier to analyze the results by presenting them on a more comparable basis.
The cash efficiency ratio is a ratio of two non-GAAP performance measures. As such, there is no directly comparable GAAP performance measure. The cash efficiency ratio performance measure removes the impact of Key’s intangible asset amortization from the calculation. Management believes this ratio provide greater consistency and comparability between Key’s results and those of its peer banks. Additionally, this ratio is used by analysts and investors as they develop earnings forecasts and peer bank analysis.
Non-GAAP financial measures have inherent limitations, are not required to be uniformly applied, and are not audited. Although these non-GAAP financial measures are frequently used by investors to evaluate a company, they have limitations as analytical tools, and should not be considered in isolation, or as a substitute for analyses of results as reported under GAAP.
| Three months ended | ||||||||||||||||||||
| 3/31/2022 | 12/31/2021 | 3/31/2021 | ||||||||||||||||||
| Tangible common equity to tangible assets at period-end | ||||||||||||||||||||
| Key shareholders’ equity (GAAP) | $ | 15,308 | $ | 17,423 | $ | 17,634 | ||||||||||||||
Less: Intangible assets (a) | 2,810 | 2,820 | 2,842 | |||||||||||||||||
Preferred Stock (b) | 1,856 | 1,856 | 1,856 | |||||||||||||||||
| Tangible common equity (non-GAAP) | $ | 10,642 | $ | 12,747 | $ | 12,936 | ||||||||||||||
| Total assets (GAAP) | $ | 181,221 | $ | 186,346 | $ | 176,203 | ||||||||||||||
Less: Intangible assets (a) | 2,810 | 2,820 | 2,842 | |||||||||||||||||
| Tangible assets (non-GAAP) | $ | 178,411 | $ | 183,526 | $ | 173,361 | ||||||||||||||
| Tangible common equity to tangible assets ratio (non-GAAP) | 5.96 | % | 6.95 | % | 7.46 | % | ||||||||||||||
| Pre-provision net revenue | ||||||||||||||||||||
| Net interest income (GAAP) | $ | 1,014 | $ | 1,033 | $ | 1,005 | ||||||||||||||
| Plus: Taxable-equivalent adjustment | 6 | 5 | 7 | |||||||||||||||||
| Noninterest income | 676 | 909 | 738 | |||||||||||||||||
| Less: Noninterest expense | 1,070 | 1,170 | 1,071 | |||||||||||||||||
| Pre-provision net revenue from continuing operations (non-GAAP) | $ | 626 | $ | 777 | $ | 679 | ||||||||||||||
| Average tangible common equity | ||||||||||||||||||||
| Average Key shareholders' equity (GAAP) | $ | 16,780 | $ | 17,471 | $ | 17,769 | ||||||||||||||
Less: Intangible assets (average) (c) | 2,814 | 2,814 | 2,844 | |||||||||||||||||
| Preferred stock (average) | 1,900 | 1,900 | 1,900 | |||||||||||||||||
| Average tangible common equity (non-GAAP) | $ | 12,066 | $ | 12,757 | $ | 13,025 | ||||||||||||||
| Return on average tangible common equity from continuing operations | ||||||||||||||||||||
| Net income (loss) from continuing operations attributable to Key common shareholders (GAAP) | $ | 420 | $ | 601 | $ | 591 | ||||||||||||||
| Average tangible common equity (non-GAAP) | 12,066 | 12,757 | 13,025 | |||||||||||||||||
| Return on average tangible common equity from continuing operations (non-GAAP) | 14.12 | % | 18.69 | % | 18.25 | % | ||||||||||||||
| Return on average tangible common equity consolidated | ||||||||||||||||||||
| Net income (loss) attributable to Key common shareholders (GAAP) | $ | 421 | $ | 603 | $ | 595 | ||||||||||||||
| Average tangible common equity (non-GAAP) | 12,066 | 12,757 | 13,025 | |||||||||||||||||
| Return on average tangible common equity consolidated (non-GAAP) | 14.15 | % | 18.75 | % | 18.37 | % | ||||||||||||||
KeyCorp Reports First Quarter 2022 Profit
April 21, 2022
Page 15
| GAAP to Non-GAAP Reconciliations (continued) | ||||||||||||||||||||
| (Dollars in millions) | ||||||||||||||||||||
| Three months ended | ||||||||||||||||||||
| 3/31/2022 | 12/31/2021 | 3/31/2021 | ||||||||||||||||||
| Cash efficiency ratio | ||||||||||||||||||||
| Noninterest expense (GAAP) | $ | 1,070 | $ | 1,170 | $ | 1,071 | ||||||||||||||
| Less: Intangible asset amortization | 11 | 14 | 15 | |||||||||||||||||
| Adjusted noninterest expense (non-GAAP) | $ | 1,059 | $ | 1,156 | $ | 1,056 | ||||||||||||||
| Net interest income (GAAP) | $ | 1,014 | $ | 1,033 | $ | 1,005 | ||||||||||||||
| Plus: Taxable-equivalent adjustment | 6 | 5 | 7 | |||||||||||||||||
| Noninterest income | 676 | 909 | 738 | |||||||||||||||||
| Total taxable-equivalent revenue (non-GAAP) | $ | 1,696 | $ | 1,947 | $ | 1,750 | ||||||||||||||
| Cash efficiency ratio (non-GAAP) | 62.4 | % | 59.4 | % | 60.3 | % | ||||||||||||||
(a)For the three months ended March 31, 2022, December 31, 2021, and March 31, 2021, intangible assets exclude $2 million, $3 million, and $4 million, respectively, of period-end purchased credit card receivables.
(b)Net of capital surplus.
(c)For the three months ended March 31, 2022, December 31, 2021, and March 31, 2021, average intangible assets exclude $3 million, $3 million, and $4 million, respectively, of average purchased credit card receivables.
GAAP = U.S. generally accepted accounting principles
KeyCorp Reports First Quarter 2022 Profit
April 21, 2022
Page 16
| Consolidated Balance Sheets | |||||||||||||||||
| (Dollars in millions) | |||||||||||||||||
| 3/31/2022 | 12/31/2021 | 3/31/2021 | |||||||||||||||
| Assets | |||||||||||||||||
| Loans | $ | 106,600 | $ | 101,854 | $ | 100,926 | |||||||||||
| Loans held for sale | 1,170 | 2,729 | 2,296 | ||||||||||||||
| Securities available for sale | 43,681 | 45,364 | 33,923 | ||||||||||||||
| Held-to-maturity securities | 6,871 | 7,539 | 6,857 | ||||||||||||||
| Trading account assets | 848 | 701 | 811 | ||||||||||||||
| Short-term investments | 3,881 | 11,010 | 15,376 | ||||||||||||||
| Other investments | 722 | 639 | 621 | ||||||||||||||
| Total earning assets | 163,773 | 169,836 | 160,810 | ||||||||||||||
| Allowance for loan and lease losses | (1,105) | (1,061) | (1,438) | ||||||||||||||
| Cash and due from banks | 684 | 913 | 938 | ||||||||||||||
| Premises and equipment | 647 | 681 | 737 | ||||||||||||||
| Goodwill | 2,694 | 2,693 | 2,673 | ||||||||||||||
| Other intangible assets | 118 | 130 | 173 | ||||||||||||||
| Corporate-owned life insurance | 4,340 | 4,327 | 4,296 | ||||||||||||||
| Accrued income and other assets | 9,544 | 8,265 | 7,347 | ||||||||||||||
| Discontinued assets | 526 | 562 | 667 | ||||||||||||||
| Total assets | $ | 181,221 | $ | 186,346 | $ | 176,203 | |||||||||||
| Liabilities | |||||||||||||||||
| Deposits in domestic offices: | |||||||||||||||||
| NOW and money market deposit accounts | $ | 86,829 | $ | 89,207 | $ | 82,777 | |||||||||||
| Savings deposits | 7,840 | 7,503 | 6,655 | ||||||||||||||
| Certificates of deposit ($100,000 or more) | 1,533 | 1,705 | 2,437 | ||||||||||||||
| Other time deposits | 2,037 | 2,153 | 2,782 | ||||||||||||||
| Total interest-bearing deposits | 98,239 | 100,568 | 94,651 | ||||||||||||||
| Noninterest-bearing deposits | 50,424 | 52,004 | 47,532 | ||||||||||||||
| Total deposits | 148,663 | 152,572 | 142,183 | ||||||||||||||
| Federal funds purchased and securities sold under repurchase agreements | 599 | 173 | 281 | ||||||||||||||
| Bank notes and other short-term borrowings | 2,222 | 588 | 744 | ||||||||||||||
| Accrued expense and other liabilities | 3,615 | 3,548 | 2,862 | ||||||||||||||
| Long-term debt | 10,814 | 12,042 | 12,499 | ||||||||||||||
| Total liabilities | 165,913 | 168,923 | 158,569 | ||||||||||||||
| Equity | |||||||||||||||||
| Preferred stock | 1,900 | 1,900 | 1,900 | ||||||||||||||
| Common shares | 1,257 | 1,257 | 1,257 | ||||||||||||||
| Capital surplus | 6,214 | 6,278 | 6,213 | ||||||||||||||
| Retained earnings | 14,793 | 14,553 | 13,166 | ||||||||||||||
| Treasury stock, at cost | (5,927) | (5,979) | (5,005) | ||||||||||||||
| Accumulated other comprehensive income (loss) | (2,929) | (586) | 103 | ||||||||||||||
| Key shareholders’ equity | 15,308 | 17,423 | 17,634 | ||||||||||||||
| Total liabilities and equity | $ | 181,221 | $ | 186,346 | $ | 176,203 | |||||||||||
| Common shares outstanding (000) | 932,398 | 928,850 | 972,587 | ||||||||||||||
KeyCorp Reports First Quarter 2022 Profit
April 21, 2022
Page 17
| Consolidated Statements of Income | ||||||||||||||||||||||||||
| (Dollars in millions, except per share amounts) | ||||||||||||||||||||||||||
Three months ended | ||||||||||||||||||||||||||
| 3/31/2022 | 12/31/2021 | 3/31/2021 | ||||||||||||||||||||||||
| Interest income | ||||||||||||||||||||||||||
| Loans | $ | 837 | $ | 873 | $ | 889 | ||||||||||||||||||||
| Loans held for sale | 12 | 15 | 11 | |||||||||||||||||||||||
| Securities available for sale | 173 | 148 | 130 | |||||||||||||||||||||||
| Held-to-maturity securities | 46 | 52 | 45 | |||||||||||||||||||||||
| Trading account assets | 6 | 5 | 5 | |||||||||||||||||||||||
| Short-term investments | 4 | 8 | 5 | |||||||||||||||||||||||
| Other investments | 2 | 2 | 2 | |||||||||||||||||||||||
| Total interest income | 1,080 | 1,103 | 1,087 | |||||||||||||||||||||||
| Interest expense | ||||||||||||||||||||||||||
| Deposits | 14 | 15 | 21 | |||||||||||||||||||||||
| Federal funds purchased and securities sold under repurchase agreements | — | — | — | |||||||||||||||||||||||
| Bank notes and other short-term borrowings | 3 | 2 | 1 | |||||||||||||||||||||||
| Long-term debt | 49 | 53 | 60 | |||||||||||||||||||||||
| Total interest expense | 66 | 70 | 82 | |||||||||||||||||||||||
| Net interest income | 1,014 | 1,033 | 1,005 | |||||||||||||||||||||||
| Provision for credit losses | 83 | 4 | (93) | |||||||||||||||||||||||
| Net interest income after provision for credit losses | 931 | 1,029 | 1,098 | |||||||||||||||||||||||
| Noninterest income | ||||||||||||||||||||||||||
| Trust and investment services income | 136 | 135 | 133 | |||||||||||||||||||||||
| Investment banking and debt placement fees | 163 | 323 | 162 | |||||||||||||||||||||||
| Service charges on deposit accounts | 91 | 90 | 73 | |||||||||||||||||||||||
| Operating lease income and other leasing gains | 32 | 37 | 38 | |||||||||||||||||||||||
| Corporate services income | 90 | 73 | 64 | |||||||||||||||||||||||
| Cards and payments income | 80 | 86 | 105 | |||||||||||||||||||||||
| Corporate-owned life insurance income | 31 | 34 | 31 | |||||||||||||||||||||||
| Consumer mortgage income | 21 | 25 | 47 | |||||||||||||||||||||||
| Commercial mortgage servicing fees | 36 | 48 | 34 | |||||||||||||||||||||||
| Other income | (4) | 58 | 51 | |||||||||||||||||||||||
| Total noninterest income | 676 | 909 | 738 | |||||||||||||||||||||||
| Noninterest expense | ||||||||||||||||||||||||||
| Personnel | 630 | 674 | 624 | |||||||||||||||||||||||
| Net occupancy | 73 | 75 | 76 | |||||||||||||||||||||||
| Computer processing | 77 | 73 | 73 | |||||||||||||||||||||||
| Business services and professional fees | 53 | 70 | 50 | |||||||||||||||||||||||
| Equipment | 23 | 25 | 25 | |||||||||||||||||||||||
| Operating lease expense | 28 | 31 | 34 | |||||||||||||||||||||||
| Marketing | 28 | 37 | 26 | |||||||||||||||||||||||
| Other expense | 158 | 185 | 163 | |||||||||||||||||||||||
| Total noninterest expense | 1,070 | 1,170 | 1,071 | |||||||||||||||||||||||
| Income (loss) from continuing operations before income taxes | 537 | 768 | 765 | |||||||||||||||||||||||
| Income taxes | 90 | 141 | 147 | |||||||||||||||||||||||
| Income (loss) from continuing operations | 447 | 627 | 618 | |||||||||||||||||||||||
| Income (loss) from discontinued operations, net of taxes | 1 | 2 | 4 | |||||||||||||||||||||||
| Net income (loss) | 448 | 629 | 622 | |||||||||||||||||||||||
| Less: Net income (loss) attributable to noncontrolling interests | — | — | — | |||||||||||||||||||||||
| Net income (loss) attributable to Key | $ | 448 | $ | 629 | $ | 622 | ||||||||||||||||||||
| Income (loss) from continuing operations attributable to Key common shareholders | $ | 420 | $ | 601 | $ | 591 | ||||||||||||||||||||
| Net income (loss) attributable to Key common shareholders | 421 | 603 | 595 | |||||||||||||||||||||||
| Per common share | ||||||||||||||||||||||||||
| Income (loss) from continuing operations attributable to Key common shareholders | $ | .45 | $ | .65 | $ | .61 | ||||||||||||||||||||
| Income (loss) from discontinued operations, net of taxes | — | — | — | |||||||||||||||||||||||
Net income (loss) attributable to Key common shareholders (a) | .46 | .65 | .62 | |||||||||||||||||||||||
| Per common share — assuming dilution | ||||||||||||||||||||||||||
| Income (loss) from continuing operations attributable to Key common shareholders | $ | .45 | $ | .64 | $ | .61 | ||||||||||||||||||||
| Income (loss) from discontinued operations, net of taxes | — | — | — | |||||||||||||||||||||||
Net income (loss) attributable to Key common shareholders (a) | .45 | .64 | .61 | |||||||||||||||||||||||
| Cash dividends declared per common share | $ | .195 | $ | .195 | $ | .185 | ||||||||||||||||||||
| Weighted-average common shares outstanding (000) | 922,941 | 922,970 | 964,878 | |||||||||||||||||||||||
| Effect of common share options and other stock awards | 10,692 | 11,758 | 9,419 | |||||||||||||||||||||||
Weighted-average common shares and potential common shares outstanding (000) (b) | 933,634 | 934,729 | 974,297 | |||||||||||||||||||||||
(a)Earnings per share may not foot due to rounding.
(b)Assumes conversion of common share options and other stock awards, as applicable.
KeyCorp Reports First Quarter 2022 Profit
April 21, 2022
Page 18
| Consolidated Average Balance Sheets, and Net Interest Income and Yields/Rates From Continuing Operations | ||||||||||||||||||||||||||||||||||||||
| (Dollars in millions) | ||||||||||||||||||||||||||||||||||||||
| First Quarter 2022 | Fourth Quarter 2021 | First Quarter 2021 | ||||||||||||||||||||||||||||||||||||
| Average | Yield/ | Average | Yield/ | Average | Yield/ | |||||||||||||||||||||||||||||||||
| Balance | Interest (a) | Rate (a) | Balance | Interest (a) | Rate (a) | Balance | Interest (a) | Rate (a) | ||||||||||||||||||||||||||||||
| Assets | ||||||||||||||||||||||||||||||||||||||
Loans: (b), (c) | ||||||||||||||||||||||||||||||||||||||
Commercial and industrial (d) | $ | 51,574 | $ | 410 | 3.22 | % | $ | 49,510 | $ | 447 | 3.58 | % | $ | 52,581 | $ | 453 | 3.48 | % | ||||||||||||||||||||
| Real estate — commercial mortgage | 14,587 | 121 | 3.37 | 13,671 | 121 | 3.51 | 12,658 | 114 | 3.67 | |||||||||||||||||||||||||||||
| Real estate — construction | 2,027 | 17 | 3.37 | 2,119 | 19 | 3.50 | 2,048 | 19 | 3.75 | |||||||||||||||||||||||||||||
| Commercial lease financing | 3,942 | 24 | 2.41 | 3,953 | 26 | 2.57 | 4,142 | 31 | 2.99 | |||||||||||||||||||||||||||||
| Total commercial loans | 72,130 | 572 | 3.21 | 69,253 | 613 | 3.51 | 71,429 | 617 | 3.50 | |||||||||||||||||||||||||||||
| Real estate — residential mortgage | 16,309 | 112 | 2.75 | 15,017 | 102 | 2.72 | 9,699 | 76 | 3.12 | |||||||||||||||||||||||||||||
| Home equity loans | 8,345 | 74 | 3.61 | 8,603 | 79 | 3.64 | 9,282 | 85 | 3.73 | |||||||||||||||||||||||||||||
| Consumer direct loans | 5,954 | 61 | 4.16 | 5,509 | 60 | 4.33 | 4,817 | 56 | 4.72 | |||||||||||||||||||||||||||||
| Credit cards | 932 | 24 | 10.36 | 941 | 24 | 10.13 | 933 | 24 | 10.45 | |||||||||||||||||||||||||||||
| Consumer indirect loans | 92 | — | — | 74 | — | — | 4,568 | 37 | 3.30 | |||||||||||||||||||||||||||||
| Total consumer loans | 31,632 | 271 | 3.45 | 30,144 | 265 | 3.49 | 29,299 | 278 | 3.84 | |||||||||||||||||||||||||||||
| Total loans | 103,762 | 843 | 3.28 | 99,397 | 878 | 3.50 | 100,728 | 895 | 3.60 | |||||||||||||||||||||||||||||
| Loans held for sale | 1,485 | 12 | 3.32 | 2,202 | 15 | 2.83 | 1,531 | 11 | 2.89 | |||||||||||||||||||||||||||||
Securities available for sale (b), (e) | 44,923 | 173 | 1.50 | 42,329 | 148 | 1.39 | 30,039 | 130 | 1.76 | |||||||||||||||||||||||||||||
Held-to-maturity securities (b) | 7,188 | 46 | 2.54 | 7,991 | 52 | 2.61 | 7,188 | 46 | 2.53 | |||||||||||||||||||||||||||||
| Trading account assets | 842 | 6 | 2.74 | 853 | 5 | 2.48 | 848 | 5 | 2.15 | |||||||||||||||||||||||||||||
| Short-term investments | 7,323 | 4 | .25 | 15,505 | 8 | .20 | 16,510 | 5 | .13 | |||||||||||||||||||||||||||||
Other investments (e) | 651 | 2 | 1.26 | 634 | 2 | 1.15 | 614 | 2 | 1.40 | |||||||||||||||||||||||||||||
| Total earning assets | 166,174 | 1,086 | 2.62 | 168,911 | 1,108 | 2.60 | 157,458 | 1,094 | 2.81 | |||||||||||||||||||||||||||||
| Allowance for loan and lease losses | (1,056) | (1,081) | (1,623) | |||||||||||||||||||||||||||||||||||
| Accrued income and other assets | 17,471 | 17,133 | 16,398 | |||||||||||||||||||||||||||||||||||
| Discontinued assets | 539 | 574 | 686 | |||||||||||||||||||||||||||||||||||
| Total assets | $ | 183,128 | $ | 185,537 | $ | 172,919 | ||||||||||||||||||||||||||||||||
| Liabilities | ||||||||||||||||||||||||||||||||||||||
| NOW and money market deposit accounts | $ | 88,515 | $ | 11 | .05 | $ | 88,110 | $ | 11 | .05 | $ | 81,439 | $ | 10 | .05 | |||||||||||||||||||||||
| Savings deposits | 7,599 | — | .01 | 7,375 | — | .01 | 6,203 | 1 | .03 | |||||||||||||||||||||||||||||
| Certificates of deposit ($100,000 or more) | 1,639 | 2 | .44 | 1,793 | 2 | .53 | 2,571 | 6 | .96 | |||||||||||||||||||||||||||||
| Other time deposits | 2,098 | 1 | .15 | 2,233 | 2 | .21 | 2,902 | 4 | .57 | |||||||||||||||||||||||||||||
| Total interest-bearing deposits | 99,851 | 14 | .06 | 99,511 | 15 | .06 | 93,115 | 21 | .09 | |||||||||||||||||||||||||||||
| Federal funds purchased and securities sold under repurchase agreements | 287 | — | .13 | 230 | — | .02 | 243 | — | .04 | |||||||||||||||||||||||||||||
| Bank notes and other short-term borrowings | 705 | 3 | 1.94 | 789 | 2 | 1.45 | 878 | 1 | .64 | |||||||||||||||||||||||||||||
Long-term debt (f), (g) | 10,830 | 49 | 1.79 | 12,159 | 53 | 1.74 | 12,831 | 60 | 1.93 | |||||||||||||||||||||||||||||
| Total interest-bearing liabilities | 111,673 | 66 | .24 | 112,689 | 70 | .25 | 107,067 | 82 | .31 | |||||||||||||||||||||||||||||
| Noninterest-bearing deposits | 50,312 | 51,494 | 44,625 | |||||||||||||||||||||||||||||||||||
| Accrued expense and other liabilities | 3,824 | 3,309 | 2,772 | |||||||||||||||||||||||||||||||||||
Discontinued liabilities (g) | 539 | 574 | 686 | |||||||||||||||||||||||||||||||||||
| Total liabilities | $ | 166,348 | $ | 168,066 | $ | 155,150 | ||||||||||||||||||||||||||||||||
| Equity | ||||||||||||||||||||||||||||||||||||||
| Key shareholders’ equity | $ | 16,780 | $ | 17,471 | $ | 17,769 | ||||||||||||||||||||||||||||||||
| Noncontrolling interests | — | — | — | |||||||||||||||||||||||||||||||||||
| Total equity | 16,780 | 17,471 | 17,769 | |||||||||||||||||||||||||||||||||||
| Total liabilities and equity | $ | 183,128 | $ | 185,537 | $ | 172,919 | ||||||||||||||||||||||||||||||||
| Interest rate spread (TE) | 2.38 | % | 2.36 | % | 2.50 | % | ||||||||||||||||||||||||||||||||
| Net interest income (TE) and net interest margin (TE) | $ | 1,020 | 2.46 | % | $ | 1,038 | 2.44 | % | $ | 1,012 | 2.61 | % | ||||||||||||||||||||||||||
TE adjustment (b) | 6 | 5 | 7 | |||||||||||||||||||||||||||||||||||
| Net interest income, GAAP basis | $ | 1,014 | $ | 1,033 | $ | 1,005 | ||||||||||||||||||||||||||||||||
(a)Results are from continuing operations. Interest excludes the interest associated with the liabilities referred to in (g) below, calculated using a matched funds transfer pricing methodology.
(b)Interest income on tax-exempt securities and loans has been adjusted to a taxable-equivalent basis using the statutory federal income tax rate of 21% for the three months ended March 31, 2022, December 31, 2021, and March 31, 2021.
(c)For purposes of these computations, nonaccrual loans are included in average loan balances.
(d)Commercial and industrial average balances include $141 million, $141 million, and $126 million of assets from commercial credit cards for the three months ended March 31, 2022, December 31, 2021, and March 31, 2021, respectively.
(e)Yield is calculated on the basis of amortized cost.
(f)Rate calculation excludes basis adjustments related to fair value hedges.
(g)A portion of long-term debt and the related interest expense is allocated to discontinued liabilities as a result of applying Key’s matched funds transfer pricing methodology to discontinued operations.
TE = Taxable Equivalent, GAAP = U.S. generally accepted accounting principles
KeyCorp Reports First Quarter 2022 Profit
April 21, 2022
Page 19
| Noninterest Expense | ||||||||||||||||||||
| (Dollars in millions) | ||||||||||||||||||||
| Three months ended | ||||||||||||||||||||
| 3/31/2022 | 12/31/2021 | 3/31/2021 | ||||||||||||||||||
Personnel (a) | $ | 630 | $ | 674 | $ | 624 | ||||||||||||||
| Net occupancy | 73 | 75 | 76 | |||||||||||||||||
| Computer processing | 77 | 73 | 73 | |||||||||||||||||
| Business services and professional fees | 53 | 70 | 50 | |||||||||||||||||
| Equipment | 23 | 25 | 25 | |||||||||||||||||
| Operating lease expense | 28 | 31 | 34 | |||||||||||||||||
| Marketing | 28 | 37 | 26 | |||||||||||||||||
| Other expense | 158 | 185 | 163 | |||||||||||||||||
| Total noninterest expense | $ | 1,070 | $ | 1,170 | $ | 1,071 | ||||||||||||||
Average full-time equivalent employees (b) | 17,110 | 16,797 | 17,086 | |||||||||||||||||
(a)Additional detail provided in Personnel Expense table below.
(b)The number of average full-time equivalent employees has not been adjusted for discontinued operations.
| Personnel Expense | ||||||||||||||||||||
| (Dollars in millions) | ||||||||||||||||||||
| Three months ended | ||||||||||||||||||||
| 3/31/2022 | 12/31/2021 | 3/31/2021 | ||||||||||||||||||
| Salaries and contract labor | $ | 348 | $ | 342 | $ | 320 | ||||||||||||||
| Incentive and stock-based compensation | 183 | 243 | 196 | |||||||||||||||||
| Employee benefits | 97 | 89 | 107 | |||||||||||||||||
| Severance | 2 | — | 1 | |||||||||||||||||
| Total personnel expense | $ | 630 | $ | 674 | $ | 624 | ||||||||||||||
KeyCorp Reports First Quarter 2022 Profit
April 21, 2022
Page 20
| Loan Composition | ||||||||||||||||||||
| (Dollars in millions) | ||||||||||||||||||||
| Percent change 3/31/2022 vs | ||||||||||||||||||||
| 3/31/2022 | 12/31/2021 | 3/31/2021 | 12/31/2021 | 3/31/2021 | ||||||||||||||||
Commercial and industrial (a) | $ | 52,815 | $ | 50,525 | $ | 52,486 | 4.5 | % | .6 | % | ||||||||||
| Commercial real estate: | ||||||||||||||||||||
| Commercial mortgage | 15,124 | 14,244 | 12,702 | 6.2 | 19.1 | |||||||||||||||
| Construction | 2,065 | 1,996 | 2,122 | 3.5 | (2.7) | |||||||||||||||
| Total commercial real estate loans | 17,189 | 16,240 | 14,824 | 5.8 | 16.0 | |||||||||||||||
Commercial lease financing (b) | 3,916 | 4,071 | 4,104 | (3.8) | (4.6) | |||||||||||||||
| Total commercial loans | 73,920 | 70,836 | 71,414 | 4.4 | 3.5 | |||||||||||||||
| Residential — prime loans: | ||||||||||||||||||||
| Real estate — residential mortgage | 17,181 | 15,756 | 10,300 | 9.0 | 66.8 | |||||||||||||||
| Home equity loans | 8,258 | 8,467 | 9,158 | (2.5) | (9.8) | |||||||||||||||
| Total residential — prime loans | 25,439 | 24,223 | 19,458 | 5.0 | 30.7 | |||||||||||||||
| Consumer direct loans | 6,249 | 5,753 | 4,862 | 8.6 | 28.5 | |||||||||||||||
| Credit cards | 930 | 972 | 909 | (4.3) | 2.3 | |||||||||||||||
| Consumer indirect loans | 62 | 70 | 4,283 | (11.4) | (98.6) | |||||||||||||||
| Total consumer loans | 32,680 | 31,018 | 29,512 | 5.4 | 10.7 | |||||||||||||||
Total loans (c), (d) | $ | 106,600 | $ | 101,854 | $ | 100,926 | 4.7 | % | 5.6 | % | ||||||||||
(a)Loan balances include $147 million, $139 million, and $126 million of commercial credit card balances at March 31, 2022, December 31, 2021, and March 31, 2021, respectively.
(b)Commercial lease financing includes receivables held as collateral for a secured borrowing of $14 million, $16 million, and $21 million at March 31, 2022, December 31, 2021, and March 31, 2021, respectively. Principal reductions are based on the cash payments received from these related receivables.
(c)Total loans exclude loans of $531 million at March 31, 2022, $567 million at December 31, 2021, and $675 million at March 31, 2021, related to the discontinued operations of the education lending business.
(d)Accrued interest of $193 million, $198 million, and $242 million at March 31, 2022, December 31, 2021, and March 31, 2021, respectively, presented in "other assets" on the Consolidated Balance Sheets is excluded from the amortized cost basis disclosed in this table.
| Loans Held for Sale Composition | ||||||||||||||||||||
| (Dollars in millions) | ||||||||||||||||||||
| Percent change 3/31/2022 vs | ||||||||||||||||||||
| 3/31/2022 | 12/31/2021 | 3/31/2021 | 12/31/2021 | 3/31/2021 | ||||||||||||||||
| Commercial and industrial | $ | 216 | $ | 1,438 | $ | 1,175 | (85.0) | % | (81.6) | % | ||||||||||
| Real estate — commercial mortgage | 819 | 1,010 | 837 | (18.9) | (2.2) | |||||||||||||||
| Real estate — construction | 21 | — | — | N/M | N/M | |||||||||||||||
| Real estate — residential mortgage | 114 | 281 | 236 | (59.4) | (51.7) | |||||||||||||||
| Consumer direct loans | — | — | 48 | N/M | N/M | |||||||||||||||
| Total loans held for sale | $ | 1,170 | $ | 2,729 | $ | 2,296 | (57.1) | % | (49.0) | % | ||||||||||
N/M = Not Meaningful
| Summary of Changes in Loans Held for Sale | |||||||||||||||||
| (Dollars in millions) | |||||||||||||||||
| 1Q22 | 4Q21 | 3Q21 | 2Q21 | 1Q21 | |||||||||||||
| Balance at beginning of period | $ | 2,729 | $ | 1,805 | $ | 1,537 | $ | 2,296 | $ | 1,583 | |||||||
| New originations | 2,724 | 5,704 | 3,328 | 3,573 | 4,010 | ||||||||||||
| Transfers from (to) held to maturity, net | — | (1) | 3,305 | (71) | 83 | ||||||||||||
| Loan sales | (4,269) | (4,742) | (6,405) | (4,195) | (3,303) | ||||||||||||
| Loan draws (payments), net | (12) | (12) | 8 | (27) | (73) | ||||||||||||
| Valuation and other adjustments | (2) | (25) | 32 | (39) | (4) | ||||||||||||
| Balance at end of period | $ | 1,170 | $ | 2,729 | $ | 1,805 | $ | 1,537 | $ | 2,296 | |||||||
KeyCorp Reports First Quarter 2022 Profit
April 21, 2022
Page 21
| Summary of Loan and Lease Loss Experience From Continuing Operations | ||||||||||||||||||||
| (Dollars in millions) | ||||||||||||||||||||
| Three months ended | ||||||||||||||||||||
| 3/31/2022 | 12/31/2021 | 3/31/2021 | ||||||||||||||||||
| Average loans outstanding | $ | 103,762 | $ | 99,397 | $ | 100,728 | ||||||||||||||
| Allowance for loan and lease losses at the beginning of the period | 1,061 | 1,084 | 1,626 | |||||||||||||||||
| Loans charged off: | ||||||||||||||||||||
| Commercial and industrial | 30 | 33 | 73 | |||||||||||||||||
| Real estate — commercial mortgage | 4 | 1 | 35 | |||||||||||||||||
| Real estate — construction | — | — | — | |||||||||||||||||
| Total commercial real estate loans | 4 | 1 | 35 | |||||||||||||||||
| Commercial lease financing | 2 | 1 | 4 | |||||||||||||||||
| Total commercial loans | 36 | 35 | 112 | |||||||||||||||||
| Real estate — residential mortgage | (1) | (1) | — | |||||||||||||||||
| Home equity loans | 1 | 2 | 2 | |||||||||||||||||
| Consumer direct loans | 7 | 7 | 8 | |||||||||||||||||
| Credit cards | 7 | 6 | 6 | |||||||||||||||||
| Consumer indirect loans | 1 | 1 | 7 | |||||||||||||||||
| Total consumer loans | 15 | 15 | 23 | |||||||||||||||||
| Total loans charged off | 51 | 50 | 135 | |||||||||||||||||
| Recoveries: | ||||||||||||||||||||
| Commercial and industrial | 11 | 23 | 8 | |||||||||||||||||
| Real estate — commercial mortgage | 1 | 1 | 1 | |||||||||||||||||
| Real estate — construction | — | — | — | |||||||||||||||||
| Total commercial real estate loans | 1 | 1 | 1 | |||||||||||||||||
| Commercial lease financing | — | — | 1 | |||||||||||||||||
| Total commercial loans | 12 | 24 | 10 | |||||||||||||||||
| Real estate — residential mortgage | — | 1 | 1 | |||||||||||||||||
| Home equity loans | 1 | 1 | 1 | |||||||||||||||||
| Consumer direct loans | 2 | 2 | 2 | |||||||||||||||||
| Credit cards | 2 | 2 | 2 | |||||||||||||||||
| Consumer indirect loans | 1 | 1 | 5 | |||||||||||||||||
| Total consumer loans | 6 | 7 | 11 | |||||||||||||||||
| Total recoveries | 18 | 31 | 21 | |||||||||||||||||
| Net loan charge-offs | (33) | (19) | (114) | |||||||||||||||||
| Provision (credit) for loan and lease losses | 77 | (4) | (74) | |||||||||||||||||
| Allowance for loan and lease losses at end of period | $ | 1,105 | $ | 1,061 | $ | 1,438 | ||||||||||||||
| Liability for credit losses on lending-related commitments at beginning of period | 160 | 152 | 197 | |||||||||||||||||
| Provision (credit) for losses on lending-related commitments | 6 | 8 | (19) | |||||||||||||||||
Liability for credit losses on lending-related commitments at end of period (a) | $ | 166 | $ | 160 | $ | 178 | ||||||||||||||
| Total allowance for credit losses at end of period | $ | 1,271 | $ | 1,221 | $ | 1,616 | ||||||||||||||
| Net loan charge-offs to average total loans | .13 | % | .08 | % | .46 | % | ||||||||||||||
| Allowance for loan and lease losses to period-end loans | 1.04 | 1.04 | 1.42 | |||||||||||||||||
| Allowance for credit losses to period-end loans | 1.19 | 1.20 | 1.60 | |||||||||||||||||
| Allowance for loan and lease losses to nonperforming loans | 251.7 | 233.7 | 197.5 | |||||||||||||||||
| Allowance for credit losses to nonperforming loans | 289.5 | 268.9 | 222.0 | |||||||||||||||||
| Discontinued operations — education lending business: | ||||||||||||||||||||
| Loans charged off | $ | 2 | 1 | $ | 1 | |||||||||||||||
| Recoveries | — | — | 1 | |||||||||||||||||
| Net loan charge-offs | $ | (2) | $ | (1) | $ | — | ||||||||||||||
(a)Included in "Accrued expense and other liabilities" on the balance sheet.
KeyCorp Reports First Quarter 2022 Profit
April 21, 2022
Page 22
| Asset Quality Statistics From Continuing Operations | |||||||||||||||||
| (Dollars in millions) | |||||||||||||||||
| 1Q22 | 4Q21 | 3Q21 | 2Q21 | 1Q21 | |||||||||||||
| Net loan charge-offs | $ | 33 | $ | 19 | $ | 29 | $ | 22 | $ | 114 | |||||||
| Net loan charge-offs to average total loans | .13 | % | .08 | % | .11 | % | .09 | % | .46 | % | |||||||
| Allowance for loan and lease losses | $ | 1,105 | $ | 1,061 | $ | 1,084 | $ | 1,220 | $ | 1,438 | |||||||
Allowance for credit losses (a) | 1,271 | 1,221 | 1,236 | 1,372 | 1,616 | ||||||||||||
| Allowance for loan and lease losses to period-end loans | 1.04 | % | 1.04 | % | 1.10 | % | 1.21 | % | 1.42 | % | |||||||
| Allowance for credit losses to period-end loans | 1.19 | 1.20 | 1.25 | 1.36 | 1.60 | ||||||||||||
| Allowance for loan and lease losses to nonperforming loans | 251.7 | 233.7 | 195.7 | 175.8 | 197.5 | ||||||||||||
| Allowance for credit losses to nonperforming loans | 289.5 | 268.9 | 223.1 | 197.7 | 222.0 | ||||||||||||
| Nonperforming loans at period end | $ | 439 | $ | 454 | $ | 554 | $ | 694 | $ | 728 | |||||||
| Nonperforming assets at period end | 467 | 489 | 599 | 738 | 790 | ||||||||||||
| Nonperforming loans to period-end portfolio loans | .41 | % | .45 | % | .56 | % | .69 | % | .72 | % | |||||||
Nonperforming assets to period-end portfolio loans plus OREO and other nonperforming assets | .44 | .48 | .61 | .73 | .78 | ||||||||||||
(a)Includes the allowance for loan and lease losses plus the liability for credit losses on lending-related commitments.
| Summary of Nonperforming Assets and Past Due Loans From Continuing Operations | |||||||||||||||||
| (Dollars in millions) | |||||||||||||||||
| 3/31/2022 | 12/31/2021 | 9/30/2021 | 6/30/2021 | 3/31/2021 | |||||||||||||
| Commercial and industrial | $ | 186 | $ | 191 | $ | 253 | $ | 355 | $ | 387 | |||||||
| Real estate — commercial mortgage | 40 | 44 | 49 | 66 | 66 | ||||||||||||
| Real estate — construction | — | — | — | — | — | ||||||||||||
| Total commercial real estate loans | 40 | 44 | 49 | 66 | 66 | ||||||||||||
| Commercial lease financing | 3 | 4 | 5 | 7 | 8 | ||||||||||||
| Total commercial loans | 229 | 239 | 307 | 428 | 461 | ||||||||||||
| Real estate — residential mortgage | 73 | 72 | 93 | 99 | 95 | ||||||||||||
| Home equity loans | 129 | 135 | 146 | 146 | 148 | ||||||||||||
| Consumer direct loans | 4 | 4 | 4 | 4 | 5 | ||||||||||||
| Credit cards | 3 | 3 | 3 | 3 | 3 | ||||||||||||
| Consumer indirect loans | 1 | 1 | 1 | 14 | 16 | ||||||||||||
| Total consumer loans | 210 | 215 | 247 | 266 | 267 | ||||||||||||
| Total nonperforming loans | 439 | 454 | 554 | 694 | 728 | ||||||||||||
| OREO | 8 | 8 | 8 | 9 | 12 | ||||||||||||
| Nonperforming loans held for sale | 20 | 24 | 35 | 32 | 47 | ||||||||||||
| Other nonperforming assets | — | 3 | 2 | 3 | 3 | ||||||||||||
| Total nonperforming assets | $ | 467 | $ | 489 | $ | 599 | $ | 738 | $ | 790 | |||||||
| Accruing loans past due 90 days or more | 55 | 68 | 82 | 74 | 92 | ||||||||||||
| Accruing loans past due 30 through 89 days | 122 | 165 | 164 | 190 | 191 | ||||||||||||
Restructured loans — accruing and nonaccruing (a) | 219 | 220 | 270 | 334 | 376 | ||||||||||||
Restructured loans included in nonperforming loans (a) | 98 | 99 | 146 | 177 | 192 | ||||||||||||
| Nonperforming assets from discontinued operations — education lending business | 4 | 4 | 4 | 5 | 5 | ||||||||||||
| Nonperforming loans to period-end portfolio loans | .41 | % | .45 | % | .56 | % | .69 | % | .72 | % | |||||||
Nonperforming assets to period-end portfolio loans plus OREO and other nonperforming assets | .44 | .48 | .61 | .73 | .78 | ||||||||||||
(a)Restructured loans (i.e., troubled debt restructuring) are those for which Key, for reasons related to a borrower’s financial difficulties, grants a concession to the borrower that it would not otherwise consider. These concessions are made to improve the collectability of the loan and generally take the form of a reduction of the interest rate, extension of the maturity date or reduction in the principal balance.
| Summary of Changes in Nonperforming Loans From Continuing Operations | |||||||||||||||||
| (Dollars in millions) | |||||||||||||||||
| 1Q22 | 4Q21 | 3Q21 | 2Q21 | 1Q21 | |||||||||||||
| Balance at beginning of period | $ | 454 | $ | 554 | $ | 694 | $ | 728 | $ | 785 | |||||||
| Loans placed on nonaccrual status | 87 | 116 | 116 | 186 | 196 | ||||||||||||
| Charge-offs | (50) | (51) | (66) | (74) | (135) | ||||||||||||
| Loans sold | — | (38) | (17) | (10) | (13) | ||||||||||||
| Payments | (27) | (68) | (136) | (92) | (37) | ||||||||||||
| Transfers to OREO | (1) | (1) | (1) | — | (3) | ||||||||||||
| Transfers to nonperforming loans held for sale | — | — | — | — | — | ||||||||||||
| Loans returned to accrual status | (24) | (58) | (36) | (44) | (65) | ||||||||||||
| Balance at end of period | $ | 439 | $ | 454 | $ | 554 | $ | 694 | $ | 728 | |||||||
KeyCorp Reports First Quarter 2022 Profit
April 21, 2022
Page 23
| Line of Business Results | ||||||||||||||||||||||||||
| (Dollars in millions) | ||||||||||||||||||||||||||
| Percentage change 1Q22 vs. | ||||||||||||||||||||||||||
| 1Q22 | 4Q21 | 3Q21 | 2Q21 | 1Q21 | 4Q21 | 1Q21 | ||||||||||||||||||||
| Consumer Bank | ||||||||||||||||||||||||||
| Summary of operations | ||||||||||||||||||||||||||
| Total revenue (TE) | $ | 799 | $ | 839 | $ | 870 | $ | 852 | $ | 864 | (4.8) | % | (7.5) | % | ||||||||||||
| Provision for credit losses | 43 | 14 | (38) | (70) | (23) | 207.1 | 287.0 | |||||||||||||||||||
| Noninterest expense | 663 | 613 | 591 | 584 | 601 | 8.2 | 10.3 | |||||||||||||||||||
| Net income (loss) attributable to Key | 70 | 161 | 241 | 257 | 217 | (56.5) | (67.7) | |||||||||||||||||||
| Average loans and leases | 38,637 | 37,792 | 39,796 | 40,598 | 39,249 | 2.2 | (1.6) | |||||||||||||||||||
| Average deposits | 91,468 | 90,271 | 89,156 | 88,412 | 85,033 | 1.3 | 7.6 | |||||||||||||||||||
| Net loan charge-offs | 22 | 22 | 35 | 34 | 36 | — | (38.9) | |||||||||||||||||||
| Net loan charge-offs to average total loans | .23 | % | .23 | % | .35 | % | .34 | % | .37 | % | — | (37.8) | ||||||||||||||
| Nonperforming assets at period end | $ | 217 | $ | 222 | $ | 254 | $ | 274 | $ | 276 | (2.3) | (21.4) | ||||||||||||||
| Return on average allocated equity | 7.91 | % | 18.05 | % | 25.81 | % | 28.53 | % | 25.74 | % | (56.2) | (69.3) | ||||||||||||||
| Commercial Bank | ||||||||||||||||||||||||||
| Summary of operations | ||||||||||||||||||||||||||
| Total revenue (TE) | $ | 810 | $ | 1,028 | $ | 886 | $ | 871 | $ | 858 | (21.2) | % | (5.6) | % | ||||||||||||
| Provision for credit losses | 41 | (12) | (69) | (131) | (67) | 441.7 | 161.2 | |||||||||||||||||||
| Noninterest expense | 417 | 501 | 470 | 451 | 443 | (16.8) | (5.9) | |||||||||||||||||||
| Net income (loss) attributable to Key | 283 | 449 | 381 | 432 | 383 | (37.0) | (26.1) | |||||||||||||||||||
| Average loans and leases | 64,701 | 61,127 | 59,914 | 59,953 | 61,221 | 5.8 | 5.7 | |||||||||||||||||||
| Average loans held for sale | 1,323 | 1,962 | 1,190 | 1,341 | 1,237 | (32.6) | 7.0 | |||||||||||||||||||
| Average deposits | 57,289 | 59,537 | 56,522 | 54,814 | 51,894 | (3.8) | 10.4 | |||||||||||||||||||
| Net loan charge-offs | 11 | — | (6) | 9 | 78 | N/M | (85.9) | |||||||||||||||||||
| Net loan charge-offs to average total loans | .07 | % | — | % | (.04) | % | .06 | % | .52 | % | N/M | (86.5) | ||||||||||||||
| Nonperforming assets at period end | $ | 250 | $ | 267 | $ | 345 | $ | 464 | $ | 514 | (6.4) | (51.4) | ||||||||||||||
| Return on average allocated equity | 13.21 | % | 21.54 | % | 18.54 | % | 20.69 | % | 17.41 | % | (38.7) | (24.1) | ||||||||||||||
TE = Taxable Equivalent, N/A = Not Applicable, N/M = Not Meaningful
KeyCorp First Quarter 2022 Earnings Review April 21, 2022 Don Kimble Vice Chairman and Chief Financial Officer Chris Gorman Chairman and Chief Executive Officer
Forward-looking Statements and Additional Information This communication contains forward-looking statements within the meaning of the Private Securities Litigation Reform Act of 1995 including, but not limited to, KeyCorp’s expectations or predictions of future financial or business performance or conditions. Forward-looking statements are typically identified by words such as “believe,” “seek,” “expect,” “anticipate,” “intend,” “target,” “estimate,” “continue,” “positions,” “plan,” “predict,” “project,” “forecast,” “guidance,” “goal,” “objective,” “prospects,” “possible,” “potential,” “strategy,” “opportunities,” or “trends,” by future conditional verbs such as “assume,” “will,” “would,” “should,” “could” or “may”, or by variations of such words or by similar expressions. These forward-looking statements are based on assumptions that involve risks and uncertainties, which are subject to change based on various important factors (some of which are beyond KeyCorp’s control.) Actual results may differ materially from current projections. Actual outcomes may differ materially from those expressed or implied as a result of the factors described under “Forward-looking Statements” and “Risk Factors” in KeyCorp’s Annual Report on Form 10-K for the year ended December 31, 2021, and in other filings of KeyCorp with the Securities and Exchange Commission (the “SEC”). Such forward-looking statements speak only as of the date they are made, and we undertake no obligation to update any forward-looking statement to reflect events or circumstances after that date or to reflect the occurrence of unanticipated events. For additional information regarding KeyCorp, please refer to our SEC filings available at www.key.com/ir. Annualized, pro forma, projected and estimated numbers are used for illustrative purpose only, are not forecasts and may not reflect actual results. This presentation also includes certain non-GAAP financial measures related to “tangible common equity,” “cash efficiency ratio,” and “pre-provision net revenue.” Although Key has procedures in place to ensure that these measures are calculated using the appropriate GAAP or regulatory components, they have limitations as analytical tools and should not be considered in isolation, or as a substitute for analysis of results under GAAP. For more information on these calculations and to view the reconciliations to the most comparable GAAP measures, please refer to the appendix of this presentation, or page 90 of our Form 10-K dated December 31, 2021. GAAP: Generally Accepted Accounting Principles 2
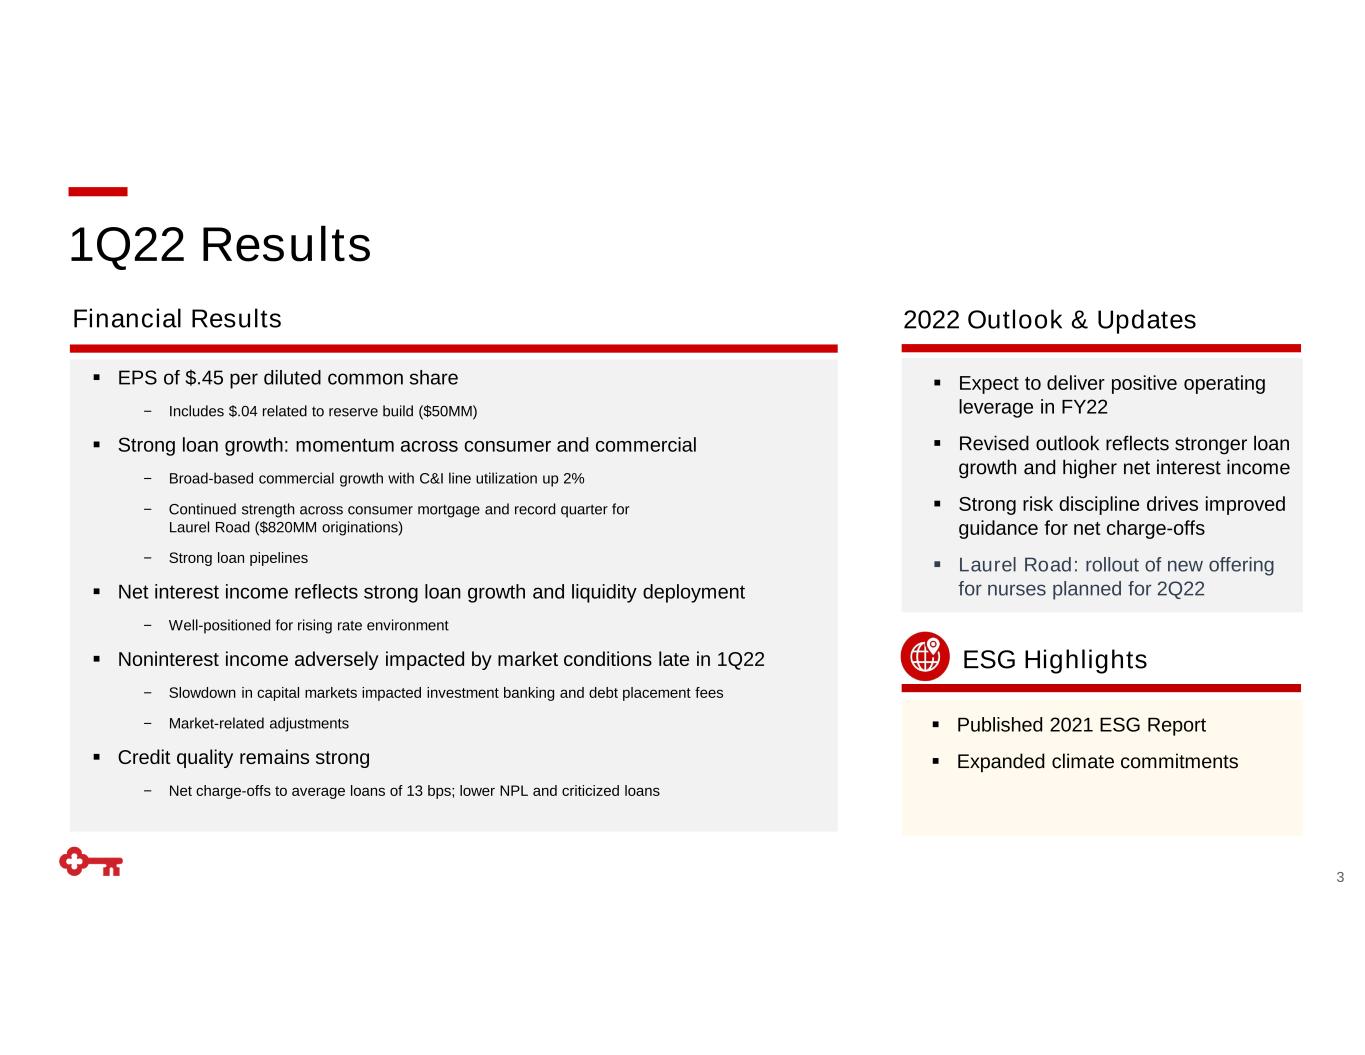
1Q22 Results 3 EPS of $.45 per diluted common share − Includes $.04 related to reserve build ($50MM) Strong loan growth: momentum across consumer and commercial − Broad-based commercial growth with C&I line utilization up 2% − Continued strength across consumer mortgage and record quarter for Laurel Road ($820MM originations) − Strong loan pipelines Net interest income reflects strong loan growth and liquidity deployment − Well-positioned for rising rate environment Noninterest income adversely impacted by market conditions late in 1Q22 − Slowdown in capital markets impacted investment banking and debt placement fees − Market-related adjustments Credit quality remains strong − Net charge-offs to average loans of 13 bps; lower NPL and criticized loans Expect to deliver positive operating leverage in FY22 Revised outlook reflects stronger loan growth and higher net interest income Strong risk discipline drives improved guidance for net charge-offs Laurel Road: rollout of new offering for nurses planned for 2Q22 Financial Results 2022 Outlook & Updates ESG Highlights Published 2021 ESG Report Expanded climate commitments
Financial Review
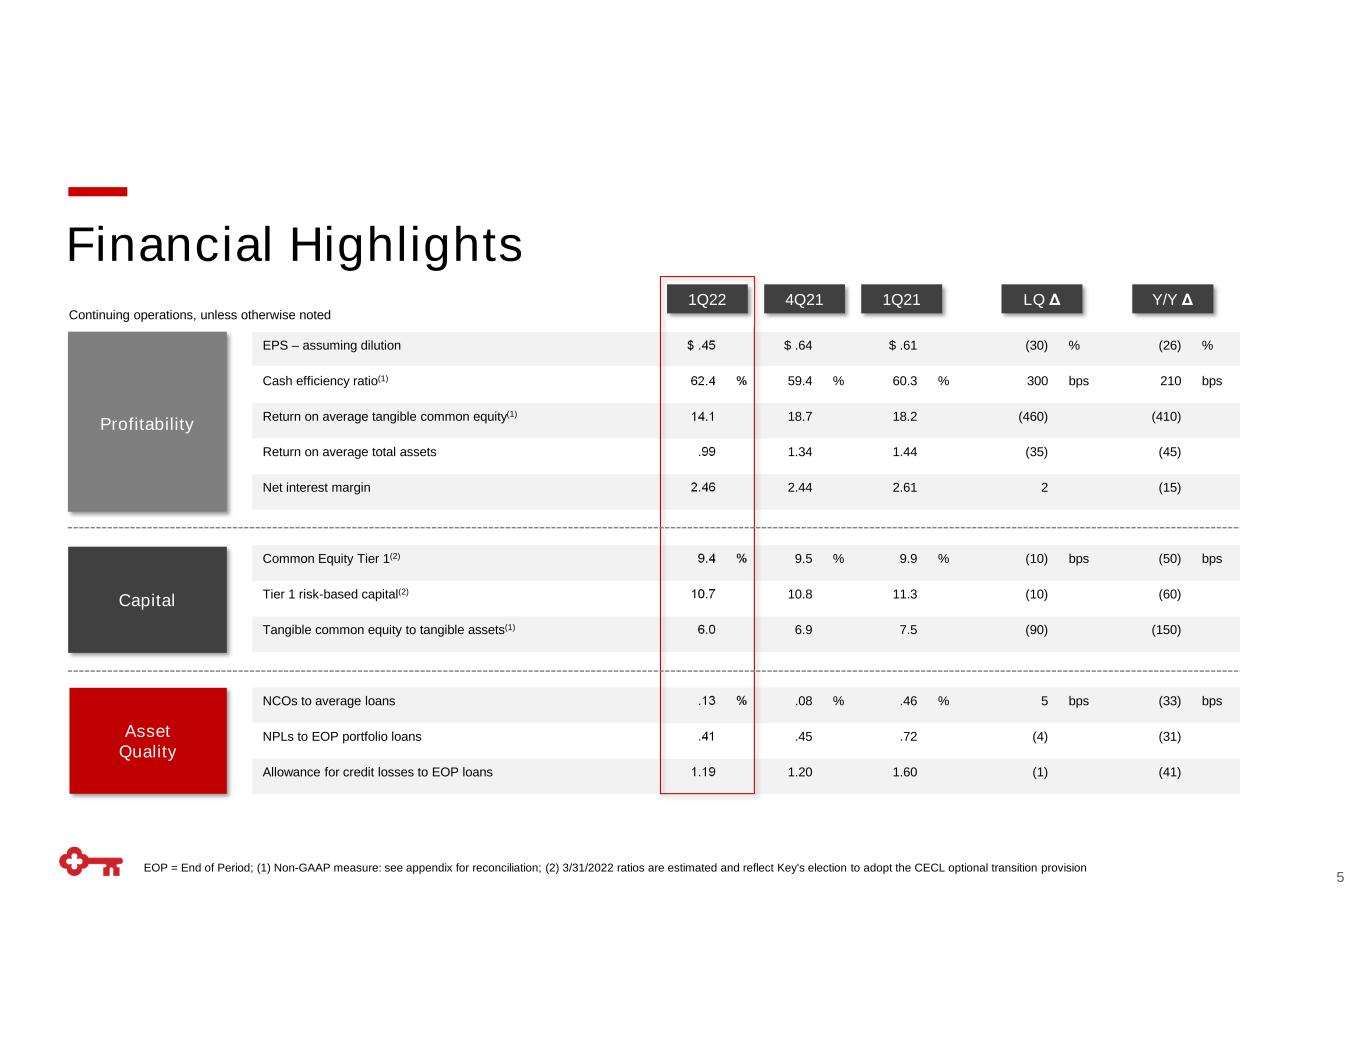
EOP = End of Period; (1) Non-GAAP measure: see appendix for reconciliation; (2) 3/31/2022 ratios are estimated and reflect Key's election to adopt the CECL optional transition provision Financial Highlights 5 EPS – assuming dilution $ .45 $ .64 $ .61 (30) % (26) % Cash efficiency ratio(1) 62.4 % 59.4 % 60.3 % 300 bps 210 bps Return on average tangible common equity(1) 14.1 18.7 18.2 (460) (410) Return on average total assets .99 1.34 1.44 (35) (45) Net interest margin 2.46 2.44 2.61 2 (15) Common Equity Tier 1(2) 9.4 % 9.5 % 9.9 % (10) bps (50) bps Tier 1 risk-based capital(2) 10.7 10.8 11.3 (10) (60) Tangible common equity to tangible assets(1) 6.0 6.9 7.5 (90) (150) NCOs to average loans .13 % .08 % .46 % 5 bps (33) bps NPLs to EOP portfolio loans .41 .45 .72 (4) (31) Allowance for credit losses to EOP loans 1.19 1.20 1.60 (1) (41) Profitability Capital Asset Quality 1Q22 4Q21 1Q21 LQ Δ Y/Y Δ Continuing operations, unless otherwise noted
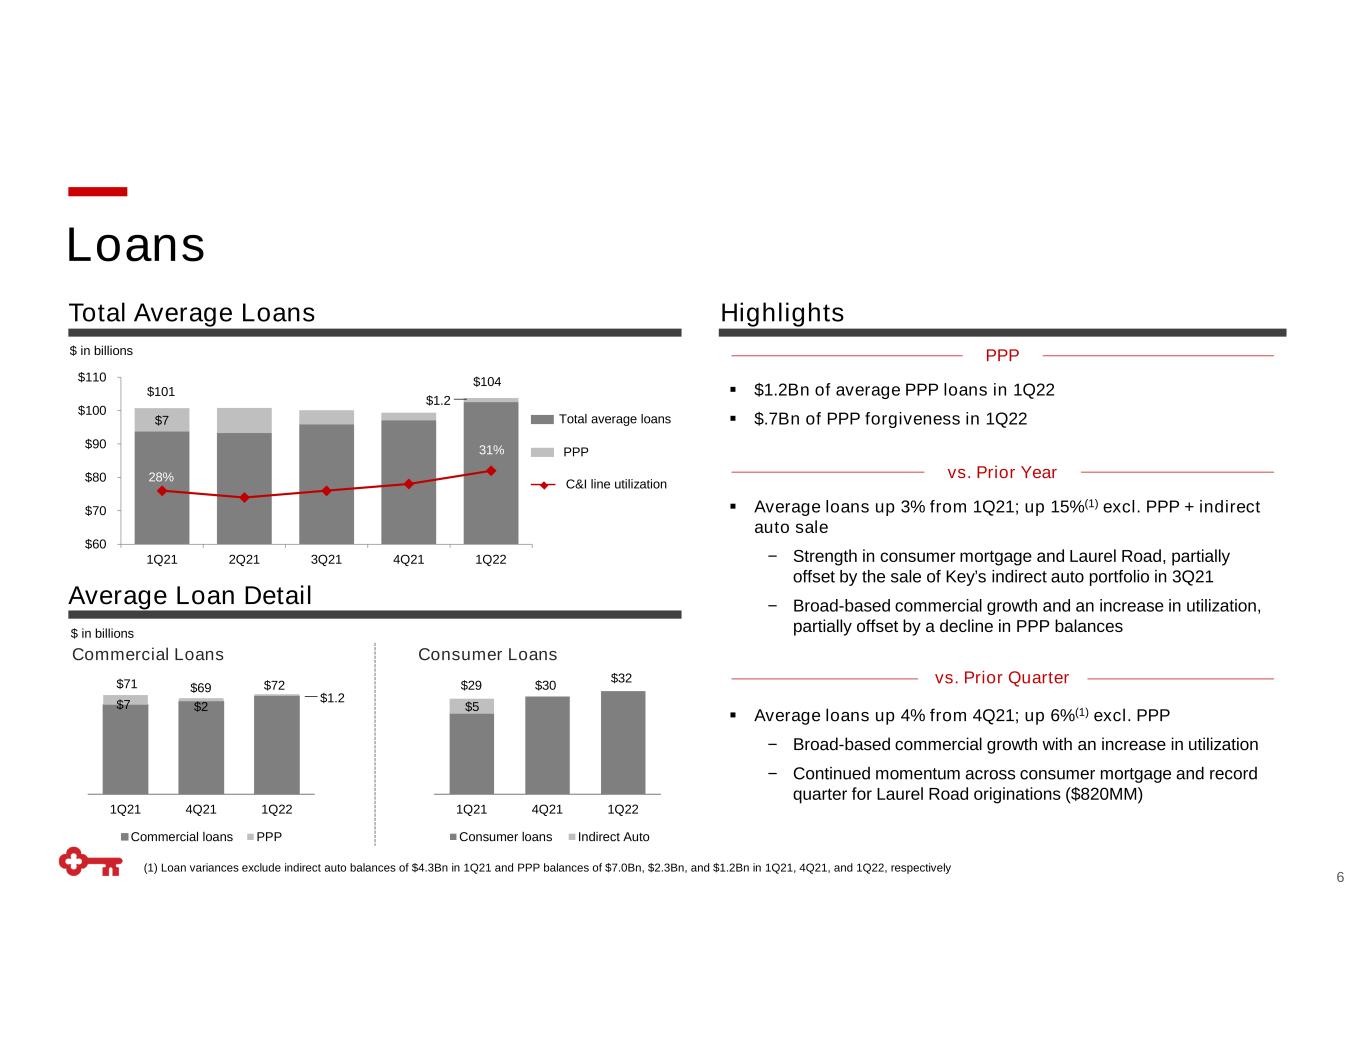
Total Average Loans 1Q21 4Q21 1Q22 Consumer loans Indirect Auto Highlights Average Loan Detail 6 $7 $1.2 28% 31% 20.00% 30.00% 40.00% $60 $70 $80 $90 $100 $110 1Q21 2Q21 3Q21 4Q21 1Q22 C&I line utilization Total average loans PPP $ in billions 1Q21 4Q21 1Q22 Commercial loans PPP PPP Average loans up 3% from 1Q21; up 15%(1) excl. PPP + indirect auto sale − Strength in consumer mortgage and Laurel Road, partially offset by the sale of Key’s indirect auto portfolio in 3Q21 − Broad-based commercial growth and an increase in utilization, partially offset by a decline in PPP balances Average loans up 4% from 4Q21; up 6%(1) excl. PPP − Broad-based commercial growth with an increase in utilization − Continued momentum across consumer mortgage and record quarter for Laurel Road originations ($820MM) $2 $1.2Bn of average PPP loans in 1Q22 $.7Bn of PPP forgiveness in 1Q22 Loans Commercial Loans Consumer Loans $ in billions $7 $5 $101 $104 $71 $69 $72 $1.2 $29 $30 $32 (1) Loan variances exclude indirect auto balances of $4.3Bn in 1Q21 and PPP balances of $7.0Bn, $2.3Bn, and $1.2Bn in 1Q21, 4Q21, and 1Q22, respectively vs. Prior Year vs. Prior Quarter
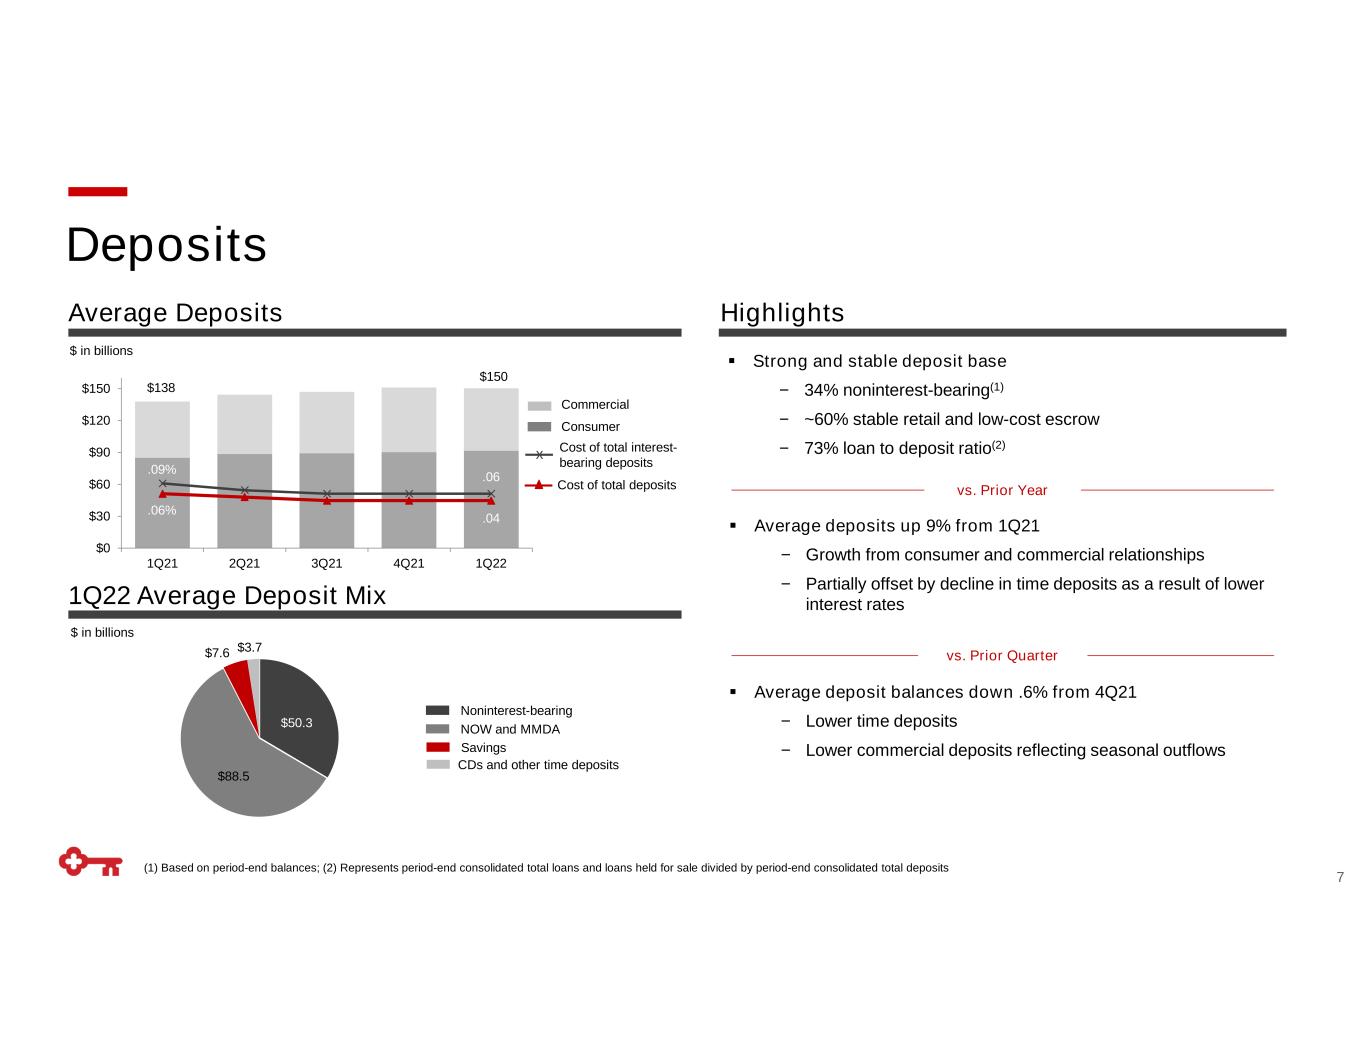
(1) Based on period-end balances; (2) Represents period-end consolidated total loans and loans held for sale divided by period-end consolidated total deposits Deposits 7 $ in billions vs. Prior Quarter Average deposit balances down .6% from 4Q21 − Lower time deposits − Lower commercial deposits reflecting seasonal outflows .06% .04 .09% .06 $0 $30 $60 $90 $120 $150 1Q21 2Q21 3Q21 4Q21 1Q22 Cost of total interest- bearing deposits Cost of total deposits Consumer Commercial x CDs and other time deposits Savings Noninterest-bearing NOW and MMDA Average deposits up 9% from 1Q21 − Growth from consumer and commercial relationships − Partially offset by decline in time deposits as a result of lower interest rates Strong and stable deposit base − 34% noninterest-bearing(1) − ~60% stable retail and low-cost escrow − 73% loan to deposit ratio(2) $138 $ in billions 1Q22 Average Deposit Mix Average Deposits Highlights $88.5 $50.3 $3.7$7.6 $150 vs. Prior Year
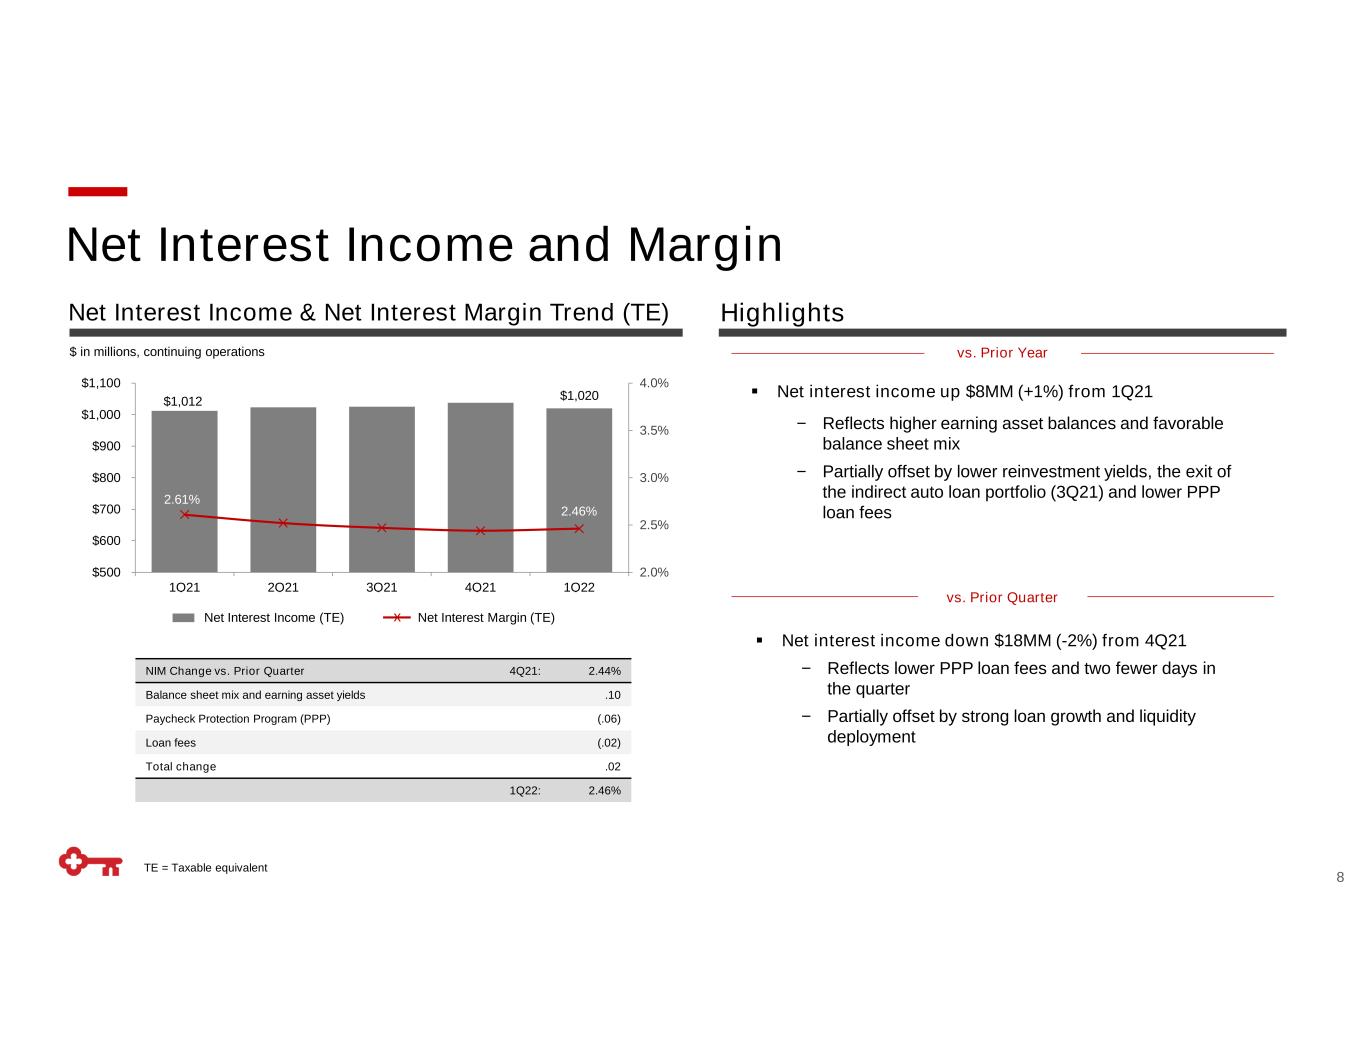
Net Interest Income and Margin $ in millions, continuing operations vs. Prior Quarter TE = Taxable equivalent $1,012 $1,020 2.61% 2.46% 2.0% 2.5% 3.0% 3.5% 4.0% $500 $600 $700 $800 $900 $1,000 $1,100 1Q21 2Q21 3Q21 4Q21 1Q22 Net Interest Income (TE) Net Interest Margin (TE)x NIM Change vs. Prior Quarter 4Q21: 2.44% Balance sheet mix and earning asset yields .10 Paycheck Protection Program (PPP) (.06) Loan fees (.02) Total change .02 1Q22: 2.46% Net interest income up $8MM (+1%) from 1Q21 − Reflects higher earning asset balances and favorable balance sheet mix − Partially offset by lower reinvestment yields, the exit of the indirect auto loan portfolio (3Q21) and lower PPP loan fees Net interest income down $18MM (-2%) from 4Q21 − Reflects lower PPP loan fees and two fewer days in the quarter − Partially offset by strong loan growth and liquidity deployment Net Interest Income & Net Interest Margin Trend (TE) Highlights 8 vs. Prior Year
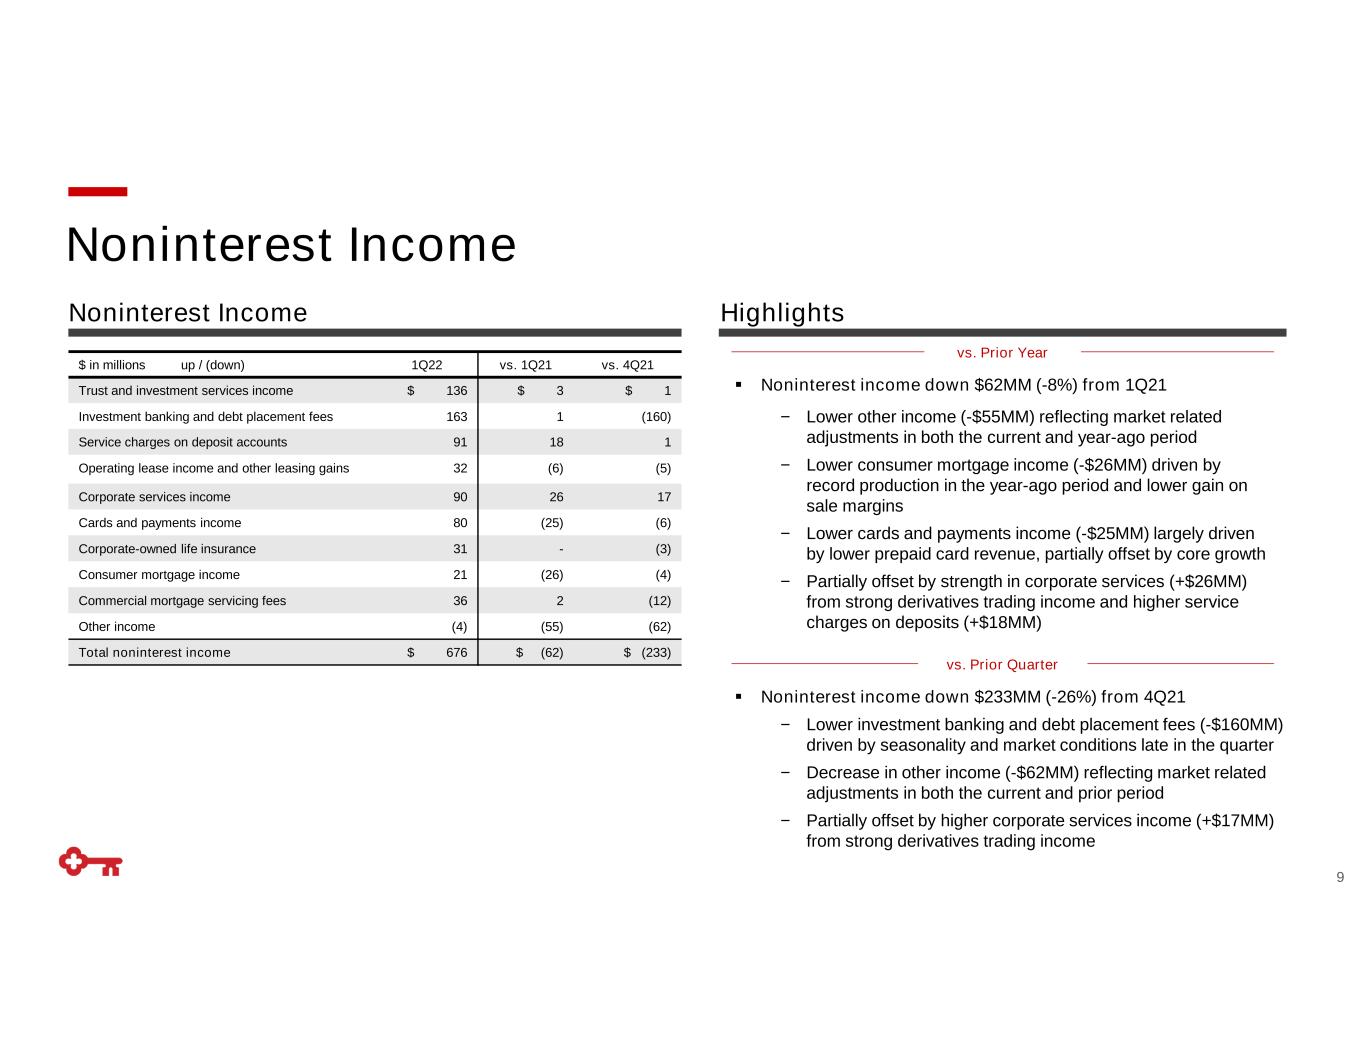
Noninterest Income 9 Noninterest income down $62MM (-8%) from 1Q21 − Lower other income (-$55MM) reflecting market related adjustments in both the current and year-ago period − Lower consumer mortgage income (-$26MM) driven by record production in the year-ago period and lower gain on sale margins − Lower cards and payments income (-$25MM) largely driven by lower prepaid card revenue, partially offset by core growth − Partially offset by strength in corporate services (+$26MM) from strong derivatives trading income and higher service charges on deposits (+$18MM) vs. Prior Quarter Noninterest income down $233MM (-26%) from 4Q21 − Lower investment banking and debt placement fees (-$160MM) driven by seasonality and market conditions late in the quarter − Decrease in other income (-$62MM) reflecting market related adjustments in both the current and prior period − Partially offset by higher corporate services income (+$17MM) from strong derivatives trading income vs. Prior Year $ in millions up / (down) 1Q22 vs. 1Q21 vs. 4Q21 Trust and investment services income $ 136 $ 3 $ 1 Investment banking and debt placement fees 163 1 (160) Service charges on deposit accounts 91 18 1 Operating lease income and other leasing gains 32 (6) (5) Corporate services income 90 26 17 Cards and payments income 80 (25) (6) Corporate-owned life insurance 31 - (3) Consumer mortgage income 21 (26) (4) Commercial mortgage servicing fees 36 2 (12) Other income (4) (55) (62) Total noninterest income $ 676 $ (62) $ (233) Noninterest Income Highlights
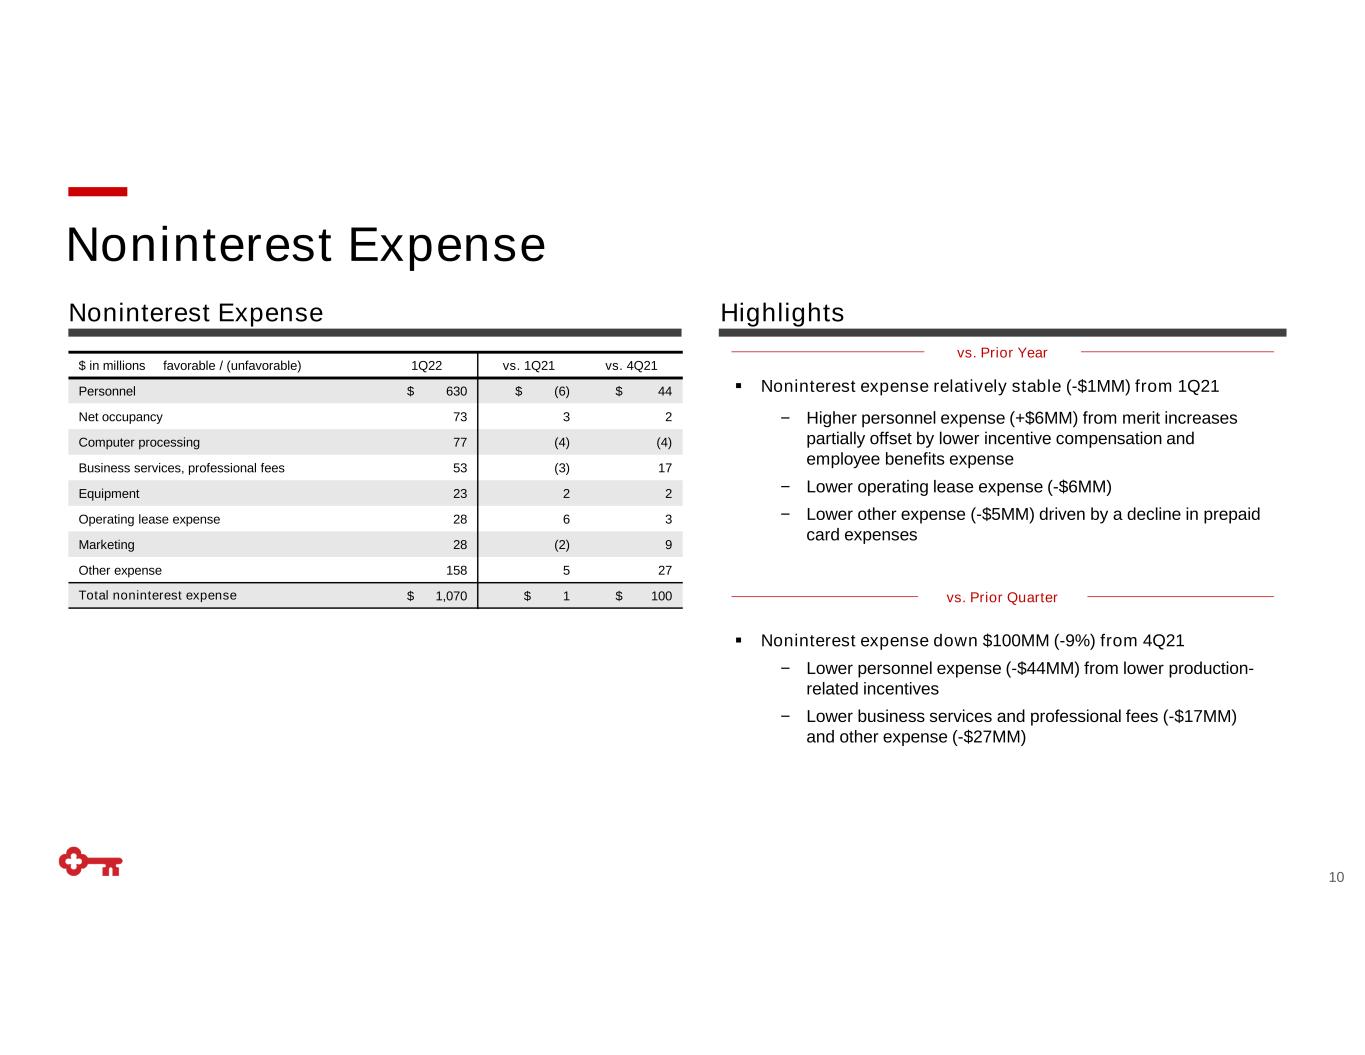
Noninterest Expense 10 vs. Prior Quarter vs. Prior Year $ in millions favorable / (unfavorable) 1Q22 vs. 1Q21 vs. 4Q21 Personnel $ 630 $ (6) $ 44 Net occupancy 73 3 2 Computer processing 77 (4) (4) Business services, professional fees 53 (3) 17 Equipment 23 2 2 Operating lease expense 28 6 3 Marketing 28 (2) 9 Other expense 158 5 27 Total noninterest expense $ 1,070 $ 1 $ 100 Noninterest expense relatively stable (-$1MM) from 1Q21 − Higher personnel expense (+$6MM) from merit increases partially offset by lower incentive compensation and employee benefits expense − Lower operating lease expense (-$6MM) − Lower other expense (-$5MM) driven by a decline in prepaid card expenses Noninterest expense down $100MM (-9%) from 4Q21 − Lower personnel expense (-$44MM) from lower production- related incentives − Lower business services and professional fees (-$17MM) and other expense (-$27MM) Noninterest Expense Highlights
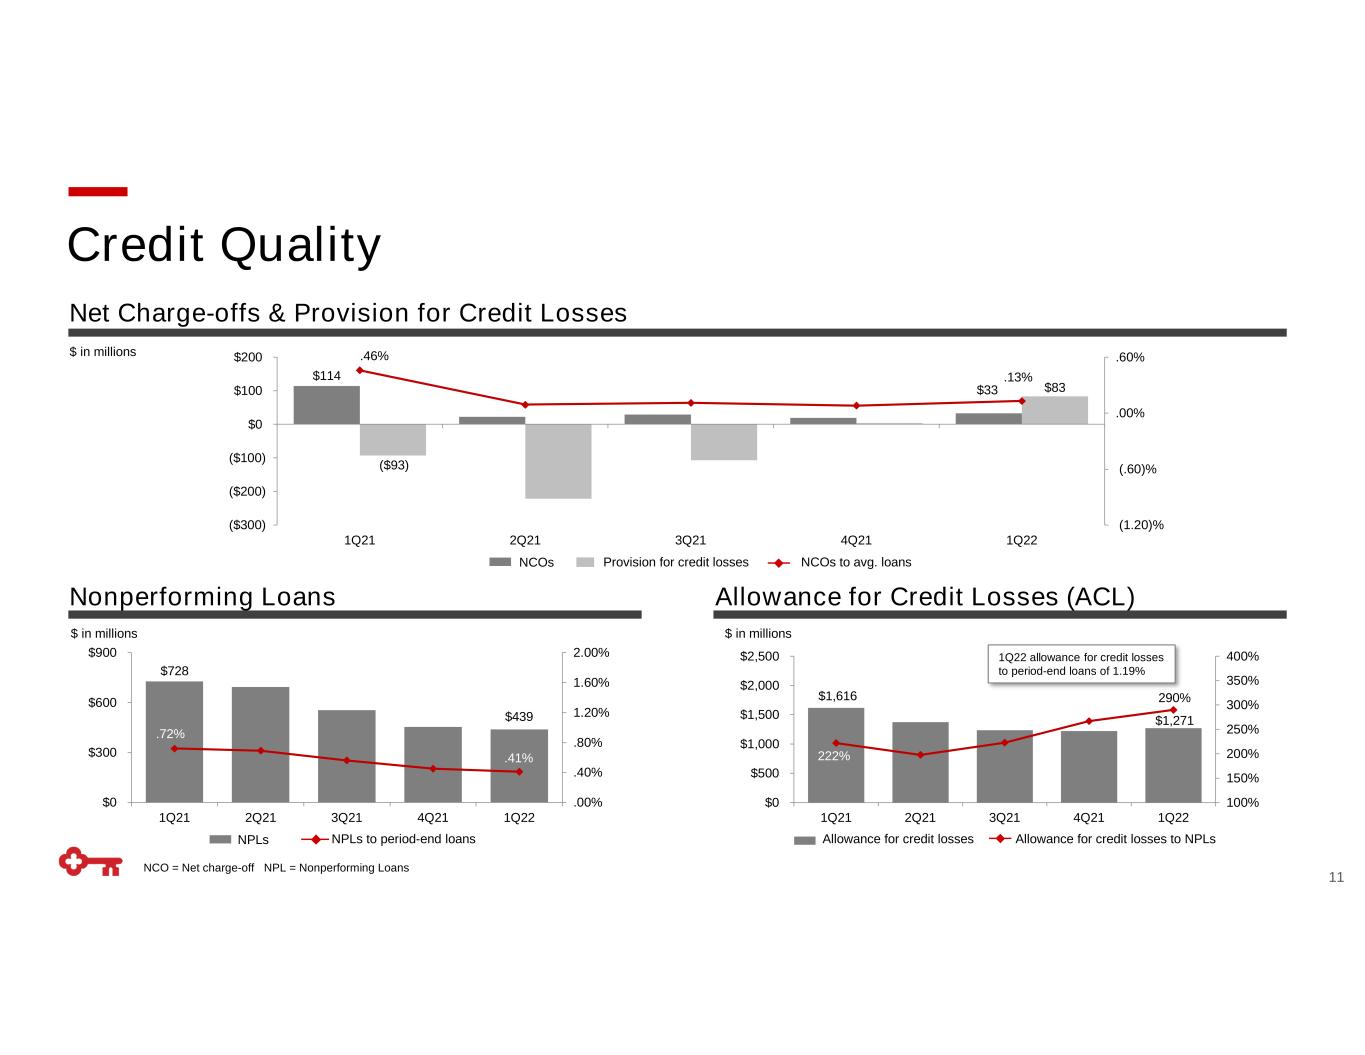
NCO = Net charge-off NPL = Nonperforming Loans Credit Quality 11 $114 $33 ($93) $83 .46% .13% (1.20)% (.60)% .00% .60% ($300) ($200) ($100) $0 $100 $200 1Q21 2Q21 3Q21 4Q21 1Q22 NCOs Provision for credit losses NCOs to avg. loans $728 $439 .72% .41% .00% .40% .80% 1.20% 1.60% 2.00% $0 $300 $600 $900 1Q21 2Q21 3Q21 4Q21 1Q22 NPLs NPLs to period-end loans $1,616 $1,271 222% 290% 100% 150% 200% 250% 300% 350% 400% $0 $500 $1,000 $1,500 $2,000 $2,500 1Q21 2Q21 3Q21 4Q21 1Q22 Allowance for credit losses to NPLsAllowance for credit losses 1Q22 allowance for credit losses to period-end loans of 1.19% Net Charge-offs & Provision for Credit Losses $ in millions Nonperforming Loans Allowance for Credit Losses (ACL) $ in millions $ in millions
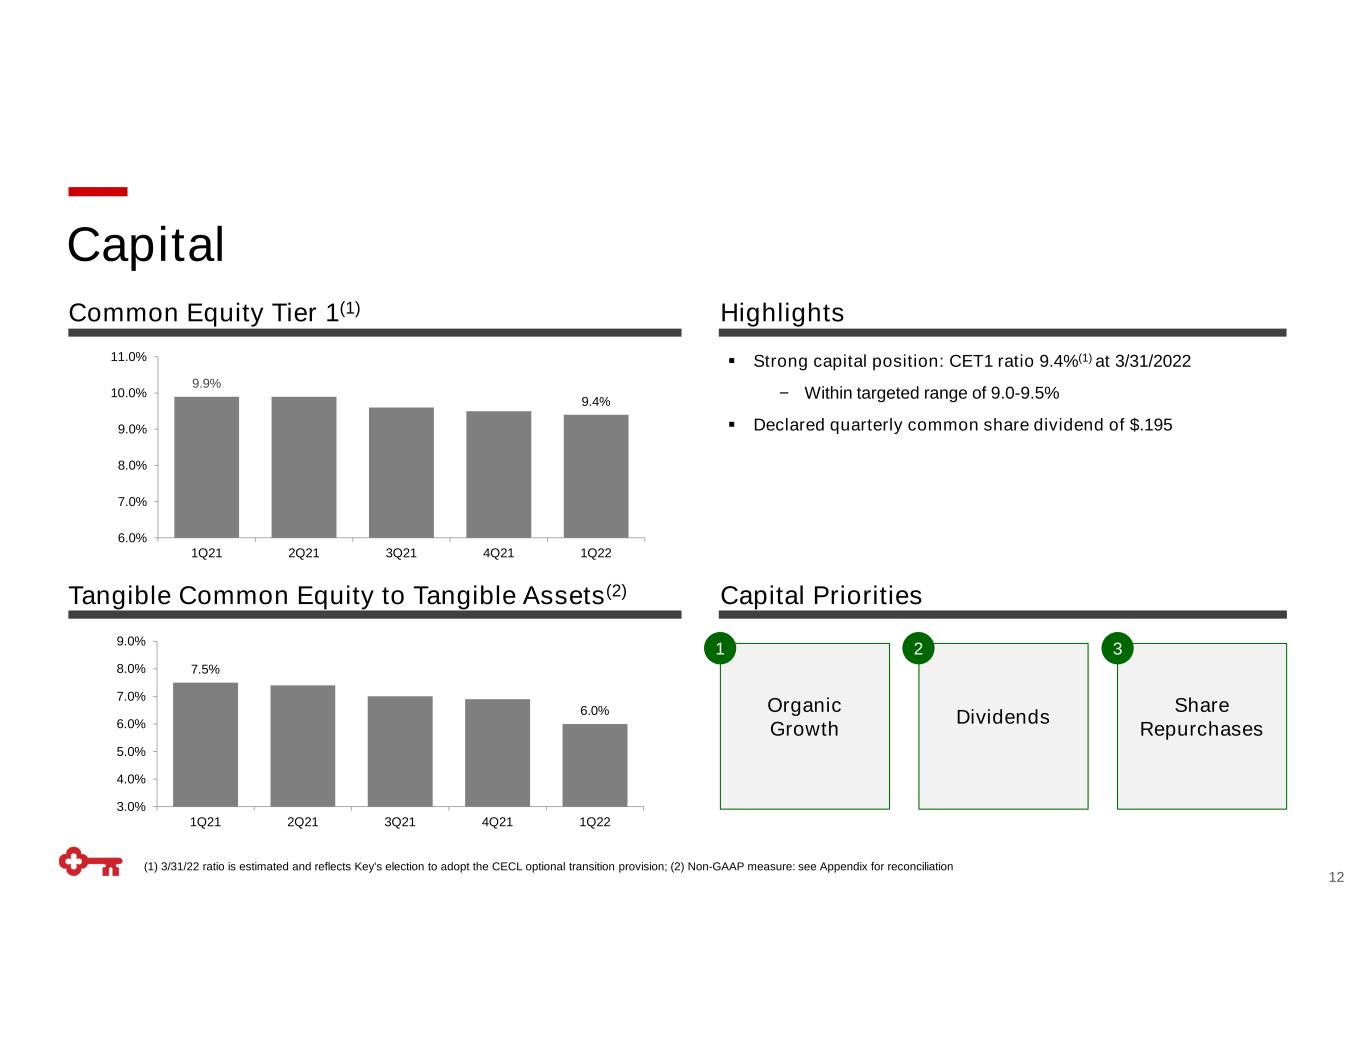
(1) 3/31/22 ratio is estimated and reflects Key's election to adopt the CECL optional transition provision; (2) Non-GAAP measure: see Appendix for reconciliation Capital 12 Strong capital position: CET1 ratio 9.4%(1) at 3/31/2022 − Within targeted range of 9.0-9.5% Declared quarterly common share dividend of $.195 9.9% 9.4% 6.0% 7.0% 8.0% 9.0% 10.0% 11.0% 1Q21 2Q21 3Q21 4Q21 1Q22 7.5% 6.0% 3.0% 4.0% 5.0% 6.0% 7.0% 8.0% 9.0% 1Q21 2Q21 3Q21 4Q21 1Q22 Tangible Common Equity to Tangible Assets(2) Common Equity Tier 1(1) Highlights Capital Priorities Organic Growth Dividends Share Repurchases 21 3
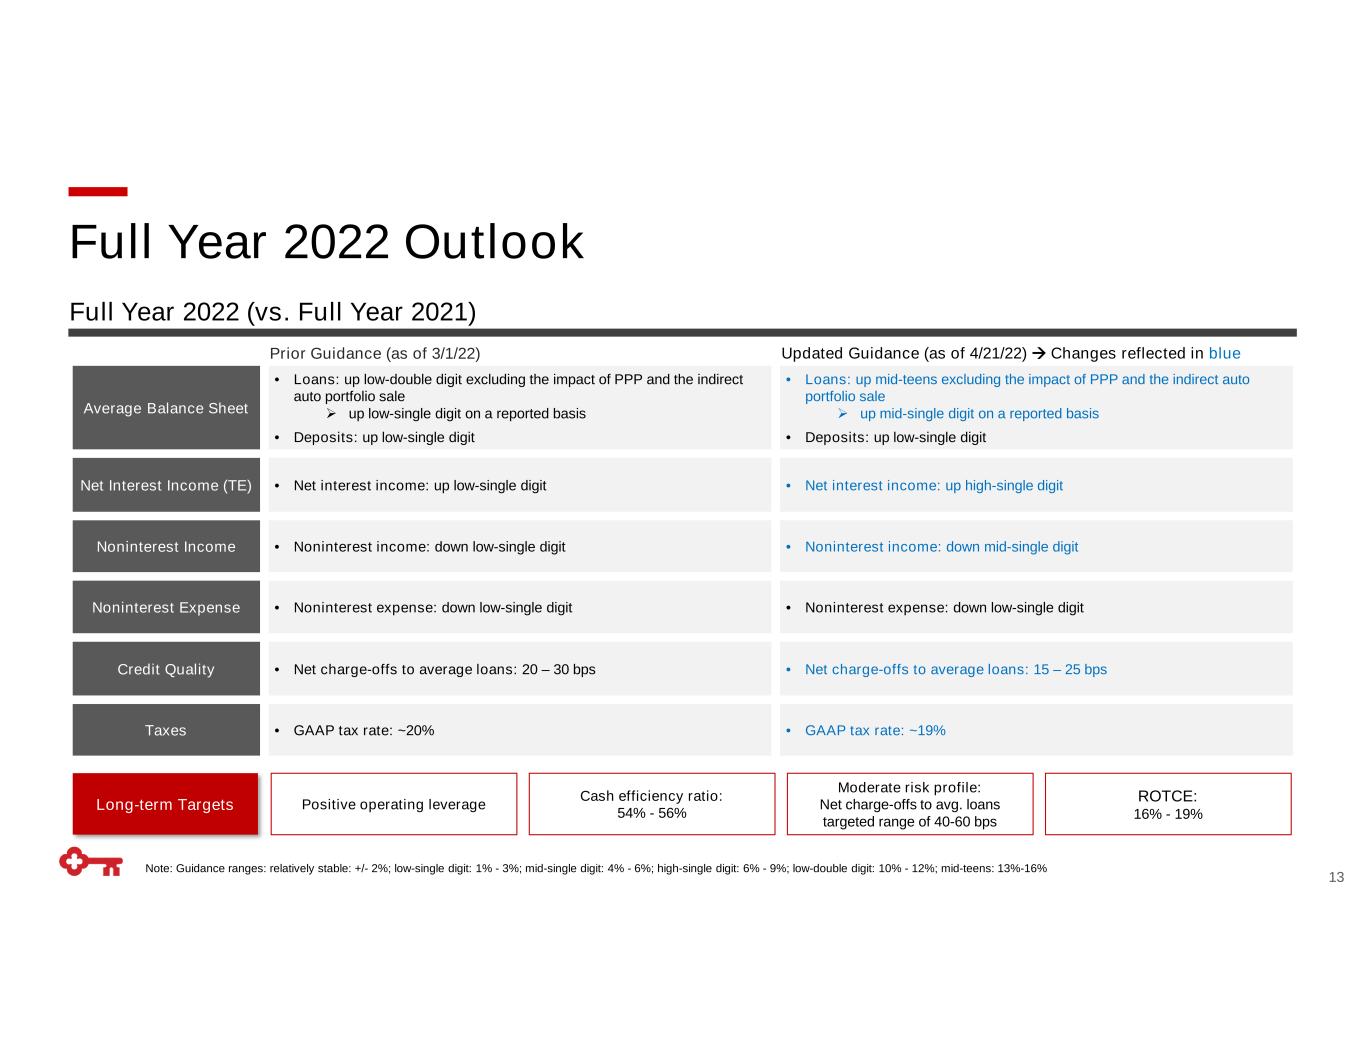
Full Year 2022 Outlook Note: Guidance ranges: relatively stable: +/- 2%; low-single digit: 1% - 3%; mid-single digit: 4% - 6%; high-single digit: 6% - 9%; low-double digit: 10% - 12%; mid-teens: 13%-16% Long-term Targets Positive operating leverage Moderate risk profile: Net charge-offs to avg. loans targeted range of 40-60 bps ROTCE: 16% - 19% Cash efficiency ratio: 54% - 56% Full Year 2022 (vs. Full Year 2021) 13 Average Balance Sheet • Loans: up low-double digit excluding the impact of PPP and the indirect auto portfolio sale up low-single digit on a reported basis • Deposits: up low-single digit • Loans: up mid-teens excluding the impact of PPP and the indirect auto portfolio sale up mid-single digit on a reported basis • Deposits: up low-single digit Net Interest Income (TE) • Net interest income: up low-single digit • Net interest income: up high-single digit Noninterest Income • Noninterest income: down low-single digit • Noninterest income: down mid-single digit Noninterest Expense • Noninterest expense: down low-single digit • Noninterest expense: down low-single digit Credit Quality • Net charge-offs to average loans: 20 – 30 bps • Net charge-offs to average loans: 15 – 25 bps Taxes • GAAP tax rate: ~20% • GAAP tax rate: ~19% Prior Guidance (as of 3/1/22) Updated Guidance (as of 4/21/22) Changes reflected in blue

Appendix
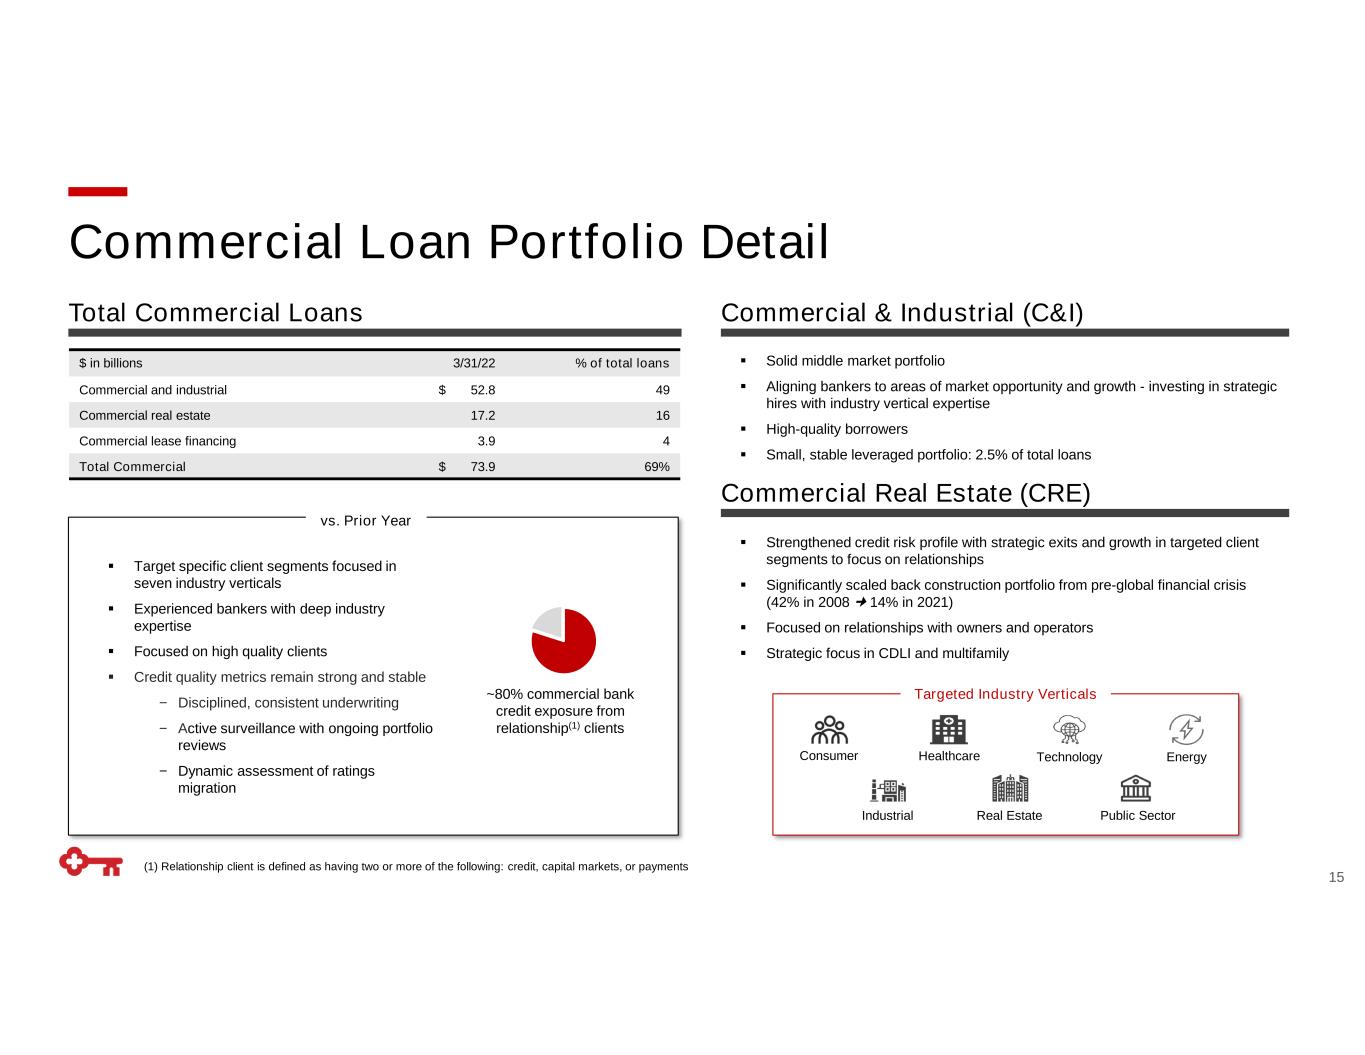
Commercial Loan Portfolio Detail vs. Prior Year Target specific client segments focused in seven industry verticals Experienced bankers with deep industry expertise Focused on high quality clients Credit quality metrics remain strong and stable − Disciplined, consistent underwriting − Active surveillance with ongoing portfolio reviews − Dynamic assessment of ratings migration ~80% commercial bank credit exposure from relationship(1) clients Targeted Industry Verticals Consumer Energy Industrial TechnologyHealthcare (1) Relationship client is defined as having two or more of the following: credit, capital markets, or payments Solid middle market portfolio Aligning bankers to areas of market opportunity and growth - investing in strategic hires with industry vertical expertise High-quality borrowers Small, stable leveraged portfolio: 2.5% of total loans Strengthened credit risk profile with strategic exits and growth in targeted client segments to focus on relationships Significantly scaled back construction portfolio from pre-global financial crisis (42% in 2008 14% in 2021) Focused on relationships with owners and operators Strategic focus in CDLI and multifamily Real Estate Public Sector Total Commercial Loans Commercial & Industrial (C&I) Commercial Real Estate (CRE) 15 $ in billions 3/31/22 % of total loans Commercial and industrial $ 52.8 49 Commercial real estate 17.2 16 Commercial lease financing 3.9 4 Total Commercial $ 73.9 69%
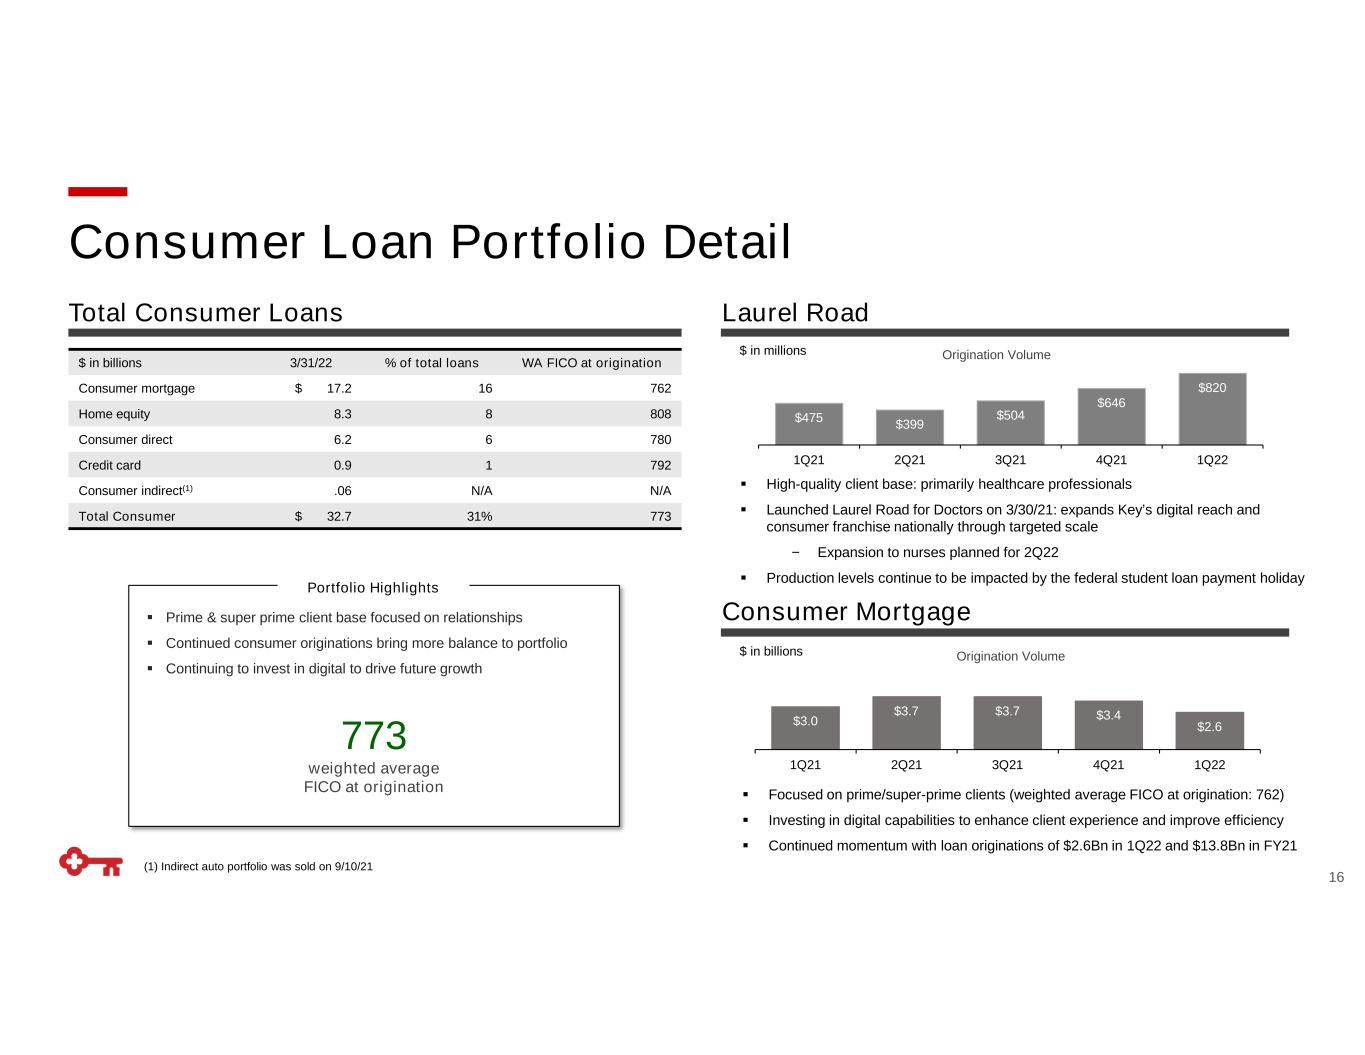
Consumer Loan Portfolio Detail Portfolio Highlights Prime & super prime client base focused on relationships Continued consumer originations bring more balance to portfolio Continuing to invest in digital to drive future growth 773 weighted average FICO at origination $475 $399 $504 $646 $820 1Q21 2Q21 3Q21 4Q21 1Q22 Origination Volume$ in millions $ in billions $3.0 $3.7 $3.7 $3.4 $2.6 1Q21 2Q21 3Q21 4Q21 1Q22 Origination Volume (1) Indirect auto portfolio was sold on 9/10/21 High-quality client base: primarily healthcare professionals Launched Laurel Road for Doctors on 3/30/21: expands Key’s digital reach and consumer franchise nationally through targeted scale − Expansion to nurses planned for 2Q22 Production levels continue to be impacted by the federal student loan payment holiday Focused on prime/super-prime clients (weighted average FICO at origination: 762) Investing in digital capabilities to enhance client experience and improve efficiency Continued momentum with loan originations of $2.6Bn in 1Q22 and $13.8Bn in FY21 Total Consumer Loans Laurel Road Consumer Mortgage 16 $ in billions 3/31/22 % of total loans WA FICO at origination Consumer mortgage $ 17.2 16 762 Home equity 8.3 8 808 Consumer direct 6.2 6 780 Credit card 0.9 1 792 Consumer indirect(1) .06 N/A N/A Total Consumer $ 32.7 31% 773
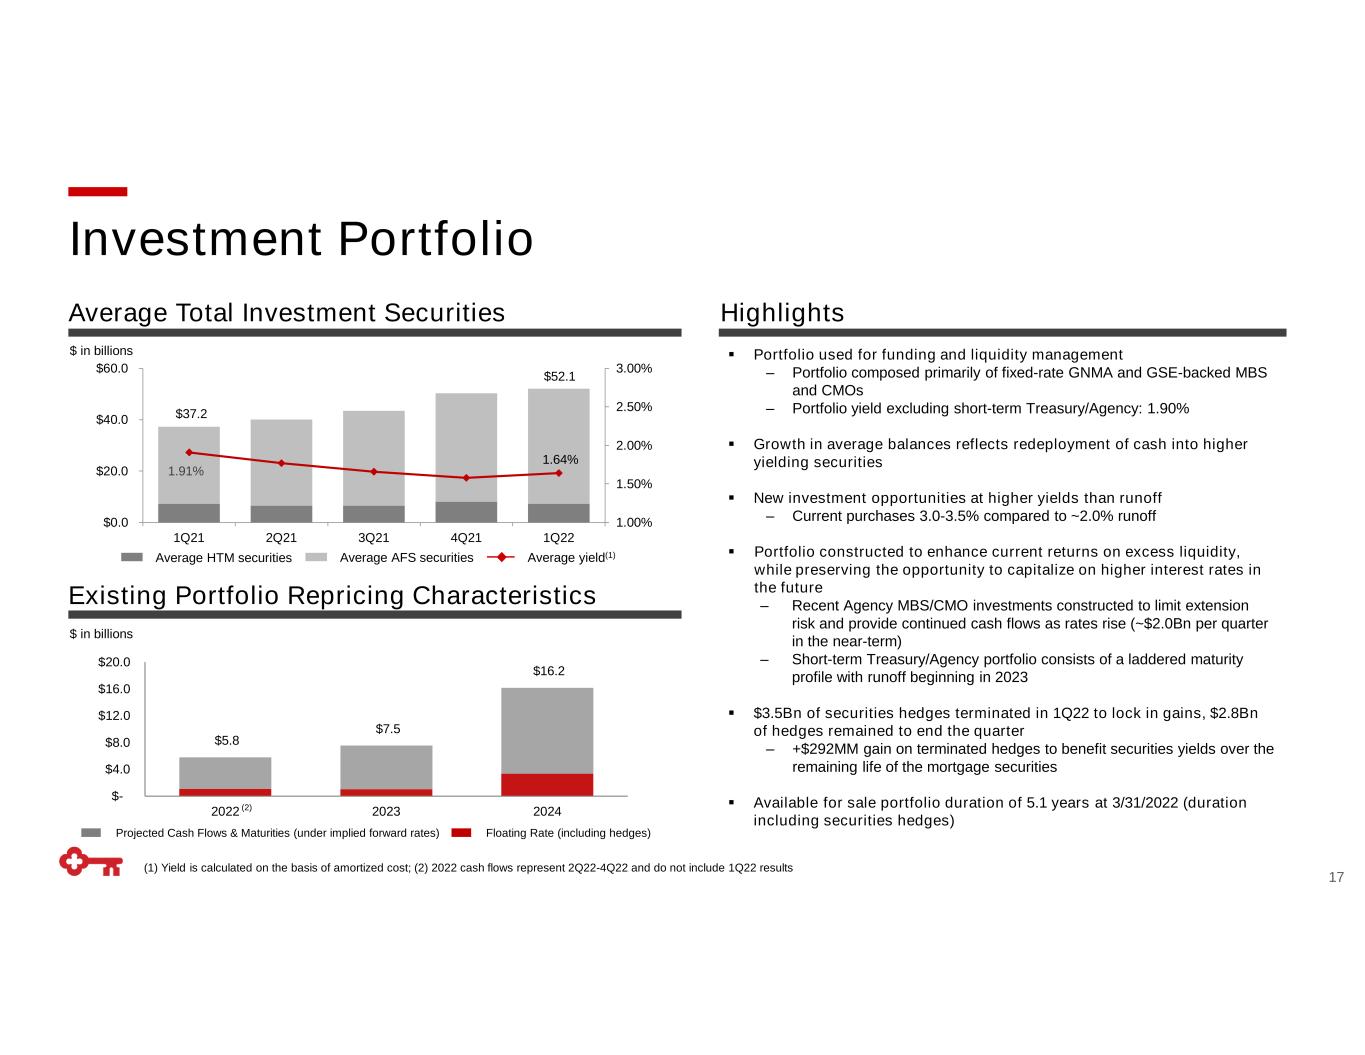
17 $ in billions 1.91% 1.64% 1.00% 1.50% 2.00% 2.50% 3.00% $0.0 $20.0 $40.0 $60.0 1Q21 2Q21 3Q21 4Q21 1Q22 Average AFS securities Average yield(1)Average HTM securities Projected Cash Flows & Maturities (under implied forward rates) Floating Rate (including hedges) Portfolio used for funding and liquidity management ‒ Portfolio composed primarily of fixed-rate GNMA and GSE-backed MBS and CMOs ‒ Portfolio yield excluding short-term Treasury/Agency: 1.90% Growth in average balances reflects redeployment of cash into higher yielding securities New investment opportunities at higher yields than runoff ‒ Current purchases 3.0-3.5% compared to ~2.0% runoff Portfolio constructed to enhance current returns on excess liquidity, while preserving the opportunity to capitalize on higher interest rates in the future ‒ Recent Agency MBS/CMO investments constructed to limit extension risk and provide continued cash flows as rates rise (~$2.0Bn per quarter in the near-term) ‒ Short-term Treasury/Agency portfolio consists of a laddered maturity profile with runoff beginning in 2023 $3.5Bn of securities hedges terminated in 1Q22 to lock in gains, $2.8Bn of hedges remained to end the quarter ‒ +$292MM gain on terminated hedges to benefit securities yields over the remaining life of the mortgage securities Available for sale portfolio duration of 5.1 years at 3/31/2022 (duration including securities hedges) Average Total Investment Securities $ in billions Existing Portfolio Repricing Characteristics Highlights (1) Yield is calculated on the basis of amortized cost; (2) 2022 cash flows represent 2Q22-4Q22 and do not include 1Q22 results $52.1 $37.2 Investment Portfolio $5.8 $7.5 $16.2 $- $4.0 $8.0 $12.0 $16.0 $20.0 2022 2023 2024(2)
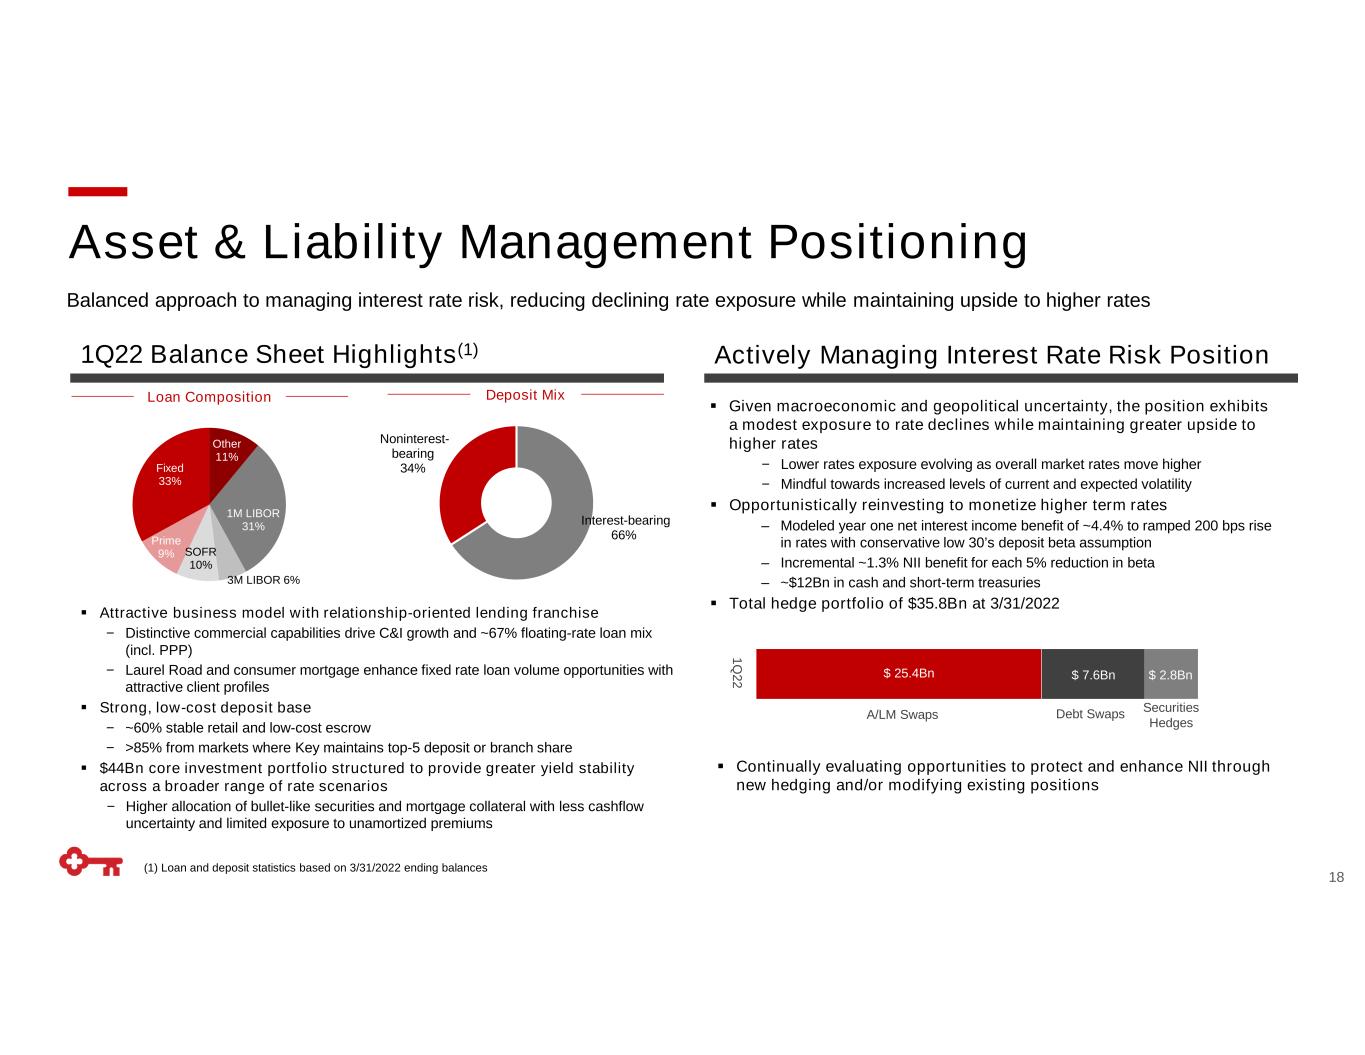
Balanced approach to managing interest rate risk, reducing declining rate exposure while maintaining upside to higher rates (1) Loan and deposit statistics based on 3/31/2022 ending balances Loan Composition Deposit Mix Prime 9% 1M LIBOR 31% 3M LIBOR 6% Other 11% SOFR 10% Fixed 33% Interest-bearing 66% Noninterest- bearing 34% 1Q 22 A/LM Swaps Debt Swaps $ 25.4Bn $ 7.6Bn $ 2.8Bn Securities Hedges Given macroeconomic and geopolitical uncertainty, the position exhibits a modest exposure to rate declines while maintaining greater upside to higher rates − Lower rates exposure evolving as overall market rates move higher − Mindful towards increased levels of current and expected volatility Opportunistically reinvesting to monetize higher term rates ‒ Modeled year one net interest income benefit of ~4.4% to ramped 200 bps rise in rates with conservative low 30’s deposit beta assumption ‒ Incremental ~1.3% NII benefit for each 5% reduction in beta ‒ ~$12Bn in cash and short-term treasuries Total hedge portfolio of $35.8Bn at 3/31/2022 Attractive business model with relationship-oriented lending franchise − Distinctive commercial capabilities drive C&I growth and ~67% floating-rate loan mix (incl. PPP) − Laurel Road and consumer mortgage enhance fixed rate loan volume opportunities with attractive client profiles Strong, low-cost deposit base − ~60% stable retail and low-cost escrow − >85% from markets where Key maintains top-5 deposit or branch share $44Bn core investment portfolio structured to provide greater yield stability across a broader range of rate scenarios − Higher allocation of bullet-like securities and mortgage collateral with less cashflow uncertainty and limited exposure to unamortized premiums Continually evaluating opportunities to protect and enhance NII through new hedging and/or modifying existing positions 1Q22 Balance Sheet Highlights(1) Actively Managing Interest Rate Risk Position 18 Asset & Liability Management Positioning
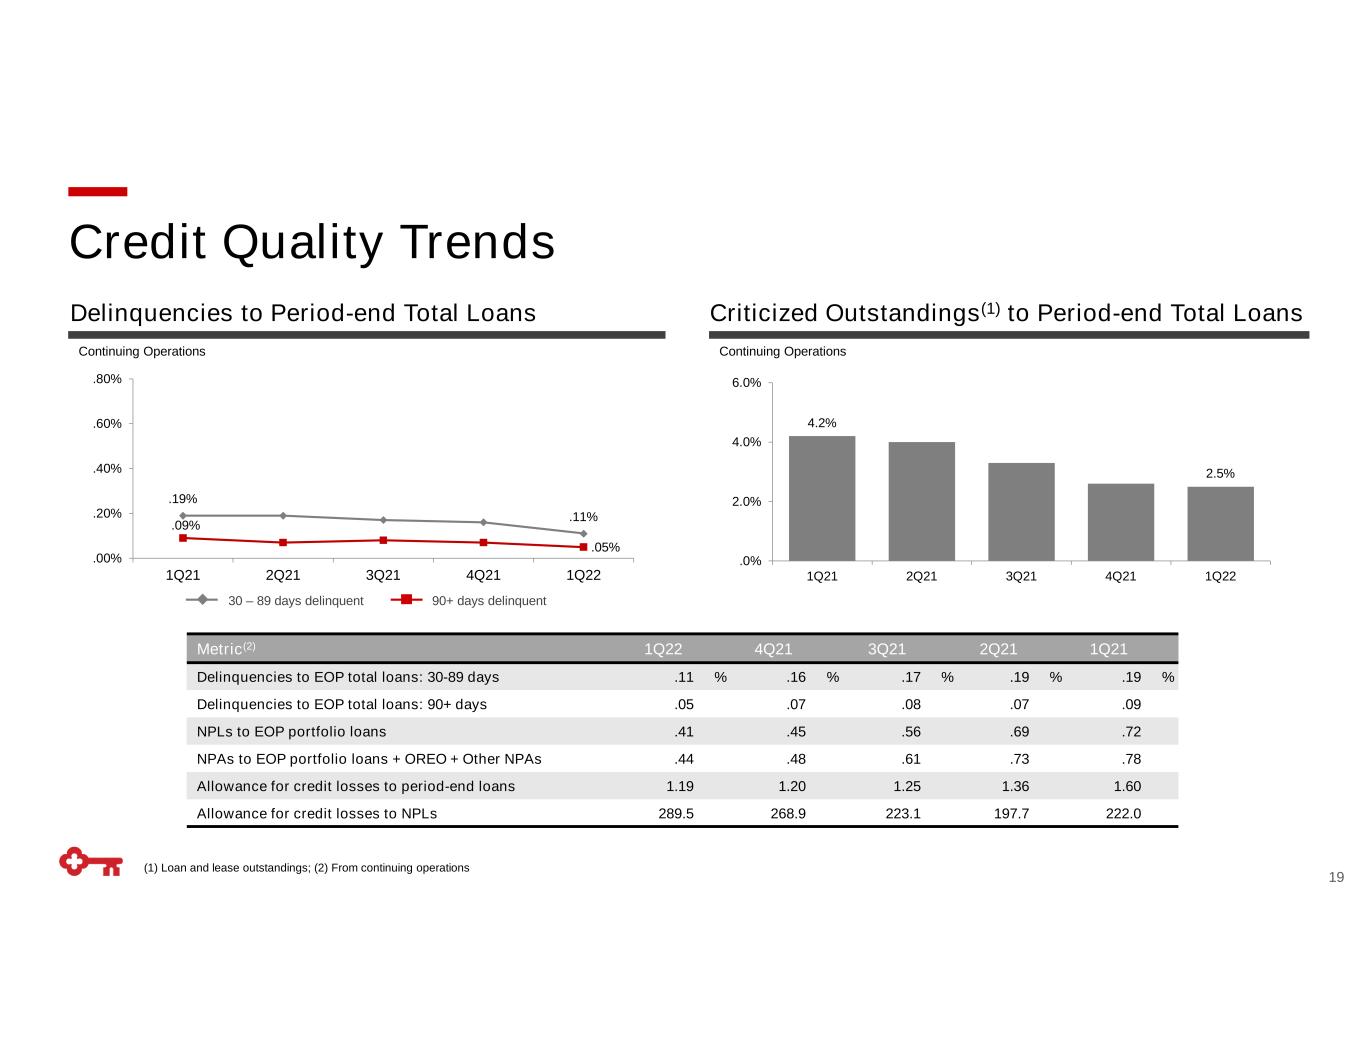
Credit Quality Trends Delinquencies to Period-end Total Loans Criticized Outstandings(1) to Period-end Total Loans (1) Loan and lease outstandings; (2) From continuing operations Continuing Operations Continuing Operations .19% .11% .09% .05% .00% .20% .40% .60% .80% 1Q21 2Q21 3Q21 4Q21 1Q22 4.2% 2.5% .0% 2.0% 4.0% 6.0% 1Q21 2Q21 3Q21 4Q21 1Q22 30 – 89 days delinquent 90+ days delinquent Metric(2) 1Q22 4Q21 3Q21 2Q21 1Q21 Delinquencies to EOP total loans: 30-89 days .11 % .16 % .17 % .19 % .19 % Delinquencies to EOP total loans: 90+ days .05 .07 .08 .07 .09 NPLs to EOP portfolio loans .41 .45 .56 .69 .72 NPAs to EOP portfolio loans + OREO + Other NPAs .44 .48 .61 .73 .78 Allowance for credit losses to period-end loans 1.19 1.20 1.25 1.36 1.60 Allowance for credit losses to NPLs 289.5 268.9 223.1 197.7 222.0 19
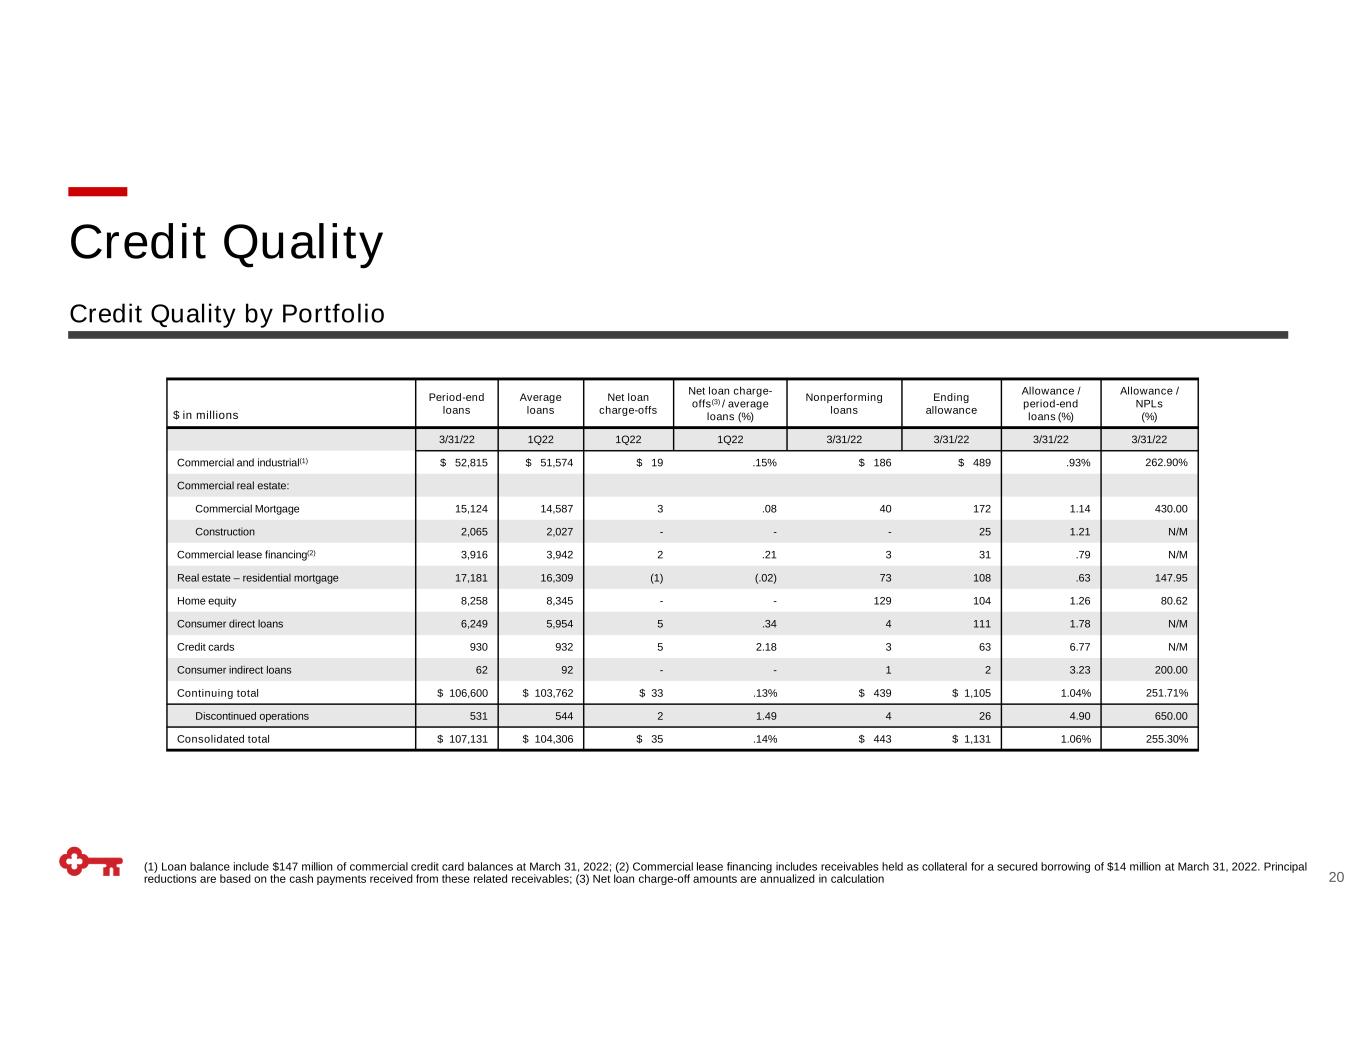
Credit Quality by Portfolio 20 Period-end loans Average loans Net loan charge-offs Net loan charge- offs(3) / average loans (%) Nonperforming loans Ending allowance Allowance / period-end loans (%) Allowance / NPLs (%) 3/31/22 1Q22 1Q22 1Q22 3/31/22 3/31/22 3/31/22 3/31/22 Commercial and industrial(1) $ 52,815 $ 51,574 $ 19 .15% $ 186 $ 489 .93% 262.90% Commercial real estate: Commercial Mortgage 15,124 14,587 3 .08 40 172 1.14 430.00 Construction 2,065 2,027 - - - 25 1.21 N/M Commercial lease financing(2) 3,916 3,942 2 .21 3 31 .79 N/M Real estate – residential mortgage 17,181 16,309 (1) (.02) 73 108 .63 147.95 Home equity 8,258 8,345 - - 129 104 1.26 80.62 Consumer direct loans 6,249 5,954 5 .34 4 111 1.78 N/M Credit cards 930 932 5 2.18 3 63 6.77 N/M Consumer indirect loans 62 92 - - 1 2 3.23 200.00 Continuing total $ 106,600 $ 103,762 $ 33 .13% $ 439 $ 1,105 1.04% 251.71% Discontinued operations 531 544 2 1.49 4 26 4.90 650.00 Consolidated total $ 107,131 $ 104,306 $ 35 .14% $ 443 $ 1,131 1.06% 255.30% $ in millions (1) Loan balance include $147 million of commercial credit card balances at March 31, 2022; (2) Commercial lease financing includes receivables held as collateral for a secured borrowing of $14 million at March 31, 2022. Principal reductions are based on the cash payments received from these related receivables; (3) Net loan charge-off amounts are annualized in calculation Credit Quality
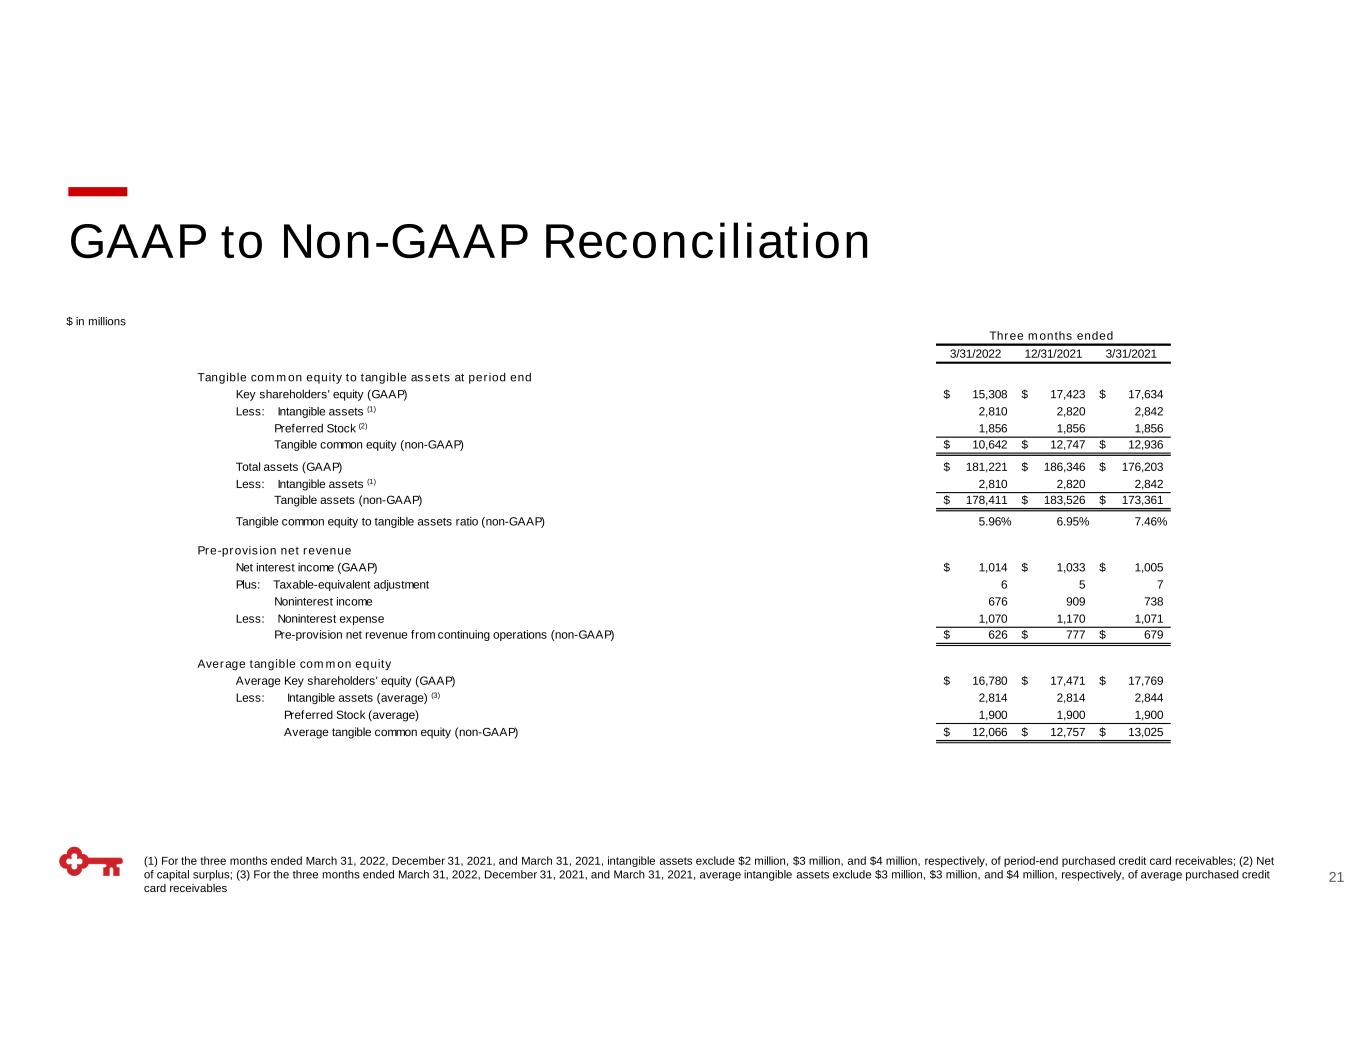
21 $ in millions (1) For the three months ended March 31, 2022, December 31, 2021, and March 31, 2021, intangible assets exclude $2 million, $3 million, and $4 million, respectively, of period-end purchased credit card receivables; (2) Net of capital surplus; (3) For the three months ended March 31, 2022, December 31, 2021, and March 31, 2021, average intangible assets exclude $3 million, $3 million, and $4 million, respectively, of average purchased credit card receivables GAAP to Non-GAAP Reconciliation 3/31/2022 12/31/2021 3/31/2021 Tangible common equity to tangible assets at period end Key shareholders' equity (GAAP) 15,308$ 17,423$ 17,634$ Less: Intangible assets (1) 2,810 2,820 2,842 Preferred Stock (2) 1,856 1,856 1,856 Tangible common equity (non-GAAP) 10,642$ 12,747$ 12,936$ Total assets (GAAP) 181,221$ 186,346$ 176,203$ Less: Intangible assets (1) 2,810 2,820 2,842 Tangible assets (non-GAAP) 178,411$ 183,526$ 173,361$ Tangible common equity to tangible assets ratio (non-GAAP) 5.96% 6.95% 7.46% Pre-provision net revenue Net interest income (GAAP) 1,014$ 1,033$ 1,005$ Plus: Taxable-equivalent adjustment 6 5 7 Noninterest income 676 909 738 Less: Noninterest expense 1,070 1,170 1,071 Pre-provision net revenue from continuing operations (non-GAAP) 626$ 777$ 679$ Average tangible common equity Average Key shareholders' equity (GAAP) 16,780$ 17,471$ 17,769$ Less: Intangible assets (average) (3) 2,814 2,814 2,844 Preferred Stock (average) 1,900 1,900 1,900 Average tangible common equity (non-GAAP) 12,066$ 12,757$ 13,025$ Three months ended
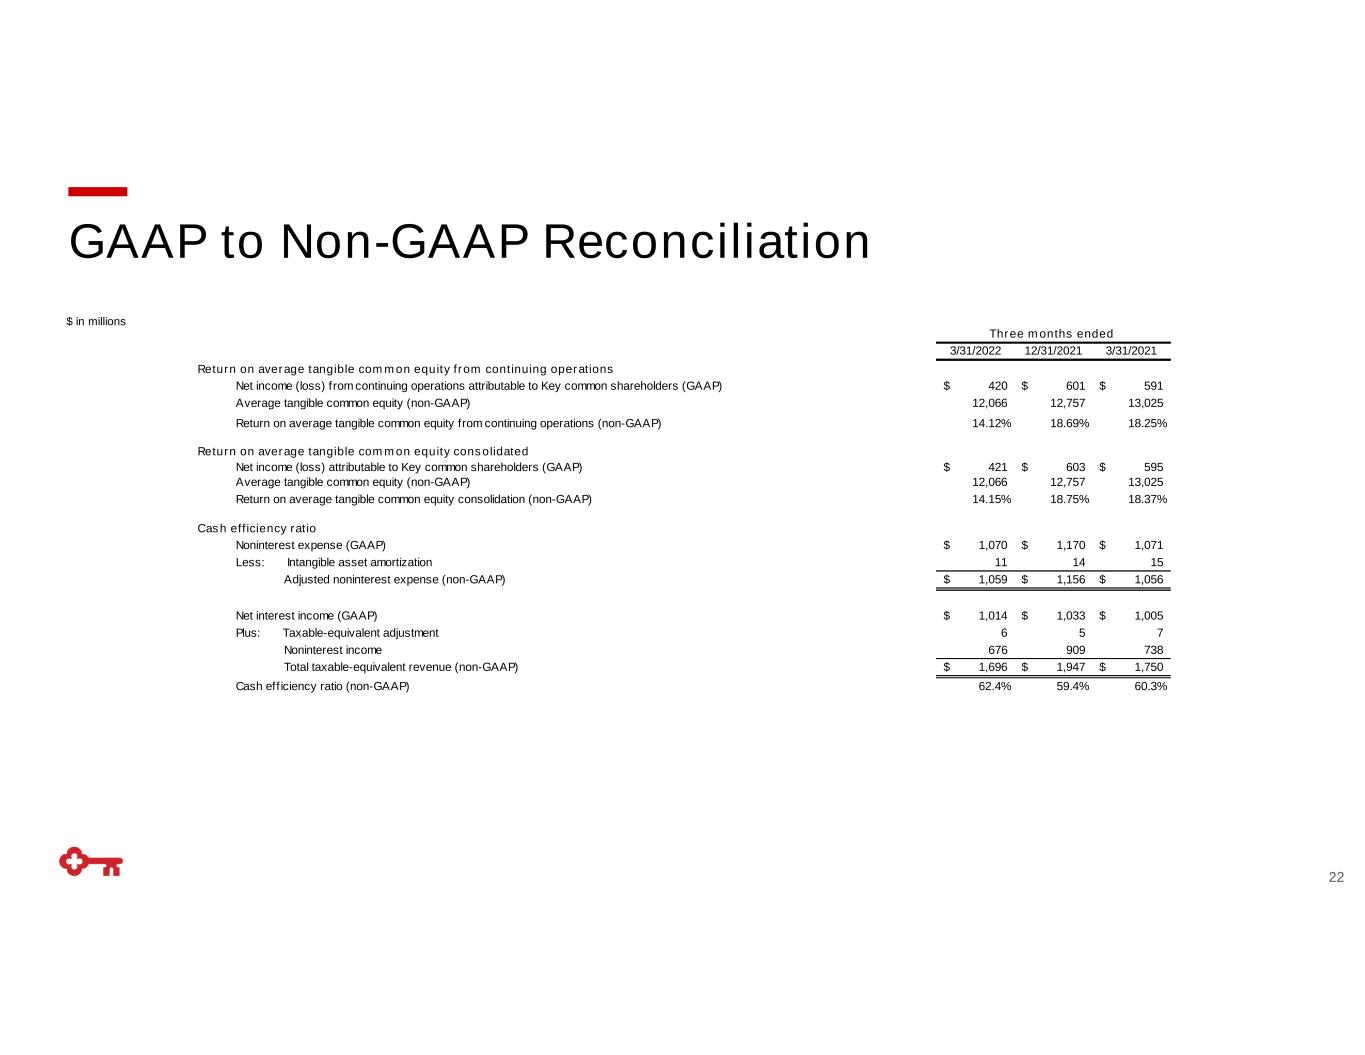
22 $ in millions GAAP to Non-GAAP Reconciliation 3/31/2022 12/31/2021 3/31/2021 Return on average tangible common equity from continuing operations Net income (loss) from continuing operations attributable to Key common shareholders (GAAP) 420$ 601$ 591$ Average tangible common equity (non-GAAP) 12,066 12,757 13,025 Return on average tangible common equity from continuing operations (non-GAAP) 14.12% 18.69% 18.25% Return on average tangible common equity consolidated Net income (loss) attributable to Key common shareholders (GAAP) 421$ 603$ 595$ Average tangible common equity (non-GAAP) 12,066 12,757 13,025 Return on average tangible common equity consolidation (non-GAAP) 14.15% 18.75% 18.37% Cash efficiency ratio Noninterest expense (GAAP) 1,070$ 1,170$ 1,071$ Less: Intangible asset amortization 11 14 15 Adjusted noninterest expense (non-GAAP) 1,059$ 1,156$ 1,056$ Net interest income (GAAP) 1,014$ 1,033$ 1,005$ Plus: Taxable-equivalent adjustment 6 5 7 Noninterest income 676 909 738 Total taxable-equivalent revenue (non-GAAP) 1,696$ 1,947$ 1,750$ Cash eff iciency ratio (non-GAAP) 62.4% 59.4% 60.3% Three months ended
Exhibit 99.3
| Consolidated Balance Sheets | |||||||||||||||||
| (dollars in millions) | |||||||||||||||||
| 3/31/2022 | 12/31/2021 | 3/31/2021 | |||||||||||||||
| Assets | |||||||||||||||||
| Loans | $ | 106,600 | $ | 101,854 | $ | 100,926 | |||||||||||
| Loans held for sale | 1,170 | 2,729 | 2,296 | ||||||||||||||
| Securities available for sale | 43,681 | 45,364 | 33,923 | ||||||||||||||
| Held-to-maturity securities | 6,871 | 7,539 | 6,857 | ||||||||||||||
| Trading account assets | 848 | 701 | 811 | ||||||||||||||
| Short-term investments | 3,881 | 11,010 | 15,376 | ||||||||||||||
| Other investments | 722 | 639 | 621 | ||||||||||||||
| Total earning assets | 163,773 | 169,836 | 160,810 | ||||||||||||||
| Allowance for loan and lease losses | (1,105) | (1,061) | (1,438) | ||||||||||||||
| Cash and due from banks | 684 | 913 | 938 | ||||||||||||||
| Premises and equipment | 647 | 681 | 737 | ||||||||||||||
| Goodwill | 2,694 | 2,693 | 2,673 | ||||||||||||||
| Other intangible assets | 118 | 130 | 173 | ||||||||||||||
| Corporate-owned life insurance | 4,340 | 4,327 | 4,296 | ||||||||||||||
| Accrued income and other assets | 9,544 | 8,265 | 7,347 | ||||||||||||||
| Discontinued assets | 526 | 562 | 667 | ||||||||||||||
| Total assets | $ | 181,221 | $ | 186,346 | $ | 176,203 | |||||||||||
| Liabilities | |||||||||||||||||
| Deposits in domestic offices: | |||||||||||||||||
| NOW and money market deposit accounts | $ | 86,829 | $ | 89,207 | $ | 82,777 | |||||||||||
| Savings deposits | 7,840 | 7,503 | 6,655 | ||||||||||||||
| Certificates of deposit ($100,000 or more) | 1,533 | 1,705 | 2,437 | ||||||||||||||
| Other time deposits | 2,037 | 2,153 | 2,782 | ||||||||||||||
| Total interest-bearing deposits | 98,239 | 100,568 | 94,651 | ||||||||||||||
| Noninterest-bearing deposits | 50,424 | 52,004 | 47,532 | ||||||||||||||
| Total deposits | 148,663 | 152,572 | 142,183 | ||||||||||||||
| Federal funds purchased and securities sold under repurchase agreements | 599 | 173 | 281 | ||||||||||||||
| Bank notes and other short-term borrowings | 2,222 | 588 | 744 | ||||||||||||||
| Accrued expense and other liabilities | 3,615 | 3,548 | 2,862 | ||||||||||||||
| Long-term debt | 10,814 | 12,042 | 12,499 | ||||||||||||||
| Total liabilities | 165,913 | 168,923 | 158,569 | ||||||||||||||
| Equity | |||||||||||||||||
| Preferred stock | 1,900 | 1,900 | 1,900 | ||||||||||||||
| Common shares | 1,257 | 1,257 | 1,257 | ||||||||||||||
| Capital surplus | 6,214 | 6,278 | 6,213 | ||||||||||||||
| Retained earnings | 14,793 | 14,553 | 13,166 | ||||||||||||||
| Treasury stock, at cost | (5,927) | (5,979) | (5,005) | ||||||||||||||
| Accumulated other comprehensive income (loss) | (2,929) | (586) | 103 | ||||||||||||||
| Key shareholders’ equity | 15,308 | 17,423 | 17,634 | ||||||||||||||
| Noncontrolling interests | — | — | — | ||||||||||||||
| Total equity | 15,308 | 17,423 | 17,634 | ||||||||||||||
| Total liabilities and equity | $ | 181,221 | $ | 186,346 | $ | 176,203 | |||||||||||
| Common shares outstanding (000) | 932,398 | 928,850 | 972,587 | ||||||||||||||
| Consolidated Statements of Income | ||||||||||||||||||||||||||
| (dollars in millions, except per share amounts) | ||||||||||||||||||||||||||
| Three months ended | Three months ended | |||||||||||||||||||||||||
| 3/31/2022 | 12/31/2021 | 3/31/2021 | 3/31/2022 | 3/31/2021 | ||||||||||||||||||||||
| Interest income | ||||||||||||||||||||||||||
| Loans | $ | 837 | $ | 873 | $ | 889 | $ | 837 | $ | 889 | ||||||||||||||||
| Loans held for sale | 12 | 15 | 11 | 12 | 11 | |||||||||||||||||||||
| Securities available for sale | 173 | 148 | 130 | 173 | 130 | |||||||||||||||||||||
| Held-to-maturity securities | 46 | 52 | 45 | 46 | 45 | |||||||||||||||||||||
| Trading account assets | 6 | 5 | 5 | 6 | 5 | |||||||||||||||||||||
| Short-term investments | 4 | 8 | 5 | 4 | 5 | |||||||||||||||||||||
| Other investments | 2 | 2 | 2 | 2 | 2 | |||||||||||||||||||||
| Total interest income | 1,080 | 1,103 | 1,087 | 1,080 | 1,087 | |||||||||||||||||||||
| Interest expense | ||||||||||||||||||||||||||
| Deposits | 14 | 15 | 21 | 14 | 21 | |||||||||||||||||||||
| Federal funds purchased and securities sold under repurchase agreements | — | — | — | — | — | |||||||||||||||||||||
| Bank notes and other short-term borrowings | 3 | 2 | 1 | 3 | 1 | |||||||||||||||||||||
| Long-term debt | 49 | 53 | 60 | 49 | 60 | |||||||||||||||||||||
| Total interest expense | 66 | 70 | 82 | 66 | 82 | |||||||||||||||||||||
| Net interest income | 1,014 | 1,033 | 1,005 | 1,014 | 1,005 | |||||||||||||||||||||
| Provision for credit losses | 83 | 4 | (93) | 83 | (93) | |||||||||||||||||||||
| Net interest income after provision for credit losses | 931 | 1,029 | 1,098 | 931 | 1,098 | |||||||||||||||||||||
| Noninterest income | ||||||||||||||||||||||||||
| Trust and investment services income | 136 | 135 | 133 | 136 | 133 | |||||||||||||||||||||
| Investment banking and debt placement fees | 163 | 323 | 162 | 163 | 162 | |||||||||||||||||||||
| Service charges on deposit accounts | 91 | 90 | 73 | 91 | 73 | |||||||||||||||||||||
| Operating lease income and other leasing gains | 32 | 37 | 38 | 32 | 38 | |||||||||||||||||||||
| Corporate services income | 90 | 73 | 64 | 90 | 64 | |||||||||||||||||||||
| Cards and payments income | 80 | 86 | 105 | 80 | 105 | |||||||||||||||||||||
| Corporate-owned life insurance income | 31 | 34 | 31 | 31 | 31 | |||||||||||||||||||||
| Consumer mortgage income | 21 | 25 | 47 | 21 | 47 | |||||||||||||||||||||
| Commercial mortgage servicing fees | 36 | 48 | 34 | 36 | 34 | |||||||||||||||||||||
| Other income | (4) | 58 | 51 | (4) | 51 | |||||||||||||||||||||
| Total noninterest income | 676 | 909 | 738 | 676 | 738 | |||||||||||||||||||||
| Noninterest expense | ||||||||||||||||||||||||||
| Personnel | 630 | 674 | 624 | 630 | 624 | |||||||||||||||||||||
| Net occupancy | 73 | 75 | 76 | 73 | 76 | |||||||||||||||||||||
| Computer processing | 77 | 73 | 73 | 77 | 73 | |||||||||||||||||||||
| Business services and professional fees | 53 | 70 | 50 | 53 | 50 | |||||||||||||||||||||
| Equipment | 23 | 25 | 25 | 23 | 25 | |||||||||||||||||||||
| Operating lease expense | 28 | 31 | 34 | 28 | 34 | |||||||||||||||||||||
| Marketing | 28 | 37 | 26 | 28 | 26 | |||||||||||||||||||||
| Intangible asset amortization | — | — | — | — | — | |||||||||||||||||||||
| Other expense | 158 | 185 | 163 | 158 | 163 | |||||||||||||||||||||
| Total noninterest expense | 1,070 | 1,170 | 1,071 | 1,070 | 1,071 | |||||||||||||||||||||
| Income (loss) from continuing operations before income taxes | 537 | 768 | 765 | 537 | 765 | |||||||||||||||||||||
| Income taxes | 90 | 141 | 147 | 90 | 147 | |||||||||||||||||||||
| Income (loss) from continuing operations | 447 | 627 | 618 | 447 | 618 | |||||||||||||||||||||
| Income (loss) from discontinued operations, net of taxes | 1 | 2 | 4 | 1 | 4 | |||||||||||||||||||||
| Net income (loss) | 448 | 629 | 622 | 448 | 622 | |||||||||||||||||||||
| Less: Net income (loss) attributable to noncontrolling interests | — | — | — | — | — | |||||||||||||||||||||
| Net income (loss) attributable to Key | $ | 448 | $ | 629 | $ | 622 | $ | 448 | $ | 622 | ||||||||||||||||
| Income (loss) from continuing operations attributable to Key common shareholders | $ | 420 | $ | 601 | $ | 591 | $ | 420 | $ | 591 | ||||||||||||||||
| Net income (loss) attributable to Key common shareholders | 421 | 603 | 595 | 421 | 595 | |||||||||||||||||||||
| Per common share | ||||||||||||||||||||||||||
| Income (loss) from continuing operations attributable to Key common shareholders | $ | .45 | $ | .65 | $ | .61 | $ | .45 | $ | .61 | ||||||||||||||||
| Income (loss) from discontinued operations, net of taxes | — | — | — | — | — | |||||||||||||||||||||
Net income (loss) attributable to Key common shareholders (a) | .46 | .65 | .62 | .46 | .62 | |||||||||||||||||||||
| Per common share — assuming dilution | ||||||||||||||||||||||||||
| Income (loss) from continuing operations attributable to Key common shareholders | $ | .45 | $ | .64 | $ | .61 | $ | .45 | $ | .61 | ||||||||||||||||
| Income (loss) from discontinued operations, net of taxes | — | — | — | — | — | |||||||||||||||||||||
Net income (loss) attributable to Key common shareholders (a) | .45 | .64 | $ | .61 | .45 | .61 | ||||||||||||||||||||
| Cash dividends declared per common share | $ | .195 | $ | .195 | $ | .185 | $ | .195 | $ | .185 | ||||||||||||||||
| Weighted-average common shares outstanding (000) | 922,941 | 922,970 | 964,878 | 922,941 | 964,878 | |||||||||||||||||||||
| Effect of common share options and other stock awards | 10,692 | 11,758 | 9,419 | 10,692 | 9,419 | |||||||||||||||||||||
Weighted-average common shares and potential common shares outstanding (000) (b) | 933,634 | 934,729 | 974,297 | 933,634 | 974,297 | |||||||||||||||||||||
(a)Earnings per share may not foot due to rounding.
(b)Assumes conversion of common share options and other stock awards and/or convertible preferred stock, as applicable.