
Keycorp /New/ 8-K, filed Apr 16, 2026
Keycorp /New/ (KEY)
8-K
2026-04-16
For: 2026-04-16
View Original
Added on
April 16, 2026
About this 8-K
Keycorp /New/ filed this 8-K on April 16, 2026.
Items reported
- Item 2.02: Financial results
- Item 9.01: Financial statements and exhibits
UNITED STATES SECURITIES AND EXCHANGE COMMISSION
Washington, D.C. 20549
FORM 8-K
CURRENT REPORT
Pursuant to Section 13 or 15(d) of the Securities Exchange Act of 1934 | ||
Date of Report (Date of earliest event reported): April 16, 2026

(Exact name of registrant as specified in its charter)
| State or other jurisdiction of incorporation or organization: | Commission File Number | I.R.S. Employer Identification Number: | ||||||||||||
| Address of principal executive offices: | Zip Code: | |||||||||||||
(216 ) 689-3000
Registrant’s telephone number, including area code:
| Check the appropriate box below if the Form 8-K filing is intended to simultaneously satisfy the filing obligation of the registrant under any of the following provisions (see General Instruction A.2. below): | |||||
| Written communications pursuant to Rule 425 under the Securities Act (17 CFR 230.425) | |||||
| Soliciting material pursuant to Rule 14a-12 under the Exchange Act (17 CFR 240.14a-12) | |||||
| Pre-commencement communications pursuant to Rule 14d-2(b) under the Exchange Act (17 CFR 240.14d-2(b)) | |||||
| Pre-commencement communications pursuant to Rule 13e-4(c) under the Exchange Act (17 CFR 240.13e-4(c)) | |||||
Securities Registered Pursuant to Section 12(b) of the Act:
| Title of each class | Trading Symbol(s) | Name of each exchange on which registered | ||||||
Indicate by check mark whether the registrant is an emerging growth company as defined in Rule 405 of the Securities Act of 1933 (§230.405 of this chapter) or Rule 12b-2 of the Securities Exchange Act of 1934 (§240.12b-2 of this chapter).
Emerging growth company ☐
If an emerging growth company, indicate by check mark if the registrant has elected not to use the extended transition period for complying with any new or revised financial accounting standards provided pursuant to Section 13(a) of the Exchange Act. ☐
Item 2.02 Results of Operations and Financial Condition.
On April 16, 2026, KeyCorp issued a press release announcing its financial results for the three-month periods ended March 31, 2026 (the “Press Release”), and posted on its website its first quarter 2026 Supplemental Information Package (the “Supplemental Information Package”). The Press Release and Supplemental Information Package are being furnished as Exhibit 99.1 and Exhibit 99.2, respectively.
The information in the preceding paragraph, as well as Exhibit 99.1 and Exhibit 99.2 referenced therein, shall not be deemed “filed” for purposes of the Securities Exchange Act of 1934, as amended (the “Exchange Act”), nor shall it be incorporated by reference in any filing under the Securities Act of 1933, as amended (the “Securities Act”).
KeyCorp’s Consolidated Balance Sheets and Consolidated Statements of Income (collectively, the “Financial Statements”), included as part of the Press Release, are filed as Exhibit 99.3 to this report. Exhibit 99.3 is deemed “filed” for purposes of Section 18 of the Exchange Act and, therefore, may be incorporated by reference in filings under the Securities Act.
Item 9.01 Financial Statements and Exhibits.
(d) Exhibits
The following exhibits are furnished, or filed in the case of Exhibit 99.3, herewith:
104 Cover Page Interactive Data File (embedded within the Inline XBRL document).
| SIGNATURE | ||||||||
| Pursuant to the requirements of the Securities Exchange Act of 1934, the registrant has duly caused this report to be signed on its behalf by the undersigned hereunto duly authorized. | ||||||||
| KEYCORP | ||||||||
| (Registrant) | ||||||||
| Date: April 16, 2026 | /s/ Stacy L. Gilbert | |||||||
| By: Stacy L. Gilbert | ||||||||
| Chief Accounting Officer | ||||||||

KEYCORP REPORTS FIRST QUARTER 2026 NET INCOME OF $486 MILLION,
OR $0.44 PER DILUTED COMMON SHARE INCREASING 33% YEAR-OVER-YEAR
Revenue of $1.95 billion, up 10% year-over-year, with noninterest income up 8%
Net interest income up 11% year-over-year and 1% quarter-over-quarter despite seasonality impact; net interest margin of 2.87% increased 5 bps sequentially
Period-end loans up $2.6 billion quarter-over-quarter, with commercial loans up $3.3 billion or 4%
Credit quality remains strong - nonperforming assets were 63 bps and net charge-offs were 38 bps
Common Equity Tier 1 ratio of 11.4%(a); repurchased $389 million of common shares during the quarter
CLEVELAND, April 16, 2026 - KeyCorp (NYSE: KEY) announced net income from continuing operations attributable to Key common shareholders of $486 million, or $0.44 per diluted common share, for the first quarter of 2026. For the fourth quarter of 2025, net income from continuing operations attributable to Key common shareholders was $474 million, or $0.43 per diluted common share, or adjusted net income of $458 million, or $0.41 per diluted common share.(b) The fourth quarter of 2025 included a $16 million after-tax benefit related to the updated FDIC special assessment.(c) For the first quarter of 2025, KeyCorp reported net income from continuing operations attributable to Key common shareholders of $370 million, or $0.33 per diluted common share.
Comments from Chairman and CEO, Chris Gorman
"Our strong first quarter performance demonstrates disciplined execution and significant momentum as we continue to deliver on our commitments. Revenue grew 10% year-over-year, growing at more than double the rate of expenses. We grew net interest income and net interest margin sequentially and year-over-year. Our priority fee-based businesses - investment banking, commercial payments, and wealth management - collectively grew 12% year-over-year. Return on tangible common equity exceeded 13%, reflecting significant progress toward achieving our goal of 15%+ return on tangible common equity by year-end 2027.
In addition to driving a greater return on capital, we remain committed to the return of capital. We repurchased almost $400 million of common shares in the first quarter. We are also encouraged by the recently updated Basel III proposal which, if implemented as currently proposed, would imply more than 100 basis point benefit to our marked CET1 ratio.
We are successfully navigating the dynamic macroeconomic environment and are prepared to manage through a broad range of potential scenarios. We are growing clients, loans, and pipelines. We continue to gain momentum in the marketplace, and are investing across the franchise in frontline bankers and technology that will drive additional organic growth and efficiency. We remain well positioned to drive strong revenue and earnings growth in 2026 through the continued delivery of our differentiated capabilities and exceptional service to our clients."
(a) March 31, 2026 ratio is estimated.
(b) The table entitled “GAAP to Non-GAAP Reconciliations” in the attached financial supplement presents the computations of certain financial measures. The table reconciles the GAAP performance measures to the corresponding non-GAAP measures, which provides a basis for period-to-period comparisons.
(c) See table on page 22 for more information on Selected Items Impact on Earnings.
KeyCorp Reports First Quarter 2026 Results
April 16, 2026
Page 2
| Selected Financial Highlights | |||||||||||||||||||||||
| Dollars in millions, except per share data | Change 1Q26 vs. | ||||||||||||||||||||||
| 1Q26 | 4Q25 | 1Q25 | 4Q25 | 1Q25 | |||||||||||||||||||
| Income (loss) from continuing operations attributable to Key common shareholders | $ | 486 | $ | 474 | $ | 370 | 2.5 | % | 31.4% | ||||||||||||||
Income (loss) from continuing operations attributable to Key common shareholders per common share — assuming dilution | 0.44 | 0.43 | 0.33 | 2.3 | 33.3 | ||||||||||||||||||
| Book value at period end | 16.13 | 16.27 | 14.89 | (0.9) | 8.3 | ||||||||||||||||||
Return on average tangible common equity from continuing operations (a) | 13.02 | % | 12.43 | % | 11.24 | % | 59 bps | 178 bps | |||||||||||||||
| Return on average total assets from continuing operations | 1.14 | 1.08 | .88 | 6 | 26 | ||||||||||||||||||
Common Equity Tier 1 ratio (b) | 11.4 | 11.8 | 11.6 | (40) | (20) | ||||||||||||||||||
| Net interest margin (TE) from continuing operations | 2.87 | 2.82 | 2.58 | 5 | 29 | ||||||||||||||||||
(a)The table entitled “GAAP to Non-GAAP Reconciliations” in the attached financial supplement presents the computations of certain financial measures related to “tangible common equity.” The table reconciles the GAAP performance measures to the corresponding non-GAAP measures, which provides a basis for period-to-period comparisons.
(b)March 31, 2026 ratio is estimated.
TE = Taxable Equivalent
| INCOME STATEMENT HIGHLIGHTS | ||||||||||||||||||||
| Revenue | ||||||||||||||||||||
| Dollars in millions | Change 1Q26 vs. | |||||||||||||||||||
| 1Q26 | 4Q25 | 1Q25 | 4Q25 | 1Q25 | ||||||||||||||||
| Net interest income (TE) | $ | 1,230 | $ | 1,223 | $ | 1,105 | 0.6 | % | 11.3 | % | ||||||||||
| Noninterest income | 723 | 782 | 668 | (7.5) | 8.2 | |||||||||||||||
| Total revenue (TE) | $ | 1,953 | $ | 2,005 | $ | 1,773 | (2.6) | % | 10.2 | % | ||||||||||
TE = Taxable Equivalent
Taxable-equivalent net interest income was $1.23 billion for the first quarter of 2026 and the net interest margin was 2.87%. Compared to the first quarter of 2025, net interest income increased by $125 million, and the net interest margin increased by 29 basis points. These increases were driven by a reduction in deposit costs as a result of declining interest rates and proactive deposit beta management, the reinvestment of proceeds from maturing low-yielding investment securities and fixed-rate swaps into higher-yielding investments, and a shift in the balance sheet composition to a more favorable mix of higher-yielding commercial and industrial loans. These benefits were partially offset by the impact of lower interest rates on variable-rate earning assets.
Compared to the fourth quarter of 2025, taxable-equivalent net interest income increased by $7 million, and the net interest margin increased by 5 basis points. These increases reflect lower deposit costs and a shift in the balance sheet composition to a more favorable mix of higher-yielding commercial and industrial loans. These benefits were partially offset by the impact of lower interest rates on variable-rate earning assets, a decline in low-cost deposit balances from seasonal outflows, and two fewer days in the first quarter of 2026 compared to the fourth quarter of 2025.
KeyCorp Reports First Quarter 2026 Results
April 16, 2026
Page 3
| Noninterest Income | ||||||||||||||||||||
| Dollars in millions | Change 1Q26 vs. | |||||||||||||||||||
| 1Q26 | 4Q25 | 1Q25 | 4Q25 | 1Q25 | ||||||||||||||||
| Trust and investment services income | $ | 157 | $ | 156 | $ | 139 | 0.6 | % | 12.9 | % | ||||||||||
| Investment banking and debt placement fees | 197 | 243 | 175 | (18.9) | 12.6 | |||||||||||||||
| Cards and payments income | 86 | 84 | 82 | 2.4 | 4.9 | |||||||||||||||
| Service charges on deposit accounts | 77 | 78 | 69 | (1.3) | 11.6 | |||||||||||||||
| Corporate services income | 71 | 81 | 65 | (12.3) | 9.2 | |||||||||||||||
| Commercial mortgage servicing fees | 62 | 68 | 76 | (8.8) | (18.4) | |||||||||||||||
| Corporate-owned life insurance income | 34 | 40 | 33 | (15.0) | 3.0 | |||||||||||||||
| Consumer mortgage income | 13 | 16 | 13 | (18.8) | — | |||||||||||||||
| Operating lease income and other leasing gains | 8 | 9 | 9 | (11.1) | (11.1) | |||||||||||||||
| Other income | 18 | 7 | 7 | 157.1 | 157.1 | |||||||||||||||
| Total noninterest income | $ | 723 | $ | 782 | $ | 668 | (7.5) | % | 8.2% | |||||||||||
Compared to the first quarter of 2025, noninterest income increased by $55 million. The increase was primarily driven by a $22 million increase in investment banking and debt placement fees reflecting higher merger and acquisition advisory fees, commercial mortgage debt placement activity, and equity underwriting activity, as well as an $18 million increase in trust and investment services income. These were partially offset by a $14 million decrease in commercial mortgage servicing fees.
Compared to the fourth quarter of 2025, noninterest income decreased by $59 million. The decrease was driven by a $46 million decrease in investment banking and debt placement fees, a $10 million decrease in corporate services income, and a $6 million decrease in commercial mortgage servicing fees.
| Noninterest Expense | ||||||||||||||||||||
| Dollars in millions | Change 1Q26 vs. | |||||||||||||||||||
| 1Q26 | 4Q25 | 1Q25 | 4Q25 | 1Q25 | ||||||||||||||||
| Personnel expense | $ | 743 | $ | 790 | $ | 680 | (5.9) | % | 9.3 | % | ||||||||||
| Net occupancy | 68 | 69 | 67 | (1.4) | 1.5 | |||||||||||||||
| Computer processing | 111 | 106 | 107 | 4.7 | 3.7 | |||||||||||||||
| Business services and professional fees | 36 | 61 | 40 | (41.0) | (10.0) | |||||||||||||||
| Equipment | 19 | 22 | 20 | (13.6) | (5.0) | |||||||||||||||
| Operating lease expense | 7 | 8 | 11 | (12.5) | (36.4) | |||||||||||||||
| Marketing | 18 | 28 | 21 | (35.7) | (14.3) | |||||||||||||||
| Other expense | 179 | 157 | 185 | 14.0 | (3.2) | |||||||||||||||
| Total noninterest expense | $ | 1,181 | $ | 1,241 | $ | 1,131 | (4.8) | % | 4.4 | % | ||||||||||
Compared to the first quarter of 2025, noninterest expense increased by $50 million. The increase was predominantly driven by a $63 million increase in personnel expense primarily related to continued investments in people, employee benefits, and incentive compensation associated with noninterest income growth.
Compared to the fourth quarter of 2025, noninterest expense decreased by $60 million. The decrease was predominantly driven by a $47 million decline in personnel expense, primarily related to incentive compensation. Business services and professional fees decreased by $25 million and marketing expense decreased by $10 million largely due to seasonality. These were partially offset by an increase in other expense related to a $21 million benefit associated with the updated FDIC special assessment in the prior quarter.
KeyCorp Reports First Quarter 2026 Results
April 16, 2026
Page 4
| BALANCE SHEET HIGHLIGHTS | ||||||||||||||||||||
| Average Loans | ||||||||||||||||||||
| Dollars in millions | Change 1Q26 vs. | |||||||||||||||||||
| 1Q26 | 4Q25 | 1Q25 | 4Q25 | 1Q25 | ||||||||||||||||
Commercial and industrial (a) | $ | 59,149 | $ | 57,541 | $ | 53,746 | 2.8 | % | 10.1 | % | ||||||||||
| Other commercial loans | 18,918 | 18,497 | 18,619 | 2.3 | 1.6 | |||||||||||||||
| Total consumer loans | 29,670 | 30,278 | 31,989 | (2.0) | (7.2) | |||||||||||||||
| Total loans | $ | 107,737 | $ | 106,316 | $ | 104,354 | 1.3 | % | 3.2 | % | ||||||||||
(a)Commercial and industrial average loan balances include $205 million, $211 million, and $213 million of assets from commercial credit cards at March 31, 2026, December 31, 2025, and March 31, 2025, respectively.
Average loans were $107.7 billion for the first quarter of 2026, an increase of $3.4 billion compared to the first quarter of 2025. Average commercial loans increased by $5.7 billion, primarily driven by a $5.4 billion increase in commercial and industrial loans. Average consumer loans declined by $2.3 billion, reflective of broad-based declines across all consumer loan categories.
Compared to the fourth quarter of 2025, average loans increased by $1.4 billion. Average commercial loans increased $2.0 billion, primarily driven by an increase in commercial and industrial loans. Average consumer loans declined by $608 million, reflective of the intentional run-off of low-yielding loans.
| Average Deposits | ||||||||||||||||||||
| Dollars in millions | Change 1Q26 vs. | |||||||||||||||||||
| 1Q26 | 4Q25 | 1Q25 | 4Q25 | 1Q25 | ||||||||||||||||
| Non-time deposits | $ | 135,522 | $ | 136,853 | $ | 131,917 | (1.0) | % | 2.7 | % | ||||||||||
| Time deposits | 11,777 | 13,857 | 16,625 | (15.0) | (29.2) | |||||||||||||||
| Total deposits | $ | 147,299 | $ | 150,710 | $ | 148,542 | (2.3) | % | (0.8) | % | ||||||||||
| Cost of total deposits | 1.65 | % | 1.81 | % | 2.06 | % | (16) bps | (41) bps | ||||||||||||
Average deposits totaled $147.3 billion for the first quarter of 2026, a decrease of $1.2 billion compared to the year-ago quarter, driven by the intentional runoff of brokered CDs.
Compared to the fourth quarter of 2025, average deposits decreased by $3.4 billion. The decline was driven by seasonally lower deposit balances, as well as the intentional runoff of brokered CDs. The rate paid on interest-bearing deposits declined by 22 basis points, and the overall cost of deposits declined by 16 basis points to 1.65%.
KeyCorp Reports First Quarter 2026 Results
April 16, 2026
Page 5
| ASSET QUALITY | ||||||||||||||||||||
| Dollars in millions | Change 1Q26 vs. | |||||||||||||||||||
| 1Q26 | 4Q25 | 1Q25 | 4Q25 | 1Q25 | ||||||||||||||||
| Net loan charge-offs | $ | 101 | $ | 104 | $ | 110 | (2.9) | % | (8.2) | % | ||||||||||
| Net loan charge-offs to average total loans | .38 | % | .39 | % | .43 | % | (1) bps | (5) bps | ||||||||||||
| Nonperforming loans at period end | $ | 682 | $ | 615 | $ | 686 | 10.9 | % | (0.6) | % | ||||||||||
| Nonperforming loans to period-end portfolio loans | .62 | % | .58 | % | .65 | % | 4 bps | (3) bps | ||||||||||||
| Nonperforming assets at period end | $ | 692 | $ | 627 | $ | 700 | 10.4 | % | (1.1) | % | ||||||||||
| Nonperforming assets to period-end portfolio loans plus OREO and other nonperforming assets | .63 | % | .59 | % | .67 | % | 4 bps | (4) bps | ||||||||||||
| Allowance for loan and lease losses | $ | 1,449 | $ | 1,427 | $ | 1,429 | 1.5 | % | 1.4 | % | ||||||||||
| Allowance for credit losses | 1,745 | 1,740 | 1,707 | 0.3 | % | 2.2 | % | |||||||||||||
| Allowance for credit losses to period-end loans | 1.60 | % | 1.63 | % | 1.63 | % | (3) bps | (3) bps | ||||||||||||
| Provision for credit losses | $ | 106 | $ | 108 | $ | 118 | (1.9) | % | (10.2) | % | ||||||||||
| Allowance for loan and lease losses to nonperforming loans | 212 | % | 232 | % | 208 | % | N/M | N/M | ||||||||||||
| Allowance for credit losses to nonperforming loans | 256 | 283 | 249 | N/M | N/M | |||||||||||||||
N/M = Not Meaningful
Net loan charge-offs for the first quarter of 2026 totaled $101 million, or 0.38% of average total loans. These results compare to $110 million, or 0.43%, for the first quarter of 2025 and $104 million, or 0.39%, for the fourth quarter of 2025.
Key’s allowance for credit losses was $1.7 billion, or 1.60% of total period-end loans at March 31, 2026, compared to 1.63% at March 31, 2025, and 1.63% at December 31, 2025. A reserve build of $5 million during the first quarter of 2026 was driven by increases in qualitative reserves due to elevated economic uncertainty, partially offset by continued improvement in the portfolio mix.
At March 31, 2026, Key’s nonperforming loans totaled $682 million, which represented 0.62% of period-end portfolio loans. These results compare to 0.65% at March 31, 2025, and 0.58% at December 31, 2025. Nonperforming assets at March 31, 2026, totaled $692 million, and represented 0.63% of period-end portfolio loans and OREO and other nonperforming assets. These results compare to 0.67% at March 31, 2025, and 0.59% at December 31, 2025.
CAPITAL
Key’s estimated risk-based capital ratios, included in the following table, continued to exceed all “well-capitalized” regulatory benchmarks at March 31, 2026.
| Capital Ratios | |||||||||||
| 3/31/2026 | 12/31/2025 | 3/31/2025 | |||||||||
Common Equity Tier 1 (a) | 11.4 | % | 11.8 | % | 11.6 | % | |||||
Tier 1 risk-based capital (a) | 13.0 | 13.5 | 13.3 | ||||||||
Total risk-based capital (a) | 15.2 | 15.7 | 15.7 | ||||||||
Tangible common equity to tangible assets (b) | 8.0 | 8.4 | 7.4 | ||||||||
Leverage (a) | 10.5 | 10.5 | 10.2 | ||||||||
(a)March 31, 2026 ratio is estimated.
(b)The table entitled “GAAP to Non-GAAP Reconciliations” in the attached financial supplement presents the computations of certain financial measures related to “tangible common equity.” The table reconciles the GAAP performance measures to the corresponding non-GAAP measures, which provides a basis for period-to-period comparisons.
Key's regulatory capital position remained strong in the first quarter of 2026. As shown in the preceding table, at March 31, 2026, Key’s estimated Common Equity Tier 1 and Tier 1 risk-based capital ratios stood at 11.4% and 13.0%, respectively.
KeyCorp Reports First Quarter 2026 Results
April 16, 2026
Page 6
| Summary of Changes in Common Shares Outstanding | |||||||||||||||||||||||
| In thousands | Change 1Q26 vs. | ||||||||||||||||||||||
| 1Q26 | 4Q25 | 1Q25 | 4Q25 | 1Q25 | |||||||||||||||||||
| Shares outstanding at beginning of period | 1,102,401 | 1,112,952 | 1,106,786 | (0.9) | % | (0.4) | % | ||||||||||||||||
| Share repurchases | (17,969) | (11,109) | — | 61.8 | N/M | ||||||||||||||||||
| Shares issued under employee compensation plans (net of cancellations and returns) | 2,861 | 558 | 5,200 | N/M | (45.0) | ||||||||||||||||||
| Shares outstanding at end of period | 1,087,293 | 1,102,401 | 1,111,986 | (1.4) | % | (2.2) | % | ||||||||||||||||
N/M = Not Meaningful
During the first quarter of 2026, Key declared a dividend of $.205 per common share. The reduction in share count was driven by $389 million of common shares repurchased.
LINE OF BUSINESS RESULTS
The following table shows the contribution made by each major business segment to Key’s taxable-equivalent revenue from continuing operations and income (loss) from continuing operations attributable to Key for the periods presented. For more detailed financial information pertaining to each business segment, see the tables at the end of this release.
| Major Business Segments | |||||||||||||||||||||||
| Dollars in millions | Change 1Q26 vs. | ||||||||||||||||||||||
| 1Q26 | 4Q25 | 1Q25 | 4Q25 | 1Q25 | |||||||||||||||||||
| Revenue from continuing operations (TE) | |||||||||||||||||||||||
| Consumer Bank | $ | 978 | $ | 998 | $ | 932 | (2.0) | % | 4.9 | % | |||||||||||||
| Commercial Bank | 1,117 | 1,194 | 1,047 | (6.4) | 6.7 | ||||||||||||||||||
Other (a) | (142) | (187) | (206) | 24.1 | 31.1 | ||||||||||||||||||
| Total | $ | 1,953 | $ | 2,005 | $ | 1,773 | (2.6) | % | 10.2 | % | |||||||||||||
| Income (loss) from continuing operations attributable to Key | |||||||||||||||||||||||
| Consumer Bank | $ | 173 | $ | 176 | $ | 163 | (1.7) | % | 6.1 | % | |||||||||||||
| Commercial Bank | 451 | 472 | 399 | (4.4) | 13.0 | ||||||||||||||||||
Other (a) | (102) | (139) | (156) | 26.6 | 34.6 | ||||||||||||||||||
| Total | $ | 522 | $ | 509 | $ | 406 | 2.6 | % | 28.6 | % | |||||||||||||
(a)Other includes other segments that consists of corporate treasury, our principal investing unit, and various exit portfolios as well as reconciling items which primarily represent the unallocated portion of nonearning assets of corporate support functions. Other also includes the residual net impact of our internal funds transfer pricing methodology, which arise from centrally managed interest rate activities and asset-liability repricing difference. Corporate treasury includes realized gains and losses from transactions associated with Key's investment securities portfolio. Reconciling items also includes intercompany eliminations and certain items that are not allocated to the business segments because they do not reflect their normal operations.
TE = Taxable Equivalent
KeyCorp Reports First Quarter 2026 Results
April 16, 2026
Page 7
| Consumer Bank | ||||||||||||||||||||
| Dollars in millions | Change 1Q26 vs. | |||||||||||||||||||
| 1Q26 | 4Q25 | 1Q25 | 4Q25 | 1Q25 | ||||||||||||||||
| Summary of operations | ||||||||||||||||||||
| Net interest income (TE) | $ | 738 | $ | 747 | $ | 706 | (1.2) | % | 4.5 | % | ||||||||||
| Noninterest income | 240 | 251 | 226 | (4.4) | 6.2 | |||||||||||||||
| Total revenue (TE) | 978 | 998 | 932 | (2.0) | 4.9 | |||||||||||||||
| Provision for credit losses | 40 | 32 | 43 | 25.0 | (7.0) | |||||||||||||||
| Noninterest expense | 709 | 734 | 675 | (3.4) | 5.0 | |||||||||||||||
| Income (loss) before income taxes (TE) | 229 | 232 | 214 | (1.3) | 7.0 | |||||||||||||||
| Allocated income taxes (benefit) and TE adjustments | 56 | 56 | 51 | — | 9.8 | |||||||||||||||
| Net income (loss) attributable to Key | $ | 173 | $ | 176 | $ | 163 | (1.7) | % | 6.1 | % | ||||||||||
| Average balances | ||||||||||||||||||||
| Loans and leases | $ | 34,005 | $ | 34,683 | $ | 36,819 | (2.0) | % | (7.6) | % | ||||||||||
| Total assets | 37,341 | 37,731 | 39,806 | (1.0) | (6.2) | |||||||||||||||
| Deposits | 87,796 | 87,738 | 88,306 | 0.1 | (0.6) | |||||||||||||||
| Assets under management at period end | $ | 69,756 | $ | 69,964 | $ | 61,053 | (0.3) | % | 14.3 | % | ||||||||||
TE = Taxable Equivalent
| Additional Consumer Bank Data | ||||||||||||||||||||
| Dollars in millions | Change 1Q26 vs. | |||||||||||||||||||
| 1Q26 | 4Q25 | 1Q25 | 4Q25 | 1Q25 | ||||||||||||||||
| Noninterest income | ||||||||||||||||||||
| Trust and investment services income | $ | 130 | $ | 128 | $ | 113 | 1.6 | % | 15.0 | % | ||||||||||
| Service charges on deposit accounts | 34 | 38 | 33 | (10.5) | 3.0 | |||||||||||||||
| Cards and payments income | 55 | 60 | 57 | (8.3) | (3.5) | |||||||||||||||
| Consumer mortgage income | 13 | 16 | 13 | (18.8) | — | |||||||||||||||
| Other noninterest income | 8 | 9 | 10 | (11.1) | (20.0) | |||||||||||||||
| Total noninterest income | $ | 240 | $ | 251 | $ | 226 | (4.4) | % | 6.2 | % | ||||||||||
| Average deposit balances | ||||||||||||||||||||
| Money market deposits | $ | 35,920 | $ | 35,390 | $ | 33,533 | 1.5 | % | 7.1 | % | ||||||||||
| Demand deposits | 23,214 | 22,879 | 22,772 | 1.5 | 1.9 | |||||||||||||||
| Savings deposits | 4,199 | 4,177 | 4,392 | 0.5 | (4.4) | |||||||||||||||
| Time deposits | 10,610 | 11,059 | 13,318 | (4.1) | (20.3) | |||||||||||||||
| Noninterest-bearing deposits | 13,853 | 14,233 | 14,291 | (2.7) | (3.1) | |||||||||||||||
| Total deposits | $ | 87,796 | $ | 87,738 | $ | 88,306 | 0.1 | % | (0.6) | % | ||||||||||
| Other data | ||||||||||||||||||||
| Branches | 940 | 940 | 945 | |||||||||||||||||
| Automated teller machines | 1,112 | 1,120 | 1,176 | |||||||||||||||||
Consumer Bank Summary of Operations (1Q26 vs. 1Q25)
•Key's Consumer Bank recorded net income attributable to Key of $173 million for the first quarter of 2026, compared to $163 million for the year-ago quarter
•Taxable-equivalent net interest income increased by $32 million, or 4.5%, compared to the first quarter of 2025
•Average loans and leases decreased $2.8 billion, or 7.6%, from the first quarter of 2025, reflective of broad-based declines across all loan categories
•Average deposits decreased $510 million, or 0.6%, from the first quarter of 2025, driven by lower time deposits, partially offset by an increase in money market deposits
•Provision for credit losses decreased $3 million compared to the first quarter of 2025 driven by lower charge-offs
•Noninterest income increased $14 million from the year-ago quarter, primarily driven by higher trust and investment services income
•Noninterest expense increased $34 million from the year-ago quarter, primarily driven by higher support and overhead expense
KeyCorp Reports First Quarter 2026 Results
April 16, 2026
Page 8
| Commercial Bank | ||||||||||||||||||||
| Dollars in millions | Change 1Q26 vs. | |||||||||||||||||||
| 1Q26 | 4Q25 | 1Q25 | 4Q25 | 1Q25 | ||||||||||||||||
| Summary of operations | ||||||||||||||||||||
| Net interest income (TE) | $ | 672 | $ | 696 | $ | 636 | (3.4) | % | 5.7 | % | ||||||||||
| Noninterest income | 445 | 498 | 411 | (10.6) | 8.3 | |||||||||||||||
| Total revenue (TE) | 1,117 | 1,194 | 1047 | (6.4) | 6.7 | |||||||||||||||
| Provision for credit losses | 70 | 73 | 75 | (4.1) | (6.7) | |||||||||||||||
| Noninterest expense | 474 | 515 | 464 | (8.0) | 2.2 | |||||||||||||||
| Income (loss) before income taxes (TE) | 573 | 606 | 508 | (5.4) | 12.8 | |||||||||||||||
| Allocated income taxes and TE adjustments | 122 | 134 | 109 | (9.0) | 11.9 | |||||||||||||||
| Net income (loss) attributable to Key | $ | 451 | $ | 472 | $ | 399 | (4.4) | % | 13.0 | % | ||||||||||
| Average balances | ||||||||||||||||||||
| Loans and leases | $ | 73,146 | $ | 71,107 | $ | 67,058 | 2.9 | % | 9.1 | % | ||||||||||
| Loans held for sale | 958 | 1,140 | 754 | (16.0) | 27.1 | |||||||||||||||
| Total assets | 82,585 | 80,689 | 76,946 | 2.3 | 7.3 | |||||||||||||||
| Deposits | 58,929 | 60,485 | 57,481 | (2.6) | 2.5 | |||||||||||||||
TE = Taxable Equivalent
| Additional Commercial Bank Data | ||||||||||||||||||||
| Dollars in millions | Change 1Q26 vs. | |||||||||||||||||||
| 1Q26 | 4Q25 | 1Q25 | 4Q25 | 1Q25 | ||||||||||||||||
| Noninterest income | ||||||||||||||||||||
| Trust and investment services income | $ | 27 | $ | 28 | $ | 27 | (3.6) | % | — | |||||||||||
| Investment banking and debt placement fees | 198 | 244 | 175 | (18.9) | 13.1 | % | ||||||||||||||
| Cards and payments income | 27 | 22 | 21 | 22.7 | 28.6 | |||||||||||||||
| Service charges on deposit accounts | 43 | 40 | 36 | 7.5 | 19.4 | |||||||||||||||
| Corporate services income | 70 | 79 | 64 | (11.4) | 9.4 | |||||||||||||||
| Commercial mortgage servicing fees | 62 | 67 | 76 | (7.5) | (18.4) | |||||||||||||||
| Operating lease income and other leasing gains | 8 | 9 | 8 | (11.1) | — | |||||||||||||||
| Other noninterest income | 10 | 9 | 4 | 11.1 | 150.0 | |||||||||||||||
| Total noninterest income | $ | 445 | $ | 498 | $ | 411 | (10.6) | % | 8.3 | % | ||||||||||
Commercial Bank Summary of Operations (1Q26 vs. 1Q25)
•Key's Commercial Bank recorded net income attributable to Key of $451 million for the first quarter of 2026, compared to $399 million for the year-ago quarter
•Taxable-equivalent net interest income increased by $36 million, or 5.7%, compared to the first quarter of 2025
•Average loan and lease balances increased $6.1 billion, or 9.1%, compared to the first quarter of 2025, driven by an increase in commercial and industrial loans
•Average deposit balances increased $1.4 billion compared to the first quarter of 2025, driven by higher client deposits
•Provision for credit losses decreased $5 million compared to the first quarter of 2025, driven by more stable reserves, partially offset by higher net charge-offs
•Noninterest income increased $34 million compared to the first quarter of 2025, primarily driven by an increase in investment banking and debt placement fees and service charges on deposit accounts
•Noninterest expense increased $10 million compared to the first quarter of 2025, primarily driven by an increase in support and overhead expense
KeyCorp Reports First Quarter 2026 Results
April 16, 2026
Page 9
*******************************************
KeyCorp's roots trace back more than 200 years to Albany, New York. Headquartered in Cleveland, Ohio, Key is one of the nation’s largest bank-based financial services companies, with assets of approximately $189 billion at March 31, 2026.
Key provides deposit, lending, cash management, and investment services to individuals and businesses in 15 states under the name KeyBank National Association through a network of approximately 950 branches and approximately 1,100 ATMs. Key also provides a broad range of sophisticated corporate and investment banking products, such as merger and acquisition advice, public and private debt and equity, syndications and derivatives to middle market companies in selected industries throughout the United States under the KeyBanc Capital Markets trade name. For more information, visit https://www.key.com/. KeyBank Member FDIC.
KeyCorp Reports First Quarter 2026 Results
April 16, 2026
Page 10
| CONTACTS: | |||||
| ANALYSTS | MEDIA | ||||
| Brian Mauney | Susan Donlan | ||||
| 216.689.0521 | 216.471.3133 | ||||
| Brian_Mauney@KeyBank.com | Susan_E_Donlan@KeyBank.com | ||||
| Hannah Lewallen | Beth Strauss | ||||
| 216.471.4856 | 216.471.2787 | ||||
| Hannah_Lewallen@KeyBank.com | Beth_A_Strauss@KeyBank.com | ||||
| Johnny Li | |||||
| 216.689.4221 | |||||
| Johnny_Li@KeyBank.com | |||||
| INVESTOR RELATIONS: | KEY MEDIA NEWSROOM: | ||||
| www.key.com/ir | www.key.com/newsroom | ||||
| This earnings release contains forward-looking statements within the meaning of the Private Securities Litigation Reform Act of 1995. These statements do not relate strictly to historical or current facts. Forward-looking statements usually can be identified by the use of words such as “goal,” “objective,” “plan,” “expect,” “assume,” “anticipate,” “intend,” “project,” “believe,” “estimate,” or other words of similar meaning. Forward-looking statements provide our current expectations or forecasts of future events, circumstances, results, or aspirations. Forward-looking statements, by their nature, are subject to assumptions, risks and uncertainties, many of which are outside of our control. Our actual results may differ materially from those set forth in our forward-looking statements. There is no assurance that any list of risks and uncertainties or risk factors is complete. Factors that could cause Key's actual results to differ from those described in the forward-looking statements can be found in KeyCorp's Form 10-K for the year ended December 31, 2025 and in KeyCorp's subsequent SEC filings, all of which have been or will be filed with the Securities and Exchange Commission (the “SEC”) and are or will be available on Key’s website (www.key.com/ir) and on the SEC’s website (www.sec.gov). These factors may include, among others, adverse changes in credit quality trends, declining asset prices, a worsening of the U.S. economy due to financial, political, or other shocks, the extensive regulation of the U.S. financial services industry, the soundness of other financial institutions, and the impact of changes in the interest rate environment. Any forward-looking statements made by us or on our behalf speak only as of the date they are made and we do not undertake any obligation to update any forward-looking statement to reflect the impact of subsequent events or circumstances. | ||
A live Internet broadcast of KeyCorp’s conference call to discuss quarterly results and currently anticipated earnings trends and to answer analysts’ questions can be accessed through the Investor Relations section at https://www.key.com/ir at 10:00 a.m. ET, on April 16, 2026. A replay of the call will be available on our website through April 16, 2027.
For up-to-date company information, media contacts, and facts and figures about Key’s lines of business, visit our Media Newsroom at https://www.key.com/newsroom.
*****
KeyCorp Reports First Quarter 2026 Results
April 16, 2026
Page 11
KeyCorp
First Quarter 2026
Financial Supplement
| Page | |||||
KeyCorp Reports First Quarter 2026 Results
April 16, 2026
Page 12
Basis of Presentation
Use of Non-GAAP Financial Measures
This document contains GAAP financial measures and non-GAAP financial measures where management
believes it to be helpful in understanding Key’s results of operations or financial position. Where non-GAAP financial measures are used, the comparable GAAP financial measure, as well as the reconciliation to the comparable GAAP financial measure, can be found in this document, the financial supplement, or conference call slides related to this document, all of which can be found on Key’s website (www.key.com/ir).
Forward-Looking Non-GAAP Financial Measures
From time to time Key may discuss forward-looking non-GAAP financial measures. Key is unable to provide a reconciliation of forward-looking non-GAAP financial measures to their most directly comparable GAAP financial measures because Key is unable to provide, without unreasonable effort, a meaningful or accurate calculation or estimation of amounts that would be necessary for the reconciliation due to the complexity and inherent difficulty in forecasting and quantifying future amounts or when they may occur. Such unavailable information could be significant for future results.
Annualized Data
Certain returns, yields, performance ratios, or quarterly growth rates are presented on an “annualized”
basis. This is done for analytical and decision-making purposes to better discern underlying performance trends when compared to full-year or year-over-year amounts.
Taxable Equivalent
The interest income earned on certain earning assets is completely or partially exempt from federal income tax. As such, these tax-exempt instruments typically yield lower returns than taxable investments. Income from tax-exempt earning assets is increased by an amount equivalent to the taxes that would have been paid if this income had been taxable at the federal statutory rate. This adjustment puts all earning assets, most notably tax-exempt loans, and certain lease assets, on a common basis that facilitates comparison of results to peers.
Earnings Per Share Equivalent
Certain income or expense items may be expressed on a per common share basis. This is done for analytical and decision-making purposes to better discern underlying trends in total consolidated earnings per share performance excluding the impact of such items. When the impact of certain income or expense items is disclosed separately, the after-tax amount is computed using the marginal tax rate, unless otherwise specified, with this then being the amount used to calculate the earnings per share equivalent.
KeyCorp Reports First Quarter 2026 Results
April 16, 2026
Page 13
| Financial Highlights | |||||||||||||||||
| (Dollars in millions, except per share amounts) | |||||||||||||||||
| Three months ended | |||||||||||||||||
| 3/31/2026 | 12/31/2025 | 3/31/2025 | |||||||||||||||
| Summary of operations | |||||||||||||||||
| Net interest income (TE) | $ | 1,230 | $ | 1,223 | $ | 1,105 | |||||||||||
| Noninterest income | 723 | 782 | 668 | ||||||||||||||
Total revenue (TE) | 1,953 | 2,005 | 1,773 | ||||||||||||||
| Provision for credit losses | 106 | 108 | 118 | ||||||||||||||
| Noninterest expense | 1,181 | 1,241 | 1,131 | ||||||||||||||
| Income (loss) from continuing operations attributable to Key | 522 | 509 | 406 | ||||||||||||||
| Income (loss) from discontinued operations, net of taxes | — | 1 | (1) | ||||||||||||||
| Net income (loss) attributable to Key | 522 | 510 | 405 | ||||||||||||||
| Income (loss) from continuing operations attributable to Key common shareholders | 486 | 474 | 370 | ||||||||||||||
| Income (loss) from discontinued operations, net of taxes | — | 1 | (1) | ||||||||||||||
| Net income (loss) attributable to Key common shareholders | 486 | 475 | 369 | ||||||||||||||
| Per common share | |||||||||||||||||
| Income (loss) from continuing operations attributable to Key common shareholders | $ | 0.45 | $ | 0.43 | $ | 0.34 | |||||||||||
| Income (loss) from discontinued operations, net of taxes | — | — | — | ||||||||||||||
Net income (loss) attributable to Key common shareholders (a) | 0.45 | 0.43 | 0.34 | ||||||||||||||
| Income (loss) from continuing operations attributable to Key common shareholders — assuming dilution | 0.44 | 0.43 | 0.33 | ||||||||||||||
| Income (loss) from discontinued operations, net of taxes — assuming dilution | — | — | — | ||||||||||||||
Net income (loss) attributable to Key common shareholders — assuming dilution (a) | 0.44 | 0.43 | 0.33 | ||||||||||||||
| Cash dividends declared | 0.205 | 0.205 | 0.205 | ||||||||||||||
| Book value at period end | 16.13 | 16.27 | 14.89 | ||||||||||||||
| Tangible book value at period end | 13.60 | 13.77 | 12.40 | ||||||||||||||
| Market price at period end | 20.05 | 20.64 | 15.99 | ||||||||||||||
| Performance ratios | |||||||||||||||||
| From continuing operations: | |||||||||||||||||
| Return on average total assets | 1.14 | % | 1.08 | % | .88 | % | |||||||||||
| Return on average common equity | 11.02 | 10.51 | 9.30 | ||||||||||||||
Return on average tangible common equity (b) | 13.02 | 12.43 | 11.24 | ||||||||||||||
| Net interest margin (TE) | 2.87 | 2.82 | 2.58 | ||||||||||||||
Cash efficiency ratio (b) | 60.4 | 61.6 | 63.5 | ||||||||||||||
| From consolidated operations: | |||||||||||||||||
| Return on average total assets | 1.14 | % | 1.08 | % | .88 | % | |||||||||||
| Return on average common equity | 11.02 | 10.54 | 9.28 | ||||||||||||||
Return on average tangible common equity (b) | 13.02 | 12.46 | 11.21 | ||||||||||||||
| Net interest margin (TE) | 2.87 | 2.81 | 2.58 | ||||||||||||||
Loan to deposit (c) | 74.6 | 72.5 | 70.2 | ||||||||||||||
| Capital ratios at period end | |||||||||||||||||
| Key shareholders’ equity to assets | 10.6 | % | 11.1 | % | 10.1 | % | |||||||||||
| Key common shareholders’ equity to assets | 9.3 | 9.7 | 8.8 | ||||||||||||||
Tangible common equity to tangible assets (b) | 8.0 | 8.4 | 7.4 | ||||||||||||||
Common Equity Tier 1 (d) | 11.4 | 11.8 | 11.6 | ||||||||||||||
Tier 1 risk-based capital (d) | 13.0 | 13.5 | 13.3 | ||||||||||||||
Total risk-based capital (d) | 15.2 | 15.7 | 15.7 | ||||||||||||||
Leverage (d) | 10.5 | 10.5 | 10.2 | ||||||||||||||
Asset quality — from continuing operations | |||||||||||||||||
Net loan charge-offs | $ | 101 | $ | 104 | $ | 110 | |||||||||||
Net loan charge-offs to average loans | .38 | % | .39 | % | .43 | % | |||||||||||
Allowance for loan and lease losses | $ | 1,449 | $ | 1,427 | $ | 1,429 | |||||||||||
Allowance for credit losses | 1,745 | 1,740 | 1,707 | ||||||||||||||
Allowance for loan and lease losses to period-end loans | 1.33 | % | 1.34 | % | 1.36 | % | |||||||||||
Allowance for credit losses to period-end loans | 1.60 | 1.63 | 1.63 | ||||||||||||||
| Allowance for loan and lease losses to nonperforming loans | 212 | 232 | 208 | ||||||||||||||
| Allowance for credit losses to nonperforming loans | 256 | 283 | 249 | ||||||||||||||
| Nonperforming loans at period-end | $ | 682 | $ | 615 | $ | 686 | |||||||||||
| Nonperforming assets at period-end | 692 | 627 | 700 | ||||||||||||||
| Nonperforming loans to period-end portfolio loans | .62 | % | .58 | % | .65 | % | |||||||||||
| Nonperforming assets to period-end portfolio loans plus OREO and other nonperforming assets | .63 | .59 | .67 | ||||||||||||||
Trust assets | |||||||||||||||||
| Assets under management | $ | 69,756 | $ | 69,964 | $ | 61,053 | |||||||||||
Other data | |||||||||||||||||
Average full-time equivalent employees | 17,469 | 17,396 | 16,989 | ||||||||||||||
Branches | 940 | 940 | 945 | ||||||||||||||
Taxable-equivalent adjustment | $ | 8 | $ | 8 | $ | 9 | |||||||||||
(a)Earnings per share may not foot due to rounding.
(b)The table entitled “GAAP to Non-GAAP Reconciliations” starting on page 14 of this supplement presents the computations of certain financial measures related to “tangible common equity” and “cash efficiency.” The table reconciles the GAAP performance measures to the corresponding non-GAAP measures, which provides a basis for period-to-period comparisons.
(c)Represents period-end consolidated total loans and loans held for sale divided by period-end consolidated total deposits.
(d)March 31, 2026, ratio is estimated.
KeyCorp Reports First Quarter 2026 Results
April 16, 2026
Page 14
GAAP to Non-GAAP Reconciliations
(Dollars in millions)
The table below presents certain non-GAAP financial measures defined and described below.
The tangible common equity ratio and the return on average tangible common equity ratio have been a focus for some investors, and management believes these ratios may assist investors in analyzing Key’s capital position without regard to the effects of intangible assets and preferred stock. Adjusted return on average tangible common equity excludes significant or unusual items that management does not consider indicative of ongoing financial performance. Management believes this measure provides a greater understanding of ongoing operations and enhances comparability of results with prior periods.
The table also shows the computation for pre-provision net revenue and adjusted pre-provision net revenue, which are not formally defined by GAAP. Management believes that eliminating the effects of the provision for credit losses makes it easier to analyze the results by presenting them on a more comparable basis. Further, management believes that adjusting pre-provision net revenue for significant or unusual items that management does not consider indicative of ongoing financial performance provides a greater understanding of ongoing operations and enhances comparability of results with prior periods.
The cash efficiency ratio is a ratio of two non-GAAP performance measures. As such, there is no directly comparable GAAP performance measure. The cash efficiency ratio performance measure removes the impact of Key’s intangible asset amortization from the calculation. Management believes this ratio provides greater consistency and comparability between Key’s results and those of its peer banks. Additionally, this ratio is used by analysts and investors as they develop earnings forecasts and peer bank analysis. The adjusted cash efficiency ratio excludes significant or unusual items that management does not consider indicative of ongoing financial performance
Adjusted taxable-equivalent revenue or adjusted revenue is a non-GAAP measure in that it adjusts revenue for certain tax-exempt instruments and selected items. The interest income earned on certain earning assets is completely or partially exempt from federal income tax. As such, these tax-exempt instruments typically yield lower returns than taxable investments. To provide more meaningful comparisons of net interest income, we use interest income on a taxable-equivalent basis by increasing the interest income earned on tax-exempt assets to make it fully equivalent to interest income earned on taxable instruments. Additionally, management believes adjusting for the selected items provide investors with useful information to gain a better understanding of ongoing operations and enhance comparability of results with prior periods, as well as demonstrate the effects of the financial impacts related to those selected items.
Adjusted noninterest income and adjusted noninterest expense are non-GAAP measures in that they exclude significant or unusual items that management does not consider indicative of ongoing financial performance. Management believes these measures provides a greater understanding of ongoing operations and enhances comparability of results with prior periods.
Adjusted income (loss) available from continuing operations attributable to Key common shareholders (or “adjusted net income”) and diluted earnings per share - adjusted (or "adjusted earnings per share") are non-GAAP in that these measures exclude significant or unusual items, net of tax, that management does not consider indicative of ongoing financial performance . Management believes these measures provide investors with useful information to gain a better understanding of ongoing operations and enhance comparability of results with prior periods.
Adjusted operating leverage and fee-based adjusted operating leverage are non-GAAP performance measures that utilize revenue on a tax-equivalent basis and adjust revenue and expense for significant and unusual items. Management utilizes these measurements in analyzing performance and believes that adjusting for significant and unusual items provide investors with useful information to gain a better understanding of ongoing operations and enhance comparability of results with prior periods.
Marked CET1 ratio is a non-GAAP measure and is calculated based on Common Equity Tier 1 capital, inclusive of the AOCI impact from securities and pension. The marked CET1 ratio differs from the defined CET1 regulatory capital ratio by including the impact of AFS and pension accumulated other comprehensive income (loss) (AOCI) amounts in the calculation of the capital ratio. These ratios are not defined in GAAP or federal banking regulations. As a result, these non-regulatory capital ratios disclosed may be considered non-GAAP financial measures.
Non-GAAP financial measures have inherent limitations, are not required to be uniformly applied, and are not audited. Although these non-GAAP financial measures are frequently used by investors to evaluate a company, they have limitations as analytical tools, and should not be considered in isolation, or as a substitute for analyses of results as reported under GAAP.
| Three months ended | ||||||||||||||||||||
| 3/31/2026 | 12/31/2025 | 3/31/2025 | ||||||||||||||||||
| Net interest income (GAAP) | $ | 1,222 | $ | 1,215 | $ | 1,096 | ||||||||||||||
| Add: Taxable-equivalent adjustment | 8 | 8 | 9 | |||||||||||||||||
| Net interest income TE (non-GAAP) (A) | $ | 1,230 | $ | 1,223 | $ | 1,105 | ||||||||||||||
| Net income (loss) attributable to Key common shareholders (GAAP) (B) | $ | 486 | $ | 475 | $ | 369 | ||||||||||||||
| Average Key shareholders' equity (GAAP) | $ | 20,392 | $ | 20,388 | $ | 18,632 | ||||||||||||||
| Less: Average intangible assets | 2,758 | 2,762 | 2,777 | |||||||||||||||||
| Average preferred stock | 2,500 | 2,500 | 2,500 | |||||||||||||||||
| Average tangible common equity (non-GAAP) (C) | $ | 15,134 | $ | 15,126 | $ | 13,355 | ||||||||||||||
| Key shareholders' equity (GAAP) | $ | 19,987 | $ | 20,381 | $ | 19,003 | ||||||||||||||
| Less: Intangible assets | 2,757 | 2,760 | 2,774 | |||||||||||||||||
Preferred stock (a) | 2,446 | 2,446 | 2,446 | |||||||||||||||||
| Tangible common equity (non-GAAP) (D) | $ | 14,784 | $ | 15,175 | $ | 13,783 | ||||||||||||||
| Total assets (GAAP) | $ | 188,663 | $ | 184,381 | $ | 188,691 | ||||||||||||||
| Less: Intangible assets | 2,757 | 2,760 | 2,774 | |||||||||||||||||
| Tangible assets (non-GAAP) (E) | $ | 185,906 | $ | 181,621 | $ | 185,917 | ||||||||||||||
| Tangible common equity to tangible assets ratio (non-GAAP) (D/E) | 7.95 | % | 8.36 | % | 7.41 | % | ||||||||||||||
| Return on average tangible common equity consolidated (non-GAAP) (B/C) | 13.02 | % | 12.46 | % | 11.21 | % | ||||||||||||||
| Common equity tier 1 (F) | $ | 17,038 | $ | 17,195 | $ | 16,549 | ||||||||||||||
| Add: AFS and Pension AOCI (loss) | (2,152) | (2,028) | (2,601) | |||||||||||||||||
Marked common equity tier 1 (non-GAAP) (G) (b) | $ | 14,886 | $ | 15,167 | $ | 13,948 | ||||||||||||||
Risk-weighted assets (H) (c) | $ | 149,465 | $ | 145,933 | $ | 142,478 | ||||||||||||||
Common equity tier 1 ratio (F/H) (c) | 11.40 | % | 11.78 | % | 11.62 | % | ||||||||||||||
Marked CET1 ratio (non-GAAP) (G/H) (b)(c) | 9.96 | % | 10.39 | % | 9.79 | % | ||||||||||||||
KeyCorp Reports First Quarter 2026 Results
April 16, 2026
Page 15
| GAAP to Non-GAAP Reconciliations (continued) | ||||||||||||||||||||
| (Dollars in millions) | ||||||||||||||||||||
| Three months ended | ||||||||||||||||||||
| 3/31/2026 | 12/31/2025 | 3/31/2025 | ||||||||||||||||||
| Income (loss) from continuing operations attributable to Key common shareholders (GAAP) (I) | $ | 486 | $ | 474 | $ | 370 | ||||||||||||||
Plus: Selected items (net of tax) (d) | — | (16) | — | |||||||||||||||||
| Net income (loss) from continuing operations attributable to Key common shareholders, excluding selected items (non-GAAP) (J) | $ | 486 | $ | 458 | $ | 370 | ||||||||||||||
| Return on average tangible common equity from continuing operations (non-GAAP) (I/C) | 13.02 | % | 12.43 | % | 11.24 | % | ||||||||||||||
| Adjusted return on average tangible common equity from continuing operations excluding selected items (non-GAAP) (J/C) | 13.02 | % | 12.01 | % | 11.24 | % | ||||||||||||||
| Noninterest income (GAAP) (K) | $ | 723 | $ | 782 | $ | 668 | ||||||||||||||
Plus: Selected items (d) | — | — | — | |||||||||||||||||
| Adjusted noninterest income (non-GAAP) (L) | $ | 723 | $ | 782 | $ | 668 | ||||||||||||||
| Noninterest expense (GAAP) (M) | $ | 1,181 | $ | 1,241 | $ | 1,131 | ||||||||||||||
| Less: Intangible asset amortization | 2 | 5 | 5 | |||||||||||||||||
| Noninterest expense less intangible asset amortization (non-GAAP) (N) | $ | 1,179 | $ | 1,236 | $ | 1,126 | ||||||||||||||
Plus: Selected items (d) (O) | — | 21 | — | |||||||||||||||||
| Adjusted noninterest expense less intangible asset amortization (non-GAAP) (P) | $ | 1,179 | $ | 1,257 | $ | 1,126 | ||||||||||||||
| Adjusted noninterest expense (non-GAAP) (M+O) | $ | 1,181 | $ | 1,262 | $ | 1,131 | ||||||||||||||
| Total taxable-equivalent revenue (non-GAAP) (A+K) = (Q) | $ | 1,953 | $ | 2,005 | $ | 1,773 | ||||||||||||||
| Total adjusted taxable-equivalent revenue (non-GAAP) (A+L) | 1,953 | 2,005 | 1,773 | |||||||||||||||||
| Cash efficiency ratio (non-GAAP) (N/Q) | 60.37 | % | 61.65 | % | 63.51 | % | ||||||||||||||
| Adjusted cash efficiency ratio (non-GAAP) (P/Q) | 60.37 | % | 62.69 | % | 63.51 | % | ||||||||||||||
| Pre-provision net revenue from continuing operations (non-GAAP) (A+K-M) | $ | 772 | $ | 764 | $ | 642 | ||||||||||||||
Plus: Selected items (d) | — | (21) | — | |||||||||||||||||
| Adjusted pre-provison net revenue from continuing operations (non-GAAP) | $ | 772 | $ | 743 | $ | 642 | ||||||||||||||
| Diluted EPS from continuing operations attributable to Key common shareholders (GAAP) | $ | 0.44 | $ | 0.43 | $ | 0.33 | ||||||||||||||
Plus: EPS impact of selected items (d) | — | (0.01) | — | |||||||||||||||||
Diluted EPS from continuing operations attributable to Key common shareholders - adjusted (non-GAAP) (e) | $ | 0.44 | $ | 0.41 | $ | 0.33 | ||||||||||||||
| Adjusted operating leverage and fee based adjusted operating leverage | ||||||||||||||||||||
| Adjusted noninterest income YoY Growth (R) | 8.23 | % | 8.31 | % | 3.25 | % | ||||||||||||||
| Adjusted taxable-equivalent revenue YoY Growth (S) | 10.15 | % | 12.45 | % | 15.66 | % | ||||||||||||||
| Adjusted noninterest expense YoY Growth (T) | 4.42 | % | 3.27 | % | 31.51 | % | ||||||||||||||
| Adjusted operating leverage (S - T) | 5.73 | % | 9.18 | % | (15.86) | % | ||||||||||||||
| Adjusted fee-based operating leverage (R - T) | 3.81 | % | 5.04 | % | (28.27) | % | ||||||||||||||
(a)Net of capital surplus.
(b)Under the current applicable regulatory capital rules, Key has made the AOCI opt out election, which enables us to exclude components of AOCI from regulatory capital, notably the AOCI relative to securities and pension.
(c)Amounts and ratios as of March 31, 2026 are estimated.
(d)Additional detail provided in Selected Items table on page 22.
(e)Earnings per share may not foot due to rounding.
GAAP = U.S. generally accepted accounting principles; TE = Taxable Equivalent
KeyCorp Reports First Quarter 2026 Results
April 16, 2026
Page 16
| Consolidated Balance Sheets | |||||||||||||||||
| (Dollars in millions) | |||||||||||||||||
| 3/31/2026 | 12/31/2025 | 3/31/2025 | |||||||||||||||
| Assets | |||||||||||||||||
| Loans | $ | 109,190 | $ | 106,541 | $ | 104,809 | |||||||||||
| Loans held for sale | 876 | 1,077 | 811 | ||||||||||||||
| Securities available for sale | 38,918 | 39,596 | 40,751 | ||||||||||||||
| Held-to-maturity securities | 9,116 | 8,622 | 7,160 | ||||||||||||||
| Trading account assets | 783 | 1,061 | 1,296 | ||||||||||||||
| Short-term investments | 11,782 | 10,163 | 15,349 | ||||||||||||||
| Other investments | 1,204 | 949 | 1,050 | ||||||||||||||
| Total earning assets | 171,869 | 168,009 | 171,226 | ||||||||||||||
| Allowance for loan and lease losses | (1,449) | (1,427) | (1,429) | ||||||||||||||
| Cash and due from banks | 1,130 | 1,287 | 1,909 | ||||||||||||||
| Premises and equipment | 618 | 628 | 602 | ||||||||||||||
| Goodwill | 2,752 | 2,752 | 2,752 | ||||||||||||||
| Other intangible assets | 5 | 8 | 22 | ||||||||||||||
| Corporate-owned life insurance | 4,439 | 4,432 | 4,404 | ||||||||||||||
| Accrued income and other assets | 9,100 | 8,481 | 8,958 | ||||||||||||||
| Discontinued assets | 199 | 211 | 247 | ||||||||||||||
| Total assets | $ | 188,663 | $ | 184,381 | $ | 188,691 | |||||||||||
| Liabilities | |||||||||||||||||
| Deposits in domestic offices: | |||||||||||||||||
| Interest-bearing deposits | $ | 120,220 | $ | 121,100 | $ | 122,283 | |||||||||||
| Noninterest-bearing deposits | 27,595 | 27,613 | 28,454 | ||||||||||||||
| Total deposits | 147,815 | 148,713 | 150,737 | ||||||||||||||
| Federal funds purchased and securities sold under repurchase agreements | 34 | 13 | 22 | ||||||||||||||
| Bank notes and other short-term borrowings | 6,149 | 1,071 | 2,328 | ||||||||||||||
| Accrued expense and other liabilities | 3,801 | 4,286 | 4,209 | ||||||||||||||
| Long-term debt | 10,877 | 9,917 | 12,392 | ||||||||||||||
| Total liabilities | 168,676 | 164,000 | 169,688 | ||||||||||||||
| Equity | |||||||||||||||||
| Preferred stock | 2,500 | 2,500 | 2,500 | ||||||||||||||
| Common shares | 1,257 | 1,257 | 1,257 | ||||||||||||||
| Capital surplus | 5,981 | 6,035 | 5,946 | ||||||||||||||
| Retained earnings | 15,622 | 15,359 | 14,724 | ||||||||||||||
| Treasury stock, at cost | (3,152) | (2,810) | (2,637) | ||||||||||||||
| Accumulated other comprehensive income (loss) | (2,221) | (1,960) | (2,787) | ||||||||||||||
| Key shareholders’ equity | 19,987 | 20,381 | 19,003 | ||||||||||||||
| Total liabilities and equity | $ | 188,663 | $ | 184,381 | $ | 188,691 | |||||||||||
| Common shares outstanding (000) | 1,087,293 | 1,102,401 | 1,111,986 | ||||||||||||||
KeyCorp Reports First Quarter 2026 Results
April 16, 2026
Page 17
| Consolidated Statements of Income | ||||||||||||||||||||||||||
| (Dollars in millions, except per share amounts) | ||||||||||||||||||||||||||
Three months ended | ||||||||||||||||||||||||||
| 3/31/2026 | 12/31/2025 | 3/31/2025 | ||||||||||||||||||||||||
| Interest income | ||||||||||||||||||||||||||
| Loans | $ | 1,416 | $ | 1,439 | $ | 1,401 | ||||||||||||||||||||
| Loans held for sale | 14 | 18 | 14 | |||||||||||||||||||||||
| Securities available for sale | 370 | 388 | 392 | |||||||||||||||||||||||
| Held-to-maturity securities | 86 | 76 | 63 | |||||||||||||||||||||||
| Trading account assets | 11 | 12 | 17 | |||||||||||||||||||||||
| Short-term investments | 103 | 137 | 174 | |||||||||||||||||||||||
| Other investments | 5 | 8 | 9 | |||||||||||||||||||||||
| Total interest income | 2,005 | 2,078 | 2,070 | |||||||||||||||||||||||
| Interest expense | ||||||||||||||||||||||||||
| Deposits | 598 | 688 | 753 | |||||||||||||||||||||||
| Federal funds purchased and securities sold under repurchase agreements | 14 | 4 | 1 | |||||||||||||||||||||||
| Bank notes and other short-term borrowings | 20 | 9 | 27 | |||||||||||||||||||||||
| Long-term debt | 151 | 162 | 193 | |||||||||||||||||||||||
| Total interest expense | 783 | 863 | 974 | |||||||||||||||||||||||
| Net interest income | 1,222 | 1,215 | 1,096 | |||||||||||||||||||||||
| Provision for credit losses | 106 | 108 | 118 | |||||||||||||||||||||||
| Net interest income after provision for credit losses | 1,116 | 1,107 | 978 | |||||||||||||||||||||||
| Noninterest income | ||||||||||||||||||||||||||
| Trust and investment services income | 157 | 156 | 139 | |||||||||||||||||||||||
| Investment banking and debt placement fees | 197 | 243 | 175 | |||||||||||||||||||||||
| Cards and payments income | 86 | 84 | 82 | |||||||||||||||||||||||
| Service charges on deposit accounts | 77 | 78 | 69 | |||||||||||||||||||||||
| Corporate services income | 71 | 81 | 65 | |||||||||||||||||||||||
| Commercial mortgage servicing fees | 62 | 68 | 76 | |||||||||||||||||||||||
| Corporate-owned life insurance income | 34 | 40 | 33 | |||||||||||||||||||||||
| Consumer mortgage income | 13 | 16 | 13 | |||||||||||||||||||||||
| Operating lease income and other leasing gains | 8 | 9 | 9 | |||||||||||||||||||||||
| Other income | 18 | 7 | 7 | |||||||||||||||||||||||
| Total noninterest income | 723 | 782 | 668 | |||||||||||||||||||||||
| Noninterest expense | ||||||||||||||||||||||||||
| Personnel | 743 | 790 | 680 | |||||||||||||||||||||||
| Net occupancy | 68 | 69 | 67 | |||||||||||||||||||||||
| Computer processing | 111 | 106 | 107 | |||||||||||||||||||||||
| Business services and professional fees | 36 | 61 | 40 | |||||||||||||||||||||||
| Equipment | 19 | 22 | 20 | |||||||||||||||||||||||
| Operating lease expense | 7 | 8 | 11 | |||||||||||||||||||||||
| Marketing | 18 | 28 | 21 | |||||||||||||||||||||||
| Other expense | 179 | 157 | 185 | |||||||||||||||||||||||
| Total noninterest expense | 1,181 | 1,241 | 1,131 | |||||||||||||||||||||||
| Income (loss) from continuing operations before income taxes | 658 | 648 | 515 | |||||||||||||||||||||||
| Income taxes (benefit) | 136 | 139 | 109 | |||||||||||||||||||||||
| Income (loss) from continuing operations | 522 | 509 | 406 | |||||||||||||||||||||||
| Income (loss) from discontinued operations, net of taxes | — | 1 | (1) | |||||||||||||||||||||||
| Net income (loss) | $ | 522 | $ | 510 | $ | 405 | ||||||||||||||||||||
| Income (loss) from continuing operations attributable to Key common shareholders | $ | 486 | $ | 474 | $ | 370 | ||||||||||||||||||||
| Net income (loss) attributable to Key common shareholders | 486 | 475 | 369 | |||||||||||||||||||||||
| Per common share | ||||||||||||||||||||||||||
| Income (loss) from continuing operations attributable to Key common shareholders | $ | 0.45 | $ | 0.43 | $ | 0.34 | ||||||||||||||||||||
| Income (loss) from discontinued operations, net of taxes | — | — | — | |||||||||||||||||||||||
Net income (loss) attributable to Key common shareholders (a) | 0.45 | 0.43 | 0.34 | |||||||||||||||||||||||
| Per common share — assuming dilution | ||||||||||||||||||||||||||
| Income (loss) from continuing operations attributable to Key common shareholders | $ | 0.44 | $ | 0.43 | $ | 0.33 | ||||||||||||||||||||
| Income (loss) from discontinued operations, net of taxes | — | — | — | |||||||||||||||||||||||
Net income (loss) attributable to Key common shareholders (a) | 0.44 | 0.43 | 0.33 | |||||||||||||||||||||||
| Cash dividends declared per common share | $ | 0.205 | $ | 0.205 | $ | 0.205 | ||||||||||||||||||||
| Weighted-average common shares outstanding (000) | 1,084,277 | 1,095,171 | 1,096,654 | |||||||||||||||||||||||
Effect of common share options and other stock awards(b) | 10,091 | 11,152 | 9,486 | |||||||||||||||||||||||
Weighted-average common shares and potential common shares outstanding (000) (c) | 1,094,368 | 1,106,323 | 1,106,140 | |||||||||||||||||||||||
(a)Earnings per share may not foot due to rounding.
(b)For periods ended in a loss from continuing operations attributable to Key common shareholders, anti-dilutive instruments have been excluded from the calculation of diluted earnings per share.
(c)Assumes conversion of common share options and other stock awards, as applicable.
KeyCorp Reports First Quarter 2026 Results
April 16, 2026
Page 18
| Consolidated Average Balance Sheets, and Net Interest Income and Yields/Rates From Continuing Operations | ||||||||||||||||||||||||||||||||||||||
| (Dollars in millions) | ||||||||||||||||||||||||||||||||||||||
| First Quarter 2026 | Fourth Quarter 2025 | First Quarter 2025 | ||||||||||||||||||||||||||||||||||||
| Average | Yield/ | Average | Yield/ | Average | Yield/ | |||||||||||||||||||||||||||||||||
| Balance | Interest (a) | Rate (a) | Balance | Interest (a) | Rate (a) | Balance | Interest (a) | Rate (a) | ||||||||||||||||||||||||||||||
| Assets | ||||||||||||||||||||||||||||||||||||||
Loans: (b), (c) | ||||||||||||||||||||||||||||||||||||||
Commercial and industrial (d) | $ | 59,149 | $ | 843 | 5.76 | % | $ | 57,541 | $ | 851 | 5.88 | % | $ | 53,746 | $ | 800 | 6.04 | % | ||||||||||||||||||||
| Real estate — commercial mortgage | 13,902 | 198 | 5.76 | 13,356 | 198 | 5.91 | 13,061 | 192 | 5.96 | |||||||||||||||||||||||||||||
| Real estate — construction | 2,803 | 45 | 6.50 | 2,839 | 48 | 6.71 | 2,905 | 49 | 6.87 | |||||||||||||||||||||||||||||
| Commercial lease financing | 2,213 | 21 | 3.81 | 2,302 | 21 | 3.73 | 2,653 | 23 | 3.52 | |||||||||||||||||||||||||||||
| Total commercial loans | 78,067 | 1,107 | 5.73 | 76,038 | 1,118 | 5.84 | 72,365 | 1,064 | 5.96 | |||||||||||||||||||||||||||||
| Real estate — residential mortgage | 18,593 | 155 | 3.34 | 18,853 | 157 | 3.33 | 19,737 | 165 | 3.33 | |||||||||||||||||||||||||||||
| Home equity loans | 5,609 | 74 | 5.35 | 5,780 | 80 | 5.47 | 6,248 | 86 | 5.60 | |||||||||||||||||||||||||||||
| Other consumer loans | 4,558 | 58 | 5.16 | 4,715 | 61 | 5.15 | 5,087 | 63 | 5.01 | |||||||||||||||||||||||||||||
| Credit cards | 910 | 30 | 13.24 | 930 | 31 | 13.24 | 917 | 32 | 14.04 | |||||||||||||||||||||||||||||
| Total consumer loans | 29,670 | 317 | 4.30 | 30,278 | 329 | 4.33 | 31,989 | 346 | 4.35 | |||||||||||||||||||||||||||||
| Total loans | 107,737 | 1,424 | 5.35 | 106,316 | 1,447 | 5.41 | 104,354 | 1,410 | 5.47 | |||||||||||||||||||||||||||||
| Loans held for sale | 1,092 | 14 | 4.99 | 1,234 | 18 | 5.84 | 815 | 14 | 6.70 | |||||||||||||||||||||||||||||
Securities available for sale (b), (e) | 39,403 | 370 | 3.59 | 39,785 | 388 | 3.67 | 39,321 | 392 | 3.70 | |||||||||||||||||||||||||||||
Held-to-maturity securities (b) | 8,795 | 86 | 3.91 | 8,056 | 76 | 3.78 | 7,274 | 63 | 3.46 | |||||||||||||||||||||||||||||
| Trading account assets | 865 | 11 | 4.96 | 961 | 12 | 4.79 | 1,296 | 17 | 5.20 | |||||||||||||||||||||||||||||
| Short-term investments | 11,134 | 103 | 3.74 | 13,603 | 137 | 4.01 | 15,211 | 174 | 4.63 | |||||||||||||||||||||||||||||
Other investments (e) | 1,075 | 5 | 1.97 | 935 | 8 | 3.09 | 935 | 9 | 3.73 | |||||||||||||||||||||||||||||
| Total earning assets | 170,101 | 2,013 | 4.71 | 170,890 | 2,086 | 4.79 | 169,206 | 2,079 | 4.86 | |||||||||||||||||||||||||||||
| Allowance for loan and lease losses | (1,419) | (1,435) | (1,401) | |||||||||||||||||||||||||||||||||||
| Accrued income and other assets | 17,567 | 17,562 | 18,285 | |||||||||||||||||||||||||||||||||||
| Discontinued assets | 204 | 215 | 254 | |||||||||||||||||||||||||||||||||||
| Total assets | $ | 186,453 | $ | 187,232 | $ | 186,344 | ||||||||||||||||||||||||||||||||
| Liabilities | ||||||||||||||||||||||||||||||||||||||
| Money market deposits | $ | 42,732 | $ | 223 | 2.12 | % | $ | 42,442 | $ | 246 | 2.30 | % | $ | 42,007 | $ | 275 | 2.65 | % | ||||||||||||||||||||
| Demand deposits | 61,478 | 279 | 1.84 | 61,541 | 319 | 2.06 | 57,460 | 310 | 2.19 | |||||||||||||||||||||||||||||
| Savings deposits | 4,378 | 1 | .04 | 4,358 | 1 | .05 | 4,610 | 1 | .06 | |||||||||||||||||||||||||||||
| Time deposits | 11,777 | 95 | 3.26 | 13,857 | 122 | 3.48 | 16,625 | 167 | 4.09 | |||||||||||||||||||||||||||||
| Total interest-bearing deposits | 120,365 | 598 | 2.01 | 122,198 | 688 | 2.23 | 120,702 | 753 | 2.53 | |||||||||||||||||||||||||||||
| Federal funds purchased and securities sold under repurchase agreements | 1,539 | 14 | 3.69 | 413 | 4 | 3.80 | 100 | 1 | 3.94 | |||||||||||||||||||||||||||||
| Bank notes and other short-term borrowings | 2,585 | 20 | 3.20 | 1,072 | 9 | 3.23 | 2,273 | 27 | 4.74 | |||||||||||||||||||||||||||||
Long-term debt (f) | 10,186 | 151 | 5.96 | 10,274 | 162 | 6.27 | 11,779 | 193 | 6.61 | |||||||||||||||||||||||||||||
| Total interest-bearing liabilities | 134,675 | 783 | 2.35 | 133,957 | 863 | 2.56 | 134,854 | 974 | 2.92 | |||||||||||||||||||||||||||||
| Noninterest-bearing deposits | 26,934 | 28,512 | 27,840 | |||||||||||||||||||||||||||||||||||
| Accrued expense and other liabilities | 4,248 | 4,160 | 4,764 | |||||||||||||||||||||||||||||||||||
Discontinued liabilities (f) | 204 | 215 | 254 | |||||||||||||||||||||||||||||||||||
| Total liabilities | $ | 166,061 | $ | 166,844 | $ | 167,712 | ||||||||||||||||||||||||||||||||
| Equity | ||||||||||||||||||||||||||||||||||||||
| Total equity | $ | 20,392 | $ | 20,388 | $ | 18,632 | ||||||||||||||||||||||||||||||||
| Total liabilities and equity | $ | 186,453 | $ | 187,232 | $ | 186,344 | ||||||||||||||||||||||||||||||||
| Interest rate spread (TE) | 2.36 | % | 2.23 | % | 1.94 | % | ||||||||||||||||||||||||||||||||
| Net interest income (TE) and net interest margin (TE) | $ | 1,230 | 2.87 | % | $ | 1,223 | 2.82 | % | $ | 1,105 | 2.58 | % | ||||||||||||||||||||||||||
TE adjustment (b) | 8 | 8 | 9 | |||||||||||||||||||||||||||||||||||
| Net interest income, GAAP basis | $ | 1,222 | $ | 1,215 | $ | 1,096 | ||||||||||||||||||||||||||||||||
(a)Results are from continuing operations. Interest excludes the interest associated with the liabilities referred to in (f) below, calculated using a matched funds transfer pricing methodology.
(b)Interest income on tax-exempt securities and loans has been adjusted to a taxable-equivalent basis using the statutory federal income tax rate of 21% for the three months ended March 31, 2026, December 31, 2025, and March 31, 2025.
(c)For purposes of these computations, nonaccrual loans are included in average loan balances.
(d)Commercial and industrial average balances include $205 million, $211 million, and $213 million of assets from commercial credit cards for the three months ended March 31, 2026, December 31, 2025, and March 31, 2025, respectively.
(e)Yield presented is calculated on the basis of amortized cost excluding fair value hedge basis adjustments. The average amortized cost for securities available for sale was $41.5 billion, $42.1 billion, and $42.7 billion for the three months ended March 31, 2026, December 31, 2025, and March 31, 2025, respectively. Yield based on the fair value of securities available for sale was 3.75%, 3.90%, and 3.99% for the three months ended March 31, 2026, December 31, 2025, and March 31, 2025, respectively.
(f)A portion of long-term debt and the related interest expense is allocated to discontinued liabilities as a result of applying Key’s matched funds transfer pricing methodology to discontinued operations.
TE = Taxable Equivalent, GAAP = U.S. generally accepted accounting principles.
KeyCorp Reports First Quarter 2026 Results
April 16, 2026
Page 19
| Noninterest Expense | ||||||||||||||||||||
| (Dollars in millions) | ||||||||||||||||||||
| Three months ended | ||||||||||||||||||||
| 3/31/2026 | 12/31/2025 | 3/31/2025 | ||||||||||||||||||
Personnel (a) | $ | 743 | $ | 790 | $ | 680 | ||||||||||||||
| Net occupancy | 68 | 69 | 67 | |||||||||||||||||
| Computer processing | 111 | 106 | 107 | |||||||||||||||||
| Business services and professional fees | 36 | 61 | 40 | |||||||||||||||||
| Equipment | 19 | 22 | 20 | |||||||||||||||||
| Operating lease expense | 7 | 8 | 11 | |||||||||||||||||
| Marketing | 18 | 28 | 21 | |||||||||||||||||
| Other expense | 179 | 157 | 185 | |||||||||||||||||
| Total noninterest expense | $ | 1,181 | $ | 1,241 | $ | 1,131 | ||||||||||||||
Average full-time equivalent employees (b) | 17,469 | 17,396 | 16,989 | |||||||||||||||||
(a)Additional detail provided in Personnel Expense table below.
(b)The number of average full-time equivalent employees has not been adjusted for discontinued operations.
| Personnel Expense | ||||||||||||||||||||
| (Dollars in millions) | ||||||||||||||||||||
| Three months ended | ||||||||||||||||||||
| 3/31/2026 | 12/31/2025 | 3/31/2025 | ||||||||||||||||||
| Salaries and contract labor | $ | 439 | $ | 446 | $ | 405 | ||||||||||||||
| Incentive and stock-based compensation | 172 | 205 | 158 | |||||||||||||||||
| Employee benefits | 127 | 131 | 109 | |||||||||||||||||
| Severance | 5 | 8 | 8 | |||||||||||||||||
| Total personnel expense | $ | 743 | $ | 790 | $ | 680 | ||||||||||||||
| Loan Composition | ||||||||||||||||||||
| (Dollars in millions) | ||||||||||||||||||||
| Change 3/31/2026 vs. | ||||||||||||||||||||
| 3/31/2026 | 12/31/2025 | 3/31/2025 | 12/31/2025 | 3/31/2025 | ||||||||||||||||
Commercial and industrial (a), (b) | $ | 60,651 | $ | 57,688 | $ | 54,378 | 5.1 | % | 11.5 | % | ||||||||||
| Commercial real estate: | ||||||||||||||||||||
| Commercial mortgage | 14,144 | 13,707 | 13,239 | 3.2 | 6.8 | |||||||||||||||
| Construction | 2,801 | 2,844 | 2,929 | (1.5) | (4.4) | |||||||||||||||
| Total commercial real estate loans | 16,945 | 16,551 | 16,168 | 2.4 | 4.8 | |||||||||||||||
Commercial lease financing (b) | 2,200 | 2,270 | 2,576 | (3.1) | (14.6) | |||||||||||||||
| Total commercial loans | 79,796 | 76,509 | 73,122 | 4.3 | 9.1 | |||||||||||||||
| Real estate — residential mortgage | 18,483 | 18,732 | 19,622 | (1.3) | (5.8) | |||||||||||||||
| Home equity loans | 5,528 | 5,703 | 6,154 | (3.1) | (10.2) | |||||||||||||||
| Other consumer loans | 4,477 | 4,644 | 5,000 | (3.6) | (10.5) | |||||||||||||||
| Credit cards | 906 | 953 | 911 | (4.9) | (.5) | |||||||||||||||
| Total consumer loans | 29,394 | 30,032 | 31,687 | (2.1) | (7.2) | |||||||||||||||
Total loans (c), (d) | $ | 109,190 | $ | 106,541 | $ | 104,809 | 2.5 | % | 4.2 | % | ||||||||||
(a)Loan balances include $207 million, $205 million, and $218 million of commercial credit card balances at March 31, 2026, December 31, 2025, and March 31, 2025, respectively.
(b)Commercial and industrial includes receivables held as collateral for a secured borrowing of $192 million at March 31, 2025. Principal reductions are based on the cash payments received from these related receivables.
(c)Total loans exclude loans of $194 million at March 31, 2026, $205 million at December 31, 2025, and $243 million at March 31, 2025, related to the discontinued operations of the education lending business.
(d)Accrued interest of $443 million, $459 million, and $448 million at March 31, 2026, December 31, 2025, and March 31, 2025, respectively, presented in "other assets" on the Consolidated Balance Sheets is excluded from the amortized cost basis disclosed in this table.
| Loans Held for Sale Composition | ||||||||||||||||||||
| (Dollars in millions) | ||||||||||||||||||||
| Change 3/31/2026 vs. | ||||||||||||||||||||
| 3/31/2026 | 12/31/2025 | 3/31/2025 | 12/31/2025 | 3/31/2025 | ||||||||||||||||
| Commercial and industrial | $ | 139 | $ | 167 | $ | 252 | (16.8) | % | (44.8) | % | ||||||||||
| Real estate — commercial mortgage | 637 | 761 | 473 | (16.3) | 34.7 | |||||||||||||||
| Real estate — residential mortgage | 100 | 149 | 86 | (32.9) | 16.3 | |||||||||||||||
| Total loans held for sale | $ | 876 | $ | 1,077 | $ | 811 | (18.7) | % | 8.0 | % | ||||||||||
KeyCorp Reports First Quarter 2026 Results
April 16, 2026
Page 20
| Summary of Changes in Loans Held for Sale | |||||||||||||||||
| (Dollars in millions) | |||||||||||||||||
| 1Q26 | 4Q25 | 3Q25 | 2Q25 | 1Q25 | |||||||||||||
| Balance at beginning of period | $ | 1,077 | $ | 998 | $ | 530 | $ | 811 | $ | 797 | |||||||
| New originations | 2,034 | 3,356 | 3,471 | 1,806 | 1,840 | ||||||||||||
| Transfers from (to) held to maturity, net | (13) | (35) | — | (71) | 6 | ||||||||||||
| Loan sales | (2,201) | (3,232) | (2,956) | (2,012) | (1,695) | ||||||||||||
| Loan draws (payments), net | (25) | (10) | (42) | (1) | (138) | ||||||||||||
| Valuation and other adjustments | 4 | — | (5) | (3) | 1 | ||||||||||||
| Balance at end of period | $ | 876 | $ | 1,077 | $ | 998 | $ | 530 | $ | 811 | |||||||
| Summary of Loan and Lease Loss Experience From Continuing Operations | ||||||||||||||||||||
| (Dollars in millions) | ||||||||||||||||||||
| Three months ended | ||||||||||||||||||||
| 3/31/2026 | 12/31/2025 | 3/31/2025 | ||||||||||||||||||
| Average loans outstanding | $ | 107,737 | $ | 106,316 | $ | 104,354 | ||||||||||||||
| Allowance for loan and lease losses at the beginning of the period | $ | 1,427 | $ | 1,444 | $ | 1,409 | ||||||||||||||
| Loans charged off: | ||||||||||||||||||||
| Commercial and industrial | 90 | 69 | 62 | |||||||||||||||||
| Real estate — commercial mortgage | 1 | 25 | 36 | |||||||||||||||||
| Real estate — construction | — | — | — | |||||||||||||||||
| Total commercial real estate loans | 1 | 25 | 36 | |||||||||||||||||
| Commercial lease financing | — | 4 | — | |||||||||||||||||
| Total commercial loans | 91 | 98 | 98 | |||||||||||||||||
| Real estate — residential mortgage | — | 1 | 1 | |||||||||||||||||
| Home equity loans | 1 | 1 | 1 | |||||||||||||||||
| Other consumer loans | 15 | 14 | 14 | |||||||||||||||||
| Credit cards | 10 | 10 | 12 | |||||||||||||||||
| Total consumer loans | 26 | 26 | 28 | |||||||||||||||||
| Total loans charged off | 117 | 124 | 126 | |||||||||||||||||
| Recoveries: | ||||||||||||||||||||
| Commercial and industrial | 10 | 7 | 10 | |||||||||||||||||
| Real estate — commercial mortgage | — | 6 | — | |||||||||||||||||
| Real estate — construction | — | — | — | |||||||||||||||||
| Total commercial real estate loans | — | 6 | — | |||||||||||||||||
| Commercial lease financing | — | — | — | |||||||||||||||||
| Total commercial loans | 10 | 13 | 10 | |||||||||||||||||
| Real estate — residential mortgage | 1 | 1 | 1 | |||||||||||||||||
| Home equity loans | 1 | 1 | 1 | |||||||||||||||||
| Other consumer loans | 2 | 2 | 2 | |||||||||||||||||
| Credit cards | 2 | 3 | 2 | |||||||||||||||||
| Total consumer loans | 6 | 7 | 6 | |||||||||||||||||
| Total recoveries | 16 | 20 | 16 | |||||||||||||||||
| Net loan charge-offs | (101) | (104) | (110) | |||||||||||||||||
| Provision (credit) for loan and lease losses | 123 | 87 | 130 | |||||||||||||||||
| Allowance for loan and lease losses at end of period | $ | 1,449 | $ | 1,427 | $ | 1,429 | ||||||||||||||
| Liability for credit losses on lending-related commitments at beginning of period | $ | 313 | $ | 292 | $ | 290 | ||||||||||||||
| Provision (credit) for losses on lending-related commitments | (17) | 21 | (12) | |||||||||||||||||
Liability for credit losses on lending-related commitments at end of period (a) | $ | 296 | $ | 313 | $ | 278 | ||||||||||||||
| Total allowance for credit losses at end of period | $ | 1,745 | $ | 1,740 | $ | 1,707 | ||||||||||||||
| Net loan charge-offs to average total loans | .38 | % | .39 | % | .43 | % | ||||||||||||||
| Allowance for loan and lease losses to period-end loans | 1.33 | 1.34 | 1.36 | |||||||||||||||||
| Allowance for credit losses to period-end loans | 1.60 | 1.63 | 1.63 | |||||||||||||||||
| Allowance for loan and lease losses to nonperforming loans | 212 | 232 | 208 | |||||||||||||||||
| Allowance for credit losses to nonperforming loans | 256 | 283 | 249 | |||||||||||||||||
| Discontinued operations — education lending business: | ||||||||||||||||||||
| Loans charged off | $ | 1 | $ | 1 | $ | 1 | ||||||||||||||
| Recoveries | — | — | — | |||||||||||||||||
| Net loan charge-offs | $ | (1) | $ | (1) | $ | (1) | ||||||||||||||
(a)Included in "Accrued expense and other liabilities" on the balance sheet.
KeyCorp Reports First Quarter 2026 Results
April 16, 2026
Page 21
| Asset Quality Statistics From Continuing Operations | |||||||||||||||||
| (Dollars in millions) | |||||||||||||||||
| 1Q26 | 4Q25 | 3Q25 | 2Q25 | 1Q25 | |||||||||||||
| Net loan charge-offs | $ | 101 | $ | 104 | $ | 114 | $ | 102 | $ | 110 | |||||||
| Net loan charge-offs to average total loans | .38 | % | .39 | % | .42 | % | .39 | % | .43 | % | |||||||
| Allowance for loan and lease losses | $ | 1,449 | $ | 1,427 | $ | 1,444 | $ | 1,446 | $ | 1,429 | |||||||
Allowance for credit losses (a) | 1,745 | 1,740 | 1,736 | 1,743 | 1,707 | ||||||||||||
| Allowance for loan and lease losses to period-end loans | 1.33 | % | 1.34 | % | 1.36 | % | 1.36 | % | 1.36 | % | |||||||
| Allowance for credit losses to period-end loans | 1.60 | 1.63 | 1.64 | 1.64 | 1.63 | ||||||||||||
| Allowance for loan and lease losses to nonperforming loans | 212 | 232 | 219 | 208 | 208 | ||||||||||||
| Allowance for credit losses to nonperforming loans | 256 | 283 | 264 | 250 | 249 | ||||||||||||
| Nonperforming loans at period end | $ | 682 | $ | 615 | $ | 658 | $ | 696 | $ | 686 | |||||||
| Nonperforming assets at period end | 692 | 627 | 668 | 707 | 700 | ||||||||||||
| Nonperforming loans to period-end portfolio loans | .62 | % | .58 | % | .62 | % | .65 | % | .65 | % | |||||||
Nonperforming assets to period-end portfolio loans plus OREO and other nonperforming assets | .63 | .59 | .63 | .66 | .67 | ||||||||||||
(a)Includes the allowance for loan and lease losses plus the liability for credit losses on lending-related commitments.
| Summary of Nonperforming Assets and Past Due Loans From Continuing Operations | |||||||||||||||||
| (Dollars in millions) | |||||||||||||||||
| 3/31/2026 | 12/31/2025 | 9/30/2025 | 6/30/2025 | 3/31/2025 | |||||||||||||
| Commercial and industrial | $ | 284 | $ | 256 | $ | 253 | $ | 280 | $ | 288 | |||||||
| Real estate — commercial mortgage | 190 | 157 | 214 | 226 | 206 | ||||||||||||
| Real estate — construction | — | — | — | — | — | ||||||||||||
| Total commercial real estate loans | 190 | 157 | 214 | 226 | 206 | ||||||||||||
| Commercial lease financing | 6 | 7 | — | — | — | ||||||||||||
| Total commercial loans | 480 | 420 | 467 | 506 | 494 | ||||||||||||
| Real estate — residential mortgage | 115 | 104 | 98 | 95 | 94 | ||||||||||||
| Home equity loans | 76 | 80 | 82 | 84 | 87 | ||||||||||||
| Other Consumer loans | 4 | 4 | 4 | 4 | 4 | ||||||||||||
| Credit cards | 7 | 7 | 7 | 7 | 7 | ||||||||||||
| Total consumer loans | 202 | 195 | 191 | 190 | 192 | ||||||||||||
Total nonperforming loans (a) | 682 | 615 | 658 | 696 | 686 | ||||||||||||
| OREO | 10 | 9 | 10 | 11 | 14 | ||||||||||||
| Nonperforming loans held for sale | — | 3 | — | — | — | ||||||||||||
| Total nonperforming assets | $ | 692 | $ | 627 | $ | 668 | $ | 707 | $ | 700 | |||||||
| Accruing loans past due 90 days or more | $ | 153 | $ | 99 | $ | 110 | $ | 74 | $ | 86 | |||||||
| Accruing loans past due 30 through 89 days | 137 | 220 | 254 | 266 | 281 | ||||||||||||
| Nonperforming assets from discontinued operations — education lending business | 2 | 2 | 2 | 2 | 1 | ||||||||||||
| Nonperforming loans to period-end portfolio loans | .62 | % | .58 | % | .62 | % | .65 | % | .65 | % | |||||||
Nonperforming assets to period-end portfolio loans plus OREO and other nonperforming assets | .63 | .59 | .63 | .66 | .67 | ||||||||||||
| Summary of Changes in Nonperforming Loans From Continuing Operations | |||||||||||||||||
| (Dollars in millions) | |||||||||||||||||
| 1Q26 | 4Q25 | 3Q25 | 2Q25 | 1Q25 | |||||||||||||
| Balance at beginning of period | $ | 615 | $ | 658 | $ | 696 | $ | 686 | $ | 758 | |||||||
| Loans placed on nonaccrual status | 253 | 248 | 210 | 233 | 170 | ||||||||||||
| Charge-offs | (117) | (124) | (140) | (127) | (126) | ||||||||||||
| Loans sold | (2) | (7) | (13) | — | — | ||||||||||||
| Payments | (37) | (124) | (68) | (74) | (57) | ||||||||||||
| Transfers to OREO | (1) | (1) | (1) | (1) | (2) | ||||||||||||
| Loans returned to accrual status | (29) | (35) | (26) | (21) | (57) | ||||||||||||
| Balance at end of period | $ | 682 | $ | 615 | $ | 658 | $ | 696 | $ | 686 | |||||||
KeyCorp Reports First Quarter 2026 Results
April 16, 2026
Page 22
| Line of Business Results | ||||||||||||||||||||||||||
| (Dollars in millions) | ||||||||||||||||||||||||||
| Change 1Q26 vs. | ||||||||||||||||||||||||||
| 1Q26 | 4Q25 | 3Q25 | 2Q25 | 1Q25 | 4Q25 | 1Q25 | ||||||||||||||||||||
| Consumer Bank | ||||||||||||||||||||||||||
| Summary of operations | ||||||||||||||||||||||||||
| Total revenue (TE) | $ | 978 | $ | 998 | $ | 992 | $ | 967 | $ | 932 | (2.0) | % | 4.9 | % | ||||||||||||
| Provision for credit losses | 40 | 32 | 40 | 55 | 43 | 25.0 | (7.0) | |||||||||||||||||||
| Noninterest expense | 709 | 734 | 693 | 694 | 675 | (3.4) | 5.0 | |||||||||||||||||||
| Net income (loss) attributable to Key | 173 | 176 | 196 | 165 | 163 | (1.7) | 6.1 | |||||||||||||||||||
| Average loans and leases | 34,005 | 34,683 | 35,363 | 36,137 | 36,819 | (2.0) | (7.6) | |||||||||||||||||||
| Average deposits | 87,796 | 87,738 | 87,692 | 88,002 | 88,306 | .1 | (.6) | |||||||||||||||||||
| Net loan charge-offs | 40 | 49 | 49 | 40 | 52 | (18.4) | (23.1) | |||||||||||||||||||
| Net loan charge-offs to average total loans | .48 | % | .56 | % | .55 | % | .44 | % | .57 | % | (14.3) | (15.8) | ||||||||||||||
| Nonperforming assets at period end | $ | 270 | $ | 262 | $ | 266 | $ | 269 | $ | 278 | 3.1 | (2.9) | ||||||||||||||
| Return on average allocated equity | 24.76 | % | 24.24 | % | 26.03 | % | 21.91 | % | 21.28 | % | 2.1 | 16.4 | ||||||||||||||
| Commercial Bank | ||||||||||||||||||||||||||
| Summary of operations | ||||||||||||||||||||||||||
| Total revenue (TE) | $ | 1,117 | $ | 1,194 | $ | 1,114 | $ | 1074 | $ | 1047 | (6.4) | % | 6.7 | % | ||||||||||||
| Provision for credit losses | 70 | 73 | 68 | 84 | 75 | (4.1) | N/M | |||||||||||||||||||
| Noninterest expense | 474 | 515 | 485 | 451 | 464 | (8.0) | 2.2 | |||||||||||||||||||
| Net income (loss) attributable to Key | 451 | 472 | 440 | 423 | 399 | (4.4) | 13.0 | |||||||||||||||||||
| Average loans and leases | 73,146 | 71,107 | 70,328 | 69,089 | 67,058 | 2.9 | 9.1 | |||||||||||||||||||
| Average loans held for sale | 958 | 1,140 | 1,224 | 707 | 754 | (16.0) | 27.1 | |||||||||||||||||||
| Average deposits | 58,929 | 60,485 | 58,523 | 55,927 | 57,481 | (2.6) | 2.5 | |||||||||||||||||||
| Net loan charge-offs | 64 | 53 | 64 | 62 | 57 | 20.8 | 12.3 | |||||||||||||||||||
| Net loan charge-offs to average total loans | .35 | % | .30 | % | .36 | % | .36 | % | .34 | % | 16.7 | 2.9 | ||||||||||||||
| Nonperforming assets at period end | $ | 422 | $ | 365 | $ | 402 | $ | 438 | $ | 422 | 15.6 | — | ||||||||||||||
| Return on average allocated equity | 18.10 | % | 18.80 | % | 17.83 | % | 17.55 | % | 17.16 | % | (3.7) | 5.5 | ||||||||||||||
TE = Taxable Equivalent; N/M = Not Meaningful
| Selected Items Impact on Earnings | |||||||||||
| (Dollars in millions, except per share amounts) | |||||||||||
Pretax(a) | After-tax at marginal rate(a) | ||||||||||
| Quarter to date results | Amount | Net Income | EPS(b), (d) | ||||||||
| Three months ended March 31, 2026 | |||||||||||
| No items | $ | — | $ | — | $ | — | |||||
| Three months ended December 31, 2025 | |||||||||||
FDIC special assessment (other expense)(c) | 21 | 16 | 0.01 | ||||||||
| Three months ended September 30, 2025 | |||||||||||
FDIC special assessment (other expense)(c) | 5 | 4 | — | ||||||||
| Three months ended June 30, 2025 | |||||||||||
| No items | — | — | — | ||||||||
| Three months ended March 31, 2025 | |||||||||||
| No items | — | — | — | ||||||||
(a)Favorable (unfavorable) impact.
(b)Impact to EPS reflected on a fully diluted basis.
(c)In November 2023, the FDIC issued a final rule implementing a special assessment on insured depository institutions to recover the loss to the FDIC’s deposit insurance fund (DIF) associated with protecting uninsured depositors following the 2023 closures of Silicon Valley Bank and Signature Bank. KeyCorp recorded the initial loss estimate related to the special assessment during the fourth quarter of 2023. Amounts reflected in this table represent adjustments from initial estimates based on quarterly invoices received from the FDIC.
(d)Earnings per share may not foot due to rounding.

KeyCorp First Quarter 2026 Earnings Review April 16, 2026 Chris Gorman Chairman and Chief Executive Officer Clark Khayat Chief Financial Officer
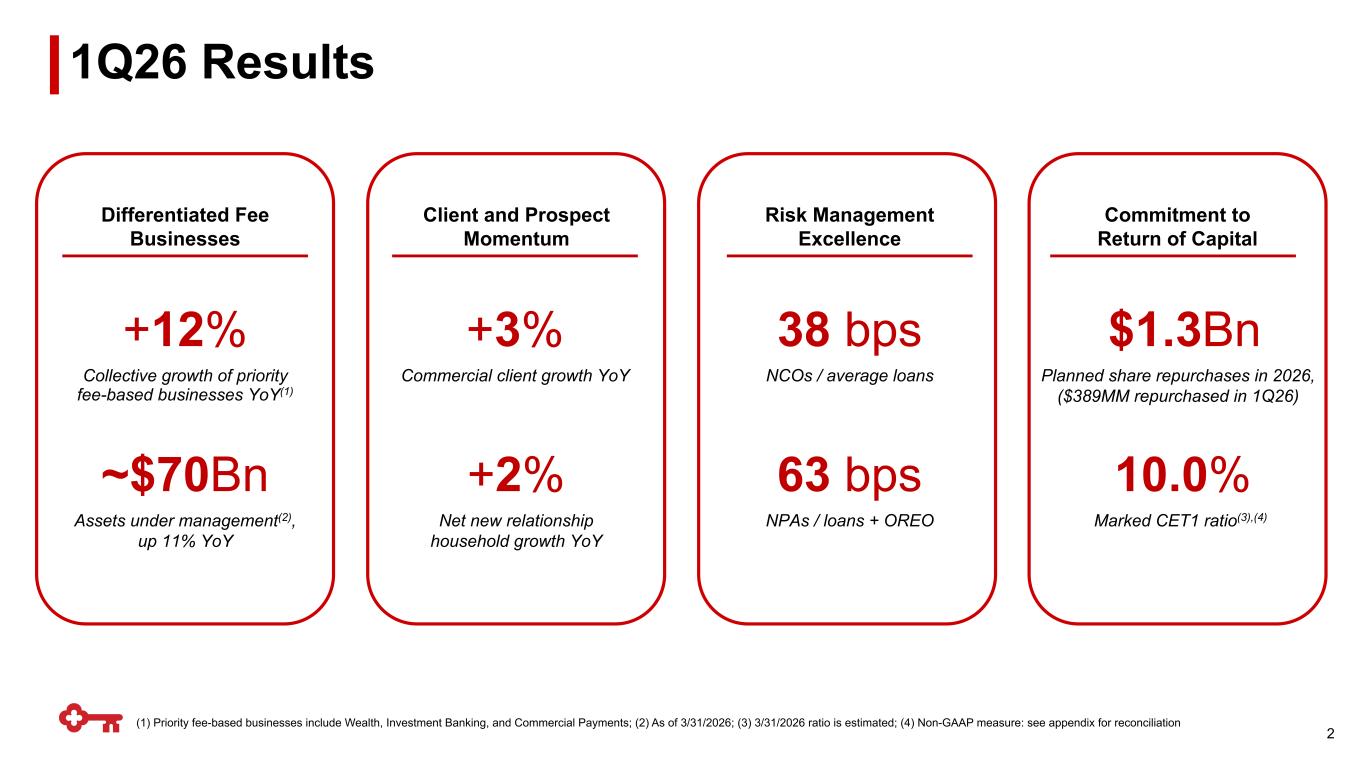
10.0% Marked CET1 ratio(3),(4) 1Q26 Results +12% Collective growth of priority fee-based businesses YoY(1) ~$70Bn Assets under management(2), up 11% YoY Differentiated Fee Businesses +3% Commercial client growth YoY Client and Prospect Momentum Commitment to Return of Capital Risk Management Excellence 63 bps NPAs / loans + OREO 38 bps NCOs / average loans 2 (1) Priority fee-based businesses include Wealth, Investment Banking, and Commercial Payments; (2) As of 3/31/2026; (3) 3/31/2026 ratio is estimated; (4) Non-GAAP measure: see appendix for reconciliation $1.3Bn Planned share repurchases in 2026, ($389MM repurchased in 1Q26) +2% Net new relationship household growth YoY

Financial Review
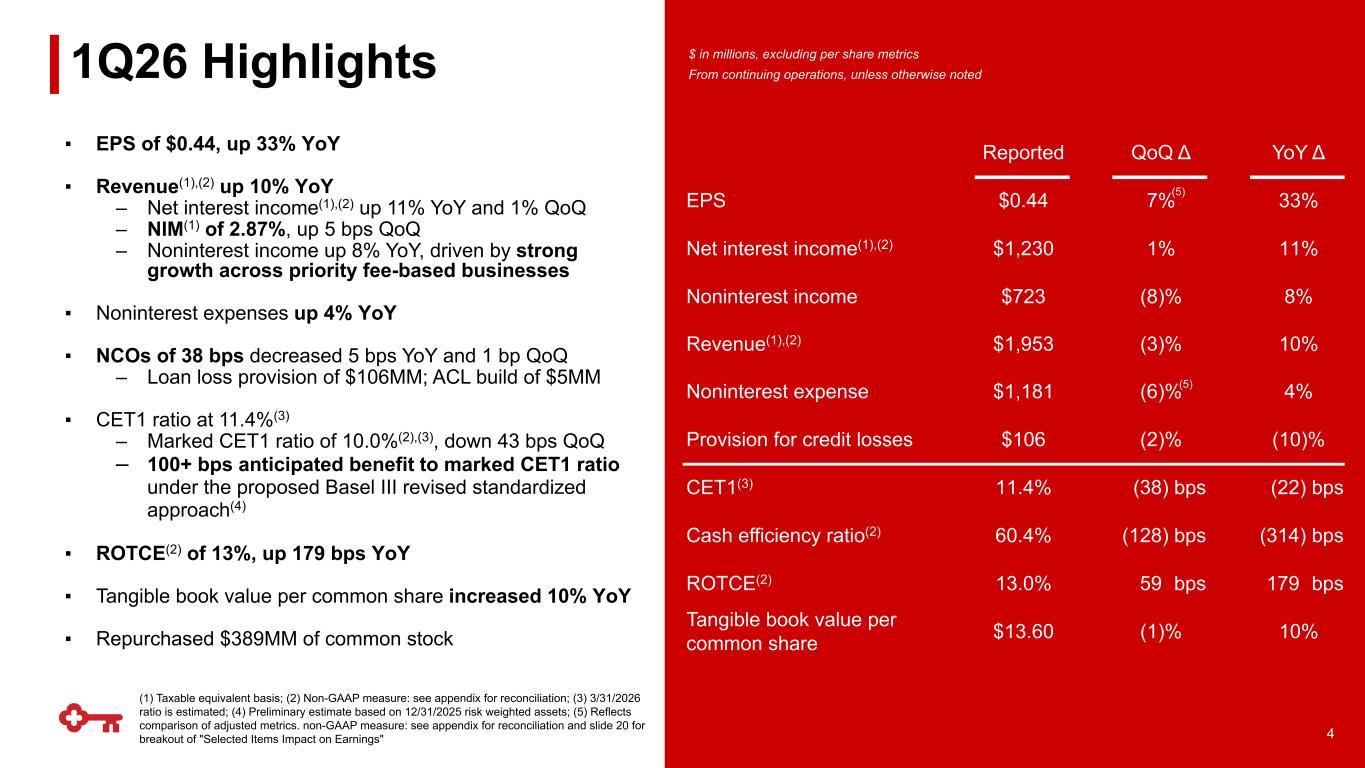
▪ EPS of $0.44, up 33% YoY ▪ Revenue(1),(2) up 10% YoY – Net interest income(1),(2) up 11% YoY and 1% QoQ – NIM(1) of 2.87%, up 5 bps QoQ – Noninterest income up 8% YoY, driven by strong growth across priority fee-based businesses ▪ Noninterest expenses up 4% YoY ▪ NCOs of 38 bps decreased 5 bps YoY and 1 bp QoQ – Loan loss provision of $106MM; ACL build of $5MM ▪ CET1 ratio at 11.4%(3) – Marked CET1 ratio of 10.0%(2),(3), down 43 bps QoQ – 100+ bps anticipated benefit to marked CET1 ratio under the proposed Basel III revised standardized approach(4) ▪ ROTCE(2) of 13%, up 179 bps YoY ▪ Tangible book value per common share increased 10% YoY ▪ Repurchased $389MM of common stock Adjusted Noninterest Expense $1,262(2) 1Q26 Highlights $ in millions, excluding per share metrics From continuing operations, unless otherwise noted Reported QoQ Δ YoY Δ EPS $0.44 7% 33% Net interest income(1),(2) $1,230 1% 11% Noninterest income $723 (8)% 8% Revenue(1),(2) $1,953 (3)% 10% Noninterest expense $1,181 (6)% 4% Provision for credit losses $106 (2)% (10)% CET1(3) 11.4% (38) bps (22) bps Cash efficiency ratio(2) 60.4% (128) bps (314) bps ROTCE(2) 13.0% 59 bps 179 bps Tangible book value per common share $13.60 (1)% 10% 4 (1) Taxable equivalent basis; (2) Non-GAAP measure: see appendix for reconciliation; (3) 3/31/2026 ratio is estimated; (4) Preliminary estimate based on 12/31/2025 risk weighted assets; (5) Reflects comparison of adjusted metrics. non-GAAP measure: see appendix for reconciliation and slide 20 for breakout of "Selected Items Impact on Earnings" (5) (5)
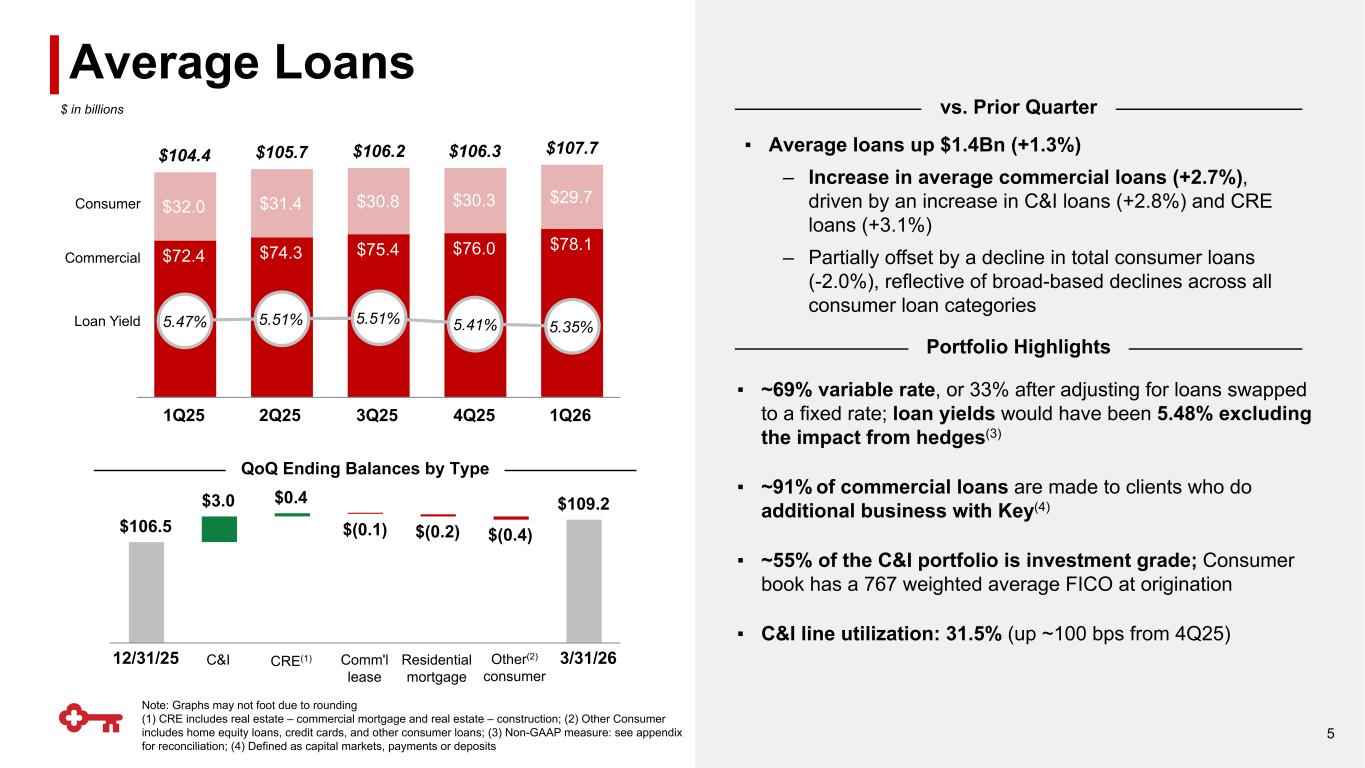
$106.5 $3.0 $0.4 $(0.1) $(0.2) $(0.4) $109.2 12/31/25 C&I CRE Comm'l lease Residential mortgage Other consumer 3/31/26 ▪ ~69% variable rate, or 33% after adjusting for loans swapped to a fixed rate; loan yields would have been 5.48% excluding the impact from hedges(3) ▪ ~91% of commercial loans are made to clients who do additional business with Key(4) ▪ ~55% of the C&I portfolio is investment grade; Consumer book has a 767 weighted average FICO at origination ▪ C&I line utilization: 31.5% (up ~100 bps from 4Q25) ▪ Average loans up $1.4Bn (+1.3%) – Increase in average commercial loans (+2.7%), driven by an increase in C&I loans (+2.8%) and CRE loans (+3.1%) – Partially offset by a decline in total consumer loans (-2.0%), reflective of broad-based declines across all consumer loan categories vs. Prior Quarter Portfolio Highlights Note: Graphs may not foot due to rounding (1) CRE includes real estate – commercial mortgage and real estate – construction; (2) Other Consumer includes home equity loans, credit cards, and other consumer loans; (3) Non-GAAP measure: see appendix for reconciliation; (4) Defined as capital markets, payments or deposits Average Loans Consumer Commercial Loan Yield $ in billions QoQ Ending Balances by Type 5 $104.4 $105.7 $106.2 $106.3 $107.7 $72.4 $74.3 $75.4 $76.0 $78.1 $32.0 $31.4 $30.8 $30.3 $29.7 5.47% 5.51% 5.51% 5.41% 5.35% 1Q25 2Q25 3Q25 4Q25 1Q26 12/ / 5 (2) consumer CRE(1) /31/26
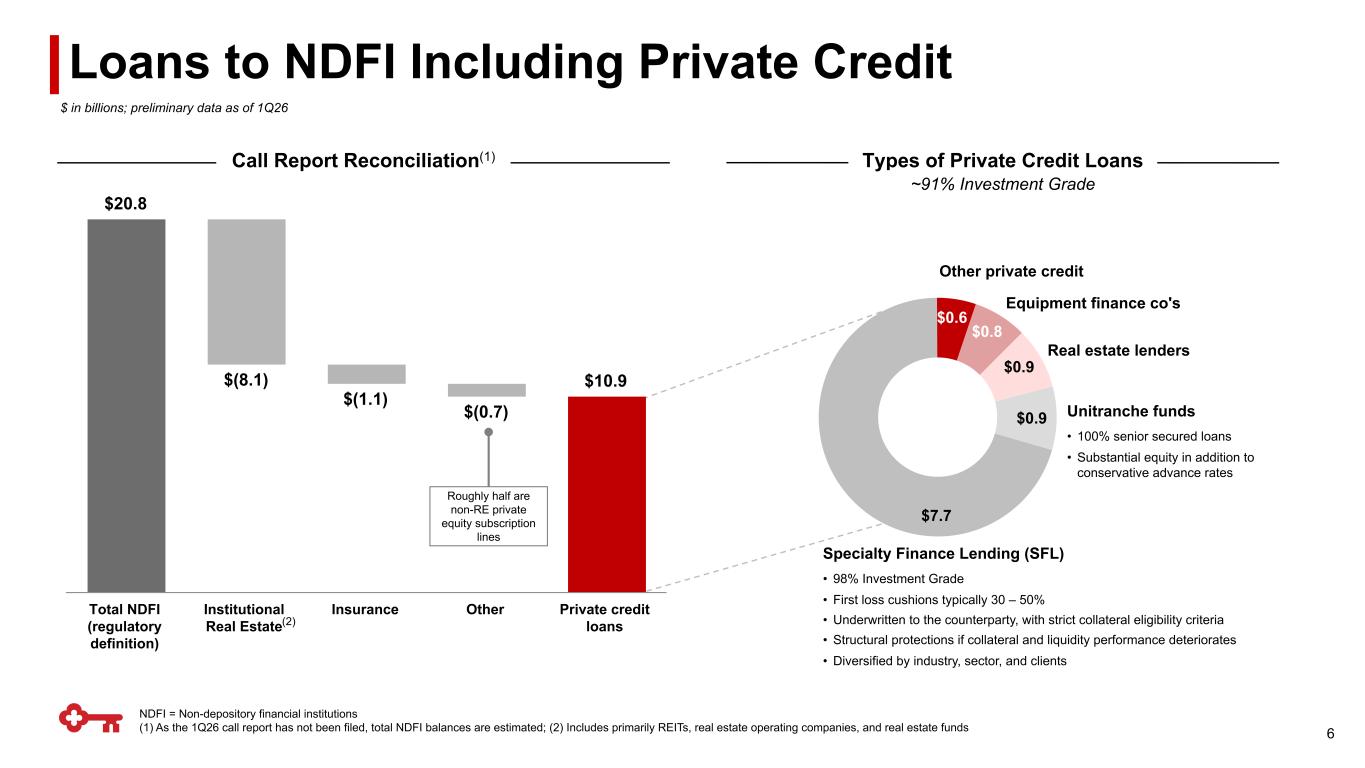
NDFI = Non-depository financial institutions (1) As the 1Q26 call report has not been filed, total NDFI balances are estimated; (2) Includes primarily REITs, real estate operating companies, and real estate funds $7.7 $0.6 $0.8 $0.9 $0.9 Unitranche funds Other private credit 6 Real estate lenders Specialty Finance Lending (SFL) Equipment finance co's $ in billions; preliminary data as of 1Q26 Types of Private Credit Loans Subset Call Report Reconciliation(1) Loans to NDFI Including Private Credit ~91% Investm nt Grade $20.8 $(8.1) $(1.1) $(0.7) $10.9 Total NDFI (regulatory definition) Institutional Real Estate Insurance Other Private credit loans Roughly half are non-RE private equity subscription lines • 98% Investment Grade • First loss cushions typically 30 – 50% • Underwritten to the counterparty, with strict collateral eligibility criteria • Structural protections if collateral and liquidity performance deteriorates • Diversified by industry, sector, and clients (2)) • 100% senior secured loans • Substantial equity in addition to conservative advance rates
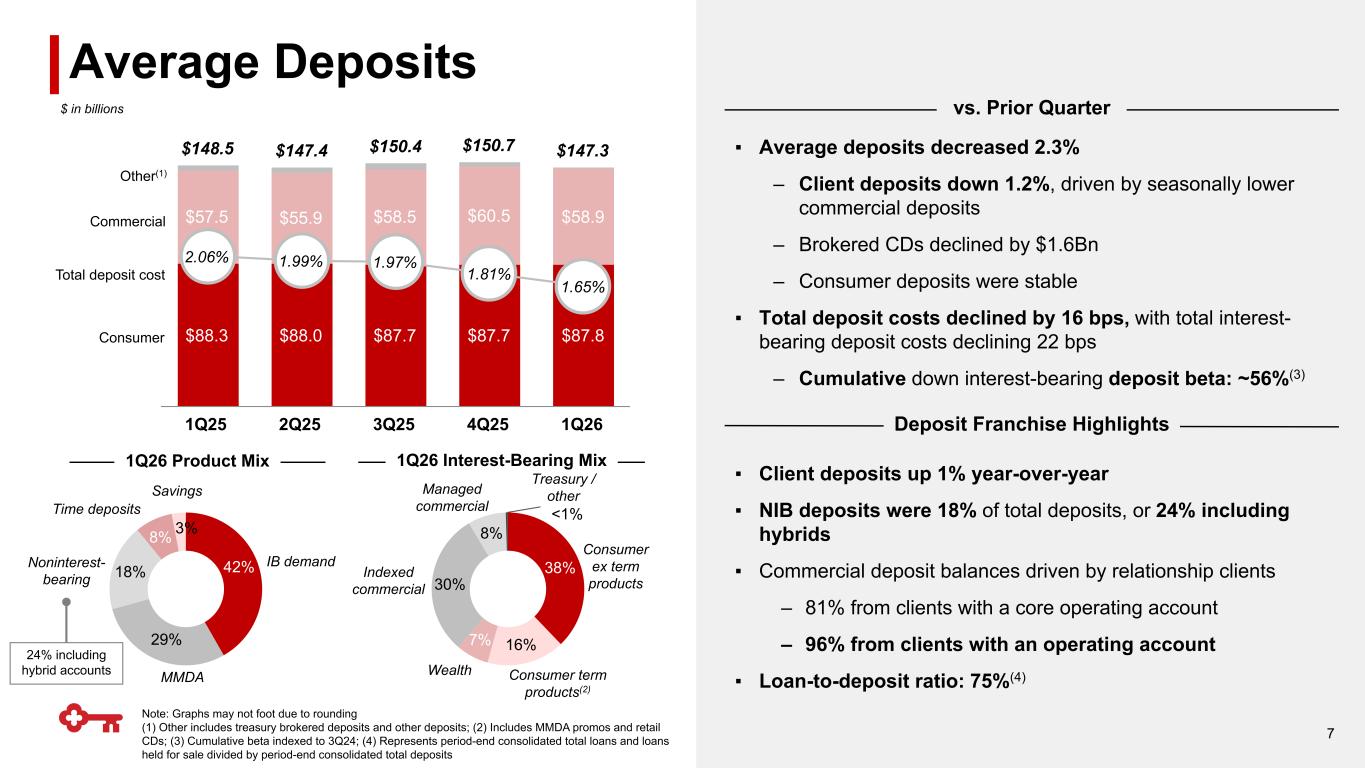
▪ Average deposits decreased 2.3% – Client deposits down 1.2%, driven by seasonally lower commercial deposits – Brokered CDs declined by $1.6Bn – Consumer deposits were stable ▪ Total deposit costs declined by 16 bps, with total interest- bearing deposit costs declining 22 bps – Cumulative down interest-bearing deposit beta: ~56%(3) 38% 16%7% 30% 8% 0% 42% 29% 18% 8% 3% vs. Prior Quarter Deposit Franchise Highlights ▪ Client deposits up 1% year-over-year ▪ NIB deposits were 18% of total deposits, or 24% including hybrids ▪ Commercial deposit balances driven by relationship clients – 81% from clients with a core operating account – 96% from clients with an operating account ▪ Loan-to-deposit ratio: 75%(4) 1Q26 Product Mix Time deposits Savings Noninterest- bearing IB demand 1Q26 Interest-Bearing Mix Consumer ex term products <1% MMDA Managed commercial Indexed commercial Wealth Average Deposits Consumer Other(1) Commercial Total deposit cost Consumer term products(2) Note: Graphs may not foot due to rounding (1) Other includes treasury brokered deposits and other deposits; (2) Includes MMDA promos and retail CDs; (3) Cumulative beta indexed to 3Q24; (4) Represents period-end consolidated total loans and loans held for sale divided by period-end consolidated total deposits 24% including hybrid accounts Treasury / other 7 $148.5 $147.4 $150.4 $150.7 $147.3 $88.3 $88.0 $87.7 $87.7 $87.8 $57.5 $55.9 $58.5 $60.5 $58.9 2.06% 1.99% 1.97% 1.81% 1.65% 1Q25 2Q25 3Q25 4Q25 1Q26 $ in billions
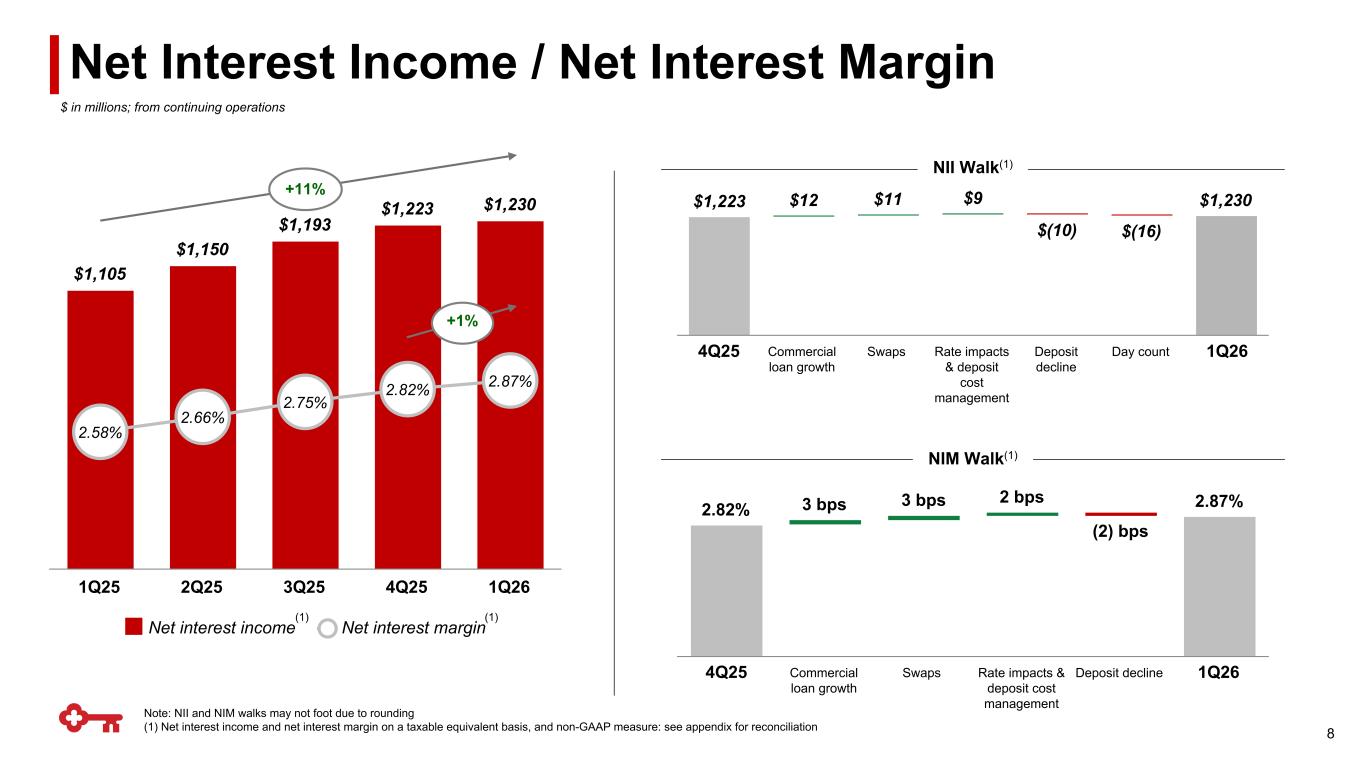
$1,223 $12 $11 $9 $(10) $(16) $1,230 Commercial loan growth Swaps Rate impacts & deposit cost management Deposit decline Day count $1,105 $1,150 $1,193 $1,223 $1,230 2.58% 2.66% 2.75% 2.82% 2.87% Net interest income Net interest margin 1Q25 2Q25 3Q25 4Q25 1Q26 Note: NII and NIM walks may not foot due to rounding (1) Net interest income and net interest margin on a taxable equivalent basis, and non-GAAP measure: see appendix for reconciliation Net Interest Income / Net Interest Margin +1% +11% NII Walk(1) NIM Walk(1) 8 2.82% 3 bps 3 bps 2 bps (2) bps 2.87% Commercial loan growth Swaps Rate impacts & deposit cost management Deposit decline $ in millions; from continuing operations 4Q25 1Q26 4Q25 1Q26 (1))(1)
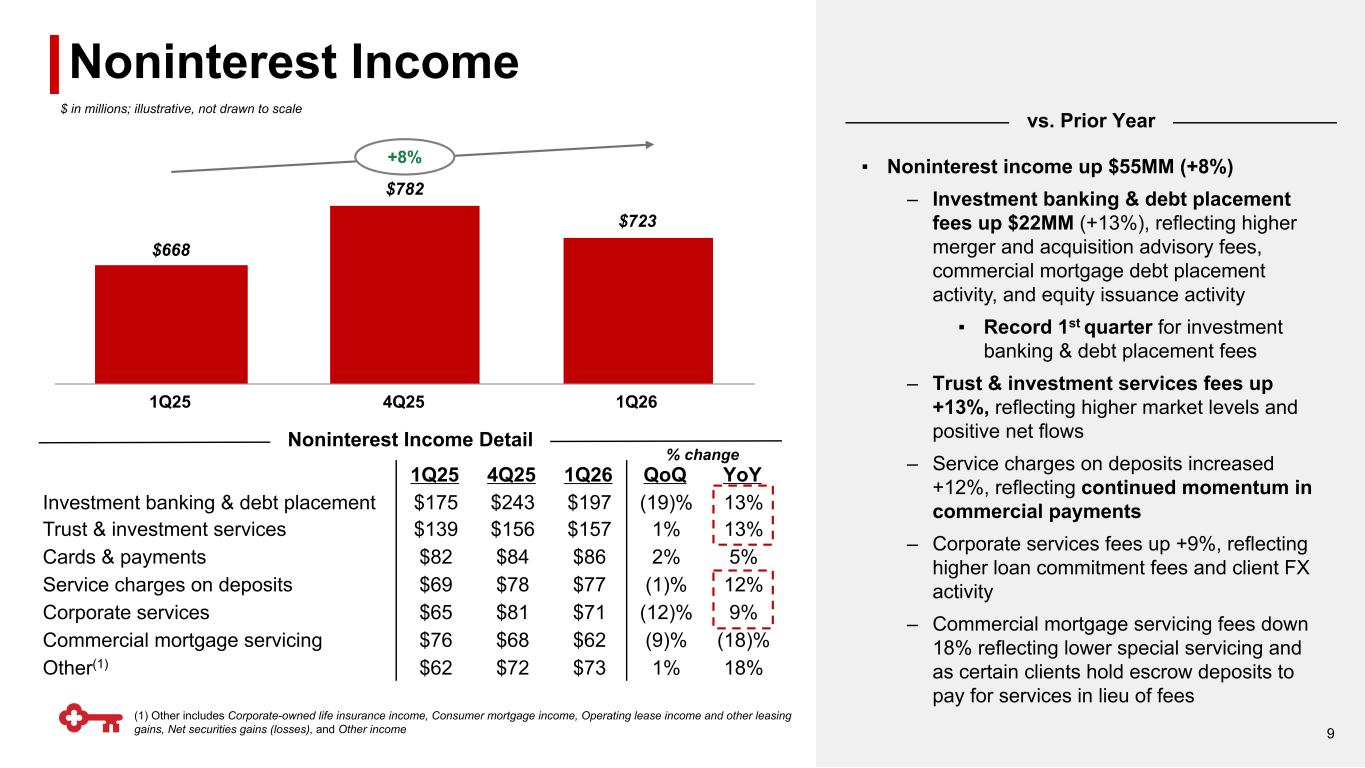
$668 $782 $723 1Q25 4Q25 1Q26 1Q25 4Q25 1Q26 QoQ YoY Investment banking & debt placement $175 $243 $197 (19)% 13% Trust & investment services $139 $156 $157 1% 13% Cards & payments $82 $84 $86 2% 5% Service charges on deposits $69 $78 $77 (1)% 12% Corporate services $65 $81 $71 (12)% 9% Commercial mortgage servicing $76 $68 $62 (9)% (18)% Other(1) $62 $72 $73 1% 18% (1) Other includes Corporate-owned life insurance income, Consumer mortgage income, Operating lease income and other leasing gains, Net securities gains (losses), and Other income Noninterest Income Noninterest Income Detail % change vs. Prior Year 9 $ in millions; illustrative, not drawn to scale +8% ▪ Noninterest income up $55MM (+8%) – Investment banking & debt placement fees up $22MM (+13%), reflecting higher merger and acquisition advisory fees, commercial mortgage debt placement activity, and equity issuance activity ▪ Record 1st quarter for investment banking & debt placement fees – Trust & investment services fees up +13%, reflecting higher market levels and positive net flows – Service charges on deposits increased +12%, reflecting continued momentum in commercial payments – Corporate services fees up +9%, reflecting higher loan commitment fees and client FX activity – Commercial mortgage servicing fees down 18% reflecting lower special servicing and as certain clients hold escrow deposits to pay for services in lieu of fees
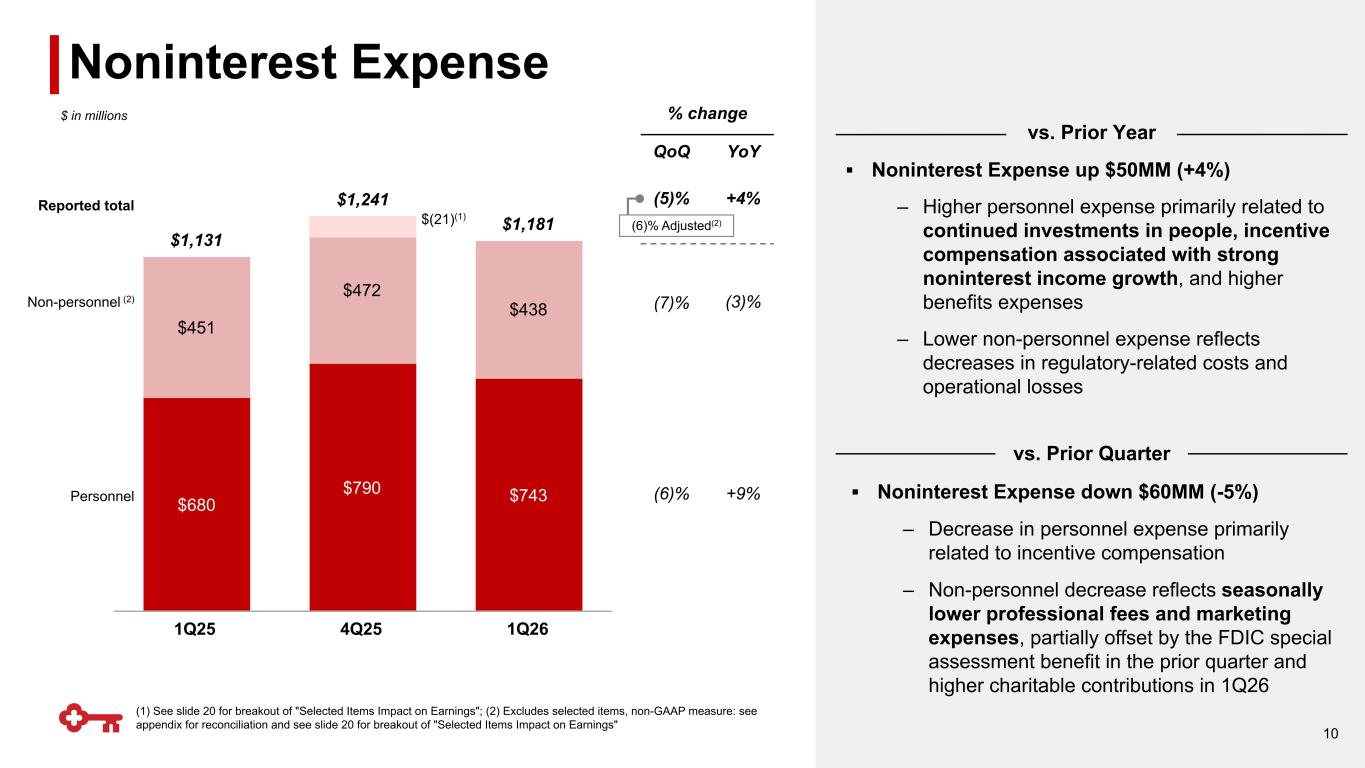
$1,131 $1,241 $1,181 $680 $790 $743 $451 $472 $438 1Q25 4Q25 1Q26 ▪ Noninterest Expense up $50MM (+4%) – Higher personnel expense primarily related to continued investments in people, incentive compensation associated with strong noninterest income growth, and higher benefits expenses – Lower non-personnel expense reflects decreases in regulatory-related costs and operational losses (3)% Personnel Non-personnel (2) YoY +9% +4% QoQ (7)% (6)% (5)% $ in millions Noninterest Expense vs. Prior Quarter % change vs. Prior Year (1) See slide 20 for breakout of "Selected Items Impact on Earnings"; (2) Excludes selected items, non-GAAP measure: see appendix for reconciliation and see slide 20 for breakout of "Selected Items Impact on Earnings" 10 $(21)(1) 1Q26 Notable Expenses ▪ Pull forward of $25MM charitable contribution originally planned in back half of the year Reported total ▪ Noninterest Expense down $60MM (-5%) – Decrease in personnel expense primarily related to incentive compensation – Non-personnel decrease reflects seasonally lower professional fees and marketing expenses, partially offset by the FDIC special assessment benefit in the prior quarter and higher charitable contributions in 1Q26 1Q26 Notable Expenses: $25MM charitable contribution pulled forward, originally planned in back half of the year (6)% Adjusted(2)
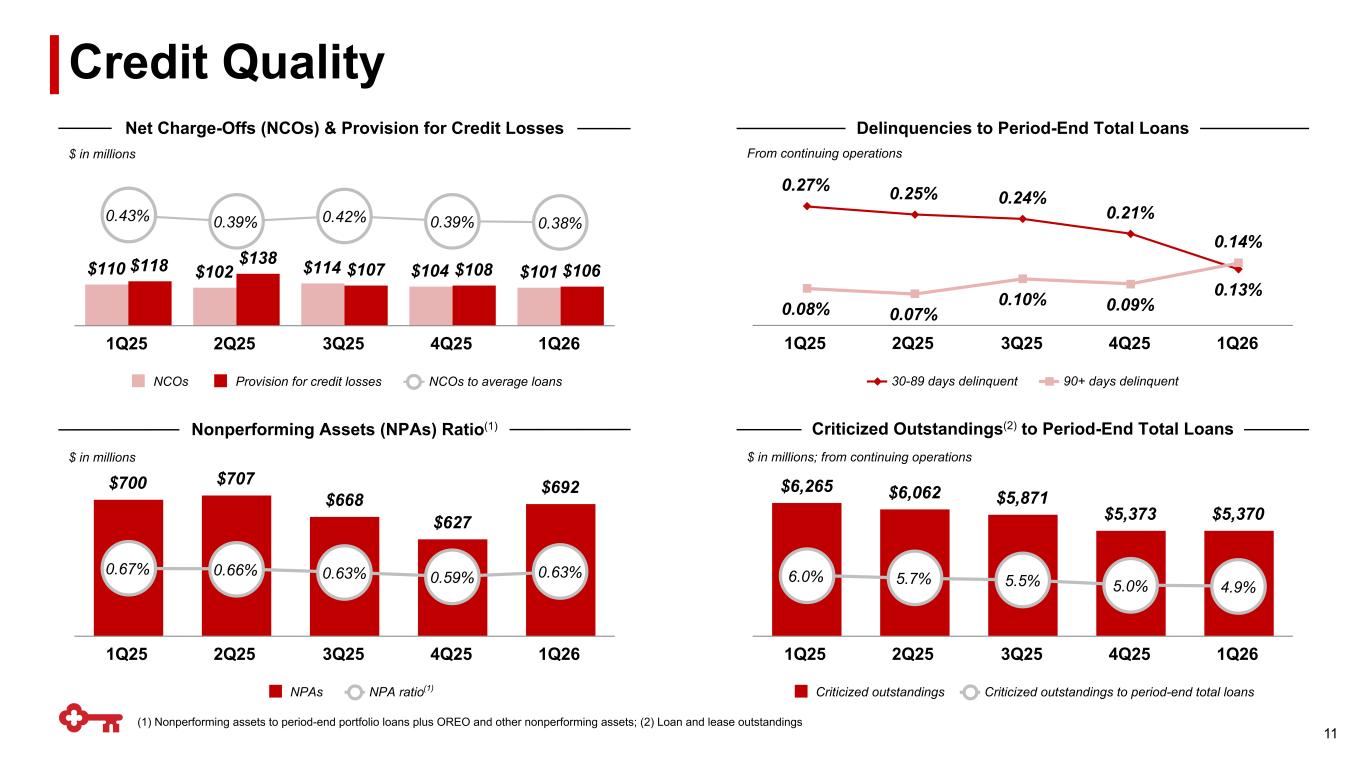
0.27% 0.25% 0.24% 0.21% 0.13% 0.08% 0.07% 0.10% 0.09% 0.14% 30-89 days delinquent 90+ days delinquent 1Q25 2Q25 3Q25 4Q25 1Q26 $6,265 $6,062 $5,871 $5,373 $5,370 6.0% 5.7% 5.5% 5.0% 4.9% Criticized outstandings Criticized outstandings to period-end total loans 1Q25 2Q25 3Q25 4Q25 1Q26 $700 $707 $668 $627 $692 0.67% 0.66% 0.63% 0.59% 0.63% NPAs NPA ratio 1Q25 2Q25 3Q25 4Q25 1Q26 (1) Nonperforming assets to period-end portfolio loans plus OREO and other nonperforming assets; (2) Loan and lease outstandings $ in millions Net Charge-Offs (NCOs) & Provision for Credit Losses Delinquencies to Period-End Total Loans Criticized Outstandings(2) to Period-End Total Loans $ in millions; from continuing operations Nonperforming Assets (NPAs) Ratio(1) $ in millions Credit Quality From continuing operations 11 $110 $102 $114 $104 $101$118 $138 $107 $108 $106 0.43% 0.39% 0.42% 0.39% 0.38% NCOs Provision for credit losses NCOs to average loans 1Q25 2Q25 3Q25 4Q25 1Q26 (1)
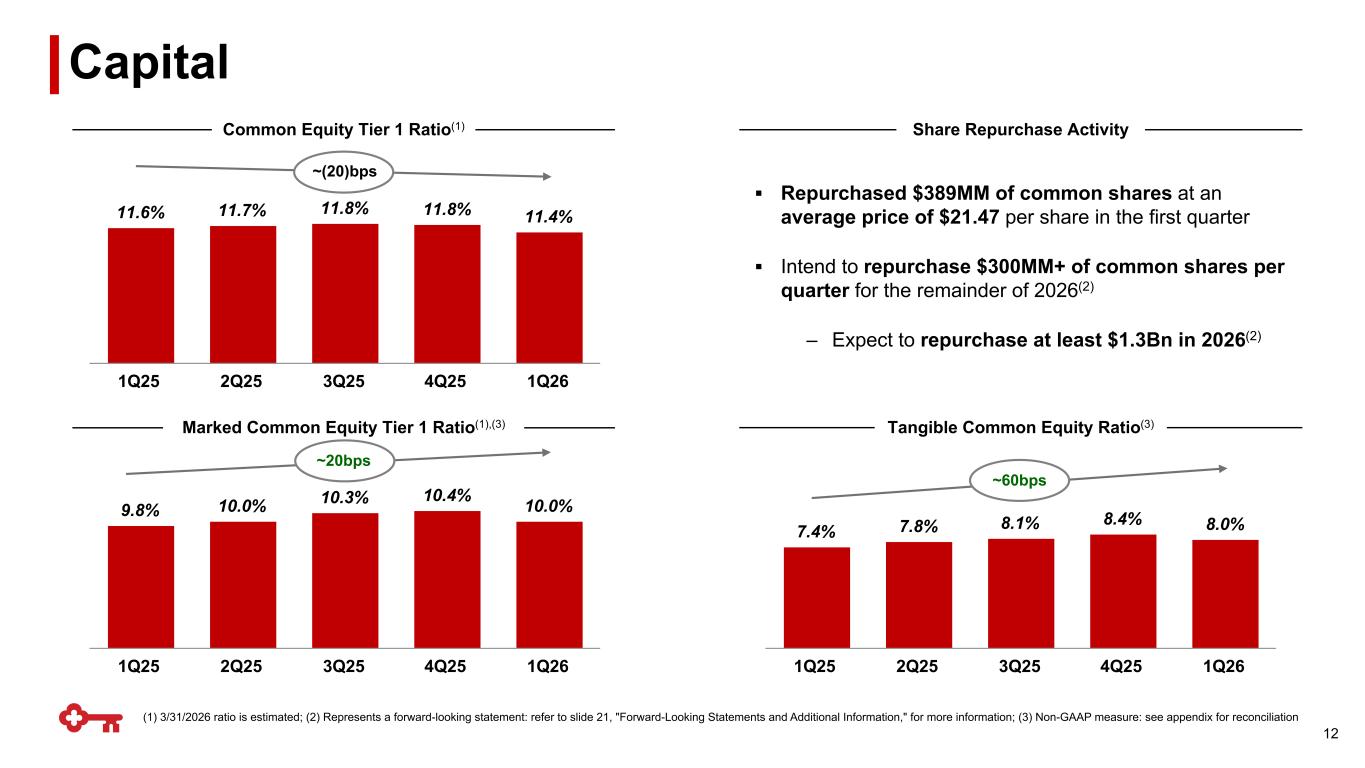
▪ Repurchased $389MM of common shares at an average price of $21.47 per share in the first quarter ▪ Intend to repurchase $300MM+ of common shares per quarter for the remainder of 2026(2) – Expect to repurchase at least $1.3Bn in 2026(2) (1) 3/31/2026 ratio is estimated; (2) Represents a forward-looking statement: refer to slide 21, "Forward-Looking Statements and Additional Information," for more information; (3) Non-GAAP measure: see appendix for reconciliation 9.8% 10.0% 10.3% 10.4% 10.0% 1Q25 2Q25 3Q25 4Q25 1Q26 11.6% 11.7% 11.8% 11.8% 11.4% 1Q25 2Q25 3Q25 4Q25 1Q26 7.4% 7.8% 8.1% 8.4% 8.0% 1Q25 2Q25 3Q25 4Q25 1Q26 Marked Common Equity Tier 1 Ratio(1),(3) Common Equity Tier 1 Ratio(1) Tangible Common Equity Ratio(3) Capital Share Repurchase Activity ~(20)bps ~60bps ~20bps 12
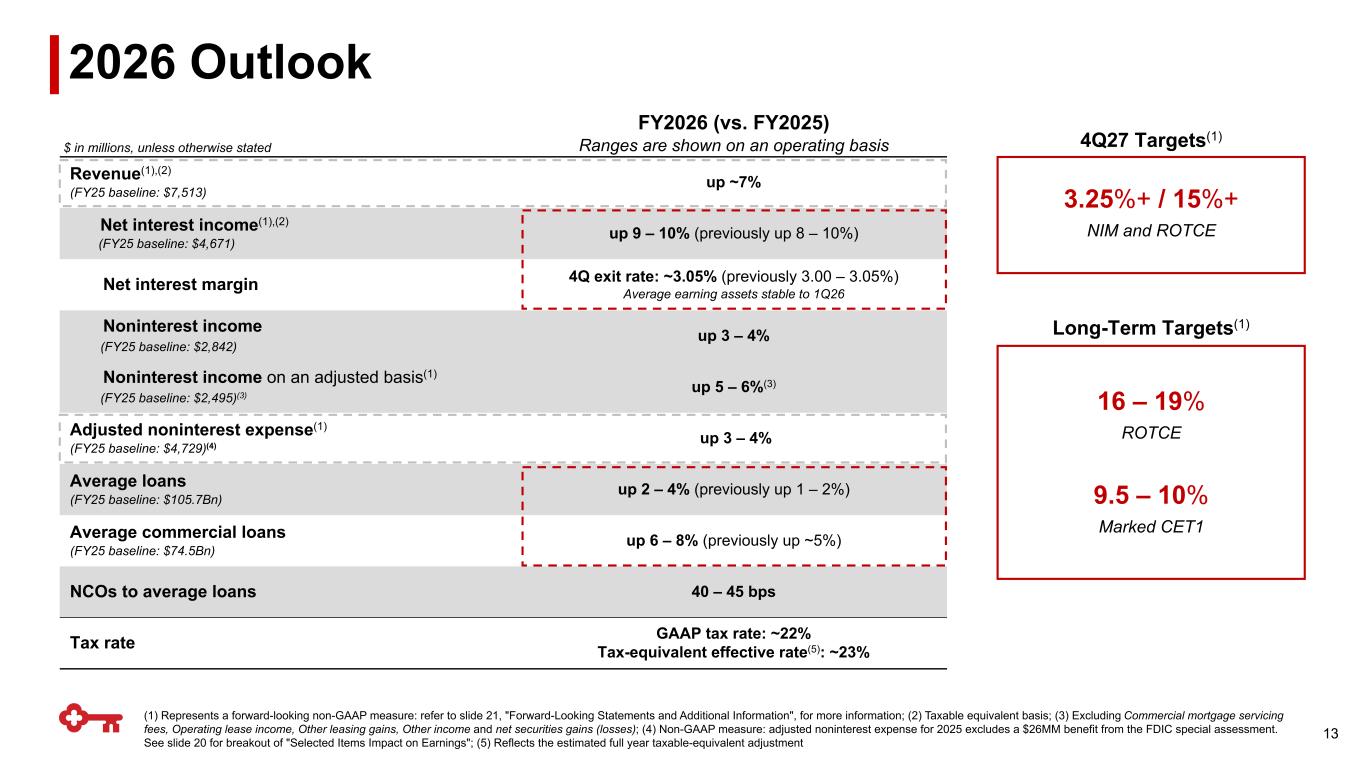
$ in millions, unless otherwise stated FY2026 (vs. FY2025) Ranges are shown on an operating basis Revenue(1),(2) (FY25 baseline: $7,513) up ~7% Net interest income(1),(2) (FY25 baseline: $4,671) up 9 – 10% (previously up 8 – 10%) Net interest margin 4Q exit rate: ~3.05% (previously 3.00 – 3.05%) Average earning assets stable to 1Q26 Noninterest income (FY25 baseline: $2,842) up 3 – 4% Noninterest income on an adjusted basis(1) (FY25 baseline: $2,495)(3) up 5 – 6%(3) Adjusted noninterest expense(1) (FY25 baseline: $4,729)(4) up 3 – 4% Average loans (FY25 baseline: $105.7Bn) up 2 – 4% (previously up 1 – 2%) Average commercial loans (FY25 baseline: $74.5Bn) up 6 – 8% (previously up ~5%) NCOs to average loans 40 – 45 bps Tax rate GAAP tax rate: ~22% Tax-equivalent effective rate(5): ~23% 2026 Outlook 13 (1) Represents a forward-looking non-GAAP measure: refer to slide 21, "Forward-Looking Statements and Additional Information", for more information; (2) Taxable equivalent basis; (3) Excluding Commercial mortgage servicing fees, Operating lease income, Other leasing gains, Other income and net securities gains (losses); (4) Non-GAAP measure: adjusted noninterest expense for 2025 excludes a $26MM benefit from the FDIC special assessment. See slide 20 for breakout of "Selected Items Impact on Earnings"; (5) Reflects the estimated full year taxable-equivalent adjustment 4Q27 Targets(1) 3.25%+ / 15%+ NIM and ROTCE 16 – 19% ROTCE 9.5 – 10% Marked CET1 Long-Term Targets(1)

Appendix
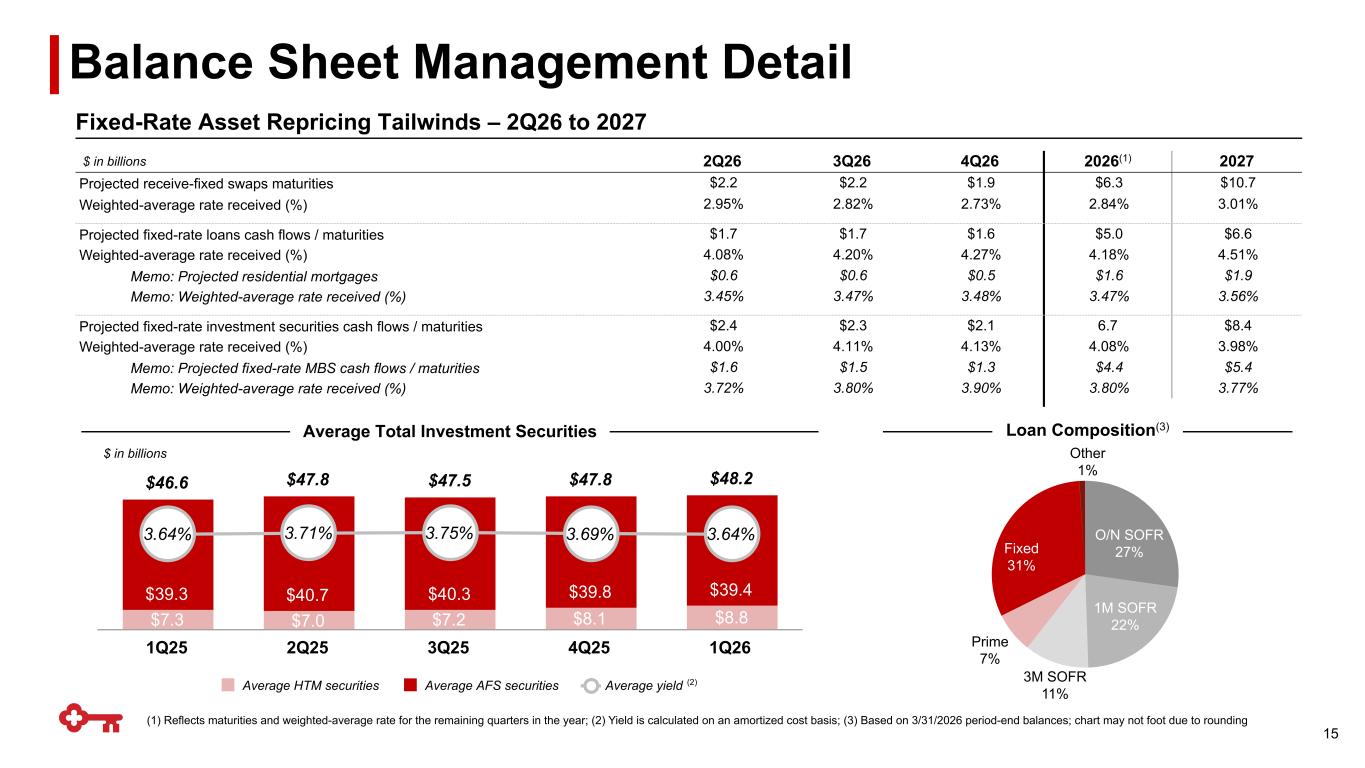
(1) Reflects maturities and weighted-average rate for the remaining quarters in the year; (2) Yield is calculated on an amortized cost basis; (3) Based on 3/31/2026 period-end balances; chart may not foot due to rounding Loan Composition(3) $ in billions Average Total Investment Securities Fixed-Rate Asset Repricing Tailwinds – 2Q26 to 2027 Balance Sheet Management Detail 15 $46.6 $47.8 $47.5 $47.8 $48.2 $7.3 $7.0 $7.2 $8.1 $8.8 $39.3 $40.7 $40.3 $39.8 $39.4 3.64% 3.71% 3.75% 3.69% 3.64% Average HTM securities Average AFS securities Average yield 1Q25 2Q25 3Q25 4Q25 1Q26 3M SOFR 11% Other 1% (2) $ in billions 2Q26 3Q26 4Q26 2026(1) 2027 Projected receive-fixed swaps maturities $2.2 $2.2 $1.9 $6.3 $10.7 Weighted-average rate received (%) 2.95% 2.82% 2.73% 2.84% 3.01% Projected fixed-rate loans cash flows / maturities $1.7 $1.7 $1.6 $5.0 $6.6 Weighted-average rate received (%) 4.08% 4.20% 4.27% 4.18% 4.51% Memo: Projected residential mortgages $0.6 $0.6 $0.5 $1.6 $1.9 Memo: Weighted-average rate received (%) 3.45% 3.47% 3.48% 3.47% 3.56% Projected fixed-rate investment securities cash flows / maturities $2.4 $2.3 $2.1 6.7 $8.4 Weighted-average rate received (%) 4.00% 4.11% 4.13% 4.08% 3.98% Memo: Projected fixed-rate MBS cash flows / maturities $1.6 $1.5 $1.3 $4.4 $5.4 Memo: Weighted-average rate received (%) 3.72% 3.80% 3.90% 3.80% 3.77% 1M SOFR 22% O/N SOFR 27%Fixed 31% Prime 7%
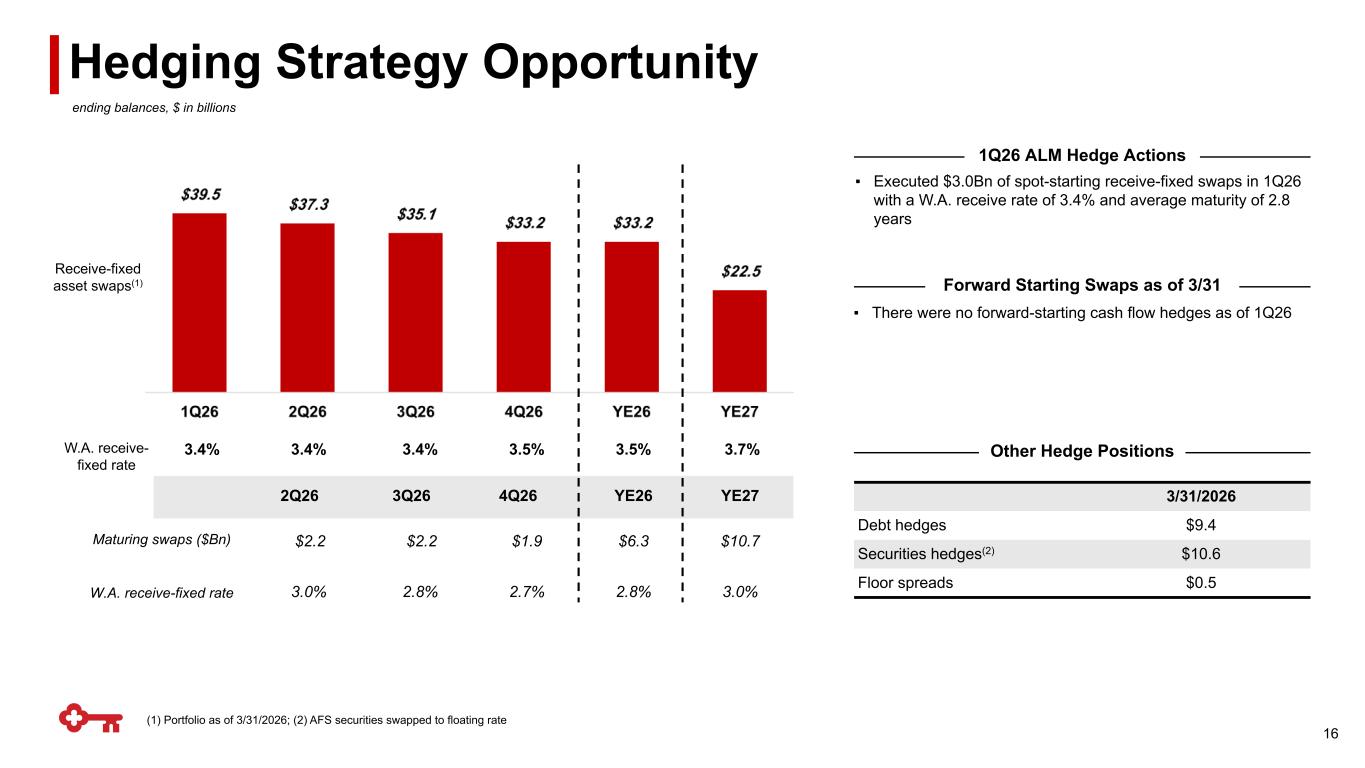
Hedging Strategy Opportunity 16 ending balances, $ in billions 3.4% 3.4% 3.4% 3.5% 3.5% 3.7% 2Q26 3Q26 4Q26 YE26 YE27 $2.2 $2.2 $1.9 $6.3 $10.7 3.0% 2.8% 2.7% 2.8% 3.0% W.A. receive- fixed rate Maturing swaps ($Bn) W.A. receive-fixed rate Receive-fixed asset swaps(1) (1) Portfolio as of 3/31/2026; (2) AFS securities swapped to floating rate 3/31/2026 Debt hedges $9.4 Securities hedges(2) $10.6 Floor spreads $0.5 Other Hedge Positions ▪ Executed $3.0Bn of spot-starting receive-fixed swaps in 1Q26 with a W.A. receive rate of 3.4% and average maturity of 2.8 years 1Q26 ALM Hedge Actions ▪ There were no forward-starting cash flow hedges as of 1Q26 Forward Starting Swaps as of 3/31
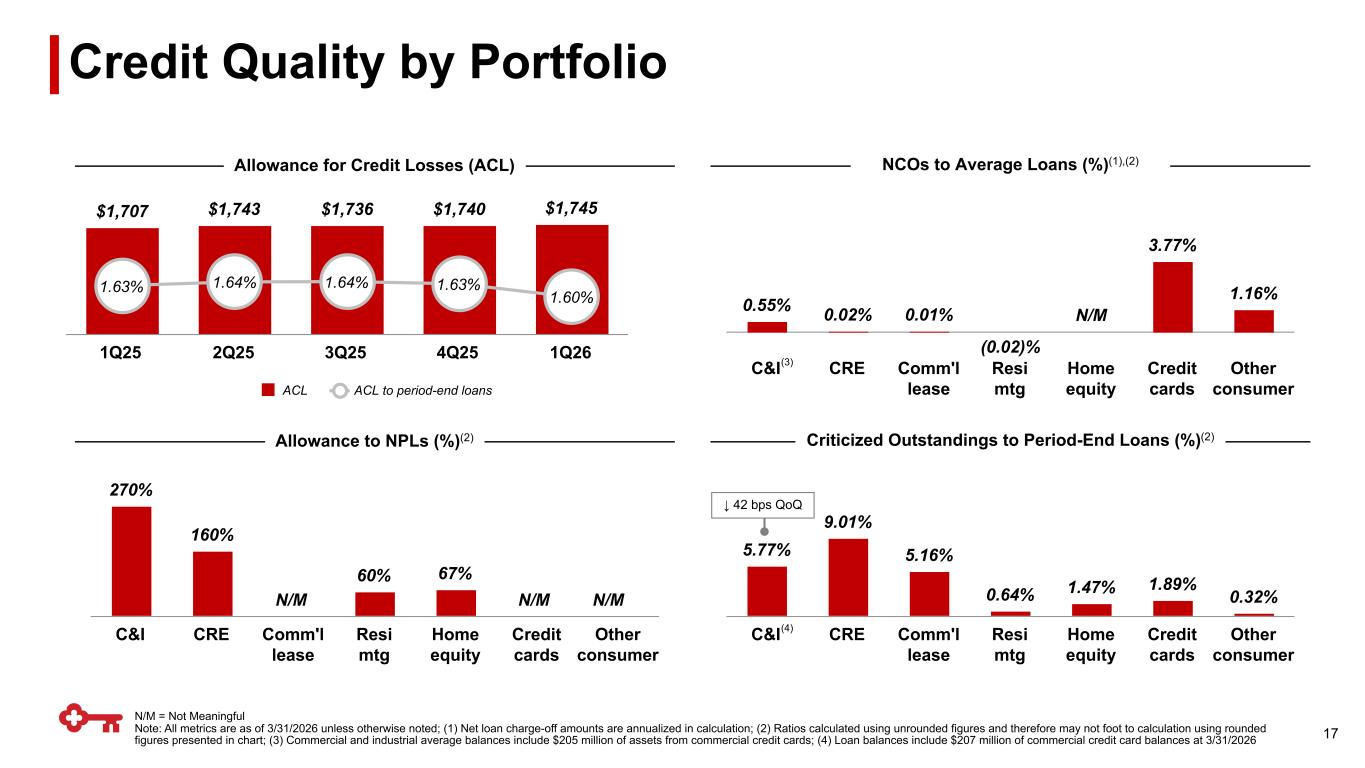
270% 160% —% 60% 67% —% —% C&I CRE Comm'l lease Resi mtg Home equity Credit cards Other consumer $1,707 $1,743 $1,736 $1,740 $1,745 1.63% 1.64% 1.64% 1.63% 1.60% ACL ACL to period-end loans 1Q25 2Q25 3Q25 4Q25 1Q26 5.77% 9.01% 5.16% 0.64% 1.47% 1.89% 0.32% C&I CRE Comm'l lease Resi mtg Home equity Credit cards Other consumer 0.55% 0.02% 0.01% — 3.77% 1.16% (0.02)% C&I CRE Comm'l lease Resi mtg Home equity Credit cards Other consumer Credit Quality by Portfolio (3) (4) N/M = Not Meaningful Note: All metrics are as of 3/31/2026 unless otherwise noted; (1) Net loan charge-off amounts are annualized in calculation; (2) Ratios calculated using unrounded figures and therefore may not foot to calculation using rounded figures presented in chart; (3) Commercial and industrial average balances include $205 million of assets from commercial credit cards; (4) Loan balances include $207 million of commercial credit card balances at 3/31/2026 NCOs to Average Loans (%)(1),(2) ↓ 42 bps QoQ 17 Allowance for Credit Losses (ACL) Allowance to NPLs (%)(2) Criticized Outstandings to Period-End Loans (%)(2) N/M N/MN/M N/M
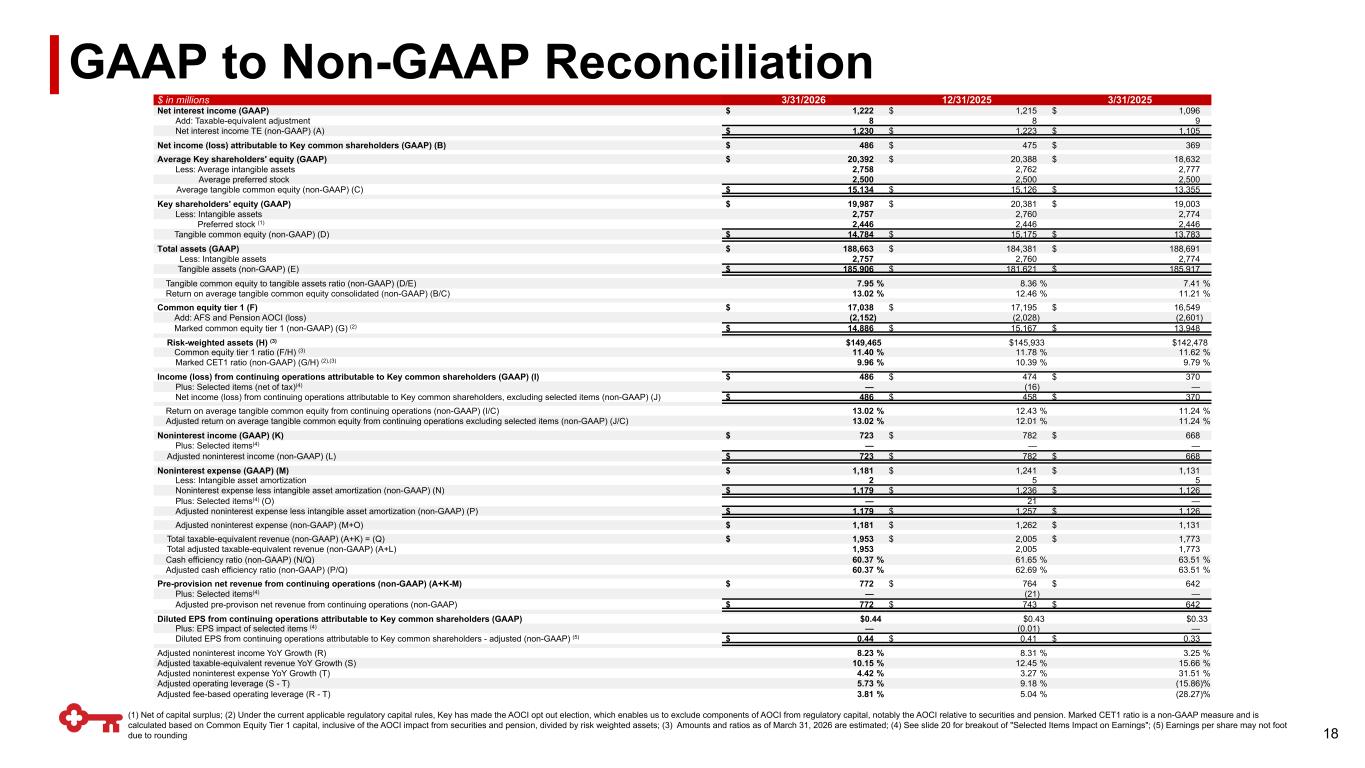
GAAP to Non-GAAP Reconciliation $ in millions 3/31/2026 12/31/2025 3/31/2025 Net interest income (GAAP) $ 1,222 $ 1,215 $ 1,096 Add: Taxable-equivalent adjustment 8 8 9 Net interest income TE (non-GAAP) (A) $ 1,230 $ 1,223 $ 1,105 Net income (loss) attributable to Key common shareholders (GAAP) (B) $ 486 $ 475 $ 369 Average Key shareholders' equity (GAAP) $ 20,392 $ 20,388 $ 18,632 Less: Average intangible assets 2,758 2,762 2,777 Average preferred stock 2,500 2,500 2,500 Average tangible common equity (non-GAAP) (C) $ 15,134 $ 15,126 $ 13,355 Key shareholders' equity (GAAP) $ 19,987 $ 20,381 $ 19,003 Less: Intangible assets 2,757 2,760 2,774 Preferred stock (1) 2,446 2,446 2,446 Tangible common equity (non-GAAP) (D) $ 14,784 $ 15,175 $ 13,783 Total assets (GAAP) $ 188,663 $ 184,381 $ 188,691 Less: Intangible assets 2,757 2,760 2,774 Tangible assets (non-GAAP) (E) $ 185,906 $ 181,621 $ 185,917 Tangible common equity to tangible assets ratio (non-GAAP) (D/E) 7.95 % 8.36 % 7.41 % Return on average tangible common equity consolidated (non-GAAP) (B/C) 13.02 % 12.46 % 11.21 % Common equity tier 1 (F) $ 17,038 $ 17,195 $ 16,549 Add: AFS and Pension AOCI (loss) (2,152) (2,028) (2,601) Marked common equity tier 1 (non-GAAP) (G) (2) $ 14,886 $ 15,167 $ 13,948 Risk-weighted assets (H) (3) $149,465 $145,933 $142,478 Common equity tier 1 ratio (F/H) (3) 11.40 % 11.78 % 11.62 % Marked CET1 ratio (non-GAAP) (G/H) (2),(3) 9.96 % 10.39 % 9.79 % Income (loss) from continuing operations attributable to Key common shareholders (GAAP) (I) $ 486 $ 474 $ 370 Plus: Selected items (net of tax)(4) — (16) — Net income (loss) from continuing operations attributable to Key common shareholders, excluding selected items (non-GAAP) (J) $ 486 $ 458 $ 370 Return on average tangible common equity from continuing operations (non-GAAP) (I/C) 13.02 % 12.43 % 11.24 % Adjusted return on average tangible common equity from continuing operations excluding selected items (non-GAAP) (J/C) 13.02 % 12.01 % 11.24 % Noninterest income (GAAP) (K) $ 723 $ 782 $ 668 Plus: Selected items(4) — — — Adjusted noninterest income (non-GAAP) (L) $ 723 $ 782 $ 668 Noninterest expense (GAAP) (M) $ 1,181 $ 1,241 $ 1,131 Less: Intangible asset amortization 2 5 5 Noninterest expense less intangible asset amortization (non-GAAP) (N) $ 1,179 $ 1,236 $ 1,126 Plus: Selected items(4) (O) — 21 — Adjusted noninterest expense less intangible asset amortization (non-GAAP) (P) $ 1,179 $ 1,257 $ 1,126 Adjusted noninterest expense (non-GAAP) (M+O) $ 1,181 $ 1,262 $ 1,131 Total taxable-equivalent revenue (non-GAAP) (A+K) = (Q) $ 1,953 $ 2,005 $ 1,773 Total adjusted taxable-equivalent revenue (non-GAAP) (A+L) 1,953 2,005 1,773 Cash efficiency ratio (non-GAAP) (N/Q) 60.37 % 61.65 % 63.51 % Adjusted cash efficiency ratio (non-GAAP) (P/Q) 60.37 % 62.69 % 63.51 % Pre-provision net revenue from continuing operations (non-GAAP) (A+K-M) $ 772 $ 764 $ 642 Plus: Selected items(4) — (21) — Adjusted pre-provison net revenue from continuing operations (non-GAAP) $ 772 $ 743 $ 642 Diluted EPS from continuing operations attributable to Key common shareholders (GAAP) $0.44 $0.43 $0.33 Plus: EPS impact of selected items (4) — (0.01) — Diluted EPS from continuing operations attributable to Key common shareholders - adjusted (non-GAAP) (5) $ 0.44 $ 0.41 $ 0.33 Adjusted noninterest income YoY Growth (R) 8.23 % 8.31 % 3.25 % Adjusted taxable-equivalent revenue YoY Growth (S) 10.15 % 12.45 % 15.66 % Adjusted noninterest expense YoY Growth (T) 4.42 % 3.27 % 31.51 % Adjusted operating leverage (S - T) 5.73 % 9.18 % (15.86) % Adjusted fee-based operating leverage (R - T) 3.81 % 5.04 % (28.27) % (1) Net of capital surplus; (2) Under the current applicable regulatory capital rules, Key has made the AOCI opt out election, which enables us to exclude components of AOCI from regulatory capital, notably the AOCI relative to securities and pension. Marked CET1 ratio is a non-GAAP measure and is calculated based on Common Equity Tier 1 capital, inclusive of the AOCI impact from securities and pension, divided by risk weighted assets; (3) Amounts and ratios as of March 31, 2026 are estimated; (4) See slide 20 for breakout of "Selected Items Impact on Earnings"; (5) Earnings per share may not foot due to rounding 18
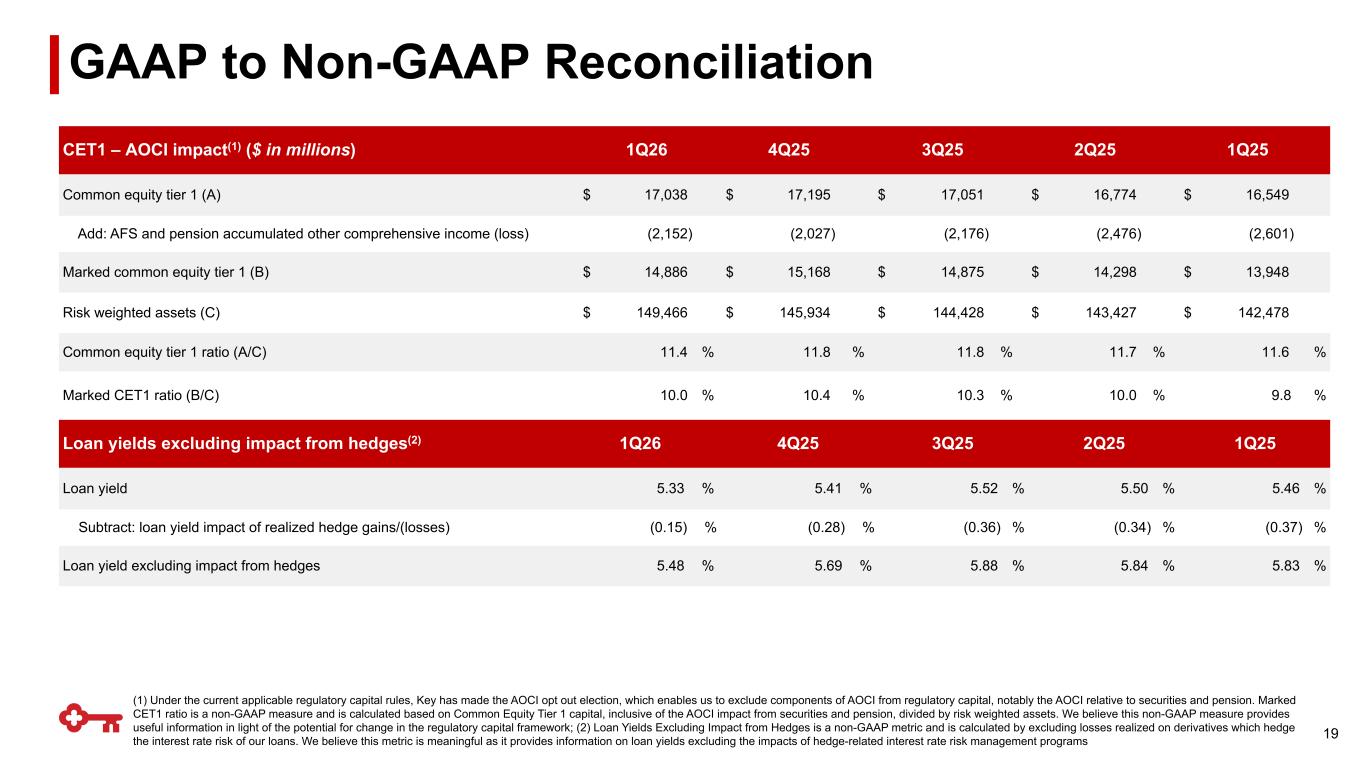
CET1 – AOCI impact(1) ($ in millions) 1Q26 4Q25 3Q25 2Q25 1Q25 Common equity tier 1 (A) $ 17,038 $ 17,195 $ 17,051 $ 16,774 $ 16,549 Add: AFS and pension accumulated other comprehensive income (loss) (2,152) (2,027) (2,176) (2,476) (2,601) Marked common equity tier 1 (B) $ 14,886 $ 15,168 $ 14,875 $ 14,298 $ 13,948 Risk weighted assets (C) $ 149,466 $ 145,934 $ 144,428 $ 143,427 $ 142,478 Common equity tier 1 ratio (A/C) 11.4 % 11.8 % 11.8 % 11.7 % 11.6 % Marked CET1 ratio (B/C) 10.0 % 10.4 % 10.3 % 10.0 % 9.8 % (1) Under the current applicable regulatory capital rules, Key has made the AOCI opt out election, which enables us to exclude components of AOCI from regulatory capital, notably the AOCI relative to securities and pension. Marked CET1 ratio is a non-GAAP measure and is calculated based on Common Equity Tier 1 capital, inclusive of the AOCI impact from securities and pension, divided by risk weighted assets. We believe this non-GAAP measure provides useful information in light of the potential for change in the regulatory capital framework; (2) Loan Yields Excluding Impact from Hedges is a non-GAAP metric and is calculated by excluding losses realized on derivatives which hedge the interest rate risk of our loans. We believe this metric is meaningful as it provides information on loan yields excluding the impacts of hedge-related interest rate risk management programs Loan yields excluding impact from hedges(2) 1Q26 4Q25 3Q25 2Q25 1Q25 Loan yield 5.33 % 5.41 % 5.52 % 5.50 % 5.46 % Subtract: loan yield impact of realized hedge gains/(losses) (0.15) % (0.28) % (0.36) % (0.34) % (0.37) % Loan yield excluding impact from hedges 5.48 % 5.69 % 5.88 % 5.84 % 5.83 % 19 GAAP to Non-GAAP Reconciliation
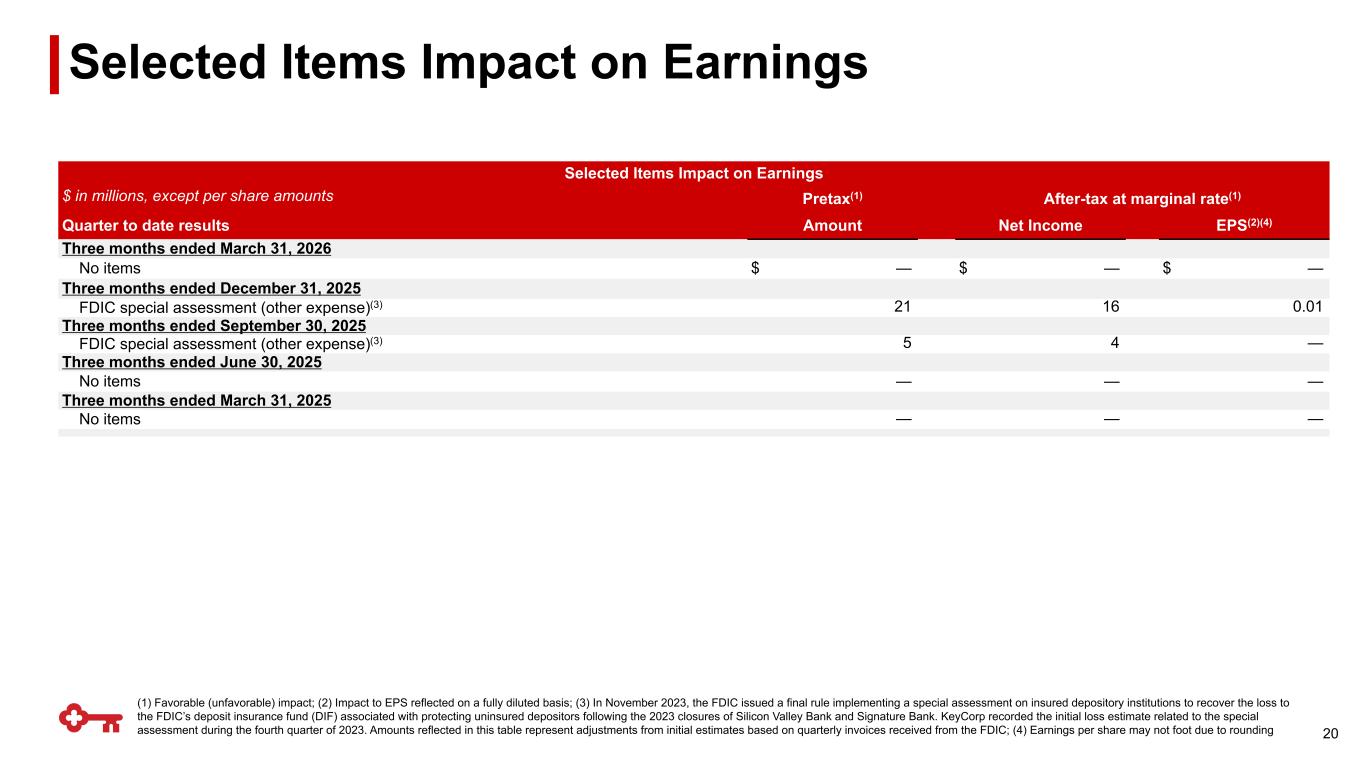
(1) Favorable (unfavorable) impact; (2) Impact to EPS reflected on a fully diluted basis; (3) In November 2023, the FDIC issued a final rule implementing a special assessment on insured depository institutions to recover the loss to the FDIC’s deposit insurance fund (DIF) associated with protecting uninsured depositors following the 2023 closures of Silicon Valley Bank and Signature Bank. KeyCorp recorded the initial loss estimate related to the special assessment during the fourth quarter of 2023. Amounts reflected in this table represent adjustments from initial estimates based on quarterly invoices received from the FDIC; (4) Earnings per share may not foot due to rounding Selected Items Impact on Earnings $ in millions, except per share amounts Pretax(1) After-tax at marginal rate(1) Quarter to date results Amount Net Income EPS(2)(4) Three months ended March 31, 2026 No items $ — $ — $ — Three months ended December 31, 2025 FDIC special assessment (other expense)(3) 21 16 0.01 Three months ended September 30, 2025 FDIC special assessment (other expense)(3) 5 4 — Three months ended June 30, 2025 No items — — — Three months ended March 31, 2025 No items — — — 20 Selected Items Impact on Earnings
This communication contains forward-looking statements within the meaning of the Private Securities Litigation Reform Act of 1995 including, but not limited to, KeyCorp’s expectations or predictions of future financial or business performance or conditions. Forward-looking statements are typically identified by words such as “believe,” “seek,” “expect,” “anticipate,” “intend,” “target,” “estimate,” “continue,” “positions,” “plan,” “predict,” “project,” “forecast,” “guidance,” “goal,” “objective,” “prospects,” “possible,” “potential,” “strategy,” “opportunities,” or “trends,” by future conditional verbs such as “assume,” “will,” “would,” “should,” “could” or “may”, or by variations of such words or by similar expressions. These forward-looking statements are based on assumptions that involve risks and uncertainties, which are subject to change based on various important factors (some of which are beyond KeyCorp’s control). Actual results may differ materially from current projections. Actual outcomes may differ materially from those expressed or implied as a result of the factors described under “Forward-looking Statements” and “Risk Factors” in KeyCorp’s Annual Report on Form 10-K for the year ended December 31, 2025, and in subsequent filings of KeyCorp with the Securities and Exchange Commission (the “SEC”). Such forward-looking statements speak only as of the date they are made, and we undertake no obligation to update any forward-looking statement to reflect events or circumstances after that date or to reflect the occurrence of unanticipated events. For additional information regarding KeyCorp, please refer to our SEC filings available at www.key.com/ir. Non-GAAP Measures. This document contains GAAP financial measures and non-GAAP financial measures where management believes it to be helpful in understanding Key’s results of operations or financial position. Where non-GAAP financial measures are used, the comparable GAAP financial measure, as well as the reconciliation to the comparable GAAP financial measure, can be found in the appendix to this presentation, the financial supplement, or the press release related to this presentation, all of which can be found on Key’s website (www.key.com/ir). Forward-Looking Non-GAAP Measures. From time to time we may discuss forward-looking non-GAAP financial measures. We are unable to provide a reconciliation of forward-looking non-GAAP financial measures to their most directly comparable GAAP financial measures because we are unable to provide, without unreasonable effort, a meaningful or accurate calculation or estimation of amounts that would be necessary for the reconciliation due to the complexity and inherent difficulty in forecasting and quantifying future amounts or when they may occur. Such unavailable information could be significant for future results. Annualized Data. Certain returns, yields, performance ratios, or quarterly growth rates are presented on an “annualized” basis. This is done for analytical and decision-making purposes to better discern underlying performance trends when compared to full-year or year-over-year amounts. Taxable Equivalent. Income from tax-exempt earning assets is increased by an amount equivalent to the taxes that would have been paid if this income had been taxable at the federal statutory rate. This adjustment puts all earning assets, most notably tax-exempt municipal securities, and certain lease assets, on a common basis that facilitates comparison of results to results of peers. Earnings Per Share Equivalent. Certain income or expense items may be expressed on a per common share basis. This is done for analytical and decision-making purposes to better discern underlying trends in total consolidated earnings per share performance excluding the impact of such items. When the impact of certain income or expense items is disclosed separately, the after-tax amount is computed using the marginal tax rate, unless otherwise specified, with this then being the amount used to calculate the earnings per share equivalent. GAAP: Generally Accepted Accounting Principles Forward-looking Statements and Additional Information 21
Exhibit 99.3
| Consolidated Balance Sheets | ||||||||||||||||||||
| (dollars in millions) | ||||||||||||||||||||
| 3/31/2026 | 12/31/2025 | 3/31/2025 | ||||||||||||||||||
| Assets | ||||||||||||||||||||
| Loans | $ | 109,190 | $ | 106,541 | $ | 104,809 | ||||||||||||||
| Loans held for sale | 876 | 1,077 | 811 | |||||||||||||||||
| Securities available for sale | 38,918 | 39,596 | 40,751 | |||||||||||||||||
| Held-to-maturity securities | 9,116 | 8,622 | 7,160 | |||||||||||||||||
| Trading account assets | 783 | 1,061 | 1,296 | |||||||||||||||||
| Short-term investments | 11,782 | 10,163 | 15,349 | |||||||||||||||||
| Other investments | 1,204 | 949 | 1,050 | |||||||||||||||||
| Total earning assets | 171,869 | 168,009 | 171,226 | |||||||||||||||||
| Allowance for loan and lease losses | (1,449) | (1,427) | (1,429) | |||||||||||||||||
| Cash and due from banks | 1,130 | 1,287 | 1,909 | |||||||||||||||||
| Premises and equipment | 618 | 628 | 602 | |||||||||||||||||
| Goodwill | 2,752 | 2,752 | 2,752 | |||||||||||||||||
| Other intangible assets | 5 | 8 | 22 | |||||||||||||||||
| Corporate-owned life insurance | 4,439 | 4,432 | 4,404 | |||||||||||||||||
| Accrued income and other assets | 9,100 | 8,481 | 8,958 | |||||||||||||||||
| Discontinued assets | 199 | 211 | 247 | |||||||||||||||||
| Total assets | $ | 188,663 | $ | 184,381 | $ | 188,691 | ||||||||||||||
| Liabilities | ||||||||||||||||||||
| Deposits in domestic offices: | ||||||||||||||||||||
| Interest-bearing deposits | 120,220 | 121,100 | 122,283 | |||||||||||||||||
| Noninterest-bearing deposits | 27,595 | 27,613 | 28,454 | |||||||||||||||||
| Total deposits | 147,815 | 148,713 | 150,737 | |||||||||||||||||
| Federal funds purchased and securities sold under repurchase agreements | 34 | 13 | 22 | |||||||||||||||||
| Bank notes and other short-term borrowings | 6,149 | 1,071 | 2,328 | |||||||||||||||||
| Accrued expense and other liabilities | 3,801 | 4,286 | 4,209 | |||||||||||||||||
| Long-term debt | 10,877 | 9,917 | 12,392 | |||||||||||||||||
| Total liabilities | 168,676 | 164,000 | 169,688 | |||||||||||||||||
| Equity | ||||||||||||||||||||
| Preferred stock | 2,500 | 2,500 | 2,500 | |||||||||||||||||
| Common shares | 1,257 | 1,257 | 1,257 | |||||||||||||||||
| Capital surplus | 5,981 | 6,035 | 5,946 | |||||||||||||||||
| Retained earnings | 15,622 | 15,359 | 14,724 | |||||||||||||||||
| Treasury stock, at cost | (3,152) | (2,810) | (2,637) | |||||||||||||||||
| Accumulated other comprehensive income (loss) | (2,221) | (1,960) | (2,787) | |||||||||||||||||
| Total equity | 19,987 | 20,381 | 19,003 | |||||||||||||||||
| Total liabilities and equity | $ | 188,663 | $ | 184,381 | $ | 188,691 | ||||||||||||||
| Common shares outstanding (000) | 1,087,293 | 1,102,401 | 1,111,986 | |||||||||||||||||
| Consolidated Statements of Income | ||||||||||||||||||||||||||
| (dollars in millions, except per share amounts) | ||||||||||||||||||||||||||
| Three months ended | ||||||||||||||||||||||||||
| 3/31/2026 | 12/31/2025 | 3/31/2025 | ||||||||||||||||||||||||
| Interest income | ||||||||||||||||||||||||||
| Loans | $ | 1,416 | $ | 1,439 | $ | 1,401 | ||||||||||||||||||||
| Loans held for sale | 14 | 18 | 14 | |||||||||||||||||||||||
| Securities available for sale | 370 | 388 | 392 | |||||||||||||||||||||||
| Held-to-maturity securities | 86 | 76 | 63 | |||||||||||||||||||||||
| Trading account assets | 11 | 12 | 17 | |||||||||||||||||||||||
| Short-term investments | 103 | 137 | 174 | |||||||||||||||||||||||
| Other investments | 5 | 8 | 9 | |||||||||||||||||||||||
| Total interest income | 2,005 | 2,078 | 2,070 | |||||||||||||||||||||||
| Interest expense | ||||||||||||||||||||||||||
| Deposits | 598 | 688 | 753 | |||||||||||||||||||||||
| Federal funds purchased and securities sold under repurchase agreements | 14 | 4 | 1 | |||||||||||||||||||||||
| Bank notes and other short-term borrowings | 20 | 9 | 27 | |||||||||||||||||||||||
| Long-term debt | 151 | 162 | 193 | |||||||||||||||||||||||
| Total interest expense | 783 | 863 | 974 | |||||||||||||||||||||||
| Net interest income | 1,222 | 1,215 | 1,096 | |||||||||||||||||||||||
| Provision for credit losses | 106 | 108 | 118 | |||||||||||||||||||||||
| Net interest income after provision for credit losses | 1,116 | 1,107 | 978 | |||||||||||||||||||||||
| Noninterest income | ||||||||||||||||||||||||||
| Trust and investment services income | 157 | 156 | 139 | |||||||||||||||||||||||
| Investment banking and debt placement fees | 197 | 243 | 175 | |||||||||||||||||||||||
| Service charges on deposit accounts | 77 | 78 | 69 | |||||||||||||||||||||||
| Operating lease income and other leasing gains | 8 | 9 | 9 | |||||||||||||||||||||||
| Corporate services income | 71 | 81 | 65 | |||||||||||||||||||||||
| Cards and payments income | 86 | 84 | 82 | |||||||||||||||||||||||
| Corporate-owned life insurance income | 34 | 40 | 33 | |||||||||||||||||||||||
| Consumer mortgage income | 13 | 16 | 13 | |||||||||||||||||||||||
| Commercial mortgage servicing fees | 62 | 68 | 76 | |||||||||||||||||||||||
| Other income | 18 | 7 | 7 | |||||||||||||||||||||||
| Net securities gains (losses) | — | — | — | |||||||||||||||||||||||
| Total noninterest income | 723 | 782 | 668 | |||||||||||||||||||||||
| Noninterest expense | ||||||||||||||||||||||||||
| Personnel | 743 | 790 | 680 | |||||||||||||||||||||||
| Net occupancy | 68 | 69 | 67 | |||||||||||||||||||||||
| Computer processing | 111 | 106 | 107 | |||||||||||||||||||||||
| Business services and professional fees | 36 | 61 | 40 | |||||||||||||||||||||||
| Equipment | 19 | 22 | 20 | |||||||||||||||||||||||
| Operating lease expense | 7 | 8 | 11 | |||||||||||||||||||||||
| Marketing | 18 | 28 | 21 | |||||||||||||||||||||||
| Intangible asset amortization | — | — | — | |||||||||||||||||||||||
| Other expense | 179 | 157 | 185 | |||||||||||||||||||||||
| Total noninterest expense | 1,181 | 1,241 | 1,131 | |||||||||||||||||||||||
| Income (loss) from continuing operations before income taxes | 658 | 648 | 515 | |||||||||||||||||||||||
| Income taxes | 136 | 139 | 109 | |||||||||||||||||||||||
| Income (loss) from continuing operations | 522 | 509 | 406 | |||||||||||||||||||||||
| Income (loss) from discontinued operations, net of taxes | — | 1 | (1) | |||||||||||||||||||||||
| Net income (loss) | 522 | 510 | 405 | |||||||||||||||||||||||
| Less: Net income (loss) attributable to noncontrolling interests | — | — | — | |||||||||||||||||||||||
| Net income (loss) attributable to Key | $ | 522 | $ | 510 | $ | 405 | ||||||||||||||||||||
| Income (loss) from continuing operations attributable to Key common shareholders | $ | 486 | $ | 474 | $ | 370 | ||||||||||||||||||||
| Net income (loss) attributable to Key common shareholders | 486 | 475 | 369 | |||||||||||||||||||||||
| Per common share | ||||||||||||||||||||||||||
| Income (loss) from continuing operations attributable to Key common shareholders | $ | .45 | $ | .43 | $ | .34 | ||||||||||||||||||||
| Income (loss) from discontinued operations, net of taxes | — | — | — | |||||||||||||||||||||||
Net income (loss) attributable to Key common shareholders (a) | .45 | .43 | .34 | |||||||||||||||||||||||
| Per common share — assuming dilution | ||||||||||||||||||||||||||
| Income (loss) from continuing operations attributable to Key common shareholders | $ | .44 | $ | .43 | $ | .33 | ||||||||||||||||||||
| Income (loss) from discontinued operations, net of taxes | — | — | — | |||||||||||||||||||||||
Net income (loss) attributable to Key common shareholders (a) | .44 | .43 | $ | .33 | ||||||||||||||||||||||
| Cash dividends declared per common share | $ | .205 | $ | .205 | $ | .205 | ||||||||||||||||||||
| Weighted-average common shares outstanding (000) | 1,084,277 | 1,095,171 | 1,096,654 | |||||||||||||||||||||||
Effect of common share options and other stock awards (b) | 10,091 | 11,152 | 9,486 | |||||||||||||||||||||||
Weighted-average common shares and potential common shares outstanding (000) (c) | 1,094,368 | 1,106,323 | 1,106,140 | |||||||||||||||||||||||
(a)Earnings per share may not foot due to rounding.
(b)For periods ended in a loss from continuing operations attributable to Key common shareholders, anti-dilutive instruments have been excluded from the calculation of diluted earnings per share.
(c)Assumes conversion of common share options and other stock awards and/or convertible preferred stock, as applicable.