
BRC Group Holdings, Inc 8-K, filed Jan 12, 2021
BRC Group Holdings, Inc. (RILY)
About this 8-K
BRC Group Holdings, Inc filed this 8-K on January 12, 2021.
Items reported
- Item 2.02: Financial results
- Item 7.01: Regulation FD disclosure
- Item 9.01: Financial statements and exhibits
UNITED STATES
SECURITIES AND EXCHANGE COMMISSION
Washington, D.C. 20549
FORM
CURRENT REPORT
Pursuant to Section 13 OR 15(d) of The Securities Exchange Act of 1934
Date of Report (Date of earliest event
reported):
(Exact name of registrant as specified in its charter)
| (State or other jurisdiction of incorporation) |
(Commission File Number) | (IRS Employer Identification No.) |
(Address, Including Zip Code, and Telephone Number, Including Area Code, of Registrant’s Principal Executive Offices)
Securities registered pursuant to Section 12(b) of the Act:
| Title of each class | Trading Symbol(s) | Name of each exchange on which registered | ||
| Depositary Shares (each representing a 1/1000th interest in a 6.875% Series A Cumulative Perpetual Preferred Share, par value $0.0001 per share) | RILYP | Nasdaq Global Market | ||
| Depositary Shares (each representing a 1/1000th interest in a 7.375% Series B Cumulative Perpetual Preferred Share, par value $0.0001 per share) | RILYL | Nasdaq Global Market | ||
| 7.25% Senior Notes due 2027 | RILYG | Nasdaq Global Market | ||
| 7.50% Senior Notes due 2027 | RILYZ | Nasdaq Global Market | ||
| 7.375% Senior Notes due 2023 | RILYH | Nasdaq Global Market | ||
| 6.875% Senior Notes due 2023 | RILYI | Nasdaq Global Market | ||
| 6.75% Senior Notes due 2024 | RILYO | Nasdaq Global Market | ||
| 6.50% Senior Notes due 2026 | RILYN | Nasdaq Global Market | ||
| 6.375% Senior Notes due 2025 | RILYM | Nasdaq Global Market |
(Former name or former address, if changed since last report)
Check the appropriate box below if the Form 8-K filing is intended to simultaneously satisfy the filing obligation of the registrant under any of the following provisions:
| Written communications pursuant to Rule 425 under the Securities Act (17 CFR 230.425) | |
| Soliciting material pursuant to Rule 14a-12 under the Exchange Act (17 CFR 240.14a-12) | |
| Pre-commencement communications pursuant to Rule 14d-2(b) under the Exchange Act (17 CFR 240.14d-2(b)) | |
| Pre-commencement communications pursuant to Rule 13e-4(c) under the Exchange Act (17 CFR 240.13e-4(c)) |
Indicate by check mark whether the registrant is an emerging growth company as defined in Rule 405 of the Securities Act of 1933 (§230.405 of this chapter) or Rule 12b-2 of the Securities Exchange Act of 1934 (§240.12b-2 of this chapter).
Emerging growth company
If an emerging growth company, indicate by check mark if the registrant has elected not to use the extended transition period for complying with any new or revised financial accounting standards provided pursuant to Section 13(a) of the Exchange Act. ☐
| Item 2.02 | Results of Operations and Financial Condition. |
On January 12, 2021, B. Riley Financial, Inc. (the “Company”) announced preliminary, unaudited estimates of results for the three months and twelve months ended December 31, 2020 based on currently available information (“Preliminary Estimates”). These Preliminary Estimates are being announced in connection with an offering of the Company’s common stock (the “Offering”). In connection with the Offering, the Company filed a preliminary prospectus supplement (the “Preliminary Prospectus Supplement”) with the Securities and Exchange Commission (“SEC”) and issued a press release announcing the launch of the Offering. The Preliminary Prospectus Supplement contains the Preliminary Estimates.
The Preliminary Estimates are not a comprehensive statement of our financial results for the three months and twelve months ended December 31, 2020. We caution that our final results for the three months and twelve months ended December 31, 2020 that we will file with the SEC could vary significantly from these Preliminary Estimates as a result of the completion of our customary year-end closing, review and audit procedures and other developments arising between now and the time that our financial results for the three months and twelve months ended December 31, 2020 are finalized. These preliminary estimates should not be viewed as a substitute for complete financial statements prepared in accordance with GAAP and they are not necessarily indicative of the results to be achieved in any future period. Accordingly, you should not place undue reliance on these preliminary estimates. The preliminary estimates of results included below have been prepared by, and is the responsibility of, the Company’s management. Marcum LLP (“Marcum”), the Company’s independent registered public accounting firm, has not audited, reviewed, compiled or performed any procedures with respect to the accompanying preliminary financial data. Accordingly, Marcum does not express an opinion or any other form of assurance with respect thereto.
For the three months ended December 31, 2020, we estimate that the net income attributable to the Company will be within the range of $162 million and $167 million, or $6.18 to $6.38 per diluted share. This compares to $17.1 million, or $0.59 per diluted share, for the three months ended December 31, 2019. For the twelve months ended December 31, 2020, we estimate that the net income attributable to the Company shall be within the range of $196 million and $201 million, or $7.20 to $7.39 per diluted share, compared to $81.6 million or $2.95 per diluted share, for the twelve months ended December 31, 2019.
For the three months ended December 31, 2020, we estimate that our adjusted EBITDA will be within the range of $253 million and $260 million compared to $50.3 million for the three months ended December 31, 2019. For the twelve months ended December 31, 2020, we estimate that our adjusted EBITDA will be within the range of $399 million and $407 million compared to $207.9 million for the twelve months ended December 31, 2019. Investment adjusted EBITDA for the three months and twelve months ended December 31, 2020 is estimated to be within the range of $133 million and $135 million and $94 million and $97 million, respectively. Operating adjusted EBITDA for the three months and twelve months ended December 31, 2020 is estimated to be within the range of $120 million and $125 million and $305 million and $310 million, respectively. As of December 31, 2020, the Company estimates its cash and investments balance to be approximately $1.3 billion, with over $300 million in total cash and investments, net of debt.
Certain of the information set forth herein, including operating revenue, adjusted EBITDA, operating adjusted EBITDA, investment adjusted EBITDA and total cash and investments, net of debt, may be considered non-GAAP financial measures. We believe this information is useful to investors because it provides a basis for measuring our available capital resources, the operating performance of our business and our revenues and our cash flow, (i) excluding in the case of operating revenues, trading income (losses) and fair value adjustments on loans, (ii) excluding in the case of adjusted EBITDA, net interest expense, provisions for or benefit from income taxes, depreciation, amortization, fair value adjustment, restructuring costs, impairment of tradenames, stock-based compensation and transaction and other expenses, (iii) excluding in the case of operating adjusted EBITDA, aforementioned adjustments for adjusted EBITDA, trading income (losses) and fair value adjustments on loans, and other investment related expenses, (iv) in the case of investment adjusted EBITDA this includes trading income (losses) and fair value adjustments on loans, net of other investment related expenses, and (v) in the case of total cash and investments, net of debt, this includes total cash, net securities and investments, and other minus total debt, that would normally be included in the most directly comparable measures calculated and presented in accordance with Generally Accepted Accounting Principles (“GAAP”). In addition, our management uses these non-GAAP financial measures along with the most directly comparable GAAP financial measures in evaluating our operating performance, capital resources and cash flow. Non-GAAP financial measures should not be considered in isolation from, or as a substitute for, financial information presented in compliance with GAAP, and non-financial measures as reported by us may not be comparable to similarly titled amounts reported by other companies. The following is a reconciliation of Net Income estimates to Adjusted EBITDA and Operating Adjusted EBITDA to the corresponding GAAP measure (in thousands), as well as a reconciliation of diluted income per common share:
1
Reconciliation of Net Income Preliminary Estimate to Adjusted EBITDA Preliminary Estimate
(Unaudited)
(Dollars in thousands)
| Preliminary Estimate | Prior Period | |||||||||||
| Three Months Ended December 31, 2020 | Three Months Ended December 31, 2019 | |||||||||||
| Low | High | Actual | ||||||||||
| Net income attributable to B. Riley Financial, Inc. | $ | 162,000 | $ | 167,100 | $ | 17,129 | ||||||
| Adjustments: | ||||||||||||
| Provision for income taxes | 63,900 | 66,000 | 7,842 | |||||||||
| Interest expense | 16,700 | 16,900 | 15,075 | |||||||||
| Interest income | — | (100 | ) | (248 | ) | |||||||
| Share based payments | 4,300 | 4,500 | 5,640 | |||||||||
| Depreciation and amortization | 4,600 | 4,700 | 4,831 | |||||||||
| Transactions related costs and other | 1,100 | 1,300 | — | |||||||||
| Total EBITDA adjustments | 90,600 | 93,300 | 33,140 | |||||||||
| Adjusted EBITDA | $ | 252,600 | $ | 260,400 | $ | 50,269 | ||||||
| Operating EBITDA Adjustments: | ||||||||||||
| Trading (income) losses and fair value adjustments on loans | (139,000 | ) | (142,000 | ) | (34,733 | ) | ||||||
| Other investment related expenses | 6,400 | 6,600 | 858 | |||||||||
| Total Operating EBITDA Adjustments | (132,600 | ) | (135,400 | ) | (33,875 | ) | ||||||
| Operating Adjusted EBITDA | $ | 120,000 | $ | 125,000 | $ | 16,394 | ||||||
2
Diluted Income per Common Share - Preliminary Estimate
(Unaudited)
(Dollars in thousands, except share data)
| Preliminary Estimate | Prior Period | |||||||||||
| Three Months Ended December 31, 2020 |
Three Months Ended December 31, 2019 |
|||||||||||
| Low | High | Actual | ||||||||||
| Net income attributable to B. Riley Financial, Inc. | $ | 162,000 | $ | 167,100 | $ | 17,129 | ||||||
| Preferred stock dividends | 1,480 | 1,480 | 264 | |||||||||
| Net income available to common shareholders | $ | 160,520 | $ | 165,620 | $ | 16,865 | ||||||
| Diluted income per common share | $ | 6.18 | $ | 6.38 | $ | 0.59 | ||||||
| Weighted average diluted common shares outstanding | 25,960,000 | 25,960,000 | 28,412,871 | |||||||||
3
Reconciliation of Net Income Preliminary Estimate to Adjusted EBITDA Preliminary Estimate
(Unaudited)
(Dollars in thousands)
| Preliminary Estimate | Prior Period | |||||||||||
| Twelve Months Ended December 31, 2020 | Twelve Months Ended December 31, 2019 | |||||||||||
| Low | High | Actual | ||||||||||
| Net income attributable to B. Riley Financial, Inc. | $ | 195,554 | $ | 200,654 | $ | 81,611 | ||||||
| Adjustments: | ||||||||||||
| Provision for income taxes | 77,280 | 79,380 | 34,644 | |||||||||
| Interest expense | 65,237 | 65,437 | 50,205 | |||||||||
| Interest income | (537 | ) | (637 | ) | (1,577 | ) | ||||||
| Share based payments | 18,567 | 18,767 | 15,916 | |||||||||
| Depreciation and amortization | 19,365 | 19,465 | 19,048 | |||||||||
| Restructuring costs | 1,557 | 1,557 | 1,699 | |||||||||
| Impairment of tradenames | 12,500 | 12,500 | — | |||||||||
| Transactions related costs and other | 9,409 | 9,609 | 6,339 | |||||||||
| Total EBITDA adjustments | 203,378 | 206,078 | 126,274 | |||||||||
| Adjusted EBITDA | $ | 398,932 | $ | 406,732 | $ | 207,885 | ||||||
| Operating EBITDA Adjustments: | ||||||||||||
| Trading (income) losses and fair value adjustments on loans | (102,858 | ) | (105,858 | ) | (106,463 | ) | ||||||
| Other investment related expenses | 8,812 | 9,012 | 12,181 | |||||||||
| Total Operating EBITDA Adjustments | (94,046 | ) | (96,846 | ) | (94,282 | ) | ||||||
| Operating Adjusted EBITDA | $ | 304,886 | $ | 309,886 | $ | 113,603 | ||||||
4
Diluted Income per Common Share - Preliminary Estimate
(Unaudited)
(Dollars in thousands, except share data)
| Preliminary Estimate | Prior Period | |||||||||||
| Twelve Months Ended December 31, 2020 |
Twelve Months Ended December 31, 2019 |
|||||||||||
| Low | High | Actual | ||||||||||
| Net income attributable to B. Riley Financial, Inc. | $ | 195,554 | $ | 200,654 | $ | 81,611 | ||||||
| Preferred stock dividends | 4,710 | 4,710 | 264 | |||||||||
| Net income available to common shareholders | $ | 190,844 | $ | 195,944 | $ | 81,347 | ||||||
| Diluted income per common share | $ | 7.20 | $ | 7.39 | $ | 2.95 | ||||||
| Weighted average diluted common shares outstanding | 26,510,000 | 26,510,000 | 27,529,157 | |||||||||
The information disclosed under this Item 2.02, including Exhibit 99.1 hereto, is being furnished and shall not be deemed “filed” for purposes of Section 18 of the Securities Exchange Act of 1934, as amended (the “Exchange Act”) and shall not be deemed incorporated by reference into any filing made under the Securities Act of 1933, as amended (the “Securities Act”), except as expressly set forth by specific reference in such filing.
5
| Item 7.01 | Regulation FD Disclosure. |
On January 12, 2021, the Company issued a press release announcing the commencement of its Offering. The Company expects to grant the underwriters a 30-day option to purchase additional shares of common stock. A copy of the press release is attached hereto as Exhibit 99.2.
In addition, in connection with the public offering, the Company will be making road show presentations to certain existing and potential securityholders of the Company (“Investor Presentation”). The Investor Presentation is attached hereto as Exhibit 99.3.
The information contained in the Investor Presentation is summary information that should be considered in the context of the Company’s filings with the SEC and other public announcements the Company may make by press release or otherwise from time to time.
The information set forth under this Item 7.01, including Exhibit 99.2 and Exhibit 99.3 hereto, is not deemed “filed” for purposes of Section 18 of the Exchange Act, or incorporated by reference in any filing under the Securities Act, except as may be expressly set forth by specific reference in such a filing.
Forward-Looking Statements
This Current Report on Form 8-K (and the exhibits attached hereto) may contain “forward-looking” statements as defined by the Private Securities Litigation Reform Act of 1995 or by the SEC in its rules, regulations and releases. These statements include, but are not limited to, the Company’s anticipated results of operations for 2020, the Company’s plans, objectives, expectations and intentions regarding the performance of its business, the terms and conditions and timing of the common stock offering, the intended use of proceeds of the common stock offering and other non-historical statements. These statements can be identified by the use of words such as “believes,” “anticipates,” “expects,” “intends,” “plans,” “continues,” “estimates,” “predicts,” “projects,” “forecasts,” and similar expressions. All forward looking statements are based on management’s current expectations and beliefs only as of the date of this report and are subject to risks, uncertainties and assumptions that could cause actual results to differ materially from those discussed in, or implied by, the forward-looking statements, including the risks identified and discussed from time to time in the Company’s reports filed with the SEC, including the Company’s most recent Annual Report on Form 10-K for the year ended December 31, 2019 and Quarterly Reports on Form 10-Q for the quarters ended March 31, 2020, June 30, 2020 and September 30, 2020. Readers are strongly encouraged to review carefully the full cautionary statements described in these reports. Except as required by law, the Company undertakes no obligation to revise or update publicly any forward-looking statements to reflect events or circumstances after the date of this report, or to reflect the occurrence of unanticipated events or circumstances.
| Item 9.01 | Financial Statements and Exhibits |
(d) Exhibits
| 99.1 | Press Release Announcing Preliminary Estimates, dated January 12, 2021. |
| 99.2 | Press Release Announcing Offering, dated January 12, 2021. |
| 99.3 | Road Show Materials, dated January 12, 2021. |
6
SIGNATURES
Pursuant to the requirements of the Securities Exchange Act of 1934, the registrant has duly caused this report to be signed on its behalf by the undersigned hereunto duly authorized.
| January 12, 2021 | B. RILEY FINANCIAL, INC. | ||
| By: | /s/ Phillip J. Ahn | ||
| Name: | Phillip J. Ahn | ||
| Title: | Chief Financial Officer and Chief Operating Officer | ||
7
Exhibit 99.1
 |
www.brileyfin.com
|
B. Riley Financial Preliminary Fourth
Quarter and Full Year 2020 Results
Significantly Exceed Prior Guidance
Forecasts Q4 Net Income of $162-$167M vs. Prior Guidance of $109-$112M,
Q4 EPS of $6.18-$6.38 vs. Prior Guidance of $4.15-$4.27,
Q4 Operating Adjusted EBITDA of $120-$125M vs. Prior Guidance of $100-$105M,
Q4 Total Adjusted EBITDA of $253-$260M vs. Prior Guidance of $175-$180M
LOS ANGELES, January 12, 2021 — B. Riley Financial, Inc. (NASDAQ: RILY) (“B. Riley” or “the Company”) today announced certain preliminary estimates for the fourth quarter and full year 2020 ending December 31, 2020.
Fourth Quarter 2020 Preliminary Results
| ● | Net income: $162 to $167 million; $6.18 to $6.38 per diluted share |
| ● | Total adjusted EBITDA: $253 to $260 million |
| ● | Operating adjusted EBITDA: $120 to $125 million |
Full Year 2020 Preliminary Results
| ● | Net income: $196 to $201 million; $7.20 to $7.39 per diluted share |
| ● | Total adjusted EBITDA: $399 to $407 million |
| ● | Operating adjusted EBITDA: $305 to $310 million |
“We are providing preliminary results for the fourth quarter and full year of 2020 that exceed our previously released guidance for net income by over $50 million, operating EBITDA guidance by $20 million and total EBITDA by over $70 million. Our updated estimates reflect better-than-expected operating performance and appreciation in our investment portfolio as of year-end,” said Bryant Riley, Chairman and Co-Chief Executive Officer of B. Riley Financial. “Our Capital Markets business outperformed our initial forecasts, both in terms of our operating results and investments. We expect our cash and investments balance to be approximately $1.3 billion as of year-end, with over $300 million in total cash and investments net of debt. The current momentum of our combined operating units has never been stronger, and we are increasingly excited about the opportunities ahead as we look to continue to build upon our growing platform.”
For the fourth quarter of 2020, net income attributable to the Company is expected to be within the range of $162 million and $167 million. Diluted income per common share is expected to be within the range of $6.18 to $6.38. This compares to $17.1 million and $0.59 per diluted share for the fourth quarter of 2019. The Company estimates fourth quarter total adjusted EBITDA (1) to be within the range of $253 million and $260 million and operating adjusted EBITDA (2) in the range of $120 million and $125 million.
For the full year of 2020, net income attributable to the Company is expected to be within the range of $196 million and $201 million. Diluted income per common share is expected to be within the range of $7.20 to $7.39. This compares to $81.6 million and $2.95 per diluted share for the full year of 2019, representing a year-over-year increase of approximately 140% for the lower end of the range compared to the same prior year period. Total adjusted EBITDA (1) is expected to be within the range of $399 million and $407 million, an increase of over 90% for the lower end of the range when compared with total adjusted EBITDA of $207.9 million from the same prior year period. Operating adjusted EBITDA (2) is expected to be within the range of $305 million to $310 million, a year-over-year increase of over 160% compared to $113.6 million from the prior year period.
As of December 31, 2020, the Company expects its cash and investments balance to be approximately $1.3 billion, with over $300 million in total cash and investments, net of debt (3).
These preliminary estimates are not a comprehensive statement of the Company’s financial results. Actual results for the fourth quarter and full year of 2020 may differ from these preliminary unaudited estimates as a result of the completion of the Company’s customary year-end closing, review and audit procedures and other developments arising between now and the time that its financial results are finalized.
B. Riley Financial, Inc. | www.brileyfin.com | NASDAQ: RILY
About B. Riley Financial
B. Riley Financial (NASDAQ: RILY) provides collaborative financial services solutions tailored to fit the capital raising, business, operational, and financial advisory needs of its clients and partners. B. Riley operates through several subsidiaries which offer a diverse range of complementary end-to-end capabilities spanning investment banking and institutional brokerage, private wealth and investment management, corporate advisory, restructuring, due diligence, forensic accounting, litigation support, appraisal and valuation, and auction and liquidation services. Certain registered affiliates of B. Riley originate and underwrite senior secured loans for asset-rich companies. B. Riley also makes proprietary investments in companies and assets with attractive return profiles. For more information about B. Riley and its affiliated companies, visit www.brileyfin.com.
Footnotes (See "Note Regarding Use of Non-GAAP Financial Measures" for further discussion of these non-GAAP terms.)
(1) Adjusted EBITDA includes earnings before interest, taxes, depreciation, amortization, restructuring costs, share-based payments, impairment of tradenames, and transaction related and other costs. For a definition of adjusted EBITDA and a reconciliation to GAAP financial measures, please see the Appendix.
(2) Operating adjusted EBITDA is defined as adjusted EBITDA excluding trading income (losses) and fair value adjustments on loans and other investment related expenses.
(3) Total cash and investments, net of debt is defined as total cash, net securities and investments, and other minus total debt.
Forward-Looking Statements
Statements in this press release that are not descriptions of historical facts are forward-looking statements that are based on management's current expectations and assumptions and are subject to risks and uncertainties. If such risks or uncertainties materialize or such assumptions prove incorrect, our business, operating results, financial condition and stock price could be materially negatively affected. You should not place undue reliance on such forward-looking statements, which are based on the information currently available to us and speak only as of the date of this press release. Such forward looking statements include, but are not limited to, statements regarding the Company's anticipated results of operations for 2020, as well as statements regarding our excitement and the expected growth of our business segments. Factors that could cause such actual results to differ materially from those contemplated or implied by such forward-looking statements include, without limitation, the risks associated with the unpredictable and ongoing impact of the COVID-19 pandemic and other risks described from time to time in B. Riley Financial, Inc.'s periodic filings with the SEC, including, without limitation, the risks described in B. Riley Financial, Inc.'s Annual Report on Form 10-K for the year ended December 31, 2019 and Quarterly Reports on Form 10-Q for the quarters ended March 31, 2020, June 30, 2020 and September 30, 2020 under the captions "Risk Factors" and "Management's Discussion and Analysis of Financial Condition and Results of Operations" (as applicable). These factors should be considered carefully, and readers are cautioned not to place undue reliance on such forward-looking statements. All information is current as of the date this press release is issued, and B. Riley Financial, Inc. undertakes no duty to update this information.
Note Regarding Use of Non-GAAP Financial Measures
Certain of the information set forth herein, including operating revenue, adjusted EBITDA, operating adjusted EBITDA, and investment adjusted EBITDA may be considered non-GAAP financial measures. B. Riley Financial believes this information is useful to investors because it provides a basis for measuring the Company's available capital resources, the operating performance of its business and its revenues and cash flow, (i) excluding in the case of operating revenues, trading income (losses) and fair value adjustments on loans, (ii) excluding in the case of adjusted EBITDA , net interest expense, provisions for or benefit from income taxes, depreciation, amortization, fair value adjustment, restructuring costs, impairment of trade names, stock-based compensation and transaction and other expenses, (iii) excluding in the case of operating adjusted EBITDA, aforementioned adjustments for adjusted EBITDA, trading income (losses) and fair value adjustments on loans, and other investment related expenses, and (iv) in the case of investment adjusted EBITDA this includes trading income (losses) and fair value adjustments on loans, net of other investment related expenses, and (v) in the case of total cash and investments, net of debt, this includes total cash, net securities and investments, and other minus total debt, that would normally be included in the most directly comparable measures calculated and presented in accordance with Generally Accepted Accounting Principles ("GAAP"). In addition, the Company's management uses these non-GAAP financial measures along with the most directly comparable GAAP financial measures in evaluating the Company's operating performance, capital resources and cash flow. Non-GAAP financial measures should not be considered in isolation from, or as a substitute for, financial information presented in compliance with GAAP, and non-financial measures as reported by the Company may not be comparable to similarly titled amounts reported by other companies.
| Contacts | |
| Investors | Media |
| Investor Relations | Jo Anne McCusker |
| ir@brileyfin.com | jmccusker@brileyfin.com |
| (310) 966-1444 | (646) 885-5425 |
2
B. RILEY FINANCIAL, INC.
Reconciliation of Net Income Preliminary Estimate to Adjusted EBITDA Preliminary Estimate
(Unaudited)
(Dollars in thousands)
| Preliminary Estimate | Prior Period | |||||||||||
| Three Months Ended December 31, 2020 | Three Months Ended December 31, 2019 | |||||||||||
| Low | High | Actual | ||||||||||
| Net income attributable to B. Riley Financial, Inc. | $ | 162,000 | $ | 167,100 | $ | 17,129 | ||||||
| Adjustments: | ||||||||||||
| Provision for income taxes | 63,900 | 66,000 | 7,842 | |||||||||
| Interest expense | 16,700 | 16,900 | 15,075 | |||||||||
| Interest income | — | (100 | ) | (248 | ) | |||||||
| Share based payments | 4,300 | 4,500 | 5,640 | |||||||||
| Depreciation and amortization | 4,600 | 4,700 | 4,831 | |||||||||
| Transactions related costs and other | 1,100 | 1,300 | — | |||||||||
| Total EBITDA adjustments | 90,600 | 93,300 | 33,140 | |||||||||
| Adjusted EBITDA | $ | 252,600 | $ | 260,400 | $ | 50,269 | ||||||
| Operating EBITDA Adjustments: | ||||||||||||
| Trading (income) losses and fair value adjustments on loans | (139,000 | ) | (142,000 | ) | (34,733 | ) | ||||||
| Other investment related expenses | 6,400 | 6,600 | 858 | |||||||||
| Total Operating EBITDA Adjustments | (132,600 | ) | (135,400 | ) | (33,875 | ) | ||||||
| Operating Adjusted EBITDA | $ | 120,000 | $ | 125,000 | $ | 16,394 | ||||||
B. RILEY FINANCIAL, INC.
Diluted Income per Common Share - Preliminary Estimate
(Unaudited)
(Dollars in thousands, except share data)
| Preliminary Estimate | Prior Period | |||||||||||
| Three Months Ended December 31, 2020 | Three Months Ended December 31, 2019 | |||||||||||
| Low | High | Actual | ||||||||||
| Net income attributable to B. Riley Financial, Inc. | $ | 162,000 | $ | 167,100 | $ | 17,129 | ||||||
| Preferred stock dividends | 1,480 | 1,480 | 264 | |||||||||
| Net income available to common shareholders | $ | 160,520 | $ | 165,620 | $ | 16,865 | ||||||
| Diluted income per common share | $ | 6.18 | $ | 6.38 | $ | 0.59 | ||||||
| Weighted average diluted common shares outstanding | 25,960,000 | 25,960,000 | 28,412,871 | |||||||||
3
B. RILEY FINANCIAL, INC.
Reconciliation of Net Income Preliminary Estimate to Adjusted EBITDA Preliminary Estimate
(Unaudited)
(Dollars in thousands)
| Preliminary Estimate | Prior Period | |||||||||||
| Twelve Months Ended December 31, 2020 | Twelve Months Ended December 31, 2019 | |||||||||||
| Low | High | Actual | ||||||||||
| Net income attributable to B. Riley Financial, Inc. | $ | 195,554 | $ | 200,654 | $ | 81,611 | ||||||
| Adjustments: | ||||||||||||
| Provision for income taxes | 77,280 | 79,380 | 34,644 | |||||||||
| Interest expense | 65,237 | 65,437 | 50,205 | |||||||||
| Interest income | (537 | ) | (637 | ) | (1,577 | ) | ||||||
| Share based payments | 18,567 | 18,767 | 15,916 | |||||||||
| Depreciation and amortization | 19,365 | 19,465 | 19,048 | |||||||||
| Restructuring costs | 1,557 | 1,557 | 1,699 | |||||||||
| Impairment of tradenames | 12,500 | 12,500 | — | |||||||||
| Transactions related costs and other | 9,409 | 9,609 | 6,339 | |||||||||
| Total EBITDA adjustments | 203,378 | 206,078 | 126,274 | |||||||||
| Adjusted EBITDA | $ | 398,932 | $ | 406,732 | $ | 207,885 | ||||||
| Operating EBITDA Adjustments: | ||||||||||||
| Trading (income) losses and fair value adjustments on loans | (102,858 | ) | (105,858 | ) | (106,463 | ) | ||||||
| Other investment related expenses | 8,812 | 9,012 | 12,181 | |||||||||
| Total Operating EBITDA Adjustments | (94,046 | ) | (96,846 | ) | (94,282 | ) | ||||||
| Operating Adjusted EBITDA | $ | 304,886 | $ | 309,886 | $ | 113,603 | ||||||
B. RILEY FINANCIAL, INC.
Diluted Income per Common Share - Preliminary Estimate
(Unaudited)
(Dollars in thousands, except share data)
| Preliminary Estimate | Prior Period | |||||||||||
| Twelve Months Ended December 31, 2020 | Twelve Months Ended December 31, 2019 | |||||||||||
| Low | High | Actual | ||||||||||
| Net income attributable to B. Riley Financial, Inc. | $ | 195,554 | $ | 200,654 | $ | 81,611 | ||||||
| Preferred stock dividends | 4,710 | 4,710 | 264 | |||||||||
| Net income available to common shareholders | $ | 190,844 | $ | 195,944 | $ | 81,347 | ||||||
| Diluted income per common share | $ | 7.20 | $ | 7.39 | $ | 2.95 | ||||||
| Weighted average diluted common shares outstanding | 26,510,000 | 26,510,000 | 27,529,157 | |||||||||
4
B. RILEY FINANCIAL, INC.
Reconciliation of Net Income Prior Guidance to Adjusted EBITDA Prior Guidance
(Unaudited)
(Dollars in thousands)
| Prior Guidance (12/17/20) | Prior Guidance (12/17/20) | |||||||||||||||
| Three Months Ended December 31, 2020 | Twelve Months Ended December 31, 2020 | |||||||||||||||
| Low | High | Low | High | |||||||||||||
| Net income attributable to B. Riley Financial, Inc. | $ | 109,000 | $ | 112,200 | $ | 142,554 | $ | 145,754 | ||||||||
| Adjustments: | ||||||||||||||||
| Provision for income taxes | 40,800 | 42,200 | 54,180 | 55,580 | ||||||||||||
| Interest expense | 16,200 | 16,400 | 64,737 | 64,937 | ||||||||||||
| Interest income | (100 | ) | (100 | ) | (637 | ) | (637 | ) | ||||||||
| Share based payments | 4,300 | 4,500 | 18,567 | 18,767 | ||||||||||||
| Depreciation and amortization | 4,700 | 4,700 | 19,465 | 19,465 | ||||||||||||
| Restructuring costs | — | — | 1,557 | 1,557 | ||||||||||||
| Impairment of tradenames | — | — | 12,500 | 12,500 | ||||||||||||
| Transactions related costs and other | 300 | 300 | 8,609 | 8,609 | ||||||||||||
| Total EBITDA adjustments | 66,200 | 68,000 | 178,978 | 180,778 | ||||||||||||
| Adjusted EBITDA | $ | 175,200 | $ | 180,200 | $ | 321,532 | $ | 326,532 | ||||||||
| Operating EBITDA Adjustments: | ||||||||||||||||
| Trading (income) losses and fair value adjustments on loans | (80,000 | ) | (80,000 | ) | (43,858 | ) | (43,858 | ) | ||||||||
| Other investment related expenses | 4,800 | 4,800 | 7,212 | 7,212 | ||||||||||||
| Total Operating EBITDA Adjustments | (75,200 | ) | (75,200 | ) | (36,646 | ) | (36,646 | ) | ||||||||
| Operating Adjusted EBITDA | $ | 100,000 | $ | 105,000 | $ | 284,886 | $ | 289,886 | ||||||||
B. RILEY FINANCIAL, INC.
Diluted Income per Common Share - Prior Guidance
(Unaudited)
(Dollars in thousands, except share data)
| Prior Guidance (12/17/20) | Prior Guidance (12/17/20) | |||||||||||||||
| Three Months Ended December 31, 2020 | Twelve Months Ended December 31, 2020 | |||||||||||||||
| Low | High | Low | High | |||||||||||||
| Net income attributable to B. Riley Financial, Inc. | $ | 109,000 | $ | 112,200 | $ | 142,554 | $ | 145,754 | ||||||||
| Preferred stock dividends | 1,500 | 1,500 | 4,900 | 4,900 | ||||||||||||
| Net income available to common shareholders | $ | 107,500 | $ | 110,700 | $ | 137,654 | $ | 140,854 | ||||||||
| Diluted income per common share | $ | 4.15 | $ | 4.27 | $ | 5.19 | $ | 5.31 | ||||||||
| Weighted average diluted common shares outstanding | 25,930,000 | 25,930,000 | 26,510,000 | 26,510,000 | ||||||||||||
Source: B. Riley Financial, Inc.
# # #
5
Exhibit 99.2
 |
www.brileyfin.com |
B. Riley Financial Announces Public Offering
of Common Stock
LOS ANGELES, January 12, 2021 – B. Riley Financial, Inc. (NASDAQ: RILY) (“B. Riley” or the “Company”) today announced it has commenced an underwritten public offering of 870,000 shares of its common stock (the “Offering”), subject to market and certain other conditions. The Company expects to grant the underwriter a 30-day option to purchase additional shares of common stock in connection with the Offering. Certain of the Company’s officers, directors and employees have indicated an interest in participating in this offering.
The Company expects to use the net proceeds of this offering for general corporate purposes, including funding future acquisitions and investments, making capital expenditures and funding working capital.
B. Riley Securities, Inc. is acting as sole book-running manager for the offering.
The shares of common stock will be offered under the Company’s shelf registration statement on Form S-3, which was declared effective by the Securities and Exchange Commission (“SEC”) on February 24, 2020. The offering will be made only by means of a prospectus supplement and accompanying base prospectus.
Copies of the preliminary prospectus supplement and the accompanying base prospectus may be obtained on the SEC’s website at www.sec.gov, or by contacting B. Riley Securities by telephone at (703) 312-9580, or by emailing prospectuses@brileyfin.com.
This press release shall not constitute an offer to sell or the solicitation of an offer to buy, nor shall there be any sale of these securities in any state or jurisdiction in which such offer, sale or solicitation would be unlawful prior to registration or qualification under the securities laws of any such state or jurisdiction.
About B. Riley Financial, Inc. (NASDAQ: RILY)
B. Riley Financial, Inc. provides collaborative financial services solutions tailored to fit the capital raising, business, operational, and financial advisory needs of its clients and partners. B. Riley operates through several subsidiaries which offer a diverse range of complementary end-to-end capabilities spanning investment banking and institutional brokerage, private wealth and investment management, corporate advisory, restructuring, due diligence, forensic accounting, litigation support, appraisal and valuation, and auction and liquidation services. Certain registered affiliates of B. Riley originate and underwrite senior secured loans for asset-rich companies. B. Riley also makes proprietary investments in companies and assets with attractive return profiles.
Forward-Looking Statements
Statements in this press release that are not descriptions of historical facts are forward-looking statements that are based on management’s current expectations and assumptions and are subject to risks and uncertainties. If such risks or uncertainties materialize or such assumptions prove incorrect, our business, operating results, financial condition and stock price could be materially negatively affected. You should not place undue reliance on such forward-looking statements, which are based on the information currently available to us and speak only as of the date of this press release. Such forward looking statements include, but are not limited to, statements regarding the terms and conditions and timing of the common stock offering and the intended use of proceeds. Because these forward-looking statements involve known and unknown risks and uncertainties, there are important factors that could cause actual results, events or developments to differ materially from those expressed or implied by these forward-looking statements. Factors that could cause actual results to differ include (without limitation) the possibility that the common stock offering will not be consummated at the expected time, on the expected terms, or at all; and the Company’s financial performance; and those risks described from time to time in B. Riley’s periodic filings with the SEC, including, without limitation, the risks described in B. Riley’s Annual Report on Form 10-K for the year ended December 31, 2019 under the captions “Risk Factors” and “Management’s Discussion and Analysis of Financial Condition and Results of Operations.” Additional information is also set forth in our Quarterly Reports on Form 10-Q for the quarters ended March 31, 2020, June 30, 2020 and September 30, 2020. These factors should be considered carefully, and readers are cautioned not to place undue reliance on such forward-looking statements. All information is current as of the date this press release is issued, and B. Riley undertakes no duty to update this information.
| Contacts | |
| Investors | Media |
| Investor Relations | Jo Anne McCusker |
| ir@brileyfin.com | jmccusker@brileyfin.com |
| (310) 966-1444 | (646) 885-5425 |
| Source: B. Riley Financial, Inc. |
# # #
B. Riley Financial, Inc. | www.brileyfin.com | NASDAQ: RILY
Exhibit 99.3

1 Investor Presentation January 11 th , 2021

2 This presentation contains statements that are forward - looking statements within the meaning of Section 27 A of the Securities Act of 1933 , as amended, and Section 21 E of the Securities Exchange Act of 1934 , as amended that are based on management’s current expectations and assumptions and are subject to risks and uncertainties . These forward looking statements can often be identified by their use of words such as “anticipates,” “believes,” “can,” “continue,” “could,” “estimates,” “expects,” “forecast,” “intends,” “may,” “outlook,” “plans,” “potential,” “predicts,” “projects,” “should,” “target,” “will,” “would” or the negative of these terms or other comparable terminology . Such forward looking statements include, but are not limited to, expressed or implied statements regarding future financial performance and future dividends, the effects of our business model, the effects of our balance sheet on our ability to pursue business opportunities, statements regarding the terms and conditions and timing of the common stock offering and the intended use of proceeds, the effects and anticipated benefits of our acquisitions and related actions, the strength of our business segments, assessments of future opportunities and performance, expectations regarding future transactions, and the financial impact, size and consistency of returns and timing thereof, expectations regarding market dynamics, as well as statements regarding the effect of investments in our business segments . Because these forward - looking statements involve known and unknown risks and uncertainties, there are important factors that could cause actual results, events or developments to differ materially from those expressed or implied by these forward - looking statements . Factors that could cause actual results to differ from those contained in the forward - looking statements include but are not limited to risks related to : the unpredictable and ongoing impact of the COVID - 19 pandemic ; volatility in our revenues and results of operations ; changing conditions in the financial markets ; our ability to generate sufficient revenues to achieve and maintain profitability ; the short term nature of our engagements ; the accuracy of our estimates and valuations of inventory or assets in “guarantee” based engagements ; competition in the asset management business ; potential losses related to our auction or liquidation engagements ; our dependence on communications, information and other systems and third parties ; potential losses related to purchase transactions in our auctions and liquidations business ; the potential loss of financial institution clients ; potential losses from or illiquidity of our proprietary investments ; changing economic and market conditions ; potential liability and harm to our reputation if we were to provide an inaccurate appraisal or valuation ; failure to successfully compete in any of our segments ; loss of key personnel ; our ability to borrow under our credit facilities or raise additional funds through offerings as necessary ; failure to comply with the terms of our credit agreements ; our ability to meet future capital requirements ; and the diversion of management time on acquisition - related issues ; and other risks described from time to time in B . Riley Financial, Inc . ’s periodic filings with the SEC, including, without limitation, the risks described in B . Riley Financial, Inc . 's Annual Report on Form 10 - K for the year ended December 31 , 2019 and Quarterly Reports on Form 10 - Q for the quarte rs ended March 31 , 2020 , June 30 , 2020 and September 30 , 2020 under the captions "Risk Factors" and "Management's Discussion and Analysis of Financial Condition and Results of Operations . ” These factors should be considered carefully and readers are cautioned not to place undue reliance on such forward - looking statements . All information is current as of the date this presentation is issued, and B . Riley Financial, Inc . undertakes no duty to update this information . This presentation includes certain non - GAAP financial measures intended to supplement, not substitute for, comparable GAAP measures . Reconciliation of certain non - GAAP financial measures are provided in the appendix to this presentation . This presentation does not constitute an offer to sell or the solicitation of an offer to buy any securities . Any offers, solicitations or offers to buy, or any sales of securities will be made in accordance with the registration requirements of the Securities Act of 1933 , as amended . A registration statement was previously filed by the Company with the SEC and declared effective by the SEC on February 24 , 2020 and a preliminary prospectus will be filed by the Company . The offering will be made only by means of a prospectus . Copies of the preliminary prospectus relating to these securities may be obtained when available without charge from the offices of B . Riley Securities, Inc . , at 1300 North 17 th Street, Suite 1300 , Arlington, VA 22209 or by calling ( 703 ) 312 - 9580 or by emailing prospectuses@brileyfin . com . Safe Harbor Statement

3 I. Transaction Summary II. B. Riley Financial at a Glance III. Business Overview IV. Financial Overview V. Appendix Table of Contents

4 I. Transaction Summary
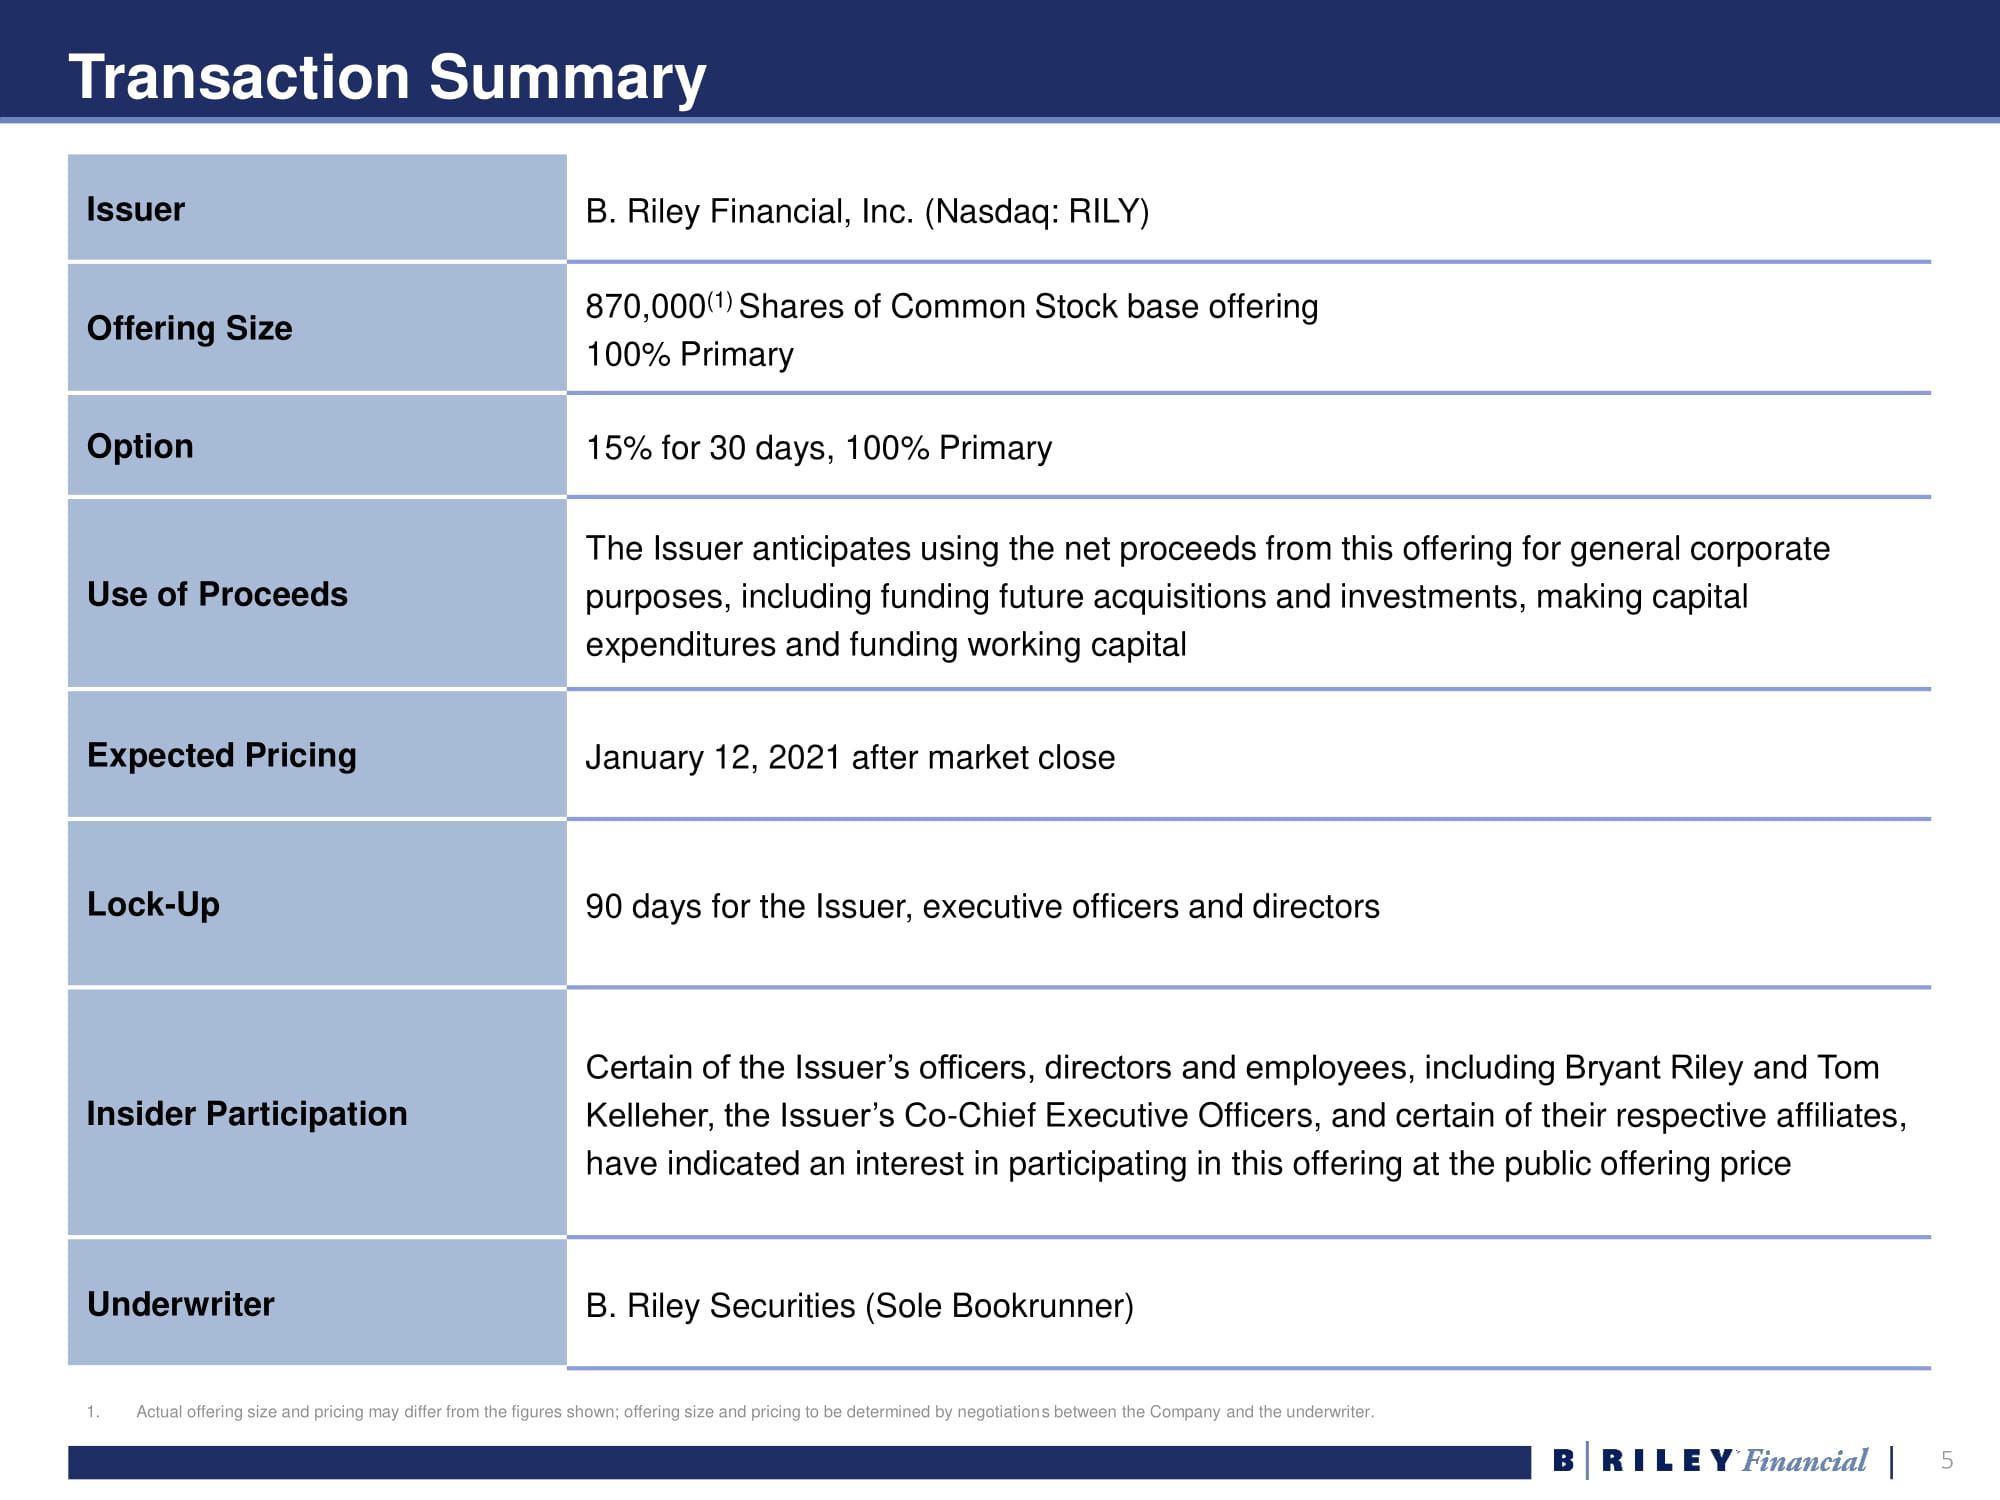
5 Transaction Summary 1. Actual offering size and pricing may differ from the figures shown; offering size and pricing to be determined by negotiation s b etween the Company and the underwriter. Issuer B. Riley Financial, Inc. (Nasdaq: RILY) Offering Size 870,000 (1) Shares of Common Stock base offering 100% Primary Option 15% for 30 days, 100% Primary Use of Proceeds The Issuer anticipates using the net proceeds from this offering for general corporate purposes, including funding future acquisitions and investments, making capital expenditures and funding working capital Expected Pricing January 12, 2021 after market close Lock - Up 90 days for the Issuer, executive officers and directors Insider Participation Certain of the Issuer’s officers, directors and employees, including Bryant Riley and Tom Kelleher, the Issuer’s Co - Chief Executive Officers, and certain of their respective affiliates, have indicated an interest in participating in this offering at the public offering price Underwriter B. Riley Securities (Sole Bookrunner)

6 II. B. Riley Financial at a Glance

7 B. Riley Financial (NASDAQ:RILY) * International operations in Germany, Australia and India Bryant Riley Chairman & Co - CEO Tom Kelleher Co - CEO Phil Ahn CFO & COO Kenny Young President Alan Forman EVP General Counsel Dan Shribman Chief Investment Officer Key Executives Locations * Overview B . Riley Financial, Inc . (“B . Riley”) is a financial services and business advisory firm which provides tailored solutions to meet the strategic, operational and capital needs of its clients and partners through a diverse range of collaborative and complementary business capabilities . ● Founded in 1997 ● Publicly listed in 2014 ● Headquartered in Los Angeles ● 50+ offices across the U.S. ● 1,000 employees 1 ● Long - standing management ● Strong investment acumen ● History of returning capital to stockholders ● 20+ years of continued growth 1. Figure shown is an approximation and does not reflect actual number of employees.

8 Origin and Historical Timeline With over 20 years of continued growth, B. Riley has developed a platform that offers diverse revenue streams and a full suite of end - to - end, complementary services for clients and partners
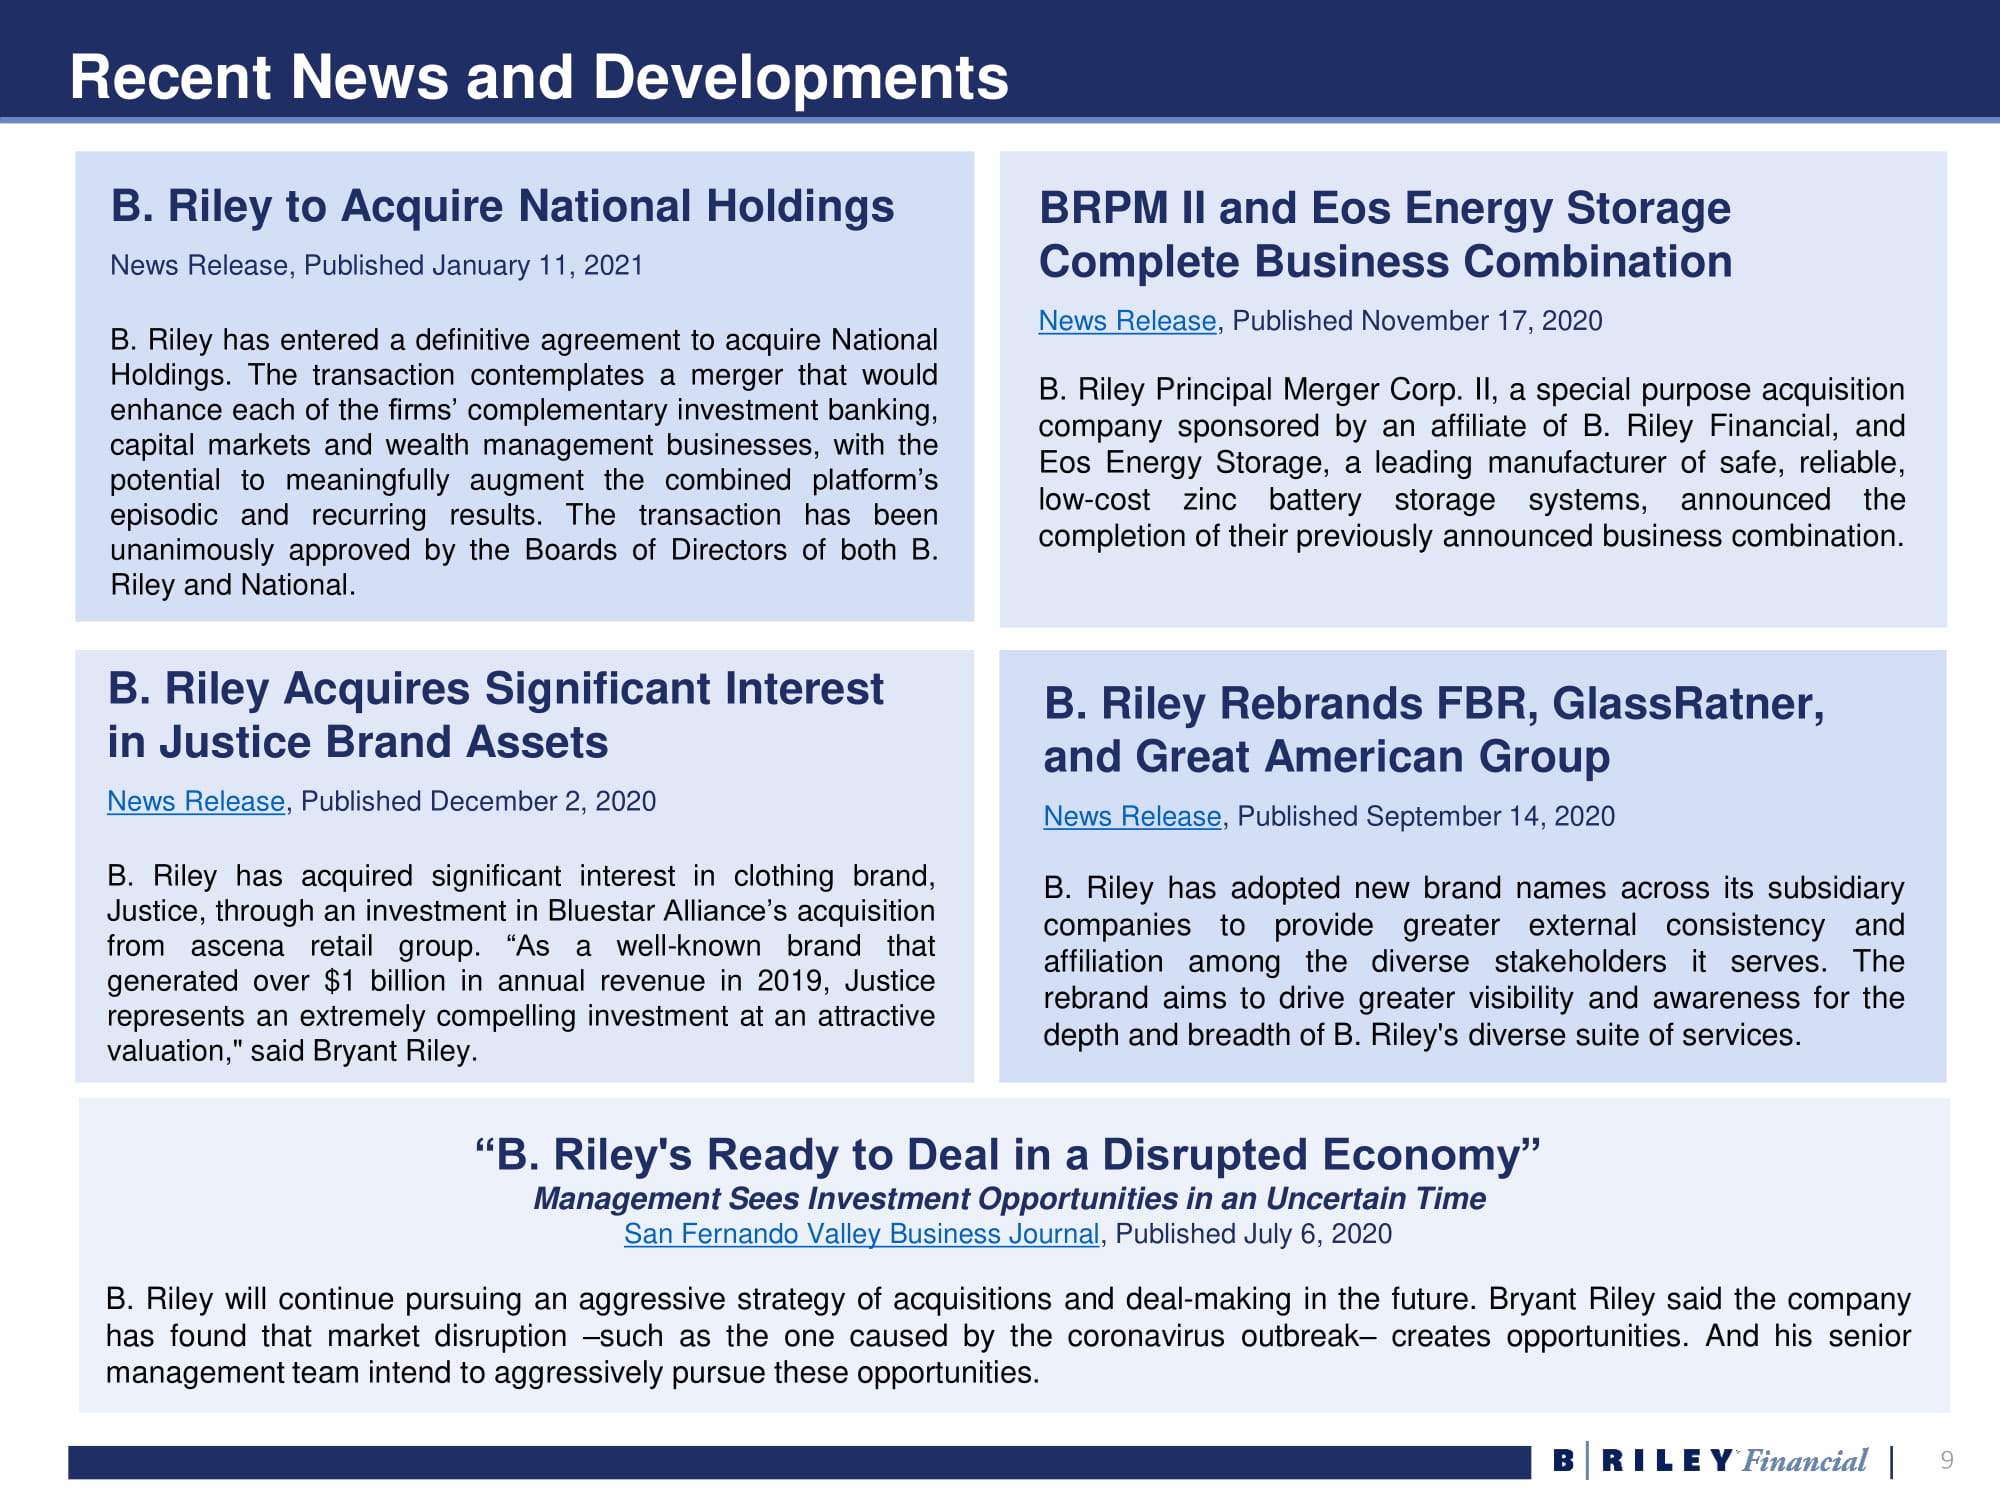
9 Recent News and Developments “B. Riley's Ready to Deal in a Disrupted Economy” Management Sees Investment Opportunities in an Uncertain Time San Fernando Valley Business Journal , Published July 6, 2020 B . Riley will continue pursuing an aggressive strategy of acquisitions and deal - making in the future . Bryant Riley said the company has found that market disruption – such as the one caused by the coronavirus outbreak – creates opportunities . And his senior management team intend to aggressively pursue these opportunities . BRPM II and Eos Energy Storage Complete Business Combination News Release , Published November 17, 2020 B . Riley Principal Merger Corp . II, a special purpose acquisition company sponsored by an affiliate of B . Riley Financial, and Eos Energy Storage, a leading manufacturer of safe, reliable, low - cost zinc battery storage systems, announced the completion of their previously announced business combination . B. Riley Rebrands FBR, GlassRatner, and Great American Group News Release , Published September 14, 2020 B . Riley has adopted new brand names across its subsidiary companies to provide greater external consistency and affiliation among the diverse stakeholders it serves . The rebrand aims to drive greater visibility and awareness for the depth and breadth of B . Riley's diverse suite of services . B. Riley to Acquire National Holdings News Release, Published January 11, 2021 B . Riley has entered a definitive agreement to acquire National Holdings . The transaction contemplates a merger that would enhance each of the firms’ complementary investment banking, capital markets and wealth management businesses, with the potential to meaningfully augment the combined platform’s episodic and recurring results . The transaction has been unanimously approved by the Boards of Directors of both B . Riley and National . B. Riley Acquires Significant Interest in Justice Brand Assets News Release , Published December 2, 2020 B . Riley has acquired significant interest in clothing brand, Justice, through an investment in Bluestar Alliance’s acquisition from ascena retail group . “As a well - known brand that generated over $ 1 billion in annual revenue in 2019 , Justice represents an extremely compelling investment at an attractive valuation," said Bryant Riley .

10 Financial Summary $423M $652M $900M FY 2018 FY 2019 FY 2020P Annual Consolidated Adj. EBITDA (1) Annual Consolidated Revenues (1) Overview 1. 2020 Revenue and EBITDA are preliminary estimated numbers provided by the Company. Final results for the twelve months ended Dec ember 31, 2020 could vary significantly from these preliminary estimates as a result of the completion of our customary year - end closing, review and audit procedures and other developments arising between now and the time that our financi al results are finalized. Offers revenue diversification through a mix of steady, recurring revenue sources and episodic opportunities Episodic Operating Businesses ● Investment Banking and Capital Markets ● Retail Liquidation Steady Operating Businesses ● Principal Investments (magicJack, United Online) ● Specialty Financial Consulting ● Appraisal and Valuation ● Wealth Management Proprietary Investments ● Opportunistic co - investments with client - partners ● Benefit from our operational, financial, industry expertise ● Create opportunities for operating business ● Drive shareholder value $90M $208M FY 2018 FY 2019 FY 2020P $399M - $407M

11 Preliminary Estimates for Q4 2020 and FY 2020 1. Net Income attributable to B. Riley Financial 2. Operating Adjusted EBITDA is defined as Adjusted EBITDA excluding (i) Trading Income (losses) and Fair Value Adjustments on L oan s and (ii) other investment related expenses. 3. Investment Adjusted EBITDA is defined as Trading Income (losses) and Fair Value Adjustments on Loans, less other investment r ela ted expenses. 4. Adjusted EBITDA includes earnings before interest, taxes, depreciation, amortization, restructuring costs, share - based payments, impairment of tradenames, and transaction related and other costs. 5. Final results for the three months and twelve months ended December 31, 2020 could vary significantly from these preliminary est imates as a result of the completion of our customary year - end closing, review and audit procedures and other developments arising between now and the time that our financial results are finalized. Financial Highlights (Annual) FY 2019 FY 2020 FY 2020 (5) Net Income (1) $82 $143 - $146 $196 - $201 Operating Adj. EBITDA (2) $114 $285 - $290 $305 - $310 Investment Adj. EBITDA (3) $94 $37 $94 - $97 Total Adj. EBITDA (4) $208 $322 - $327 $399 - $407 Financial Highlights (Quarter) Q4 2019 Q4 2020 Q4 2020 (5) Net Income (1) $17 $109 - $112 $162 - $167 Operating Adj. EBITDA (2) $16 $100 - $105 $120 - $125 Investment Adj. EBITDA (3) $34 $75 $133 - $135 Total Adj. EBITDA (4) $50 $175 - $180 $253 - $260 ($ in Millions) ($ in Millions) Preliminary Estimates Prior Guidance 12/17/20 Prior Guidance 12/17/20 Preliminary Estimates

12 Maintain Significant Ownership, Strong Shareholder Alignment $0.28 $0.67 $0.74 $1.49 $1.33 $4.86 2016 2017 2018 2019 2020 Special Dividend Regular Dividend Cumulative 1. There can be no assurance that we will continue to generate sufficient cash to pay dividends or that we will pay dividends in fu ture periods. Further, the issuance of preferred stock may reduce or eliminate our ability to make common stock dividends. 2. Insider purchase data from 3/13/2018 to 12/31/20. Historical Dividends Common Dividends (1) ● Regular quarterly dividend of $0.375 per share ● Raised from $0.30 per share on October 29, 2020 ● Previously raised from $0.25 on July 30, 2020 ● Cumulative total of approximately $4.86 per common share returned to shareholders from September 2014 to November 2020 Insider Ownership (2) ● 27.5% of total holdings owned by executives and board ● 217K open market purchases in 2020 ● 665K open market purchases since 2018 Historical Share Price Performance $10.00 $20.00 $30.00 $40.00 $50.00 Jan-19 May-19 Sep-19 Dec-19 May-20 Aug-20 Dec-20
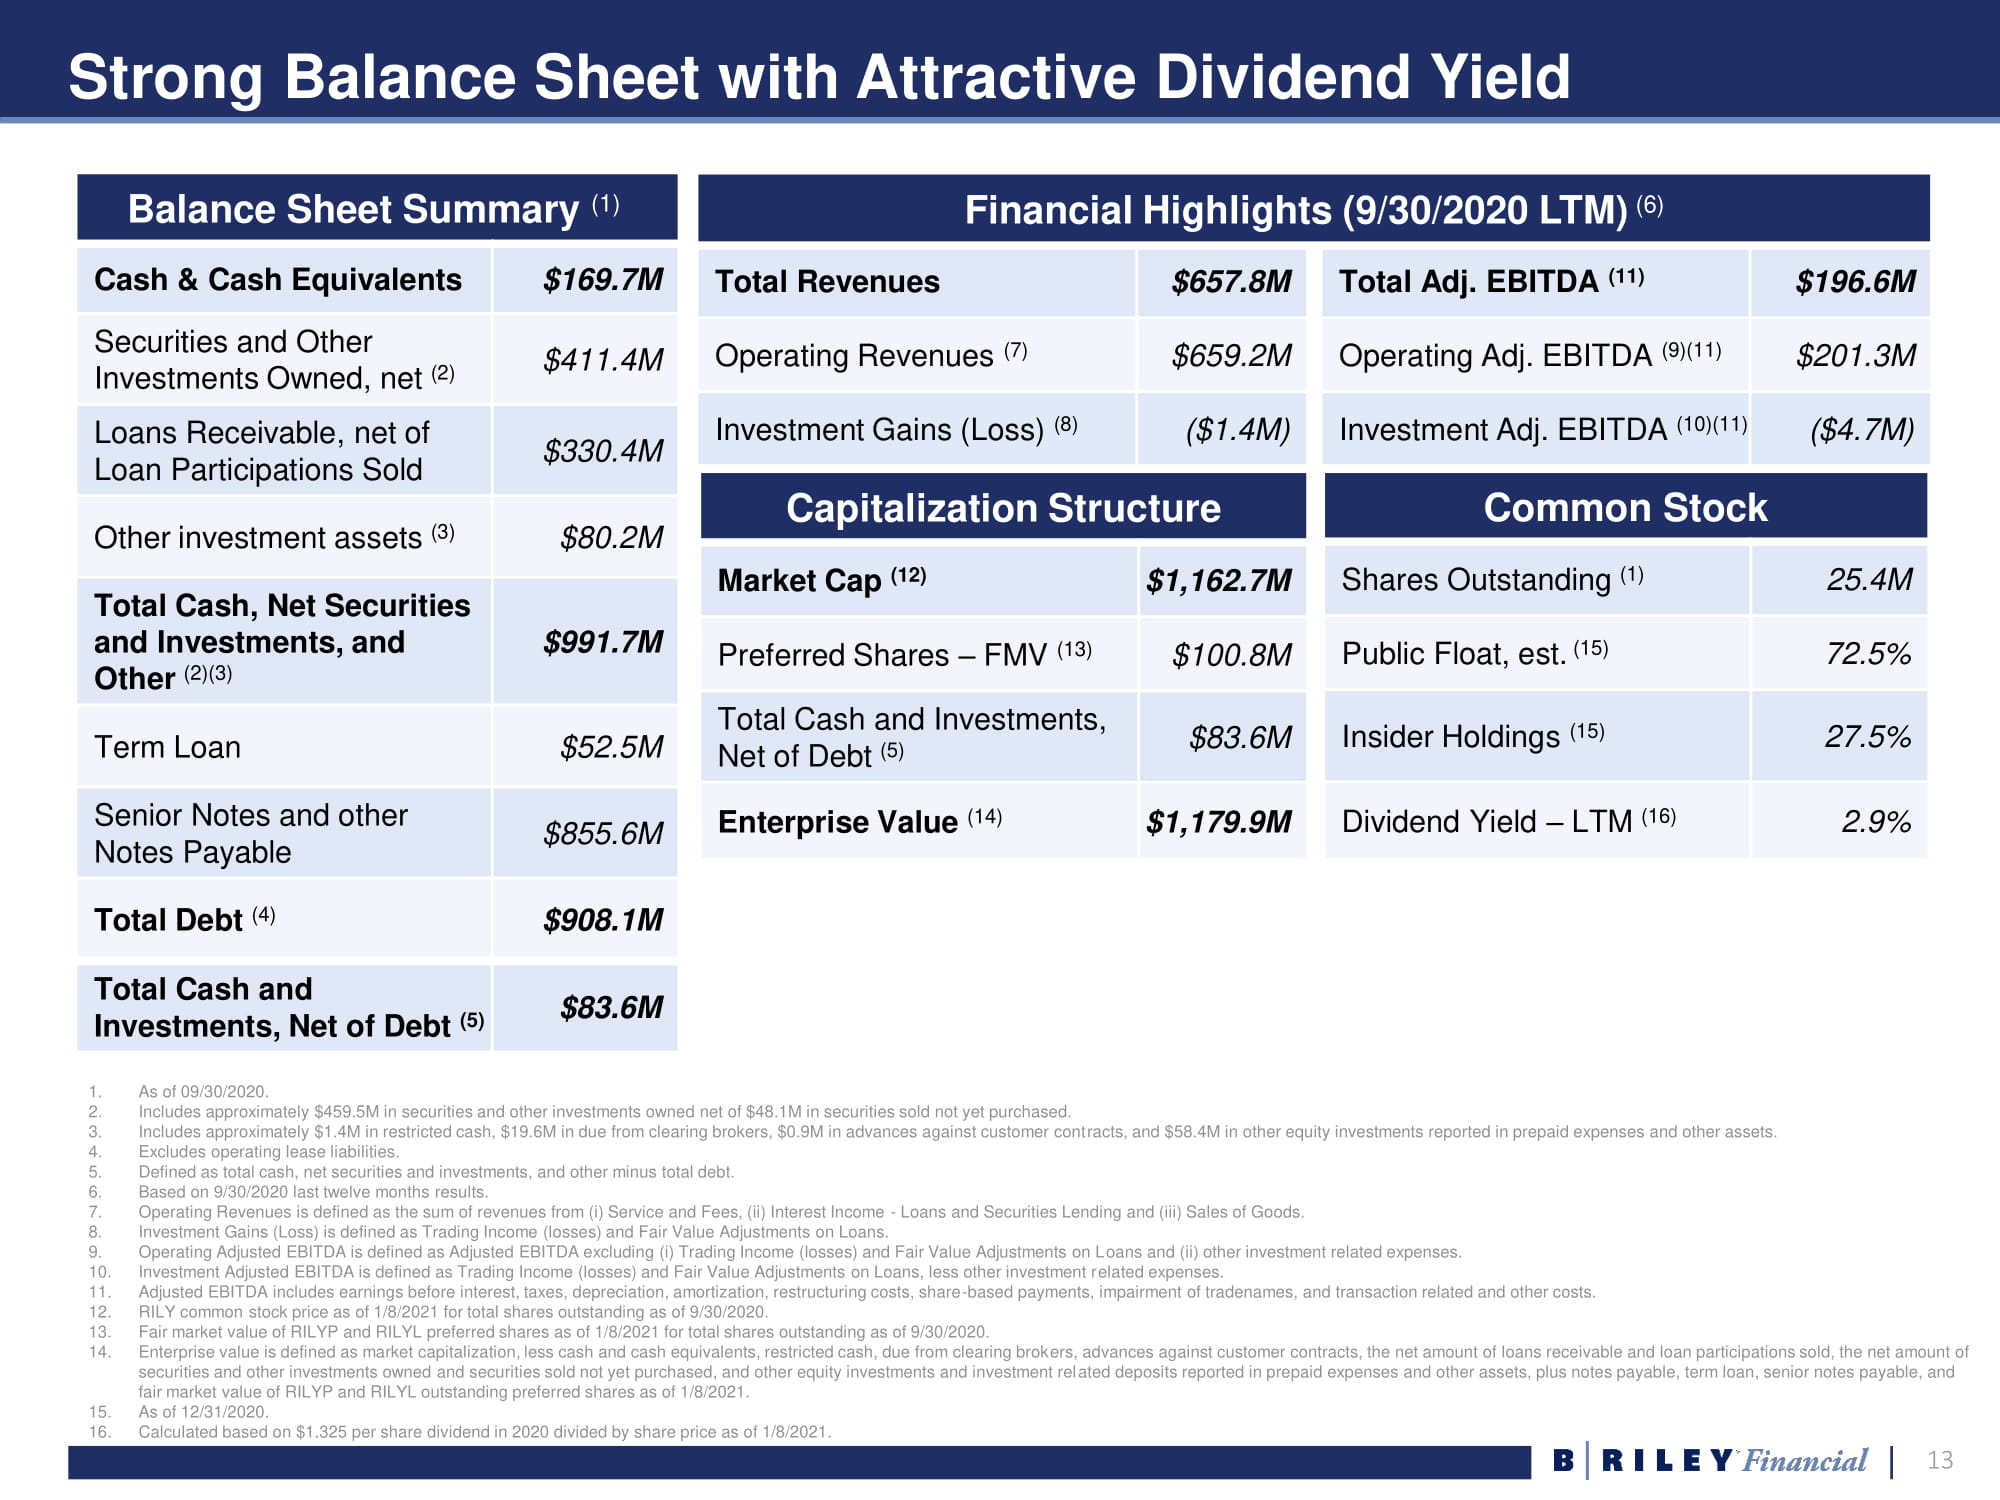
13 Strong Balance Sheet with Attractive Dividend Yield 1. As of 09/30/2020. 2. Includes approximately $459.5M in securities and other investments owned net of $48.1M in securities sold not yet purchased. 3. Includes approximately $1.4M in restricted cash, $19.6M in due from clearing brokers, $0.9M in advances against customer cont rac ts, and $58.4M in other equity investments reported in prepaid expenses and other assets. 4. Excludes operating lease liabilities. 5. Defined as total cash, net securities and investments, and other minus total debt. 6. Based on 9/30/2020 last twelve months results. 7. Operating Revenues is defined as the sum of revenues from (i) Service and Fees, (ii) Interest Income - Loans and Securities Lend ing and (iii) Sales of Goods. 8. Investment Gains (Loss) is defined as Trading Income (losses) and Fair Value Adjustments on Loans. 9. Operating Adjusted EBITDA is defined as Adjusted EBITDA excluding (i) Trading Income (losses) and Fair Value Adjustments on L oan s and (ii) other investment related expenses. 10. Investment Adjusted EBITDA is defined as Trading Income (losses) and Fair Value Adjustments on Loans, less other investment r ela ted expenses. 11. Adjusted EBITDA includes earnings before interest, taxes, depreciation, amortization, restructuring costs, share - based payments, impairment of tradenames, and transaction related and other costs. 12. RILY common stock price as of 1/8/2021 for total shares outstanding as of 9/30/2020. 13. Fair market value of RILYP and RILYL preferred shares as of 1/8/2021 for total shares outstanding as of 9/30/2020. 14. Enterprise value is defined as market capitalization, less cash and cash equivalents, restricted cash, due from clearing brok ers , advances against customer contracts, the net amount of loans receivable and loan participations sold, the net amount of securities and other investments owned and securities sold not yet purchased, and other equity investments and investment rel ate d deposits reported in prepaid expenses and other assets, plus notes payable, term loan, senior notes payable, and fair market value of RILYP and RILYL outstanding preferred shares as of 1/8/2021. 15. As of 12/31/2020. 16. Calculated based on $1.325 per share dividend in 2020 divided by share price as of 1/8/2021. Common Stock Shares Outstanding (1) 25.4M Public Float, est. (15) 72.5% Insider Holdings (15) 27.5% Dividend Yield – LTM (16) 2.9% Balance Sheet Summary (1) Cash & Cash Equivalents $169.7M Securities and Other Investments Owned, net (2) $411.4M Loans Receivable, net of Loan Participations Sold $330.4M Other investment assets (3) $80.2M Total Cash, Net Securities and Investments, and Other (2)(3) $991.7M Term Loan $52.5M Senior Notes and other Notes Payable $855.6M Total Debt (4) $908.1M Capitalization Structure Market Cap (12) $1,162.7M Preferred Shares – FMV (13) $100.8M Total Cash and Investments, Net of Debt (5) $83.6M Enterprise Value (14) $1,179.9M Total Adj. EBITDA (11) $196.6M Operating Adj. EBITDA (9)(11) $201.3M Investment Adj. EBITDA (10)(11) ($4.7M) Total Cash and Investments, Net of Debt (5) $83.6M Total Revenues $657.8M Operating Revenues (7) $659.2M Investment Gains (Loss) (8) ($1.4M) Financial Highlights (9/30/2020 LTM) (6)

14 III. Business Overview

15 Our Structure and Diverse Business Mix Investment Banking • Full - service investment bank • Capital markets, M&A, restructuring • 400+ companies covered by equity research (1) • 1,000 + institutional clients (2) Complementary mix of steady cash flow and episodic higher margin businesses Retail Liquidation • Leading operator of retail, wholesale, industrial auctions and liquidations • 3,900+ store closures in 2019 with $2.9B+ in associated liquidation inventory value 1. Companies covered by B. Riley Securities Equity Research division as of 1/4/21. 2. B. Riley Securities institutional sales & trading clients as of 9/30/20. 3. Figures shown are approximations and do not reflect actual number of Assets under Administration, Active Client Accounts. Financial Advisors and Branch Locations as of 01/08/21. Principal Investments • Proprietary investments • Control and minority investments • Venture Capital Appraisal • Equipment, inventory, real estate ABL appraisals • 1,000+ company appraisals per year Wealth Management • Private wealth services • 170+ financial advisors (3) • $10B+ in client AUM (3) Specialty Financial Advisory • Bankruptcy, financial, operational restructuring consulting • Forensic accounting, litigation support • Valuation disputes, fraud investigations • Due diligence and QOE analysis Real Estate • Real estate advisory and valuation services, in the U.S. and abroad • Serves companies of varying sizes, financial institutions, investors, family offices and individuals

16 B. Riley Securities (formerly B. Riley FBR) Investment Banking and Brokerage ● Full - service investment bank providing comprehensive corporate finance solutions for public and private companies ● Offers fully - customized creative capital markets solutions ● Leader in small - and mid - cap debt/equity offerings ● Established franchise in SPAC, ATM and private placement deals ● Go - to source for quality small - and mid - cap research ● Leverages broad retail, family office distribution network ● Recognized as leading advisor to distressed companies (3) ● Increase in financial restructuring mandates as result of COVID - 19, including significant retail and consumer products engagements Key Stats & Accolades Investment Banking - 80+ professionals (1) • #1 bookrunner for at - the - market (ATM) issuances (2) • Top 10 bankruptcy financial adviser (3) Sales & Trading – 70+ professionals (1) • 1,000+ institutional client relationships (4) Equity Research - 45+ professionals (1) • 400+ companies covered by research (5) • #3 most small - caps under coverage (6) 1. B. Riley Securities investment banking, sales & trading and research professionals as of 09/30/20. 2. Source: Dealogic, Company Filings, PlacementTracker, 12/31/09 – 12/31/19. Apportioned credit to all placement agents. 3. Source: The Deal, Bankruptcy Restructuring Advisers Power Rankings for Q1 2020. 4. B. Riley Securities institutional sales & trading clients as of 9/30/2020. 5. B. Riley Securities Equity Research coverage as of 1/4/21. 6. Sources: StarMine rankings as of 11/14/19. Bloomberg, FactSet, and company websites used for firms not included in StarMine r ank ings. Overall coverage includes only companies with a rating & domiciled in the U.S. Does not include Closed End Funds. Small - Cap Coverage includes market caps less than $1 billion. Recent Deals Initial Public Offering Lead Bookrunner Common Stock Initial Public Offering Sole Bookrunner $292,640,000 November 2020 $331,200,000 December 2020 Healthcare Services Acquisition Corp. $111,204,000 December 2020 Common Stock Follow - On Sole Bookrunner

17 17 B. Riley Securities is a Leading Small Cap Underwriter Source: 1. Dealogic. Pricing Date 1/1/2020 – 12/31/2020, Deal Type = IPO, FO, Rank Eligible. SEC registered. Exchange Nationalit y = USA. Market Cap. $100m - $1.0bn (Deals <$1.1bn rounded down). Excludes SPAC IPOs and Healthcare transactions. 2. Source: Dealogic. Pricing Date 1/1/2020 – 12/31/2020, Deal Type = FO, Rank Eligible. SEC registered. Exchange N ationality = USA. Market Cap. $100m - $1.0bn. Excludes Healthcare transactions. 3. Dealogic. Pricing Date 1/1/2020 – 12/31/2020, Deal Type = SPAC, Rank Eligible, SEC registered. Exchange Nationality = USA. Market Cap. =<$1.0bn. Deal Value $10 0 - $ 400m. Weighted on $ raised attributed to respective bank economics on transaction. Top Small Cap SPAC Bookrunners 3 2020 Rank Bookrunner $M No. % Lead 1 Credit Suisse $4,516.1 21 81% 2 Cantor Fitzgerald & Co $3,452.2 18 89% 3 Citi $3,329.0 20 90% 4 Goldman Sachs $2,833.8 15 67% 5 Jefferies LLC $2,827.3 18 83% 6 Deutsche Bank $2,049.8 13 85% 7 UBS $2,047.1 14 50% 8 Barclays $1,312.2 12 25% 9 Cowen & Company $1,298.1 8 75% 10 B Riley Securities $1,254.6 7 86% 11 Morgan Stanley $1,245.3 12 33% 12 EarlyBirdCapital Inc $1,234.1 13 62% 13 BofA Securities $1,198.2 14 21% 14 Chardan Capital $933.0 7 100% 15 Wells Fargo Securities $908.0 6 50% 16 JPMorgan $861.6 6 50% 17 BTIG LLC $723.0 8 38% 18 Evercore Inc $669.6 2 100% 19 Stifel $605.4 9 33% 20 Oppenheimer & Co $534.7 6 50% Top Small Cap Bookrunners, Ex - Healthcare 1 2020 Rank Bookrunner $M No. % Lead 1 BofA Securities $931.7 19 47% 2 Morgan Stanley $765.8 16 44% 3 JPMorgan $673.6 13 54% 4 Jefferies LLC $620.2 13 46% 5 B Riley Securities $606.2 17 71% 6 Goldman Sachs $533.6 10 50% 7 Credit Suisse $507.2 13 54% 8 Citi $479.8 13 46% 9 Stifel $461.5 21 19% 10 BMO Capital Markets $423.2 17 18% 11 Barclays $292.5 8 50% 12 Wells Fargo Securities $283.9 10 70% 13 RBC Capital Markets $219.7 7 14% 14 Oppenheimer & Co $219.4 8 75% 15 Raymond James $218.6 16 13% 16 Roth Capital Partners $214.8 25 40% 17 William Blair & Co $193.7 8 0% 18 Canaccord Genuity $189.0 14 29% 19 Needham & Co $170.9 11 18% 20 Truist Financial Corp $163.2 11 9% Top Small Cap Follow - On Bookrunners, Ex - Healthcare 2 2020 Rank Bookrunner $M No. % Lead 1 BofA Securities $643.5 11 64% 2 B Riley Securities $465.0 16 69% 3 Jefferies LLC $447.8 8 63% 4 Credit Suisse $395.1 9 67% 5 Morgan Stanley $302.0 9 44% 6 Barclays $292.5 8 50% 7 JPMorgan $282.9 8 50% 8 Stifel $281.5 16 19% 9 Citi $237.7 5 60% 10 Oppenheimer & Co $209.2 7 86% 11 Raymond James $174.4 13 8% 12 Wells Fargo Securities $166.4 7 57% 13 BMO Capital Markets $163.7 11 18% 14 Roth Capital Partners $163.6 20 35% 15 Maxim Group LLC $136.5 10 70% 16 Canaccord Genuity $135.9 12 25% 17 Goldman Sachs $133.7 4 50% 18 Cowen & Company $112.3 3 33% 19 RBC Capital Markets $105.2 4 25% 20 Needham & Co $103.2 8 25% B. Riley has established itself as the preeminent lead left bookrunner for small cap issuers

18 B. Riley Is The Market Leader In At - The - Market (ATM) Offerings 525 385 382 326 314 281 280 221 220 191 173 0 100 200 300 400 500 B. Riley Securities Cantor Fitzgerald Bank of America Jefferies Wells Fargo JP Morgan Citigroup Cowen RBC Morgan Stanley Barclays Continued Growth in Avg Daily ATM Revenue Fueled by New ATM Filings Source: Dealogic, Company Filings, PlacementTracker. Note: The sum of deals is greater than the actual number completed to account for multiple - agent transactions and “B. Riley Secu rities” includes transactions completed by FBR/MLV prior to the acquisition by B. Riley Financial in June 2017. $75 $91 $62 $46 $51 $50 $80 $102 $165 $128 $122 $257 18 19 9 14 11 14 13 16 21 25 24 24 0 5 10 15 20 25 30 $0 $50 $100 $150 $200 $250 $300 Q1 2018 Q2 2018 Q3 2018 Q4 2018 Q1 2019 Q2 2019 Q3 2019 Q4 2019 Q1 2020 Q2 2020 Q3 2020 Q4 2020 Avg Daily ATM Revenue New ATMs Filed During the Qtr New ATMs Filed Avg Daily ATM Revenue in Thousands B. Riley Securities Has Filed The Most ATMs Since 2010

19 B. Riley Wealth Management Wealth Management ● Acquired Wunderlich Securities in July 2017 ● Provides consultative investment advice, financial planning expertise and retail brokerage services ● Serves individuals and families, corporations and non - profit organizations, qualified retirement plans, trusts, foundations and endowments ● Large private client network with strong demand for new issues offers enhanced distribution and aftermarket benefits ● Benefits from B. Riley infrastructure, deals syndicate and ancillary investment offerings $10B+ assets under administration 170+ experienced financial advisors 34,000+ active client accounts Key Stats – B. Riley Wealth Management (1) 1. Figures shown are approximations and do not reflect actual number of Assets under Administration, Active Client Accounts, Fi nan cial Advisors as of 01/08/21. 2. Figures shown are approximations and do not reflect actual number of Assets under Management, Active Client Accounts, Adviso rs and Branch Locations as of 01/08/21. Key Stats – National Holdings (2) $18.9B assets under management 700+ advisors Over 100 locations in 23 states National Holdings Acquisition ● Announced acquisition of National Holdings January 2021; Transaction expected to close Q1 2021 ● Transaction contemplates merger that enhances complementary wealth management business ● Significantly broadens retail distribution ● Potential to meaningfully augment platform's episodic and recurring results

20 National Holdings Corporation Brokerage Investment Banking Tax & Accounting Advisory ● Private shares ● Syndicate desk ● Institutional distribution ● Approximately 26,000 federal, state and local tax returns prepared during 2020 tax season ● 700 registered representatives ● Institutional trading desk ● Robust research coverage ● Traditional and non - traditional investment products and risk management strategies ● Financial planning and monitoring services National Holdings Corporation (Nasdaq : NHLD) is a full - service middle market investment banking and asset management firm that operates through several subsidiaries including brokerage firm, National Securities , among others . » Brokerage founded in 1947 » Approximately 1 , 000 affiliated personnel » Client AUM of $ 18 . 9 B as of January 8 , 2021 » Revenues of $ 229 . 9 M in fiscal 2020 Proposed Acquisition Expands RILY Platform and Capabilities; Offers Enhanced Distribution

21 B. Riley Advisory Services (formerly GlassRatner) Financial Advisory ● Acquired GlassRatner in August 2018 ● Nationally recognized financial advisory firm ● Leading restructuring adviser ● Specializes in bankruptcy & restructuring, litigation support, forensic accounting, valuation disputes, due diligence and fraud investigations ● Serves stakeholders facing highly complex crisis management and litigation matters ● Key sectors include healthcare, automotive, agriculture, energy and power, retail and real estate ● Maintains strong performance since joining B . Riley ● Significant increase in bankruptcy & restructuring matters as result of COVID - 19 ● Acquired Alderney Advisors (auto restructuring firm) in Q 2 2020 100+ Financial Advisory Professionals Top 10 Leading Restructuring Adviser #1 Overall Expert Witness #1 Forensic Accounting Firm #1 Litigation Valuation Firm Cross Border Special Situation M&A Deal of the Year Key Stats & Accolades (1)(2) 1. B. Riley Advisory Services (formerly GlassRatner) professionals as of 09/30/20. 2. Sources: The Deal, Bankruptcy Restructuring Advisers Power Rankings for Q1 2020; ALM’s Daily Report, “Best of 2019”; Corporat e C ounsel “Best Of” Awards (2018); and Global M&A Network, “Turnaround Atlas Awards” (2019). Illustrative Engagements FA to International Fitness Chain Chapter 11 Trustee for Hospital System FA to UCC of Oil & Gas Company
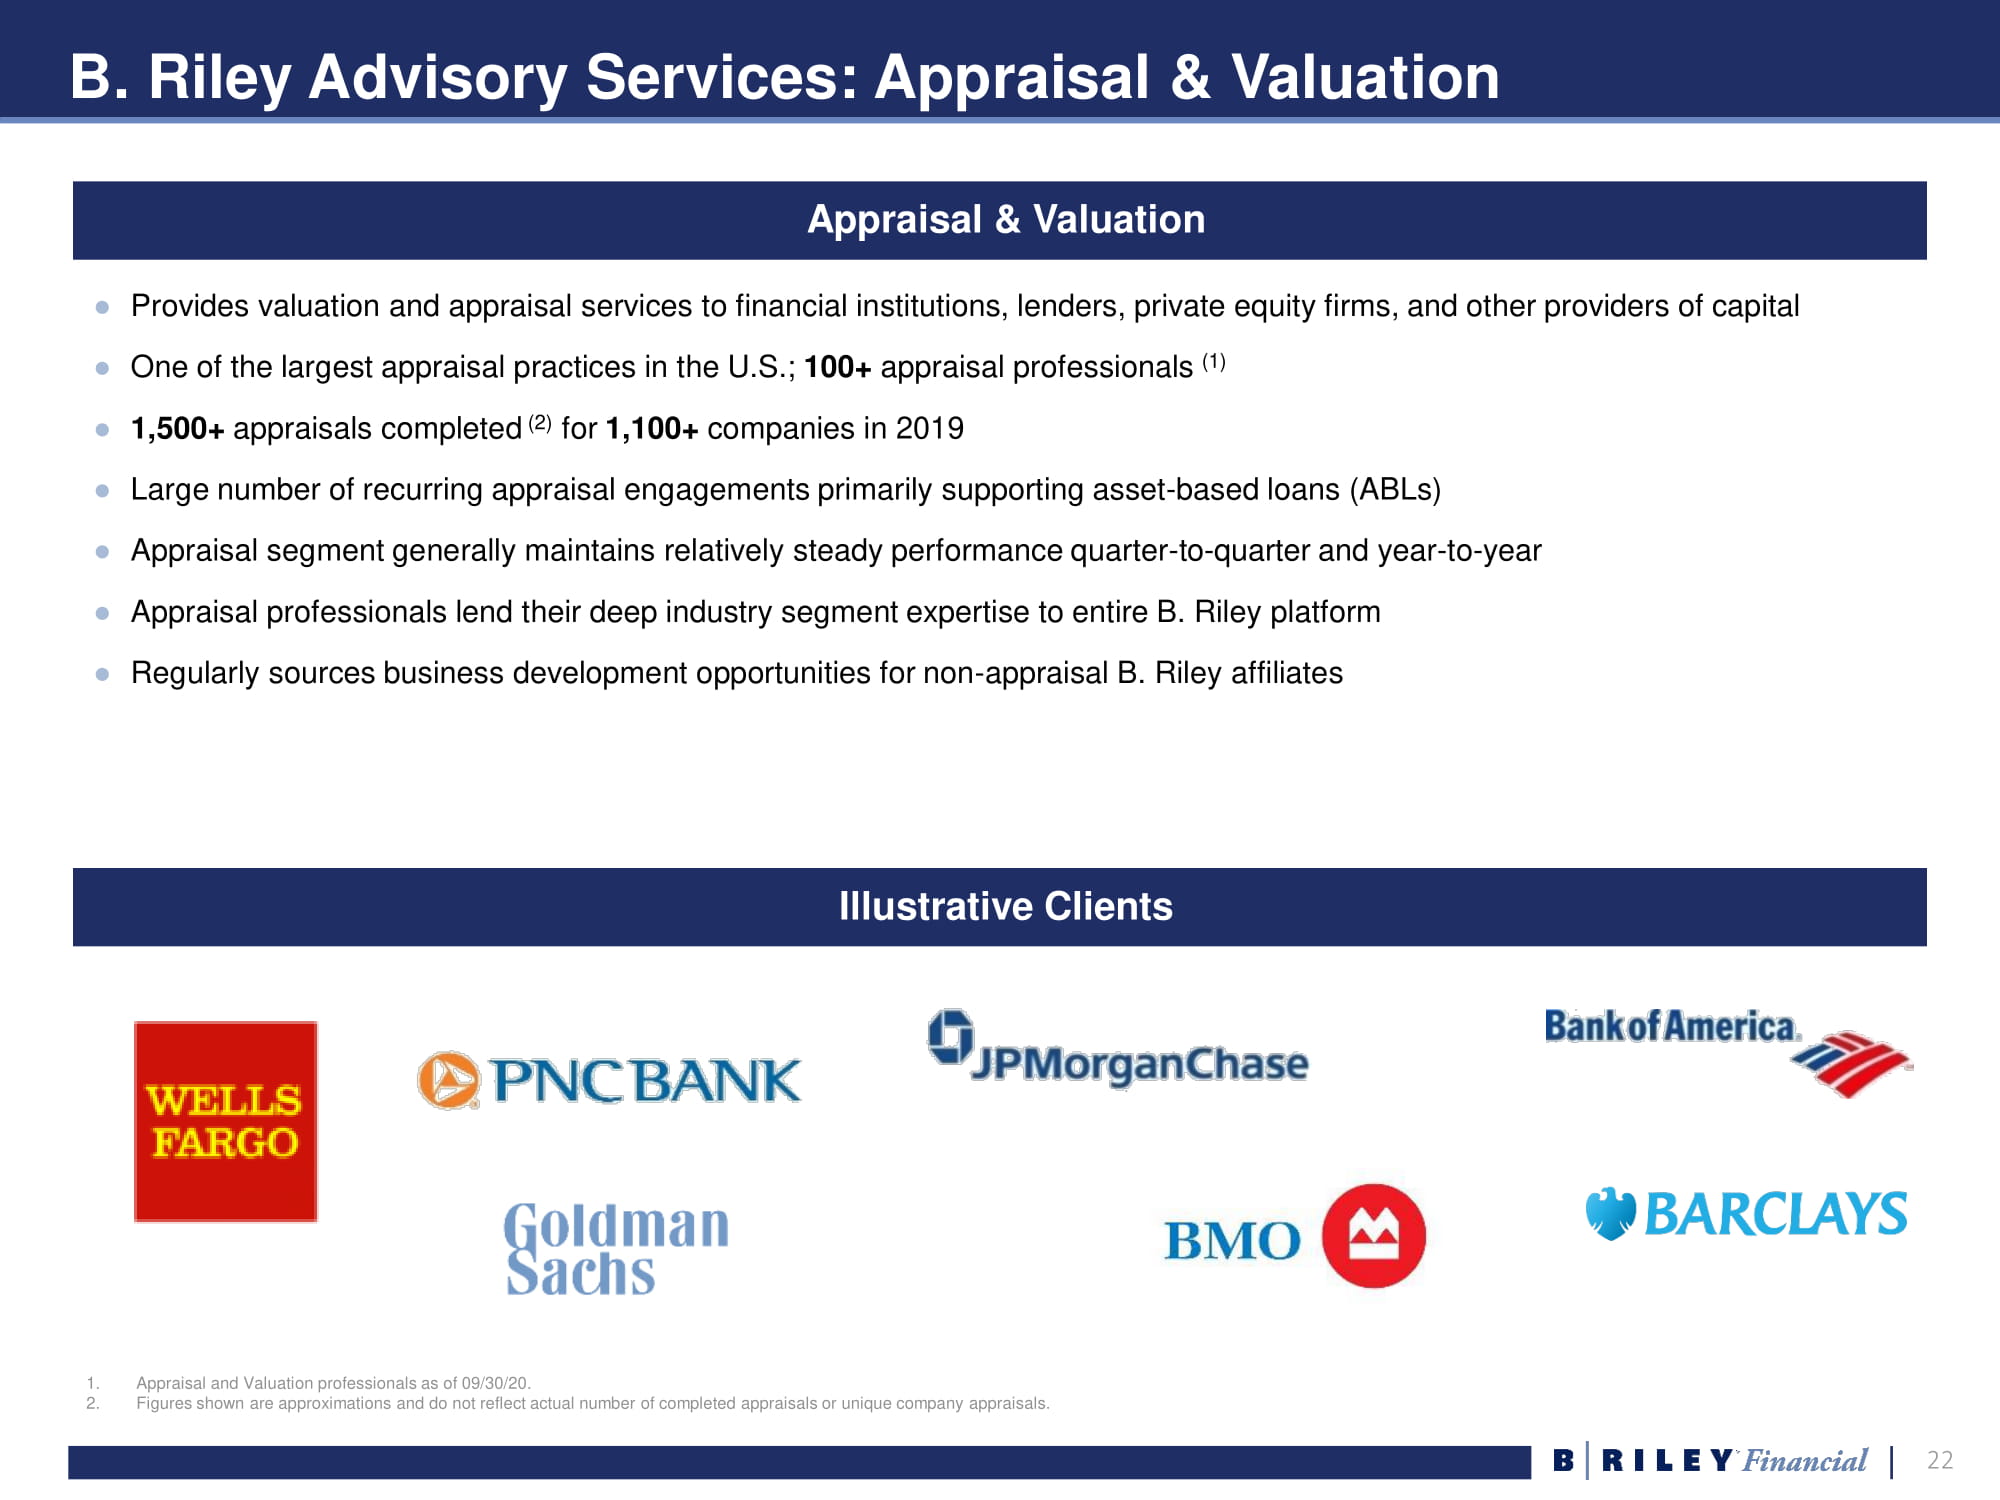
22 B. Riley Advisory Services: Appraisal & Valuation Appraisal & Valuation ● Provides valuation and appraisal services to financial institutions, lenders, private equity firms, and other providers of capital ● One of the largest appraisal practices in the U . S .; 100 + appraisal professionals ( 1 ) ● 1 , 500 + appraisals completed ( 2 ) for 1 , 100 + companies in 2019 ● Large number of recurring appraisal engagements primarily supporting asset - based loans (ABLs) ● Appraisal segment generally maintains relatively steady performance quarter - to - quarter and year - to - year ● Appraisal professionals lend their deep industry segment expertise to entire B. Riley platform ● Regularly sources business development opportunities for non - appraisal B. Riley affiliates 1. Appraisal and Valuation professionals as of 09/30/20. 2. Figures shown are approximations and do not reflect actual number of completed appraisals or unique company appraisals. Illustrative Clients

23 B. Riley Retail Solutions: Retail Liquidation Illustrative Engagements Retail Liquidation ● Great American Group merged with B . Riley in June 2014 ● Leading operator of large - scale retail liquidations ● Episodic, counter - cyclical business which benefits from the acceleration of retail industry headwinds ● 3,900+ store closings completed with over $2.9 billion in total value of assets liquidated in 2019 (1) ● 2,000+ store closings with over $2.8 billion in associated retail inventory value in 2020 YTD (1) ● Real estate consolidation and purging excess inventory remain a key focus for retailers amid COVID - 19 uncertainty ● Robust pipeline of fee - based liquidation projects through year - end 1. Figures shown are approximations as of 9/30/20 and do not reflect actual number of store closures or liquidated asset values.

24 Principal Investments ● Strong cash - flow companies generating attractive returns ● High gross margins ; predictable subscriber attrition ● Low overhead from successful execution of cost synergies United Online (acquired July 2016 ) ● Internet access and online advertising provider ● Exceeded net initial investment since acquisition ● Generates steady income for B . Riley magicJack (acquired November 2018 ) ● VoIP technology and services communications provider ● Offers operational synergies with United Online Lingo Communications (Acquired 40 % ownership interest November 2020 ) ● Global cloud/UC and managed service provider ● B . Riley acquired 40 % equity interest in November 2020 ; expected to acquire additional 40 % interest in 2021 pending regulatory approval Cumulative Segment Income (1) Principal Investments $9.2M $28.7M $48.2M $81.3M $107.4M 2016 2017 2018 2019 Sep'20 YTD United Online magicJack 1. Includes results from United Online, Inc. since Q3 2016, and results from magicJack VocalTec Ltd. since Q4 2018.

25 Brand Portfolio Ownership Summary (1) (2) Brands Portfolio ● Established brand investment portfolio in October 2019 ● Brand portfolio offers recurring revenue and cash flow through licensing of brand trademarks ● Leverages retail and brand management partnerships ● Trends in traditional brick and mortar retail creates opportunity to acquire intellectual property and brand assets ● Acquired interest in Justice in November 2020 1. Brand holdings for Six Brands, Hurley and bebe as of 9/30/2020. Acquired interest in Justice brand on 11/30/2020. Percentages re present approximate ownership stakes in these brands. 2. Brands Segment results primarily include interest from Six Brands. Results for Justice brand will be included in future resul ts. Results for Hurley and bebe are recognized outside of the brand segments. 80% Catherine Malandrino English Laundry Joan Vass Kensie Girl Limited Too Nanette Lepore 43% Hurley 41% Justice 32% bebe Brand Holdings

26 IV. Financial Overview

27 Financial Highlights 1. Adjusted EBITDA includes earnings before interest, taxes, depreciation, amortization, restructuring costs, share - based payments, impairment of tradenames, and transaction related and other costs. 2. Operating Adjusted EBITDA is defined as Adjusted EBITDA excluding (i) Trading Income (losses) and Fair Value Adjustments on L oan s and (ii) other investment related expenses. 3. Adjusted net income excludes the impact of share - based payments, fair value adjustments, amortization of intangible assets, rest ructuring costs, insurance settlement recovery, impairment of tradenames, transaction - related and other costs, tax impact of aforementioned adjustments and certain tax items. (000’s) Q3 2020 Total Revenue $226,253 Adjusted EBITDA (1) 94,133 Net income attributable to B. Riley Financial 48,379 Net income available to common shareholders 47,291 Adjusted net income attributable to B. Riley Financial (3) 55,423 Operating Adjusted EBITDA (1)(2) 67,222 (000’s) Sep 2020 LTM Total Revenue $657,752 Adjusted EBITDA (1) 196,601 Net income attributable to B. Riley Financial 50,683 Net income available to common shareholders 47,189 Adjusted net income attributable to B. Riley Financial (3) 92,313 Operating Adjusted EBITDA (1)(2) 201,280 Select Income Items

28 Financial Highlights (cont.) Cash and Net Investments (000’s) 9/30/20 Cash and cash equivalents $169,676 Restricted cash 1,410 Due from clearing brokers 19,589 Securities and Other Investments Owned, net (1) 411,355 Advances against customer contracts 900 Loans receivables, net of loan participations sold 330,420 Other equity investments and deposits (2) 58,389 Total Cash, Net Securities and Investments, and Other $991,739 Debt (000’s) 9/30/20 Notes payable $ 714 Term loan 52,452 Senior notes payable 854,926 Total Debt $908,092 1. Includes $459.5M in securities and other investments owned net of $48.1M in securities sold not yet purchased. 2. Other equity investments reported in prepaid expenses and other assets. 3. Defined as total cash, net securities and investments, and other minus total debt.. Total Cash and Investments, Net of Debt (3) $ 83,647

29 V. Appendix

30 GAAP Income Statement B. Riley Financial Consoldiated Statements of Operations FY FY LTM Dec 31, Q1 Q2 Q3 Q4 Dec 31, Q1 Q2 Q3 Sep 30, USD in 000's except for share data 2018 2019 2019 2019 2019 2019 2020 2020 2020 2020 Revenues: Services and Fees $392,080 $103,896 $139,968 $113,111 $103,518 $460,493 $159,381 $125,595 $144,823 $533,317 Trading Income (Loss) and Fair Value Adjustments on Loans (8,004) 25,867 5,595 40,268 34,733 106,463 (182,442) 114,547 31,753 (1,409) Interest Income - Loans and Securities Lending 38,277 11,420 16,961 25,766 23,074 77,221 21,851 24,506 26,026 95,457 Sale of Goods 638 945 2,160 918 3,912 7,935 1,004 1,820 23,651 30,387 Total Revenues 422,991 142,128 164,684 180,063 165,237 652,112 (206) 266,468 226,253 657,752 Operating Expenses: Direct Cost of Services 34,754 14,116 19,663 7,936 17,109 58,824 19,952 7,985 23,264 68,310 Cost of Goods Sold 800 1,119 1,805 911 3,740 7,575 769 860 9,813 15,182 Selling, General and Administrative Expenses 310,508 94,964 91,907 101,092 97,256 385,219 87,744 106,562 97,143 388,705 Restructuring Charge 8,506 147 1,552 - - 1,699 - - 1,557 1,557 Impairment of Tradenames - - - - - - 4,000 8,500 - 12,500 Interest Expense - Securities Lending and Loan Participations Sold 23,039 6,804 5,502 10,273 9,565 32,144 8,473 11,221 10,975 40,234 Total Operating Expenses 377,607 117,150 120,429 120,212 127,670 485,461 120,938 135,128 142,752 526,488 Operating Income (Loss) 45,384 24,978 44,255 59,851 37,567 166,651 (121,144) 131,340 83,501 131,264 Other Income (Expense): Interest Income 1,326 637 331 361 248 1,577 246 224 67 785 Income (Loss) from Equity Investments 7,986 (3,762) (1,400) 1,113 2,618 (1,431) (236) (318) 409 2,473 Interest Expense (33,393) (10,770) (11,588) (12,772) (15,075) (50,205) (15,654) (16,509) (16,374) (63,612) Income before Income Taxes 21,303 11,083 31,598 48,553 25,358 116,592 (136,788) 114,737 67,603 70,910 (Provision) Benefit for Income Taxes (4,903) (3,104) (9,289) (14,409) (7,842) (34,644) 37,539 (32,208) (18,711) (21,222) Net Income (Loss) 16,400 7,979 22,309 34,144 17,516 81,948 (99,249) 82,529 48,892 49,688 Net (Loss) Income Attributable to Noncontrolling Interests 891 (44) 152 (158) 387 337 (584) (1,311) 513 (995) Net Income Attributable to B. Riley Financial, Inc. 15,509 8,023 22,157 34,302 17,129 81,611 (98,665) 83,840 48,379 50,683 Preferred Stock Dividends - - - - 264 264 1,055 1,087 1,088 3,494 Net Income Available to Common Shareholders 15,509 8,023 22,157 34,302 16,865 81,347 (99,720) 82,753 47,291 47,189 Diluted Income per Common Share $0.58 $0.30 $0.82 $1.21 $0.59 $2.95 ($3.83) $3.07 $1.75 $1.74 Weighted Average Diluted Common Shares Outstanding 26,764,856 26,687,531 26,896,573 28,233,423 28,412,871 27,529,157 26,028,613 26,992,823 27,050,448 27,121,189

31 Historical Financial Results for B. Riley Financial 1. Operating Revenue is defined as the sum of revenues from (i) Service and Fees, (ii) Interest Income - Loans and Securities Lendi ng and (iii) Sales of Goods. 2. Investment Gains (Loss) is defined as Trading Income (Losses) and Fair Value Adjustments on Loans. 3. Segment Operating Income is defined as Segment Income excluding (i) Trading Income (Losses) and Fair Value Adjustments on Loa ns and (ii) other investment related expenses. 4. Investment Income (Loss) is defined as Trading Income (Losses) and Fair Value Adjustments on Loans, less other investment rel ate d expenses. B. Riley Financial Segment Financial Results FY FY LTM Dec 31, Q1 Q2 Q3 Q4 Dec 31, Q1 Q2 Q3 Sep 30, USD in 000's 2018 2019 2019 2019 2019 2019 2020 2020 2020 2020 Operating Revenues: Capital Markets (1) $283,070 $59,434 $88,653 $93,828 $137,480 $379,395 $126,264 $111,364 $115,058 $490,166 Auction and Liquidation 54,986 20,709 34,916 11,286 (44,395) 22,516 20,661 8,251 44,185 28,702 Valuation and Appraisal 38,705 8,583 9,742 10,818 9,678 38,821 8,788 7,669 9,655 35,790 Principal Investments - UOL and MJ 54,234 27,535 25,778 23,863 23,686 100,862 22,722 21,431 21,602 89,441 Brands - - - - 4,055 4,055 3,801 3,206 4,000 15,062 Operating Revenues (1) 430,995 116,261 159,089 139,795 130,504 545,649 182,236 151,921 194,500 659,161 Investment Gain (Loss) (2) (8,004) 25,867 5,595 40,268 34,733 106,463 (182,442) 114,547 31,753 (1,409) Total Revenues 422,991 142,128 164,684 180,063 165,237 652,112 (206) 266,468 226,253 657,752 Segment Operating Income: Capital Markets (3) 18,156 (1,711) 14,688 17,272 54,719 84,968 46,505 31,062 37,900 170,186 Auction and Liquidation 27,013 11,504 17,828 5,953 (60,818) (25,533) 4,289 2,020 12,000 (42,509) Valuation and Appraisal 11,097 1,363 2,737 3,451 2,686 10,237 1,880 1,478 2,972 9,016 Principal Investments - UOL and MJ 19,448 7,929 7,779 8,662 8,787 33,157 8,504 9,188 8,368 34,847 Brands - - - - 2,667 2,667 (1,817) (6,318) 2,292 (3,176) Segment Operating Income (3) 75,714 19,085 43,032 35,338 8,041 105,496 59,361 37,430 63,532 168,364 Investment Income (Loss) (4) (8,004) 15,572 9,705 35,130 33,875 94,282 (166,972) 101,507 26,911 (4,679) Total Segment Income (Loss) 67,710 34,657 52,737 70,468 41,916 199,778 (107,611) 138,937 90,443 163,685
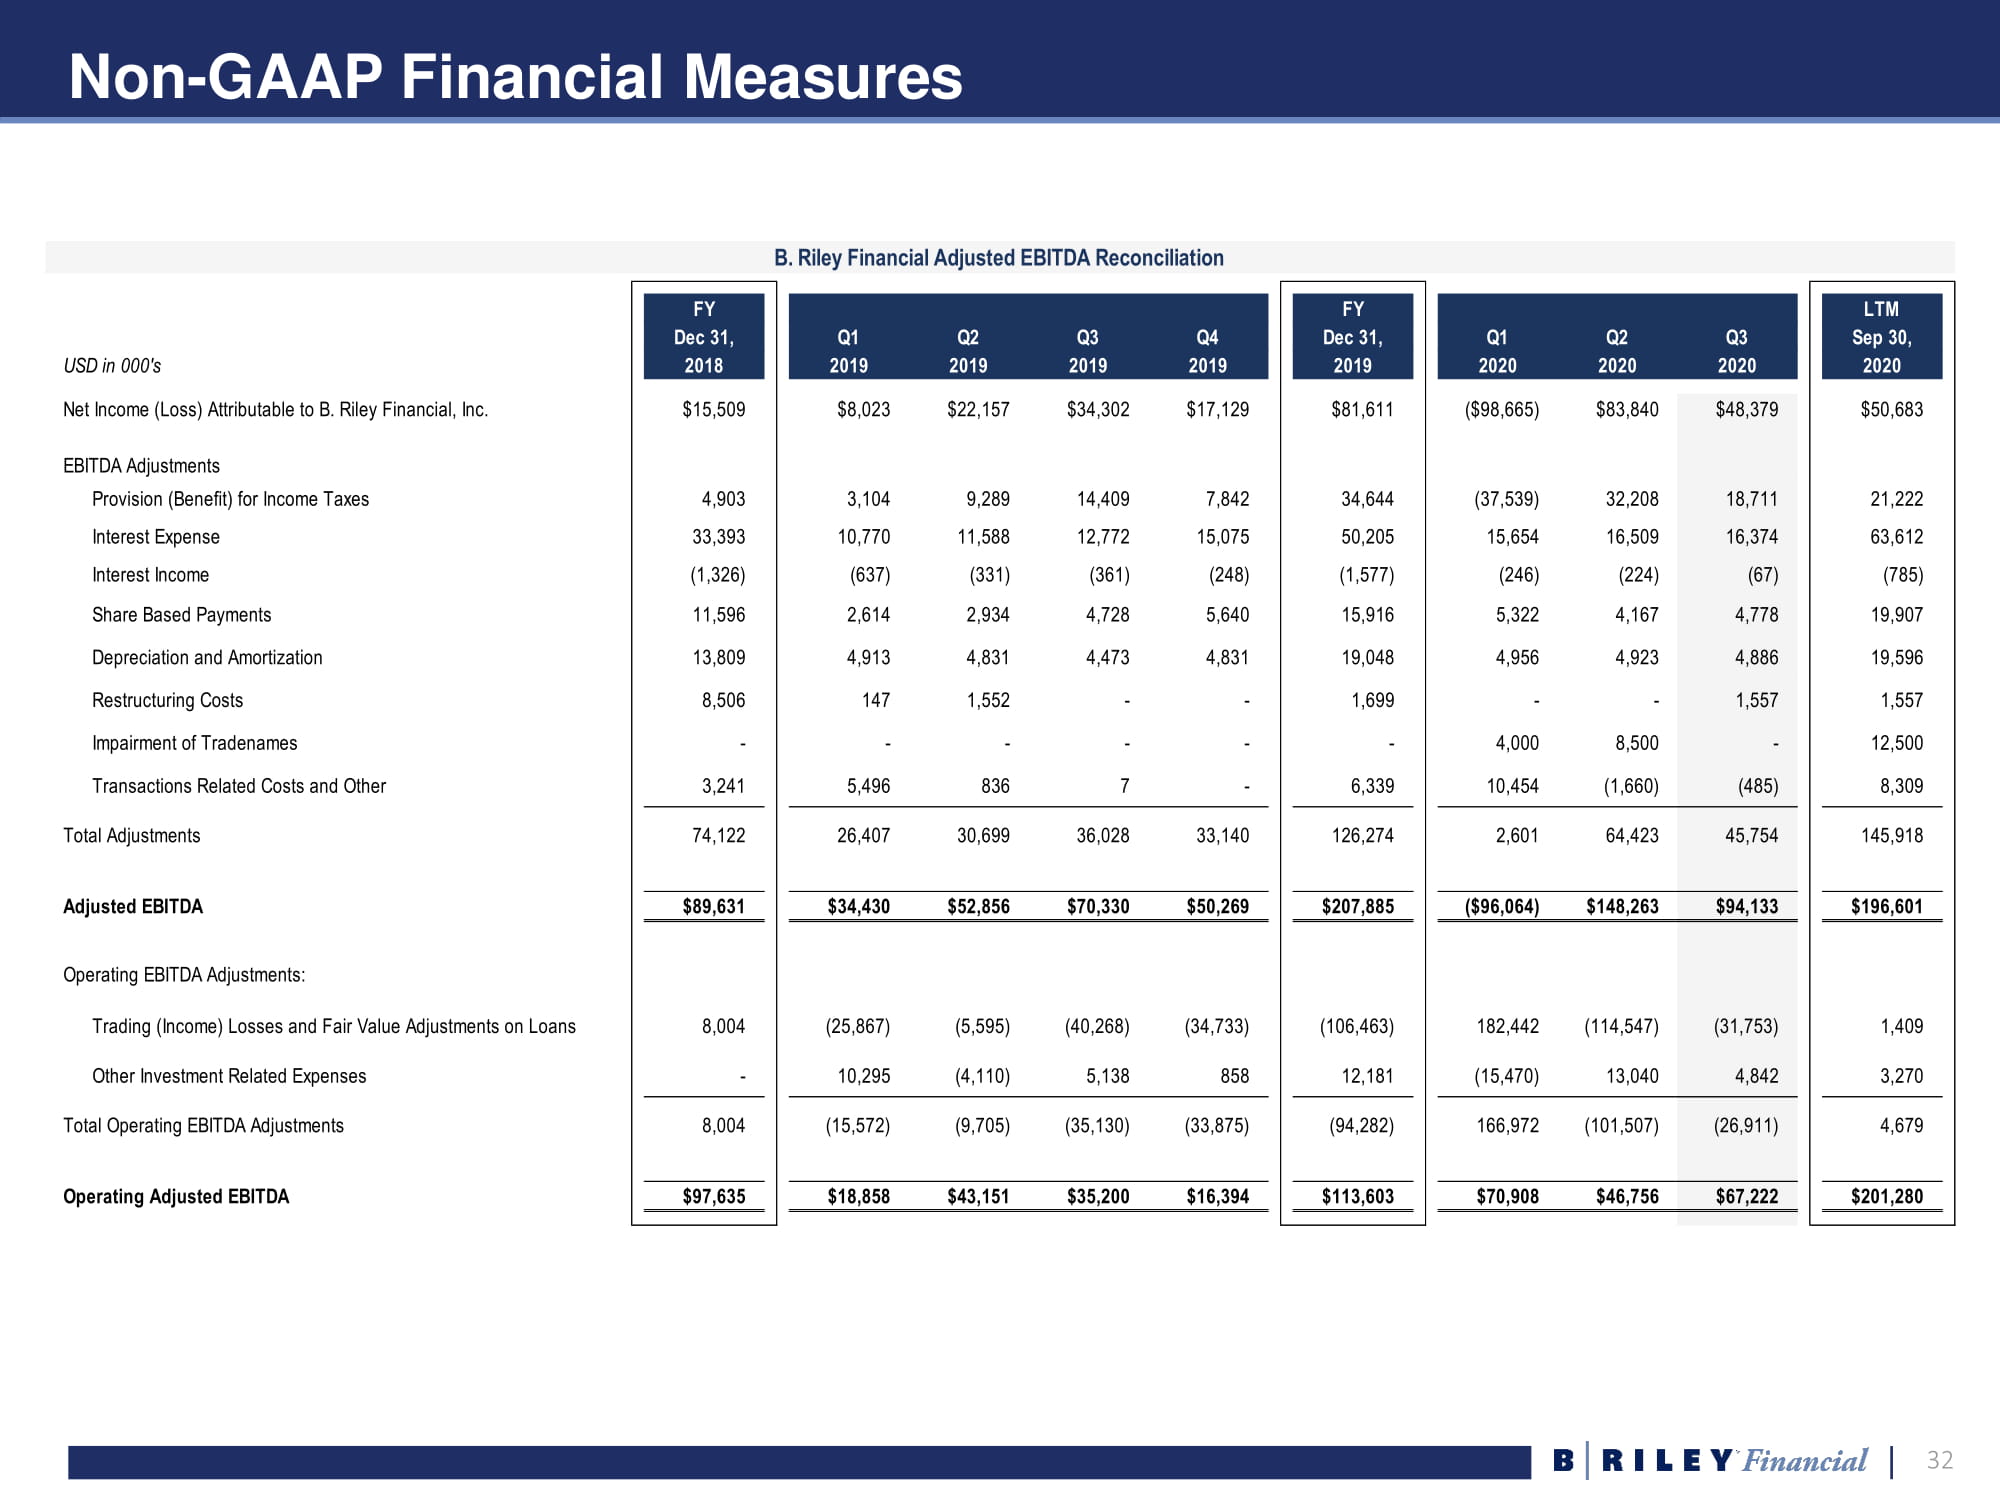
32 Non - GAAP Financial Measures B. Riley Financial Adjusted EBITDA Reconciliation FY FY LTM Dec 31, Q1 Q2 Q3 Q4 Dec 31, Q1 Q2 Q3 Sep 30, USD in 000's 2018 2019 2019 2019 2019 2019 2020 2020 2020 2020 Net Income (Loss) Attributable to B. Riley Financial, Inc. $15,509 $8,023 $22,157 $34,302 $17,129 $81,611 ($98,665) $83,840 $48,379 $50,683 EBITDA Adjustments Provision (Benefit) for Income Taxes 4,903 3,104 9,289 14,409 7,842 34,644 (37,539) 32,208 18,711 21,222 Interest Expense 33,393 10,770 11,588 12,772 15,075 50,205 15,654 16,509 16,374 63,612 Interest Income (1,326) (637) (331) (361) (248) (1,577) (246) (224) (67) (785) Share Based Payments 11,596 2,614 2,934 4,728 5,640 15,916 5,322 4,167 4,778 19,907 Depreciation and Amortization 13,809 4,913 4,831 4,473 4,831 19,048 4,956 4,923 4,886 19,596 Restructuring Costs 8,506 147 1,552 - - 1,699 - - 1,557 1,557 Impairment of Tradenames - - - - - - 4,000 8,500 - 12,500 Transactions Related Costs and Other 3,241 5,496 836 7 - 6,339 10,454 (1,660) (485) 8,309 Total Adjustments 74,122 26,407 30,699 36,028 33,140 126,274 2,601 64,423 45,754 145,918 Adjusted EBITDA $89,631 $34,430 $52,856 $70,330 $50,269 $207,885 ($96,064) $148,263 $94,133 $196,601 Operating EBITDA Adjustments: Trading (Income) Losses and Fair Value Adjustments on Loans 8,004 (25,867) (5,595) (40,268) (34,733) (106,463) 182,442 (114,547) (31,753) 1,409 Other Investment Related Expenses - 10,295 (4,110) 5,138 858 12,181 (15,470) 13,040 4,842 3,270 Total Operating EBITDA Adjustments 8,004 (15,572) (9,705) (35,130) (33,875) (94,282) 166,972 (101,507) (26,911) 4,679 Operating Adjusted EBITDA $97,635 $18,858 $43,151 $35,200 $16,394 $113,603 $70,908 $46,756 $67,222 $201,280

33 Non - GAAP Financial Measures B. Riley Financial Adjusted Net Income Reconciliation FY FY LTM Dec 31, Q1 Q2 Q3 Q4 Dec 31, Q1 Q2 Q3 Sep 30, USD in 000's 2018 2019 2019 2019 2019 2019 2020 2020 2020 2020 Net Income (Loss) Attributable to B. Riley Financial, Inc. $15,509 $8,023 $22,157 $34,302 $17,129 $81,611 ($98,665) $83,840 $48,379 $50,683 Share Based Compensation 11,596 2,614 2,934 4,728 5,640 15,916 5,322 4,167 4,778 19,907 Amortization of Intangible Assets 9,133 3,377 3,344 3,310 3,815 13,846 4,024 4,024 3,919 15,782 Restructuring Costs 8,506 147 1,552 - - 1,699 - - 1,557 1,557 Impairment of Tradenames - - - - - - 4,000 8,500 - 12,500 Transactions Related Costs and Other 3,241 5,496 836 7 - 6,339 10,454 (1,660) (485) 8,309 Income Tax Effect of Adjusting Entries (9,209) (3,245) (2,560) (2,380) (2,969) (11,154) (6,559) (4,172) (2,725) (16,425) Total Adjustments 23,267 8,389 6,106 5,665 6,486 26,646 17,241 10,859 7,044 41,630 Adjusted Net Income $38,776 $16,412 $28,263 $39,967 $23,615 $108,257 ($81,424) $94,699 $55,423 $92,313
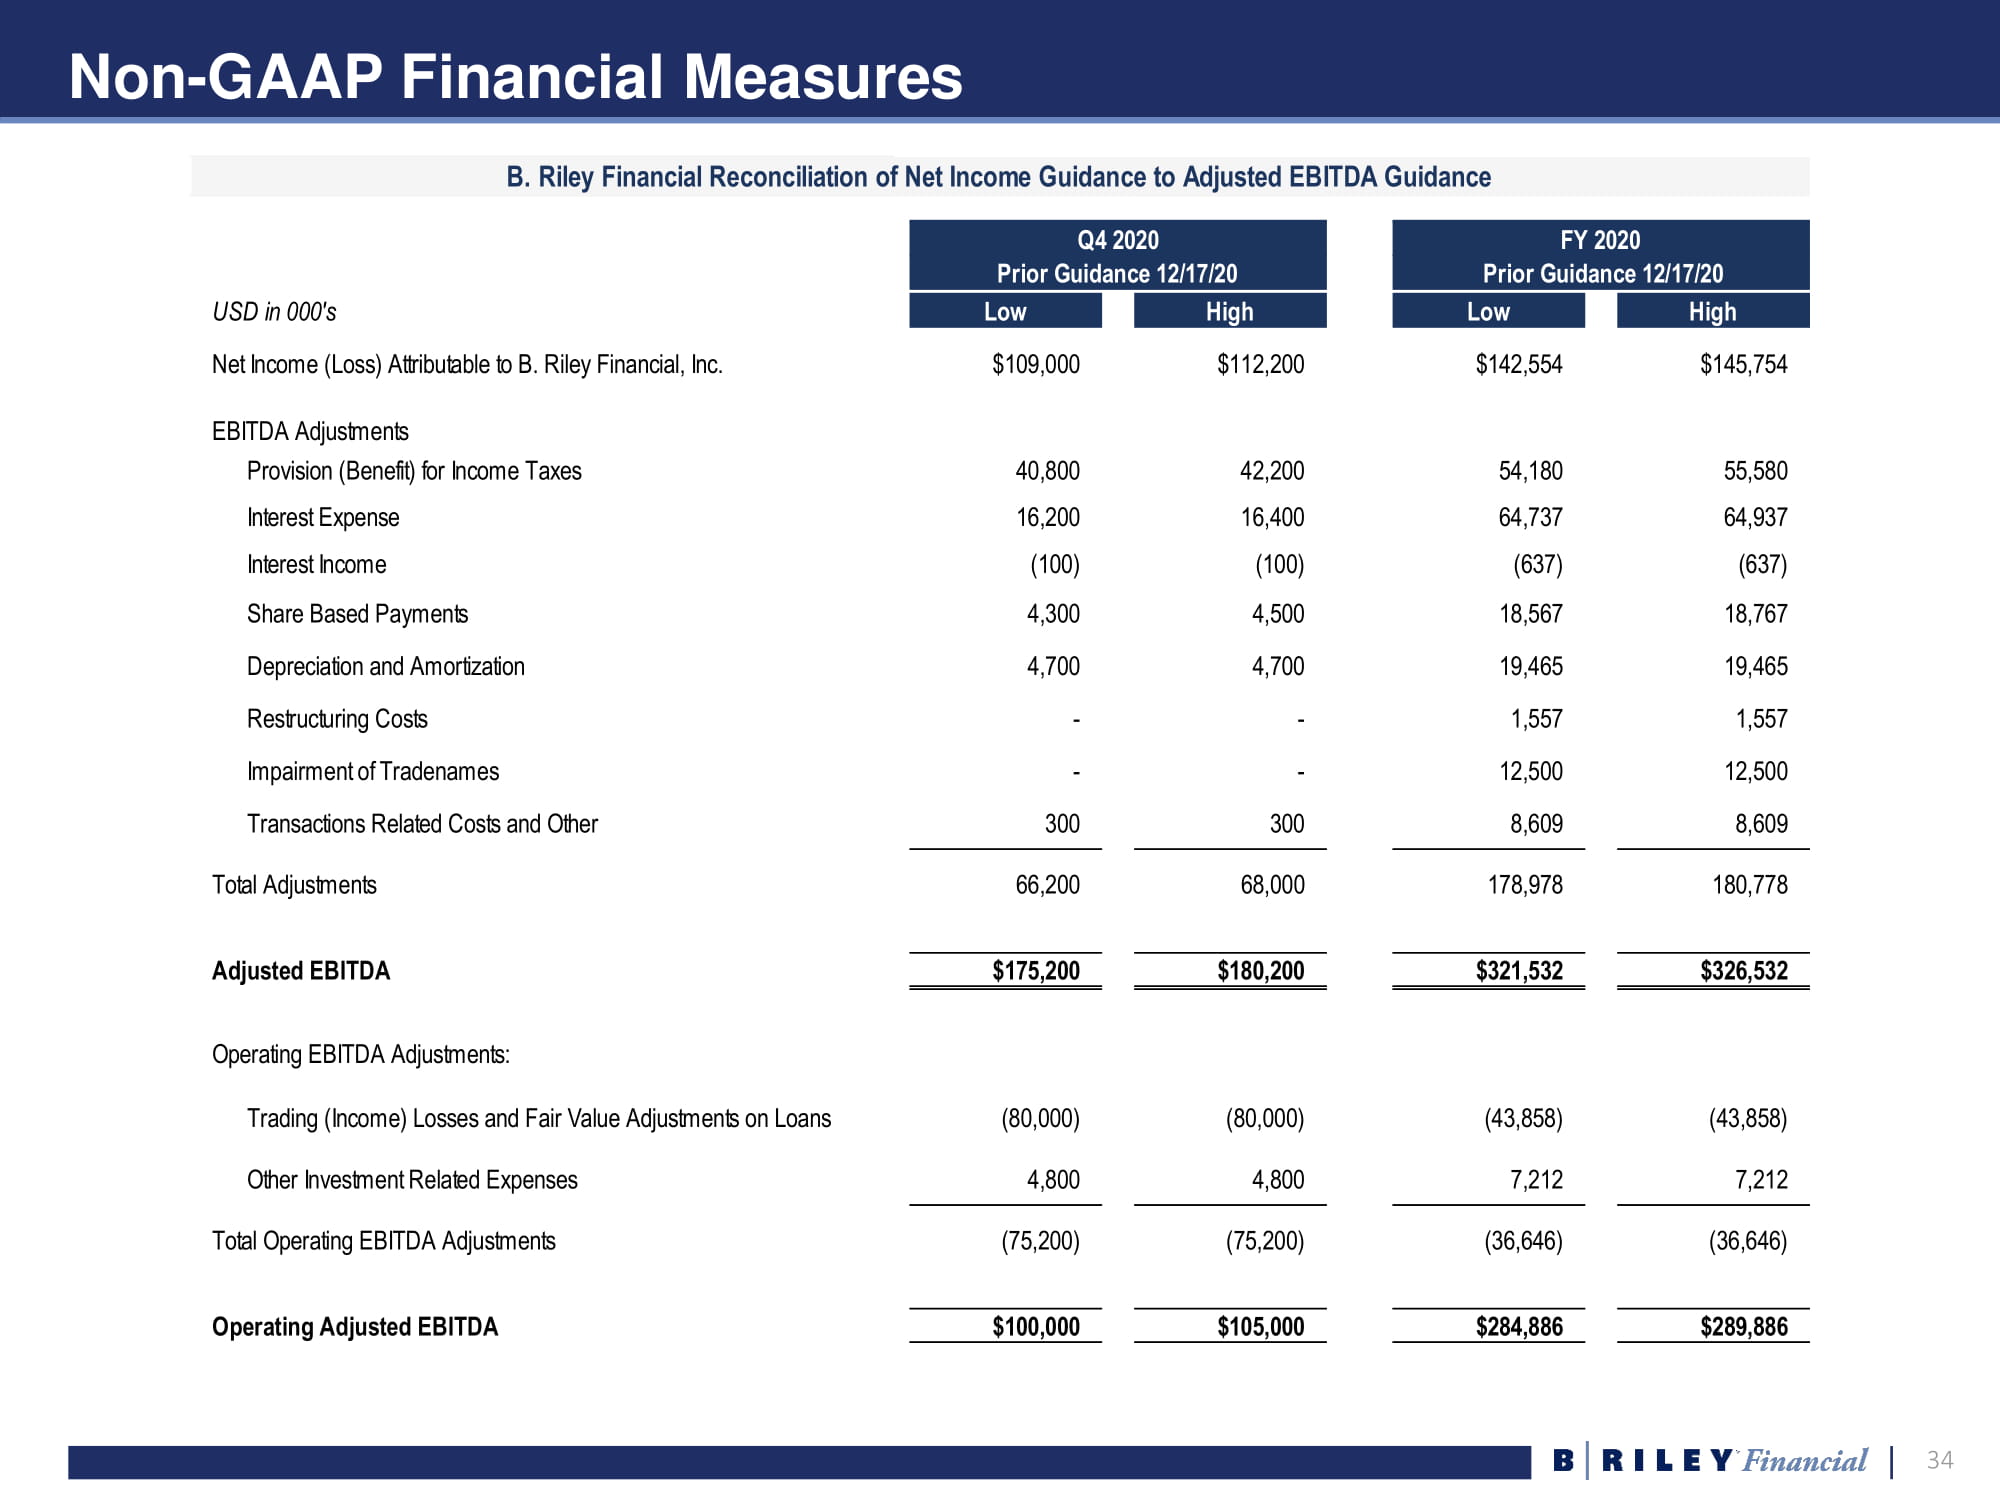
34 Non - GAAP Financial Measures B. Riley Financial Reconciliation of Net Income Guidance to Adjusted EBITDA Guidance Q4 2020 FY 2020 Prior Guidance 12/17/20 Prior Guidance 12/17/20 USD in 000's Low High Low High Net Income (Loss) Attributable to B. Riley Financial, Inc. $109,000 $112,200 $142,554 $145,754 EBITDA Adjustments Provision (Benefit) for Income Taxes 40,800 42,200 54,180 55,580 Interest Expense 16,200 16,400 64,737 64,937 Interest Income (100) (100) (637) (637) Share Based Payments 4,300 4,500 18,567 18,767 Depreciation and Amortization 4,700 4,700 19,465 19,465 Restructuring Costs - - 1,557 1,557 Impairment of Tradenames - - 12,500 12,500 Transactions Related Costs and Other 300 300 8,609 8,609 Total Adjustments 66,200 68,000 178,978 180,778 Adjusted EBITDA $175,200 $180,200 $321,532 $326,532 Operating EBITDA Adjustments: Trading (Income) Losses and Fair Value Adjustments on Loans (80,000) (80,000) (43,858) (43,858) Other Investment Related Expenses 4,800 4,800 7,212 7,212 Total Operating EBITDA Adjustments (75,200) (75,200) (36,646) (36,646) Operating Adjusted EBITDA $100,000 $105,000 $284,886 $289,886
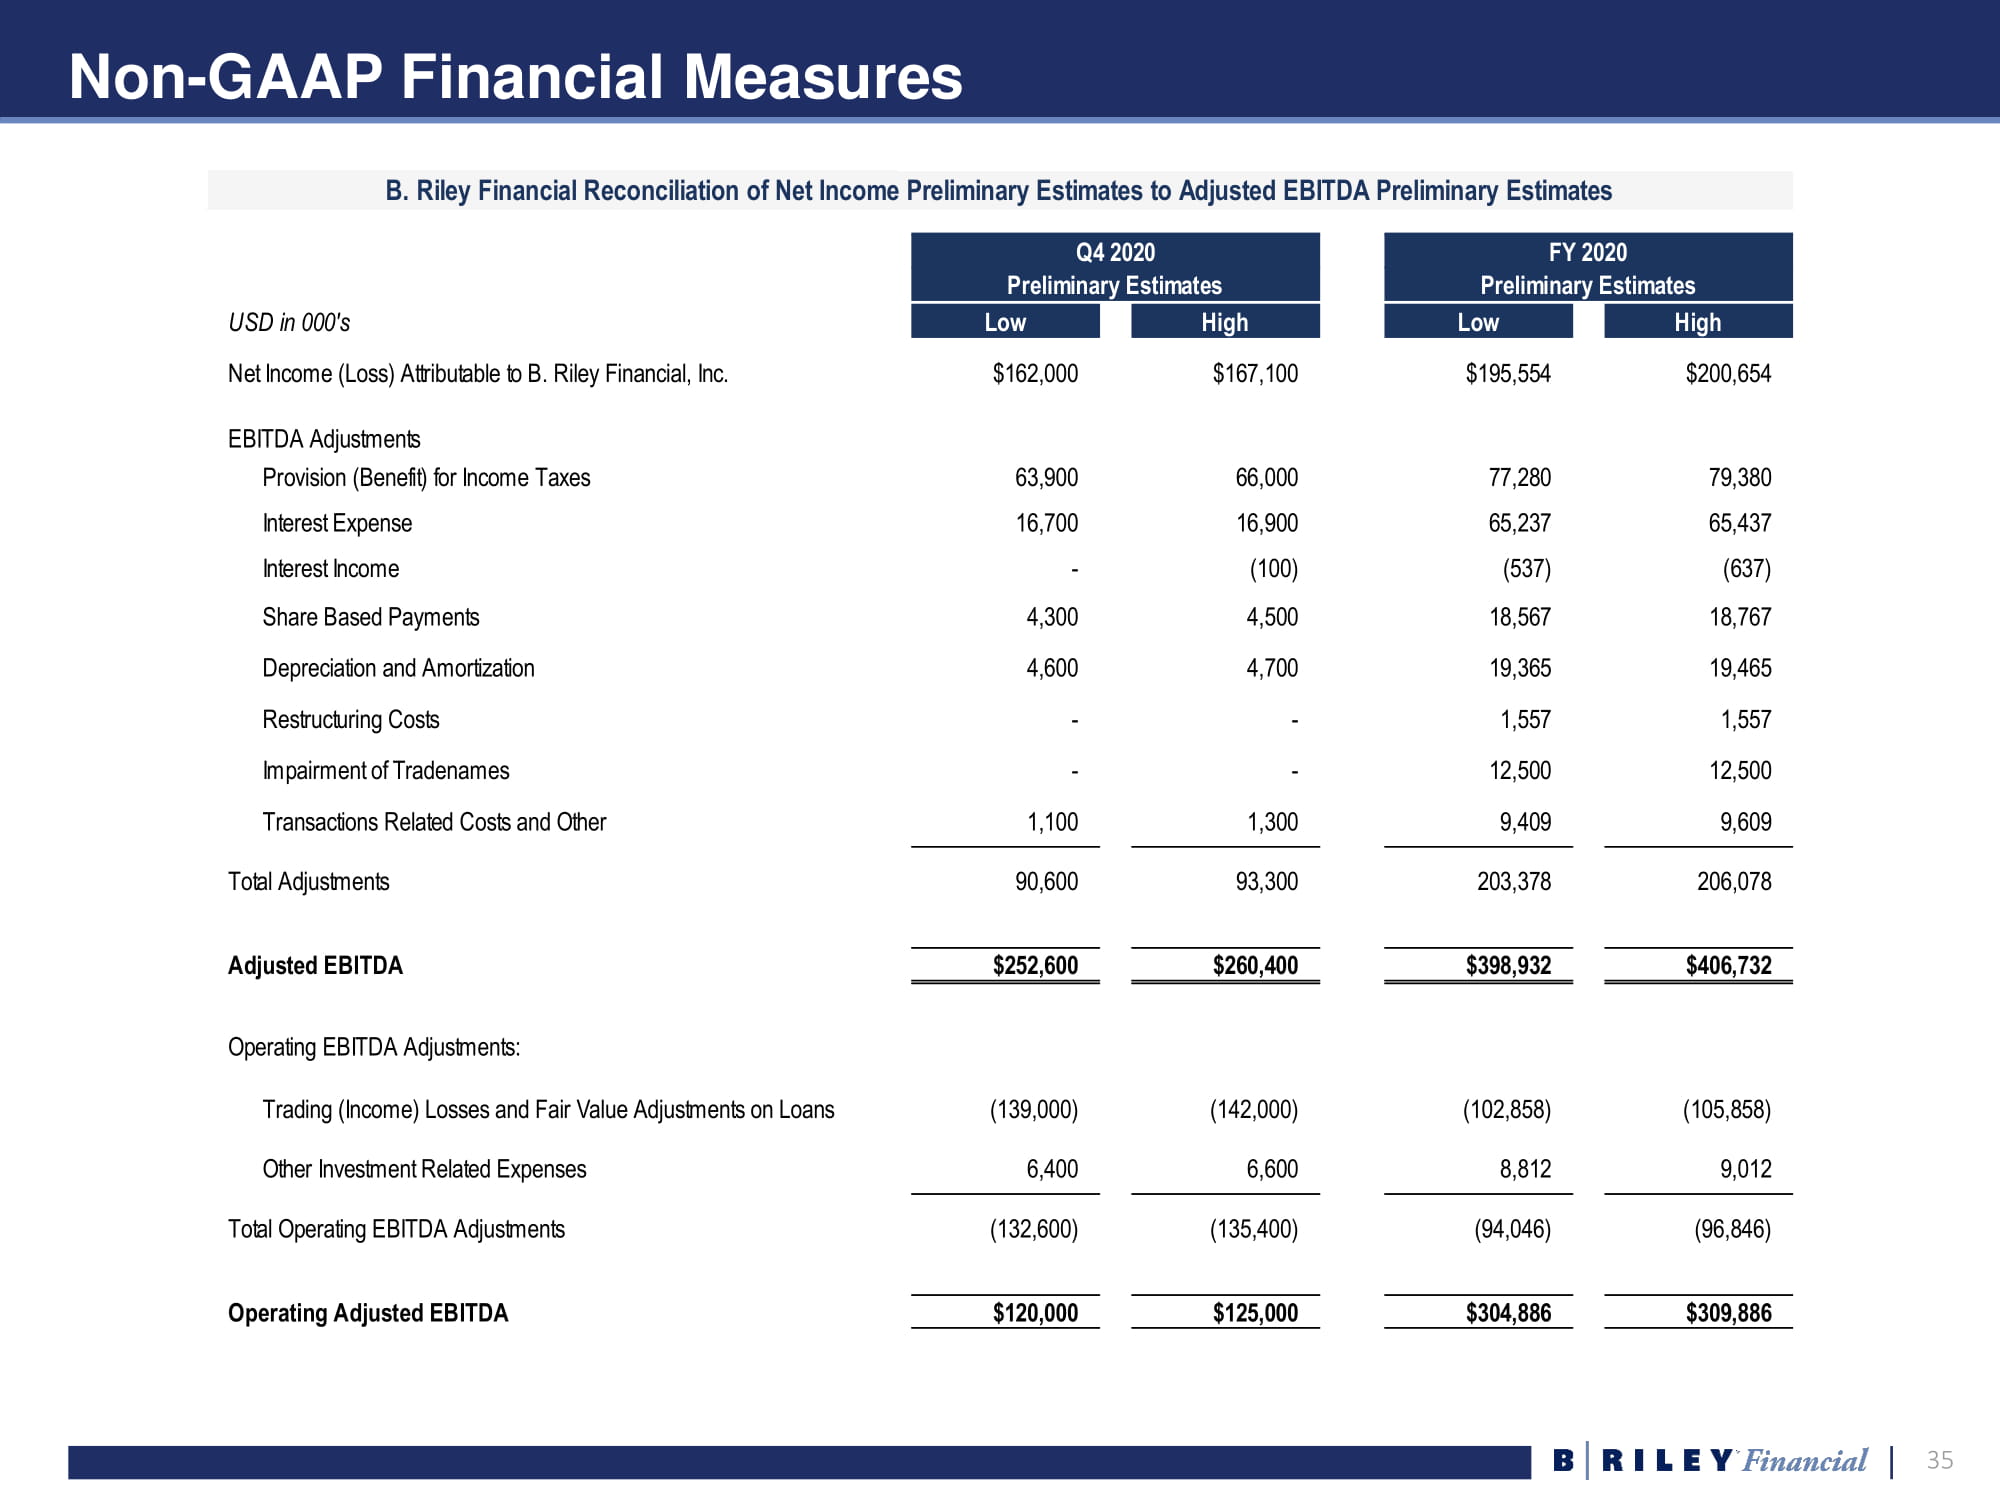
35 Non - GAAP Financial Measures B. Riley Financial Reconciliation of Net Income Preliminary Estimates to Adjusted EBITDA Preliminary Estimates Q4 2020 FY 2020 Preliminary Estimates Preliminary Estimates USD in 000's Low High Low High Net Income (Loss) Attributable to B. Riley Financial, Inc. $162,000 $167,100 $195,554 $200,654 EBITDA Adjustments Provision (Benefit) for Income Taxes 63,900 66,000 77,280 79,380 Interest Expense 16,700 16,900 65,237 65,437 Interest Income - (100) (537) (637) Share Based Payments 4,300 4,500 18,567 18,767 Depreciation and Amortization 4,600 4,700 19,365 19,465 Restructuring Costs - - 1,557 1,557 Impairment of Tradenames - - 12,500 12,500 Transactions Related Costs and Other 1,100 1,300 9,409 9,609 Total Adjustments 90,600 93,300 203,378 206,078 Adjusted EBITDA $252,600 $260,400 $398,932 $406,732 Operating EBITDA Adjustments: Trading (Income) Losses and Fair Value Adjustments on Loans (139,000) (142,000) (102,858) (105,858) Other Investment Related Expenses 6,400 6,600 8,812 9,012 Total Operating EBITDA Adjustments (132,600) (135,400) (94,046) (96,846) Operating Adjusted EBITDA $120,000 $125,000 $304,886 $309,886

36 For more information, please visit www.brileyfin.com