
BRC Group Holdings, Inc 8-K, filed Nov 3, 2022
BRC Group Holdings, Inc. (RILY)
About this 8-K
BRC Group Holdings, Inc filed this 8-K on November 3, 2022.
Items reported
- Item 2.02: Financial results
- Item 7.01: Regulation FD disclosure
- Item 9.01: Financial statements and exhibits
UNITED STATES
SECURITIES AND EXCHANGE COMMISSION
Washington, D.C. 20549
FORM
CURRENT REPORT
Pursuant to Section 13 OR 15(d) of The Securities Exchange Act of 1934
Date of Report (Date of earliest event reported):
(Exact name of registrant as specified in its charter)
| (State or other jurisdiction of incorporation) |
(Commission File Number) | (IRS Employer Identification No.) |
(Address, Including Zip Code, and Telephone Number, Including Area Code, of Registrant’s Principal Executive Offices)
Securities registered pursuant to Section 12(b) of the Act:
| Title of each class | Trading Symbol(s) | Name of each exchange on which registered | ||
| Global Market | ||||
| Global Market | ||||
| Global Market | ||||
(Former name or former address, if changed since last report)
Check the appropriate box below if the Form 8-K filing is intended to simultaneously satisfy the filing obligation of the registrant under any of the following provisions:
| Written communications pursuant to Rule 425 under the Securities Act (17 CFR 230.425) | |
| Soliciting material pursuant to Rule 14a-12 under the Exchange Act (17 CFR 240.14a-12) | |
| Pre-commencement communications pursuant to Rule 14d-2(b) under the Exchange Act (17 CFR 240.14d-2(b)) | |
| Pre-commencement communications pursuant to Rule 13e-4(c) under the Exchange Act (17 CFR 240.13e-4(c)) |
Indicate by check mark whether the registrant is an emerging growth company as defined in Rule 405 of the Securities Act of 1933 (§230.405 of this chapter) or Rule 12b-2 of the Securities Exchange Act of 1934 (§240.12b-2 of this chapter).
Emerging growth company
If an emerging growth company, indicate by check mark if the registrant has elected not to use the extended transition period for complying with any new or revised financial accounting standards provided pursuant to Section 13(a) of the Exchange Act. ☐
Item 2.02. Results of Operations and Financial Condition.
On November 3, 2022, B. Riley Financial, Inc. (the “Company”) issued a press release reporting its financial results for the fiscal quarter ended September 30, 2022. A copy of the press release is attached hereto as Exhibit 99.1.
Item 7.01. Regulation FD Disclosure.
Additionally, on November 3, 2022, in conjunction with the press release described above, the Company posted to its website at https://ir.brileyfin.com/events-and-presentations, certain supplemental financial information for the fiscal quarter ended September 30, 2022 and certain prior periods. A copy of the information is attached hereto as Exhibit 99.2.
The information set forth in this Current Report, including Exhibits 99.1 and 99.2 attached hereto, is being furnished and shall not be deemed “filed” for purposes of Section 18 of the Securities Exchange Act of 1934, as amended (the “Exchange Act”), or otherwise subject to the liabilities of such section. The information in this Current Report, including Exhibits 99.1 and 99.2 attached hereto, shall not be incorporated by reference into any filing under the Securities Act of 1933, as amended, or the Exchange Act, except as expressly set forth by specific reference in such a filing to this Current Report.
Item 9.01. Financial Statements and Exhibits.
(d) Exhibits
| Exhibit No. | Description | |
| 99.1 | Earnings Release dated November 3, 2022 | |
| 99.2 | Third Quarter 2022 Supplemental Financial Data dated November 3, 2022 | |
| 104 | Cover Page Interactive Data File (embedded within the Inline XBRL document) |
1
SIGNATURE
Pursuant to the requirements of the Securities Exchange Act of 1934, the registrant has duly caused this report to be signed on its behalf by the undersigned hereunto duly authorized.
| November 3, 2022 | B. RILEY FINANCIAL, INC. | ||
| By: | /s/ Phillip J. Ahn | ||
| Name: | Phillip J. Ahn | ||
| Title: | Chief Financial Officer and Chief Operating Officer | ||
2
Exhibit 99.1

B. Riley Financial Reports Third Quarter 2022 Results; Declares $1.00 Dividend
Total Revenues of $340.4 million
Net Income of $45.8 million, Diluted EPS of $1.53
Adjusted EBITDA of $141.4 million
Declares Quarterly Dividend of $1.00 per common share
Board Approves Share Repurchase Plan of up to $50 million
LOS ANGELES, November 3, 2022 – B. Riley Financial, Inc. (NASDAQ: RILY) (“B. Riley” or the “Company”), a diversified financial services platform, today released results for the three-month period ending September 30, 2022.
Bryant Riley, Chairman and Co-Chief Executive Officer of B. Riley Financial, commented: “Our third quarter results represent the underlying strength and continued versatility of our diversified platform despite the meaningful slowdown in capital markets. Our ability to generate solid operating results over the past nine months has enabled us to deliver our shareholders with a third quarter dividend of $1.00 per share, and over $83 million in common dividends related to our performance in the current year.”
“Stable operating performance and steady cash flow have provided us a solid foundation with which to operate as we continue to opportunistically invest to enhance our platform. During the quarter, we added BullsEye Telecom to our Lingo subsidiary and expanded our receivables portfolio. And in the beginning of the fourth quarter, we acquired Targus® in a transaction valued at $250 million. These additions are expected to further balance our episodic and cyclical businesses, while meaningfully augmenting our steady and recurring earnings and cash flows as we look ahead,” added Riley.
“It has been over a decade since we have endured a capital markets environment as challenging as the one we navigate today. While we have maintained meaningful profitability, we recognize that the current market environment presents both opportunities and challenges for capital markets and wealth management. Our diversified business is well-structured for continued resiliency in the event challenging markets persist, or even intensify. Cost discipline over our 25-year history has afforded us the agility and flexibility to continue to thrive and aggregate share amid periods of market dislocation. At the same time, steady and growing cash flows have enabled us to return meaningful capital to our shareholders as we continue to invest in our business. We expect to see numerous opportunities over the next 12 to 24 months as market valuations adjust, and believe we are in a very strong position to take advantage of those opportunities.”
Tom Kelleher, Co-Chief Executive Officer of B. Riley Financial, added: “Our world class team of professionals has continued to make great strides incorporating acquisitions and welcoming new colleagues to B. Riley, while continuing to support our clients and partners amid a difficult environment. Embedded throughout our platform is core expertise across restructuring, debt refinancing, direct lending, bankruptcy advisory, and asset disposition. As financial conditions tighten and demand for these services continue to accelerate, we believe our counter-cyclical businesses will be poised for growth in the coming quarters.”
Declaration of Common Dividend
The Company has declared a regular quarterly cash dividend of $1.00 per common share payable on or about November 29 to common stockholders of record as of November 15.
Share Repurchase Authorization
B. Riley’s Board of Directors has approved an annual share repurchase plan under which the Company may repurchase up to $50 million of its common shares.
| www.brileyfin.com | NASDAQ: RILY | 1 |

Third Quarter 2022 Financial Summary
| Three Months Ended September 30, | Nine Months Ended September 30, | |||||||||||||||
| (Dollars in thousands, except for share data) | 2022 | 2021 | 2022 | 2021 | ||||||||||||
| Net income (loss) available to common shareholders | $ | 45,835 | $ | 48,621 | $ | (108,390 | ) | $ | 375,415 | |||||||
| Basic income (loss) per common share | $ | 1.62 | $ | 1.76 | $ | (3.86 | ) | $ | 13.75 | |||||||
| Diluted income (loss) per common share | $ | 1.53 | $ | 1.69 | $ | (3.86 | ) | $ | 13.07 | |||||||
B. Riley Financial reported total revenues of $340.4 million, compared with $381.5 million for the third quarter ended September 30, 2021.
Net income available to common shareholders was $45.8 million, or $1.53 per diluted share, compared to $48.6 million, or $1.69 per diluted share in the prior-year period.
Total adjusted EBITDA for the quarter was $141.4 million, compared to $114.1 million in the prior year period.
| Three Months Ended September 30, | Nine Months Ended September 30, | |||||||||||||||
| (Dollars in thousands) | 2022 | 2021 | 2022 | 2021 | ||||||||||||
| Operating Revenues (2) | $ | 328,209 | $ | 363,325 | $ | 868,815 | $ | 1,000,633 | ||||||||
| Investment Gains (Loss) (4) | 12,154 | 18,197 | (280,163 | ) | 317,818 | |||||||||||
| Total Revenues | $ | 340,363 | $ | 381,522 | $ | 588,652 | $ | 1,318,451 | ||||||||
| Operating Adjusted EBITDA (3) | $ | 106,244 | $ | 101,091 | $ | 264,651 | $ | 315,932 | ||||||||
| Investment Adjusted EBITDA (5) | 35,193 | 13,010 | (218,329 | ) | 308,537 | |||||||||||
| Total Adjusted EBITDA (1) | $ | 141,437 | $ | 114,101 | $ | 46,322 | $ | 624,469 | ||||||||
For the third quarter ended September 30, 2022:
Operating revenues (2) were $328.2 million, compared with $363.3 million for the third quarter ended September 30, 2021. Operating adjusted EBITDA (3) increased to $106.2 million, compared with $101.1 million in the prior year period.
Quarterly investment gains were $12.2 million for the quarter, which reflect certain strategic investments held by the Company.
Quarterly results benefitted from $13.2 million of income related to the deconsolidation of B. Riley Principal 150 Merger Corp. as result of its business combination with FaZe Clan Inc.
Balance Sheet Highlights
As of September 30, 2022, cash and investments (6) totaled approximately $2.33 billion including cash and cash equivalents of $231.8 million, $1.2 billion in net securities and other investments owned, and $814.7 million in loans receivable.
Total debt was approximately $2.32 billion as of September 30. Total cash and investments, (6) net of debt, was approximately $14 million at quarter-end.
| www.brileyfin.com | NASDAQ: RILY | 2 |
Third Quarter 2022 Segment Financial Summary
| Operating Revenues (2) | Investment Gains (Loss) (4) | Total Segment Revenue | ||||||||||||||||||||||
| Three Months Ended September 30, | Three Months Ended September 30, | Three Months Ended September 30, | ||||||||||||||||||||||
| (Dollars in thousands) | 2022 | 2021 | 2022 | 2021 | 2022 | 2021 | ||||||||||||||||||
| Capital Markets | $ | 168,271 | $ | 161,718 | $ | 11,127 | $ | 16,935 | $ | 179,398 | $ | 178,653 | ||||||||||||
| Wealth Management | 47,145 | 117,572 | 1,027 | 1,262 | 48,172 | 118,834 | ||||||||||||||||||
| Auction and Liquidation | 7,039 | 37,072 | - | - | 7,039 | 37,072 | ||||||||||||||||||
| Financial Consulting | 22,835 | 21,291 | - | - | 22,835 | 21,291 | ||||||||||||||||||
| Principal Investments - Communications and Other | 77,896 | 19,300 | - | - | 77,896 | 19,300 | ||||||||||||||||||
| Brands | 5,023 | 6,372 | - | - | 5,023 | 6,372 | ||||||||||||||||||
| Segment Operating Income (Loss) (7) | Investment Income (Loss) (5) | Total Segment Income (Loss) | ||||||||||||||||||||||
| Three Months Ended September 30, | Three Months Ended September 30, | Three Months Ended September 30, | ||||||||||||||||||||||
| (Dollars in thousands) | 2022 | 2021 | 2022 | 2021 | 2022 | 2021 | ||||||||||||||||||
| Capital Markets | $ | 90,767 | $ | 76,142 | $ | 33,337 | $ | 11,748 | $ | 124,104 | $ | 87,890 | ||||||||||||
| Wealth Management | (10,524 | ) | 5,322 | 1,027 | 1,262 | (9,497 | ) | 6,584 | ||||||||||||||||
| Auction and Liquidation | 577 | 6,298 | - | - | 577 | 6,298 | ||||||||||||||||||
| Financial Consulting | 2,704 | 2,769 | - | - | 2,704 | 2,769 | ||||||||||||||||||
| Principal Investments - Communications and Other | 1,906 | 6,506 | - | - | 1,906 | 6,506 | ||||||||||||||||||
| Brands | 3,599 | 4,686 | - | - | 3,599 | 4,686 | ||||||||||||||||||
For the three months ended September 30, 2022:
Capital Markets revenues of $179.4 million remained relatively flat, despite lower levels of investment banking and underwriting activity. Segment income increased to $124.1 million, up from $87.9 million in the prior year period, primarily driven by interest income from loans and securities lending.
Excluding investment gains(4), Capital Markets segment operating revenues increased to $168.3 million, up from $161.7 million in the prior year period. Segment operating income (7) increased to $90.8 million from $76.1 million in the prior year period.
Wealth Management revenues decreased to $48.2 million, primarily impacted by our strategic exit of several brokers and certain businesses previously affiliated with National Securities, in addition to challenging market conditions which resulted in reduced client activity. Wealth assets under management were approximately $25 billion as of September 30, 2022.
Auction and Liquidation revenues were $7.0 million, primarily driven by ongoing engagements in Europe and smaller liquidation projects in the US. Results for this segment vary from quarter-to-quarter and year-to-year due to the episodic impact of large retail liquidation engagements.
| www.brileyfin.com | NASDAQ: RILY | 3 |
Financial Consulting revenues increased to $22.8 million, up from $21.3 million in the prior year period, primarily driven by sustained demand for appraisals, and bankruptcy restructuring and forensic litigation consulting. Segment income of $2.7 million remained steady compared to $2.8 million in the prior year period.
Principal Investments – Communications and Other segment revenues increased 304% to $77.9 million, up from $19.3 million in the prior year period due to the additions of Marconi Wireless, Lingo, and Bullseye Telecom. On a combined basis, communications businesses, along with other principal investments, continued to perform above expectations, contributing recurring cash flow to the Company.
Brands segment revenues were $5.0 million related to the licensing of trademarks for six brands: Catherine Malandrino, English Laundry, Joan Vass, Kensie Girl, Limited Too, and Nanette Lepore.
Investments in the Hurley and Justice brands contributed dividend income of $7.1 million for the quarter, compared to $4.3 million in the same period last year. Results related to the Hurley and Justice investments are recognized as Capital Markets segment operating income.(7)
Supplemental Financial Data
Additional details related to operating results and investment performance can be found in the Third Quarter 2022 Financial Supplement on B. Riley’s investor relations website.
Conference Call Details
Management will host an investor call to discuss its third quarter results today, Thursday, November 3, 2022 at 4:30 p.m. Eastern time (1:30 p.m. Pacific time). Investors may access the live broadcast and archived recording via ir.brileyfin.com.
| Date and Time: | Thursday, November 3, 2022 at 4:30 p.m. Eastern time (1:30 p.m. Pacific time) | |
| Dial In: | 1-800-239-9838 (toll-free) or 1-856-344-9221 (international) | |
| Audio Webcast: | https://ir.brileyfin.com/events-and-presentations | |
| Replay (expires Thursday, November 10, 2022) | ||
| Dial In: | 1-844-512-2921; 9397082 (pin) | |
About B. Riley Financial
B. Riley Financial is a diversified financial services platform that delivers tailored solutions to meet the strategic, operational, and capital needs of its clients and partners. B. Riley leverages cross-platform expertise to provide clients with full service, collaborative solutions at every stage of the business life cycle. Through its affiliated subsidiaries, B. Riley provides end-to-end, collaborative financial services across investment banking, institutional brokerage, private wealth and investment management, financial consulting, corporate restructuring, operations management, risk and compliance, due diligence, forensic accounting, litigation support, appraisal and valuation, auction, and liquidation services. B. Riley opportunistically invests to benefit its shareholders, and certain registered affiliates originate and underwrite senior secured loans for asset-rich companies. B. Riley refers to B. Riley Financial, Inc. and/or one or more of its subsidiaries or affiliates. For more information, please visit www.brileyfin.com.
Footnotes (See "Note Regarding Use of Non-GAAP Financial Measures" for further discussion of these non-GAAP terms.)
| (1) | Adjusted EBITDA includes earnings before interest, taxes, depreciation, amortization, restructuring charge, share-based payments, gain on extinguishment of loans, impairment of tradenames, and transaction related and other costs. For a definition of adjusted EBITDA and a reconciliation to GAAP financial measures, please see the Appendix hereto. |
| (2) | Operating revenue is defined as the sum of revenues from services and fees, interest income - loans and securities lending, and sale of goods. |
| (3) | Operating adjusted EBITDA is defined as adjusted EBITDA excluding trading income (losses) and fair value adjustments on loans and other investment related expenses. |
| (4) | Investment gains (loss) is defined as trading income (losses) and fair value adjustments on loans. |
| (5) | Investment adjusted EBITDA and investment income (loss) are defined as trading income (losses) and fair value adjustments on loans, less other investment related expenses. |
| (6) | Total cash and investments is defined as the sum of cash and cash equivalents, restricted cash, due from clearing brokers net of due to clearing brokers, securities and other investments owned, at fair value net of (i) securities sold not yet purchased and (ii) noncontrolling interest related to investments, advances against customer contracts, loans receivable, at fair value net of loan participations sold, and other investments reported in prepaid and other assets. |
| (7) | Segment operating income (loss) is defined as segment income (loss) excluding trading income (losses) and fair value adjustments on loans and other investment related operating expenses. |
| www.brileyfin.com | NASDAQ: RILY | 4 |
Note Regarding Use of Non-GAAP Financial Measures
Certain of the information set forth herein, including operating revenues, adjusted EBITDA, operating adjusted EBITDA, and investment adjusted EBITDA, may be considered non-GAAP financial measures. B. Riley Financial believes this information is useful to investors because it provides a basis for measuring the Company's available capital resources, the operating performance of its business and its revenues and cash flow, (i) excluding in the case of operating revenues, trading income (losses) and fair value adjustments on loans, (ii) excluding in the case of adjusted EBITDA, net interest expense, provisions for or benefit from income taxes, depreciation, amortization, fair value adjustment, restructuring charge, gain on extinguishment of loans, impairment of trade names, stock-based compensation and transaction and other expenses, (iii) excluding in the case of operating adjusted EBITDA, the aforementioned adjustments for adjusted EBITDA as well as trading income (losses) and fair value adjustments on loans, and other investment related expenses, (iv) including in the case of investment adjusted EBITDA, trading income (losses) and fair value adjustments on loans, net of other investment related expenses, and (v) including in the case of total cash and investments, net of debt, total cash, net securities and investments, and other minus total debt, that would normally be included in the most directly comparable measures calculated and presented in accordance with Generally Accepted Accounting Principles ("GAAP"). In addition, the Company's management uses these non-GAAP financial measures along with the most directly comparable GAAP financial measures in evaluating the Company's operating performance, management compensation, capital resources, and cash flow. Non-GAAP financial measures should not be considered in isolation from, or as a substitute for, financial information presented in compliance with GAAP, and non-financial measures as reported by the Company may not be comparable to similarly titled amounts reported by other companies.
Forward-Looking Statements
Statements in this press release that are not descriptions of historical facts are forward-looking statements that are based on management's current expectations and assumptions and are subject to risks and uncertainties. If such risks or uncertainties materialize or such assumptions prove incorrect, our business, operating results, financial condition, and stock price could be materially negatively affected. You should not place undue reliance on such forward-looking statements, which are based on the information currently available to us and speak only as of the date of this press release. Such forward-looking statements include, but are not limited to, statements regarding our excitement and the expected growth of our business segments. Factors that could cause such actual results to differ materially from those contemplated or implied by such forward-looking statements include, without limitation, the risks associated with the unpredictable and ongoing impact of the COVID-19 pandemic and other risks described from time to time in B. Riley Financial, Inc.’s periodic filings with the SEC, including, without limitation, the risks described in B. Riley Financial, Inc.’s Annual Report on Form 10-K for the year ended December 31, 2021 under the captions “Risk Factors” and “Management's Discussion and Analysis of Financial Condition and Results of Operations” (as applicable). Additional information will be set forth in our Quarterly Report on Form 10-Q for the quarter ended September 30, 2022. These factors should be considered carefully, and readers are cautioned not to place undue reliance on such forward-looking statements. All information is current as of the date this press release is issued, and B. Riley Financial undertakes no duty to update this information.
Contacts
|
Investors Mike Frank ir@brileyfin.com (212) 409-2424 |
Media Jo Anne McCusker press@brileyfin.com (646) 885-5425 |
| www.brileyfin.com | NASDAQ: RILY | 5 |
B. RILEY FINANCIAL, INC.
Consolidated Balance Sheets
(Dollars in thousands, except par value)
| September 30, | December 31, | |||||||
| 2022 | 2021 | |||||||
| (Unaudited) | ||||||||
| Assets | ||||||||
| Assets | ||||||||
| Cash and cash equivalents | $ | 231,805 | $ | 278,933 | ||||
| Restricted cash | 1,578 | 927 | ||||||
| Due from clearing brokers | 53,472 | 29,657 | ||||||
| Securities and other investments owned, at fair value | 1,238,613 | 1,532,095 | ||||||
| Securities borrowed | 2,243,306 | 2,090,966 | ||||||
| Accounts receivable, net | 64,707 | 49,673 | ||||||
| Due from related parties | 814 | 2,074 | ||||||
| Loans receivable, at fair value (includes $68,575 and $167,744 from related parties as of September 30, 2022 and December 31, 2021, respectively.) | 814,715 | 873,186 | ||||||
| Prepaid expenses and other assets | 355,875 | 463,502 | ||||||
| Operating lease right-of-use assets | 84,550 | 56,969 | ||||||
| Property and equipment, net | 16,174 | 12,870 | ||||||
| Goodwill | 429,187 | 250,568 | ||||||
| Other intangible assets, net | 296,346 | 207,651 | ||||||
| Deferred tax assets, net | 2,845 | 2,848 | ||||||
| Total assets | $ | 5,833,987 | $ | 5,851,919 | ||||
| Liabilities and Equity | ||||||||
| Liabilities | ||||||||
| Accounts payable | $ | 22,167 | $ | 6,326 | ||||
| Accrued expenses and other liabilities | 278,889 | 343,750 | ||||||
| Deferred revenue | 89,157 | 69,507 | ||||||
| Deferred tax liabilities, net | 10,932 | 93,055 | ||||||
| Due to related parties and partners | 396 | — | ||||||
| Due to clearing brokers | 3,942 | 69,398 | ||||||
| Securities sold not yet purchased | 17,751 | 28,623 | ||||||
| Securities loaned | 2,239,250 | 2,088,685 | ||||||
| Operating lease liabilities | 96,049 | 69,072 | ||||||
| Notes payable | 25,075 | 357 | ||||||
| Revolving credit facility | 74,700 | 80,000 | ||||||
| Term loans, net | 558,035 | 346,385 | ||||||
| Senior notes payable, net | 1,661,191 | 1,606,560 | ||||||
| Total liabilities | 5,077,534 | 4,801,718 | ||||||
| Commitments and contingencies | ||||||||
| Redeemable noncontrolling interests in equity of subsidiaries | 178,759 | 345,000 | ||||||
| B. Riley Financial, Inc. equity: | ||||||||
| Preferred stock, $0.0001 par value; 1,000,000 shares authorized; 4,535 and 4,512 issued and outstanding as of September 30, 2022 and December 31, 2021, respectively; liquidation preference of $113,380 and $112,790 as of September 30, 2022 and December 31, 2021, respectively. | — | — | ||||||
| Common stock, $0.0001 par value; 100,000,000 shares authorized; 28,300,003 and 27,591,028 issued and outstanding as of September 30, 2022 and December 31, 2021, respectively. | 3 | 3 | ||||||
| Additional paid-in capital | 473,420 | 413,486 | ||||||
| Retained earnings | 46,916 | 248,862 | ||||||
| Accumulated other comprehensive loss | (6,726 | ) | (1,080 | ) | ||||
| Total B. Riley Financial, Inc. stockholders' equity | 513,613 | 661,271 | ||||||
| Noncontrolling interests | 64,081 | 43,930 | ||||||
| Total equity | 577,694 | 705,201 | ||||||
| Total liabilities and equity | $ | 5,833,987 | $ | 5,851,919 | ||||
| www.brileyfin.com | NASDAQ: RILY | 6 |
B. RILEY FINANCIAL, INC.
Consolidated Statements of Operations
(Unaudited)
(Dollars in thousands, except share data)
| Three Months Ended | Nine Months Ended | |||||||||||||||
| September 30, | September 30, | |||||||||||||||
| 2022 | 2021 | 2022 | 2021 | |||||||||||||
| Revenues: | ||||||||||||||||
| Services and fees | $ | 266,485 | $ | 301,497 | $ | 678,065 | $ | 857,109 | ||||||||
| Trading income (losses) and fair value adjustments on loans | 12,154 | 18,197 | (280,163 | ) | 317,818 | |||||||||||
| Interest income - Loans and securities lending | 57,594 | 26,869 | 182,855 | 89,280 | ||||||||||||
| Sale of goods | 4,130 | 34,959 | 7,895 | 54,244 | ||||||||||||
| Total revenues | 340,363 | 381,522 | 588,652 | 1,318,451 | ||||||||||||
| Operating expenses: | ||||||||||||||||
| Direct cost of services | 44,523 | 18,019 | 73,959 | 41,435 | ||||||||||||
| Cost of goods sold | 3,089 | 12,442 | 7,334 | 21,394 | ||||||||||||
| Selling, general and administrative expenses | 163,727 | 244,218 | 506,062 | 635,484 | ||||||||||||
| Restructuring charge | 8,016 | — | 8,016 | — | ||||||||||||
| Interest expense - Securities lending and loan participations sold | 17,447 | 10,097 | 43,757 | 40,269 | ||||||||||||
| Total operating expenses | 236,802 | 284,776 | 639,128 | 738,582 | ||||||||||||
| Operating income (loss) | 103,561 | 96,746 | (50,476 | ) | 579,869 | |||||||||||
| Other income (expense): | ||||||||||||||||
| Interest income | 686 | 70 | 1,253 | 175 | ||||||||||||
| Change in fair value of financial instruments and other | (574 | ) | 1,758 | 9,728 | 8,267 | |||||||||||
| (Loss) income from equity investments | (91 | ) | 1,149 | 3,285 | 1,172 | |||||||||||
| Interest expense | (34,587 | ) | (25,372 | ) | (96,787 | ) | (66,014 | ) | ||||||||
| Income (loss) before income taxes | 68,995 | 74,351 | (132,997 | ) | 523,469 | |||||||||||
| (Provision for) benefit from income taxes | (16,350 | ) | (22,693 | ) | 39,858 | (140,113 | ) | |||||||||
| Net income (loss) | 52,645 | 51,658 | (93,139 | ) | 383,356 | |||||||||||
| Net income attributable to noncontrolling interests and redeemable noncontrolling interests | 4,808 | 1,108 | 9,245 | 2,474 | ||||||||||||
| Net income (loss) attributable to B. Riley Financial, Inc. | 47,837 | 50,550 | (102,384 | ) | 380,882 | |||||||||||
| Preferred stock dividends | 2,002 | 1,929 | 6,006 | 5,467 | ||||||||||||
| Net income (loss) available to common shareholders | $ | 45,835 | $ | 48,621 | $ | (108,390 | ) | $ | 375,415 | |||||||
| Basic income (loss) per common share | $ | 1.62 | $ | 1.76 | $ | (3.86 | ) | $ | 13.75 | |||||||
| Diluted income (loss) per common share | $ | 1.53 | $ | 1.69 | $ | (3.86 | ) | $ | 13.07 | |||||||
| Weighted average basic common shares outstanding | 28,293,064 | 27,570,716 | 28,068,160 | 27,297,917 | ||||||||||||
| Weighted average diluted common shares outstanding | 29,968,417 | 28,794,066 | 28,068,160 | 28,726,492 | ||||||||||||
| www.brileyfin.com | NASDAQ: RILY | 7 |
B. RILEY FINANCIAL, INC.
Segment Financial Information
(Unaudited)
(Dollars in thousands)
| Three Months Ended | Nine Months Ended | |||||||||||||||
| September 30, | September 30, | |||||||||||||||
| 2022 | 2021 | 2022 | 2021 | |||||||||||||
| Capital Markets segment: | ||||||||||||||||
| Revenues - Services and fees | $ | 113,217 | $ | 134,849 | $ | 249,727 | $ | 431,825 | ||||||||
| Trading income (loss) and fair value adjustments on loans | 11,127 | 16,935 | (283,240 | ) | 311,335 | |||||||||||
| Interest income - Loans and securities lending | 55,054 | 26,869 | 178,879 | 89,280 | ||||||||||||
| Total revenues | 179,398 | 178,653 | 145,366 | 832,440 | ||||||||||||
| Selling, general and administrative expenses | (35,673 | ) | (80,152 | ) | (115,655 | ) | (231,765 | ) | ||||||||
| Interest expense - Securities lending and loan participations sold | (17,447 | ) | (10,097 | ) | (43,757 | ) | (40,269 | ) | ||||||||
| Depreciation and amortization | (2,174 | ) | (514 | ) | (6,271 | ) | (1,526 | ) | ||||||||
| Segment income (loss) | 124,104 | 87,890 | (20,317 | ) | 558,880 | |||||||||||
| Wealth Management segment: | ||||||||||||||||
| Revenues - Services and fees | 47,145 | 117,572 | 184,963 | 270,558 | ||||||||||||
| Trading income and fair value adjustments on loans | 1,027 | 1,262 | 3,077 | 6,483 | ||||||||||||
| Total revenues | 48,172 | 118,834 | 188,040 | 277,041 | ||||||||||||
| Selling, general and administrative expenses | (52,302 | ) | (110,157 | ) | (206,438 | ) | (260,331 | ) | ||||||||
| Restructuring charge | (4,106 | ) | — | (4,106 | ) | — | ||||||||||
| Depreciation and amortization | (1,261 | ) | (2,093 | ) | (4,402 | ) | (6,832 | ) | ||||||||
| Segment (loss) income | (9,497 | ) | 6,584 | (26,906 | ) | 9,878 | ||||||||||
| Auction and Liquidation segment: | ||||||||||||||||
| Revenues - Services and fees | 1,949 | 2,745 | 7,792 | 15,637 | ||||||||||||
| Revenues - Sale of goods | 2,550 | 34,327 | 2,550 | 52,162 | ||||||||||||
| Interest income - Loans and securities lending | 2,540 | — | 3,976 | — | ||||||||||||
| Total revenues | 7,039 | 37,072 | 14,318 | 67,799 | ||||||||||||
| Direct cost of services | (2,999 | ) | (13,622 | ) | (6,630 | ) | (27,742 | ) | ||||||||
| Cost of goods sold | (1,235 | ) | (11,999 | ) | (1,235 | ) | (19,578 | ) | ||||||||
| Selling, general and administrative expenses | (2,228 | ) | (5,153 | ) | (6,225 | ) | (9,719 | ) | ||||||||
| Segment income | 577 | 6,298 | 228 | 10,760 | ||||||||||||
| Financial Consulting segment: | ||||||||||||||||
| Revenues - Services and fees | 22,835 | 21,291 | 73,081 | 66,435 | ||||||||||||
| Selling, general and administrative expenses | (20,056 | ) | (18,436 | ) | (60,947 | ) | (55,896 | ) | ||||||||
| Depreciation and amortization | (75 | ) | (86 | ) | (234 | ) | (273 | ) | ||||||||
| Segment income | 2,704 | 2,769 | 11,900 | 10,266 | ||||||||||||
| Principal Investments - Communications and Other segment: | ||||||||||||||||
| Revenues - Services and fees | 76,316 | 18,669 | 147,748 | 57,394 | ||||||||||||
| Revenues - Sale of goods | 1,580 | 631 | 5,345 | 2,081 | ||||||||||||
| Total revenues | 77,896 | 19,300 | 153,093 | 59,475 | ||||||||||||
| Direct cost of services | (41,524 | ) | (4,397 | ) | (67,329 | ) | (13,693 | ) | ||||||||
| Cost of goods sold | (1,854 | ) | (443 | ) | (6,099 | ) | (1,816 | ) | ||||||||
| Selling, general and administrative expenses | (22,267 | ) | (5,458 | ) | (44,103 | ) | (15,096 | ) | ||||||||
| Restructuring charge | (3,910 | ) | — | (3,910 | ) | — | ||||||||||
| Depreciation and amortization | (6,435 | ) | (2,496 | ) | (13,255 | ) | (7,558 | ) | ||||||||
| Segment income | 1,906 | 6,506 | 18,397 | 21,312 | ||||||||||||
| Brands segment: | ||||||||||||||||
| Revenues - Services and fees | 5,023 | 6,372 | 14,754 | 15,261 | ||||||||||||
| Selling, general and administrative expenses | (845 | ) | (972 | ) | (2,419 | ) | (2,338 | ) | ||||||||
| Depreciation and amortization | (579 | ) | (714 | ) | (1,745 | ) | (2,143 | ) | ||||||||
| Segment income | 3,599 | 4,686 | 10,590 | 10,780 | ||||||||||||
| Consolidated operating income (loss) from reportable segments | 123,393 | 114,733 | (6,108 | ) | 621,876 | |||||||||||
| Corporate and other expenses | (19,832 | ) | (17,987 | ) | (44,368 | ) | (42,007 | ) | ||||||||
| Interest income | 686 | 70 | 1,253 | 175 | ||||||||||||
| Change in fair value of financial instruments and other | (574 | ) | 1,758 | 9,728 | 8,267 | |||||||||||
| (Loss) income on equity investments | (91 | ) | 1,149 | 3,285 | 1,172 | |||||||||||
| Interest expense | (34,587 | ) | (25,372 | ) | (96,787 | ) | (66,014 | ) | ||||||||
| Income (loss) before income taxes | 68,995 | 74,351 | (132,997 | ) | 523,469 | |||||||||||
| (Provision for) benefit from income taxes | (16,350 | ) | (22,693 | ) | 39,858 | (140,113 | ) | |||||||||
| Net income (loss) | 52,645 | 51,658 | (93,139 | ) | 383,356 | |||||||||||
| Net income attributable to noncontrolling interests and redeemable noncontrolling interests | 4,808 | 1,108 | 9,245 | 2,474 | ||||||||||||
| Net income (loss) attributable to B. Riley Financial, Inc. | 47,837 | 50,550 | (102,384 | ) | 380,882 | |||||||||||
| Preferred stock dividends | 2,002 | 1,929 | 6,006 | 5,467 | ||||||||||||
| Net income (loss) available to common shareholders | $ | 45,835 | $ | 48,621 | $ | (108,390 | ) | $ | 375,415 | |||||||
| www.brileyfin.com | NASDAQ: RILY | 8 |
B. RILEY FINANCIAL, INC.
Adjusted EBITDA and Operating Adjusted EBITDA Reconciliation
(Unaudited)
(Dollars in thousands)
| Three Months Ended | Nine Months Ended | |||||||||||||||
| September 30, | September 30, | |||||||||||||||
| 2022 | 2021 | 2022 | 2021 | |||||||||||||
| Net income (loss) attributable to B. Riley Financial, Inc. | $ | 47,837 | $ | 50,550 | $ | (102,384 | ) | $ | 380,882 | |||||||
| Adjustments: | ||||||||||||||||
| Provision for (benefit from) income taxes | 16,350 | 22,693 | (39,858 | ) | 140,113 | |||||||||||
| Interest expense | 34,587 | 25,372 | 96,787 | 66,014 | ||||||||||||
| Interest income | (686 | ) | (70 | ) | (1,253 | ) | (175 | ) | ||||||||
| Share based payments | 14,613 | 9,374 | 45,828 | 23,508 | ||||||||||||
| Depreciation and amortization | 10,717 | 6,142 | 26,526 | 19,066 | ||||||||||||
| Restructuring charge | 8,016 | — | 8,016 | — | ||||||||||||
| Gain on extinguishment of loans | — | — | (1,102 | ) | (6,509 | ) | ||||||||||
| Transactions related costs and other | 10,003 | 40 | 13,762 | 1,570 | ||||||||||||
| Total EBITDA Adjustments | 93,600 | 63,551 | 148,706 | 243,587 | ||||||||||||
| Adjusted EBITDA | $ | 141,437 | $ | 114,101 | $ | 46,322 | $ | 624,469 | ||||||||
| Operating EBITDA Adjustments: | ||||||||||||||||
| Trading (income) losses and fair value adjustments on loans | (12,154 | ) | (18,197 | ) | 280,163 | (317,818 | ) | |||||||||
| Other investment related expenses | (23,039 | ) | 5,187 | (61,834 | ) | 9,281 | ||||||||||
| Total Operating EBITDA Adjustments | (35,193 | ) | (13,010 | ) | 218,329 | (308,537 | ) | |||||||||
| Operating Adjusted EBITDA | $ | 106,244 | $ | 101,091 | $ | 264,651 | $ | 315,932 | ||||||||
| www.brileyfin.com | NASDAQ: RILY | 9 |
B. RILEY FINANCIAL, INC.
Adjusted Net Income Reconciliation
(Unaudited)
(Dollars in thousands, except share data)
| Three Months Ended | Nine Months Ended | |||||||||||||||
| September 30, | September 30, | |||||||||||||||
| 2022 | 2021 | 2022 | 2021 | |||||||||||||
| Net income (loss) attributable to B. Riley Financial, Inc. | $ | 47,837 | $ | 50,550 | $ | (102,384 | ) | $ | 380,882 | |||||||
| Adjustments: | ||||||||||||||||
| Share based payments | 14,613 | 9,374 | 45,828 | 23,508 | ||||||||||||
| Amortization of intangible assets | 9,390 | 5,156 | 23,146 | 16,176 | ||||||||||||
| Restructuring charge | 8,016 | — | 8,016 | — | ||||||||||||
| Gain on extinguishment of loans | — | — | (1,102 | ) | (6,509 | ) | ||||||||||
| Transactions related costs and other | 10,003 | 40 | 13,762 | 1,570 | ||||||||||||
| Income tax effect of adjusting entries | (10,704 | ) | (4,514 | ) | (23,593 | ) | (9,587 | ) | ||||||||
| Adjusted net income (loss) attributable to B. Riley Financial, Inc. | $ | 79,155 | $ | 60,606 | $ | (36,327 | ) | $ | 406,040 | |||||||
| Adjusted income (loss) per common share: | ||||||||||||||||
| Adjusted basic income (loss) per share | $ | 2.80 | $ | 2.20 | $ | (1.29 | ) | $ | 14.87 | |||||||
| Adjusted diluted income (loss) per share | $ | 2.64 | $ | 2.10 | $ | (1.29 | ) | $ | 14.13 | |||||||
| Shares used to calculate adjusted basic net income per share | 28,293,064 | 27,570,716 | 28,068,160 | 27,297,917 | ||||||||||||
| Shares used to calculate adjusted diluted net income per share | 29,968,417 | 28,794,066 | 28,068,160 | 28,726,492 | ||||||||||||
# # #
Source: B. Riley Financial, Inc.
| www.brileyfin.com | NASDAQ: RILY | 10 |
Exhibit 99.2

1 NASDAQ: RILY Third Quarter 2022 Supplemental Financial Data November 3, 2022
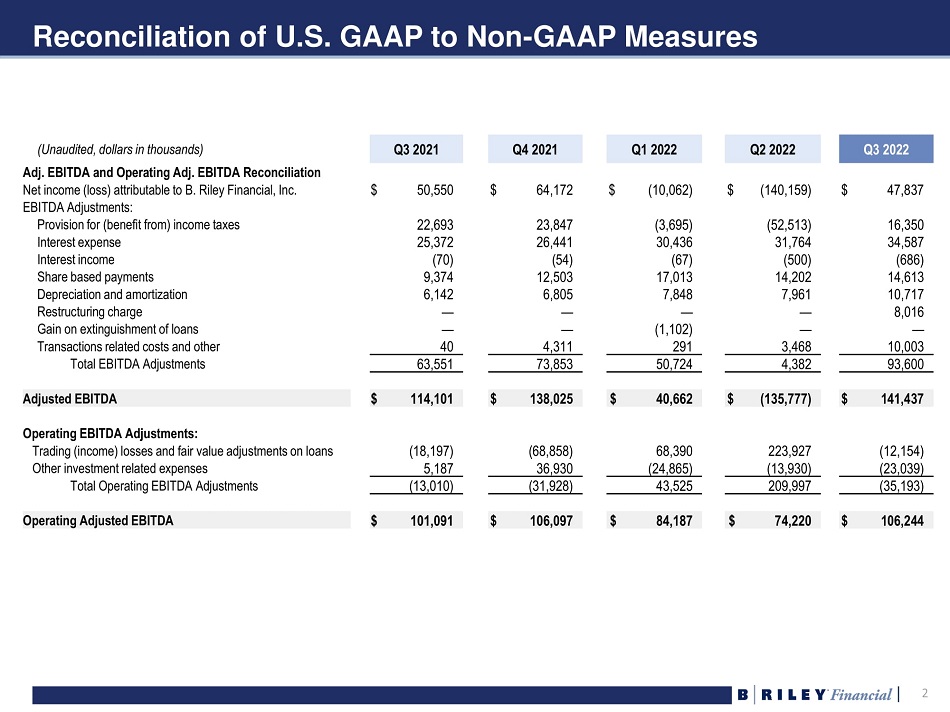
2 2 Reconciliation of U.S. GAAP to Non - GAAP Measures (Unaudited, dollars in thousands) Q3 2021 Q4 2021 Q1 2022 Q2 2022 Q3 2022 Adj. EBITDA and Operating Adj. EBITDA Reconciliation Net income (loss) attributable to B. Riley Financial, Inc. $ 50,550 $ 64,172 $ (10,062) $ (140,159) $ 47,837 EBITDA Adjustments: Provision for (benefit from) income taxes 22,693 23,847 (3,695) (52,513) 16,350 Interest expense 25,372 26,441 30,436 31,764 34,587 Interest income (70) (54) (67) (500) (686) Share based payments 9,374 12,503 17,013 14,202 14,613 Depreciation and amortization 6,142 6,805 7,848 7,961 10,717 Restructuring charge — — — — 8,016 Gain on extinguishment of loans — — (1,102) — — Transactions related costs and other 40 4,311 291 3,468 10,003 Total EBITDA Adjustments 63,551 73,853 50,724 4,382 93,600 Adjusted EBITDA $ 114,101 $ 138,025 $ 40,662 $ (135,777) $ 141,437 Operating EBITDA Adjustments: Trading (income) losses and fair value adjustments on loans (18,197) (68,858) 68,390 223,927 (12,154) Other investment related expenses 5,187 36,930 (24,865) (13,930) (23,039) Total Operating EBITDA Adjustments (13,010) (31,928) 43,525 209,997 (35,193) Operating Adjusted EBITDA $ 101,091 $ 106,097 $ 84,187 $ 74,220 $ 106,244
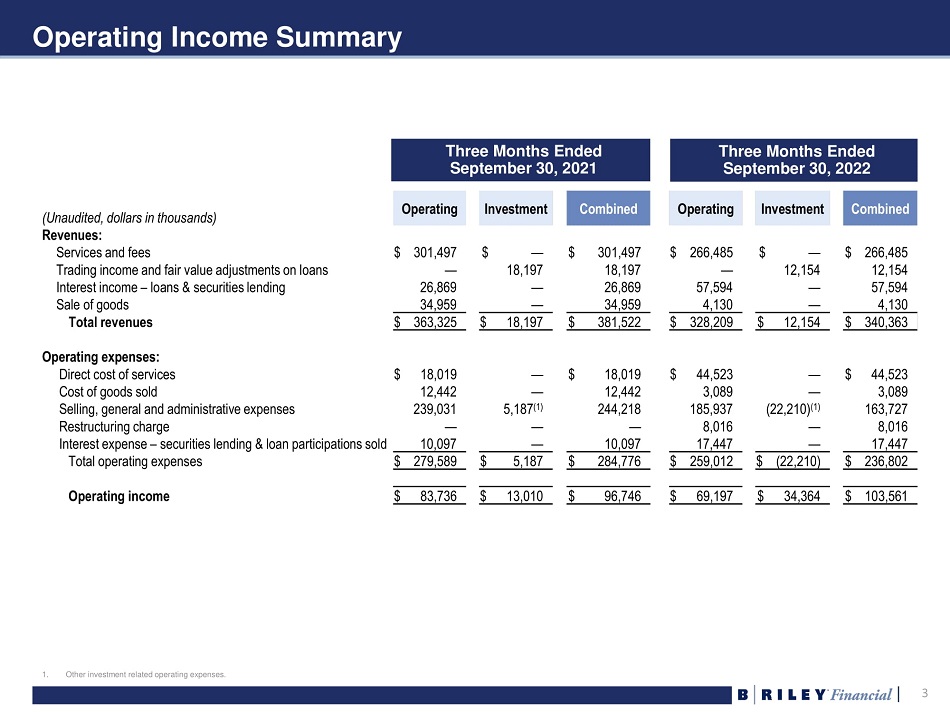
3 3 Operating Income Summary 1. Other investment related operating expenses. (Unaudited, dollars in thousands) Operating Investment Combined Operating Investment Combined Revenues: Services and fees $ 301,497 $ — $ 301,497 $ 266,485 $ — $ 266,485 Trading income and fair value adjustments on loans — 18,197 18,197 — 12,154 12,154 Interest income – loans & securities lending 26,869 — 26,869 57,594 — 57,594 Sale of goods 34,959 — 34,959 4,130 — 4,130 Total revenues $ 363,325 $ 18,197 $ 381,522 $ 328,209 $ 12,154 $ 340,363 Operating expenses: Direct cost of services $ 18,019 — $ 18,019 $ 44,523 — $ 44,523 Cost of goods sold 12,442 — 12,442 3,089 — 3,089 Selling, general and administrative expenses 239,031 5,187 (1) 244,218 185,937 (22,210) (1) 163,727 Restructuring charge — — — 8,016 — 8,016 Interest expense – securities lending & loan participations sold 10,097 — 10,097 17,447 — 17,447 Total operating expenses $ 279,589 $ 5,187 $ 284,776 $ 259,012 $ (22,210) $ 236,802 Operating income $ 83,736 $ 13,010 $ 96,746 $ 69,197 $ 34,364 $ 103,561 Three Months Ended September 30, 2021 Three Months Ended September 30, 2022
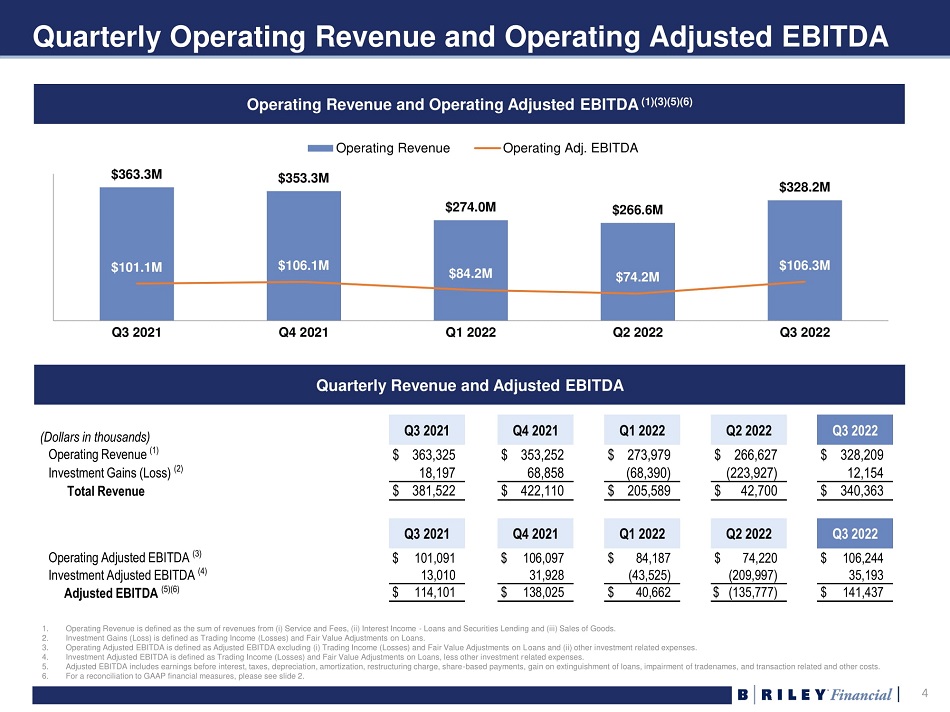
4 4 Quarterly Operating Revenue and Operating Adjusted EBITDA Operating Revenue and Operating Adjusted EBITDA (1)(3)(5)(6) (Dollars in thousands) Q3 2021 Q4 2021 Q1 2022 Q2 2022 Q3 2022 Operating Revenue (1) $ 363,325 $ 353,252 $ 273,979 $ 266,627 $ 328,209 Investment Gains (Loss) (2) 18,197 68,858 (68,390) (223,927) 12,154 Total Revenue $ 381,522 $ 422,110 $ 205,589 $ 42,700 $ 340,363 Q3 2021 Q4 2021 Q1 2022 Q2 2022 Q3 2022 Operating Adjusted EBITDA (3) $ 101,091 $ 106,097 $ 84,187 $ 74,220 $ 106,244 Investment Adjusted EBITDA (4) 13,010 31,928 (43,525) (209,997) 35,193 Adjusted EBITDA (5)(6) $ 114,101 $ 138,025 $ 40,662 $ (135,777) $ 141,437 Quarterly Revenue and Adjusted EBITDA 1. Operating Revenue is defined as the sum of revenues from (i) Service and Fees, (ii) Interest Income - Loans and Securities Lendi ng and (iii) Sales of Goods. 2. Investment Gains (Loss) is defined as Trading Income (Losses) and Fair Value Adjustments on Loans. 3. Operating Adjusted EBITDA is defined as Adjusted EBITDA excluding (i) Trading Income (Losses) and Fair Value Adjustments on L oan s and (ii) other investment related expenses. 4. Investment Adjusted EBITDA is defined as Trading Income (Losses) and Fair Value Adjustments on Loans, less other investment r ela ted expenses. 5. Adjusted EBITDA includes earnings before interest, taxes, depreciation, amortization, restructuring charge, share - based payments , gain on extinguishment of loans, impairment of tradenames, and transaction related and other costs. 6. For a reconciliation to GAAP financial measures, please see slide 2. $363.3M $353.3M $274.0M $266.6M $328.2M $101.1M $106.1M $84.2M $74.2M $106.3M Q3 2021 Q4 2021 Q1 2022 Q2 2022 Q3 2022 Operating Revenue Operating Adj. EBITDA

5 5 Cash and Investments Summary (Dollars in thousands) Sep 30, 2021 Dec 31, 2021 Mar 31, 2022 Jun 30, 2022 Sep 30, 2022 Cash and Cash Equivalents $ 378,205 $ 278,933 $ 213,584 $ 216,098 $ 231,805 Restricted Cash 927 927 928 928 1,578 Due from/(to) Clearing Brokers, net 599,715 (39,741) 40,350 25,902 49,530 Advances Against Customer Contracts 200 200 200 200 200 Securities and Other Investments Owned Equity Securities 1,276,191 1,444,474 1,228,690 1,055,379 1,140,728 Corporate Bonds 5,401 7,632 10,508 8,231 6,761 Other Fixed Income Securities 4,436 2,606 3,681 2,321 8,649 Partnership Interests and Other 66,072 77,383 74,222 78,965 82,475 Securities Sold Not Yet Purchased (419,211) (28,623) (7,498) (5,403) (17,751) Loans Receivable, net of Loan Participations Sold 350,762 873,186 882,391 770,840 814,715 Other investments and deposits (1) 43,369 40,187 49,391 49,156 45,947 Noncontrolling interest (2) (16,558) (17,785) (17,135) (25,317) (32,038) Total Cash, Net Securities, and Other $ 2,289,509 $ 2,639,379 $ 2,479,312 $ 2,177,300 $ 2,332,599 (Dollars in thousands) Sep 30, 2021 Dec 31, 2021 Mar 31, 2022 Jun 30, 2022 Sep 30, 2022 Term Loans, net $ 252,927 $ 346,385 $ 342,851 $ 367,815 $ 558,035 Revolving Credit Facility 80,000 80,000 80,000 80,000 74,700 Notes Payable 357 357 22,891 23,186 25,075 Senior Notes Payable, net 1,362,847 1,606,560 1,627,649 1,644,778 1,661,191 Total Debt 1,696,131 2,033,302 2,073,391 2,115,779 2,319,001 Total Cash and Investments, Net of Debt $ 593,378 $ 606,077 $ 405,921 $ 61,521 $ 13,598 1. Other investments and investment related deposits reported in prepaid and other assets. 2. Noncontrolling interest related to investments reported in Securities and Other Investments Owned. Debt Summary
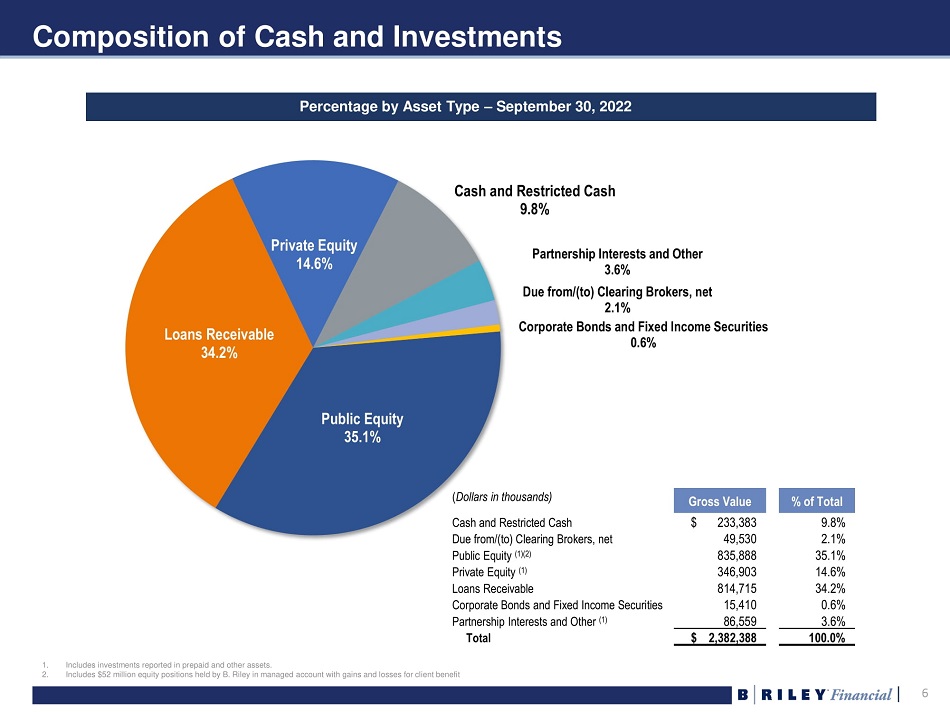
6 6 Composition of Cash and Investments Percentage by Asset Type – September 30, 2022 ( Dollars in thousands) Gross Value % of Total Cash and Restricted Cash $ 233,383 9.8% Due from/(to) Clearing Brokers, net 49,530 2.1% Public Equity (1)(2) 835,888 35.1% Private Equity (1) 346,903 14.6% Loans Receivable 814,715 34.2% Corporate Bonds and Fixed Income Securities 15,410 0.6% Partnership Interests and Other (1) 86,559 3.6% Total $ 2,382,388 100.0% 1. Includes investments reported in prepaid and other assets. 2. Includes $52 million equity positions held by B. Riley in managed account with gains and losses for client benefit Public Equity 35.1% Loans Receivable 34.2% Private Equity 14.6% Cash and Restricted Cash 9.8% Partnership Interests and Other 3.6% Due from/(to) Clearing Brokers, net 2.1% Corporate Bonds and Fixed Income Securities 0.6%
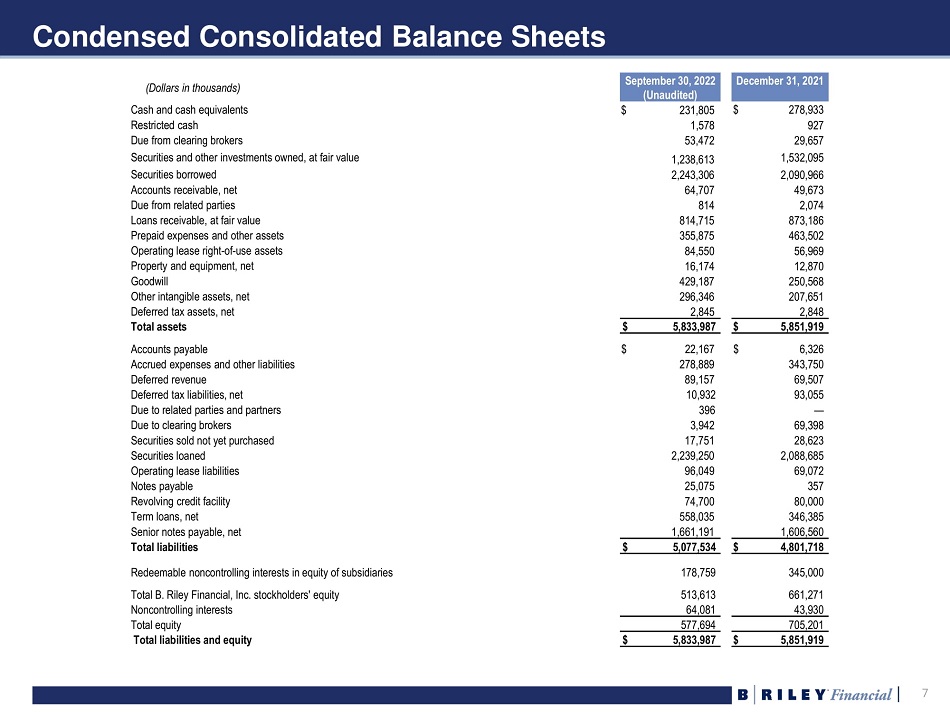
7 7 Condensed Consolidated Balance Sheets (Dollars in thousands) September 30, 2022 (Unaudited) December 31, 2021 Cash and cash equivalents $ 231,805 $ 278,933 Restricted cash 1,578 927 Due from clearing brokers 53,472 29,657 Securities and other investments owned, at fair value 1,238,613 1,532,095 Securities borrowed 2,243,306 2,090,966 Accounts receivable, net 64,707 49,673 Due from related parties 814 2,074 Loans receivable, at fair value 814,715 873,186 Prepaid expenses and other assets 355,875 463,502 Operating lease right - of - use assets 84,550 56,969 Property and equipment, net 16,174 12,870 Goodwill 429,187 250,568 Other intangible assets, net 296,346 207,651 Deferred tax assets, net 2,845 2,848 Total assets $ 5,833,987 $ 5,851,919 Accounts payable $ 22,167 $ 6,326 Accrued expenses and other liabilities 278,889 343,750 Deferred revenue 89,157 69,507 Deferred tax liabilities, net 10,932 93,055 Due to related parties and partners 396 — Due to clearing brokers 3,942 69,398 Securities sold not yet purchased 17,751 28,623 Securities loaned 2,239,250 2,088,685 Operating lease liabilities 96,049 69,072 Notes payable 25,075 357 Revolving credit facility 74,700 80,000 Term loans, net 558,035 346,385 Senior notes payable, net 1,661,191 1,606,560 Total liabilities $ 5,077,534 $ 4,801,718 Redeemable noncontrolling interests in equity of subsidiaries 178,759 345,000 Total B. Riley Financial, Inc. stockholders' equity 513,613 661,271 Noncontrolling interests 64,081 43,930 Total equity 577,694 705,201 Total liabilities and equity $ 5,833,987 $ 5,851,919
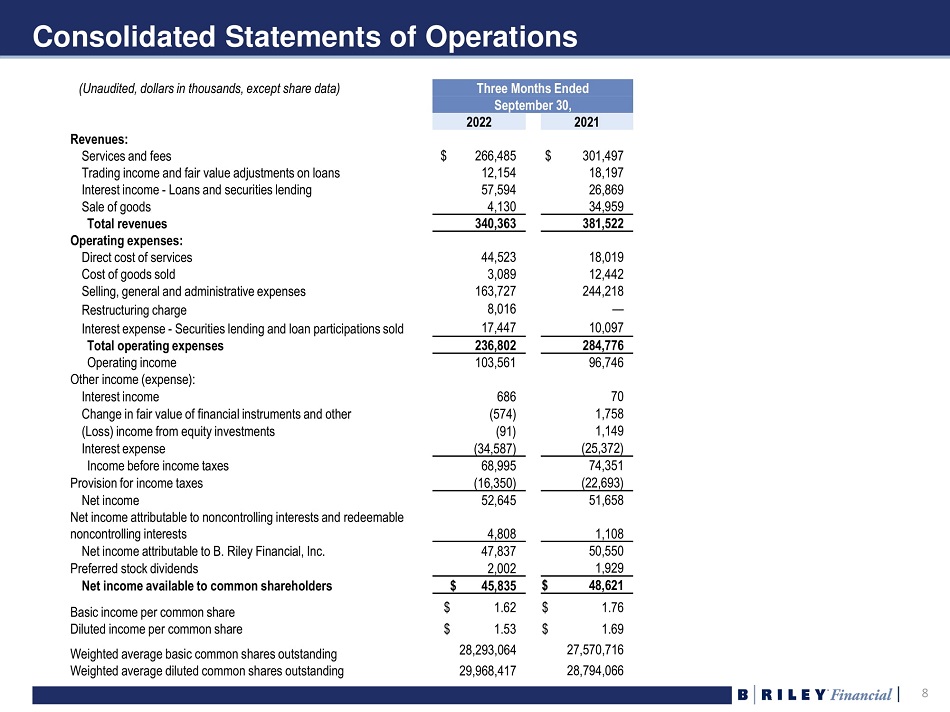
8 8 Consolidated Statements of Operations (Unaudited, dollars in thousands, except share data) Three Months Ended September 30, 2022 2021 Revenues: Services and fees $ 266,485 $ 301,497 Trading income and fair value adjustments on loans 12,154 18,197 Interest income - Loans and securities lending 57,594 26,869 Sale of goods 4,130 34,959 Total revenues 340,363 381,522 Operating expenses: Direct cost of services 44,523 18,019 Cost of goods sold 3,089 12,442 Selling, general and administrative expenses 163,727 244,218 Restructuring charge 8,016 — Interest expense - Securities lending and loan participations sold 17,447 10,097 Total operating expenses 236,802 284,776 Operating income 103,561 96,746 Other income (expense): Interest income 686 70 Change in fair value of financial instruments and other (574) 1,758 (Loss) income from equity investments (91) 1,149 Interest expense (34,587) (25,372) Income before income taxes 68,995 74,351 Provision for income taxes (16,350) (22,693) Net income 52,645 51,658 Net income attributable to noncontrolling interests and redeemable noncontrolling interests 4,808 1,108 Net income attributable to B. Riley Financial, Inc. 47,837 50,550 Preferred stock dividends 2,002 1,929 Net income available to common shareholders $ 45,835 $ 48,621 Basic income per common share $ 1.62 $ 1.76 Diluted income per common share $ 1.53 $ 1.69 Weighted average basic common shares outstanding 28,293,064 27,570,716 Weighted average diluted common shares outstanding 29,968,417 28,794,066
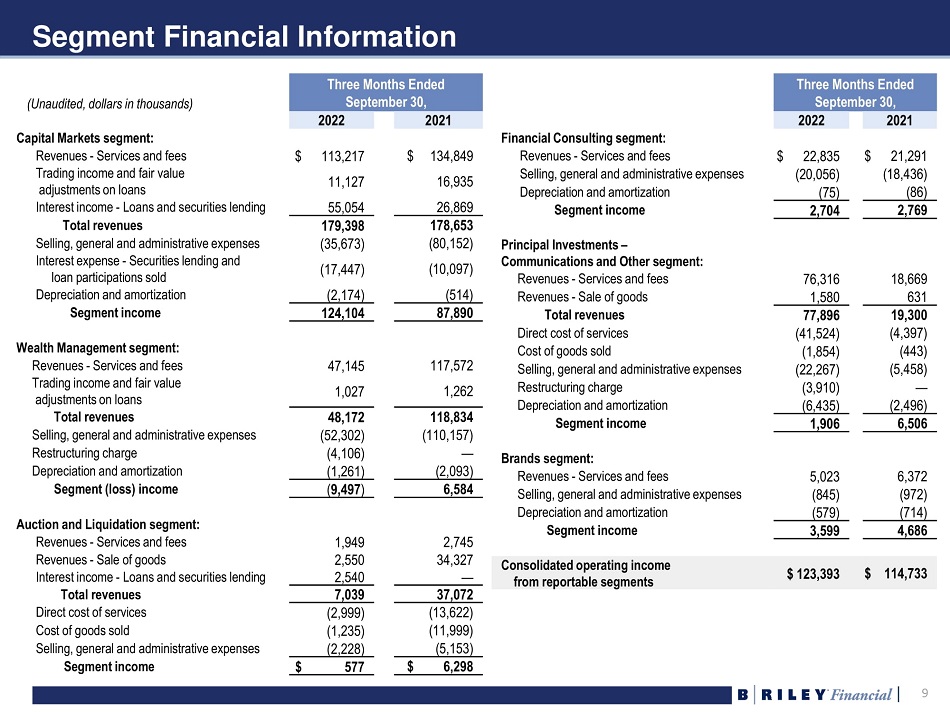
9 9 Segment Financial Information (Unaudited, dollars in thousands) Three Months Ended September 30, 2022 2021 Capital Markets segment: Revenues - Services and fees $ 113,217 $ 134,849 Trading income and fair value adjustments on loans 11,127 16,935 Interest income - Loans and securities lending 55,054 26,869 Total revenues 179,398 178,653 Selling, general and administrative expenses (35,673) (80,152) Interest expense - Securities lending and loan participations sold (17,447) (10,097) Depreciation and amortization (2,174) (514) Segment income 124,104 87,890 Wealth Management segment: Revenues - Services and fees 47,145 117,572 Trading income and fair value adjustments on loans 1,027 1,262 Total revenues 48,172 118,834 Selling, general and administrative expenses (52,302) (110,157) Restructuring charge (4,106) — Depreciation and amortization (1,261) (2,093) Segment (loss) income ( 9,497 ) 6,584 Auction and Liquidation segment: Revenues - Services and fees 1,949 2,745 Revenues - Sale of goods 2,550 34,327 Interest income - Loans and securities lending 2,540 — Total revenues 7,039 37,072 Direct cost of services (2,999) (13,622) Cost of goods sold (1,235) (11,999) Selling, general and administrative expenses (2,228) (5,153) Segment income $ 577 $ 6,298 Three Months Ended September 30 , 2022 2021 Financial Consulting segment: Revenues - Services and fees $ 22,835 $ 21,291 Selling, general and administrative expenses (20,056) (18,436) Depreciation and amortization (75) (86) Segment income 2,704 2,769 Principal Investments – Communications and Other segment: Revenues - Services and fees 76,316 18,669 Revenues - Sale of goods 1,580 631 Total revenues 77,896 19,300 Direct cost of services (41,524) (4,397) Cost of goods sold (1,854) (443) Selling, general and administrative expenses (22,267) (5,458) Restructuring charge (3,910) — Depreciation and amortization (6,435) (2,496) Segment income 1,906 6,506 Brands segment: Revenues - Services and fees 5,023 6,372 Selling, general and administrative expenses (845) (972) Depreciation and amortization (579) (714) Segment income 3,599 4,686 Consolidated operating income from reportable segments $ 123,393 $ 114,733
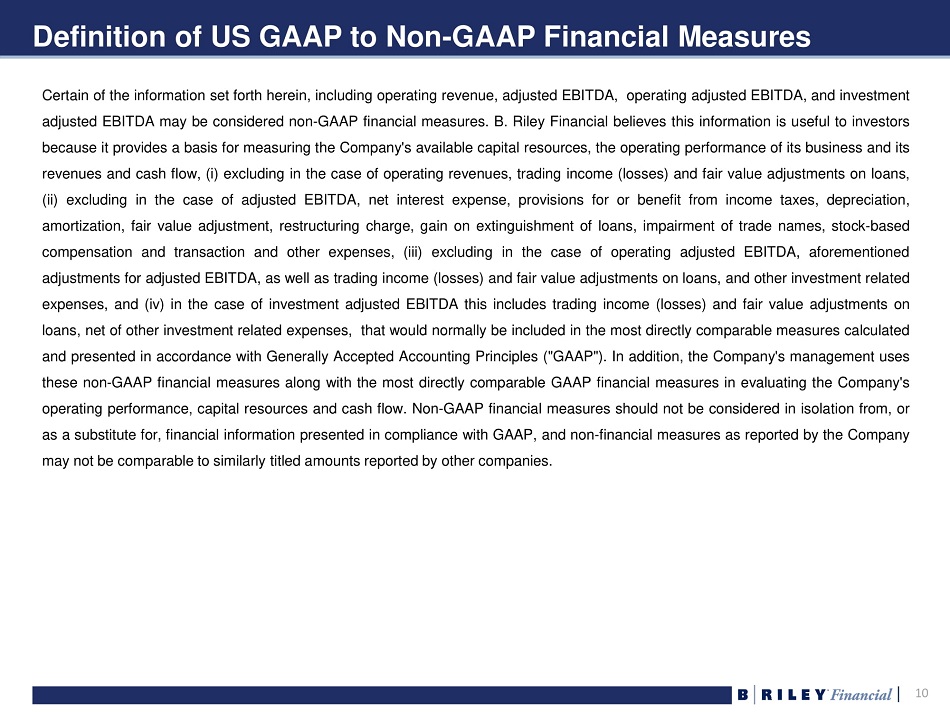
10 10 Definition of US GAAP to Non - GAAP Financial Measures Certain of the information set forth herein, including operating revenue, adjusted EBITDA, operating adjusted EBITDA, and investment adjusted EBITDA may be considered non - GAAP financial measures . B . Riley Financial believes this information is useful to investors because it provides a basis for measuring the Company's available capital resources, the operating performance of its business and its revenues and cash flow, (i) excluding in the case of operating revenues, trading income (losses) and fair value adjustments on loans, (ii) excluding in the case of adjusted EBITDA, net interest expense, provisions for or benefit from income taxes, depreciation, amortization, fair value adjustment, restructuring charge, gain on extinguishment of loans, impairment of trade names, stock - based compensation and transaction and other expenses, (iii) excluding in the case of operating adjusted EBITDA, aforementioned adjustments for adjusted EBITDA, as well as trading income (losses) and fair value adjustments on loans, and other investment related expenses, and (iv) in the case of investment adjusted EBITDA this includes trading income (losses) and fair value adjustments on loans, net of other investment related expenses, that would normally be included in the most directly comparable measures calculated and presented in accordance with Generally Accepted Accounting Principles ("GAAP") . In addition, the Company's management uses these non - GAAP financial measures along with the most directly comparable GAAP financial measures in evaluating the Company's operating performance, capital resources and cash flow . Non - GAAP financial measures should not be considered in isolation from, or as a substitute for, financial information presented in compliance with GAAP, and non - financial measures as reported by the Company may not be comparable to similarly titled amounts reported by other companies .