
BRC Group Holdings, Inc 8-K, filed Oct 29, 2020
BRC Group Holdings, Inc. (RILY)
About this 8-K
BRC Group Holdings, Inc filed this 8-K on October 29, 2020.
Items reported
- Item 2.02: Financial results
- Item 7.01: Regulation FD disclosure
- Item 9.01: Financial statements and exhibits
UNITED STATES
SECURITIES AND EXCHANGE COMMISSION
Washington, D.C. 20549
FORM
CURRENT REPORT
Pursuant to Section 13 OR 15(d) of The Securities Exchange Act of 1934
Date of Report (Date of earliest event reported):
(Exact name of registrant as specified in its charter)
| (State or other jurisdiction of incorporation) | (Commission File Number) | (IRS Employer Identification No.) |
(Address, Including Zip Code, and Telephone Number, Including Area Code, of Registrant’s Principal Executive Offices)
Securities registered pursuant to Section 12(b) of the Act:
| Title of each class | Trading Symbol(s) | Name of each exchange on which registered | ||
| Depositary Shares (each representing a 1/1000th interest in a 6.875% Series A Cumulative Perpetual Preferred Share, par value $0.0001 per share) | RILYP | Nasdaq Global Market | ||
| Depositary Shares (each representing a 1/1000th interest in a 7.375% Series B Cumulative Perpetual Preferred Share, par value $0.0001 per share) | RILYL | Nasdaq Global Market | ||
| 7.25% Senior Notes due 2027 | RILYG | Nasdaq Global Market | ||
| 7.50% Senior Notes due 2027 | RILYZ | Nasdaq Global Market | ||
| 7.375% Senior Notes due 2023 | RILYH | Nasdaq Global Market | ||
| 6.875% Senior Notes due 2023 | RILYI | Nasdaq Global Market | ||
| 6.75% Senior Notes due 2024 | RILYO | Nasdaq Global Market | ||
| 6.50% Senior Notes due 2026 | RILYN | Nasdaq Global Market | ||
| 6.375% Senior Notes due 2025 | RILYM | Nasdaq Global Market |
Not Applicable
(Former name or former address, if changed since last report)
Check the appropriate box below if the Form 8-K filing is intended to simultaneously satisfy the filing obligation of the registrant under any of the following provisions:
| Written communications pursuant to Rule 425 under the Securities Act (17 CFR 230.425) | |
| Soliciting material pursuant to Rule 14a-12 under the Exchange Act (17 CFR 240.14a-12) | |
| Pre-commencement communications pursuant to Rule 14d-2(b) under the Exchange Act (17 CFR 240.14d-2(b)) | |
| Pre-commencement communications pursuant to Rule 13e-4(c) under the Exchange Act (17 CFR 240.13e-4(c)) | |
Indicate by check mark whether the registrant is an emerging growth company as defined in Rule 405 of the Securities Act of 1933 (§230.405 of this chapter) or Rule 12b-2 of the Securities Exchange Act of 1934 (§240.12b-2 of this chapter).
Emerging growth company
If an emerging growth company, indicate by check mark if the registrant has elected not to use the extended transition period for complying with any new or revised financial accounting standards provided pursuant to Section 13(a) of the Exchange Act. ☐
Item 2.02. Results of Operations and Financial Condition.
On October 29, 2020, B. Riley Financial, Inc. (the “Company”) issued a press release reporting its financial results for the fiscal quarter ended September 30, 2020. A copy of the press release is attached hereto as Exhibit 99.1.
Item 7.01. Regulation FD Disclosure.
Additionally, on October 29, 2020, in conjunction with the press release described above, the Company posted to its website at https://ir.brileyfin.com/events-and-presentations, certain supplemental financial information for the fiscal quarter ended September 30, 2020 and certain prior periods. A copy of the information is attached hereto as Exhibit 99.2.
The information set forth in this Current Report, including Exhibits 99.1 and 99.2 attached hereto, is being furnished and shall not be deemed “filed” for purposes of Section 18 of the Securities Exchange Act of 1934, as amended (the “Exchange Act”), or otherwise subject to the liabilities of such section. The information in this Current Report, including Exhibits 99.1 and 99.2 attached hereto, shall not be incorporated by reference into any filing under the Securities Act of 1933, as amended, or the Exchange Act, except as expressly set forth by specific reference in such a filing to this Current Report.
Item 9.01. Financial Statements and Exhibits.
(d) Exhibits
| Exhibit No. | Description | |
| 99.1 | Earnings Release dated October 29, 2020 | |
| 99.2 | Third Quarter 2020 Supplemental Financial Data dated October 29, 2020 | |
| 104 | Cover Page Interactive Data File (embedded within the Inline XBRL document) |
1
SIGNATURE
Pursuant to the requirements of the Securities Exchange Act of 1934, the registrant has duly caused this report to be signed on its behalf by the undersigned hereunto duly authorized.
| October 29, 2020 | B. RILEY FINANCIAL, INC. | ||
| By: | /s/ Phillip J. Ahn | ||
| Name: | Phillip J. Ahn | ||
| Title: | Chief Financial Officer and Chief Operating Officer | ||
2
Exhibit 99.1
 | www.brileyfin.com |
B. Riley Financial Reports Strong Third
Quarter 2020 Results
Q3 2020 Consolidated Revenues of $226.3
million and Net Income of $47.3 million, or $1.75 per Diluted Share
Year-to-Date Consolidated Revenues of $492.5 million and Net Income of $30.3 million
Q3 2020 Operating adjusted EBITDA of $67.2 million; YTD Operating Adjusted EBITDA of $184.9 million
Regular Quarterly Cash Dividend Raised
to $0.375 per Common Share
Board of Directors Approves Additional Share Repurchase Program
LOS ANGELES, October 29, 2020 – B. Riley Financial, Inc. (NASDAQ:RILY) (“B. Riley” or the “Company”) today announced results for the third quarter ended September 30, 2020.
Third Quarter 2020 Financial Highlights
| · | GAAP consolidated revenues of $226.3 million |
| · | Net income available to common shareholders of $47.3 million, or $1.75 per diluted share |
| · | Adjusted EBITDA (1) of $94.1 million |
| · | Operating revenues (2) of $194.5 million and operating adjusted EBITDA (3) of $67.2 million |
“We delivered strong third quarter results across our business lines which generated net income of $47.3 million compared to $34.3 million last year and operating adjusted EBITDA growth of over 90%,” said Bryant Riley, Chairman and Co-Chief Executive Officer. “Our capital markets group was the primary driver of growth this quarter, having realized impressive performance in all of its verticals. Our focus on helping small cap companies navigate financial markets with advisory, capital raising, and restructuring services is the ethos of our firm and this quarter confirmed that we provide vital services during periods of market turmoil like we have seen with COVID-19. As we continue to creatively gain market share in each of our segments within capital markets, we anticipate becoming the market leader within the small cap ecosystem. In addition to capital markets, we have continued to see strong performance out of our liquidation business given the unfortunate ramifications of COVID-19. Additionally, our valuation business, brand portfolio, and wholly owned subsidiaries within our principal investments business continue to generate steady cash flows and healthy returns on invested capital. Finally, we continue to view our balance sheet as a vital differentiator that sets us apart from the competition. We saw investment gains of $32 million in the quarter which marks a continued recovery from our first quarter losses. This understates the importance that our strong balance sheet and our net cash and investments have on driving growth and cash flow across our segments. We pride ourselves on being solution providers to companies in need and use our balance sheet as a tool to generate both fees and returns. When I look through our portfolio, I am as optimistic as I have ever been about its future performance and love our set up as we finish the remainder of the year. Year-to-date, we have delivered net income of $30.3 million and almost $185 million of operating adjusted EBITDA, up 90% over last year. In addition, we have a clear line of sight to delivering strong growth in the fourth quarter as well. Our strong performance and the confidence we have in our business strategy and future are the primary reasons for our increasing our regular quarterly dividend to $0.375.”
Mr. Riley added, “Since the formation of B. Riley Financial in 2014, our philosophy has been to provide a regular dividend enhanced by special dividends based on the strength of our episodic businesses. As our overall business has become increasingly diversified and recurring in nature, we feel a larger regular dividend annualized at $1.50 per share is more appropriate to reflect the underlying cash flow generating power of our business. To be clear, we will continue to consider special dividends when appropriate, and trust that a stable and growing regular dividend will be appreciated by our shareholders. In addition, we will continue to opportunistically repurchase shares as noted by our buyback authorization. Year-to-date, we repurchased approximately 1.7 million shares representing approximately 7% of our shares outstanding.”
B. Riley Financial, Inc. | www.brileyfin.com | NASDAQ: RILY
Co-Chief Executive Officer Tom Kelleher added, “This past quarter we took concerted steps to position our platform to drive increased client and shareholder value by rebranding our operating companies and providing greater visibility into the breadth of our offerings. In addition, we launched our venture capital business which should strengthen our capabilities to identify, acquire and invest in attractive emerging growth companies and is a highly strategic addition to our already broad platform. Moving forward, we are confident in our strategy and our ability to drive continued growth.”
Third Quarter 2020 Financial Summary
| Three Months Ended | Nine Months Ended | |||||||||||||||
| September 30, | September 30, | |||||||||||||||
| (Dollars in thousands) | 2020 | 2019 | 2020 | 2019 | ||||||||||||
| Revenues | ||||||||||||||||
| Operating Revenues (2) | $ | 194,500 | $ | 139,795 | $ | 528,657 | $ | 415,145 | ||||||||
| Investment Gains (Loss) (4) | 31,753 | 40,268 | (36,142 | ) | 71,730 | |||||||||||
| Total Revenues | $ | 226,253 | $ | 180,063 | $ | 492,515 | $ | 486,875 | ||||||||
| Adjusted EBITDA (1) | ||||||||||||||||
| Operating Adjusted EBITDA (3) | $ | 67,222 | $ | 35,200 | $ | 184,886 | $ | 97,209 | ||||||||
| Investment Adjusted EBITDA (5) | 26,911 | 35,130 | (38,554 | ) | 60,407 | |||||||||||
| Total Adjusted EBITDA | $ | 94,133 | $ | 70,330 | $ | 146,332 | $ | 157,616 | ||||||||
B. Riley Financial reported total revenues of $226.3 million for the three months ended September 30, 2020, up from $180.1 million in total revenues for the prior year period. Operating revenues (2) totaled $194.5 million compared to $139.8 million in the prior year period.
Net income available to common shareholders totaled $47.3 million, or $1.75 per diluted share, compared to net income of $34.3 million, or $1.21 per diluted share, for the prior year period.
Total adjusted EBITDA (1) increased to $94.1 million from $70.3 million for the third quarter of 2019. Operating adjusted EBITDA (3) increased to $67.2 million from $35.2 million for the prior year period.
For the first nine months of 2020, B. Riley’s total revenues were $492.5 million, operating revenues (2) totaled $528.7 million and net income totaled $30.3 million. During that same period, total adjusted EBITDA was $146.3 million and operating adjusted EBITDA was $184.9 million.
Investment gains (4) of $31.8 million in the third quarter reflected a continued recovery from the significant mark-to-market losses experienced in the first quarter of 2020 due to the impact of COVID-19 on equity markets. B. Riley’s proprietary investments are comprised of certain private and public securities and loans which also create revenue opportunities for the Company’s operating business while driving long-term value for its clients, partners, and shareholders.
Supplemental Financial Data
B. Riley has presented information related to its operating results and investments to provide investors with additional metrics regarding its performance and overall results of operations. Further details related to these metrics can be found in a Financial Supplement on the Company’s investor relations website at ir.brileyfin.com.
2
Third Quarter 2020 Segment Financial Summary
| Three Months Ended | ||||||||||||||||||||
| September 30, 2020 | ||||||||||||||||||||
| (Dollars in thousands) | Capital Markets | Auction and Liquidation | Valuation and Appraisal | Principal Investments | Brands | |||||||||||||||
| Operating Revenues (2) | $ | 115,058 | $ | 44,185 | $ | 9,655 | $ | 21,602 | $ | 4,000 | ||||||||||
| Investment Gains (4) | 31,753 | - | - | - | - | |||||||||||||||
| Segment Revenue | $ | 146,811 | $ | 44,185 | $ | 9,655 | $ | 21,602 | $ | 4,000 | ||||||||||
| Segment Operating Income (6) | 37,900 | $ | 12,000 | $ | 2,972 | $ | 8,368 | $ | 2,292 | |||||||||||
| Investment Gains Income (5) | 26,911 | - | - | - | - | |||||||||||||||
| Segment Income (Loss) | $ | 64,811 | $ | 12,000 | $ | 2,972 | $ | 8,368 | $ | 2,292 | ||||||||||
| · | Capital Markets segment revenues increased to $146.8 million compared to $134.1 million for the prior year period. The increase was primarily driven by increased fees from advisory services, the addition of our real estate consulting business and an increase in income related to minority investments. |
| · | Auction and Liquidation performance was driven by a number of retail liquidations in the US and in Europe as our group further capitalized on the current challenging retail market conditions created by COVID-19. |
| · | Valuation and Appraisal results continue to be negatively impacted by COVID-19 but overall business conditions and activity continue to show signs of recovery. |
| · | Principal Investments companies, United Online and magicJack, continued to deliver solid operating performance and cash flow generation despite the impact of COVID-19. |
As of September 30, 2020, cash and investments totaled $991.7 million, including cash and cash equivalents of $169.7 million. The Company’s investment balance included approximately $58.4 million of other equity investments reported in prepaid and other assets. Total cash and investments net of debt, including investments reported in prepaid and other assets, was $83.6 million.
Share Repurchases
The Board of Directors has approved an additional share repurchase program for up to $50 million. In July, B. Riley announced an agreement to repurchase 900,000 shares of its common stock as part of a privately negotiated transaction. During the third quarter, the Company repurchased 450,000 shares of these 900,000 shares and expects to purchase the remaining shares by year-end, subject to various factors including price, trading volume, corporate requirements, and market conditions. Year-to-date through September 30th, B. Riley has repurchased approximately 1.7 million of its common shares.
Dividend
B. Riley’s Board of Directors approved an increase in the Company’s regular quarterly dividend to $0.375 per common share, from the previous regular quarterly dividend of $0.30 per common share. The quarterly dividend of $0.375 per common share will be paid on or about November 24, 2020 to stockholders of record as of November 10, 2020.
Conference Call
Management will host a conference call today, Thursday, October 29, 2020 at 4:30 p.m. Eastern time (1:30 p.m. Pacific time), to discuss the Company’s quarterly results. The live broadcast and archived recording will be available on the Company’s investor relations website at https://ir.brileyfin.com/events-and-presentations.
| Date: | Thursday October 29, 2020 |
| Time: | 4:30 p.m. Eastern time (1:30 p.m. Pacific time) |
| Toll-Free: | 1-877-451-6152 |
| International: | 1-201-389-0879 |
Replay Dial-In (expires on Thursday, November 5, 2020)
| Toll-Free: | 1-844-512-2921 |
| International: | 1-412-317-6671 |
| Replay Pin: | 13711619 |
3
About B. Riley Financial, Inc. (NASDAQ:RILY)
B. Riley Financial, Inc. provides collaborative financial services solutions tailored to fit the capital raising, business, operational, and financial advisory needs of its clients and partners. B. Riley operates through several subsidiaries which offer a diverse range of complementary end-to-end capabilities spanning investment banking and institutional brokerage, private wealth and investment management, corporate advisory, restructuring, due diligence, forensic accounting, litigation support, appraisal and valuation, and auction and liquidation services. Certain registered affiliates of B. Riley originate and underwrite senior secured loans for asset-rich companies. B. Riley also makes proprietary investments in companies and assets with attractive return profiles. For more information about B. Riley and its affiliated companies, visit www.brileyfin.com.
Footnotes (See “Note Regarding Use of Non-GAAP Financial Measures” for further discussion of these non-GAAP terms.)
| (1) | Adjusted EBITDA includes earnings before interest, taxes, depreciation, amortization, restructuring costs, share-based payments, impairment of tradenames, and transaction related and other costs. For a definition of adjusted EBITDA and a reconciliation to GAAP financial measures, please see the Appendix. |
| (2) | Operating revenue is defined as the sum of revenues from service and fees, interest income - loans and securities lending, and sales of goods. |
| (3) | Operating adjusted EBITDA is defined as adjusted EBITDA excluding trading income (losses) and fair value adjustments on loans and other investment related expenses. |
| (4) | Investment gains (loss) is defined as trading income (losses) and fair value adjustments on loans. |
| (5) | Investment adjusted EBITDA and investment gains income are defined as trading income (losses) and fair value adjustments on loans, less other investment related expenses. |
| (6) | Segment operating income is defined as segment income excluding trading income (losses) and fair value adjustments on loans and other investment related expenses |
Forward-Looking Statements
Statements in this press release that are not descriptions of historical facts are forward-looking statements that are based on management’s current expectations and assumptions and are subject to risks and uncertainties. If such risks or uncertainties materialize or such assumptions prove incorrect, our business, operating results, financial condition and stock price could be materially negatively affected. You should not place undue reliance on such forward-looking statements, which are based on the information currently available to us and speak only as of the date of this press release. Such forward looking statements include, but are not limited to, statements regarding the Company’s anticipated results of operations for 2020, as well as statements regarding our excitement and the expected growth of our business segments. Factors that could cause such actual results to differ materially from those contemplated or implied by such forward-looking statements include, without limitation, the risks associated with the unpredictable and ongoing impact of the COVID-19 pandemic and other risks described from time to time in B. Riley Financial, Inc.’s periodic filings with the SEC, including, without limitation, the risks described in B. Riley Financial, Inc.’s Annual Report on Form 10-K for the year ended December 31, 2019 and Quarterly Reports on Form 10-Q for the quarters ended March 31, 2020 and June 30, 2020 under the captions “Risk Factors” and “Management’s Discussion and Analysis of Financial Condition and Results of Operations” (as applicable)and any additional information included in our Quarterly Report on Form 10-Q for the quarter ended September 30, 2020. These factors should be considered carefully, and readers are cautioned not to place undue reliance on such forward-looking statements. All information is current as of the date this press release is issued, and B. Riley Financial, Inc. undertakes no duty to update this information.
Note Regarding Use of Non-GAAP Financial Measures
Certain of the information set forth herein, including operating revenue, adjusted EBITDA, operating adjusted EBITDA, and investment adjusted EBITDA may be considered non-GAAP financial measures. B. Riley Financial believes this information is useful to investors because it provides a basis for measuring the Company’s available capital resources, the operating performance of its business and its revenues and cash flow, (i) excluding in the case of operating revenues, trading income (losses) and fair value adjustments on loans, (ii) excluding in the case of adjusted EBITDA , net interest expense, provisions for or benefit from income taxes, depreciation, amortization, fair value adjustment, restructuring costs, impairment of trade names, stock-based compensation and transaction and other expenses, (iii) excluding in the case of operating adjusted EBITDA, aforementioned adjustments for adjusted EBITDA, trading income (losses) and fair value adjustments on loans, and other investment related expenses, and (iv) in the case of investment adjusted EBITDA this includes trading income (losses) and fair value adjustments on loans, net of other investment related expenses, that would normally be included in the most directly comparable measures calculated and presented in accordance with Generally Accepted Accounting Principles (“GAAP”). In addition, the Company’s management uses these non-GAAP financial measures along with the most directly comparable GAAP financial measures in evaluating the Company’s operating performance, capital resources and cash flow. Non-GAAP financial measures should not be considered in isolation from, or as a substitute for, financial information presented in compliance with GAAP, and non-financial measures as reported by the Company may not be comparable to similarly titled amounts reported by other companies.
Contacts Investors Brad Edwards ir@brileyfin.com | Media Scott Cianciulli press@brileyfin.com |
4
B. RILEY FINANCIAL, INC.
Condensed Consolidated Balance Sheets
(Dollars in thousands, except par value)
| September 30, | December 31, | |||||||
| 2020 | 2019 | |||||||
| (Unaudited) | ||||||||
| Assets | ||||||||
| Assets: | ||||||||
| Cash and cash equivalents | $ | 169,676 | $ | 104,268 | ||||
| Restricted cash | 1,410 | 471 | ||||||
| Due from clearing brokers | 19,589 | 23,818 | ||||||
| Securities and other investments owned, at fair value | 459,480 | 408,213 | ||||||
| Securities borrowed | 676,423 | 814,331 | ||||||
| Accounts receivable, net | 45,654 | 46,624 | ||||||
| Due from related parties | 3,766 | 5,832 | ||||||
| Advances against customer contracts | 900 | 27,347 | ||||||
| Loans receivable, at fair value (includes $236,018 from related parties at September 30, 2020) | 344,339 | 43,338 | ||||||
| Loans receivable, at cost (includes $157,080 from related parties at December 31, 2019) | — | 225,848 | ||||||
| Prepaid expenses and other assets | 87,560 | 81,808 | ||||||
| Operating lease right-of-use assets | 43,514 | 47,809 | ||||||
| Property and equipment, net | 11,986 | 12,727 | ||||||
| Goodwill | 227,046 | 223,697 | ||||||
| Other intangible assets, net | 194,516 | 220,525 | ||||||
| Deferred income taxes | 14,223 | 31,522 | ||||||
| Total assets | $ | 2,300,082 | $ | 2,318,178 | ||||
| Liabilities and Equity | ||||||||
| Liabilities: | ||||||||
| Accounts payable | $ | 4,226 | $ | 4,477 | ||||
| Accrued expenses and other liabilities | 127,036 | 130,714 | ||||||
| Deferred revenue | 70,565 | 67,121 | ||||||
| Due to related parties and partners | 777 | 1,750 | ||||||
| Securities sold not yet purchased | 48,125 | 41,820 | ||||||
| Securities loaned | 667,109 | 810,495 | ||||||
| Mandatorily redeemable noncontrolling interests | 4,462 | 4,616 | ||||||
| Operating lease liabilities | 55,790 | 61,511 | ||||||
| Notes payable | 714 | 38,167 | ||||||
| Loan participations sold | 13,919 | 12,478 | ||||||
| Term loan | 52,452 | 66,666 | ||||||
| Senior notes payable | 854,926 | 688,112 | ||||||
| Total liabilities | 1,900,101 | 1,927,927 | ||||||
| Commitments and contingencies | ||||||||
| B. Riley Financial, Inc. stockholders’ equity: | ||||||||
| Preferred stock, $0.0001 par value; 1,000,000 shares authorized; 3,831 and 2,349 issued and outstanding as of September 30, 2020 and December 31, 2019, respectively; liquidation preference of $95,773 and $58,723 as of September 30, 2020 and December 31, 2019, respectively. | — | — | ||||||
| Common stock, $0.0001 par value; 100,000,000 shares authorized; 25,431,575 and 26,972,332 issued and outstanding as of September 30, 2020 and December 31, 2019, respectively. | 3 | 3 | ||||||
| Additional paid-in capital | 332,085 | 323,109 | ||||||
| Retained earnings | 43,938 | 39,536 | ||||||
| Accumulated other comprehensive loss | (2,167 | ) | (1,988 | ) | ||||
| Total B. Riley Financial, Inc. stockholders’ equity | 373,859 | 360,660 | ||||||
| Noncontrolling interests | 26,122 | 29,591 | ||||||
| Total equity | 399,981 | 390,251 | ||||||
| Total liabilities and equity | $ | 2,300,082 | $ | 2,318,178 | ||||
5
B. RILEY FINANCIAL, INC.
Condensed Consolidated Statements of Operations
(Unaudited)
(Dollars in thousands, except share data)
| Three Months Ended | Nine Months Ended | |||||||||||||||
| September 30, | September 30, | |||||||||||||||
| 2020 | 2019 | 2020 | 2019 | |||||||||||||
| Revenues: | ||||||||||||||||
| Services and fees | $ | 144,823 | $ | 113,111 | $ | 429,799 | $ | 356,975 | ||||||||
| Trading income (loss) and fair value adjustments on loans | 31,753 | 40,268 | (36,142 | ) | 71,730 | |||||||||||
| Interest income - Loans and securities lending | 26,026 | 25,766 | 72,383 | 54,147 | ||||||||||||
| Sale of goods | 23,651 | 918 | 26,475 | 4,023 | ||||||||||||
| Total revenues | 226,253 | 180,063 | 492,515 | 486,875 | ||||||||||||
| Operating expenses: | ||||||||||||||||
| Direct cost of services | 23,264 | 7,936 | 51,201 | 41,715 | ||||||||||||
| Cost of goods sold | 9,813 | 911 | 11,442 | 3,835 | ||||||||||||
| Selling, general and administrative expenses | 97,143 | 101,092 | 291,449 | 287,963 | ||||||||||||
| Restructuring charge | 1,557 | — | 1,557 | 1,699 | ||||||||||||
| Impairment of tradenames | — | — | 12,500 | — | ||||||||||||
| Interest expense - Securities lending and loan participations sold | 10,975 | 10,273 | 30,669 | 22,579 | ||||||||||||
| Total operating expenses | 142,752 | 120,212 | 398,818 | 357,791 | ||||||||||||
| Operating income | 83,501 | 59,851 | 93,697 | 129,084 | ||||||||||||
| Other income (expense): | ||||||||||||||||
| Interest income | 67 | 361 | 537 | 1,329 | ||||||||||||
| Income (loss) from equity investments | 409 | 1,113 | (145 | ) | (4,049 | ) | ||||||||||
| Interest expense | (16,374 | ) | (12,772 | ) | (48,537 | ) | (35,130 | ) | ||||||||
| Income before income taxes | 67,603 | 48,553 | 45,552 | 91,234 | ||||||||||||
| Provision for income taxes | (18,711 | ) | (14,409 | ) | (13,380 | ) | (26,802 | ) | ||||||||
| Net income | 48,892 | 34,144 | 32,172 | 64,432 | ||||||||||||
| Net income (loss) attributable to noncontrolling interests | 513 | (158 | ) | (1,382 | ) | (50 | ) | |||||||||
| Net income attributable to B. Riley Financial, Inc. | 48,379 | 34,302 | 33,554 | 64,482 | ||||||||||||
| Preferred stock dividends | 1,088 | — | 3,230 | — | ||||||||||||
| Net income available to common shareholders | $ | 47,291 | $ | 34,302 | $ | 30,324 | $ | 64,482 | ||||||||
| Basic income per common share | $ | 1.86 | $ | 1.29 | $ | 1.18 | $ | 2.45 | ||||||||
| Diluted income per common share | $ | 1.75 | $ | 1.21 | $ | 1.14 | $ | 2.37 | ||||||||
| Weighted average basic common shares outstanding | 25,446,292 | 26,556,223 | 25,699,735 | 26,351,839 | ||||||||||||
| Weighted average diluted common shares outstanding | 27,050,448 | 28,233,423 | 26,689,700 | 27,251,837 | ||||||||||||
6
B. RILEY FINANCIAL, INC.
Condensed Consolidated Statements of Cash Flows
(Unaudited)
(Dollars in thousands)
| Nine Months Ended September 30, | ||||||||
| 2020 | 2019 | |||||||
| Cash flows from operating activities: | ||||||||
| Net income | $ | 32,172 | $ | 64,432 | ||||
| Adjustments to reconcile net income to net cash provided by operating activities: | ||||||||
| Depreciation and amortization | 14,765 | 14,217 | ||||||
| Provision for doubtful accounts | 2,438 | 1,646 | ||||||
| Share-based compensation | 14,267 | 10,276 | ||||||
| Fair value adjustments, non-cash | 21,755 | (13,343 | ) | |||||
| Non-cash interest and other | (12,901 | ) | (14,941 | ) | ||||
| Effect of foreign currency on operations | (602 | ) | 8 | |||||
| Loss from equity investments | 145 | 4,049 | ||||||
| Deferred income taxes | 17,312 | 6,358 | ||||||
| Impairment of intangibles and loss on disposal of fixed assets | 14,057 | (327 | ) | |||||
| Gain on extinguishment of debt | (1,556 | ) | — | |||||
| Income allocated for mandatorily redeemable noncontrolling interests | 779 | 857 | ||||||
| Change in operating assets and liabilities: | ||||||||
| Due from clearing brokers | 4,230 | 9,947 | ||||||
| Securities and other investments owned | (36,859 | ) | (32,122 | ) | ||||
| Securities borrowed | 137,908 | 211,139 | ||||||
| Accounts receivable and advances against customer contracts | 25,336 | (8,645 | ) | |||||
| Prepaid expenses and other assets | (3,507 | ) | (9,619 | ) | ||||
| Accounts payable, accrued expenses and other liabilities | (10,297 | ) | 31,473 | |||||
| Amounts due to/from related parties and partners | 1,093 | (4,574 | ) | |||||
| Securities sold, not yet purchased | 6,304 | (8,531 | ) | |||||
| Deferred revenue | 3,444 | (502 | ) | |||||
| Securities loaned | (143,386 | ) | (215,575 | ) | ||||
| Net cash provided by operating activities | 86,897 | 46,223 | ||||||
| Cash flows from investing activities: | ||||||||
| Purchases of loans receivable | (169,100 | ) | (350,695 | ) | ||||
| Repayments of loans receivable | 75,982 | 98,742 | ||||||
| Sale of loan receivable to related party | 1,800 | — | ||||||
| Proceeds from loan participations sold | 2,400 | 31,806 | ||||||
| Repayment of loan participations sold | (1,131 | ) | (3,175 | ) | ||||
| Purchases of property, equipment and other | (1,517 | ) | (2,885 | ) | ||||
| Proceeds from sale of property, equipment and intangible assets | 1 | 504 | ||||||
| Purchase of equity investments | (6,486 | ) | (33,391 | ) | ||||
| Proceeds from sale of division of magicJack | — | 6,196 | ||||||
| Dividends and distributions from equity investments | 1,005 | 1,454 | ||||||
| Acquisition of other businesses | (1,500 | ) | – | |||||
| Net cash used in investing activities | (98,546 | ) | (251,444 | ) | ||||
| Cash flows from financing activities: | ||||||||
| Repayment of asset based credit facility | (37,096 | ) | — | |||||
| Repayment of notes payable | (357 | ) | (357 | ) | ||||
| Proceeds from term loan | — | 10,000 | ||||||
| Repayment of term loan | (14,429 | ) | (17,924 | ) | ||||
| Proceeds from issuance of senior notes | 171,417 | 244,497 | ||||||
| Redemption of senior notes | (1,829 | ) | — | |||||
| Payment of debt issuance costs | (2,761 | ) | (4,212 | ) | ||||
| Payment of employment taxes on vesting of restricted stock | (2,950 | ) | (2,626 | ) | ||||
| Common dividends paid | (25,822 | ) | (25,049 | ) | ||||
| Preferred dividends paid | (3,230 | ) | — | |||||
| Repurchase of common stock | (38,348 | ) | (4,273 | ) | ||||
| Repurchase of warrants | — | (2,777 | ) | |||||
| Distribution to noncontrolling interests | (3,013 | ) | (1,095 | ) | ||||
| Proceeds from issuance of preferred stock | 36,007 | — | ||||||
| Net cash provided by financing activities | 77,589 | 196,184 | ||||||
| Increase (decrease) in cash, cash equivalents and restricted cash | 65,940 | (9,037 | ) | |||||
| Effect of foreign currency on cash, cash equivalents and restricted cash | 407 | (183 | ) | |||||
| Net increase (decrease) in cash, cash equivalents and restricted cash | 66,347 | (9,220 | ) | |||||
| Cash, cash equivalents and restricted cash, beginning of period | 104,739 | 180,278 | ||||||
| Cash, cash equivalents and restricted cash, end of period | $ | 171,086 | $ | 171,058 | ||||
| Supplemental disclosures: | ||||||||
| Interest paid | $ | 75,231 | $ | 52,931 | ||||
| Taxes paid | $ | 1,460 | $ | 5,029 | ||||
7
B. RILEY FINANCIAL, INC.
Segment Financial Information
(Unaudited)
(Dollars in thousands)
| Three Months Ended | Nine Months Ended | |||||||||||||||
| September 30, | September 30, | |||||||||||||||
| 2020 | 2019 | 2020 | 2019 | |||||||||||||
| Capital Markets segment: | ||||||||||||||||
| Revenues - Services and fees | $ | 89,032 | $ | 68,062 | $ | 280,303 | $ | 187,768 | ||||||||
| Trading income (losses) and fair value adjustments on loans | 31,753 | 40,268 | (36,142 | ) | 71,730 | |||||||||||
| Interest income - Loans and securities lending | 26,026 | 25,766 | 72,383 | 54,147 | ||||||||||||
| Total revenues | 146,811 | 134,096 | 316,544 | 313,645 | ||||||||||||
| Selling, general and administrative expenses | (68,442 | ) | (70,140 | ) | (204,183 | ) | (196,570 | ) | ||||||||
| Restructuring (charge) recovery | (1,417 | ) | — | (1,417 | ) | 4 | ||||||||||
| Interest expense - Securities lending and loan participations sold | (10,975 | ) | (10,273 | ) | (30,669 | ) | (22,579 | ) | ||||||||
| Depreciation and amortization | (1,166 | ) | (1,281 | ) | (3,362 | ) | (3,844 | ) | ||||||||
| Segment income | 64,811 | 52,402 | 76,913 | 90,656 | ||||||||||||
| Auction and Liquidation segment: | ||||||||||||||||
| Revenues - Services and fees | 21,473 | 11,232 | 49,340 | 65,681 | ||||||||||||
| Revenues - Sale of goods | 22,712 | 54 | 23,757 | 1,230 | ||||||||||||
| Total revenues | 44,185 | 11,286 | 73,097 | 66,911 | ||||||||||||
| Direct cost of services | (18,373 | ) | (2,371 | ) | (36,406 | ) | (21,584 | ) | ||||||||
| Cost of goods sold | (9,046 | ) | (126 | ) | (9,360 | ) | (992 | ) | ||||||||
| Selling, general and administrative expenses | (4,625 | ) | (2,835 | ) | (8,880 | ) | (9,045 | ) | ||||||||
| Restructuring (charge) recovery | (140 | ) | — | (140 | ) | — | ||||||||||
| Depreciation and amortization | (1 | ) | (1 | ) | (2 | ) | (5 | ) | ||||||||
| Segment income | 12,000 | 5,953 | 18,309 | 35,285 | ||||||||||||
| Valuation and Appraisal segment: | ||||||||||||||||
| Revenues - Services and fees | 9,655 | 10,818 | 26,112 | 29,143 | ||||||||||||
| Selling, general and administrative expenses | (6,632 | ) | (7,331 | ) | (19,643 | ) | (21,492 | ) | ||||||||
| Depreciation and amortization | (51 | ) | (36 | ) | (139 | ) | (100 | ) | ||||||||
| Segment income | 2,972 | 3,451 | 6,330 | 7,551 | ||||||||||||
| Principal Investments - United Online and magicJack segment: | ||||||||||||||||
| Revenues - Services and fees | 20,663 | 22,999 | 63,037 | 74,383 | ||||||||||||
| Revenues - Sale of goods | 939 | 864 | 2,718 | 2,793 | ||||||||||||
| Total revenues | 21,602 | 23,863 | 65,755 | 77,176 | ||||||||||||
| Direct cost of services | (4,891 | ) | (5,565 | ) | (14,795 | ) | (20,131 | ) | ||||||||
| Cost of goods sold | (767 | ) | (785 | ) | (2,082 | ) | (2,843 | ) | ||||||||
| Selling, general and administrative expenses | (4,840 | ) | (5,895 | ) | (14,352 | ) | (18,410 | ) | ||||||||
| Depreciation and amortization | (2,736 | ) | (2,956 | ) | (8,466 | ) | (9,719 | ) | ||||||||
| Restructuring charge | — | — | — | (1,703 | ) | |||||||||||
| Segment income | 8,368 | 8,662 | 26,060 | 24,370 | ||||||||||||
| Brands segment: | ||||||||||||||||
| Revenues - Services and fees | 4,000 | — | 11,007 | — | ||||||||||||
| Selling, general and administrative expenses | (994 | ) | — | (2,207 | ) | — | ||||||||||
| Depreciation and amortization | (714 | ) | — | (2,143 | ) | — | ||||||||||
| Impairment of tradenames | — | — | (12,500 | ) | — | |||||||||||
| Segment income (loss) | 2,292 | — | (5,843 | ) | — | |||||||||||
| Consolidated operating income from reportable segments | 90,443 | 70,468 | 121,769 | 157,862 | ||||||||||||
| Corporate and other expenses | (6,942 | ) | (10,617 | ) | (28,072 | ) | (28,778 | ) | ||||||||
| Interest income | 67 | 361 | 537 | 1,329 | ||||||||||||
| Income (loss) on equity investments | 409 | 1,113 | (145 | ) | (4,049 | ) | ||||||||||
| Interest expense | (16,374 | ) | (12,772 | ) | (48,537 | ) | (35,130 | ) | ||||||||
| Income before income taxes | 67,603 | 48,553 | 45,552 | 91,234 | ||||||||||||
| Provision for income taxes | (18,711 | ) | (14,409 | ) | (13,380 | ) | (26,802 | ) | ||||||||
| Net income | 48,892 | 34,144 | 32,172 | 64,432 | ||||||||||||
| Net income (loss) attributable to noncontrolling interests | 513 | (158 | ) | (1,382 | ) | (50 | ) | |||||||||
| Net income attributable to B. Riley Financial, Inc. | 48,379 | 34,302 | 33,554 | 64,482 | ||||||||||||
| Preferred stock dividends | 1,088 | — | 3,230 | — | ||||||||||||
| Net income available to common shareholders | $ | 47,291 | $ | 34,302 | $ | 30,324 | $ | 64,482 | ||||||||
8
B. RILEY FINANCIAL, INC.
Adjusted EBITDA Reconciliation and Operating Adjusted EBITDA Reconciliation
(Unaudited)
(Dollars in thousands)
| Three Months Ended September 30, | Nine Months Ended September 30, | |||||||||||||||
| 2020 | 2019 | 2020 | 2019 | |||||||||||||
| Net income attributable to B. Riley Financial, Inc. | $ | 48,379 | $ | 34,302 | $ | 33,554 | $ | 64,482 | ||||||||
| Adjustments: | ||||||||||||||||
| Provision for income taxes | 18,711 | 14,409 | 13,380 | 26,802 | ||||||||||||
| Interest expense | 16,374 | 12,772 | 48,537 | 35,130 | ||||||||||||
| Interest income | (67 | ) | (361 | ) | (537 | ) | (1,329 | ) | ||||||||
| Share based payments | 4,778 | 4,728 | 14,267 | 10,276 | ||||||||||||
| Depreciation and amortization | 4,886 | 4,473 | 14,765 | 14,217 | ||||||||||||
| Restructuring costs | 1,557 | — | 1,557 | 1,699 | ||||||||||||
| Impairment of tradenames | — | — | 12,500 | — | ||||||||||||
| Transactions related costs and other | (485 | ) | 7 | 8,309 | 6,339 | |||||||||||
| Total EBITDA adjustments | 45,754 | 36,028 | 112,778 | 93,134 | ||||||||||||
| Adjusted EBITDA | $ | 94,133 | $ | 70,330 | $ | 146,332 | $ | 157,616 | ||||||||
| Operating EBITDA Adjustments: | ||||||||||||||||
| Trading (income) losses and fair value adjustments on loans | (31,753 | ) | (40,268 | ) | 36,142 | (71,730 | ) | |||||||||
| Other investment related expenses | 4,842 | 5,138 | 2,412 | 11,323 | ||||||||||||
| Total Operating EBITDA Adjustments | (26,911 | ) | (35,130 | ) | 38,554 | (60,407 | ) | |||||||||
| Operating Adjusted EBITDA | $ | 67,222 | $ | 35,200 | $ | 184,886 | $ | 97,209 | ||||||||
9
B. RILEY FINANCIAL, INC.
Adjusted Net Income Reconciliation
(Unaudited)
(Dollars in thousands, except share data)
| Three Months Ended September 30, | Nine Months Ended September 30, | |||||||||||||||
| 2020 | 2019 | 2020 | 2019 | |||||||||||||
| Net income attributable to B. Riley Financial, Inc. | $ | 48,379 | $ | 34,302 | $ | 33,554 | $ | 64,482 | ||||||||
| Adjustments: | ||||||||||||||||
| Share based payments | 4,778 | 4,728 | 14,267 | 10,276 | ||||||||||||
| Amortization of intangible assets | 3,919 | 3,310 | 11,967 | 10,031 | ||||||||||||
| Restructuring costs | 1,557 | — | 1,557 | 1,699 | ||||||||||||
| Impairment of tradenames | — | — | 12,500 | — | ||||||||||||
| Transactions related costs and other | (485 | ) | 7 | 8,309 | 6,339 | |||||||||||
| Income tax effect of adjusting entries | (2,725 | ) | (2,380 | ) | (13,456 | ) | (8,185 | ) | ||||||||
| Adjusted net income attributable to B. Riley Financial, Inc. | $ | 55,423 | $ | 39,967 | $ | 68,698 | $ | 84,642 | ||||||||
| Adjusted income per common share: | ||||||||||||||||
| Adjusted basic income per share | $ | 2.18 | $ | 1.51 | $ | 2.67 | $ | 3.21 | ||||||||
| Adjusted diluted income per share | $ | 2.05 | $ | 1.42 | $ | 2.57 | $ | 3.11 | ||||||||
| Shares used to calculate adjusted basic net income per share | 25,446,292 | 26,556,223 | 25,699,735 | 26,351,839 | ||||||||||||
| Shares used to calculate adjusted diluted net income per share | 27,050,448 | 28,233,423 | 26,689,700 | 27,251,837 | ||||||||||||
Source: B. Riley Financial, Inc.
# # #
10
Exhibit 99.2

1 NASDAQ: RILY Third Quarter 2020 Supplemental Financial Data October 29, 2020

2 2 Reconciliation of U.S. GAAP to Non - GAAP Measures (Unaudited, dollars in thousands) Q3 2019 Q4 2019 Q1 2020 Q2 2020 Q3 2020 Adj. EBITDA and Operating Adj. EBITDA Reconciliation Net income (loss) attributable to B. Riley Financial, Inc. $34,302 $17,129 $(98,665) $83,840 $48,379 EBITDA Adjustments: Provision (benefit) for income taxes 14,409 7,842 (37,539) 32,208 18,711 Interest expense 12,772 15,075 15,654 16,509 16,374 Interest income (361) (248) (246) (224) (67) Share based payments 4,728 5,640 5,322 4,167 4,778 Depreciation and amortization 4,473 4,831 4,956 4,923 4,886 Restructuring costs — — — — 1,557 Impairment of tradenames — — 4,000 8,500 — Transactions related costs and other 7 — 10,454 (1,660) (485) Total EBITDA Adjustments 36,028 33,140 2,601 64,423 45,754 Adjusted EBITDA $70,330 $50,269 $(96,064) $148,263 $94,133 Operating EBITDA Adjustments: Trading (income) losses and fair value adjustments on loans (40,268) (34,733) 182,442 (114,547) (31,753) Other investment related expenses 5,138 858 (15,470) 13,040 4,842 Total Operating EBITDA Adjustments (35,130) (33,875) 166,972 (101,507) (26,911) Operating Adjusted EBITDA $35,200 $16,394 $70,908 $46,756 $67,222

3 3 Operating Income Summary – Q3 2020 and September 2020 YTD 1. Other investment related expenses. (Unaudited) (Dollars in thousands) Operating Investment Combined Operating Investment Combined Revenues: Services and fees $ 144,823 - $ 144,823 $ 429,799 - $ 429,799 Trading income (losses) and fair value adjustments on loans - 31,753 31,753 - (36,142) (36,142) Interest income – loans & securities lending 26,026 - 26,026 72,383 - 72,383 Sale of goods 23,651 - 23,651 26,475 - 26,475 Total revenues $ 194,500 $ 31,753 $ 226,253 $ 528,657 $ (36,142) $ 492,515 Operating expenses: Direct cost of services $ 23,264 - $ 23,264 $ 51,201 - $ 51,201 Cost of goods sold 9,813 - 9,813 11,442 - 11,442 Selling, general and administrative expenses 92,301 4,842 (1) 97,143 289,037 2,412 (1) 291,449 Restructuring charges 1,557 - 1,557 1,557 - 1,557 Impairment of tradenames - - - 12,500 - 12,500 Interest expense – securities lending & loan participation sold 10,975 - 10,975 30,669 - 30,669 Total operating expenses $ 137,910 $ 4,842 $ 142,752 $ 396,406 $ 2,412 $ 398,818 Operating income (loss) $ 56,590 $ 26,911 $ 83,501 $ 132,251 $ (38,554) $ 93,697 Q3 2020 September 2020 YTD

4 4 Quarterly Operating Revenue and Operating Adjusted EBITDA Operating Revenue and Operating Adjusted EBITDA (1)(3)(5)(6) $139.8M $130.5M $182.2M $151.9M $194.5M $35.2M $16.4M $70.9M $46.8M $67.2M Q3 2019 Q4 2019 Q1 2020 Q2 2020 Q3 2020 Operating Revenue Operating Adj. EBITDA (Dollars in thousands) Q3 2019 Q4 2019 Q1 2020 Q2 2020 Q3 2020 Operating Revenue (1) $139,795 $130,504 $182,236 $ 151,921 $ 194,500 Investment Gains (Loss) (2) 40,268 34,733 (182,442) 114,547 31,753 Total Revenue $180,063 $165,237 $(206) $ 266,468 $ 226,253 Q3 2019 Q4 2019 Q1 2020 Q2 2020 Q3 2020 Operating Adjusted EBITDA (3) $35,200 $16,394 $70,908 $46,756 $67,222 Investment Adjusted EBITDA (4) 35,130 33,875 (166,972) 101,507 26,911 Adjusted EBITDA (5)(6) $70,330 $50,269 $(96,064) $148,263 $94,133 Quarterly Revenue and Adjusted EBITDA 1. Operating Revenue is defined as the sum of revenues from ( i ) Service and Fees, (ii) Interest Income - Loans and Securities Lending and (iii) Sales of Goods. 2. Investment Gains (Loss) is defined as Trading Income (Losses) and Fair Value Adjustments on Loans. 3. Operating Adjusted EBITDA is defined as Adjusted EBITDA excluding ( i ) Trading Income (Losses) and Fair Value Adjustments on Loans and (ii) other investment related expenses. 4. Investment Adjusted EBITDA is defined as Trading Income (Losses) and Fair Value Adjustments on Loans, less other investment r ela ted expenses. 5. Adjusted EBITDA includes earnings before interest, taxes, depreciation, amortization, restructuring costs, share - based payments, impairment of tradenames, and transaction related and other costs. 6. For a reconciliation to GAAP financial measures, please see slide 2.
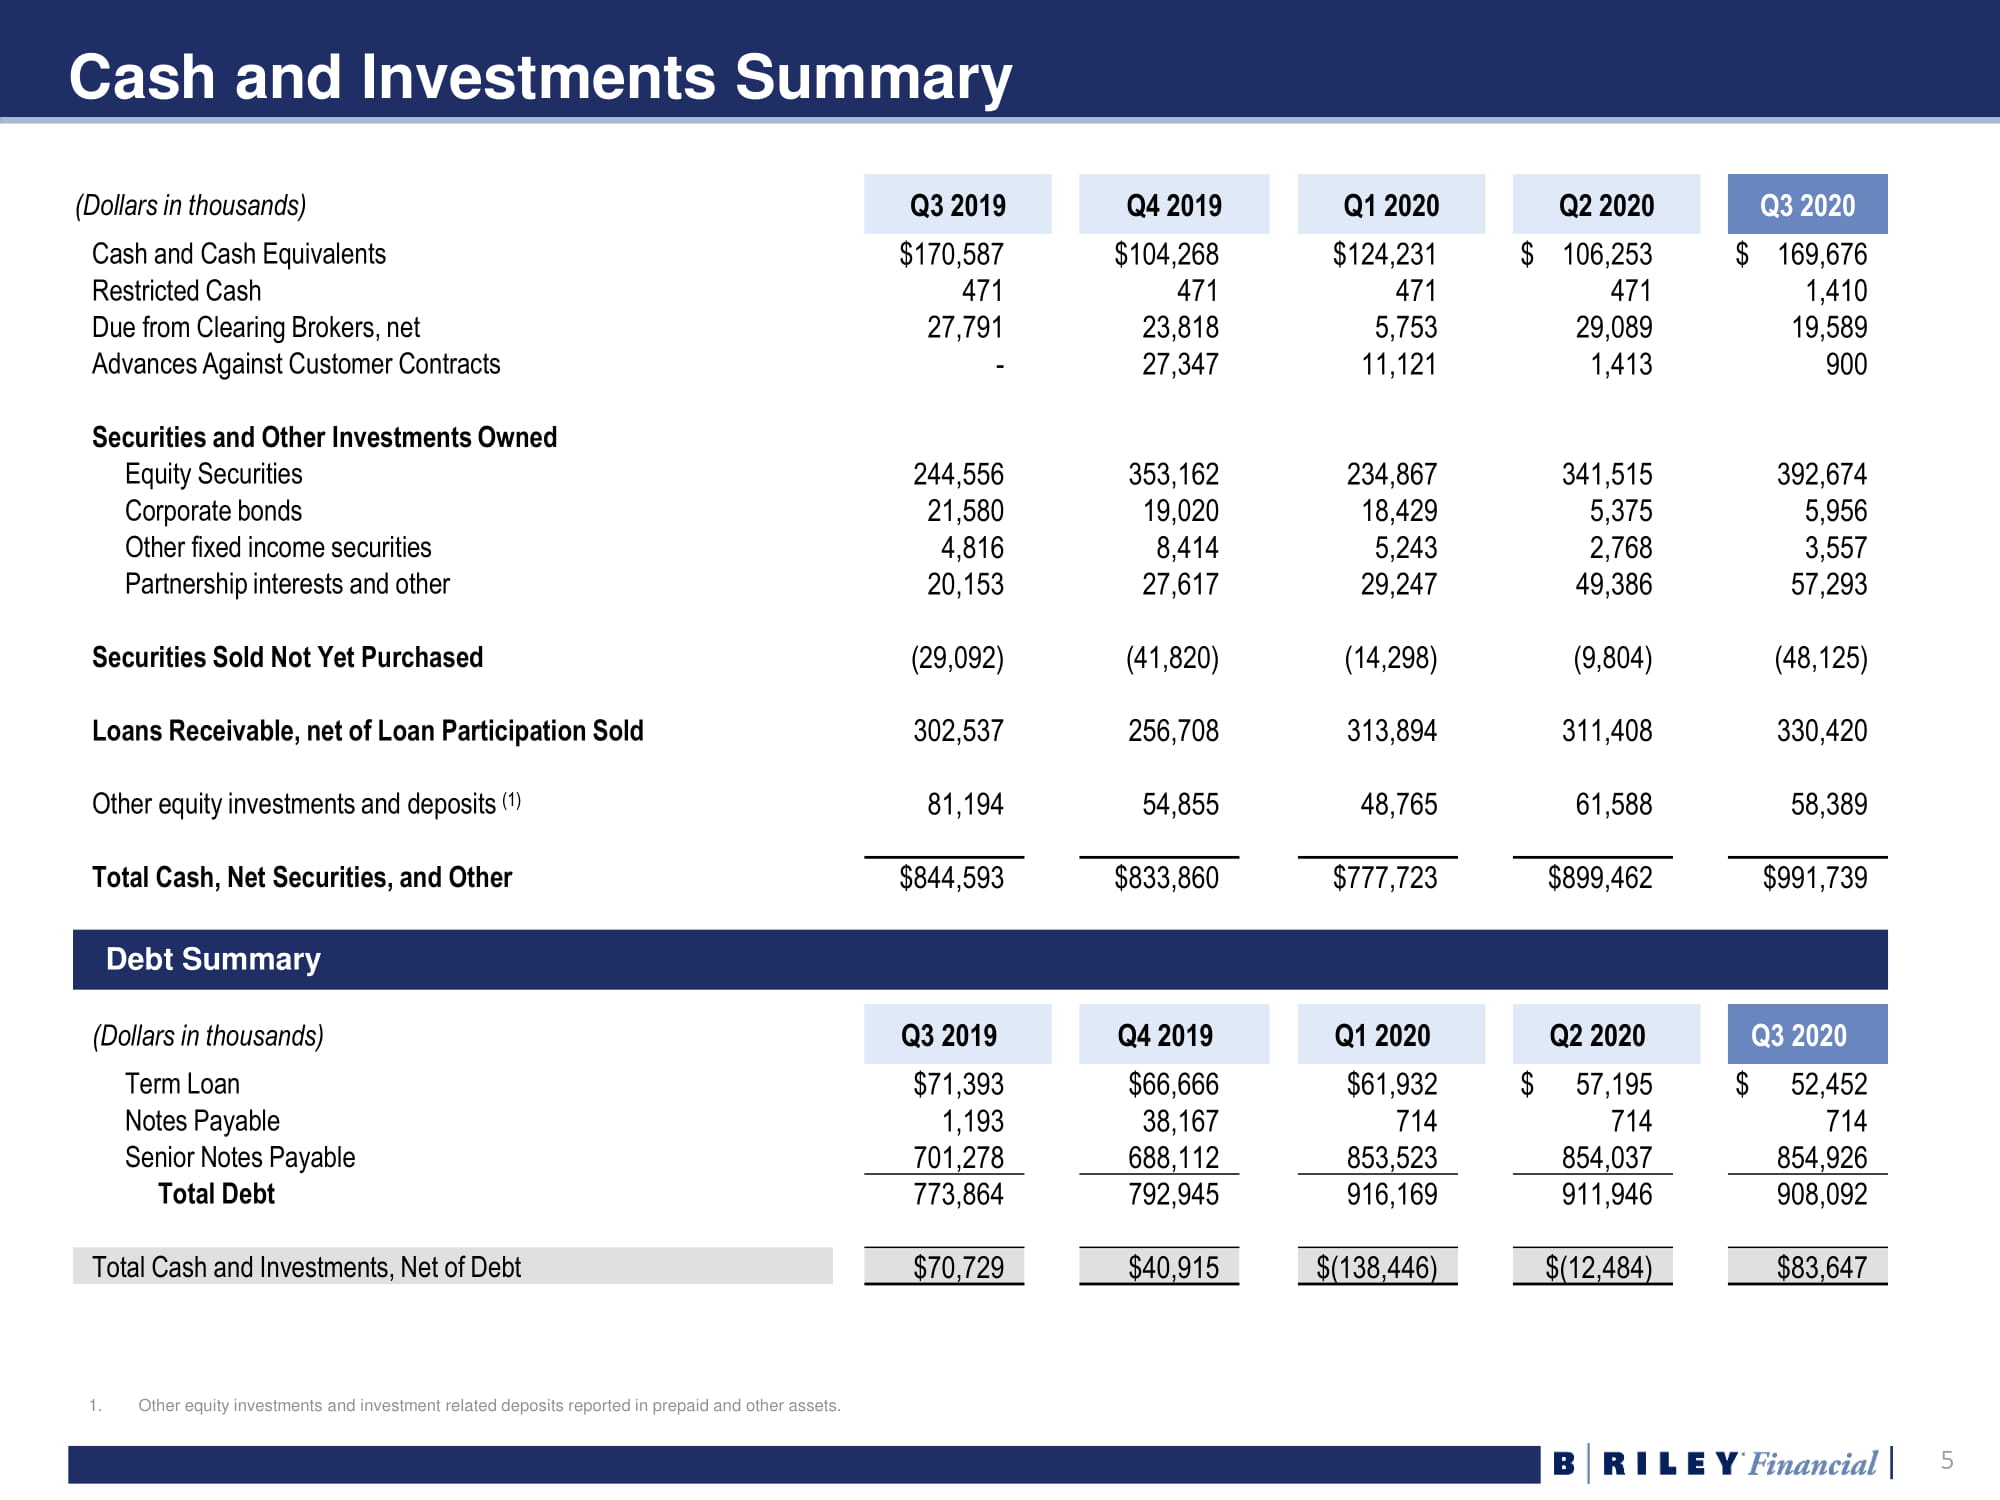
5 5 Cash and Investments Summary (Dollars in thousands) Q3 2019 Q4 2019 Q1 2020 Q2 2020 Q3 2020 Cash and Cash Equivalents $170,587 $104,268 $124,231 $ 106,253 $ 169,676 Restricted Cash 471 471 471 471 1,410 Due from Clearing Brokers, net 27,791 23,818 5,753 29,089 19,589 Advances Against Customer Contracts - 27,347 11,121 1,413 900 Securities and Other Investments Owned Equity Securities 244,556 353,162 234,867 341,515 392,674 Corporate bonds 21,580 19,020 18,429 5,375 5,956 Other fixed income securities 4,816 8,414 5,243 2,768 3,557 Partnership interests and other 20,153 27,617 29,247 49,386 57,293 Securities Sold Not Yet Purchased (29,092) (41,820) (14,298) (9,804) (48,125) Loans Receivable, net of Loan Participation Sold 302,537 256,708 313,894 311,408 330,420 Other equity investments and deposits (1) 81,194 54,855 48,765 61,588 58,389 Total Cash, Net Securities, and Other $844,593 $833,860 $777,723 $899,462 $991,739 (Dollars in thousands) Q3 2019 Q4 2019 Q1 2020 Q2 2020 Q3 2020 Term Loan $71,393 $66,666 $61,932 $ 57,195 $ 52,452 Notes Payable 1,193 38,167 714 714 714 Senior Notes Payable 701,278 688,112 853,523 854,037 854,926 Total Debt 773,864 792,945 916,169 911,946 908,092 Total Cash and Investments, Net of Debt $70,729 $40,915 $(138,446) $(12,484) $83,647 1. Other equity investments and investment related deposits reported in prepaid and other assets. Debt Summary

6 6 Condensed Consolidated Balance Sheets (Dollars in thousands) September 30, 2020 (Unaudited) December 31, 2019 Cash and cash equivalents $169,676 $104,268 Restricted cash 1,410 471 Due from clearing brokers 19,589 23,818 Securities and other investments owned, at fair value 459,480 408,213 Securities borrowed 676,423 814,331 Accounts receivable, net 45,654 46,624 Due from related parties 3,766 5,832 Advances against customer contracts 900 27,347 Loans receivable, at fair value 344,339 43,338 Loans receivable, at cost — 225,848 Prepaid expenses and other assets 87,560 81,808 Operating lease right - of - use assets 43,514 47,809 Property and equipment, net 11,986 12,727 Goodwill 227,046 223,697 Other intangible assets, net 194,516 220,525 Deferred income taxes 14,223 31,522 Total assets $2,300,082 $2,318,178 Accounts payable $4,226 $4,477 Accrued expenses and other liabilities 127,036 130,714 Deferred revenue 70,565 67,121 Due to related parties and partners 777 1,750 Securities sold not yet purchased 48,125 41,820 Securities loaned 667,109 810,495 Mandatorily redeemable noncontrolling interests 4,462 4,616 Operating lease liabilities 55,790 61,511 Notes payable 714 38,167 Loan participations sold 13,919 12,478 Term loan 52,452 66,666 Senior notes payable 854,926 688,112 Total liabilities $1,900,101 $1,927,927 Total B. Riley Financial, Inc. stockholders' equity 373,859 360,660 Noncontrolling interests 26,122 29,591 Total equity 399,981 390,251 Total liabilities and equity $2,300,082 $ 2,318,178

7 7 Condensed Consolidated Statements of Income (Unaudited) (Dollars in thousands) Three Months Ended September 30, 2020 2019 Revenues: Services and fees $144,823 $113,111 Trading income and fair value adjustments on loans 31,753 40,268 Interest income - Loans and securities lending 26,026 25,766 Sale of goods 23,651 918 Total revenues 226,253 180,063 Operating expenses: Direct cost of services 23,264 7,936 Cost of goods sold 9,813 911 Selling, general and administrative expenses 97,143 101,092 Restructuring charge 1,557 — Impairment of tradenames — — Interest expense - Securities lending and loan participations sold 10,975 10,273 Total operating expenses 142,752 120,212 Operating income 83,501 59,851 Other income (expense): Interest income 67 361 Income from equity investments 409 1,113 Interest expense (16,374) (12,722) Income before income taxes 67,603 48,553 Provision for income taxes (18,711) (14,409) Net income 48,892 34,144 Net income (loss) attributable to noncontrolling interests 513 (158) Net income attributable to B. Riley Financial, Inc. $48,379 $34,302 Preferred stock dividends 1,088 — Net income available to common shareholders $47,291 $34,302 Basic income per common share $1.86 $1.29 Diluted income per common share $1.75 $1.21 Weighted average basic common shares outstanding 25,446,292 26,556,223 Weighted average diluted common shares outstanding 27,050,448 28,233,423

8 8 Condensed Consolidated Statements of Cash Flows (Unaudited) (Dollars in thousands) Nine Months Ended September 30, 2020 2019 Cash flows from operating activities: Net income $32,172 $64,432 Adjustments to reconcile net income to net cash provided by operating activities: Depreciation and amortization 14,765 14,217 Provision for doubtful accounts 2,438 1,646 Share - based compensation 14,267 10,276 Fair value adjustments, non - cash 21,755 (13,343) Non - cash interest and other (12,901) (14,941) Effect of foreign currency on operations (602) 8 Loss from equity investments 145 4,049 Deferred income taxes 17,312 6,358 Impairment of intangibles and loss on disposal of fixed assets 14,057 (327) Gain on extinguishment of debt (1,556) — Income allocated for mandatorily redeemable noncontrolling interests 779 857 Change in operating assets and liabilities (15,734) (27,009) Net cash provided by operating activities 86,897 46,223 Cash flows from investing activities: Purchases of loans receivable (169,100) (350,695) Repayments of loans receivable 75,982 98,742 Sale of loan receivable to related party 1,800 — Proceeds from loan participations sold net of repayment of loan participations sold 1,269 28,631 Purchases of property, equipment and other (1,517) (2,885) Proceeds from sale of property, equipment and intangible assets 1 504 Purchase of equity investments (6,486) (33,391) Proceeds from sale of division of magicJack — 6,196 Dividends and distributions from equity investments 1,005 1,454 Acquisition of other businesses (1,500) — Net cash used in investing activities (98,546) (251,444) Cash flows from financing activities: Net cash provided by financing activities 77,589 196,184 Effect of foreign currency on cash, cash equivalents and restricted cash 407 (183) Net increase (decrease) in cash, cash equivalents and restricted cash 66,347 (9,220) Cash, cash equivalents and restricted cash, beginning of period 104,739 180,278 Cash, cash equivalents and restricted cash, end of period $171,086 $171,058

9 9 Segment Financial Information (Unaudited) (Dollars in thousands) Three Months Ended September 30, 2020 2019 Capital Markets segment: Revenues - Services and fees $89,032 $68,062 Trading income and fair value adjustments on loans 31,753 40,268 Interest income - Loans and securities lending 26,026 25,766 Total revenues 146,811 134,096 Selling, general and administrative expenses (68,442) (70,140) Restructuring charge (1,417) — Interest expense - Securities lending and loan participations sold (10,975) (10,273) Depreciation and amortization (1,166) (1,281) Segment income 64,811 52,402 Auction and Liquidation segment: Revenues - Services and fees 21,473 11,232 Revenues - Sale of goods 22,712 54 Total revenues 44,185 11,286 Direct cost of services (18,373) (2,371) Cost of goods sold (9,046) (126) Selling, general and administrative expenses (4,625) (2,835) Restructuring charge (140) — Depreciation and amortization (1) (1) Segment income 12,000 5,953 Valuation and Appraisal segment: Revenues - Services and fees 9,655 10,818 Selling, general and administrative expenses (6,632) (7,331) Depreciation and amortization (51) (36) Segment income 2,972 3,451 Three Months Ended September 30, 2020 2019 Principal Investments – United Online and magicJack segment: Revenues - Services and fees 20,663 22,999 Revenues - Sale of goods 939 864 Total revenues 21,602 23,863 Direct cost of services (4,891) (5,565) Cost of goods sold (767) (785) Selling, general and administrative expenses (4,840) (5,895) Depreciation and amortization (2,736) (2,956) Restructuring charge — — Segment income 8,368 8,662 Brands segment: Revenues - Services and fees 4,000 — Selling, general and administrative expenses (994) — Depreciation and amortization (714) — Segment income 2,292 — Consolidated operating income from reportable segments $90,443 $70,468

10 10 Definition of US GAAP to Non - GAAP Financial Measures Certain of the information set forth herein, including operating revenue, adjusted EBITDA, operating adjusted EBITDA, and investment adjusted EBITDA may be considered non - GAAP financial measures . B . Riley Financial believes this information is useful to investors because it provides a basis for measuring the Company's available capital resources, the operating performance of its business and its revenues and cash flow, ( i ) excluding in the case of operating revenues, trading income (losses) and fair value adjustments on loans, (ii) excluding in the case of adjusted EBITDA, net interest expense, provisions for or benefit from income taxes, depreciation, amortization, fair value adjustment, restructuring costs, impairment of trade names, stock - based compensation and transaction and other expenses, (iii) excluding in the case of operating adjusted EBITDA, aforementioned adjustments for adjusted EBITDA, trading income (losses) and fair value adjustments on loans, and other investment related expenses, and (iv) in the case of investment adjusted EBITDA this includes trading income (losses) and fair value adjustments on loans, net of other investment related expenses, that would normally be included in the most directly comparable measures calculated and presented in accordance with Generally Accepted Accounting Principles ("GAAP") . In addition, the Company's management uses these non - GAAP financial measures along with the most directly comparable GAAP financial measures in evaluating the Company's operating performance, capital resources and cash flow . Non - GAAP financial measures should not be considered in isolation from, or as a substitute for, financial information presented in compliance with GAAP, and non - financial measures as reported by the Company may not be comparable to similarly titled amounts reported by other companies .