Operator
Good morning, ladies and gentlemen, and welcome to the Sterling Infrastructure Fourth Quarter and Full Year Webcast and Conference Call. As a reminder, this call is being recorded on Thursday, February 26, 2026. I would now like to turn the call over to Noelle Dilts, Vice President, Investor Relations and Corporate Strategy. Please go ahead.
Good morning to everyone joining us, and welcome to Sterling Infrastructure's Fourth Quarter and Full Year 2025 Earnings Conference Call and Webcast. I'm pleased to be here today to discuss our results with Joseph Cutillo, Sterling's Chief Executive Officer; and Nick Grindstaff, Sterling's Chief Financial Officer. Joe will open the call with an overview of the company and its performance in the quarter. Nick will then discuss our financial results and 2026 guidance, after which Joe will provide some additional commentary on our markets and outlook. We will then open the call up for questions. As a reminder, there are accompanying slides on the Investor Relations section of our website. These slides include details on our full year 2026 financial guidance. Before turning the call over to Joe, I'll read the safe harbor statement. The discussion today may include forward-looking statements. Actual results could differ materially from the statements made today. Please refer to Sterling's most recent 10-K and 10-Q filings for a more complete description of risk factors that could affect these projections and assumptions. The company assumes no obligations to update forward-looking statements as a result of new information, future events or otherwise. Please also note that management may reference EBITDA, adjusted EBITDA, adjusted net income or adjusted earnings per share on this call, which are all financial measures not recognized under U.S. GAAP. As required by SEC rules and regulations, these non-GAAP financial measures are reconciled to their most comparable GAAP financial measures in our earnings release issued yesterday afternoon. Our discussion of all results today, including revenue and backlog, refer to figures that adjust prior period results to conform to the current accounting of our RHB JV, unless otherwise noted. I'll now turn the call over to our CEO, Joe Cutillo.
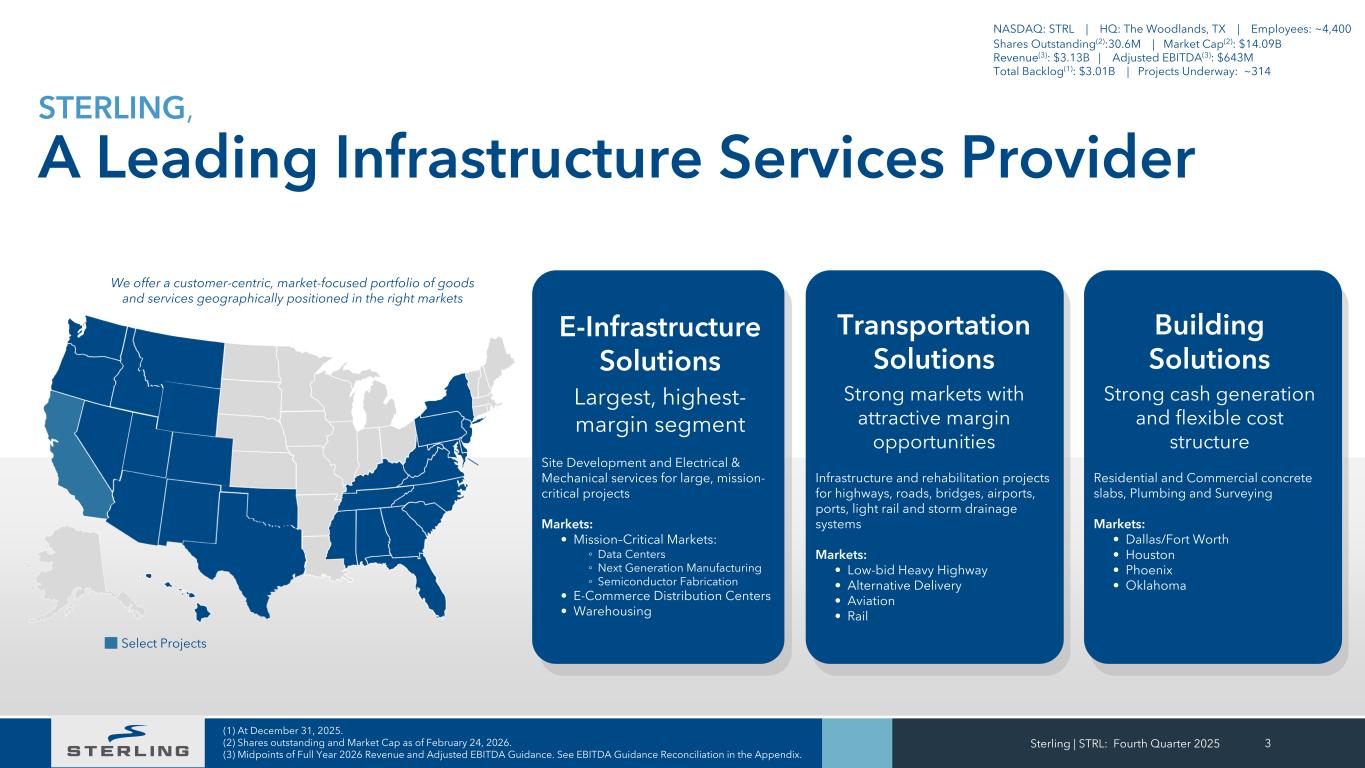
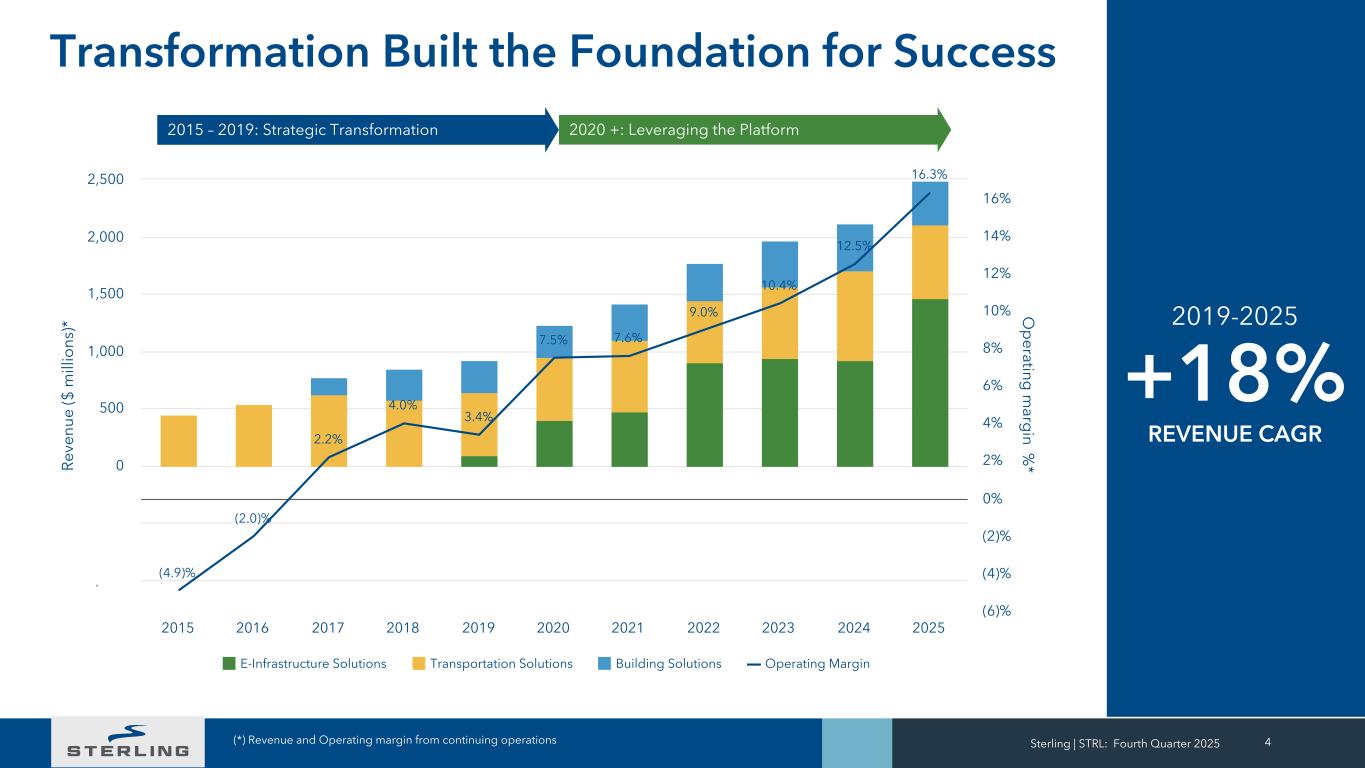
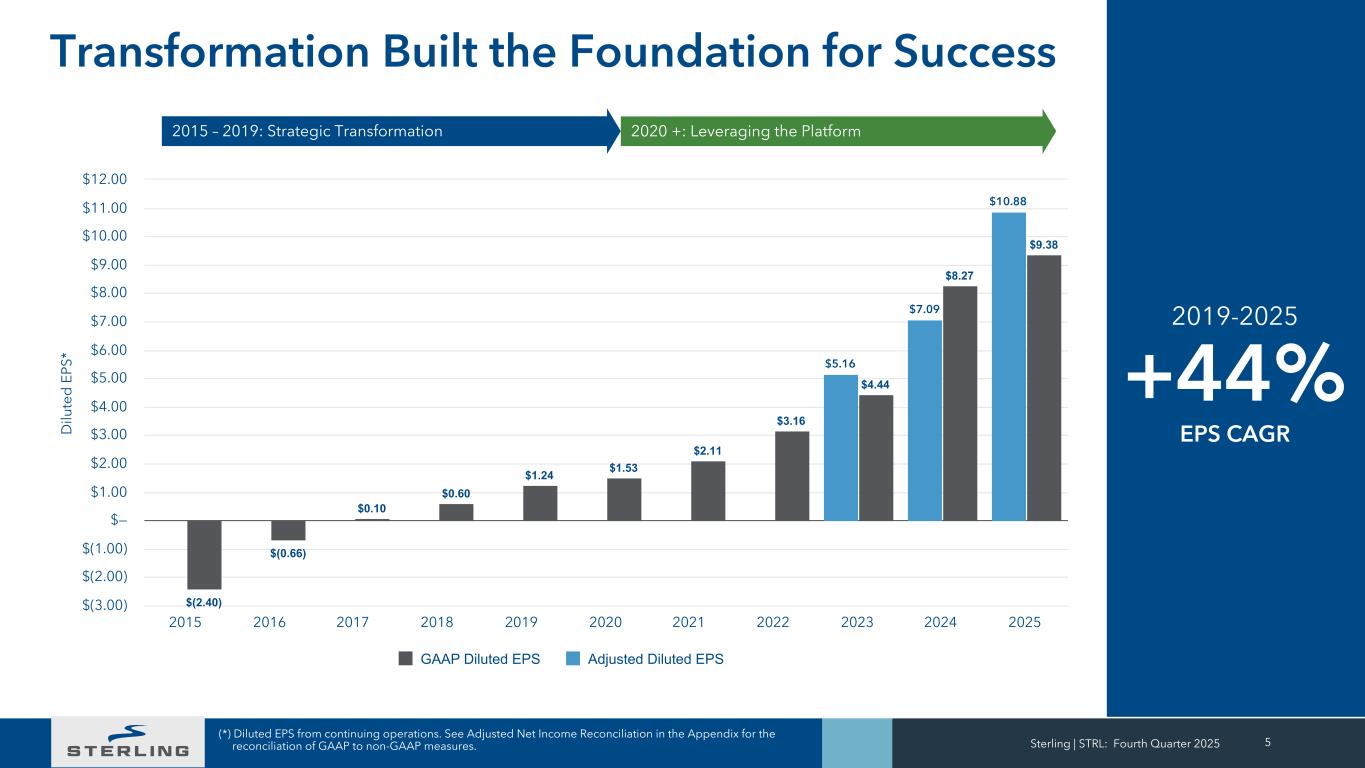
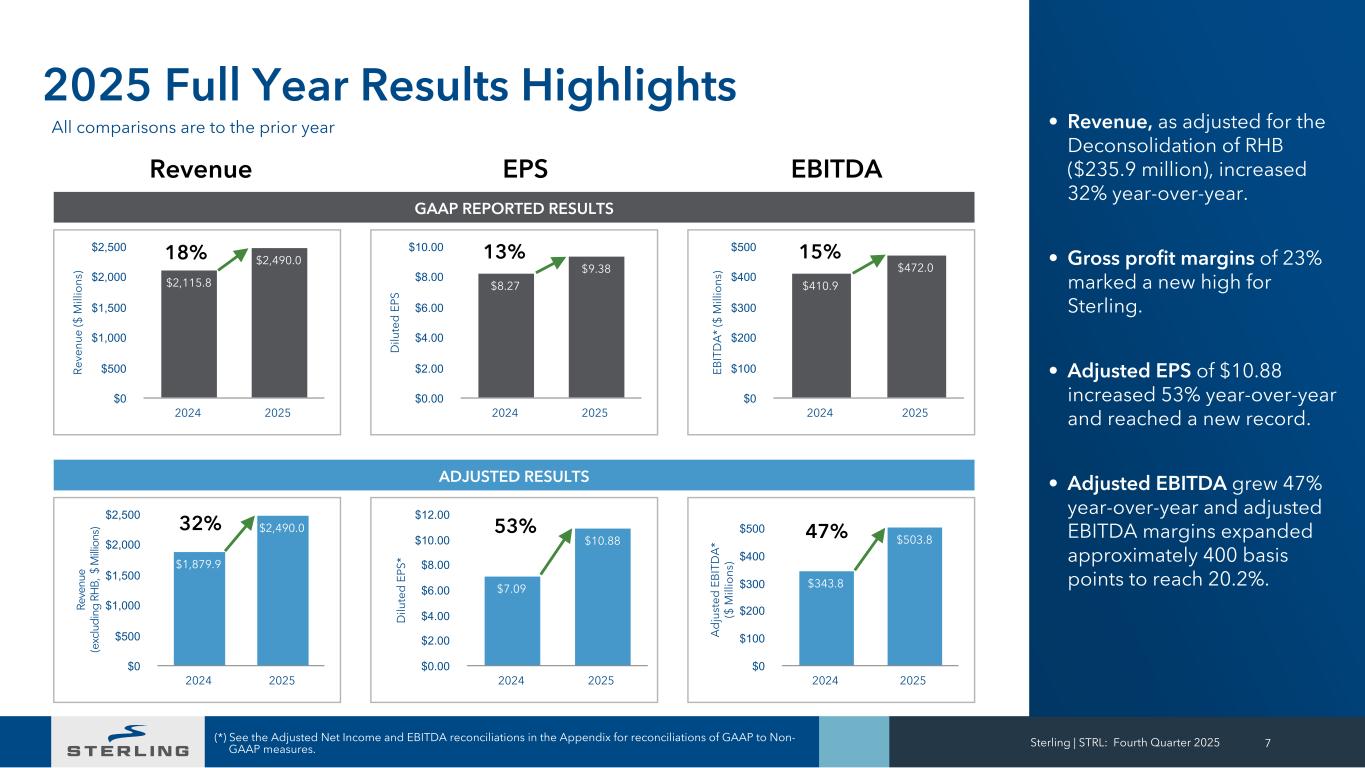
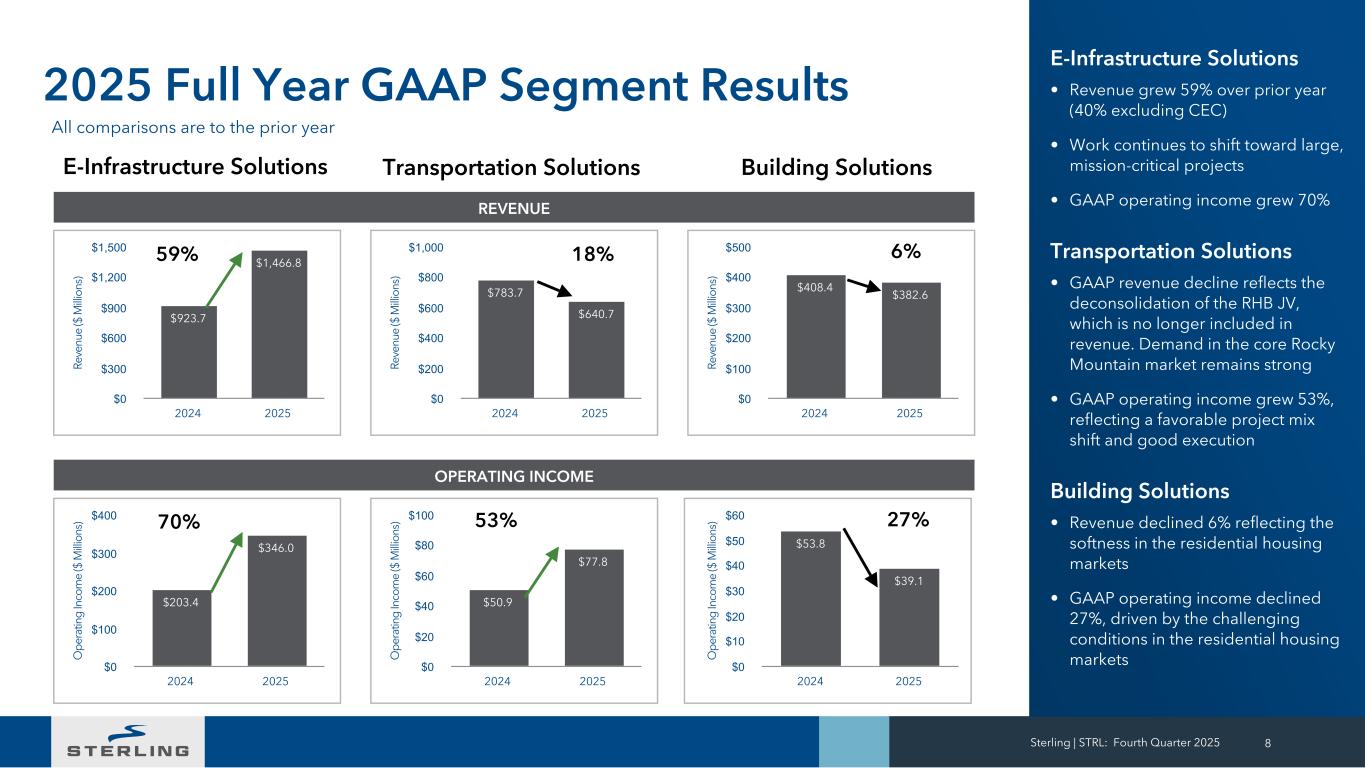
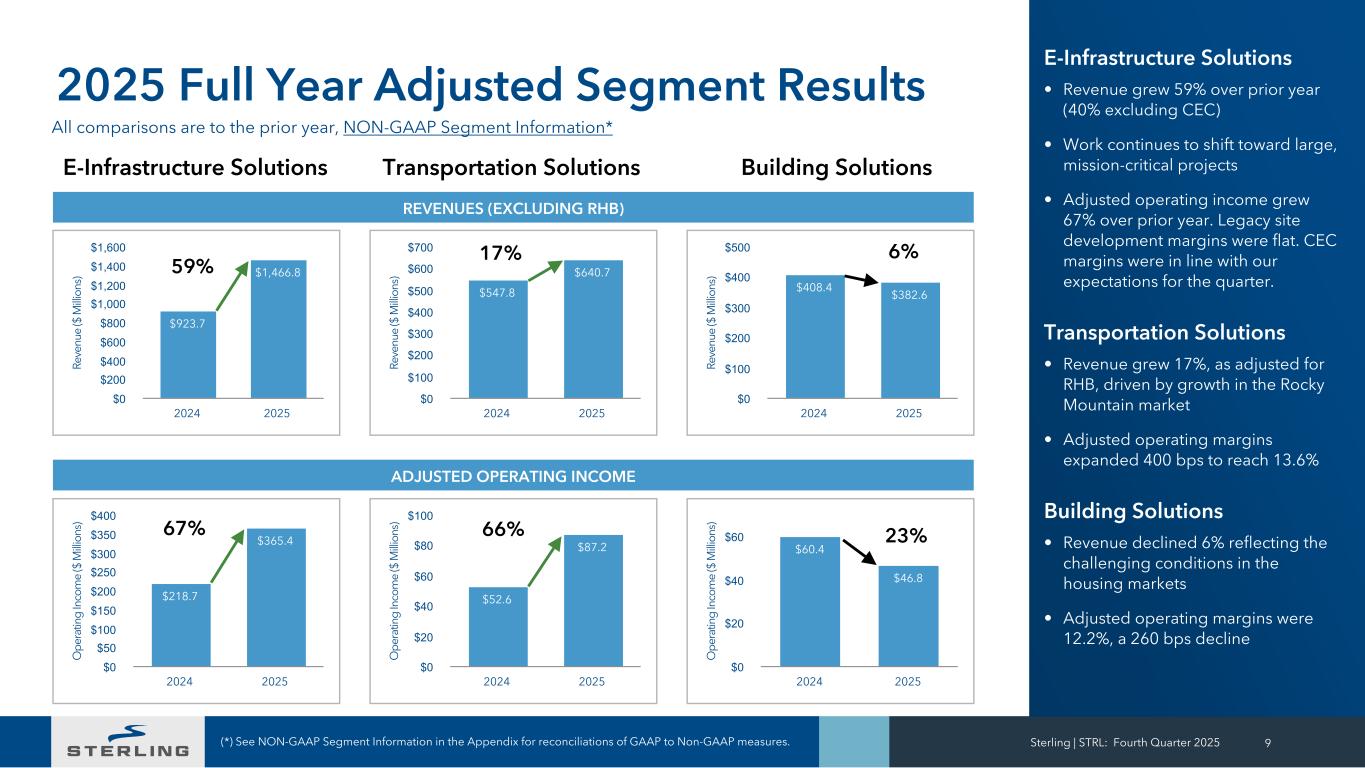
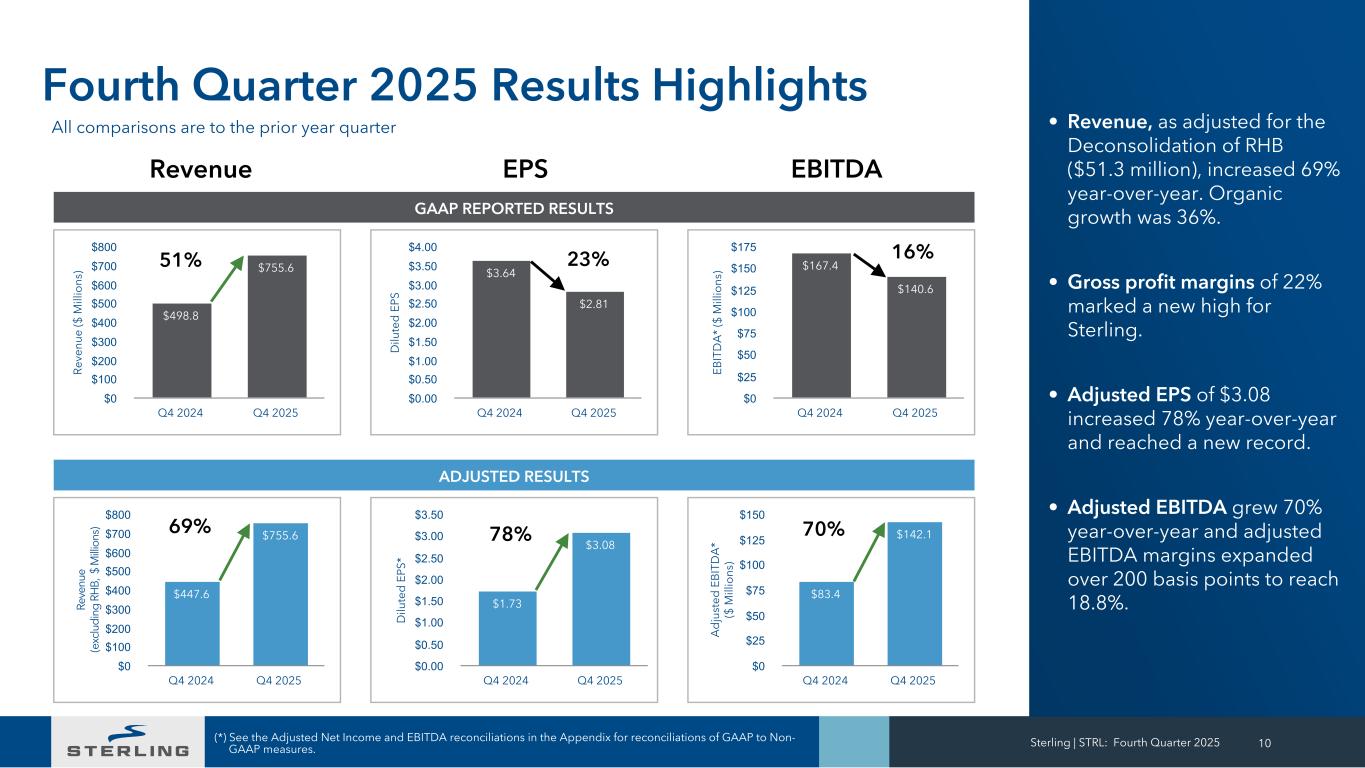
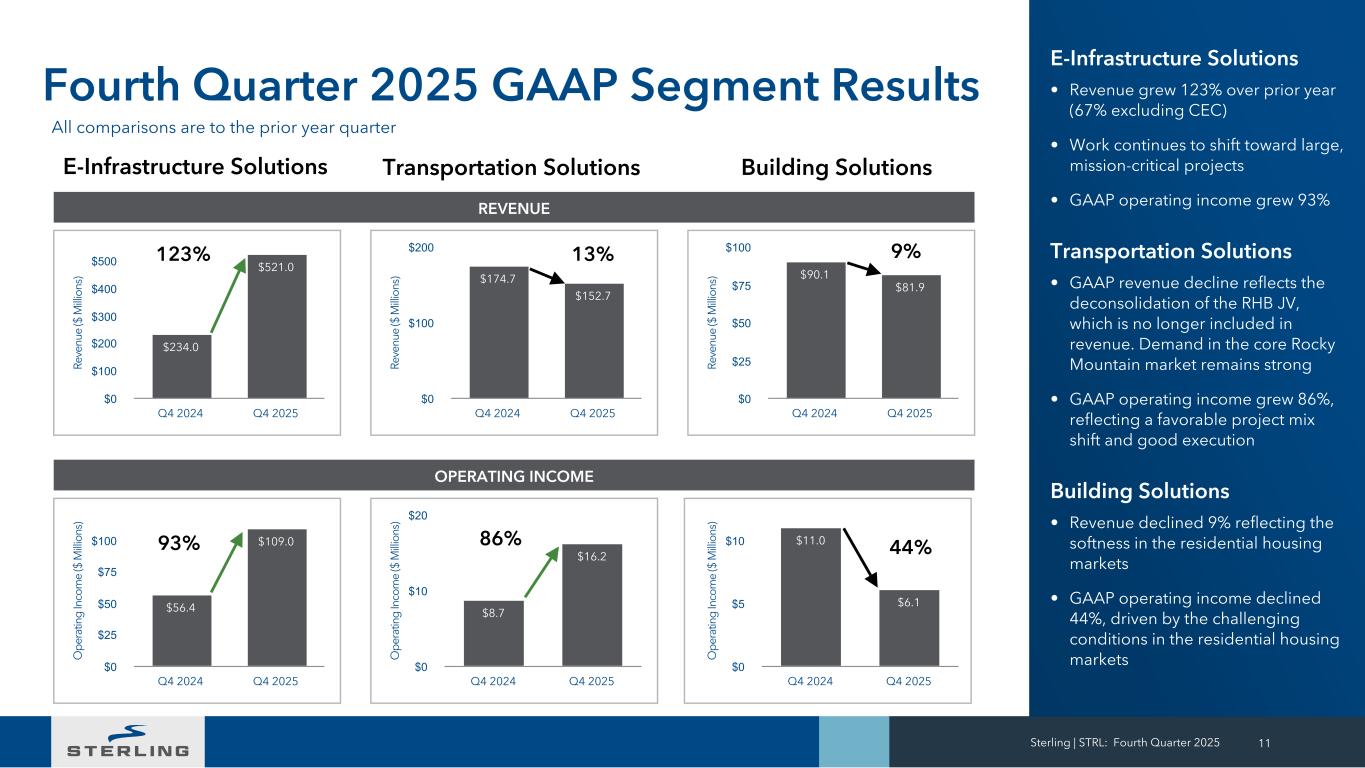
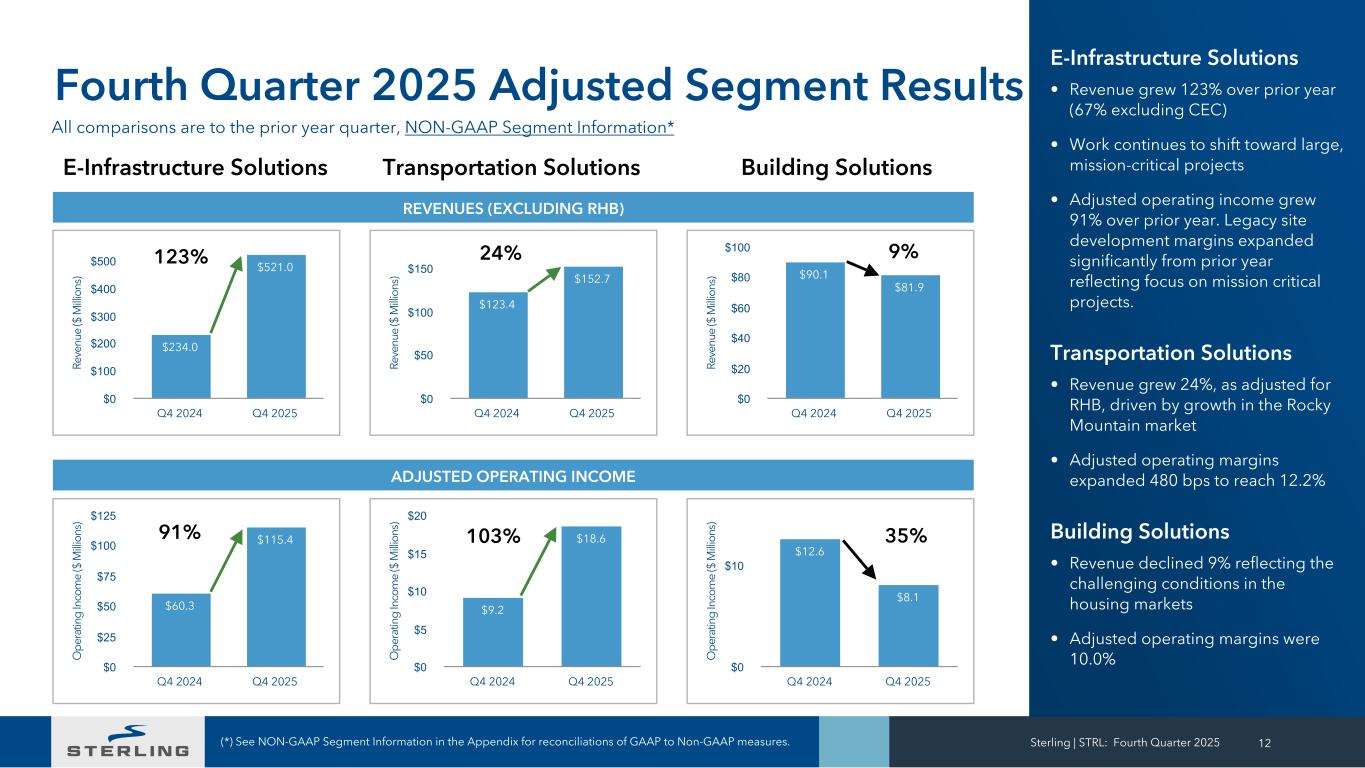
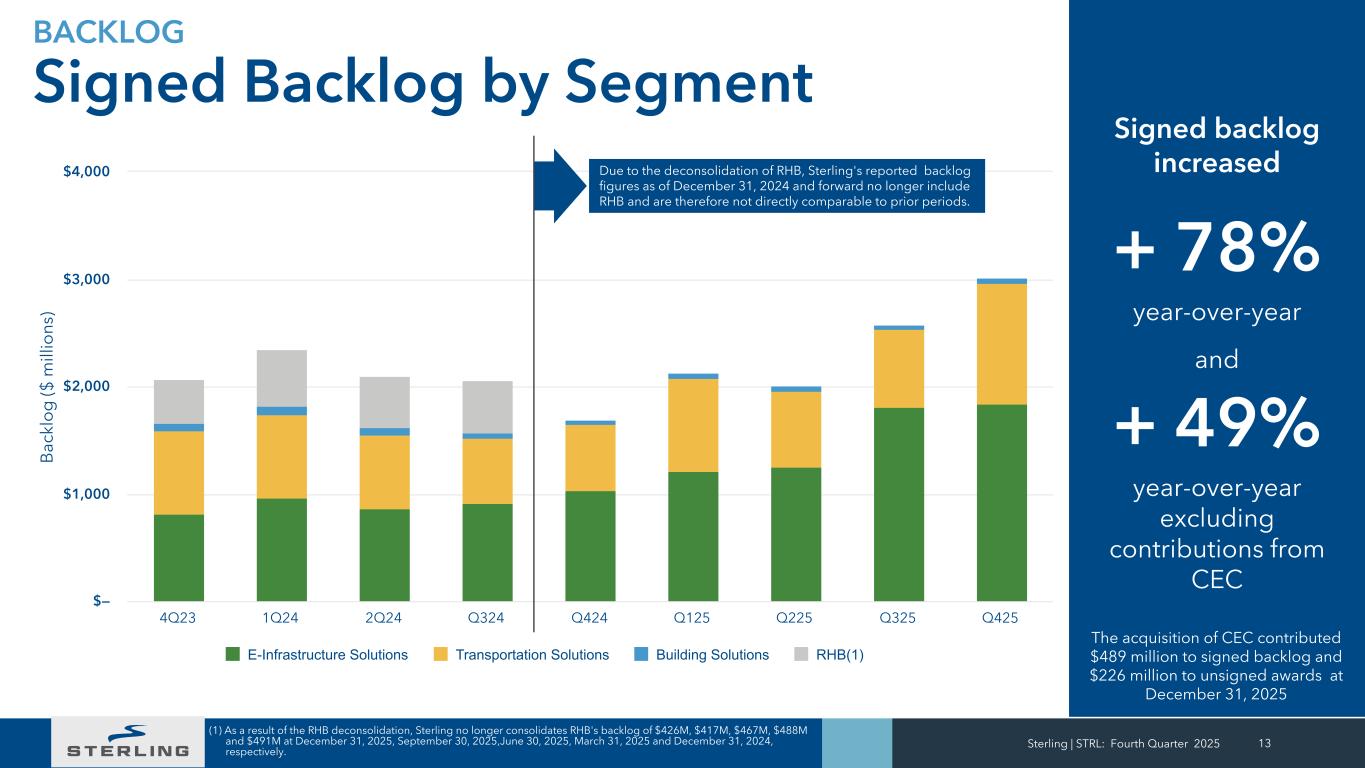
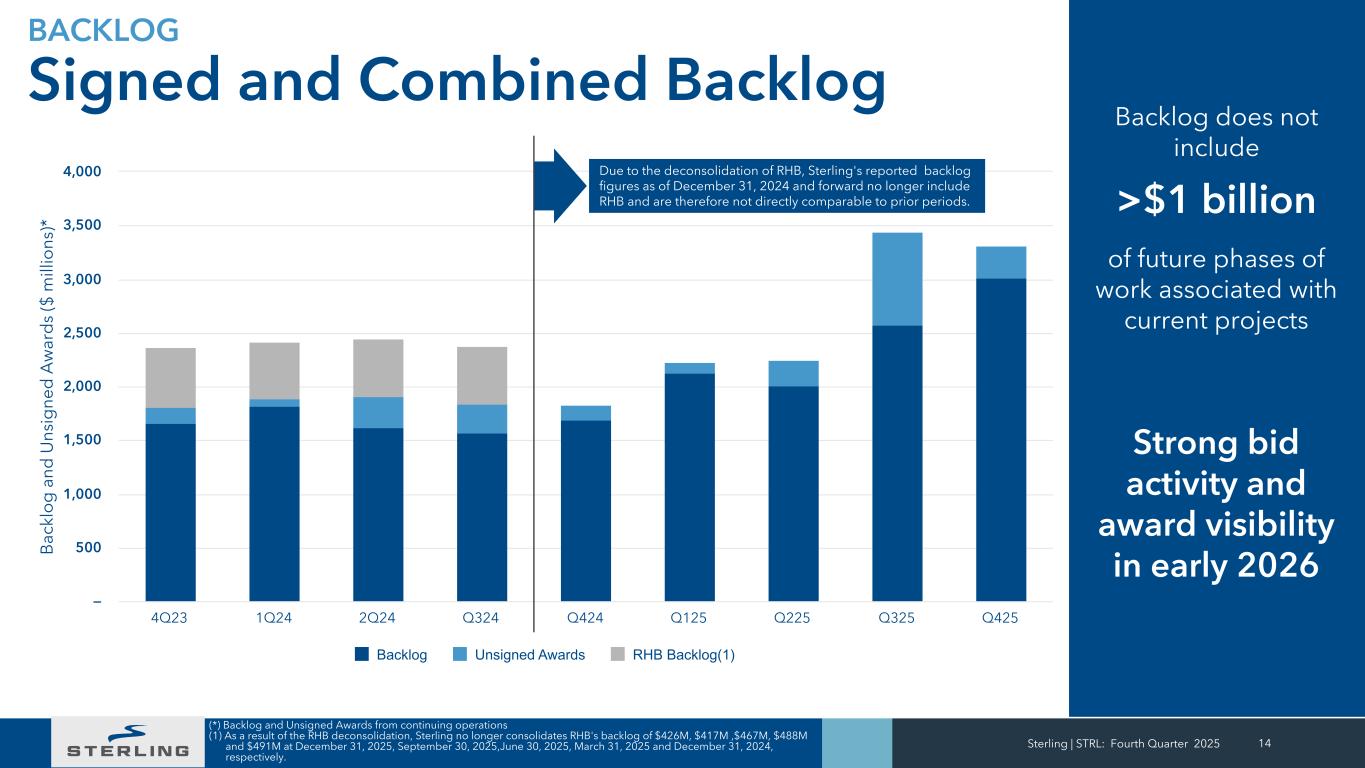
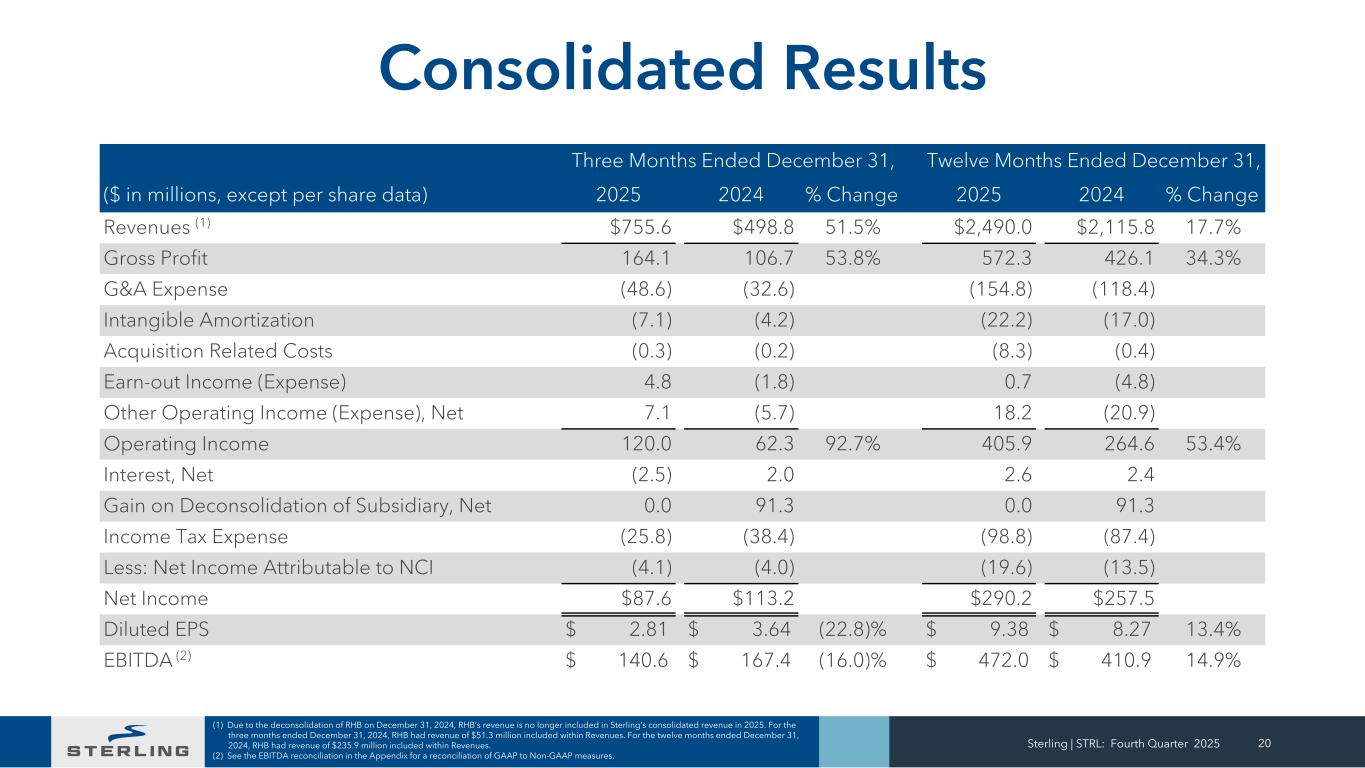
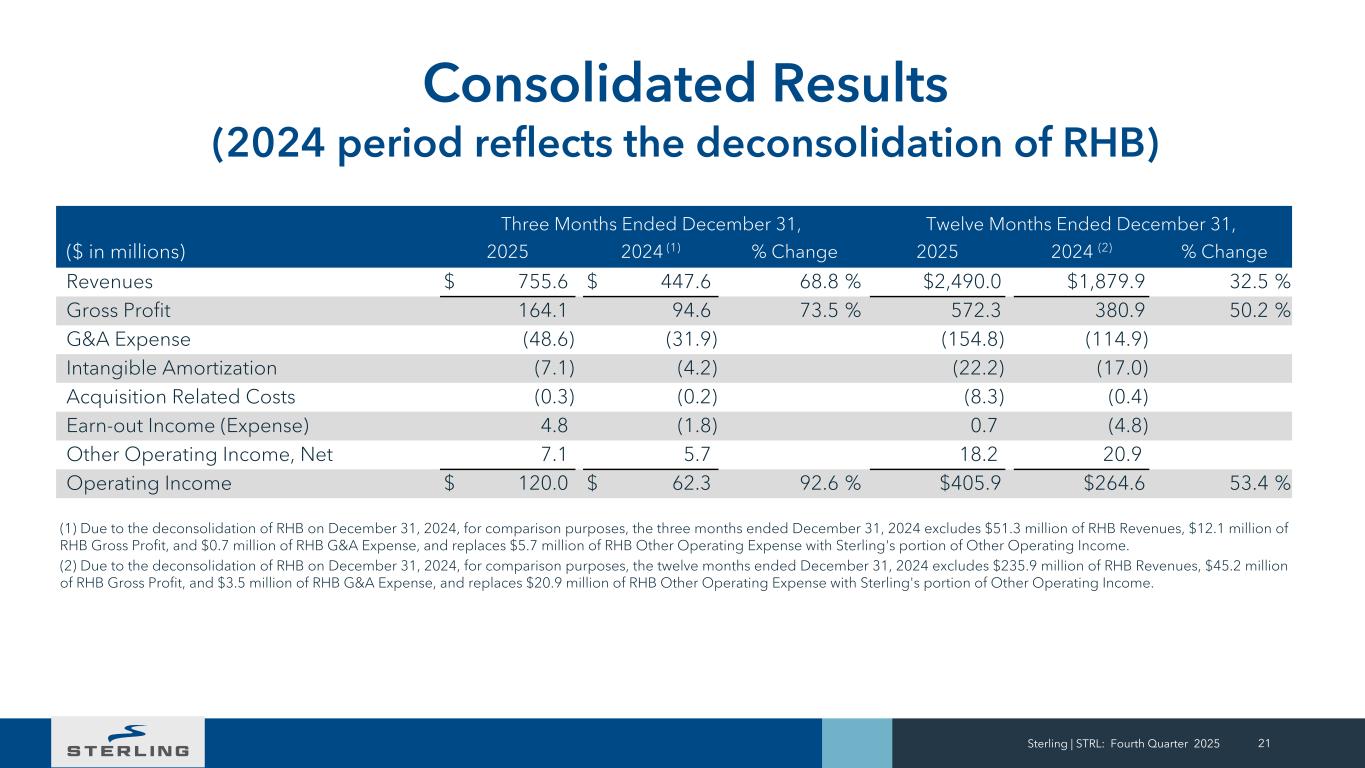
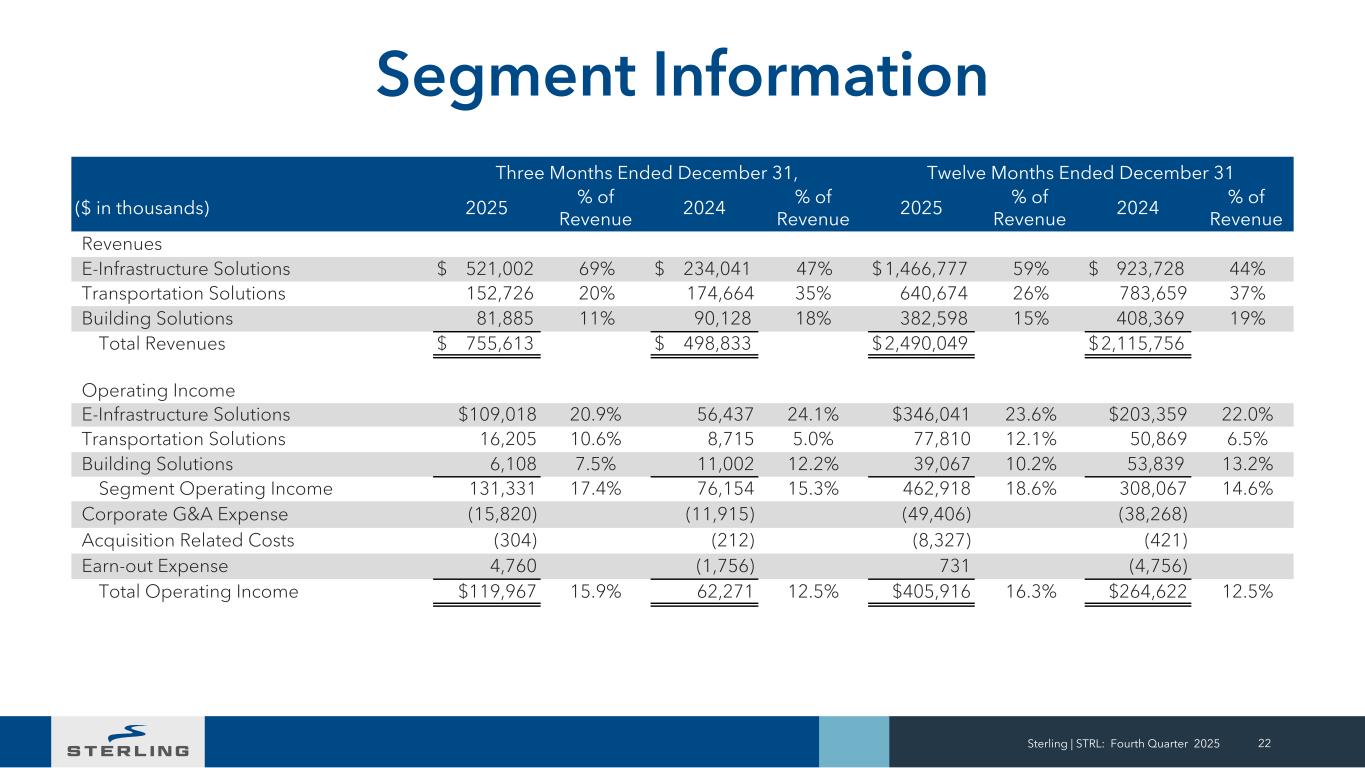
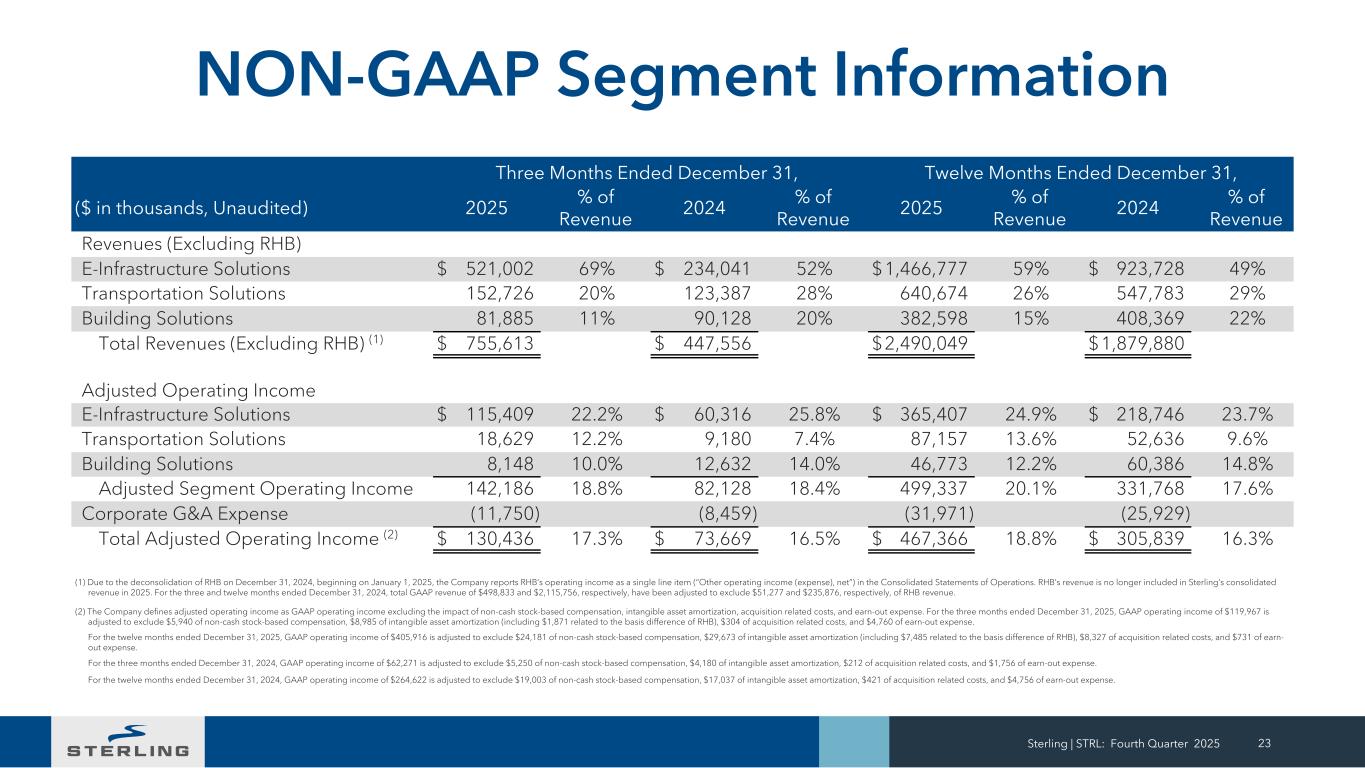
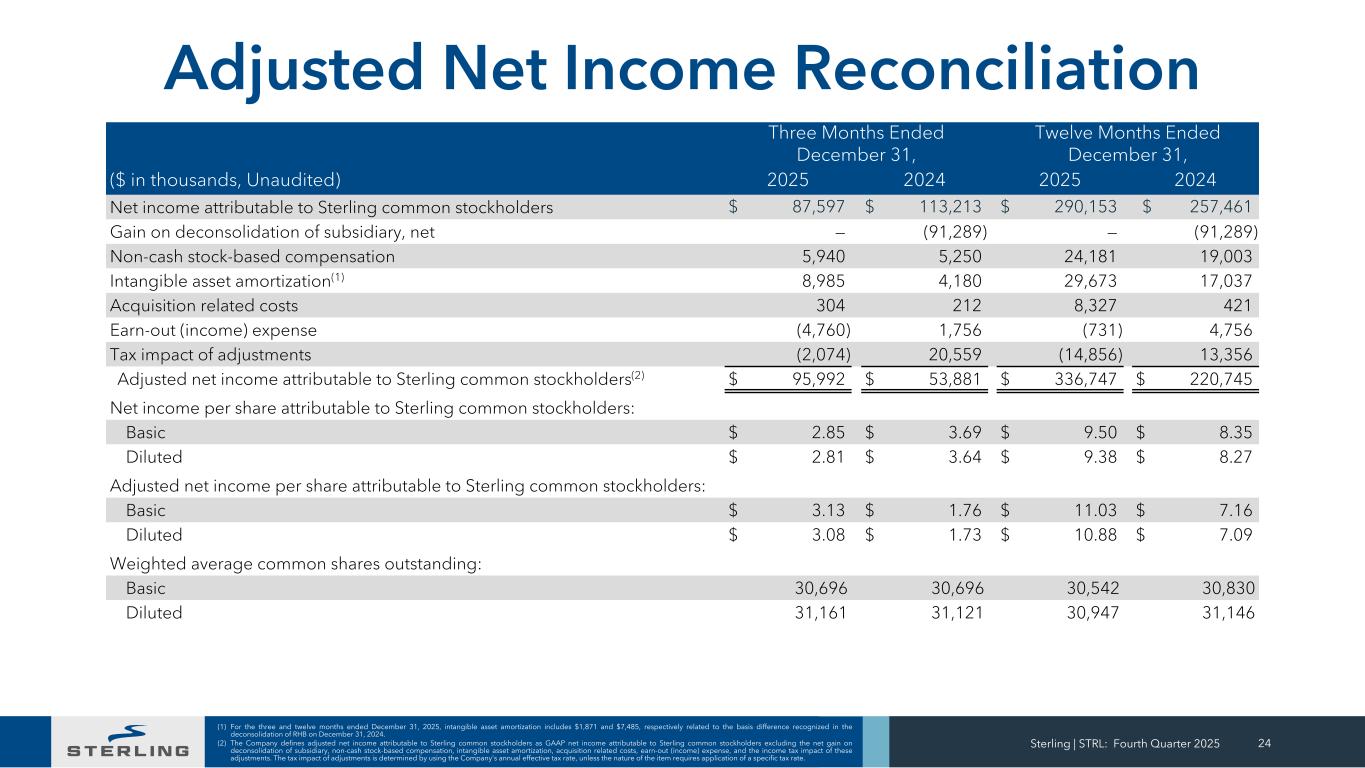
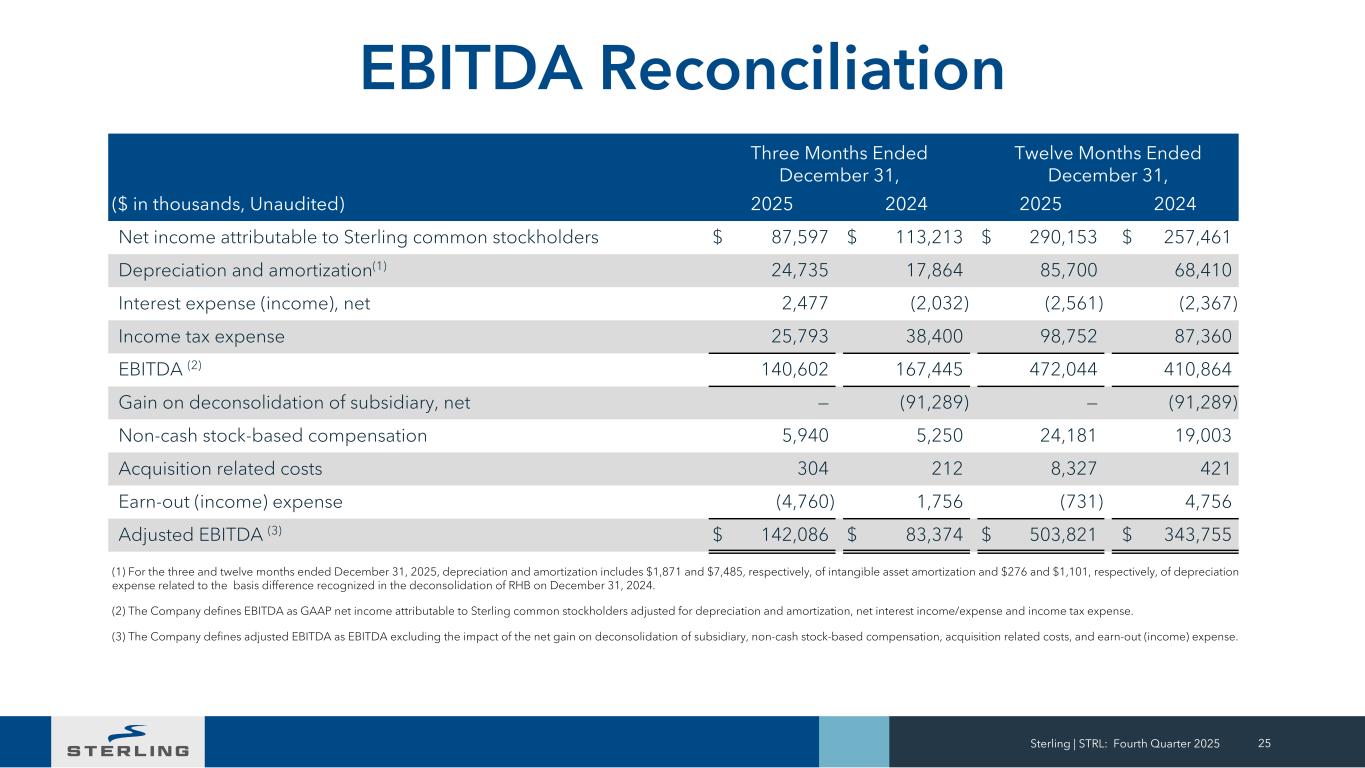
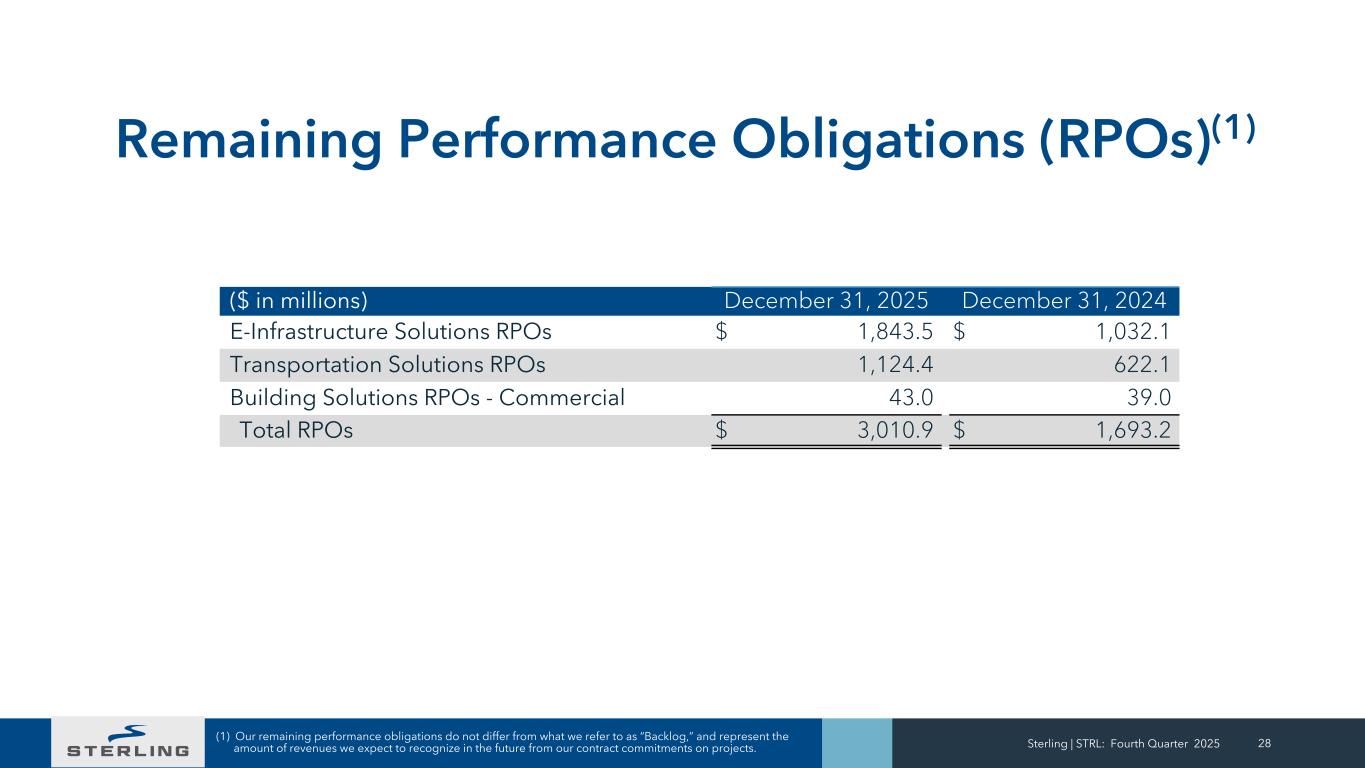
Thanks, Noelle. Good morning, everyone, and thank you for joining Sterling's Fourth Quarter and Full Year 2025 Earnings Call. I'd like to start by thanking our team for delivering another outstanding year in 2025. We achieved strong revenue growth of over 32% and adjusted diluted EPS growth of over 53%. This is the fifth consecutive year we have achieved adjusted EPS growth of over 35%. Full year gross margins reached 23% and adjusted EBITDA margins exceeded 20% for the first time in our history. The strength of our margins reflects our continued focus on pursuing opportunities that offer the most attractive returns. Additionally, our operating cash generation remained strong at $440 million. We are pleased to discuss these results with you today, but are even more excited about the opportunities ahead of us. The Sterling Way, which is our commitment to take care of our people, our environment, our investors, and our communities, while we work to build America's infrastructure remains our guiding principle as we execute our strategy and grow the company. Moving to the fourth quarter results. Revenue grew 69%, fueled by 123% growth in E-Infrastructure Solutions and 24% growth in our Transportation Solutions. Organic growth in the quarter was 36%. We grew adjusted earnings per share by 78% to $3.08 and adjusted EBITDA by 70% to $142 million. Additionally, operating cash flow generation in the quarter was again very strong at $186 million. Our backlog position and strong visibility drive our confidence in the future. Signed backlog at the end of the quarter totaled $3 billion, a 78% increase from year-end 2024. On a same-store basis, backlog increased approximately 50%. When you layer in our unsigned awards of $301 million, and pipeline of future phase opportunities, which now exceeds $1 billion, we have visibility into a pool of work approaching $4.5 billion for Sterling. Now I'd like to discuss our segment results for the full year and fourth quarter in more detail. In E-Infrastructure, full year revenue grew 59% including 40% organic growth and adjusted operating income grew 67%. Adjusted operating margins reached nearly 25% and an increase of more than 120 basis points. This was driven by our shift towards large mission-critical projects where our superior project management and ability to finish jobs on or ahead of schedule is extremely valuable to our customers. In the fourth quarter, revenue grew 123%, including 67% organic growth. The data center market, again, was the primary growth driver in the quarter. Additionally, our geographic expansion efforts are really paying off. Our Rocky Mountain site development operation, which is solely focused on mission-critical work, grew more than 150% from the prior year period. Adjusted E-Infrastructure operating income grew 91%. Operating margin for the legacy E-Infrastructure site development business remained flat with prior year levels. Margins continue to benefit from our focus on large mission-critical projects and strong execution. The CEC acquisition is performing very well. In the quarter, CEC revenue increased 21% from its prior year fourth quarter, and margins were in line with our expectations. The Texas market, in particular, is very strong, and we continue to see tremendous opportunities ahead for both electrical and site development. Our multiyear visibility in the E-Infrastructure business remains excellent. The aggregate of our E-Infrastructure signed backlog, unsigned electrical awards, and future phased site development opportunities totaled more than $3 billion. Mission-critical work, including data centers, large manufacturing projects, and semiconductors represented 84% of E-Infrastructure signed backlog at the end of the year. Future phase work is predominantly related to mission-critical projects. Moving to Transportation Solutions. For the full year, revenue grew 17% and adjusted operating profit grew 66%, driven by strong market demand and the benefit of mix towards higher-margin services. Fourth quarter revenue grew 24% and adjusted operating profit grew over 100%. We ended the quarter with Transportation Solutions backlog at $1.1 billion, an 81% year-over-year increase, driven by strong award activity and the conversion of unsigned backlog to signed backlog. Shifting to Building Solutions, full year revenue declined 6%, and adjusted operating profit declined 23%. In the fourth quarter, segment revenue declined 9% and adjusted operating margins were 10%. Overall demand for homes has been impacted as potential buyers struggle with affordability challenges. Even with the headwinds in Building Solutions, the strength of Sterling's diversified portfolio and strategy to focus on growth in high-margin end markets enabled us to deliver another fantastic year. With that, I'd like to turn it over to Nick to give you more details on some of our financial metrics and the 2026 guidance.
Speaker 3
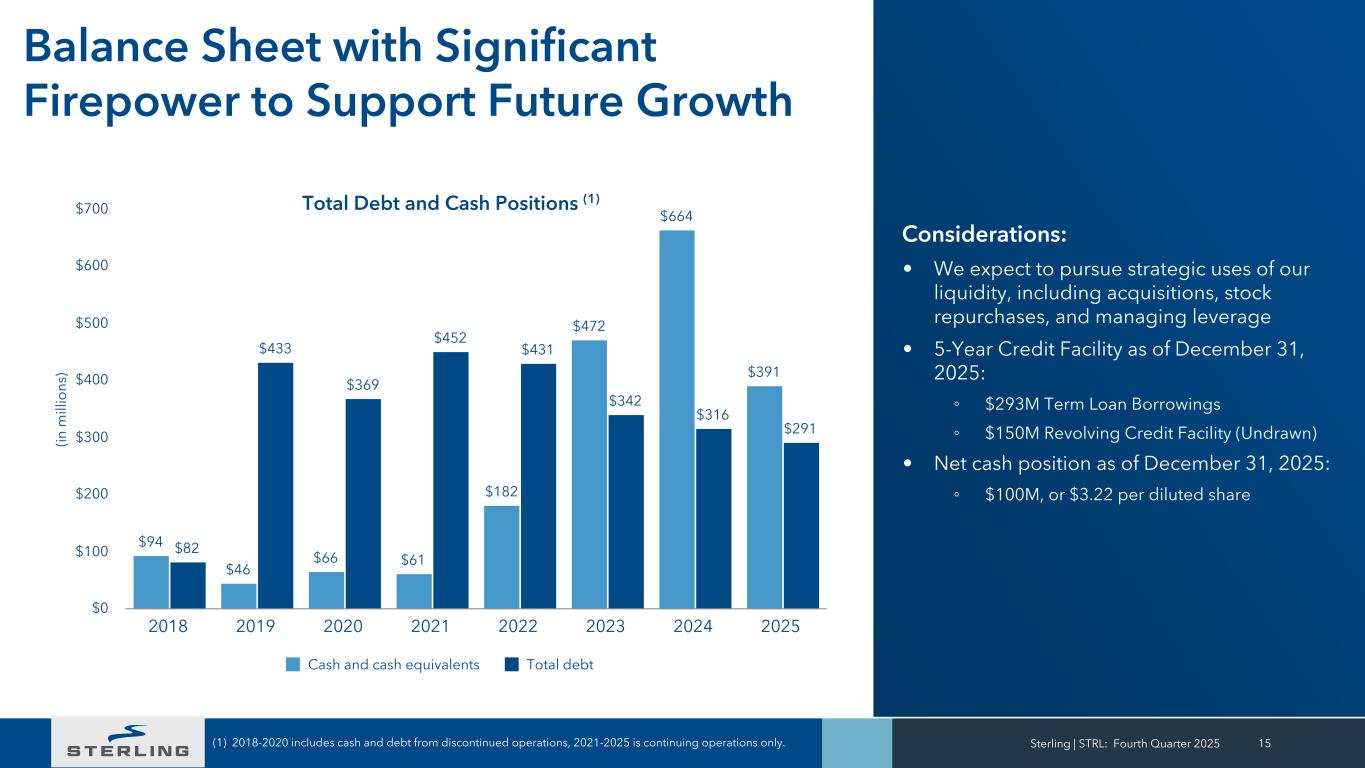
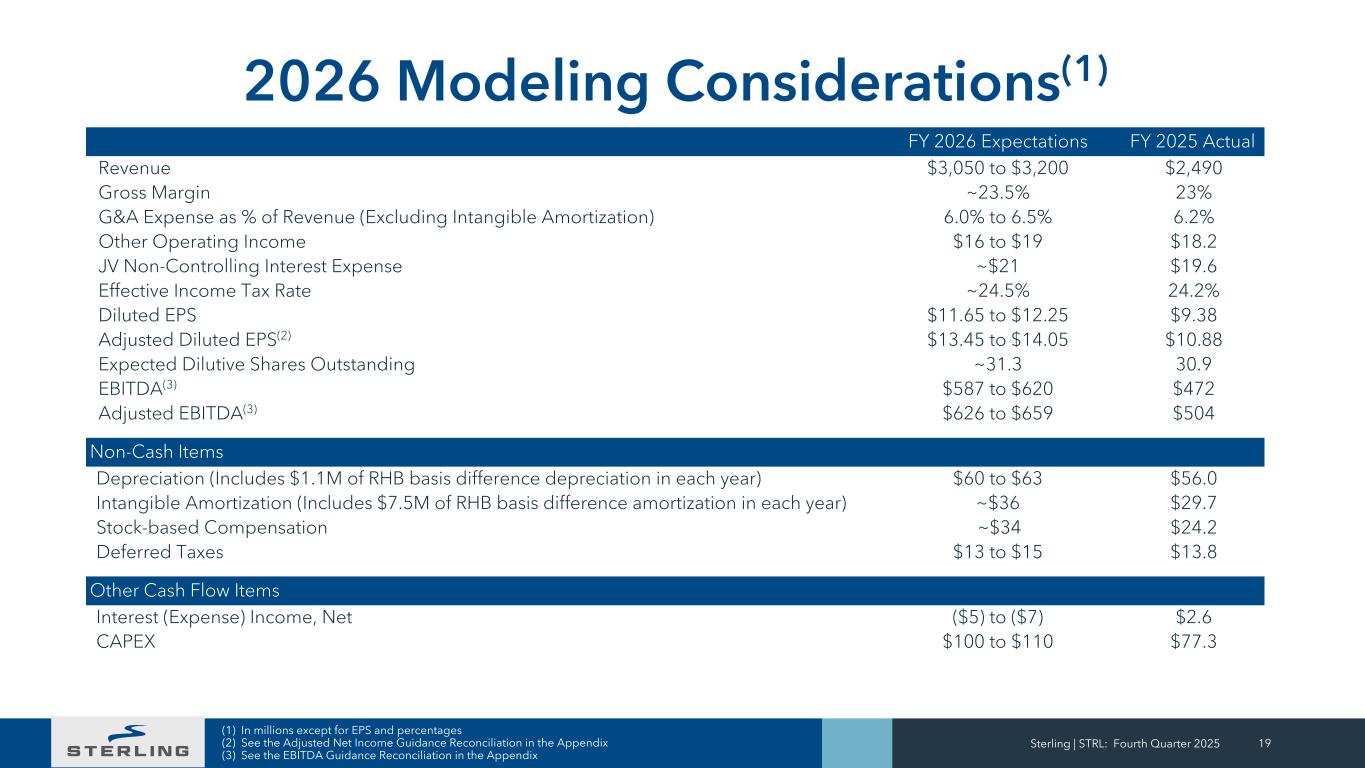
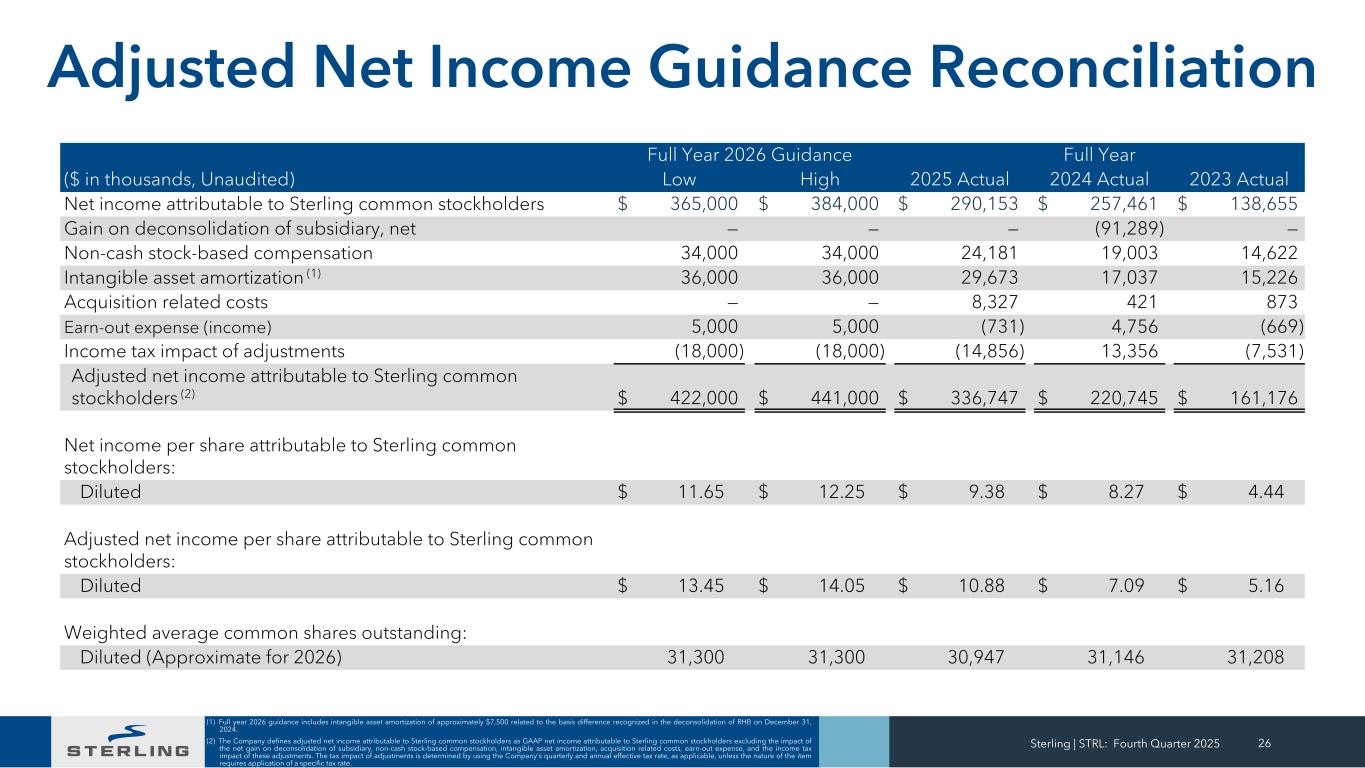
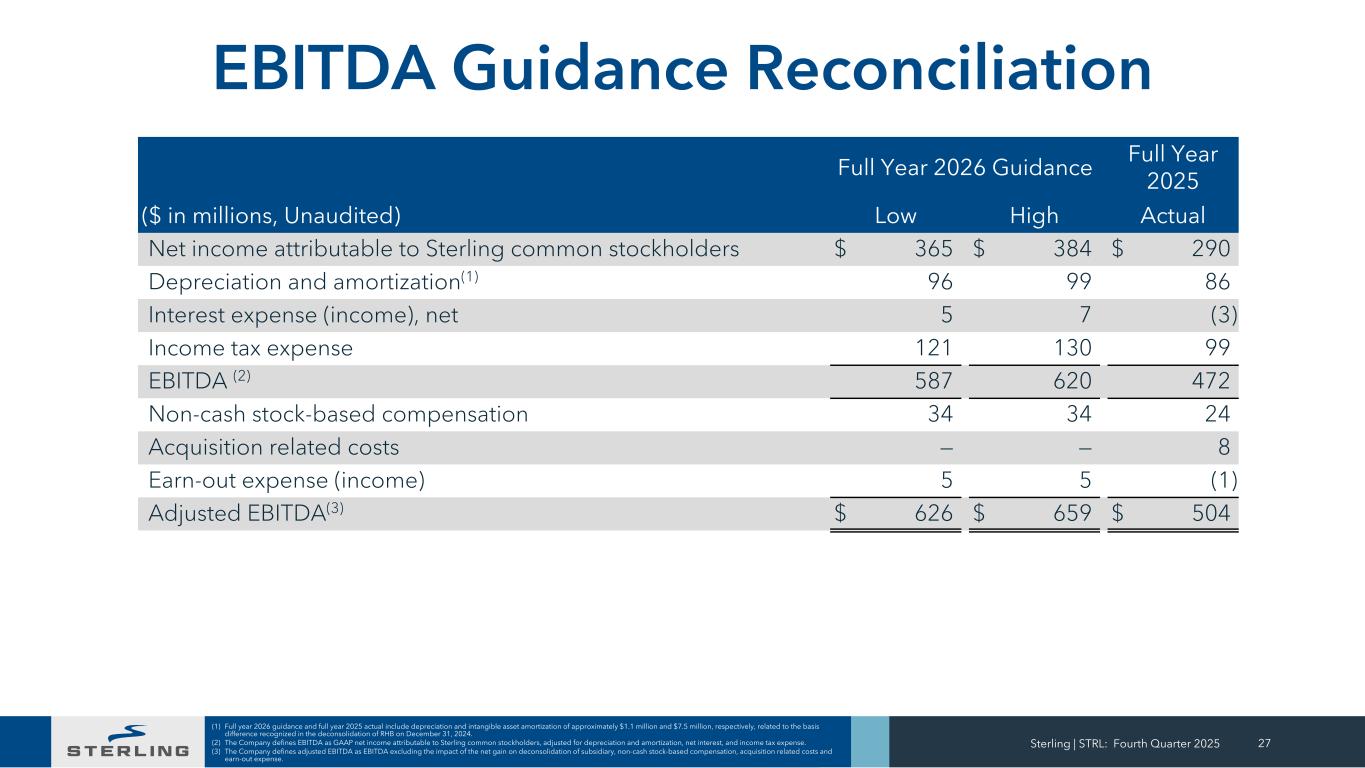
Thanks, Joe, and good morning. I'll begin with our consolidated backlog metrics. Our year-end backlog totaled $3 billion, a 78% increase from year-end 2024 or 49%, excluding CEC. Combined backlog of $3.3 billion increased 81% from prior year-end or 42%, excluding CEC. Fourth quarter 2025 book-to-burn ratios were 1.64x for backlog and 0.81x for combined backlog. Moving to our cash flow metrics. Cash flow from operating activities for 2025 was a strong $440 million. We expect continued strength in operating cash flow in 2026 in both the legacy and recently acquired businesses. Cash flow used in investing activities for 2025 included $77 million of CapEx and $482 million for acquisitions, including CEC. For 2026, we are forecasting CapEx in the range of $100 million to $110 million, with the increase driven by investments to support growth and productivity. Cash flow from financing activities was a $162 million outflow, primarily driven by share repurchases of $74 million at an average price of $168.72 per share. In the quarter, we deployed $26 million into share repurchases at an average price of $310.09 per share. Remaining availability under the existing repurchase authorization is $374 million. We will remain opportunistic in our approach to share repurchases. We are in great shape from a balance sheet perspective. We ended the quarter with $391 million of cash and debt of $291 million for a cash net of debt balance of $100 million. Additionally, our $150 million revolving credit facility remained undrawn during the period. Given our strong liquidity, we are in an excellent position to continue to take advantage of both organic and inorganic growth opportunities in the years ahead. Now I'd like to discuss our guidance. Our current backlog, visibility, and strong market tailwinds position us well for another great year ahead. We are initiating the following guidance ranges for 2026. Revenue of $3.05 billion to $3.2 billion; diluted EPS of $11.65 to $12.25. Adjusted diluted EPS of $13.45 to $14.05, EBITDA of $587 million to $620 million. Adjusted EBITDA of $626 million to $659 million. The midpoints of these ranges reflect strong year-over-year growth of 25% or higher for each of these metrics. Now I will turn the call back to Joe.
Thanks, Nick. As we look to the future, we remain very bullish on the multiyear opportunity in each of our markets. Our strong backlog, future phase opportunities and conversations with our core customers on the size and number of future projects contribute to our confidence. In E-Infrastructure site development, we anticipate that the current strength in data center demand will continue for the foreseeable future. We have discussed for some time that we're in conversations with our customers regarding how we can best support their strong multiyear capital deployment programs. As part of this, we are being pulled more rapidly into new geographies, including Texas and the Pacific Northwest. Additionally, our projects are getting larger and are spanning longer time periods. In the semiconductor and manufacturing markets, there remains a very big pool of mega projects on the horizon for the later part of the decade. This includes planned semiconductor fabrication facilities. We believe that some of these projects are close to shore and will be awarded in 2026. In E-Commerce distribution, award opportunities strengthened significantly in 2025 as large customers restarted their investment programs following the post-COVID build-out and correction. We believe that this momentum will continue into 2026 as these programs accelerate. Together, these dynamics across our end markets support strong growth opportunities over a multiyear period. We have very good momentum in our Electrical business for 2026. Customer demand is very strong, particularly in the Texas data center market. We have a high degree of confidence in our ability to leverage the combination of our site development and electrical services to drive growth and margin expansion across the platform. For 2026, we expect to deliver E-Infrastructure revenue growth of 40% or higher. This includes 20% growth or higher in the legacy business. Adjusted operating profit margins for the E-infrastructure are expected to be in the 23% to 24% range. In Transportation Solutions, we're in the final year of the current federal funding cycle, which concludes in September 2026. We have built over two years of backlog and continue to see good levels of bid activity. For 2026, we anticipate continued growth in our core Rocky Mountain market. The downsizing of our low bid heavy highway business in Texas is progressing according to plan, resulting in some moderation of Transportation Solutions' top line and backlog which should continue to drive margin improvement as we move through the year. We expect Transportation Solutions revenue growth in the low to mid-single digits in 2026 and continued margin expansion. In Building Solutions, we believe the business is well-positioned for growth over a multiyear period. Our key geographies of Dallas, Fort Worth, Houston, and Phoenix are all expected to see population growth, driving new home demand. Additionally, there is an opportunity for share gain coming out of a down cycle. In the near term, we believe the current soft market conditions will continue. We anticipate that Building Solutions revenue will decline in the high single to low double digits in 2026 and that adjusted operating margins will remain in the low double digits. As a reminder, from a seasonality perspective, our fourth quarter and first quarter tend to be slower than our second and third quarters, with the first quarter typically our lowest of the year. On the acquisition front, we are looking for acquisitions that are the right strategic fit to enhance our service offering and geographic footprint. We are seeing more high-quality acquisition targets in the market today than we did a year ago. Moving to our full year 2026 guidance, the midpoint of our guidance range would represent 25% revenue growth, 26% adjusted EPS growth and 28% adjusted EBITDA growth. With that, I'd like to turn it over for questions.
Operator
And your first question comes from Brian Brophy from Stifel.
Speaker 4
I guess I just wanted to ask about transportation awards and backlog. It seems like it was a lot stronger than folks were expecting. Anything notable to call out there? Were there any large awards worth highlighting?
Yes. Thanks, Brian. Nothing in particular. There wasn't one big giant project or anything. I think what people tend to get confused with is even though we're coming to the end of a funding cycle, only about 50% to 60% of the total funding has been spent. So we will continue to see good bid activity through that September timeframe as projects are continuing to be let, which will obviously be built for a time period after that. So we feel very good about where we're positioned, and we like the bid activity. Nothing major, just kind of good singles, doubles, and maybe a little triple now and then as we go forward. But I also want to just remind you and everybody that at the end of the funding cycle, the world doesn't stop. This isn't a toggle switch. Generally, what happens if they don't have the next funding bill in place is they will do an extension of the existing funding bill. They have generally historically adjusted that for inflation. And as a result, bids will continue to come up.
Speaker 4
Yes, that's helpful. And then I guess just as a follow-up, you touched on this a bit in your opening comments, but hoping you could expand a little bit more. But just an update on some of the progress entering in Texas on the site prep side? And how is progress going kind of marrying that with some of the joint awards at CEC?
Yes. We're really excited about the Texas market, one from the CEC side on what we're seeing for data center expansion, electrical. But two, we're getting pulled very rapidly on the site development side. I think in the first half of this year, we're going to be able to talk about some very nice awards that take place in Texas. I believe we are ahead of schedule and more optimistic about the strength of putting these two together and the responses that we're receiving from customers. We are very pleased that our thesis is coming true. I think we'll see some very good activity in the first half of this year that will make everybody happy.
Operator
And your next question comes from Brent Thielman from Davidson.
Speaker 5
Great quarter, guys. Joe, maybe just to tack on to Brian's question, to get out a little bit more about how the pipeline has evolved at CEC since you've acquired it? Are the award opportunities getting a lot bigger? And maybe if you could comment on kind of what you're doing or seeing already that might support a higher threshold for margins for that business going forward?
Yes. The jobs are getting significantly larger. We joked at a recent leadership meeting about how we were excited to have our first 100-acre data center just a few years ago, thinking it was the largest project we could handle. Now, we have a new site in Texas where the parking lot alone is 100 acres, which really puts things into perspective. These are no longer just data centers; they're data campuses, and I think there’s some confusion around that. We’ll have multiple buildings on these campuses. CEC is gaining strong traction, and together, the site development and CEC are showing great progress. We are seeing margin improvements in several areas. As CEC shifts more towards data centers, those margins historically outperform the smaller industrial commercial projects. Additionally, by combining the exterior electric with site development, we've already achieved significant margin improvements from the small dry utility business we acquired in Georgia last year. The same improvements will occur with CEC over time. We're just starting these projects, and I believe we’ll see substantial progress in the first half of this year, with impacts becoming more evident in the second half.
Speaker 5
Okay. All right. And then maybe just on the legacy site development margins, as you mentioned, sort of flat here, obviously, at great levels. Maybe, Joe, you could just comment on why we shouldn't think they peaked at this point?
I apologize, Brent, I misunderstood your question. You are inquiring about site development margins for the quarter. We definitely do not foresee them becoming negative, particularly as we are witnessing larger project opportunities emerging. Additionally, there are some prospects in the Northeast for bigger jobs that will significantly enhance margins. As we mentioned in our script, our Rocky Mountain site development business has grown 150% year-over-year, which is quite exciting. However, a challenge for our margins in that region is that we generally utilize a smaller and different suite of equipment compared to the East Coast. Therefore, we plan to invest in some capital and adjust our capital planning, which we believe will boost margins significantly by mirroring our successful strategies from the Southeast and East Coast. Furthermore, we will continue to explore opportunities for vertical integration, as it can provide leverage and improve productivity. When entering a new geography, we first establish ourselves in site development, which allows us to assess potential partners for vertical integration and choose the best options. In the next 12 to 18 months, you will see us integrating some of those players across the U.S. I do want to add one more comment, though, on your CEC question on how rapidly they're growing and everything else. I would tell you if I had another 1,000 electricians in Texas, and I have a much bigger number. I think we could put them to work in 30 days or less. When we bought CEC, they had a small modular build facility. We just are in the process of signing a lease that triples the size of that. That will also help their margins so we can start prebuilding more in a factory condition and ship those to the field.
Operator
And your next question comes from Manish Somaiya from Cantor.
Speaker 6
Congrats on the quarter. A couple of questions for me. Maybe beginning with Joe, you talked about $1 billion of high probability future phase work. Can you give us a sense if that's tied to existing customers or programs? Or is it completely new? And how should we think about the expected conversion window?
Well, first, that $1 billion-plus is tied to projects we're actively working on today. So that's real work. That's what it will take in a minimum to finish out those projects. If you remember, as they continue to design, they release that work in a package. We did that next phase of work and then we execute it. So it's very solid. We can't technically call it backlog, but internally for capacity planning and everything else, it's a backlog for us. It's tied to existing customers, but we're always getting a new customer here and there. So we're not just fixated on 1 or 2. The lion's share of that is with the big name hyperscalers that everybody knows that have all announced their budgets, plans and future forecasts, which are all up significantly. I will tell you, as we look ahead in the next 3 to 5 years, and work with them on their planning, we don't see anything slowing down. If anything, we continue to see it accelerate.
Speaker 6
And then a question for Nick. As you guys scale up the E-Infrastructure business, how should we think about investments in working capital and free cash flow conversion?
Speaker 3
We expect to maintain strong free cash flow conversion. Conservatively, we anticipate free cash flow conversion to EBITDA in the 80% range or so, and that's a cautious estimate. We believe this trend will continue as we progress deeper into the E-Infrastructure space throughout the year.
Speaker 6
Okay. Back to Joe. Regarding capital allocation, you mentioned that there is an active share buyback program of $400 million that started last November. You also spoke about mergers and acquisitions, highlighting the availability of good assets in the market, which is a bit surprising as I haven't heard that in some time. While multiples are high, could you share your thoughts on your priorities? Should we consider this as a fourth pillar for the Sterling business? How do you view the allocation of capital, M&A, and this idea of an abundance of attractive acquisitions, especially since we've heard this in a few calls before? It would be helpful to understand your perspective on this.
Our focus is not necessarily on adding a fourth leg to the business. Instead, we are concentrating on the areas of data centers, semiconductors, pharmaceuticals, and other manufacturing, along with long-term projects. Over the next 5 to 7 years, we believe our best returns will come from growing and expanding our services and geographic presence within our infrastructure. While we are open to pursuing a fourth leg if the right opportunity arises, our current priorities are driven by the demands of our core customers for services and locations over the next 3 to 5 years. This means we are focusing on geographic expansion, site development, and enhancing our electrical capacity and services. We will also look at mechanical services in a natural progression. Regarding the abundance of quality businesses on the market, I believe there are two key reasons: first, multiples for these businesses have increased, and second, many owners see significant growth opportunities ahead but lack the capital to fund that growth. They feel that without teaming up with a larger partner, they risk being left out and potentially losing their projects.
Operator
And your next question comes from Alex Rygiel from Texas Capital.
Speaker 7
When you talk about manufacturing and high-tech and fab plants, can you just sort of help us to maybe understand how big that market opportunity could be sort of in the coming years?
We can start by discussing the semiconductor sector. I believe we are just beginning to see developments in this industry. I don't anticipate a significant influx of semiconductor projects until around 2030, due to the lengthy capital expenditure timelines required to get projects off the ground. However, there are some projects that will be launching soon. For perspective, our data center projects typically average around three years, whereas semiconductor plants will take closer to seven to ten years to complete, with total project scopes potentially reaching up to $1 billion, which is substantial for us. The pharmaceutical sector has announced several facilities nationwide, but it's important to understand that from announcement to actual operations can take three to five years due to the time required for land acquisition, permitting, and utility installation. Equipment purchases, particularly specialized equipment, can also have long lead times, ranging from two to five years depending on the industry components. We anticipate all of this coming. Meanwhile, our data center customers are not slowing down; they're planning larger and more numerous builds, engaging with us to secure capacity and capabilities. Our geographic expansion in the next 12 to 18 months is not solely based on current projects but on future opportunities we are preparing for with our customers. The Texas market is exceptionally active right now. The developments happening in Texas are remarkable, and we are strategically positioning ourselves from both the East and West. We have strong confidence in what Texas will contribute to our company over the next three to five years.
Operator
And your next question comes from Louie DiPalma from William Blair.
Speaker 8
Joe, you previously on past calls, you've discussed Sterling's entry into West Texas. Are you able to further expand into Texas to cover some other key markets? I know you said that you're attacking it from the East and attacking it from the West. Have you already won jobs on the East side of Texas and in other markets across the state?
Yes. Let me explain our approach to the market from both the East and the West to clarify any confusion. West Texas is experiencing rapid growth, and we're actively securing jobs there that we’ll announce in the first quarter. When I refer to the East, I'm thinking of the Dallas and Houston corridor, not the piney forest area of East Texas, where not much is happening at the moment, but there is potential. Our strategy involves leveraging our plateau business to begin penetrating what we refer to as East Texas. We are optimistic about our efforts in that region and believe we can deliver significant value. We plan to expand in various areas, including opportunities arising from the Texas market, while also looking into further growth possibilities in the Northeast and Pacific Northwest.
Speaker 8
That was great, Joe. Should investors view 2026 as a year for which you're focused in terms of your geographic expansion? You're focused mostly on Texas? Or are there other data center and mission-critical geographies outside of the Southeast and outside of Texas that you can potentially expand into for 2026?
In 2026, the majority of data center growth will occur in those regions. Currently, there's promising activity in the Northeast, and we're excited about some upcoming projects there. Additionally, in 2026, we plan to allocate more assets and resources to the Pacific Northwest, with several projects expected to be launched in 2027 that could be quite beneficial for us. We're still assessing entry into the Ohio and Indiana markets, which present potential opportunities, although we are not close to finalizing those plans. Looking at the Southeast, along with a few projects in the Northeast and Texas, most significant developments are aligned with our core customers and the scale of projects that suit our profile. In contrast, while the Mid-Atlantic has numerous data centers, they tend to be smaller and do not fit our strategic approach.
Speaker 8
And one final one related to this discussion for your entry into new markets. Is it reasonable to assume that the profitability in terms of the operating margins will be lower than the profitability for your core E-Infrastructure mission-critical business such that as investors and the sell-side as we're modeling should there be any negative impact from expanding into Texas and expanding into the Northwest? Or how should we consider that?
Yes, I think if we move our equipment from the Southeast to Texas, we will see the same margins. In the Rocky Mountain region, we've experienced slightly lower margins, not due to the market but because we are in the process of ramping up our equipment profile. We converted highway assets and some large assets to get them operational as we expand. Those margins will improve. When looking at acquisitions, we typically find that their margins are a bit lower than ours. However, once we integrate those acquisitions into our operations and apply our processes, procedures, and technology, we expect to enhance those margins to match ours. Additionally, it's important to remember that in our multiphase projects, which can span from 3 to 7 phases, the initial margins tend to be lower. These margins will improve based on productivity and our ability to stage earlier phases effectively to boost future productivity.
Operator
Your next question comes from Adam Thalhimer from Thomson Davidson.
Speaker 9
Nice quarter. Joe, can you talk more about the CEC modular expansion? Curious what that will take you to on a square footage basis? What exactly are you doing modularly versus in the field?
Yes. Our simple take on that is we're not the only ones doing modular, but anything we can take out of the field in prefab to move into the field reduces the number of electricians we need on that site, right? It also improves productivity and cost. The new facility is over 300,000 square feet. I will tell you that we're looking at does it or does it make sense to have multiple facilities throughout the U.S. that can make these components. We're doing everything from the exterior piping and conduit around the duct banks to the actual cabinets that go into these centers. We're looking at how to continue to expand that capability and growth. It's pretty exciting because when you run the numbers, it's significant on what it frees up for capacity and how it positively impacts your margins.
Speaker 9
Future of construction.
Speaker 9
I guess the future of construction.
Yes, I think we will see, regardless of us or our space or other spaces, you're going to continue to see modular activities grow as the labor pool just gets tighter and tighter. It's the most logical thing to do.
Speaker 9
And then just lastly, I wanted to see where your head was at on the residential bid. And does it make sense to do an acquisition there when multiples might be more depressed? Or does it just make sense to let that play out?
Yes, I think there are challenges ahead, especially in the first half of 2026. There isn't anything positive right now to help revive the residential business. I do want to note that once the market turns around, there will be 3 or 4 months of existing inventory that builders will need to sell before we see new construction begin. This is an important detail. However, we’re not far off from recovery. If a good acquisition opportunity arises in the residential sector, particularly since multiples are down and earnings are low, we remain optimistic for the long term. Historically, companies like Tealstone gained significant market share after the previous downturn, and we believe we will follow suit, especially in the Houston and Arizona markets. If we find the right acquisition at a substantial discount, it could yield great results for us in about 18 months.
Operator
And your last question comes from Julio Romero from Sidoti & Company.
Speaker 10
I wanted to stay on the topic of these projects getting bigger. As you said, Joe, they're not even data centers anymore. They're data center campuses. As these mission-critical projects get bigger and more complex, is the mix of above-ground work versus underground infrastructure changing at all? And if so, is that mix shift margin accretive?
Yes. I wouldn't say we've seen any significant shift on above-ground versus below ground. I think what we will see kind of the next generation of these projects will have self-power generation. That will create more development opportunities because if you have a power plant, you've got all the underground, whether it's water utilities, you've got the electrical coming in, all that stuff. We think that the size and scope of these projects, not only in physical size will get bigger, but the amount of work that we will touch will continue to grow. Those projects really won't start getting until '27 or '28. We may see one this year, but that's the lion's share. It also opens up opportunities to look at other goods and services that we can add to those projects.
Speaker 10
Got it. And does that change at all if the mix within mission-critical begins to skew over time to semiconductor and advanced manufacturing?
Yes, there isn't a significant difference. While data centers have duct banks, what many people overlook is that these facilities have thousands of miles of underground pipes, wires, and more. It's like an underground city. We're not worried if the emphasis shifts more towards semiconductors instead of data centers or manufacturing. We have more data regarding site development, and we’ve observed comparable margins historically. This is the strength of our model. As we continue to grow our electrical capabilities, our services are interchangeable. Large projects are definitely more beneficial for us, but we remain indifferent whether it's a data center, a chip plant, a large automotive facility, or a battery plant.
Speaker 10
Very helpful. I wanted to ask how Sterling is positioned amongst other specialty contractors with regards to AI-driven tools as these tools kind of become more adopted across the industry. Joe, how are you thinking about staying ahead of competitors? I'm sure some of those competitors would say they're probably using AI to narrow the gap of reliability or maybe scale versus Sterling. How do you see Sterling's position in that context? Could you be using these tools to maybe widen your differentiation versus some of these peers?
Yes. I certainly would not be able to see. I don't know where our peers are. I can tell you where we are. I think people would be shocked what we've done and what we're doing in and around AI and how we're tying that to not only the estimating and bid process, but the project execution. We did 3 pilots last year. To say the teams were excited when we first started them, everybody said, how is AI applicable to what we do? Remember, we're running drones. We're running all kinds of analytics of our equipment. We’re now tying all that into project management and making things happen faster. We picked up just in, remember, our capacity constraint in site development is project managers. We picked up somewhere between 15% to 20% of incremental capacity on project managers just from our first AI project. We’ve got 6 AI projects underway right now. I will tell you, when people talk about, well, is AI real and all that, I would say if companies like us are running very quickly at this and our guys, every time they touch it, they come up with 4 or 5 other things that we can incorporate which will improve the efficiency, effectiveness, quality, and just as importantly, there are some really cool things we're doing on the safety side with this that will help make our employees even safer than they are today.
Operator
And there are no further questions at this time. Mr. Joe Cutillo, you may continue.
Thank you. I want to thank everybody for joining today's call. If you have any follow-up questions, please contact Noelle Dilts. Her contact information is in the press release. I appreciate what our team did. Another great quarter, and have a great day.
Operator
Ladies and gentlemen, this does conclude your conference call for today. We thank you very much for your participation. You may now disconnect. Have a great day.