
TBLA 8-K
Taboola.com Ltd. (TBLA)
8-K
2023-02-24
For: 2023-02-24
View Original
Added on
April 04, 2026
UNITED STATES
SECURITIES AND EXCHANGE COMMISSION
WASHINGTON, D.C. 20549
FORM 8-K
CURRENT REPORT
PURSUANT TO SECTION 13 OR 15(D) OF THE
SECURITIES EXCHANGE ACT OF 1934
Date of report (Date of earliest event reported):
(Exact name of registrant as specified in its charter)
|
|
|
|
|
(State or Other Jurisdiction of Incorporation)
|
(Commission File Number)
|
(IRS Employer Identification Number)
|
(Address of principal executive offices, including zip code)
(Registrant’s telephone number, including area code)
N/A
(Former name or former address, if changed since last report)
Check the appropriate box below if the Form 8-K filing is intended to simultaneously satisfy the filing obligation of the registrant under any of the following provisions
(see General Instruction A.2. below):
|
Written communications pursuant to Rule 425 under the Securities Act (17 CFR 230.425)
|
|
Soliciting material pursuant to Rule 14a-12 under the Exchange Act (17 CFR 240.14a-12)
|
|
Pre-commencement communications pursuant to Rule 14d-2(b) under the Exchange Act (17 CFR 240.14d-2(b))
|
|
Pre-commencement communications pursuant to Rule 13e-4(c) under the Exchange Act (17 CFR 240.13e-4(c))
|
Securities registered pursuant to Section 12(b) of the Act:
|
Title of each class
|
Trading Symbol(s)
|
Name of each exchange on which registered
|
||
|
|
|
|
||
|
|
|
|
Indicate by check mark whether the registrant is an emerging growth company as defined in Rule 405 of the Securities Act of 1933 (§230.405 of this chapter) or Rule 12b-2 of
the Securities Exchange Act of 1934 (§240.12b-2 of this chapter).
Emerging growth company ☐
If an emerging growth company, indicate by check mark if the registrant has elected not to use the extended transition period for complying with any new or revised
financial accounting standards provided pursuant to Section 13(a) of the Exchange Act. ☐
| Item 2.02. |
Results of Operations and Financial Condition.
|
On February 24, 2023, Taboola.com Ltd. (the “Company” or “Taboola”) issued a press release announcing the Company’s financial results for the fourth quarter of and full year 2022. That press release is furnished herewith
as Exhibit 99.1 and is incorporated herein by reference.
| Item 7.01. |
Regulation FD Disclosure.
|
On February 24, 2023, the Company made available a shareholder letter, investor presentation and prepared remarks from its Chief Executive Officer and Chief Financial
Officer providing highlights of the Company’s fourth quarter of and full year 2022 financial results and related information, which is being made available in connection with the February 24, 2023 earnings conference call. A copy of the shareholder
letter, investor presentation and prepared remarks are furnished herewith as Exhibits 99.2, 99.3 and 99.4, respectively, and are incorporated herein by reference.
The information furnished with this Form 8-K, including Exhibits 99.1, 99.2, 99.3 and 99.4, shall not be deemed “filed” for purposes of Section 18 of
the Securities Exchange Act of 1934, as amended (the “Exchange Act”), or otherwise subject to the liabilities of that section, nor shall it be deemed incorporated by reference into any other filing under the Securities Act of 1933, as amended, or the
Exchange Act, except as expressly set forth by specific reference in such a filing.
| Item 9.01. |
Financial Statement and Exhibits.
|
(d) Exhibits
TABLE OF CONTENTS
| Exhibit No. |
Description |
|
|
Press Release dated February 24, 2023
|
||
|
Letter to Shareholders dated February 24, 2023
|
||
|
Investor presentation dated February 24, 2023
|
||
|
Prepared Remarks dated February 24, 2023
|
||
| 104 |
Cover page of this Current Report on Form 8-K formatted in Inline XBRL |
SIGNATURE
Pursuant to the requirements of the Securities Exchange Act of 1934, the registrant has duly caused this report to be signed on its
behalf by the undersigned, thereunto duly authorized.
|
TABOOLA.COM LTD.
|
|||
|
By:
|
/s/ Stephen Walker
|
||
|
Name:
|
Stephen Walker
|
||
|
Title:
|
Chief Financial Officer
|
||
|
Date: February 24, 2023
|
|||
Exhibit 99.1
Taboola Meets Guidance for Q4 and FY2022; Guiding for Positive Free Cash Flow in 2023 and $100M+ in 2024 (partial Yahoo rollout)
| - |
2022 Revenues of $1,401.2M, Gross Profit of $464.3M, ex-TAC Gross Profit of $569.6M, Net Loss of $12.0M, and Adjusted EBITDA of $156.7M were all around mid-point of guidance while
Non-GAAP Net Income of $91.4M exceeded our guidance.
|
| - |
Free Cash Flow in 2022 of $18.6M after paying publishers $15.3M in net prepayments** and $20.7M in cash interest payments.
|
| - |
2023 is assumed to be pre Yahoo rollout and 2024 will have partial Yahoo revenue contribution.
|
| - |
2023 guidance assumes an investment year to support Yahoo transition and growth initiatives - Revenues of $1,419M - $1,469M, Gross Profit of $416M - $436M, ex-TAC Gross Profit of
$526M - $546M, Adjusted EBITDA of $60M - $80M and Non-GAAP Net Income (loss) of ($10M) - $10M. Positive Free Cash Flow.
|
| - |
2024 guidance assumes investments will pay off: at least $200M Adjusted EBITDA, at least $100M Free Cash Flow.
|
New York, NY, February 24, 2023 -- Taboola (Nasdaq: TBLA), a global leader in powering recommendations for the open web, helping people discover things they may like, today
announced its results for the quarter and year ended December 31, 2022.
“While 2022 was a challenging year for advertising spend, our financial performance was solid. It was our second best year in adding new publisher partnerships – over 90%
higher in new revenue per month than in previous years, including winning back some key publishers that previously left us. And of course, we signed a transformative 30-year partnership with Yahoo,” said Adam Singolda, CEO and Founder, Taboola.
“2023 will be a year of investment for us. It’s hard to accept declines this year; we will return to growth in the second half of 2023 and, while it’s very rare that
management teams know what the future will look like, 2024 will be a step change in revenue with Yahoo ramping. In 2024, we expect to generate at least $200M in Adjusted EBITDA and $100M in Free Cash Flow, even though it will be a partial year of
Yahoo. I’m also energized by the progress we are making on our top company priorities of performance advertising, eCommerce and header bidding - these will drive significant growth in 2024 and beyond. I believe in 2024, Taboola will become the
largest open web advertising company in the world by revenue, with scale similar to Snap, Pinterest and Twitter” continued Singolda.
1
For more commentary on the quarter, please refer to Taboola’s Q4 2022 Shareholder Letter, which was furnished to the SEC and also posted on Taboola’s website today at
https://investors.taboola.com.
In addition, we are excited to invite you to Taboola’s Yahoo Information Session, where we will provide additional
information on our recently closed 30-year commercial relationship with Yahoo. The event will take place on Wednesday, March 1st at 10:00 a.m. EST at Taboola’s U.S. Headquarters in New York. A webcast of the event, along with supporting materials, will be accessible live through the
Investor Relations section of Taboola’s website at www.taboola.com/about/investors. As space for the event is
limited, in-person attendance is by invitation only and advance registration is required. Current and prospective investors interested in attending are encouraged to contact Taboola Investor Relations at [email protected].
Fourth Quarter and Full Year 2022 Results Summary
|
(dollars in millions, except per share data)
|
Three months ended
December 31,
|
Year ended
December 31,
|
||||||||||||||||||||||
|
2022
|
2021
|
2022
|
2021
|
% change
Q4 YoY
|
% change
FY22 YoY
|
|||||||||||||||||||
|
Unaudited
|
||||||||||||||||||||||||
|
Revenues
|
$
|
371.3
|
$
|
407.7
|
$
|
1,401.2
|
$
|
1,378.5
|
(8.9
|
%)
|
1.6
|
%
|
||||||||||||
|
Gross profit
|
$
|
133.2
|
$
|
143.6
|
$
|
464.3
|
$
|
441.1
|
(7.3
|
%)
|
5.3
|
%
|
||||||||||||
|
Net income (loss)
|
$
|
15.2
|
$
|
0.6
|
$
|
(12.0
|
)
|
$
|
(24.9
|
)
|
NM
|
(52.0
|
%)
|
|||||||||||
|
EPS diluted (1)
|
$
|
0.06
|
$
|
0.00
|
$
|
(0.05
|
)
|
$
|
(0.26
|
)
|
NM
|
(81.8
|
%)
|
|||||||||||
|
Ratio of net income (loss) to gross profit
|
11.4
|
%
|
0.4
|
%
|
(2.6
|
%)
|
(5.7
|
%)
|
—
|
—
|
||||||||||||||
|
Cash flow provided by operating activities
|
$
|
20.1
|
$
|
23.0
|
$
|
53.5
|
$
|
63.5
|
(12.7
|
%)
|
(15.8
|
%)
|
||||||||||||
|
Cash, cash equivalents and short-term investments
|
$
|
262.8
|
$
|
319.3
|
$
|
262.8
|
$
|
319.3
|
(17.7
|
%)
|
(17.7
|
%)
|
||||||||||||
|
Non-GAAP Financial Data *
|
||||||||||||||||||||||||
|
ex-TAC Gross Profit
|
$
|
158.9
|
$
|
169.2
|
$
|
569.6
|
$
|
518.9
|
(6.1
|
%)
|
9.8
|
%
|
||||||||||||
|
Adjusted EBITDA
|
$
|
63.5
|
$
|
65.4
|
$
|
156.7
|
$
|
179.5
|
(2.9
|
%)
|
(12.7
|
%)
|
||||||||||||
|
Non-GAAP Net Income (2)
|
$
|
43.3
|
$
|
33.8
|
$
|
91.4
|
$
|
113.6
|
27.9
|
%
|
(19.5
|
%)
|
||||||||||||
|
IPO Pro forma Non-GAAP EPS diluted (3)
|
$
|
0.164
|
$
|
0.124
|
$
|
0.352
|
$
|
0.453
|
32.1
|
%
|
(22.3
|
%)
|
||||||||||||
|
Ratio of Adjusted EBITDA to ex-TAC Gross Profit
|
40.0
|
%
|
38.6
|
%
|
27.5
|
%
|
34.6
|
%
|
—
|
—
|
||||||||||||||
|
Free Cash Flow
|
$
|
13.6
|
$
|
12.7
|
$
|
18.6
|
$
|
24.5
|
7.5
|
%
|
(24.1
|
%)
|
||||||||||||
1 The weighted-average shares used in the computation of the diluted
EPS for the three months ended December 31, 2022 and 2021 are 263,160,470 and 271,857,016, respectively, and for the year ended December 31, 2022 and 2021 are 254,284,781 and 142,883,475, respectively.
2 Three months and year ended December 31, 2021 have been adjusted to
include the impact of foreign currency exchange rates to be consistent with current period presentation.
3 See Appendix for a description and calculation of IPO Pro forma
Non-GAAP EPS basic and diluted.
2
Fourth Quarter and Full Year 2022 Financial Highlights
Q4 and FY 2022 results were around mid-point of guidance across all financial measures except
Non-GAAP Net Income which exceeded our guidance.
|
(dollars in millions)
|
Q4 2022
Actuals
|
Q4 2022
Guidance
|
FY 2022
Actuals
|
FY 2022
Guidance
|
||||||||||||
|
Revenues
|
$
|
371.3
|
$
|
358 - $374
|
$
|
1,401.2
|
$
|
1,388 - $1,404
|
||||||||
|
Gross profit
|
$
|
133.2
|
$
|
127 - $139
|
$
|
464.3
|
$
|
458 - $470
|
||||||||
|
ex-TAC Gross Profit*
|
$
|
158.9
|
$
|
153- $165
|
$
|
569.6
|
$
|
564 - $576
|
||||||||
|
Adjusted EBITDA*
|
$
|
63.5
|
$
|
59 - $67
|
$
|
156.7
|
$
|
152 - $160
|
||||||||
|
Non-GAAP Net Income*
|
$
|
43.3
|
$
|
35 - $43
|
$
|
91.4
|
$
|
83 - $91
|
||||||||
Business Highlights for 2022
| ○ |
In Q4 ‘22 versus the prior year, new digital property partners1 increased by $34.6 million of Revenues and existing digital property partners2 decreased by $71.0 million of
Revenues.
|
| ○ |
New publisher partnerships revenue added per month was over 90% higher in 2022 than the average of 2020 and 2021 and the second highest rate on record.
|
| ○ |
New publisher partners signed included competitive wins such as Slate, Buzzfeed Japan, HuffPo Japan, Prisa, Grupo Godó, Network18, United Internet Media, Dumont and Kodansha as well as publisher
partners that had previously left us, such as Slate, Kicker (Germany) and Ouest (France).
|
| ○ |
Signed key renewals with partners including CBSi, Tegna, Fox Sports, Grupo RBS, Der Standard, Milenio Diario and Telemundo.
|
| ○ |
Announced our transformative 30-year partnership with Yahoo.
|
| ○ |
Announced momentum for Taboola Header Bidding, now used by over 50 publishers around the world, including McClatchy, Ströer and iMedia.
|
1 New digital property partners within the first 12 months that
were live on our network.
2 Net growth of existing digital property partners, including the growth of new digital property partners (beyond the revenue contribution determined based on
the run-rate revenue generated by them when they are first on-boarded).
3
First Quarter and Full Year 2023 Guidance
For the First Quarter and Full Year 2023, the Company currently expects:
|
(dollars in millions)
|
Q1 2023
Guidance
|
FY 2023
Guidance
|
||||||
| Unaudited |
||||||||
| (dollars in millions) |
||||||||
|
Revenues
|
|
$299 - $325
|
|
$1,419 - $1,469
|
||||
|
Gross profit
|
|
$76 - $88
|
|
$416 - $436
|
||||
|
ex-TAC Gross Profit*
|
$103 - $115
|
|
$526 - $546
|
|||||
|
Adjusted EBITDA*
|
($6) - $6
|
|
|
$60 - $80
|
||||
|
Non-GAAP Net Income (loss)*
|
($23) - ($11)
|
|
|
($10) - $10
|
|
|||
Our outlook assumes that the macro economy continues to be challenged but does not meaningfully deteriorate and that, as a result, the current softness in the online
advertising market continues but does not worsen. In addition, we assume a substantial ramp in investment related to our Yahoo partnership agreement but, to be conservative, do not factor in the associated revenue. It also assumes continued
investment in our key company priorities of performance advertising, eCommerce and Header Bidding. Finally, when looking at Q1 2023 growth rates, a year on year comparison is distorted due to an unusually strong first half of 2022 and a weaker second
half of 2022, which negatively impacted our run rate coming into 2023.
Although we provide guidance for Adjusted EBITDA and Non-GAAP Net Income (loss), we are not able to provide guidance for projected net income (loss), the most directly
comparable GAAP measure. Certain elements of net income (loss), including share-based compensation expenses and warrant valuations, are not predictable due to the high variability and difficulty of making accurate forecasts. As a result, it is
impractical for us to provide guidance on net income (loss) or to reconcile our Adjusted EBITDA and Non-GAAP Net Income (loss) guidance without unreasonable efforts. Consequently, no disclosure of projected net income (loss) is included. For the same
reasons, we are unable to address the probable significance of the unavailable information.
4
Webcast Details
Taboola’s senior management team will discuss the Company’s earnings on a call that will take place on February 24, 2023, at 8:30 AM ET. The call can be accessed via
webcast at https://investors.taboola.com. To access the call by phone, please go to this link to register https://register.vevent.com/register/BI2d9c0edd185d48d1940ab1823ab1abbd and you will be provided with dial in details.
The webcast will be available for replay for one year, through the close of business on February 23, 2024.
*About Non-GAAP Financial Information
This press release includes ex-TAC Gross Profit, Adjusted EBITDA, Ratio of Adjusted EBITDA to ex-TAC Gross Profit, Free Cash Flow, Non-GAAP Net Income (loss), Non-GAAP EPS
basic and diluted and IPO Pro forma Non-GAAP EPS basic and diluted, which are non-GAAP financial measures. These non-GAAP financial measures are not measures of financial performance in accordance with GAAP and may exclude items that are significant
in understanding and assessing the Company’s financial results. Therefore, these measures should not be considered in isolation or as an alternative to revenues, gross profit, earnings per share, net income (loss), cash flows from operations or other
measures of profitability, liquidity or performance under GAAP. You should be aware that the Company’s presentation of these measures may not be comparable to similarly-titled measures used by other companies.
The Company believes non-GAAP financial measures provide useful supplemental information to management and investors regarding future financial and business trends relating
to the Company. The Company believes that the use of these measures provides an additional tool for investors to use in evaluating operating results and trends and in comparing the Company’s financial measures with other similar companies, many of
which present similar non-GAAP financial measures to investors. Non-GAAP financial measures are subject to inherent limitations because they reflect the exercise of judgments by management about which items are excluded or included in calculating
them, which may vary from period to period. Please refer to the appendix at the end of this press release for reconciliations to the most directly comparable measures in accordance with GAAP.
**About Cash Investment in Publisher Prepayments
(Net)
We calculate cash investment in publisher prepayments (net) for a specific measurement period as the gross amount of cash publisher prepayments we made in that measurement
period minus the amortization of publisher prepayments that were included in traffic acquisition cost during that measurement period, which were the result of cash publisher prepayments made in that measurement period and previous periods.
5
Note Regarding Forward-Looking Statements
Certain statements in this press release are forward-looking statements. Forward-looking statements generally relate to future events including future financial or
operating performance of Taboola.com Ltd. (the “Company”). In some cases, you can identify forward-looking statements by terminology such as “may”, “should”, “expect”, “guidance”, “intend”, “will”, “estimate”, “anticipate”, “believe”, “predict”,
“target”, “potential” or “continue”, or the negatives of these terms or variations of them or similar terminology. Such forward-looking statements are subject to risks, uncertainties, and other factors which could cause actual results to differ
materially from those expressed or implied by such forward looking statements.
These forward-looking statements are based upon estimates and assumptions that, while considered reasonable by the Company and its management, are inherently uncertain.
Uncertainties and risk factors that could affect the Company’s future performance and cause results to differ from the forward-looking statements in this press release include, but are not limited to: the ability to recognize the anticipated benefits
of the Connexity acquisition and the business combination between the Company and ION Acquisition Corp. 1 Ltd. (together, the “Business Combinations”), which may be affected by, among other things, competition, the ability of the Company to grow and
manage growth profitably, maintain relationships with customers and retain its management and key employees; the Company’s ability to successfully integrate the Connexity acquisition; costs related to the Business Combinations; changes in applicable
laws or regulations; the Company’s estimates of expenses and profitability and underlying assumptions with respect to accounting presentations and purchase price and other adjustments; the Company’s
ability to transition to and fully launch the native advertising service for Yahoo on the currently anticipated schedule or at all; the ability to generate or achieve the increase in Adjusted EBITDA and Free Cash Flow in 2024 to the levels assumed
in this press release or at all; the ability to become the largest open web advertising company in the world by revenue; ability to attract new digital properties and advertisers; ability to meet minimum guarantee requirements in contracts
with digital properties; intense competition in the digital advertising space, including with competitors who have significantly more resources; ability to grow and scale the Company’s ad and content platform through new relationships with
advertisers and digital properties; ability to secure high quality content from digital properties; ability to maintain relationships with current advertiser and digital property partners; ability to prioritize investments to improve profitability
and free cash flow; ability to make continued investments in the Company’s AI-powered technology platform; the need to attract, train and retain highly-skilled technical workforce; changes in the regulation of, or market practice with respect to,
“third party cookies” and its impact on digital advertising; continued engagement by users who interact with the Company’s platform on various digital properties; the impact of the ongoing COVID-19 pandemic and other potential public health
emergencies; reliance on a limited number of partners for a significant portion of the Company’s revenue; changes in laws and regulations related to privacy, data protection, advertising regulation, competition and other areas related to digital
advertising; ability to enforce, protect and maintain intellectual property rights; and risks related to the fact that we are incorporated in Israel and governed by Israeli law; and other risks and uncertainties set forth in the Company’s Annual
Report on Form 20-F for the year ended December 31, 2021 under Item 3.D. “Information About the Company - Risk Factors” and in the Company’s subsequent filings with the Securities and Exchange Commission.
6
Nothing in this press release should be regarded as a representation by any person that the forward-looking statements set forth herein will be achieved or that any of the
contemplated results of such forward-looking statements will be achieved. You should not place undue reliance on these forward-looking statements, which speak only as of the date they were made. The Company undertakes no duty to update these
forward-looking statements except as may be required by law.
About Taboola
Taboola powers recommendations for the open web, helping people discover things they may like.
The Company’s platform, powered by artificial intelligence, is used by digital properties, including websites, devices and mobile apps, to drive monetization and user
engagement. Taboola has long-term partnerships with some of the top digital properties in the world, including CNBC, BBC, NBC News, Business Insider, The Independent and El Mundo.
Approximately 18,000 advertisers use Taboola to reach over 500 million daily active users in a brand-safe environment. Following the acquisition of Connexity in 2021,
Taboola is a leader in powering e-commerce recommendations, driving more than 1 million monthly transactions each month. Leading brands, including Walmart, Macy’s, Wayfair, Skechers and eBay are among key customers.
Learn more at www.taboola.com and follow @taboola on Twitter.
|
Investor Contact:
|
Press Contact:
|
|
Rick Hoss
|
Dave Struzzi
|
7
CONSOLIDATED BALANCE SHEETS
U.S. dollars in thousands, except share and per share data
|
December 31,
|
December 31,
|
|||||||
|
2022
|
2021
|
|||||||
|
ASSETS
|
||||||||
|
CURRENT ASSETS
|
||||||||
|
Cash and cash equivalents
|
$
|
165,893
|
$
|
319,319
|
||||
|
Short-term investments
|
96,914
|
—
|
||||||
|
Restricted deposits
|
750
|
1,000
|
||||||
|
Trade receivables (net of allowance for credit losses of $6,748 and $3,895 as of December 31, 2022 and 2021, respectively)
|
256,708
|
245,235
|
||||||
|
Prepaid expenses and other current assets
|
73,643
|
63,394
|
||||||
|
Total current assets
|
593,908
|
628,948
|
||||||
|
NON-CURRENT ASSETS
|
||||||||
|
Long-term prepaid expenses
|
42,945
|
32,926
|
||||||
|
Restricted deposits
|
4,059
|
3,897
|
||||||
|
Deferred tax assets, net
|
3,821
|
1,876
|
||||||
|
Operating lease right of use assets
|
66,846
|
65,105
|
||||||
|
Property and equipment, net
|
73,019
|
63,259
|
||||||
|
Intangible assets, net
|
189,156
|
250,923
|
||||||
|
Goodwill
|
555,869
|
550,380
|
||||||
|
Total non-current assets
|
935,715
|
968,366
|
||||||
|
Total assets
|
$
|
1,529,623
|
$
|
1,597,314
|
||||
8
CONSOLIDATED BALANCE SHEETS
U.S. dollars in thousands, except share and per share data
|
December 31,
|
December 31,
|
|||||||
|
2022
|
2021
|
|||||||
|
LIABILITIES AND SHAREHOLDERS’ EQUITY
|
||||||||
|
CURRENT LIABILITIES
|
||||||||
|
Trade payables
|
$
|
247,504
|
$
|
259,941
|
||||
|
Short-term operating lease liabilities
|
14,753
|
12,958
|
||||||
|
Accrued expenses and other current liabilities
|
102,965
|
124,662
|
||||||
|
Current maturities of long-term loan
|
3,000
|
3,000
|
||||||
|
Total current liabilities
|
368,222
|
400,561
|
||||||
|
LONG-TERM LIABILITIES
|
||||||||
|
Long-term loan, net of current maturities
|
223,049
|
285,402
|
||||||
|
Long-term operating lease liabilities
|
57,928
|
61,526
|
||||||
|
Warrants liability
|
6,756
|
31,227
|
||||||
|
Other long-term and deferred tax liabilities, net
|
39,133
|
51,027
|
||||||
|
Total long-term liabilities
|
326,866
|
429,182
|
||||||
|
SHAREHOLDERS’ EQUITY
|
||||||||
|
Ordinary shares with no par value- Authorized: 700,000,000 as of December 31, 2022 and 2021; 254,133,863 and 234,031,749 shares issued and
outstanding as of December 31, 2022 and 2021, respectively.
|
—
|
—
|
||||||
|
Additional paid-in capital
|
903,789
|
824,016
|
||||||
|
Accumulated other comprehensive loss
|
(834
|
)
|
—
|
|||||
|
Accumulated deficit
|
(68,420
|
)
|
(56,445
|
)
|
||||
|
Total shareholders’ equity
|
834,535
|
767,571
|
||||||
|
Total liabilities and shareholders’ equity
|
$
|
1,529,623
|
$
|
1,597,314
|
||||
9
CONSOLIDATED STATEMENTS OF INCOME (LOSS)
U.S. dollars in thousands, except share and per share data
|
Three months ended
December 31,
|
Year ended
December 31,
|
|||||||||||||||
|
2022
|
2021
|
2022
|
2021
|
|||||||||||||
|
Unaudited
|
||||||||||||||||
|
Revenues
|
$
|
371,267
|
$
|
407,668
|
$
|
1,401,150
|
$
|
1,378,458
|
||||||||
|
Cost of revenues:
|
||||||||||||||||
|
Traffic acquisition cost
|
212,399
|
238,458
|
831,508
|
859,595
|
||||||||||||
|
Other cost of revenues
|
25,694
|
25,568
|
105,389
|
77,792
|
||||||||||||
|
Total cost of revenues
|
238,093
|
264,026
|
936,897
|
937,387
|
||||||||||||
|
Gross profit
|
133,174
|
143,642
|
464,253
|
441,071
|
||||||||||||
|
Operating expenses:
|
||||||||||||||||
|
Research and development
|
28,548
|
34,044
|
129,276
|
117,933
|
||||||||||||
|
Sales and marketing
|
55,814
|
59,127
|
246,803
|
206,089
|
||||||||||||
|
General and administrative
|
23,777
|
31,826
|
101,839
|
130,314
|
||||||||||||
|
Total operating expenses
|
108,139
|
124,997
|
477,918
|
454,336
|
||||||||||||
|
Operating income (loss)
|
25,035
|
18,645
|
(13,665
|
)
|
(13,265
|
)
|
||||||||||
|
Finance income (expenses), net
|
(3,176
|
)
|
(1,783
|
)
|
9,213
|
11,293
|
||||||||||
|
Income (loss) before income taxes
|
21,859
|
16,862
|
(4,452
|
)
|
(1,972
|
)
|
||||||||||
|
Income tax expenses
|
(6,675
|
)
|
(16,277
|
)
|
(7,523
|
)
|
(22,976
|
)
|
||||||||
|
Net income (loss)
|
$
|
15,184
|
$
|
585
|
$
|
(11,975
|
)
|
$
|
(24,948
|
)
|
||||||
|
Less: Undistributed earnings allocated to participating securities
|
—
|
—
|
—
|
(11,944
|
)
|
|||||||||||
|
Net income (loss) attributable to Ordinary shares – basic and diluted
|
15,184
|
585
|
(11,975
|
)
|
(36,892
|
)
|
||||||||||
|
Net income (loss) per share attributable to Ordinary shareholders, basic
|
$
|
0.06
|
$
|
0.00
|
$
|
(0.05
|
)
|
$
|
(0.26
|
)
|
||||||
|
Weighted-average shares used in computing net income (loss) per share attributable to Ordinary shareholders, basic
|
261,922,644
|
243,850,858
|
254,284,781
|
142,883,475
|
||||||||||||
|
Net income (loss) per share attributable to Ordinary shareholders, diluted
|
$
|
0.06
|
$
|
0.00
|
$
|
(0.05
|
)
|
$
|
(0.26
|
)
|
||||||
|
Weighted-average shares used in computing net income (loss) per share attributable to Ordinary shareholders, diluted
|
263,160,470
|
271,857,016
|
254,284,781
|
142,883,475
|
||||||||||||
10
CONSOLIDATED STATEMENTS OF COMPREHENSIVE INCOME (LOSS)
U.S. dollars in thousands
|
Three months ended
December 31,
|
Year ended
December 31,
|
|||||||||||||||
|
2022
|
2021
|
2022
|
2021
|
|||||||||||||
|
Unaudited
|
||||||||||||||||
|
Net income (loss)
|
$
|
15,184
|
$
|
585
|
$
|
(11,975
|
)
|
$
|
(24,948
|
)
|
||||||
|
Other comprehensive income (loss):
|
||||||||||||||||
|
Unrealized gains (losses) on available-for-sale marketable securities
|
183
|
—
|
(521
|
)
|
—
|
|||||||||||
|
Unrealized gains (losses) on derivative instruments, net
|
1,707
|
—
|
(313
|
)
|
—
|
|||||||||||
|
Other comprehensive income (loss)
|
1,890
|
—
|
(834
|
)
|
—
|
|||||||||||
|
Comprehensive income (loss)
|
$
|
17,074
|
$
|
585
|
$
|
(12,809
|
)
|
$
|
(24,948
|
)
|
||||||
11
SHARE-BASED COMPENSATION BREAK-DOWN BY EXPENSE LINE
U.S. dollars in thousands
|
Three months ended
December 31,
|
Year ended
December 31,
|
|||||||||||||||
|
2022
|
2021
|
2022
|
2021
|
|||||||||||||
|
Unaudited
|
||||||||||||||||
|
Cost of revenues
|
$
|
865
|
$
|
794
|
$
|
3,092
|
$
|
1,891
|
||||||||
|
Research and development
|
5,545
|
8,738
|
26,433
|
29,022
|
||||||||||||
|
Sales and marketing
|
4,264
|
4,518
|
22,615
|
44,834
|
||||||||||||
|
General and administrative
|
5,276
|
9,473
|
22,781
|
52,210
|
||||||||||||
|
Total share-based compensation expenses
|
$
|
15,950
|
$
|
23,523
|
$
|
74,921
|
$
|
127,957
|
||||||||
DEPRECIATION AND AMORTIZATION BREAK-DOWN BY EXPENSE LINE
U.S. dollars in thousands
|
Three months ended
December 31,
|
Year ended
December 31,
|
|||||||||||||||
|
2022
|
2021
|
2022
|
2021
|
|||||||||||||
|
Unaudited
|
||||||||||||||||
|
Cost of revenues
|
$
|
8,160
|
$
|
8,590
|
$
|
33,349
|
$
|
27,417
|
||||||||
|
Research and development
|
474
|
704
|
2,468
|
3,574
|
||||||||||||
|
Sales and marketing
|
13,240
|
13,709
|
54,157
|
21,267
|
||||||||||||
|
General and administrative
|
636
|
58
|
1,247
|
853
|
||||||||||||
|
Total depreciation and amortization expense
|
$
|
22,510
|
$
|
23,061
|
$
|
91,221
|
$
|
53,111
|
||||||||
12
CONSOLIDATED STATEMENTS OF CASH FLOWS
U.S. dollars in thousands
|
Three months ended
December 31,
|
Year ended
December 31,
|
|||||||||||||||
|
2022
|
2021
|
2022
|
2021
|
|||||||||||||
|
Unaudited
|
||||||||||||||||
|
Cash flows from operating activities
|
||||||||||||||||
|
Net income (loss)
|
$
|
15,184
|
$
|
585
|
$
|
(11,975
|
)
|
$
|
(24,948
|
)
|
||||||
|
Adjustments to reconcile net income (loss) to net cash flows provided by operating activities:
|
||||||||||||||||
|
Depreciation and amortization
|
22,510
|
23,061
|
91,221
|
53,111
|
||||||||||||
|
Share-based compensation expenses
|
15,950
|
23,523
|
74,921
|
127,957
|
||||||||||||
|
Net loss (gain) from financing expenses
|
(3,257
|
)
|
(463
|
)
|
4,476
|
(2,320
|
)
|
|||||||||
|
Revaluation of the Warrants liability
|
2,517
|
(5,565
|
)
|
(24,471
|
)
|
(22,656
|
)
|
|||||||||
|
Amortization of loan issuance costs and credit facility issuance costs
|
1,003
|
283
|
2,009
|
402
|
||||||||||||
|
Amortization of premium and accretion of discount on short-term investments, net
|
(357
|
)
|
—
|
(679
|
)
|
—
|
||||||||||
|
Change in operating assets and liabilities:
|
||||||||||||||||
|
Increase in trade receivables, net
|
(71,914
|
)
|
(54,657
|
)
|
(11,242
|
)
|
(40,113
|
)
|
||||||||
|
Decrease (increase) in prepaid expenses and other current assets and long-term prepaid expenses
|
3,136
|
(26,544
|
)
|
(10,785
|
)
|
(64,923
|
)
|
|||||||||
|
Increase (decrease) in trade payables
|
37,834
|
52,663
|
(16,825
|
)
|
23,862
|
|||||||||||
|
Increase (decrease) in accrued expenses and other current liabilities and other long-term liabilities
|
3,584
|
14,026
|
(21,932
|
)
|
16,182
|
|||||||||||
|
Decrease in deferred taxes, net
|
(7,653
|
)
|
(4,297
|
)
|
(17,329
|
)
|
(1,581
|
)
|
||||||||
|
Change in operating lease right of use assets
|
3,992
|
3,651
|
15,528
|
14,529
|
||||||||||||
|
Change in operating lease liabilities
|
(2,471
|
)
|
(3,298
|
)
|
(19,433
|
)
|
(15,981
|
)
|
||||||||
|
Net cash provided by operating activities
|
20,058
|
22,968
|
53,484
|
63,521
|
||||||||||||
|
Cash flows from investing activities
|
||||||||||||||||
|
Purchase of property and equipment, including capitalized internal-use software
|
(6,438
|
)
|
(10,296
|
)
|
(34,914
|
)
|
(39,070
|
)
|
||||||||
|
Cash paid in connection with acquisitions, net of cash acquired
|
—
|
(171
|
)
|
(7,981
|
)
|
(583,457
|
)
|
|||||||||
|
Proceeds from (investments in) restricted deposits
|
(7
|
)
|
(258
|
)
|
91
|
2,067
|
||||||||||
|
Investments in (purchase of) short-term investments
|
1
|
—
|
(126,381
|
)
|
—
|
|||||||||||
|
Proceeds from sales and maturities of short-term investments
|
23,464
|
—
|
29,624
|
—
|
||||||||||||
|
Net cash provided by (used in) investing activities
|
17,020
|
(10,725
|
)
|
(139,561
|
)
|
(620,460
|
)
|
|||||||||
|
Cash flows from financing activities
|
||||||||||||||||
|
Exercise of options and vested RSUs
|
920
|
2,539
|
8,387
|
10,018
|
||||||||||||
|
Issuance of Ordinary shares, net of offering costs
|
—
|
(792
|
)
|
—
|
285,378
|
|||||||||||
|
Payment of tax withholding for share-based compensation expenses
|
(1,641
|
)
|
(6,152
|
)
|
(5,751
|
)
|
(6,152
|
)
|
||||||||
|
Proceeds from long-term loan, net of debt issuance costs
|
—
|
—
|
—
|
288,750
|
||||||||||||
|
Repayment of long-term loan
|
(62,014
|
)
|
(750
|
)
|
(64,264
|
)
|
(750
|
)
|
||||||||
|
Costs associated with entering into a revolving credit facility
|
(184
|
)
|
—
|
(1,245
|
)
|
—
|
||||||||||
|
Issuance of Warrants
|
—
|
—
|
—
|
53,883
|
||||||||||||
|
Net cash provided by (used in) financing activities
|
(62,919
|
)
|
(5,155
|
)
|
(62,873
|
)
|
631,127
|
|||||||||
|
Exchange rate differences on balances of cash and cash equivalents
|
3,257
|
463
|
(4,476
|
)
|
2,320
|
|||||||||||
|
Increase (decrease) in cash and cash equivalents
|
(22,584
|
)
|
7,551
|
(153,426
|
)
|
76,508
|
||||||||||
|
Cash and cash equivalents - at the beginning of the period
|
188,477
|
311,768
|
319,319
|
242,811
|
||||||||||||
|
Cash and cash equivalents - at end of the period
|
$
|
165,893
|
$
|
319,319
|
$
|
165,893
|
$
|
319,319
|
||||||||
13
|
Three months ended
December 31,
|
Year ended
December 31,
|
|||||||||||||||
|
2022
|
2021
|
2022
|
2021
|
|||||||||||||
|
Unaudited
|
||||||||||||||||
|
Supplemental disclosures of cash flow information:
|
||||||||||||||||
|
Cash paid during the year for:
|
||||||||||||||||
|
Income taxes
|
$
|
6,199
|
$
|
1,997
|
$
|
28,798
|
$
|
15,475
|
||||||||
|
Interest
|
$
|
5,618
|
$
|
—
|
$
|
20,712
|
$
|
1,125
|
||||||||
|
Non-cash investing and financing activities:
|
||||||||||||||||
|
Purchase of property and equipment, including capitalized internal-use software
|
$
|
1,657
|
$
|
1,120
|
$
|
1,657
|
$
|
1,120
|
||||||||
|
Share-based compensation included in capitalized internal-use software
|
$
|
472
|
$
|
382
|
$
|
1,932
|
$
|
783
|
||||||||
|
Creation of operating lease right-of-use assets
|
$
|
5,621
|
$
|
6,902
|
$
|
17,269
|
$
|
4,520
|
||||||||
|
Fair value of Ordinary shares issued as consideration of the acquisition
|
$
|
—
|
$
|
—
|
$
|
—
|
$
|
157,689
|
||||||||
14
APPENDIX A: Non-GAAP Reconciliation
RECONCILIATION OF GAAP TO NON-GAAP FINANCIAL MEASURES FOR Q4 AND FULL YEARS ENDED DECEMBER 31, 2022 AND 2021 (Unaudited)
The following table provides a reconciliation of revenues to ex-TAC Gross Profit.
|
Three months ended
December 31,
|
Year ended
December 31,
|
|||||||||||||||
|
2022
|
2021
|
2022
|
2021
|
|||||||||||||
|
(dollars in thousands)
|
||||||||||||||||
|
Revenues
|
$
|
371,267
|
$
|
407,668
|
$
|
1,401,150
|
$
|
1,378,458
|
||||||||
|
Traffic acquisition cost
|
212,399
|
238,458
|
831,508
|
859,595
|
||||||||||||
|
Other cost of revenues
|
25,694
|
25,568
|
105,389
|
77,792
|
||||||||||||
|
Gross profit
|
$
|
133,174
|
$
|
143,642
|
$
|
464,253
|
$
|
441,071
|
||||||||
|
Add back: Other cost of revenues
|
25,694
|
25,568
|
105,389
|
77,792
|
||||||||||||
|
ex-TAC Gross Profit
|
$
|
158,868
|
$
|
169,210
|
$
|
569,642
|
$
|
518,863
|
||||||||
The following table provides a reconciliation of net income (loss) to Adjusted EBITDA.
|
Three months ended
December 31,
|
Year ended
December 31,
|
|||||||||||||||
|
2022
|
2021
|
2022
|
2021
|
|||||||||||||
|
(dollars in thousands)
|
||||||||||||||||
|
Net income (loss)
|
$
|
15,184
|
$
|
585
|
$
|
(11,975
|
)
|
$
|
(24,948
|
)
|
||||||
|
Adjusted to exclude the following:
|
|
|
|
|
||||||||||||
|
Finance (income) expenses, net
|
3,176
|
1,783
|
(9,213
|
)
|
(11,293
|
)
|
||||||||||
|
Income tax expenses
|
6,675
|
16,277
|
7,523
|
22,976
|
||||||||||||
|
Depreciation and amortization
|
22,510
|
23,061
|
91,221
|
53,111
|
||||||||||||
|
Share-based compensation expenses (1)
|
13,214
|
20,641
|
63,830
|
124,235
|
||||||||||||
|
Restructuring expenses (2)
|
—
|
—
|
3,383
|
—
|
||||||||||||
|
Holdback compensation expenses (3)
|
2,736
|
2,882
|
11,091
|
3,722
|
||||||||||||
|
M&A costs
|
—
|
154
|
816
|
11,661
|
||||||||||||
|
Adjusted EBITDA
|
$
|
63,495
|
$
|
65,383
|
$
|
156,676
|
$
|
179,464
|
||||||||
1 For the year ended December 31, 2021, a substantial majority is share-based compensation expenses related to
going public.
2 Costs associated with the Company’s cost restructuring program implemented in September
2022.
3 Represents share-based compensation due to holdback of Taboola Ordinary shares issuable under compensatory arrangements relating to Connexity acquisition.
15
We calculate Ratio of net income (loss) to gross profit as net income (loss) divided by gross profit. We calculate the Ratio of Adjusted EBITDA to ex-TAC Gross Profit, a
non-GAAP measure, as Adjusted EBITDA divided by ex-TAC Gross Profit. We believe that the Ratio of Adjusted EBITDA to ex-TAC Gross Profit is useful because TAC is what we must pay digital properties to obtain the right to place advertising on their
websites, and we believe focusing on ex-TAC Gross Profit better reflects the profitability of our business. The following table reconciles Ratio of net income (loss) to gross profit and Ratio of Adjusted EBITDA to ex-TAC Gross Profit for the period
shown.
|
Three months ended
December 31,
|
Year ended
December 31,
|
|||||||||||||||
|
2022
|
2021
|
2022
|
2021
|
|||||||||||||
|
(dollars in thousands)
|
||||||||||||||||
|
Gross profit
|
$
|
133,174
|
$
|
143,642
|
$
|
464,253
|
$
|
441,071
|
||||||||
|
Net income (loss)
|
$
|
15,184
|
$
|
585
|
$
|
(11,975
|
)
|
$
|
(24,948
|
)
|
||||||
|
Ratio of net income (loss) to gross profit
|
11.4
|
%
|
0.4
|
%
|
(2.6
|
%)
|
(5.7
|
%)
|
||||||||
|
ex-TAC Gross Profit
|
$
|
158,868
|
$
|
169,210
|
$
|
569,642
|
$
|
518,863
|
||||||||
|
Adjusted EBITDA
|
$
|
63,495
|
$
|
65,383
|
$
|
156,676
|
$
|
179,464
|
||||||||
|
Ratio of Adjusted EBITDA margin to ex-TAC Gross Profit
|
40.0
|
%
|
38.6
|
%
|
27.5
|
%
|
34.6
|
%
|
||||||||
16
The following table provides a reconciliation of net income (loss) to Non-GAAP Net Income*.
|
Three months ended
December 31,
|
Year ended
December 31,
|
|||||||||||||||
|
2022
|
2021
|
2022
|
2021
|
|||||||||||||
|
(dollars in thousands)
|
||||||||||||||||
|
Net income (loss)
|
$
|
15,184
|
$
|
585
|
$
|
(11,975
|
)
|
$
|
(24,948
|
)
|
||||||
|
Amortization of acquired intangibles
|
15,966
|
15,821
|
63,557
|
23,007
|
||||||||||||
|
Share-based compensation expenses (1)
|
13,214
|
20,641
|
63,830
|
124,235
|
||||||||||||
|
Restructuring expenses (2)
|
—
|
—
|
3,383
|
—
|
||||||||||||
|
Holdback compensation expenses (3)
|
2,736
|
2,882
|
11,091
|
3,722
|
||||||||||||
|
M&A costs
|
—
|
154
|
816
|
11,661
|
||||||||||||
|
Revaluation of Warrants
|
2,517
|
(5,565
|
)
|
(24,471
|
)
|
(22,656
|
)
|
|||||||||
|
Foreign currency exchange rate (4)
|
(4,430
|
)
|
1,106
|
(1,377
|
)
|
4,625
|
||||||||||
|
Income tax effects
|
(1,909
|
)
|
(1,778
|
)
|
(13,472
|
)
|
(6,060
|
)
|
||||||||
|
Non-GAAP Net Income
|
$
|
43,278
|
$
|
33,846
|
$
|
91,382
|
$
|
113,586
|
||||||||
|
Non-GAAP EPS basic
|
$
|
0.17
|
$
|
0.14
|
$
|
0.36
|
$
|
0.79
|
||||||||
|
Non-GAAP EPS diluted
|
$
|
0.16
|
$
|
0.12
|
$
|
0.35
|
$
|
0.68
|
||||||||
* Three months and year ended December 31, 2021 have been adjusted to include the impact of
foreign currency exchange rates to be consistent with current period presentation.
1 For the year ended December 31, 2021, a substantial majority is share-based compensation expenses related to
going public.
2 Costs associated with the Company’s cost restructuring program implemented in September
2022.
3 Represents share-based compensation due to holdback of Taboola Ordinary shares issuable under compensatory arrangements relating to Connexity acquisition.
4 Represents income or loss related to the remeasurement of monetary assets and liabilities
to the Company’s functional currency using exchange rates in effect at the end of the reporting period.
17
The following table provides a reconciliation of the number of shares used to calculate GAAP EPS to IPO Pro forma Non-GAAP EPS basic and diluted.
|
Three months ended
December 31,
|
Year ended
December 31,
|
|||||||||||||||
|
2022
|
2021
|
2022
|
2021
|
|||||||||||||
|
GAAP weighted-average shares used to compute net income (loss) per share, basic
|
261,922,644
|
243,850,858
|
254,284,781
|
142,883,475
|
||||||||||||
|
Add: Non-GAAP adjustment for Ordinary shares issued in connection with going public
|
—
|
—
|
—
|
84,769,190
|
||||||||||||
|
IPO Pro forma Non-GAAP weighted-average shares used to compute net income per share, basic
|
261,922,644
|
243,850,858
|
254,284,781
|
227,652,665
|
||||||||||||
|
GAAP weighted-average shares used to compute net income (loss) per share, diluted
|
263,160,470
|
271,857,016
|
254,284,781
|
142,883,475
|
||||||||||||
|
Add: Non-GAAP adjustment for Ordinary shares issued in connection with going public
|
—
|
—
|
—
|
84,769,190
|
||||||||||||
|
Add: Dilutive Ordinary share equivalents
|
—
|
—
|
5,519,155
|
23,155,427
|
||||||||||||
|
IPO Pro forma Non-GAAP weighted-average shares used to compute net income per share, diluted
|
263,160,470
|
271,857,016
|
259,803,936
|
250,808,092
|
||||||||||||
|
IPO Pro forma Non-GAAP EPS, basic (1)
|
$
|
0.165
|
$
|
0.139
|
$
|
0.359
|
$
|
0.499
|
||||||||
|
IPO Pro forma Non-GAAP EPS, diluted (1)
|
$
|
0.164
|
$
|
0.124
|
$
|
0.352
|
$
|
0.453
|
||||||||
1 IPO Pro Forma Non-GAAP EPS basic and diluted is presented only for the year ended December 31, 2021 assuming Taboola went public and consummated the related
transactions in each case as of January 1, 2021. Therefore the Non-GAAP net income does not include any adjustments of undistributed earnings previously allocated to participating securities, assuming these securities converted to Ordinary shares in
each case as of January 1, 2021.
18
The following table provides a reconciliation of net cash provided by operating activities to Free Cash Flow.
|
Three months ended
December 31,
|
Year ended
December 31,
|
|||||||||||||||
|
2022
|
2021
|
2022
|
2021
|
|||||||||||||
|
(dollars in thousands)
|
||||||||||||||||
|
Net cash provided by operating activities
|
$
|
20,058
|
$
|
22,968
|
$
|
53,484
|
$
|
63,521
|
||||||||
|
Purchases of property and equipment, including capitalized internal-use software
|
(6,438
|
)
|
(10,296
|
)
|
(34,914
|
)
|
(39,070
|
)
|
||||||||
|
Free Cash Flow
|
$
|
13,620
|
$
|
12,672
|
$
|
18,570
|
$
|
24,451
|
||||||||
19
APPENDIX A: Non-GAAP Guidance Reconciliation
RECONCILIATION OF GAAP TO NON-GAAP FINANCIAL MEASURES FOR Q1 2023 AND FULL YEAR 2023 GUIDANCE
(Unaudited)
The following table provides a reconciliation of projected Gross profit to ex-TAC Gross profit guidance.
|
Q1 2023
Guidance
|
FY 2023
Guidance
|
|||||||
|
Unaudited
|
||||||||
|
(dollars in millions)
|
||||||||
|
Revenues
|
|
$299 - $325
|
$1,419 - $1,469
|
|||||
|
Traffic acquisition cost
|
($196 - $210)
|
|
($893 - $923)
|
|
||||
|
Other cost of revenues
|
($26 - $28)
|
|
($107 - $113)
|
|
||||
|
Gross profit
|
$76 - $88
|
$416 - $436
|
||||||
|
Add back: Other cost of revenues
|
$26 - $28
|
$107 - $113
|
||||||
|
ex-TAC Gross Profit
|
$103 - $115
|
$526 - $546
|
||||||
Although we provide a projection for Free Cash Flow, we are not able to provide a projection for net cash provided by operating activities, the most directly comparable
GAAP measure. Certain elements of net cash provided by operating activities, including taxes and timing of collections and payments, are not predictable therefore projecting an accurate forecast is difficult. As a result, it is impractical for us to
provide projections on net cash provided by operating activities or to reconcile our Free Cash Flow projections without unreasonable efforts. Consequently, no disclosure of projected net cash provided by operating activities is included. For the same
reasons, we are unable to address the probable significance of the unavailable information.
20
Exhibit 99.2
Dear Shareholder,
We delivered solid financial performance in Q4 - we came in the middle of our guidance on all metrics, while Non-GAAP Net Income was slightly ahead. For the full year 2022
we achieved $569.6M of ex-TAC, $156.7M of Adjusted EBITDA and positive Free Cash Flow.
| 2022 was a challenging year, but also a year of significant accomplishments. I am very proud of our team at Taboola and the way we were able to manage through the macro environment, keep our heads down and execute. 2022 was the second best year we have had for signing new publisher partnerships, with over 90% higher new revenue per month than 2020 and 2021; we won a lot. Great new publisher partners joined us, such as Buzzfeed Japan, HuffPo, Prisa, Grupo Godó, Network18, United Internet Media, Dumont and Gendai. We won back publishers that had previously left us, such as Slate, Kicker, Ouest and more. We signed key renewals: CBSi,Tegna, Fox Sports and BuzzFeed Brazil. | 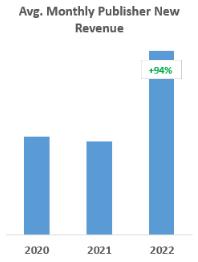 |
As part of our “Taboola Anywhere” strategy, 2022 was a year when Taboola News, our version of “Apple News” but for Android devices, exceeded $50M in annual revenue. As part
of our “Taboola Anything” strategy, eCommerce gained meaningful momentum with Dynamic Creative Optimization (DCO) rolling out, and the recent announcement of TIME launching our new Taboola Turnkey Commerce solution. More on eCommerce below.
We finished the year with a transformative 30-year partnership - Yahoo. This includes Yahoo advertisers buying Taboola network, building new contextual segments, and
powering native advertising exclusively for nearly 900M users a month. BIG.
2023 is assumed to be pre Yahoo rollout, while 2024 will have partial Yahoo contribution and meaningful gains. In 2023, we are guiding to 6% lower ex-TAC compared to 2022,
Adjusted EBITDA of $70M and positive Free Cash Flow. There are 4 reasons for weaker year over year results:
| - |
Entering 2023 with lower jumping-off point, $50M less ex-TAC than 2022 due to softer H2 2022. We expect to return to year-over-year growth in Q3 and Q4 as we lap the tough first half comparables from
2022.
|
| - |
Investing in successful Yahoo transition, ~$30M this year (people, servers, infrastructures).
|
| - |
Investing in performance advertising, eCommerce, and header bidding. We believe these 3 growth investments will help us double and triple Taboola revenue when Yahoo launches.
|
| - |
Winning market share - over time, we can see net pre-payments to publishers being insignificant to none as we become even more strategic. This year we budget ~$15M for it.
|
While it’s hard to accept declines this year, it’s very rare that management teams know what the future will look like and are willing to guide for it. 2024 will be a step
change in revenue with Yahoo ramping. While we are not fully guiding for 2024 -- we expect to generate at least
$200M in Adjusted EBITDA, and at least $100M in Free Cash Flow in 2024. I would also note that 2024 will still be a partial year of Yahoo.
Taking a step back, especially with Google and
Meta now being less than 50% of the ad market, and privacy concerns on the rise, advertisers will be looking for contextual advertising partners with scale.
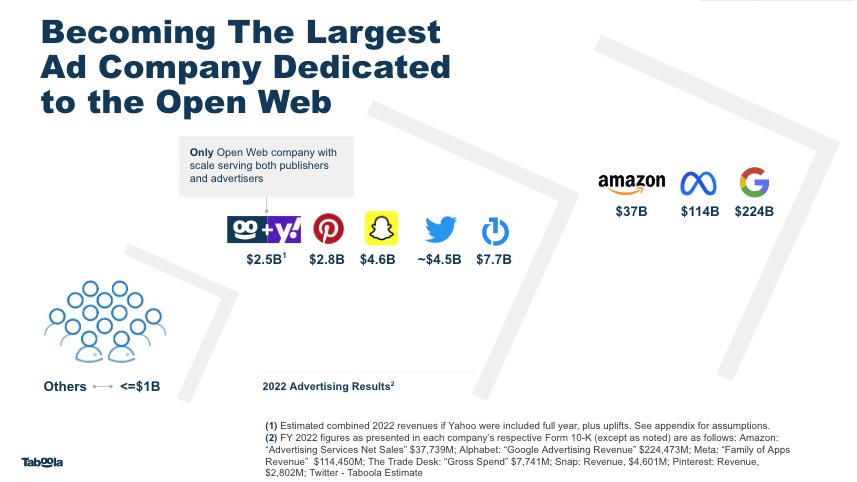
With the Yahoo partnership, we are one step further towards our long-term goal of becoming the largest open web advertising company in the world by revenue. We estimate we would have had 2022 revenue of ~$2.5 billion if Yahoo had been on our network
and we were fully integrated as of the beginning of the year. That would have put us side by side to companies like Twitter, Snap, Pinterest and TTD - with mainly Google, Meta and Amazon (much) bigger than us. And Taboola is the only company to my
knowledge at our size that is dedicated to the open web, serving both publishers and advertisers like we are. The open web will have a “walled garden strong” company that is going after our estimated $70B TAM, and I believe we are making meaningful
steps towards that vision.
eCommerce, Performance Advertising and Header Bidding
We spoke previously about our three primary focus areas for investment: performance advertising, eCommerce and header bidding.
These are where we have the most to gain as a company to further drive growth in years to come. Let me briefly update on how we’re doing on each.
Our goal with our investments in performance advertising is to make Taboola the first and best
choice for any performance advertisers that want to reach consumers in the open web. We are currently focusing our investments in four key areas. First, we are working on new bidding strategies that will help advertisers with different goals to be
successful on our network. Previously, we had shared how SmartBid automates the bidding process for our advertising partners. Now we are working on enhancements to SmartBid that will allow advertisers to do things like set a target CPA and allow the
algorithm complete latitude to even set the initial bid (rather than just adjust the bid across the network as SmartBid did previously) or to maximize conversions (even at the expense of CPA targets). Second, we are working on new ways of finding
high intent nuggets for very specific audiences in our supply. Third, we are investing in new ways to help advertisers drive clicks and conversions, such as with new creative formats and enhanced landing pages. For instance, we are currently working
on Generative Artificial Intelligence that will help advertisers write more creative and appealing headlines and even generate new images from scratch. (Come see a demo of this amazing new generative AI technology at our Yahoo Deal Information
Session on March 1 - it is really cool stuff.) Fourth, we are investing in technologies that will be smarter about how we match ads with users and especially how we ensure that advertisers see results as quickly as possible. I just came back from a
trip to Israel during which I spent time with our R&D teams working on this and I have to tell you - I was blown away about how passionate our 200 person tech team is, and about the future of the Taboola advertising platform. We have so much more
that we can do.
|
We continue to see good progress with our investments in eCommerce as well. We previously
shared that while still a small portion of the overall revenue, we are seeing “hockey stick” type of growth from our dynamic creative optimization (DCO) technology, which is a way for merchants to automatically place their product libraries
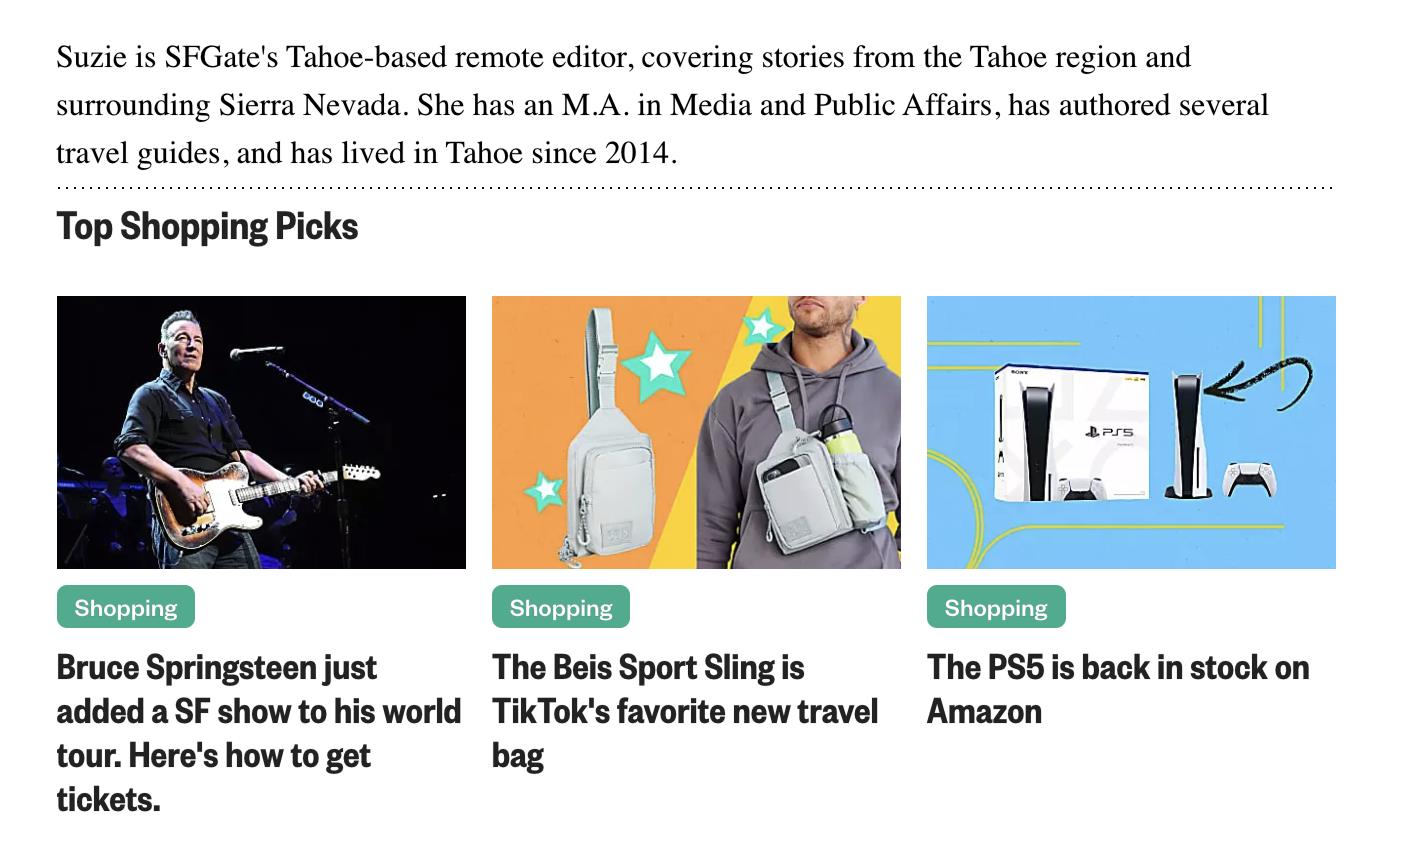
on our network. It has allowed us to significantly grow the amount of eCommerce demand that shows up in our traditional Taboola placements, such as in the bottom of article feeds. We recently launched “eCommerce circulation widgets” to help
drive users to commerce pages; it looks like the image on the right.
|
 |
|
We also just announced an exciting new initiative in eCommerce that we call Taboola Turnkey Commerce. This was the missing link to take our eCommerce business to
the next level. Every publisher that wants to get into eCommerce, but has little or no content attractive to retailers, can now do it with Taboola. Taboola does all of the work for the publishers, from using our data to know which content
makes sense for us to write on behalf of the publisher, to driving traffic to it, and of course monetizing it with relationships with merchants and service providers. We are very excited to have announced our first two publisher partners
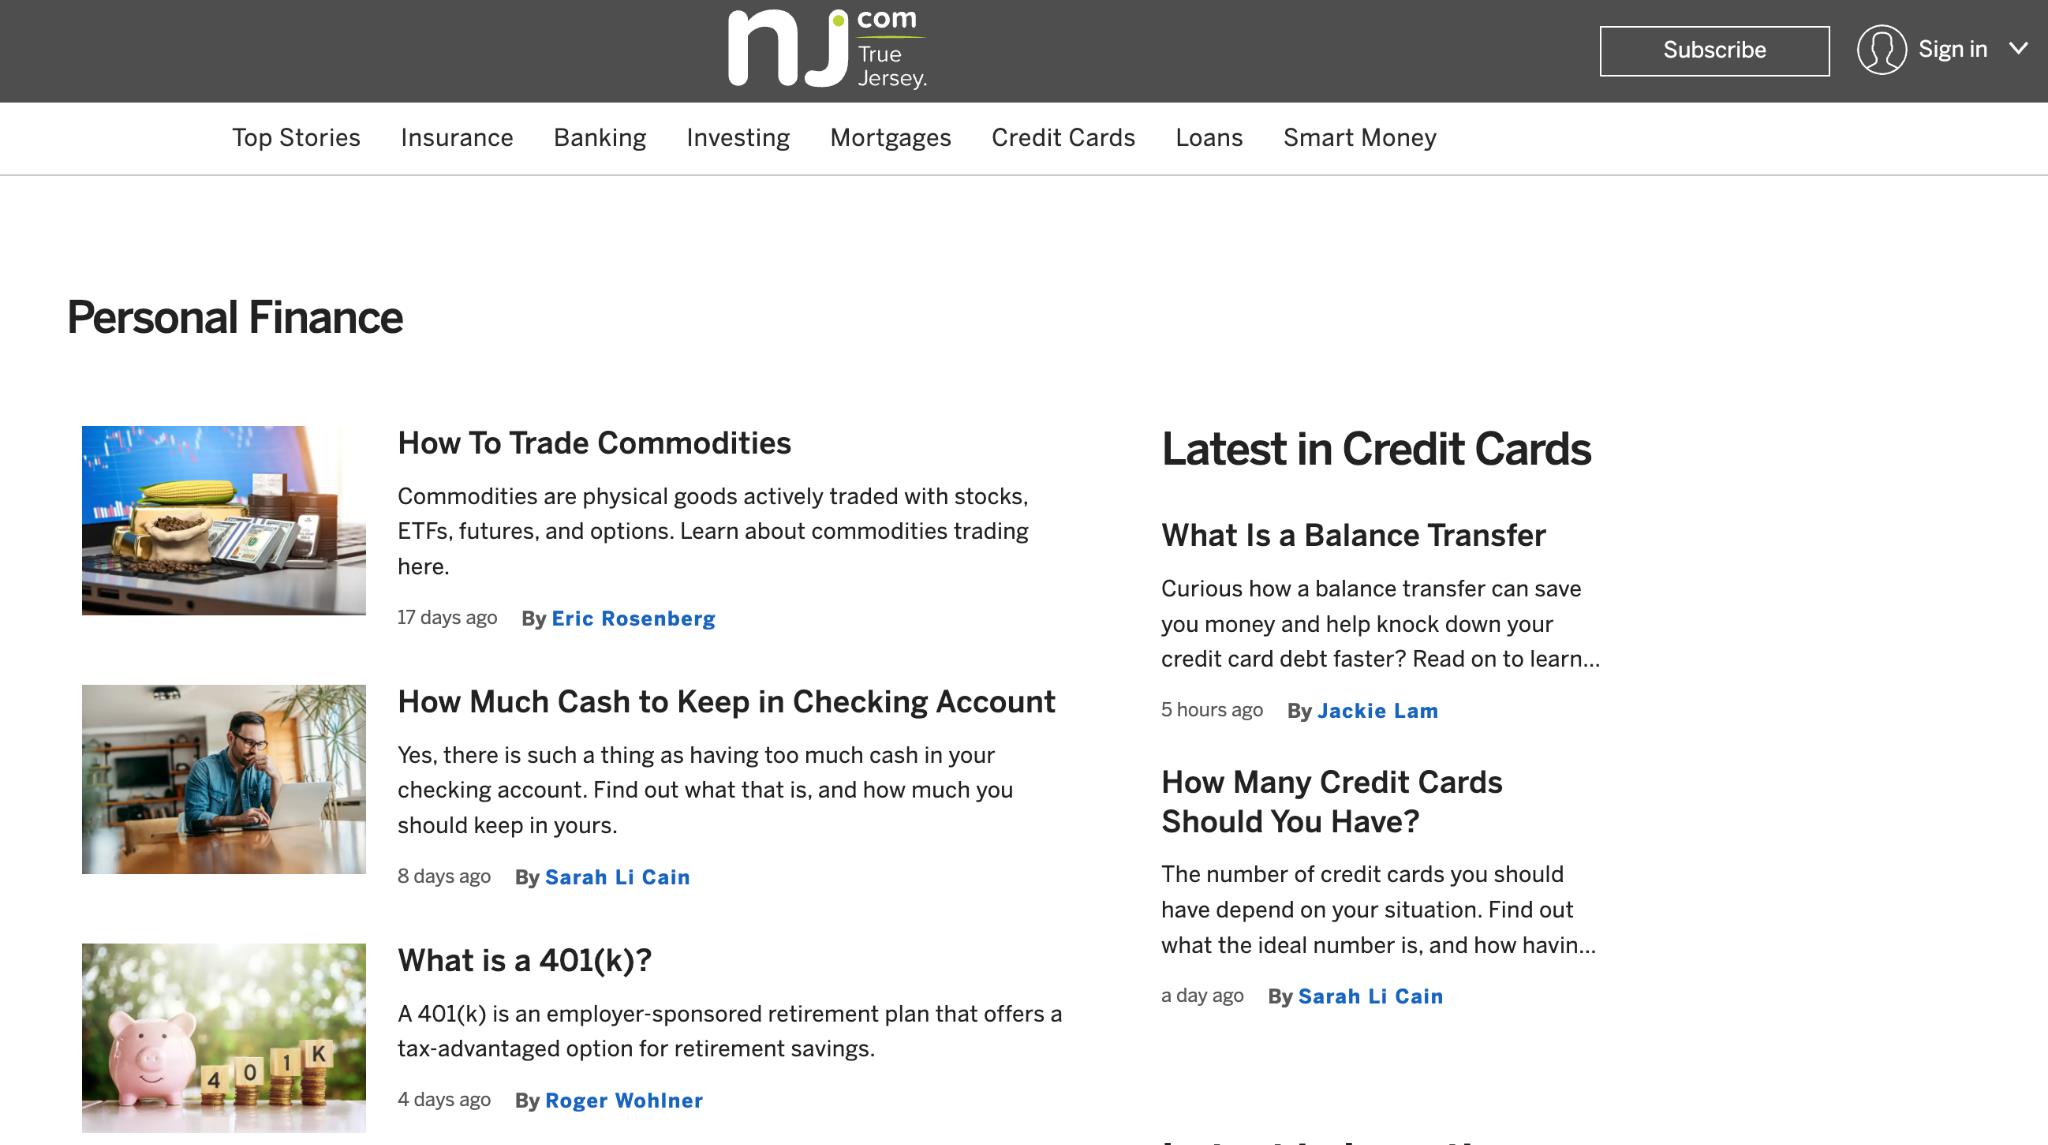
for this initiative: TIME and Advance Publications (their NJ.com site). The financial services section on NJ.com, written by Taboola, looks like the image on the right.
|
 |
Last but not least, we are investing heavily in header bidding. This is important to our future
because this is one of the ways that we will expand beyond our traditional bottom of article placements and continue to grow our share of open web, which we estimate to be a $70 billion advertising market and still dominated by display ads. Header
bidding allows us to compete for this supply using our first party data, our unique demand from performance advertisers that bid on a cost-per-click basis, and our proprietary technology that is able to combine this data and demand to predict which
ads are likely to perform well with a particular user in a particular context and from that, generate a profitable CPM-based bid. We launched this technology with our first partner, Microsoft, in April 2022 and we are generating hundreds of millions
of dollars of revenue from that partnership. Since then, we have started beta testing the technology with an additional 50+ publisher partners and we are starting to see traction.
For the first time, we’re starting to see a few publishers generating a few millions of dollars a year from it on top of our core partnership, which increases our share of
wallet, and our moat as we look to win new partnerships and expand existing relationships.
2023 Yahoo Integration Planning
2023 will be a year of investment in our newly signed 30-year agreement to be the exclusive native advertising partner for Yahoo. We are very excited about this new
partnership, as it will be financially transformative for our company. As we discussed at the time we announced the deal, if our integration with Yahoo had been completed before the start of 2022, we believe this deal would have generated
approximately an incremental $1 billion of revenue, almost doubled our Adjusted EBITDA and would have increased Free Cash Flow by 5x.
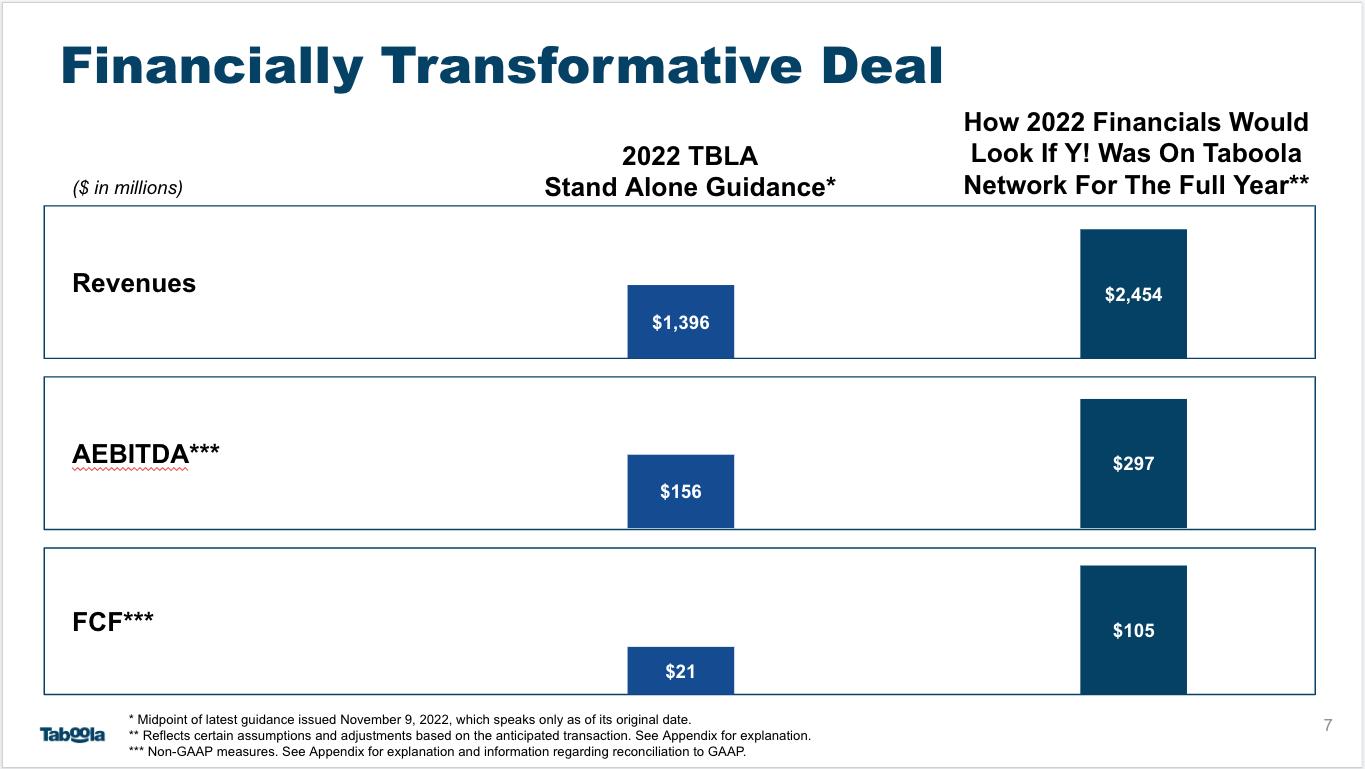
Having said that, 2023 will require significant investment to integrate Yahoo and transition the revenue. We expect the transition to occur in three phases. Currently, in Phase 0, we are designing the technology migration plan - you can think of this phase as designing the plumbing system between the two platforms so, when completed, advertisers
on Yahoo’s platform can spend on Taboola’s supply and advertisers on Taboola’s platform can spend on Yahoo’s supply. Soon, we will move to Phase 1 of the migration, in which we
will build that plumbing system and “test the pipes” by starting to flow small amounts of demand between the platforms, move some of the supply and transition a small number of advertisers to test the experience. We expect Phase 1 to be complete in
the second half of 2023. Once we validate the pipes and our transition plans, Phase 2 will begin and will involve transitioning the advertisers and supply from Yahoo to Taboola.
At this point, the migration will mostly be “blocking and tackling” but we still need to be thoughtful in the process because we want every advertiser making the transition to have a great experience and to thrive and grow on the Taboola platform -
we don’t want to trade long-term gains for short-term revenue. We expect Phase 2 to begin in the second half of 2023 and be completed sometime in 2024, at which point we will be fully ramped and will be able to focus on additional growth
opportunities from our partnership with Yahoo.
Q4 Financial Performance
Let me finish by sharing our financial results. Below are the results of Q4 and Full Year 2022 versus our guidance.
|
(dollars in millions)
|
Q4 2022
Actuals
|
Q4 2022
Guidance
|
FY 2022
Actuals
|
FY 2022
Guidance
|
||||||||||||
|
Revenues
|
$
|
371.3
|
$
|
358 - $374
|
$
|
1,401.2
|
$
|
1,388 - $1,404
|
||||||||
|
Gross profit
|
$
|
133.2
|
$
|
127 - $139
|
$
|
464.3
|
$
|
458 - $470
|
||||||||
|
ex-TAC Gross Profit*
|
$
|
158.9
|
$
|
153- $165
|
$
|
569.6
|
$
|
564 - $576
|
||||||||
|
Adjusted EBITDA*
|
$
|
63.5
|
$
|
59 - $67
|
$
|
156.7
|
$
|
152 - $160
|
||||||||
|
Non-GAAP Net Income*
|
$
|
43.3
|
$
|
35 - $43
|
$
|
91.4
|
$
|
83 - $91
|
||||||||
After a relatively strong start to 2022 in Q1, the macro environment softened in Europe in Q2 and then in the rest of the world starting in Q3. Incremental revenue from new
business contributed 8% growth while existing business was a 17% headwind in Q4. The macro softness resulted in softer advertiser demand and weaker yield, which is what caused the decrease in existing business. While we are very excited about new
customer contracts signed in the quarter and remain optimistic about the depth of our pipeline, we are especially proud of those previously lost customers that returned to Taboola. We think this demonstrates true differentiation in the marketplace
and is indicative of the win-win partnerships we establish with our customers. Adjusted EBITDA exceeded the mid-point of our guidance as we benefited from cost management initiatives that we started in Q2 and accelerated in Q3. We continue to examine
our business and cut unnecessary costs. Our continued focus on operational efficiency also allowed us to exceed our Non-GAAP Net Income guidance.
Q1 and FY 2023, 2024 Guidance
Below is our Q1 2023 and full year 2023 guidance. Our outlook assumes that the macro environment continues to be challenging but does not meaningfully deteriorate and that,
as a result, the current softness in the online advertising market continues but does not worsen. In addition, we assume a substantial ramp in investment related to our Yahoo partnership but, to be conservative, do not factor in the associated
revenue. It also assumes continued investment in our key company priorities of performance advertising, eCommerce and header bidding. Despite these significant investments, we still expect to have positive Free Cash Flow in 2023. We also believe our
investments will start to show returns in 2024 and, while we are not fully guiding, we expect to generate at least $200M in Adjusted EBITDA and $100M in Free Cash Flow in 2024, despite being a partial year for Yahoo. Finally, it is important to note
that when looking at Q1 2023 growth rates, a year on year comparison is distorted due to a relatively strong first quarter in 2022 and a substantially weaker second half, which negatively impacted our run rate coming into 2023.
|
Q1 2023
Guidance
|
FY 2023
Guidance
|
|||||||
| Unaudited | ||||||||
|
(dollars in millions)
|
||||||||
|
Revenues
|
|
$299 - $325
|
$1,419 - $1,469
|
|||||
|
Gross profit
|
$76 - $88
|
$416 - $436
|
||||||
|
ex-TAC Gross Profit*
|
$103 - $115
|
$526 - $546
|
||||||
|
Adjusted EBITDA*
|
($6) - $6
|
|
$60 - $80
|
|||||
|
Non-GAAP Net Income (loss)*
|
($23) - ($11)
|
|
($10) - $10
|
|
||||
For more information on our Q4 results and our full year 2023 and Q1 2023 guidance, please see our Q4 2022 earnings press release, which was furnished to the SEC and also
posted on Taboola’s website today at https://investors.taboola.com.
|
*
|
*
|
*
|
In Summary
We remain fully committed to building an alternative to the walled gardens, expanding our core market and entering new markets. We are grateful our shareholders trust us
to continue investing in the long term drivers of the business which we categorize into four channels: 1) performance advertising, 2) e-Commerce, 3) header bidding, and as of now having a 4th priority - making Yahoo successful.
This is a year of investment for us, with meaningful financial gains starting in 2024 and continuing beyond. Many companies would go into defensive mode in times like this,
we’re continuing to play offense, and I believe our future is incredibly strong.
Kind regards,
-- Adam Singolda
Founder & CEO Taboola
*About Non-GAAP Financial Information
This letter includes ex-TAC Gross Profit, Adjusted EBITDA, Ratio of Adjusted EBITDA to ex-TAC Gross Profit, Free Cash Flow, Non-GAAP Net Income (loss), Non-GAAP EPS basic
and diluted and IPO Pro forma Non-GAAP EPS basic and diluted, which are non-GAAP financial measures. These non-GAAP financial measures are not measures of financial performance in accordance with GAAP and may exclude items that are significant in
understanding and assessing the Company’s financial results. Therefore, these measures should not be considered in isolation or as an alternative to revenues, gross profit, earnings per share, net income (loss), cash flows from operations or other
measures of profitability, liquidity or performance under GAAP. You should be aware that the Company’s presentation of these measures may not be comparable to similarly-titled measures used by other companies.
The Company believes non-GAAP financial measures provide useful information to management and investors regarding future financial and business trends relating to the
Company. The Company believes that the use of these measures provides an additional tool for investors to use in evaluating operating results and trends and in comparing the Company’s financial measures with other similar companies, many of which
present similar non-GAAP financial measures to investors. Non-GAAP financial measures are subject to inherent limitations because they reflect the exercise of judgments by management about which items are excluded or included in calculating them.
Please refer to the appendix at the end of this letter for reconciliations to the most directly comparable measures in accordance with GAAP.
**About Cash Investment in Publisher Prepayments
(Net)
We calculate cash investment in publisher prepayments (net) for a specific measurement period as the gross amount of cash publisher prepayments we made in
that measurement period minus the amortization of publisher prepayments that were included in traffic acquisition cost during that measurement period, which were the result of cash publisher prepayments made in that measurement period and previous
periods.
Note Regarding Forward-Looking Statements
Certain statements in this letter are forward-looking statements. Forward-looking statements generally relate to future events including future financial or operating
performance of Taboola.com Ltd. (the “Company”). In some cases, you can identify forward-looking statements by terminology such as “may”, “should”, “expect”, “guidance”, “intend”, “will”, “estimate”, “anticipate”, “believe”, “predict”, “target”,
“potential” or “continue”, or the negatives of these terms or variations of them or similar terminology. Such forward-looking statements are subject to risks, uncertainties, and other factors which could cause actual results to differ materially
from those expressed or implied by such forward looking statements.
These forward-looking statements are based upon estimates and assumptions that, while considered reasonable by the Company and its management, are inherently uncertain.
Uncertainties and risk factors that could affect the Company’s future performance and cause results to differ from the forward-looking statements in this letter include, but are not limited to: the ability to recognize the anticipated benefits of
the Connexity acquisition and the business combination between the Company and ION Acquisition Corp. 1 Ltd. (together, the “Business Combinations”), which may be affected by, among other things, competition, the ability of the Company to grow and
manage growth profitably, maintain relationships with customers and retain its management and key employees; the Company’s ability to successfully integrate the Connexity acquisition; costs related to the Business Combinations; changes in
applicable laws or regulations; the Company’s estimates of expenses and profitability and underlying assumptions with respect to accounting presentations and purchase price and other adjustments; the
Company’s ability to transition to and fully launch the native advertising service for Yahoo on the currently anticipated schedule or at all; the timing and amount of any margin, profitability, cash flow or other financial contributions resulting
from the integration of Yahoo with our service; the risk that the Yahoo integration results in a decline in the Company’s financial performance during the preparation and roll out of the new service and beyond; the ability to generate or achieve
the financial results, including the increase in Adjusted EBITDA and Free Cash Flow in 2024 to the levels assumed in this letter or at all; ability to transform the Company into an alternative to the walled gardens in the Open Web; the ability to become the largest open web advertising company in the world by revenue; ability to attract new digital properties and advertisers; ability to meet minimum guarantee requirements in
contracts with digital properties; intense competition in the digital advertising space, including with competitors who have significantly more resources; ability to grow and scale the Company’s ad and content platform through new relationships
with advertisers and digital properties; ability to secure high quality content from digital properties; ability to maintain relationships with current advertiser and digital property partners; ability to make continued investments in the Company’s
AI-powered technology platform; the need to attract, train and retain highly-skilled technical workforce; changes in the regulation of, or market practice with respect to, “third party cookies” and its impact on digital advertising; continued
engagement by users who interact with the Company’s platform on various digital properties; the impact of the ongoing COVID-19 pandemic; reliance on a limited number of partners for a significant portion of the Company’s revenue; changes in laws
and regulations related to privacy, data protection, advertising regulation, competition and other areas related to digital advertising; ability to enforce, protect and maintain intellectual property rights; and risks related to the fact that we
are incorporated in Israel and governed by Israeli law; and other risks and uncertainties set forth in the Company’s Annual Report on Form 20-F for the year ended December 31, 2021 under Item 3.D. “Information About the Company - Risk Factors” and
in the Company’s subsequent filings with the Securities and Exchange Commission.
Nothing in this letter should be regarded as a representation by any person that the forward-looking statements set forth herein will be achieved or that any of the
contemplated results of such forward-looking statements will be achieved. You should not place undue reliance on these forward-looking statements, which speak only as of the date they were made. The Company undertakes no duty to update these
forward-looking statements except as may be required by law.
APPENDIX: Non-GAAP Reconciliation
RECONCILIATION OF GAAP TO NON-GAAP FINANCIAL MEASURES FOR Q4 AND YEARS ENDED DECEMBER 31, 2022 AND 2021 (Unaudited)
The following table provides a reconciliation of revenues to ex-TAC Gross Profit.
|
Three months ended
December 31,
|
Year ended
December 31,
|
|||||||||||||||
|
2022
|
2021
|
2022
|
2021
|
|||||||||||||
|
(dollars in thousands)
|
||||||||||||||||
|
Revenues
|
$
|
371,267
|
$
|
407,668
|
$
|
1,401,150
|
$
|
1,378,458
|
||||||||
|
Traffic acquisition cost
|
212,399
|
238,458
|
831,508
|
859,595
|
||||||||||||
|
Other cost of revenues
|
25,694
|
25,568
|
105,389
|
77,792
|
||||||||||||
|
Gross profit
|
$
|
133,174
|
$
|
143,642
|
$
|
464,253
|
$
|
441,071
|
||||||||
|
Add back: Other cost of revenues
|
25,694
|
25,568
|
105,389
|
77,792
|
||||||||||||
|
ex-TAC Gross Profit
|
$
|
158,868
|
$
|
169,210
|
$
|
569,642
|
$
|
518,863
|
||||||||
The following table provides a reconciliation of net income (loss) to Adjusted EBITDA.
|
Three months ended
December 31,
|
Year ended
December 31,
|
|||||||||||||||
|
2022
|
2021
|
2022
|
2021
|
|||||||||||||
|
(dollars in thousands)
|
||||||||||||||||
|
Net income (loss)
|
$
|
15,184
|
$
|
585
|
$
|
(11,975
|
)
|
$
|
(24,948
|
)
|
||||||
|
Adjusted to exclude the following:
|
|
|
|
|
||||||||||||
|
Finance (income) expenses, net
|
3,176
|
1,783
|
(9,213
|
)
|
(11,293
|
)
|
||||||||||
|
Income tax expenses
|
6,675
|
16,277
|
7,523
|
22,976
|
||||||||||||
|
Depreciation and amortization
|
22,510
|
23,061
|
91,221
|
53,111
|
||||||||||||
|
Share-based compensation expenses (1)
|
13,214
|
20,641
|
63,830
|
124,235
|
||||||||||||
|
Restructuring expenses (2)
|
—
|
—
|
3,383
|
—
|
||||||||||||
|
Holdback compensation expenses (3)
|
2,736
|
2,882
|
11,091
|
3,722
|
||||||||||||
|
M&A costs
|
—
|
154
|
816
|
11,661
|
||||||||||||
|
Adjusted EBITDA
|
$
|
63,495
|
$
|
65,383
|
$
|
156,676
|
$
|
179,464
|
||||||||
1 For the year ended December 31, 2021, a substantial majority is share-based compensation expenses related to
going public.
2 Costs associated with the Company’s cost restructuring program implemented in September
2022.
3 Represents share-based compensation due to holdback of Taboola Ordinary shares issuable under compensatory arrangements relating to Connexity acquisition.
We calculate Ratio of net income (loss) to gross profit as net income (loss) divided by gross profit. We calculate Ratio of Adjusted EBITDA to ex-TAC Gross Profit, a
non-GAAP measure, as Adjusted EBITDA divided by ex-TAC Gross Profit. We believe that the Ratio of Adjusted EBITDA to ex-TAC Gross Profit is useful because TAC is what we must pay digital properties to obtain the right to place advertising on their
websites, and we believe focusing on ex-TAC Gross Profit better reflects the profitability of our business. The following table reconciles Ratio of net income (loss) to gross profit and Ratio of Adjusted EBITDA to ex-TAC Gross Profit for the period
shown.
|
Three months ended
December 31,
|
Year ended
December 31,
|
|||||||||||||||
|
2022
|
2021
|
2022
|
2021
|
|||||||||||||
|
(dollars in thousands)
|
||||||||||||||||
|
Gross profit
|
$
|
133,174
|
$
|
143,642
|
$
|
464,253
|
$
|
441,071
|
||||||||
|
Net income (loss)
|
$
|
15,184
|
$
|
585
|
$
|
(11,975
|
)
|
$
|
(24,948
|
)
|
||||||
|
Ratio of net income (loss) to gross profit
|
11.4
|
%
|
0.4
|
%
|
(2.6
|
%)
|
(5.7
|
%)
|
||||||||
|
ex-TAC Gross Profit
|
$
|
158,868
|
$
|
169,210
|
$
|
569,642
|
$
|
518,863
|
||||||||
|
Adjusted EBITDA
|
$
|
63,495
|
$
|
65,383
|
$
|
156,676
|
$
|
179,464
|
||||||||
|
Ratio of Adjusted EBITDA margin to ex-TAC Gross Profit
|
40.0
|
%
|
38.6
|
%
|
27.5
|
%
|
34.6
|
%
|
||||||||
The following table provides a reconciliation of net income (loss) to Non-GAAP Net Income*.
|
Three months ended
December 31,
|
Year ended
December 31,
|
|||||||||||||||
|
2022
|
2021
|
2022
|
2021
|
|||||||||||||
|
(dollars in thousands)
|
||||||||||||||||
|
Net income (loss)
|
$
|
15,184
|
$
|
585
|
$
|
(11,975
|
)
|
$
|
(24,948
|
)
|
||||||
|
Amortization of acquired intangibles
|
15,966
|
15,821
|
63,557
|
23,007
|
||||||||||||
|
Share-based compensation expenses (1)
|
13,214
|
20,641
|
63,830
|
124,235
|
||||||||||||
|
Restructuring expenses (2)
|
—
|
—
|
3,383
|
—
|
||||||||||||
|
Holdback compensation expenses (3)
|
2,736
|
2,882
|
11,091
|
3,722
|
||||||||||||
|
M&A costs
|
—
|
154
|
816
|
11,661
|
||||||||||||
|
Revaluation of Warrants
|
2,517
|
(5,565
|
)
|
(24,471
|
)
|
(22,656
|
)
|
|||||||||
|
Foreign currency exchange rate (4)
|
(4,430
|
)
|
1,106
|
(1,377
|
)
|
4,625
|
||||||||||
|
Income tax effects
|
(1,909
|
)
|
(1,778
|
)
|
(13,472
|
)
|
(6,060
|
)
|
||||||||
|
Non-GAAP Net Income
|
$
|
43,278
|
$
|
33,846
|
$
|
91,382
|
$
|
113,586
|
||||||||
|
Non-GAAP EPS basic
|
$
|
0.17
|
$
|
0.14
|
$
|
0.36
|
$
|
0.79
|
||||||||
|
Non-GAAP EPS diluted
|
$
|
0.16
|
$
|
0.12
|
$
|
0.35
|
$
|
0.68
|
||||||||
* Three months and year ended December 31, 2021 have been adjusted to include the impact of
foreign currency exchange rates to be consistent with current period presentation.
1 For the year ended December 31, 2021, a substantial majority is share-based compensation expenses related to
going public.
2 Costs associated with the Company’s cost restructuring program implemented in September
2022.
3 Represents share-based compensation due to
holdback of Taboola Ordinary shares issuable under compensatory arrangements relating to Connexity acquisition.
4 Represents income or loss related to the remeasurement of monetary assets and liabilities
to the Company’s functional currency using exchange rates in effect at the end of the reporting period.
The following table provides a reconciliation of the number of shares used to calculate GAAP EPS to IPO Pro forma Non-GAAP EPS basic and diluted.
|
Three months ended
December 31,
|
Year ended
December 31,
|
|||||||||||||||
|
2022
|
2021
|
2022
|
2021
|
|||||||||||||
|
GAAP weighted-average shares used to compute net income (loss) per share, basic
|
261,922,644
|
243,850,858
|
254,284,781
|
142,883,475
|
||||||||||||
|
Add: Non-GAAP adjustment for Ordinary shares issued in connection with going public
|
—
|
—
|
—
|
84,769,190
|
||||||||||||
|
IPO Pro forma Non-GAAP weighted-average shares used to compute net income per share, basic
|
261,922,644
|
243,850,858
|
254,284,781
|
227,652,665
|
||||||||||||
|
GAAP weighted-average shares used to compute net income (loss) per share, diluted
|
263,160,470
|
271,857,016
|
254,284,781
|
142,883,475
|
||||||||||||
|
Add: Non-GAAP adjustment for Ordinary shares issued in connection with going public
|
—
|
—
|
—
|
84,769,190
|
||||||||||||
|
Add: Dilutive Ordinary share equivalents
|
—
|
—
|
5,519,155
|
23,155,427
|
||||||||||||
|
IPO Pro forma Non-GAAP weighted-average shares used to compute net income per share, diluted
|
263,160,470
|
271,857,016
|
259,803,936
|
250,808,092
|
||||||||||||
|
IPO Pro forma Non-GAAP EPS, basic (1)
|
$
|
0.165
|
$
|
0.139
|
$
|
0.359
|
$
|
0.499
|
||||||||
|
IPO Pro forma Non-GAAP EPS, diluted (1)
|
$
|
0.164
|
$
|
0.124
|
$
|
0.352
|
$
|
0.453
|
||||||||
1 IPO Pro Forma Non-GAAP EPS basic and diluted is presented only for the year ended December 31, 2021 assuming Taboola went public and consummated the related
transactions in each case as of January 1, 2021. Therefore the Non-GAAP net income does not include any adjustments of undistributed earnings previously allocated to participating securities, assuming
these securities converted to Ordinary shares in each case as of January 1, 2021.
The following table provides a reconciliation of net cash provided by operating activities to Free Cash Flow.
|
Three months ended
December 31,
|
Year ended
December 31,
|
|||||||||||||||
|
2022
|
2021
|
2022
|
2021
|
|||||||||||||
|
(dollars in thousands)
|
||||||||||||||||
|
Net cash provided by operating activities
|
$
|
20,058
|
$
|
22,968
|
$
|
53,484
|
$
|
63,521
|
||||||||
|
Purchases of property and equipment, including capitalized internal-use software
|
(6,438
|
)
|
(10,296
|
)
|
(34,914
|
)
|
(39,070
|
)
|
||||||||
|
Free Cash Flow
|
$
|
13,620
|
$
|
12,672
|
$
|
18,570
|
$
|
24,451
|
||||||||
APPENDIX: Non-GAAP Guidance Reconciliation
RECONCILIATION OF GAAP TO NON-GAAP FINANCIAL MEASURES FOR Q1 2023 AND FULL YEAR 2023 GUIDANCE
(Unaudited)
The following table provides a reconciliation of projected gross profit to ex-TAC Gross Profit.
|
Q1 2023
Guidance
|
FY 2023
Guidance
|
|||||||
|
Unaudited
|
||||||||
|
(dollars in millions)
|
||||||||
|
Revenues
|
|
$299 - $325
|
$1,419 - $1,469
|
|||||
|
Traffic acquisition cost
|
($196 - $210)
|
|
($893 - $923)
|
|
||||
|
Other cost of revenues
|
($26 - $28)
|
|
($107 - $113)
|
|
||||
|
Gross profit
|
$76 - $88
|
$416 - $436
|
||||||
|
Add back: Other cost of revenues
|
$26 - $28
|
$107 - $113
|
||||||
|
ex-TAC Gross Profit
|
$103 - $115
|
$526 - $546
|
||||||
Although we provide a projection for Free Cash Flow, we are not able to provide a projection for net cash provided by operating activities, the most directly comparable
GAAP measure. Certain elements of net cash provided by operating activities, including taxes and timing of collections and payments, are not predictable therefore projecting an
accurate forecast is difficult. As a result, it is impractical for us to provide projections on net cash provided by operating activities or to reconcile our Free Cash Flow projections without unreasonable efforts. Consequently, no
disclosure of projected net cash provided by operating activities is included. For the same reasons, we are unable to address the probable significance of the unavailable information.
APPENDIX: Assumptions: If Yahoo Were On Taboola Network For FY 2022
All numbers are management estimates based on the following assumptions and sources:
| ● |
Revenue baseline is equal to the expected FY 2022 financials for TBLA at guidance midpoint (66% of combined Revenues) + FY 2022 expected financials for Yahoo Native supply* that will be serviced by
TBLA (34% of combined Revenues)
|
| ● |
Revenue uplift on Yahoo supply from improved yield due to the application of Taboola technology and data
|
| ● |
Revenue uplift on stand-alone Taboola supply from improved yield due to advertiser demand from Yahoo and additional data
|
| ● |
Operating expenses based on bottom up model of resources needed to support deal
|
| ● |
Assumes no ramp up time - numbers assume Yahoo is part of Taboola network from the beginning of 2022 and assumes uplifts and operating expenses start from the beginning of the year
|
* Yahoo Q1 to Q3 2022 actuals, plus Yahoo forecast for Q4 2022
Exhibit 99.3

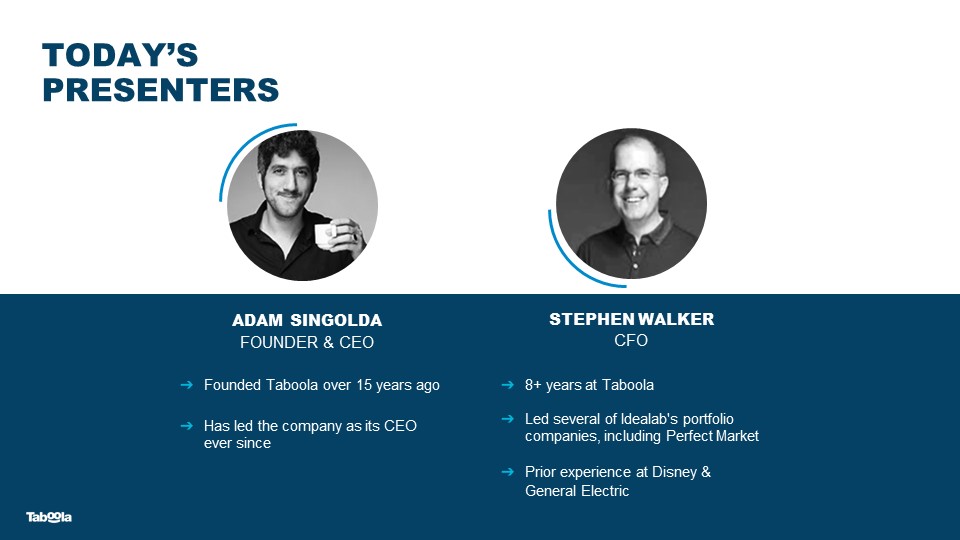

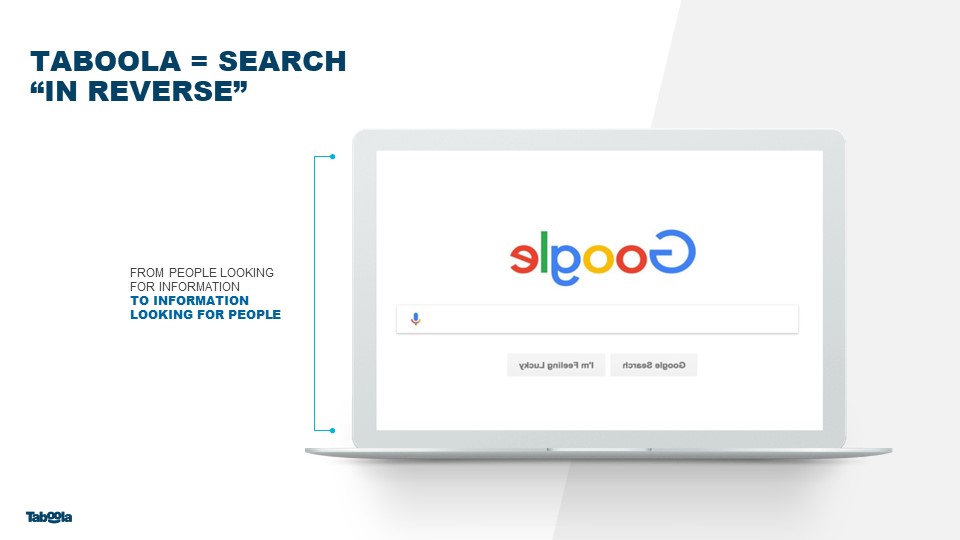
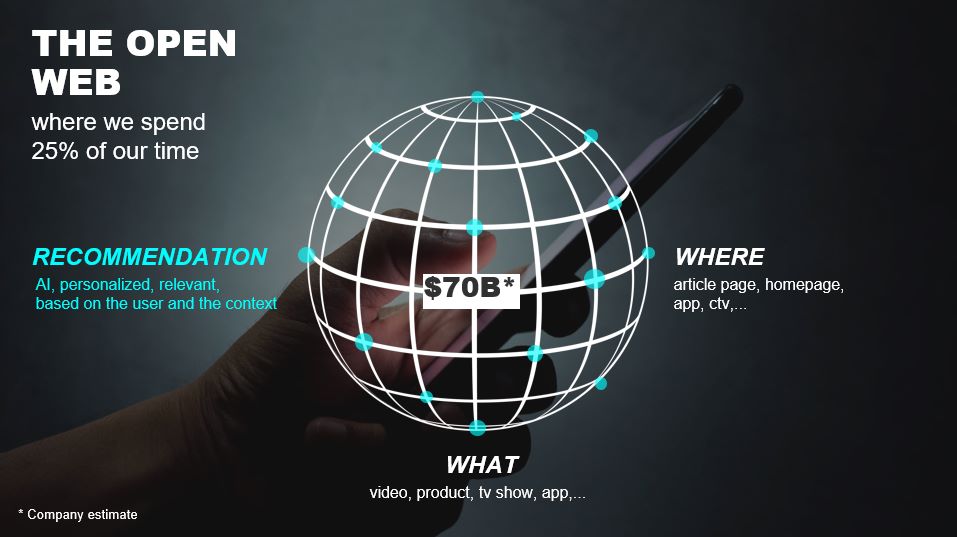
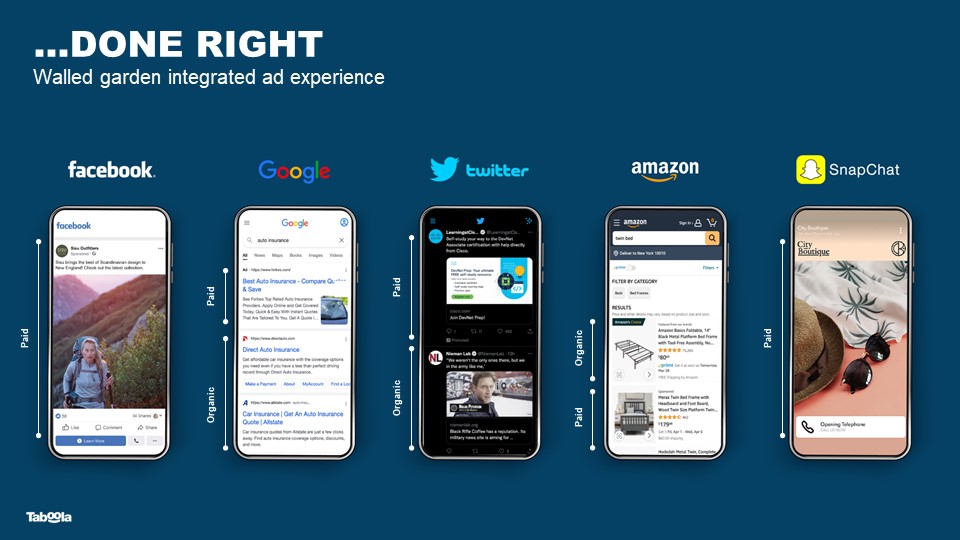
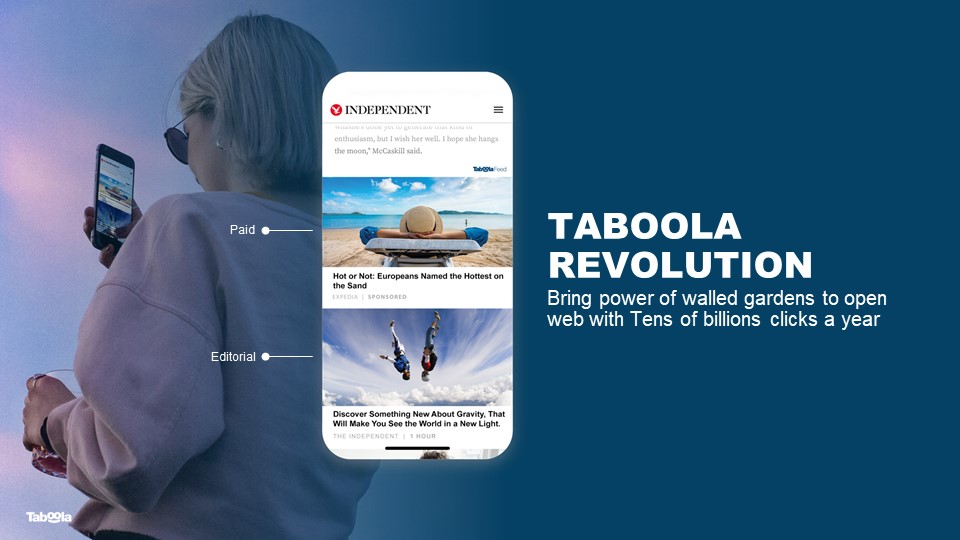


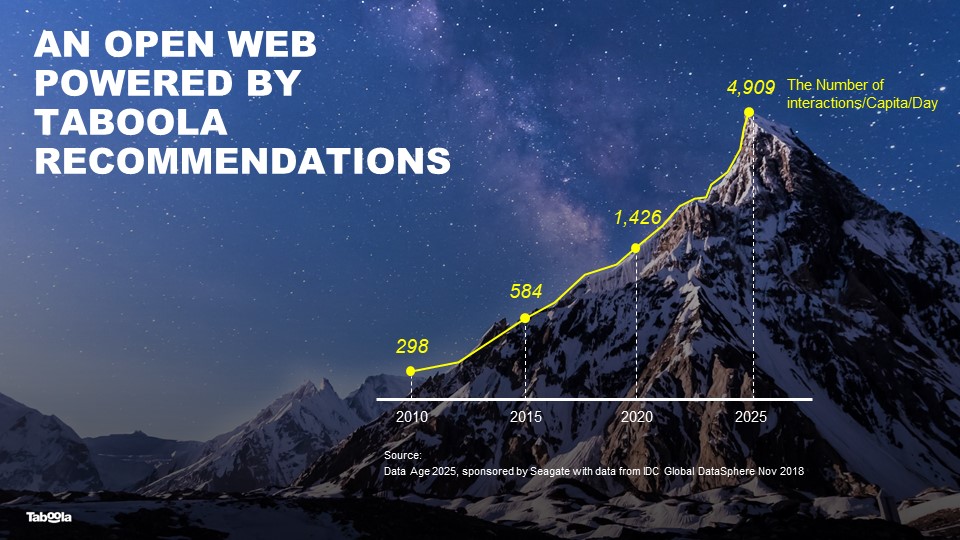


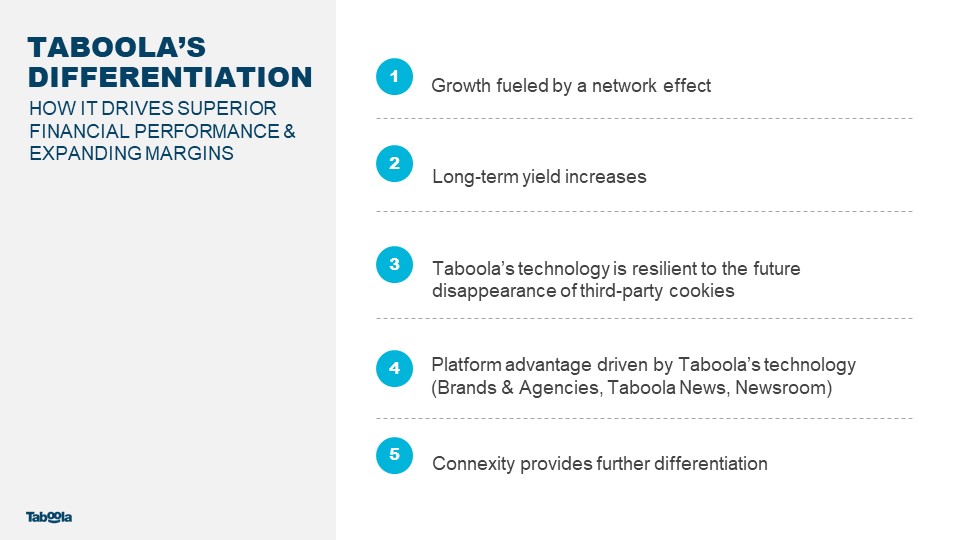
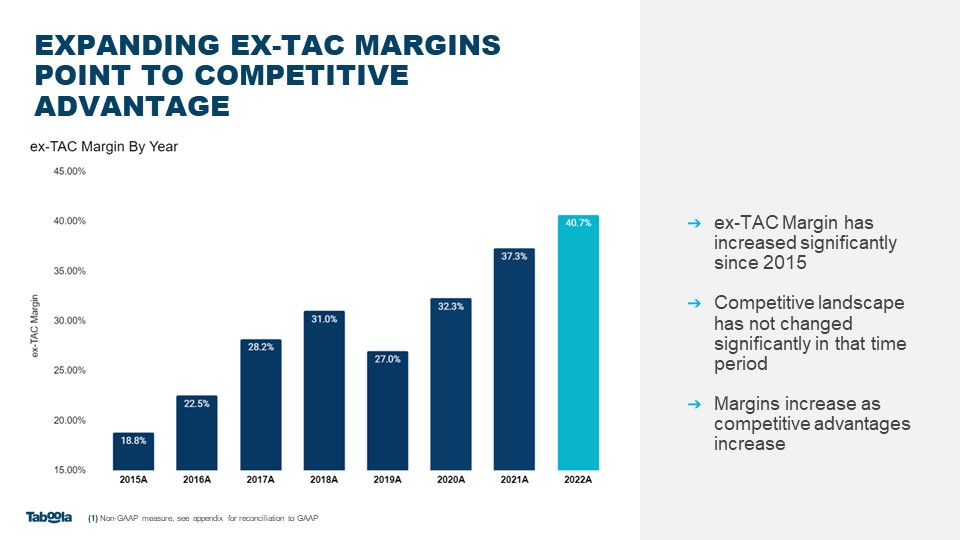
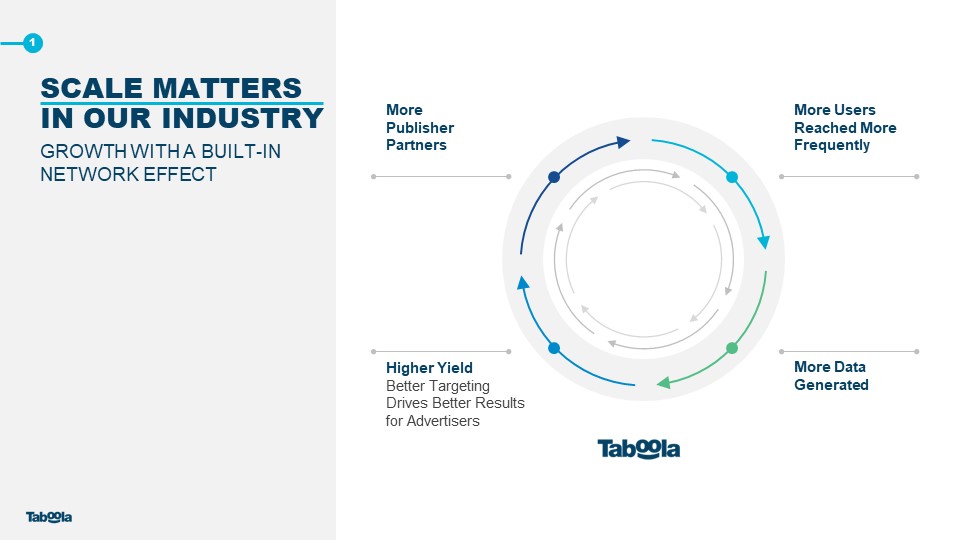
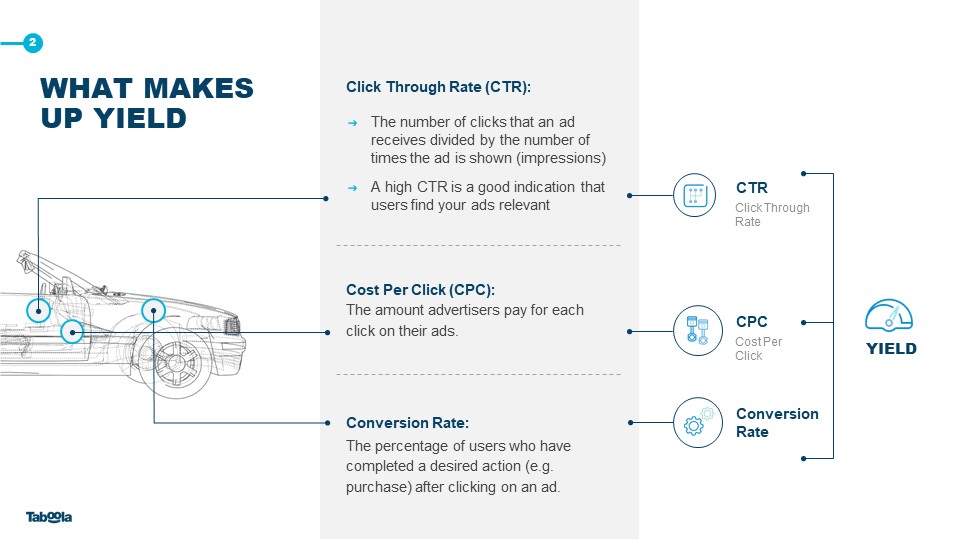
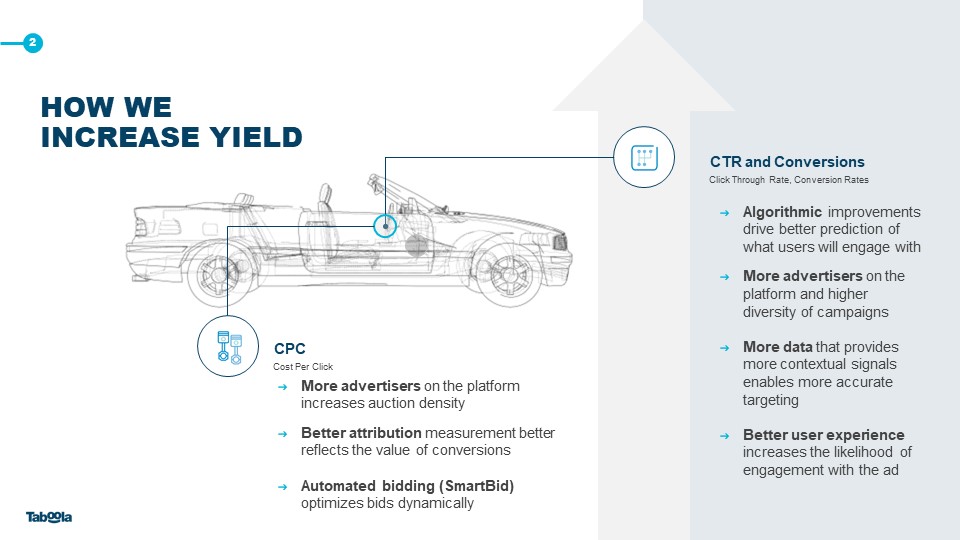
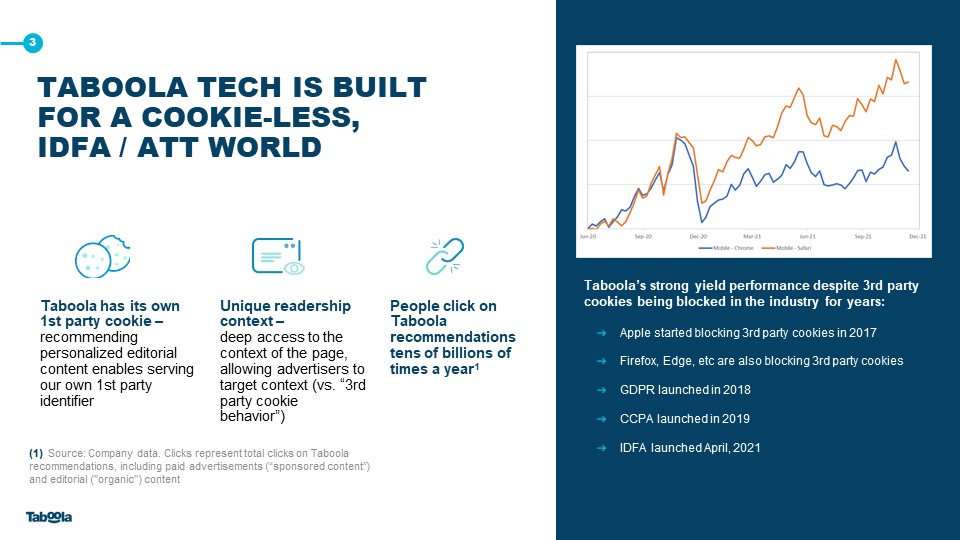
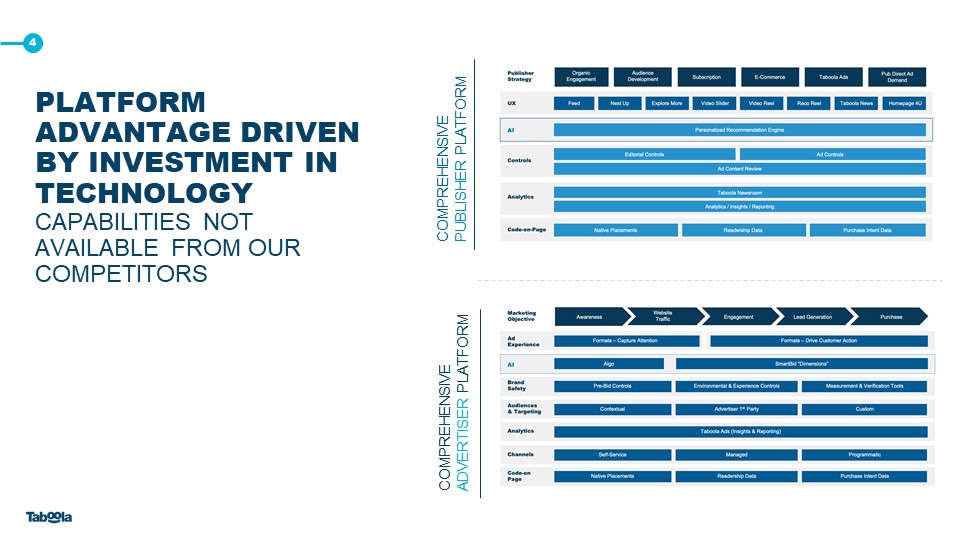
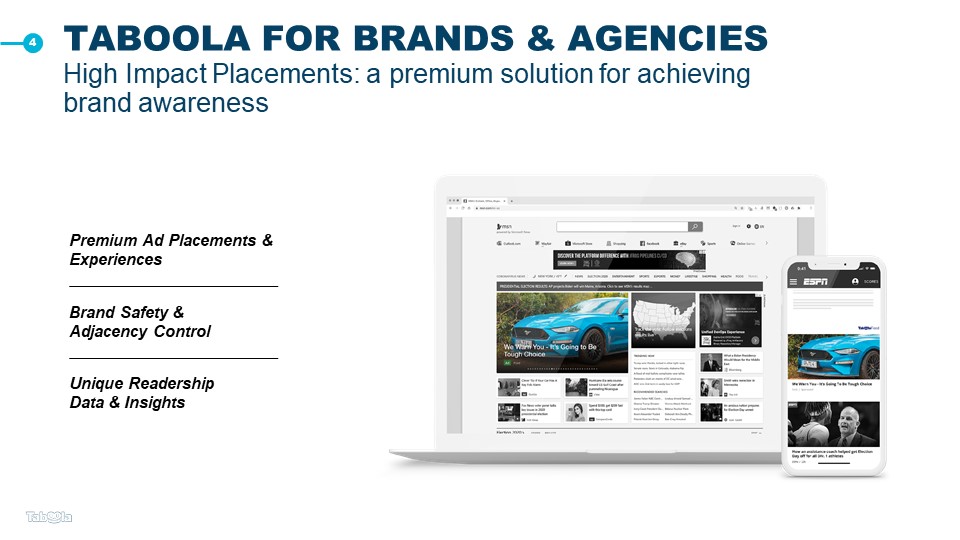
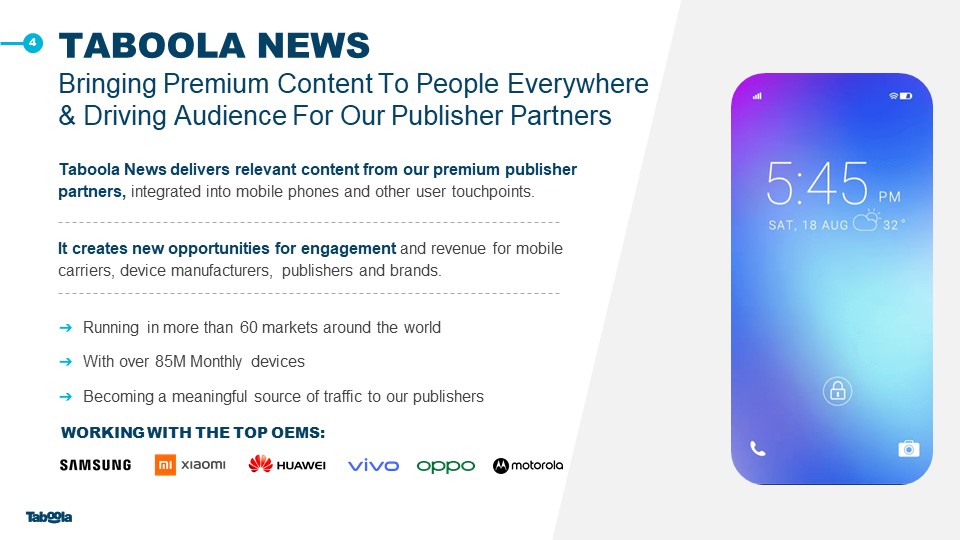
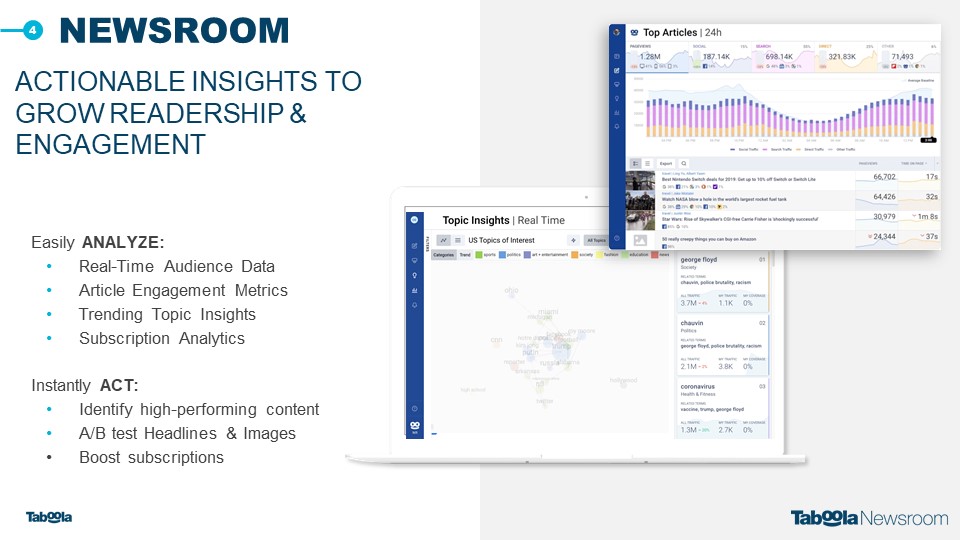
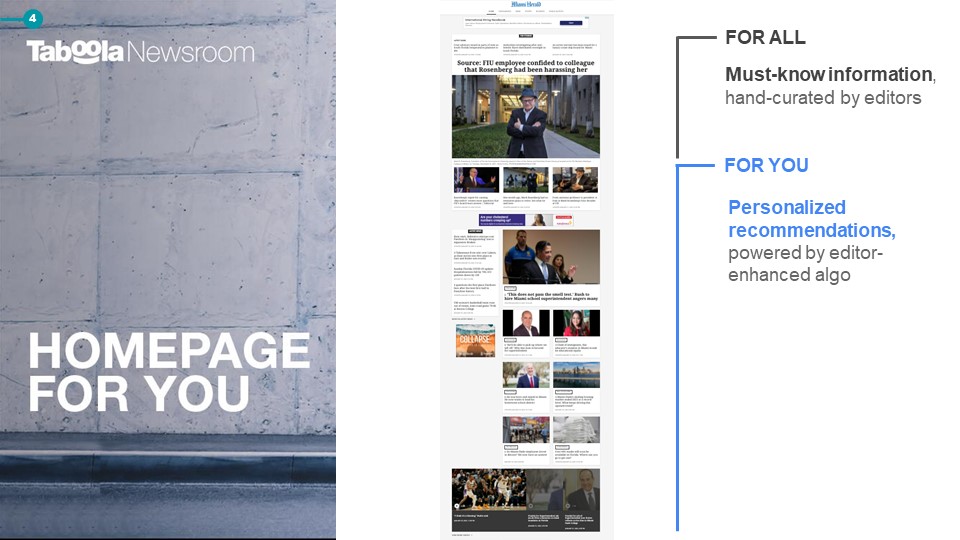
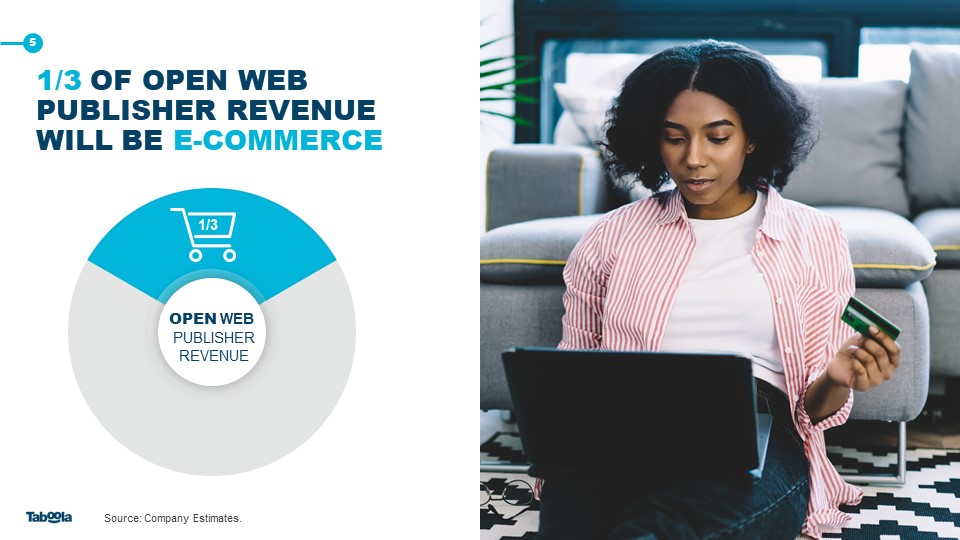
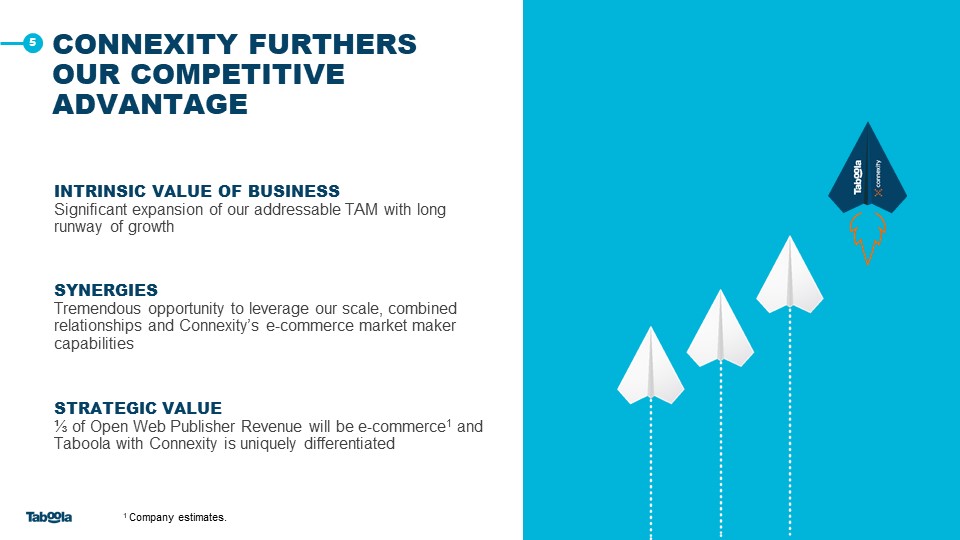
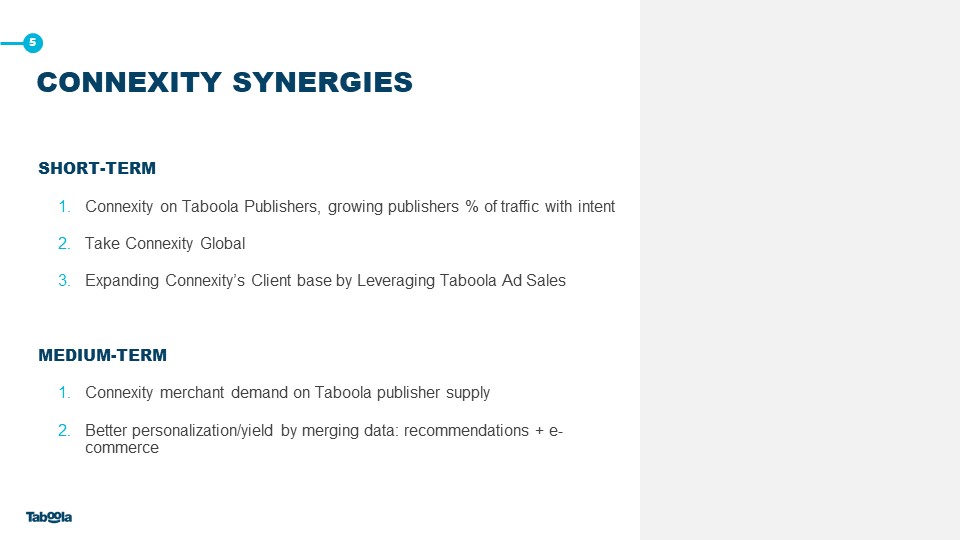
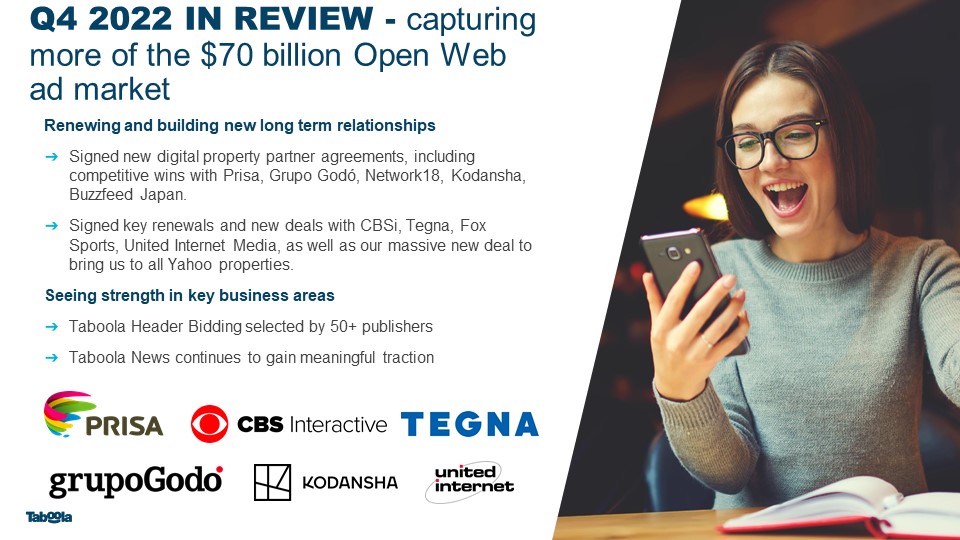
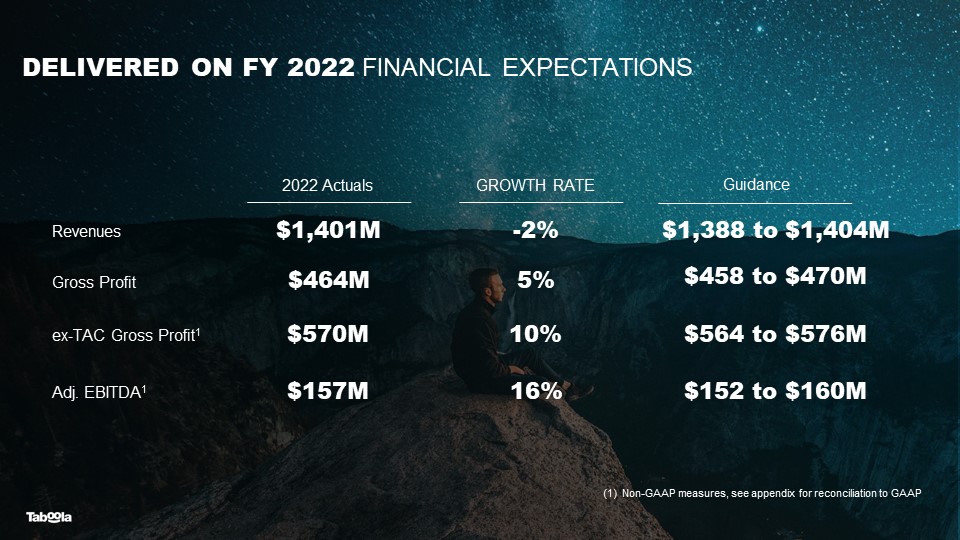
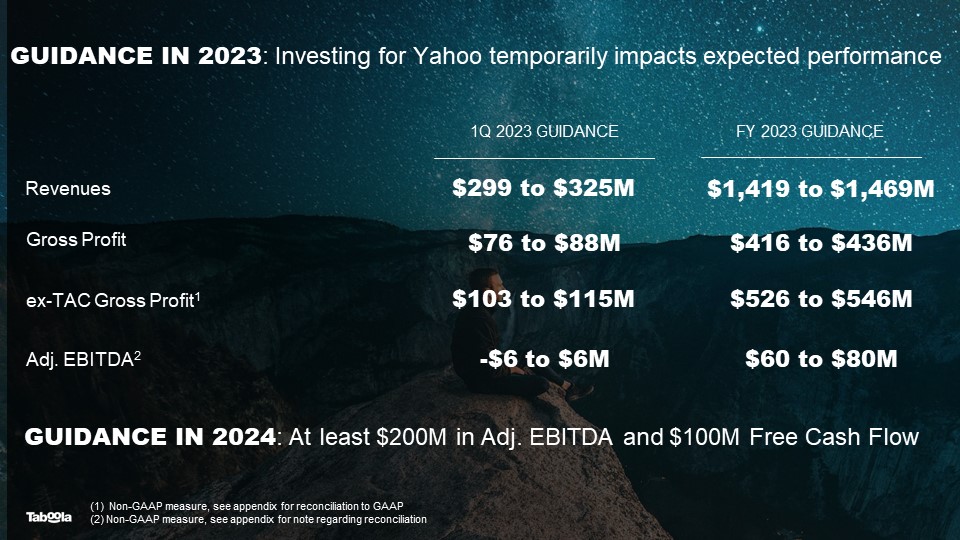

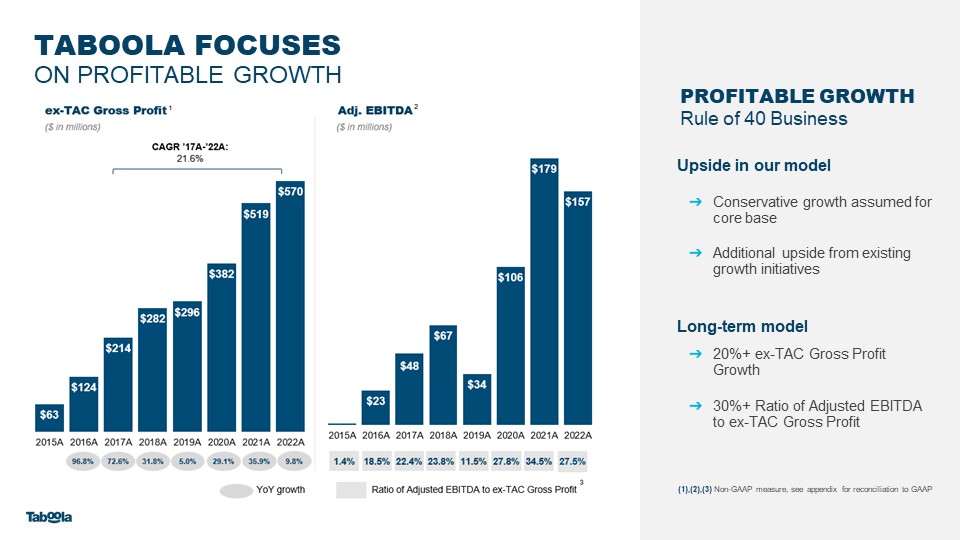
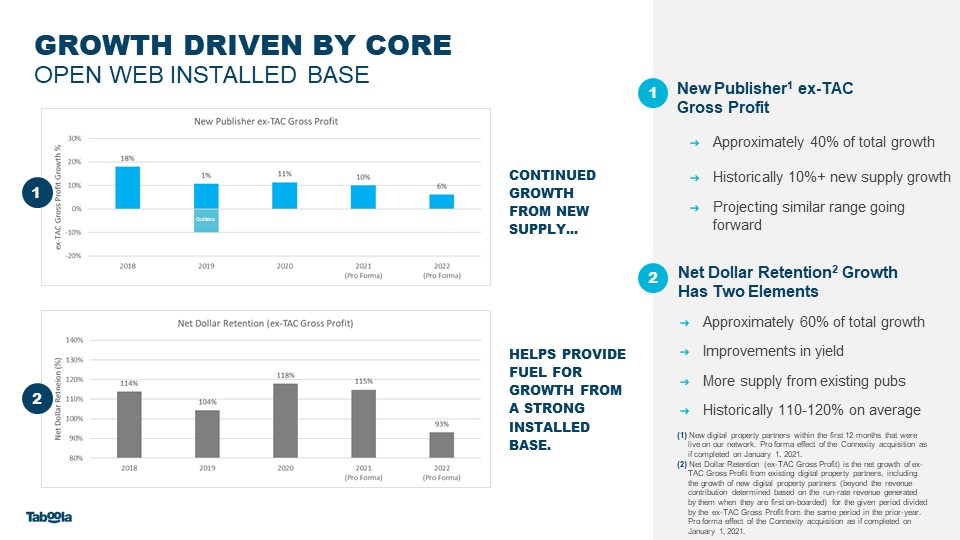
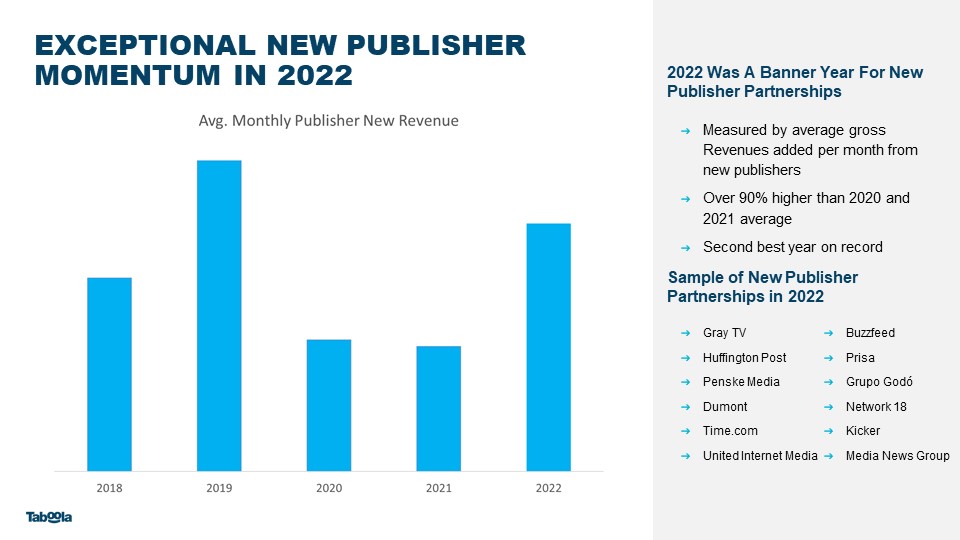
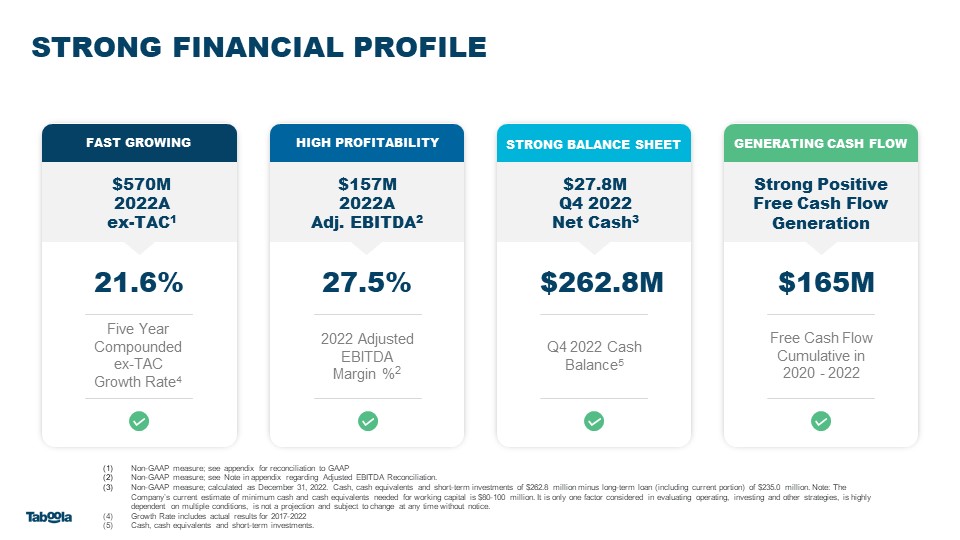

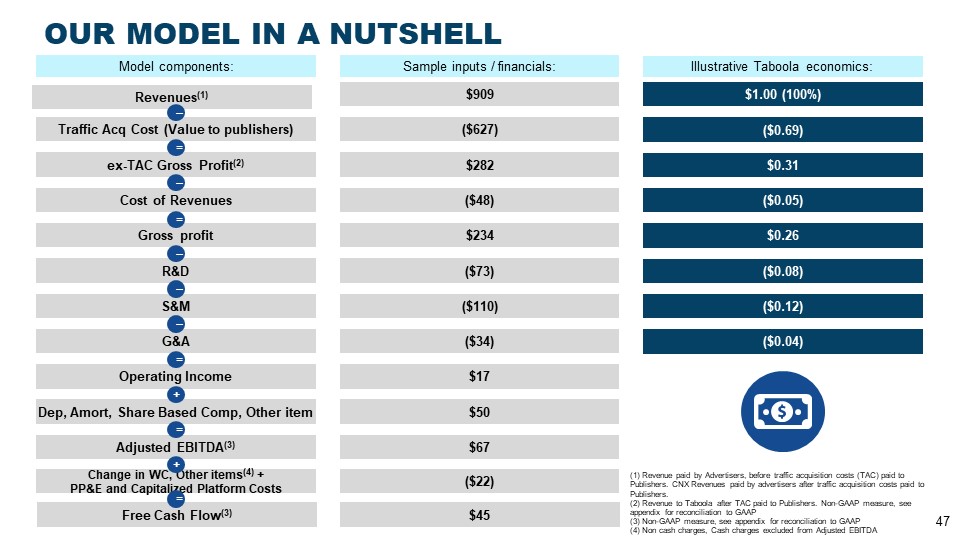
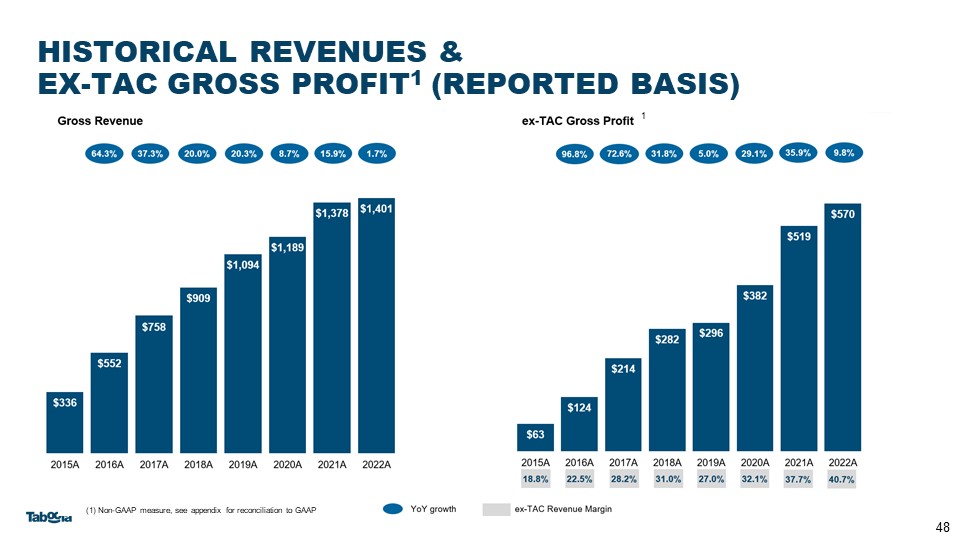
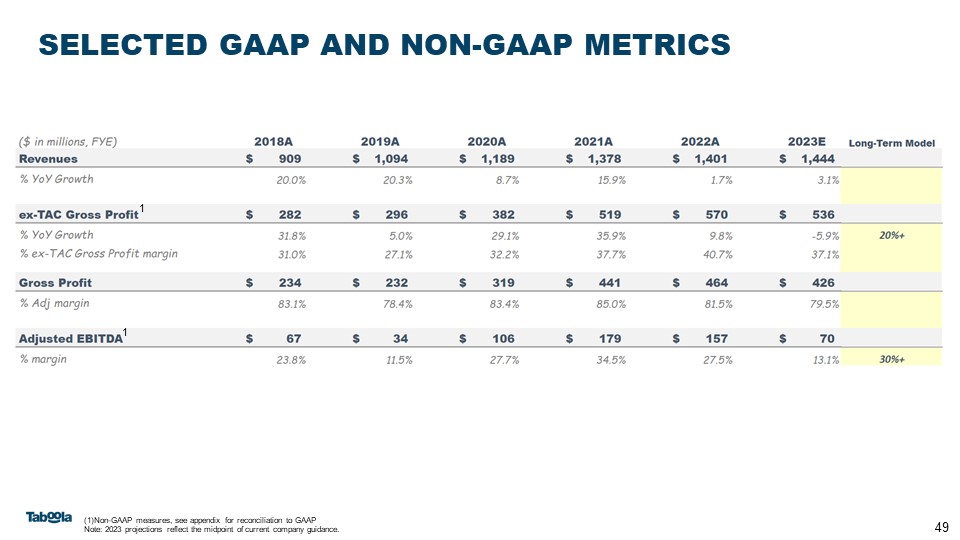
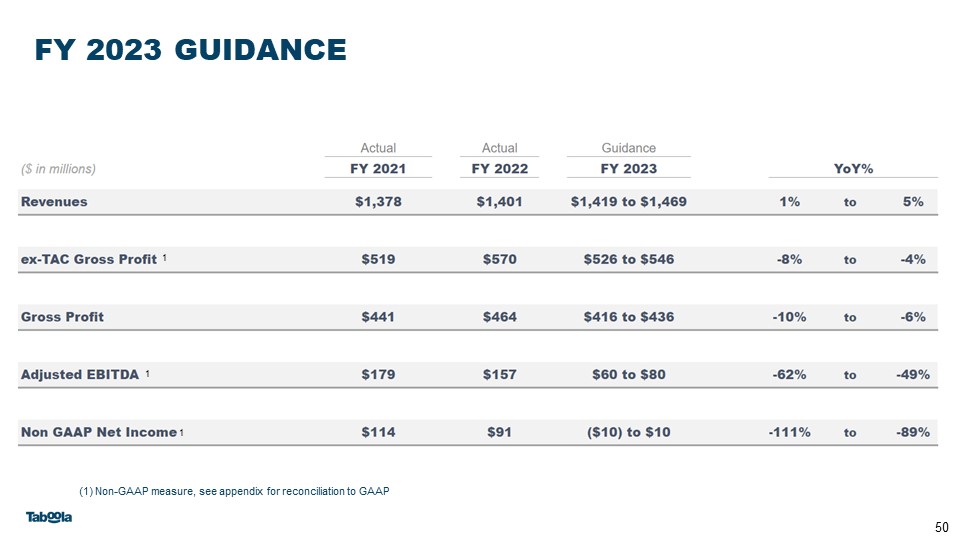
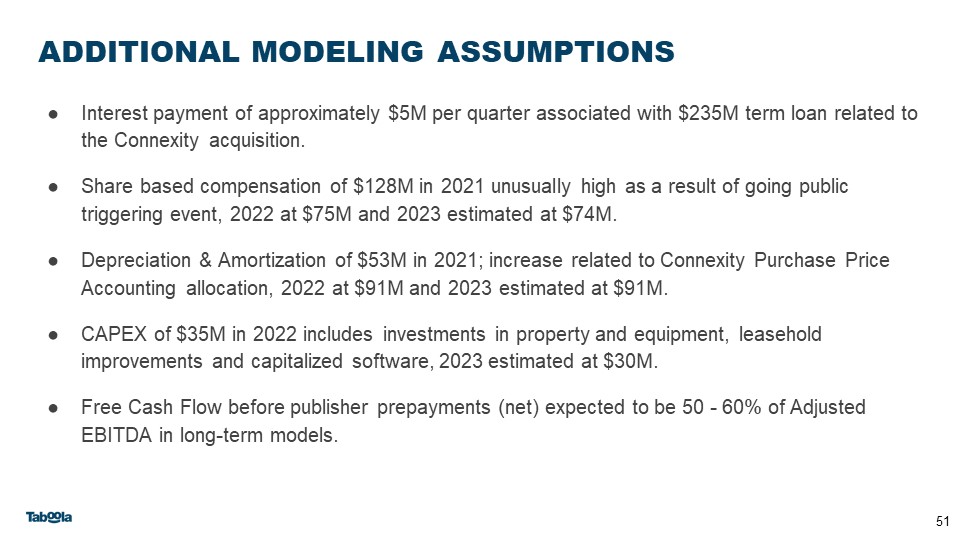
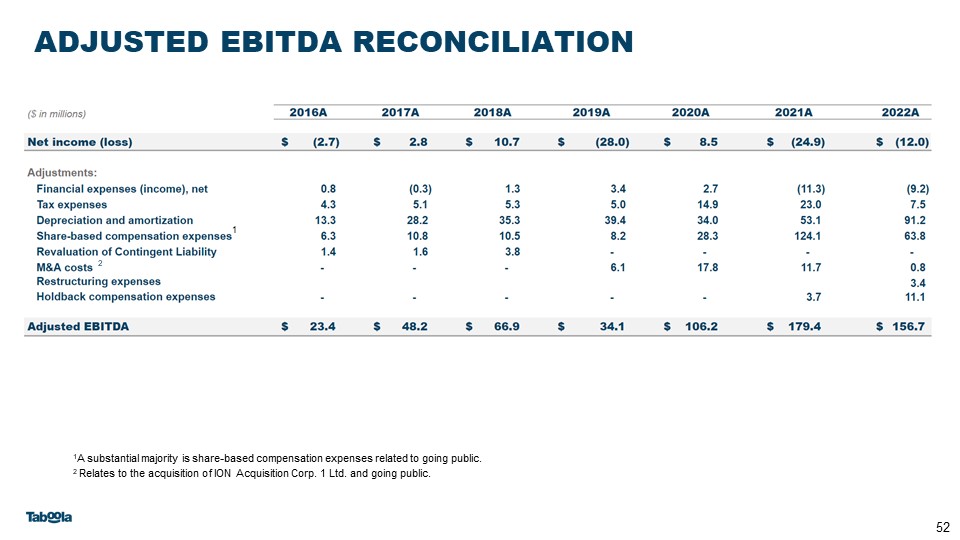
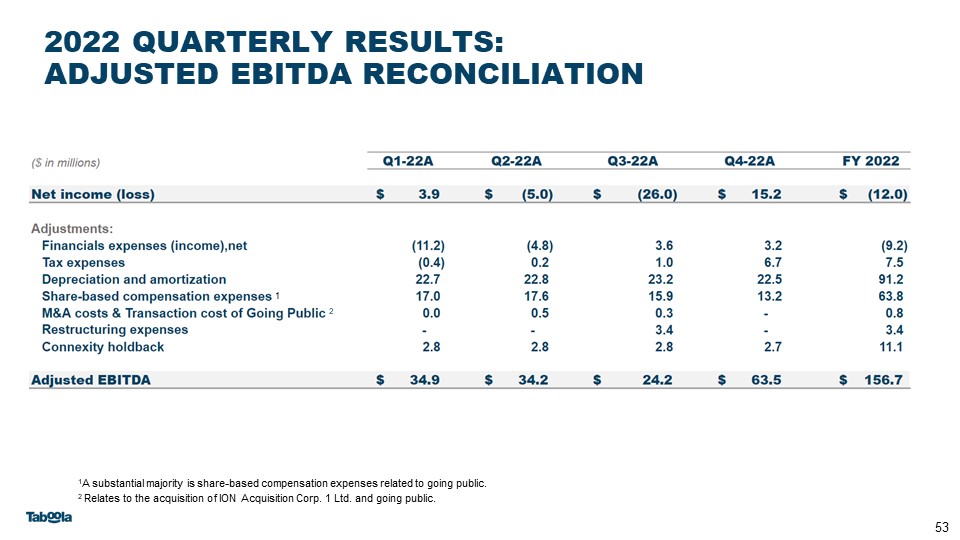
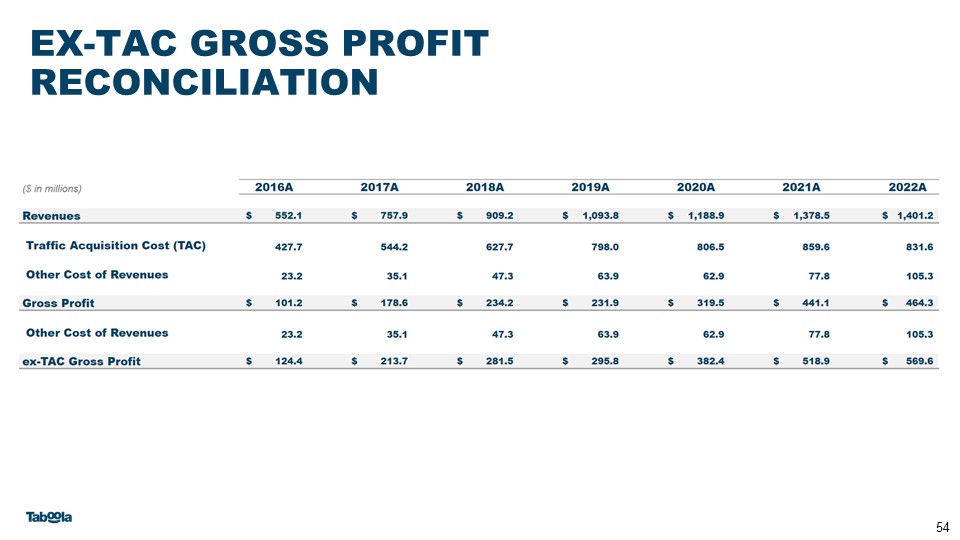
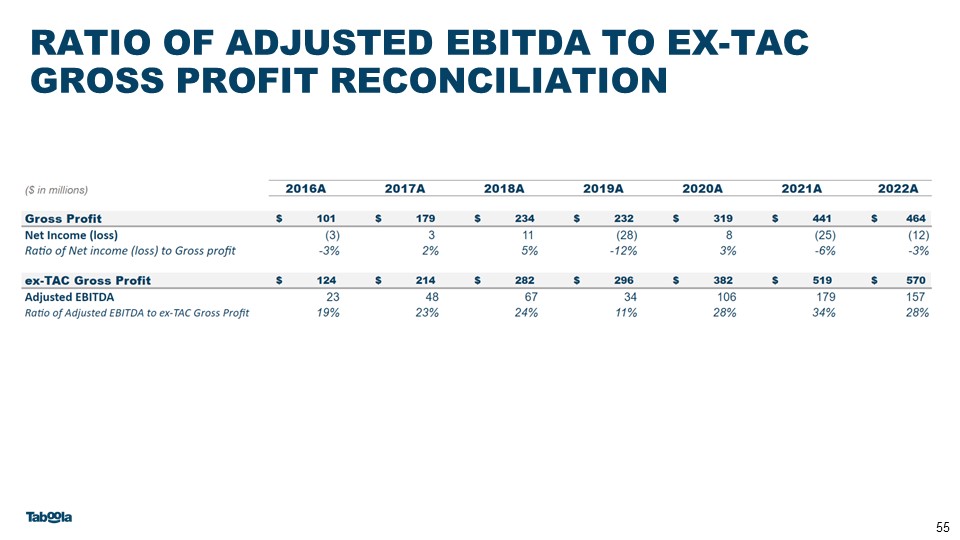
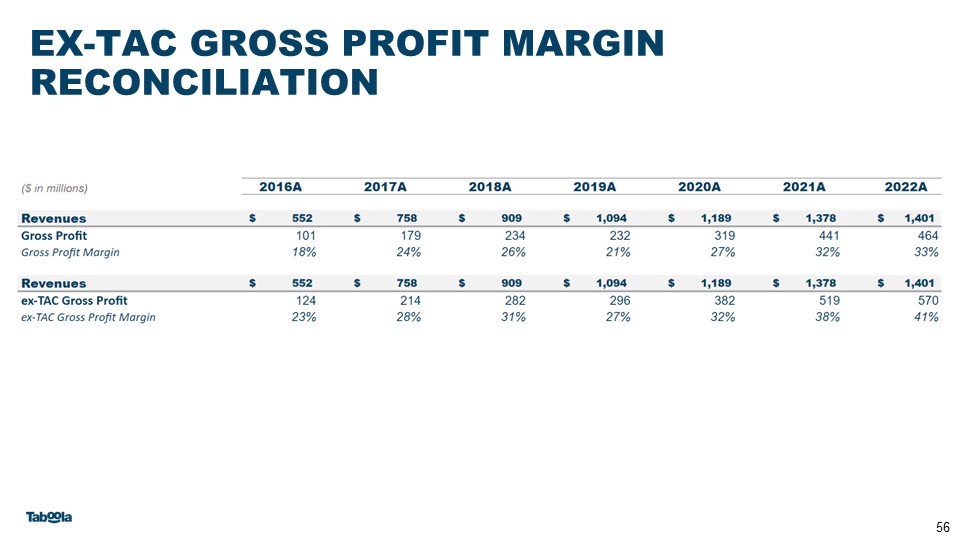
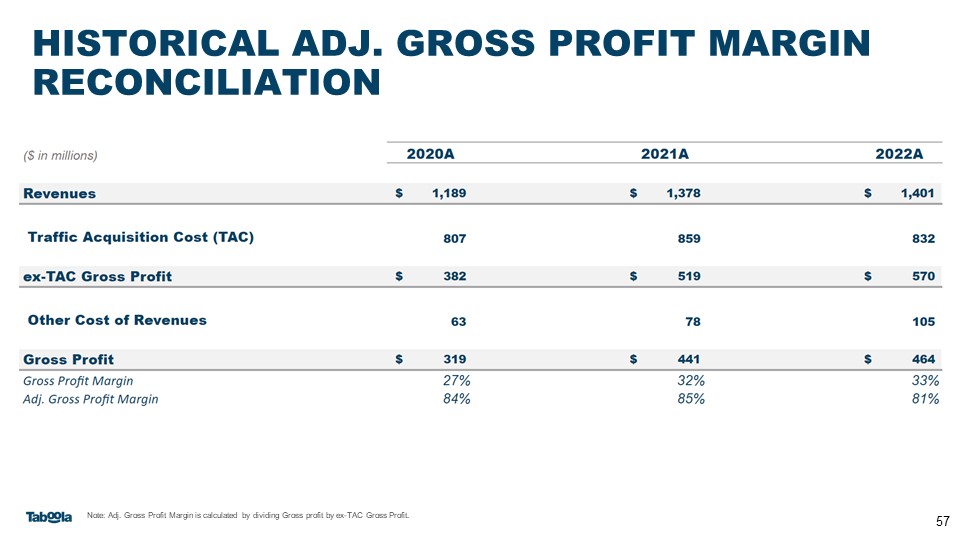
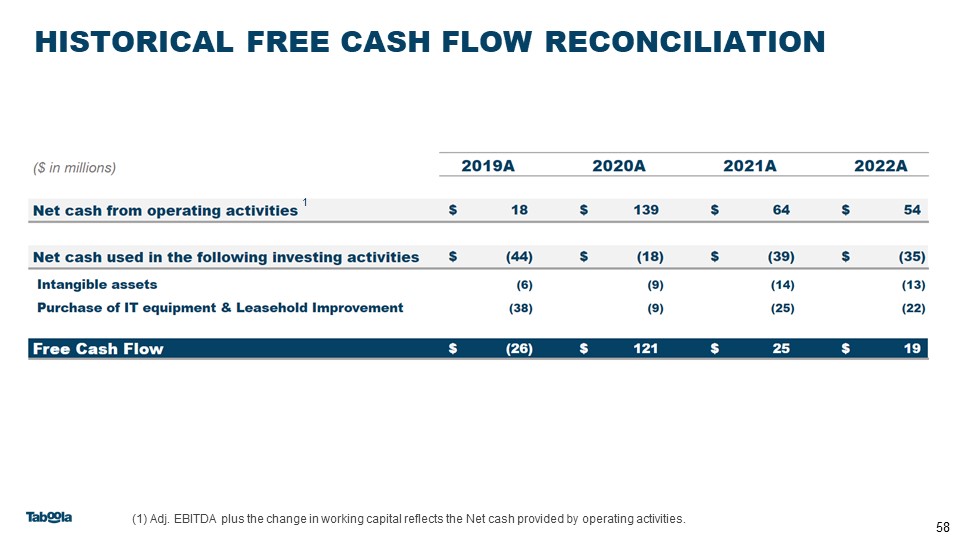
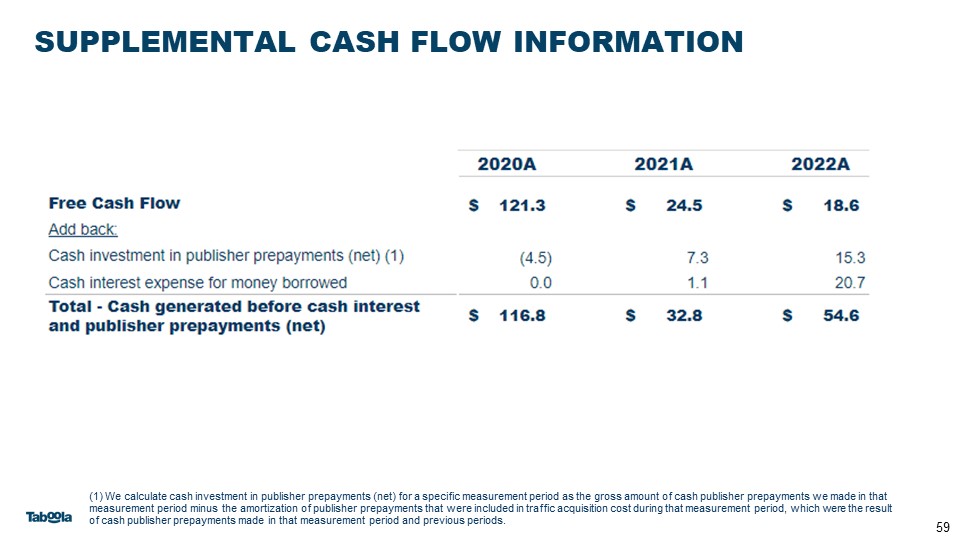
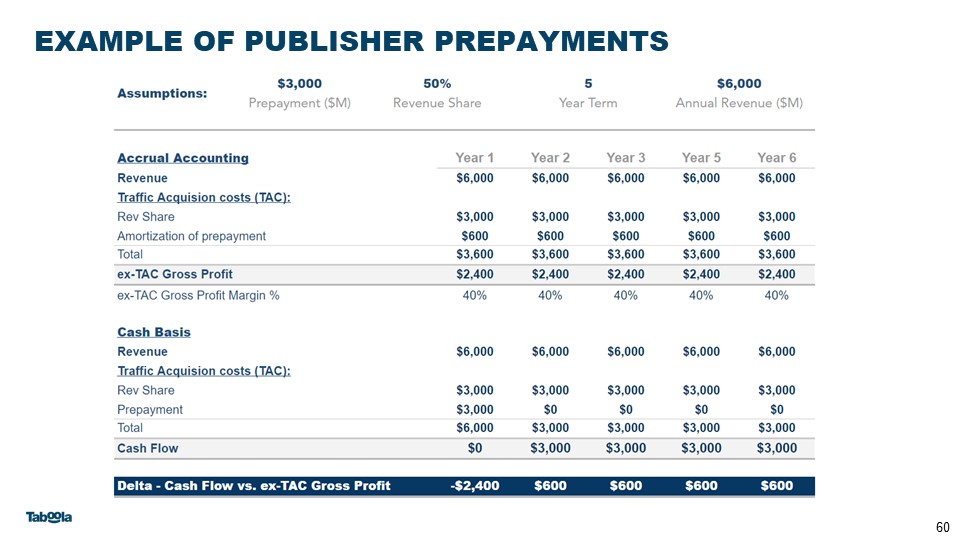
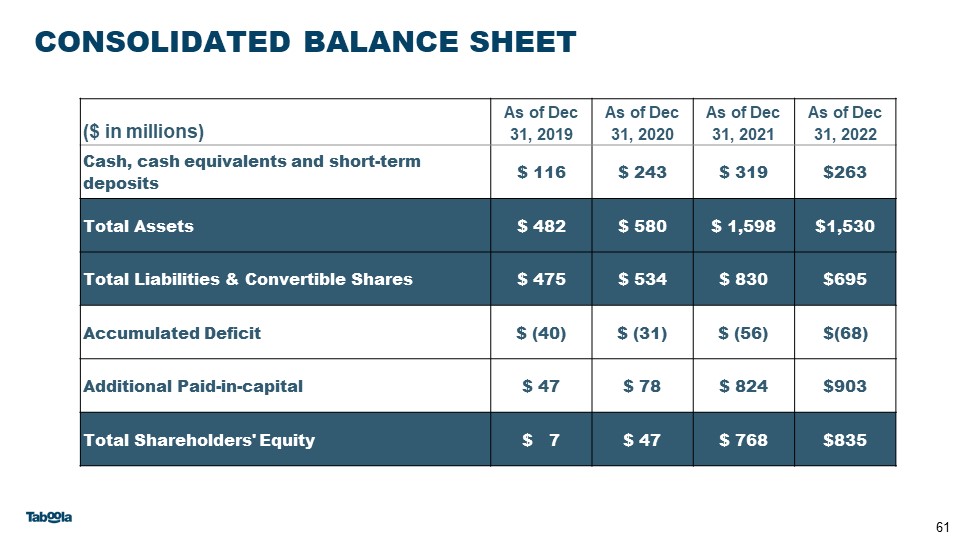
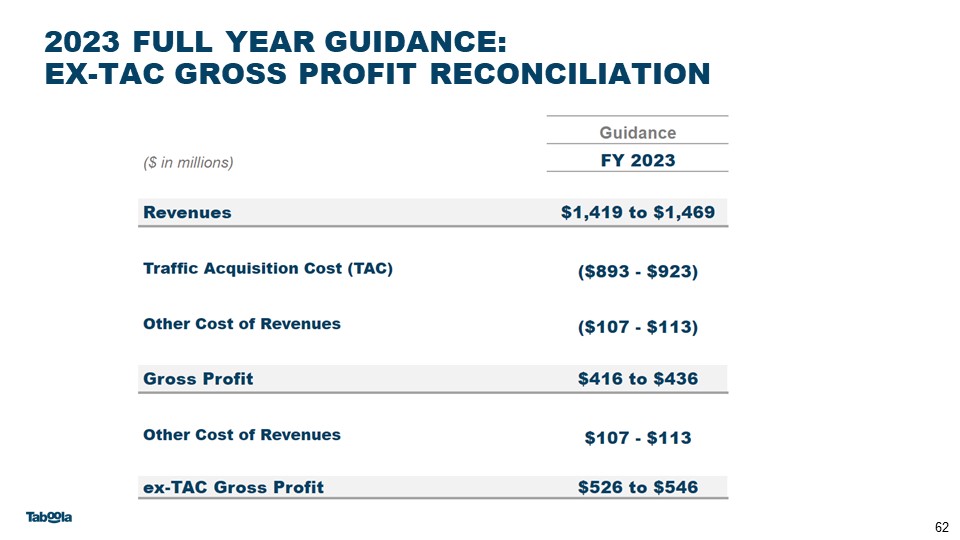

Exhibit 99.4
Q4 2022 Earnings Call Script February 24, 2023
Thank you, and good morning everyone. And welcome to Taboola’s fourth quarter 2022 earnings conference call. I’m here with Adam Singolda our Founder, and CEO; and Steve
Walker our CFO. We issued our earnings materials today before the market and they are available in the Investors section of our website.
Now, I’ll quickly cover the safe harbor. Certain statements today, including our expectations for future periods are forward-looking statements. They are not facts and are
subject to material risks and uncertainties described in our SEC filings. These statements are based on currently available information and we undertake no duty to update them, except as required by law. Today’s discussion is also subject to the
forward-looking statement limitations in the earnings press release. Future events could differ materially and adversely from those anticipated.
During this call, we will use terms defined in the earnings release and refer to non-GAAP financial measures. For definitions and reconciliations to GAAP, please refer to
the non-GAAP tables in the earnings release posted on our website.
Adam Singolda Prepared Remarks:
Thanks Rick. Good morning everyone and thank you all for joining us for our fourth quarter call.
We delivered solid financial performance in Q4 - we came in the middle of our guidance on all metrics, while Adjusted EBITDA was slightly ahead. For the full year 2022 we
achieved $569.6M of ex-TAC, $156.7M of Adjusted EBITDA and positive Free Cash Flow.
Overall, 2022 was a challenging year, but also a year of significant accomplishments. I am very proud of our team at Taboola and the way we were able to manage through the
macro environment, keep our heads down and execute. 2022 was the second best year we have had for signing new publisher partnerships, with over 90% higher new revenue per month than 2020 and 2021; we won a lot.
Great new publisher partners joined us, such as Conde Nast, Buzzfeed Japan, HuffPo, Prisa, Grupo Godó, Network18, United Internet Media, Dumont and Gendai. We won back
publishers that had previously left us, such as Slate, Kicker, Ouest and more. We signed key renewals such as CBSi,Tegna, Fox Sports and BuzzFeed Brazil.
As you recall, our strategy is 2 fold - we want to be recommending anything users may like, content, commerce, over time apps, tv shows and more. We call that Taboola
Anywhere.
The second part of our strategy is called Taboola Anywhere, which is taking our publisher content, technology and advertisers anywhere people spend their time - on OEM
devices like Samsung, and Xiaomi as an example, but over time we want to bring our content to automobiles, home audio devices and more.
On the “Taboola Anywhere” front -- 2022 was a year when Taboola News, our version of “Apple News” but for Android devices, exceeded $50M in annual revenue, and it’s growing
triple digits. We like that type of growth, as well the strategic value it has to our overall core business as publishers are getting more and more traffic from Taboola News.
As part of our “Taboola Anything” strategy, eCommerce gained meaningful momentum with Dynamic Creative Optimization (DCO) rolling out which was the main advertiser success
stories for companies like Snap and Meta. Additionally, we recently announced that TIME.com will be launching our new Taboola Turnkey Commerce solution, which I will talk about a little later.
We finished the year with a transformative 30-year partnership with Yahoo. This is a 3 way partnership - it includes Yahoo advertisers buying Taboola network, building new
contextual segments, and lastly - powering native advertising exclusively for nearly 900M users a month. This is really BIG.
2023 is assumed to be pre Yahoo rollout, while 2024 will have partial Yahoo contribution and meaningful gains. In 2023, we are guiding to 6% lower ex-TAC compared to 2022,
Adjusted EBITDA of $70M and positive Free Cash Flow. There are 4 reasons for weaker year over year results:
First, Q1 and H1 of 2022 were uniquely strong as compared to how we ended 2022 due to the war in Europe and macro economics hitting the US. As part of that, we are entering
2023 with $50M less ex-TAC on a run rate basis than 2022. We expect to return to year-over-year growth in Q3 and Q4 as we lap hard comparables from 2022 H1.
Second, we are investing in a successful Yahoo transition, which will cost roughly $30M this year and includes people, servers, and infrastructure.
Third, we are investing in performance advertising, eCommerce, and header bidding. We believe these three growth investments will help us double and triple Taboola revenue
when Yahoo launches.
1
And fourth, winning market share over time includes a net publisher pre-payment estimate of $15M this year. Like I mentioned last quarter, we see net pre-payments to
publishers being insignificant to none over time as we continue to become even more strategic to their entire organization, so you should assume this is not a permanent part of the financial model.
Let me say that while it’s hard to accept declines this year, it’s very rare that management teams know what the future will look like and are willing to guide for it. 2024
will be a step change in revenue with Yahoo ramping. We expect to generate at least $200M in Adjusted EBITDA, and at least $100M in Free Cash Flow in 2024, and
to be conservative - this assumes Yahoo is only being live by June of 2024, and no revenue in 2023. Obviously, we are working hard to beat those assumptions we’re sharing with you now.
That’s why we refer to 2023 as an investment year, we’re putting in meaningful resources this year for gains we feel strongly are coming next year and beyond.
Taking a step back, especially with Google and Meta now being less than 50% of the ad market and privacy concerns on the rise, advertisers will be looking for contextual advertising partners with scale. With the Yahoo partnership, we are one step
further towards our long-term goal of becoming the largest open web advertising company in the world by revenue. We estimate we would have had roughly $2.5 billion of revenue in 2022 if Yahoo had been on our network and we were fully integrated as of
the beginning of the year. That would have put us side by side to companies like Twitter, Snap, Pinterest and The Trade Desk - with mainly Google, Meta and Amazon much bigger than us. And Taboola is the only company to my knowledge at our size that
is fully dedicated to the open web, serving both publishers and advertisers directly.
I’m convinced that - the open web will have a “walled garden strong” company that is going after our estimated $70B TAM, and I believe we are making meaningful steps
towards that vision with Yahoo launching, as well as our growth engines materializing.
Let me provide a brief update on those growth engines, performance advertising, eCommerce and header bidding. These are where we have the most to gain as a company to
further drive growth in years to come.
Our goal with our investments in performance advertising is to make Taboola the
first and best choice for any performance advertisers that want to reach consumers in the Open Web. We are currently focusing our investments in four key areas. First, we are working on new bidding strategies that will help advertisers with different
goals to be successful on our network. Previously, we had shared how SmartBid automates the bidding process for our advertising partners. Now we are working on enhancements to SmartBid that will allow advertisers to do things like set a target CPA
and allow the algorithm to even set the initial bid, rather than just adjust the bid across the network as SmartBid did previously, or to maximize conversions, even at the expense of CPA targets. Second, we are working on new ways of finding high
intent nuggets for very specific audiences in our supply. Third, we are investing in new ways to help advertisers drive clicks and conversions, such as with new creative formats and enhanced landing pages. For instance, we are currently working on
Generative Artificial Intelligence that will help advertisers write more creative and appealing headlines and even generate new images from scratch. If you can, please come see a demo of this amazing new generative AI technology at our Yahoo Deal
Information Session on March 1 - it is really cool stuff.
2
Fourth, we are investing in technologies that will be smarter about how we match ads with users and especially how we ensure that advertisers see results as quickly as
possible.
I just came back from a trip to Israel during which I spent time with our R&D teams working on this and I have to tell you - I was blown away about how passionate our
200 person tech team is, and about the future of the Taboola advertising platform. We have so much more that we can do.
We continue to see good progress with our investments in eCommerce as well. I
mentioned the momentum we’re seeing with DCO, essentially Connexity retailers automatically place their product libraries on our network. It has allowed us to significantly grow the amount of eCommerce demand that shows up in our traditional Taboola
placements, such as in the bottom of article feeds. We recently launched “eCommerce circulation widgets” to help drive users to commerce pages, which helps our publishers drive traffic from general news pages to high intent commerce pages.
We also just announced an exciting new initiative in eCommerce that we call Taboola Turnkey Commerce. This was the missing link to take our eCommerce business to the next
level. Every publisher that wants to get into eCommerce, but has little or no content attractive to retailers, can now do it with Taboola. Taboola does all of the work for the publishers, from using our data to know which content makes sense for us
to write on behalf of the publisher, we write the content, we drive traffic to it, we monetize it with the relationships with merchants and service providers. We are very excited to have announced our first two publisher partners for this initiative:
TIME and Advance Publications through their NJ.com site. I don’t know of any other full stack eCommerce solution that can do this, while it’s still new for us, I can tell you publishers are calling us about this product left and right. Everybody
wants a “NYTimes WireCutter” like business, and we will enable it.
Last but not least, we are investing heavily in header bidding. This is important
to our future because this is one of the ways that we will expand beyond our traditional bottom of article placements and continue to grow our share of Open Web which is still dominated by display ads. Header bidding allows us to compete for this
supply using our first party data, our unique CPC demand, and our proprietary technology that is able to predict which ads are likely to perform well, generate a profitable CPM-based bid. We launched this technology with our first partner, Microsoft,
in April 2022 and we are generating hundreds of millions of dollars of revenue from that partnership. Since then, we have started beta testing the technology with an additional 50+ publisher partners and we are starting to see traction.
3
For the first time, we’re starting to see a few publishers generating a few millions of dollars a year from it on top of our core partnership, which increases our share of
wallet, and our moat as we look to win new partnerships and expand existing relationships.
2023 will be a year of investment in our 30-year partnership to be the exclusive native advertising partner for Yahoo. This is big for us, big for Yahoo, and I think big
for the advertising community. It will be very accretive to our financials, as we shared publicly - if this was live in 2022 it would have multiplied our free cash flow by 5x to north of $100M+ and add $150M of adjusted EBITDA.
We are full on in planning mode, and 2023 will require a lot of work and investment to make it a successful transition - just think about thousands of advertisers
transitioning, many page types, employees, infrastructure, and more.
We expect the transition to occur in three phases. Currently, in Phase 0, we are
designing the technology migration plan - you can think of this phase as designing the plumbing system between the two platforms so, when completed, advertisers on Yahoo’s platform can spend on Taboola’s supply and advertisers on Taboola’s platform
can spend on Yahoo’s supply.
Soon, we will move to Phase 1 of the migration, in which we will build that
plumbing system and “test the pipes” by starting to flow small amounts of demand between the platforms, move some of the supply and transition a small number of advertisers to test the experience. We expect Phase 1 to be complete in the second half
of 2023.
Once we validate the pipes and our transition plans, Phase 2 will begin and will
involve transitioning the advertisers and supply from Yahoo to Taboola. At this point, the migration will mostly be “blocking and tackling” but we still need to be thoughtful in the process because we want every advertiser making the transition to
have a great experience and to thrive and grow on the Taboola platform - we don’t want to trade long-term gains for short-term revenue.
We expect Phase 2 to begin in the second half of 2023 and be completed sometime in 2024, at which point we will be fully ramped and will be able to focus on additional
growth opportunities from our partnership with Yahoo.
We’re building our rockets this year, and in 2024 we will have liftoff. We will become bigger, more competitive, and I was never as excited about where we are and our
future.
I’ll now pass it over to Steve, our CFO, to talk more about our financials.
4
Thanks Adam and good morning everyone.
As Adam noted, our Q4 and Full Year 2022 results were within our guidance ranges. All metrics were above the midpoint of our guidance except ex-TAC Gross profit, which came
in just below our midpoint.
For the full year, we finished 2022 with approximately $1.4 billion in Revenue, $570 million in ex-TAC Gross Profit and $157 million in Adjusted EBITDA. We had a Net Loss
of $12 million and Non-GAAP Net Income of $91.4 million. We also generated positive Free Cash Flow for the year, generating $18.6 million of cash, despite the challenging macroeconomic conditions. I would note that 2022 was a banner year for us on
the supply side of our business. On average in 2022, we brought in over 90% more new digital property partner revenue per month than we averaged in 2020 and 2021. Our churn rates for our digital property partners were also at historically low levels.
In addition, we gained valuable new supply from Taboola News as we grew that business to over $50 million in revenue in 2022.
For the quarter, our Q4 Revenues were approximately $371 million, our ex-TAC Gross Profit $159 million, our Net Income $15.2 million and Non-GAAP Net Income $43.3 million.
ex-TAC Gross Profit declined approximately 6% year over year, which included a drag of almost 5% from foreign currency exchange rate headwinds. Revenues were aided by the addition of approximately $35 million of new digital property partners, but
were decreased by approximately $71 million decline in our existing digital property partners. The decline in our existing digital property partners, which is a very unusual occurrence for us, was caused by the global macroeconomic weakness and the
resultant reductions in advertising budgets by many of our advertising partners.
Operating expenses were down around $17 million year over year. This decrease was primarily the result of our focus on cost reductions that started with decreased
discretionary spending around mid-year and continued with our cost restructuring program announced in Q3.
We generated Adjusted EBITDA of $63.5 million in the quarter and approximately $157 million for the full year, both of which were in line with our expectations.
GAAP Net Income for the quarter of $15.2 million for Q4 and our GAAP Net Loss of $12 million for the full year included Intangibles Amortization of $16 million for the
quarter and $64 million for the full year, Share-Based Compensation expenses, excluding the holdback related to the Connexity acquisition, of $13 million for the quarter and $64 million for the full year, and restructuring charges of $3 million for
the full year, which were excluded from Non-GAAP Net Income. Our Non-GAAP Net Income of approximately $43 million for the quarter and approximately $91 million for the full year were both above the high end of our guidance ranges.
5
In terms of cash generation, we had approximately $20 million in operating cash flow in Q4 and approximately $53 million for the full year, with Free Cash Flow of around
$14 million for the quarter and $19 million for the full year. That Free Cash Flow was after Net Publisher Prepayments of $3 million in Q4 and $15 million for the full year, as well as $6 million of interest payments on our long-term debt in the
quarter and $21 million for the full year. I would also note that the combined balance of our Cash and cash equivalents plus our Short-term investments declined from approximately $319 million at the end of 2021 to approximately $263 million at the
end of 2022. The decline is more than fully explained by our decision to repay approximately $61 million of our long-term debt. We decided to do this in Q4 because of rising interest rates. We have historically kept a relatively large amount of cash
on our balance sheet in order to maintain operating flexibility in case certain opportunities came along that required large amounts of cash on short notice, for instance the acquisition of a distressed asset or a large publisher win that would
necessitate a large upfront prepayment. You could think of the upside of this policy as maintaining option value. However, as the cost of maintaining this option has risen with rising interest rates, and given the fact that we now have a revolving
credit facility to draw upon as well, we decided to pay down some of our long-term debt. We expect to retire $30 million to $40 million more of the debt in 2023.
Now let me shift to our forward looking guidance. I should note that our guidance assumes continued weakness in the macro environment at current levels for the rest of
2023, but not a significant worsening of the macro environment. As I mentioned earlier, the decline in our year-over-year Revenues and ex-TAC was the result of the macroeconomic softness that started in Europe at the end of Q1 and spread to the US
and most of the rest of the world at the end of Q2. We had relatively normal seasonality in Q4, so that softness did not worsen, but it does mean that we entered 2023 at a much lower run rate than we had starting 2022. The way to see this is to look
at our Q3 2022 numbers. Historically, Q3 contributes almost exactly 25% of our ex-TAC in a given calendar year, so if you multiply our Q3 ex-TAC by 4, that is a good estimate of our run rate entering the subsequent year. In Q3 2022, we had $129.3
million of ex-TAC, which means we entered 2023 with a run rate of around $517 million - over $50 million lower than our 2022 full year numbers.
This lower run rate of $517 million was the starting point for our 2023 projections. After applying our expected growth, we are guiding to full year Revenues of $1.42
billion to $1.47 billion and ex-TAC of $526 million to $546 million. This guidance does not currently include Revenues or ex-TAC from Yahoo. We have chosen not to include Yahoo Revenues or ex-TAC in our guidance because we have not finalized our
planning process and therefore it is too early to accurately forecast when we should start seeing the revenue from that partnership. We will update as we progress through the year and have better visibility into that.
To that point, this year will be a significant investment year for us. We did factor in almost $30 million of cost related to Yahoo into our guidance. These expenditures
will be required to support the transition of the Yahoo supply and advertiser relationships onto our platform. In addition, we recently announced an initiative called Taboola Turnkey Commerce with TIME as our initial partner. We believe this
initiative will generate significant returns over time and meaningfully increase the growth rate in our eCommerce initiatives. We will invest $5-$10 million in this initiative in 2023.
6
These investments in Yahoo and Turnkey Commerce are on top of the investments that we are making in our top company priorities of performance advertising, header bidding
and our other eCommerce initiatives. After the impact of these investments, we are guiding to $60 million to $80 million of Adjusted EBITDA and a Non-GAAP Net Income range of negative $10 million to positive $10 million.
Let me finish by saying that we are very confident that all of these investments will begin to pay off in 2024 and will continue to drive growth beyond next year. Adam has
said many times internally that we are in a very unique position right now because it is rare for a company to have such a clear picture of what the future looks like and I agree with him. It is because of that confidence that we are comfortable
guiding to Adjusted EBITDA in 2024 of over $200 million and Free Cash Flow of over $100 million. It is also important to note that 2024 will still only be a partial year for Yahoo, as that business will not be fully transitioned until mid-2024.
Please come to our Yahoo Deal Information Session on March 1 to hear more about what you can expect from that partnership. You can register on our investor website under
the “Events” tab or by sending an email to [email protected].
With that, let’s open it up to questions.
7