Operator
Ladies and gentlemen, thank you for joining us and welcome to the Thrive First Quarter 2026 Earnings Call. After today's prepared remarks, we will host a question and answer session. If you would like to ask a question, please raise your hand. If you have dialed into today's call, please press star 9 to raise your hand and star 6 to unmute. I will now hand the conference over to Cameron Lessard, Senior Vice President, Corporate Development and strategy. Cameron, please go ahead.
Good morning, and thank you for joining us for Thrive Holdings' first quarter 2026 earnings conference call. With me today are Joe Walsh, Chairman and Chief Executive Officer, and Paul Rouse, Chief Financial Officer. Before we begin, I'd like to remind you that today's call may contain forward-looking statements, including statements about our business outlook and strategy, future financial results, growth prospects, and any other matters that are not historical facts. These statements are subject to risks and uncertainties and our actual results may differ materially. Please refer to our most recent filings with the SEC for a discussion of factors that could cause our results to differ materially from these forward-looking statements. We do not undertake any obligation to update these statements. In addition, today's discussion will include references to non-GAAP financial measures.
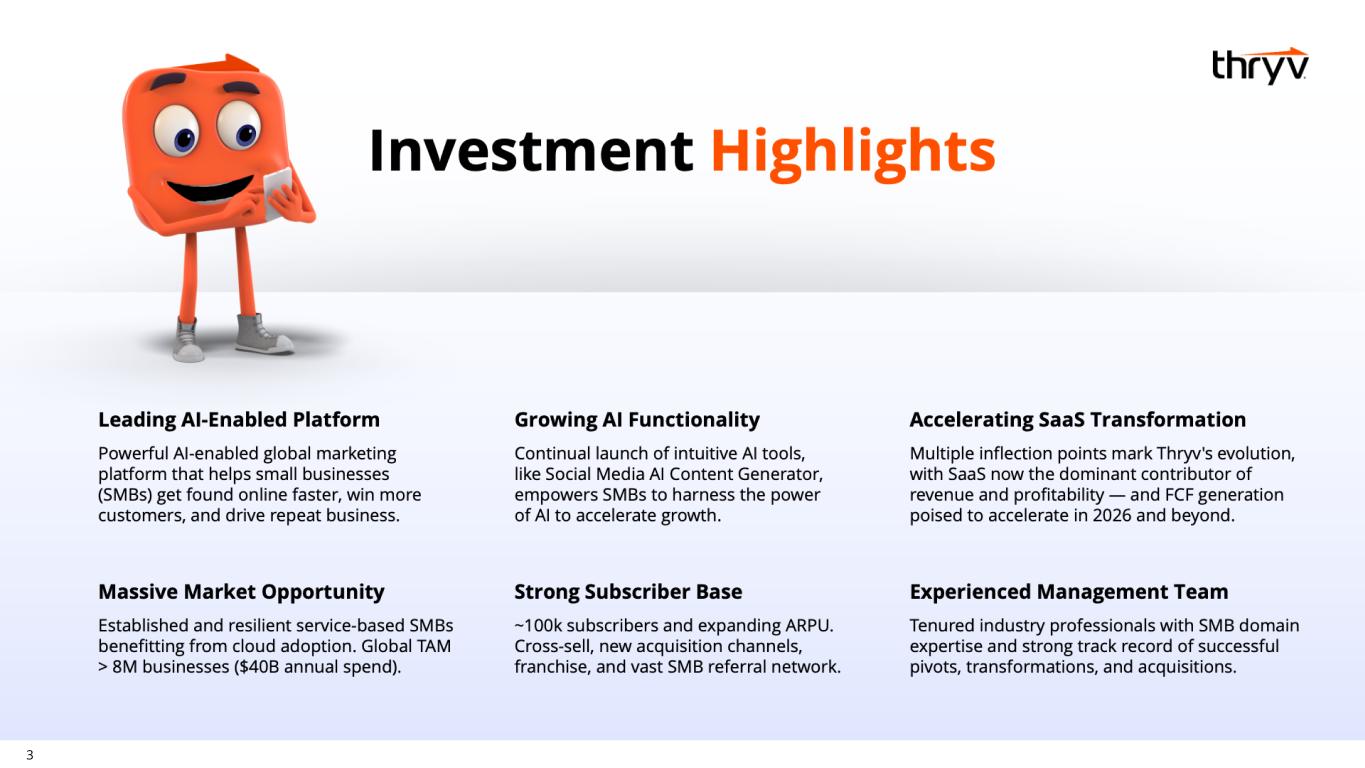
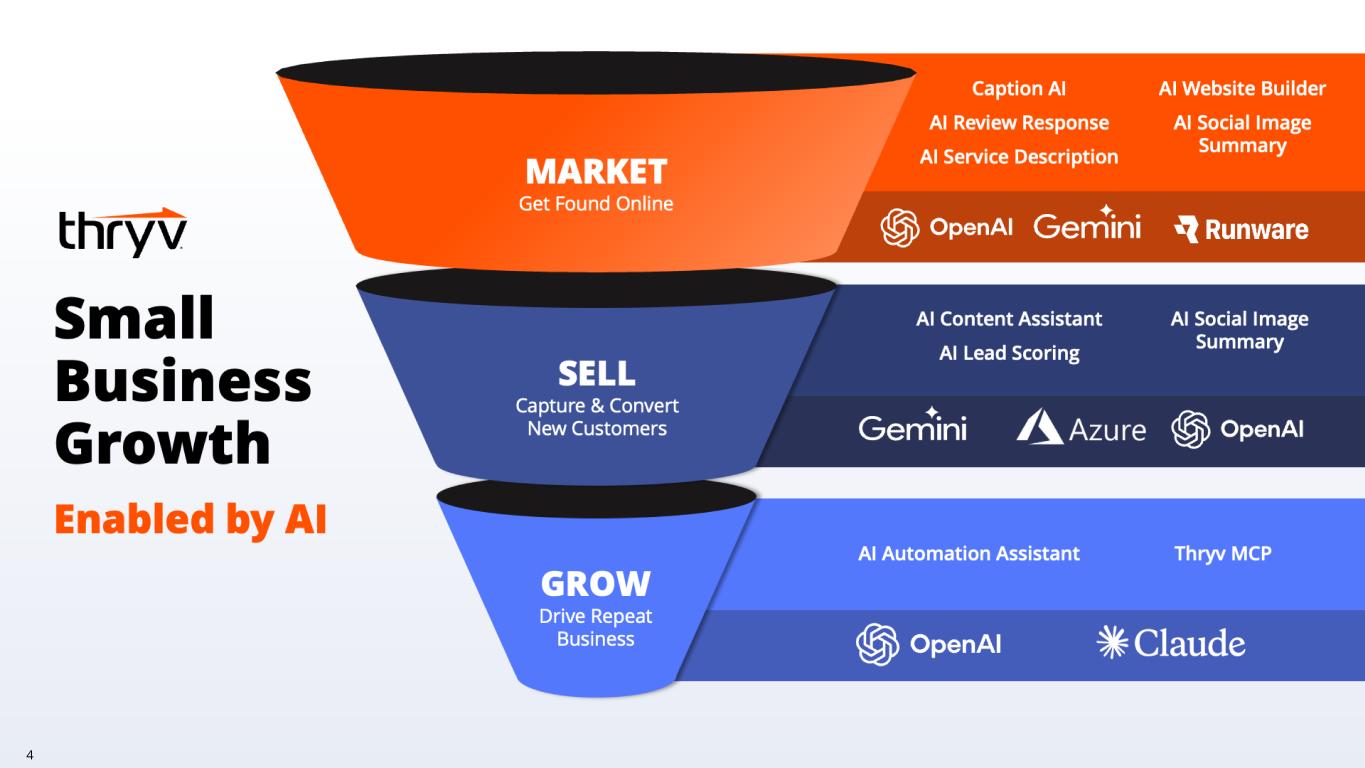
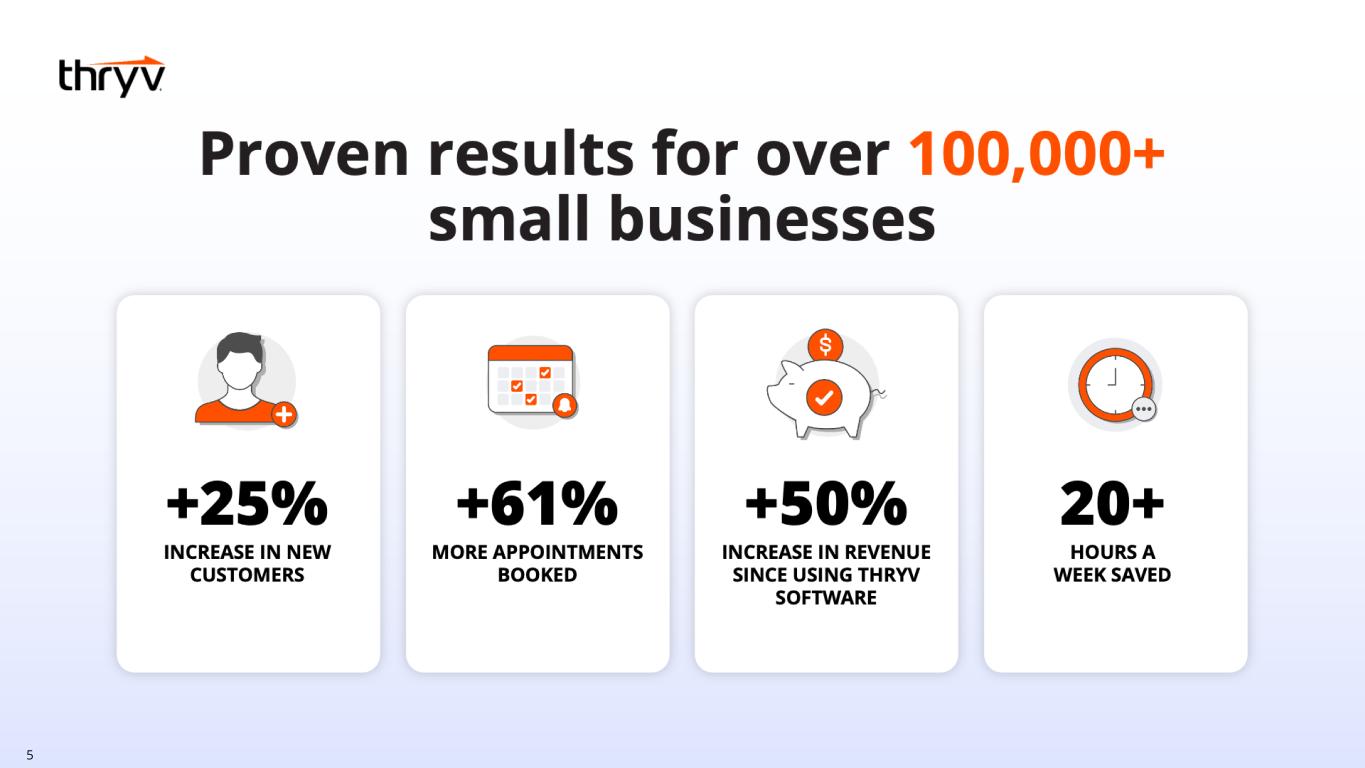
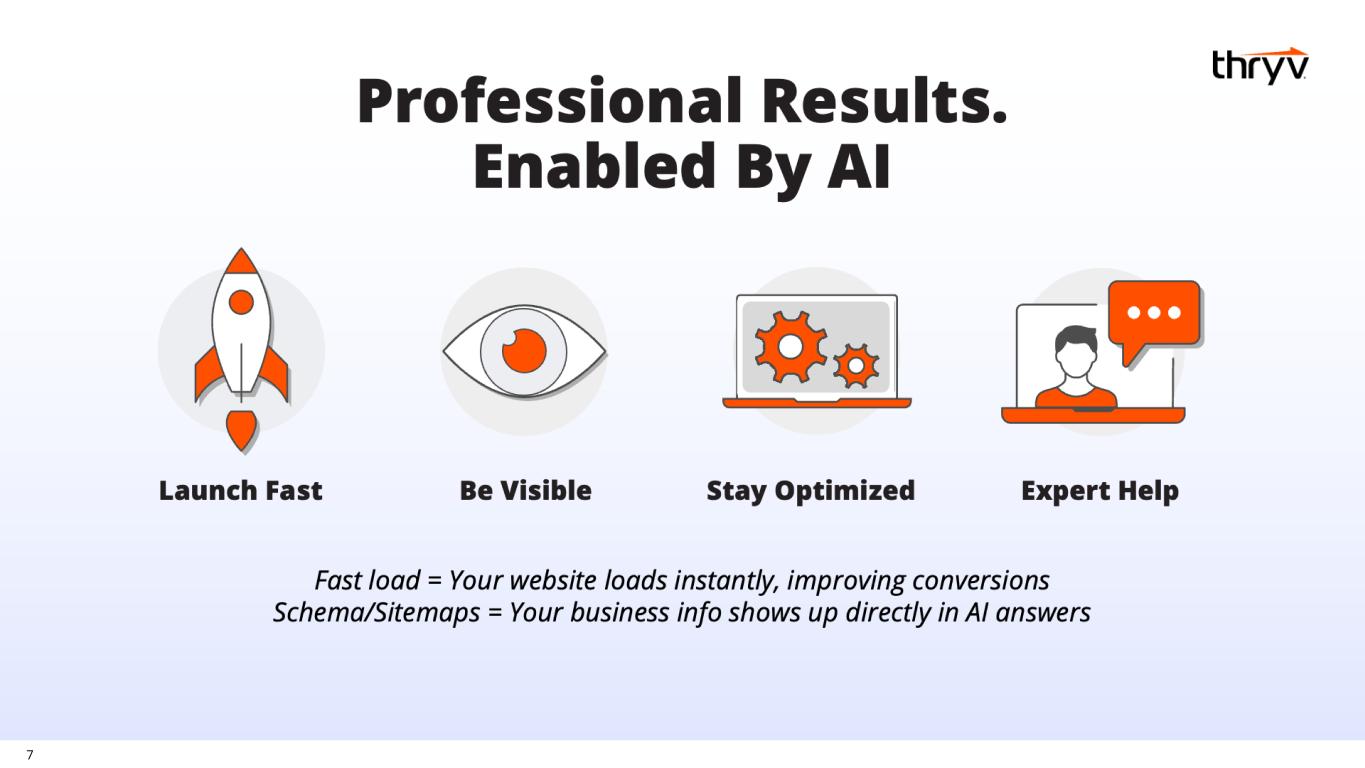
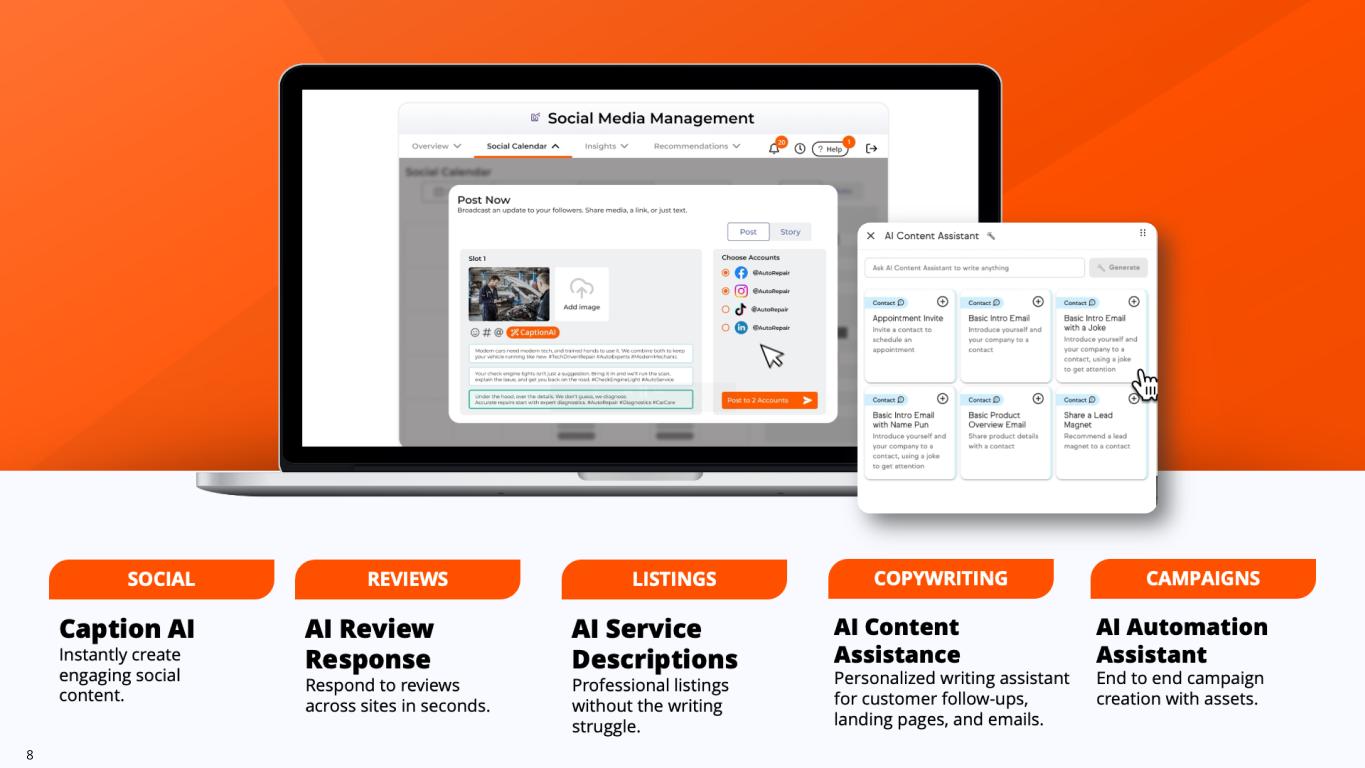
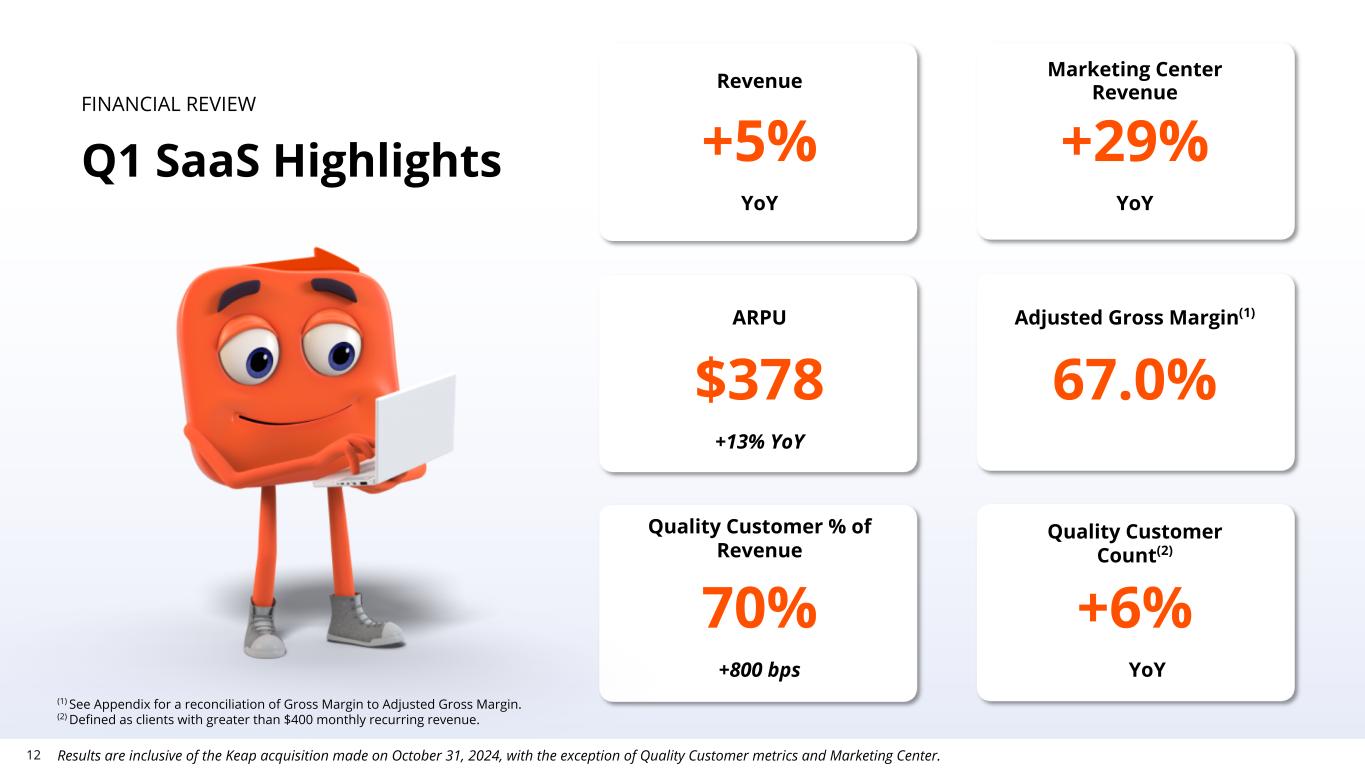
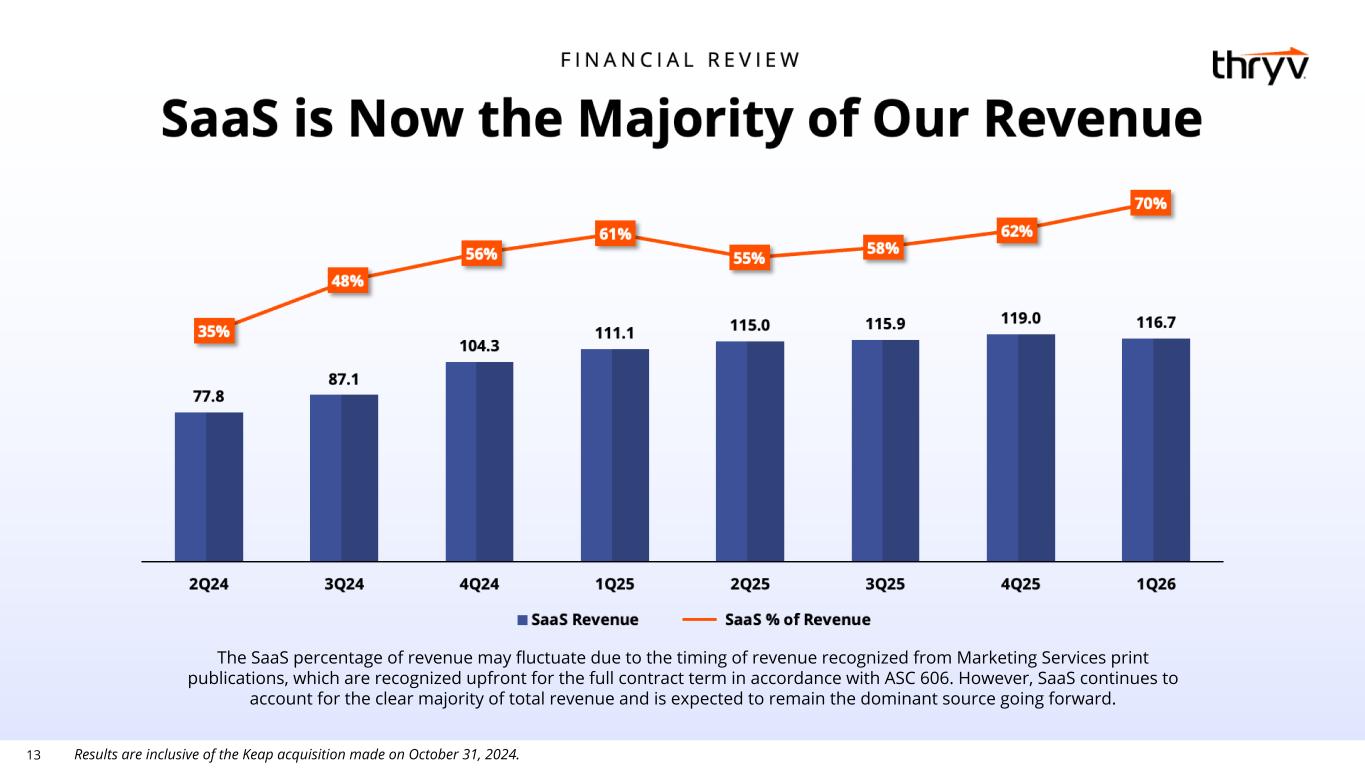
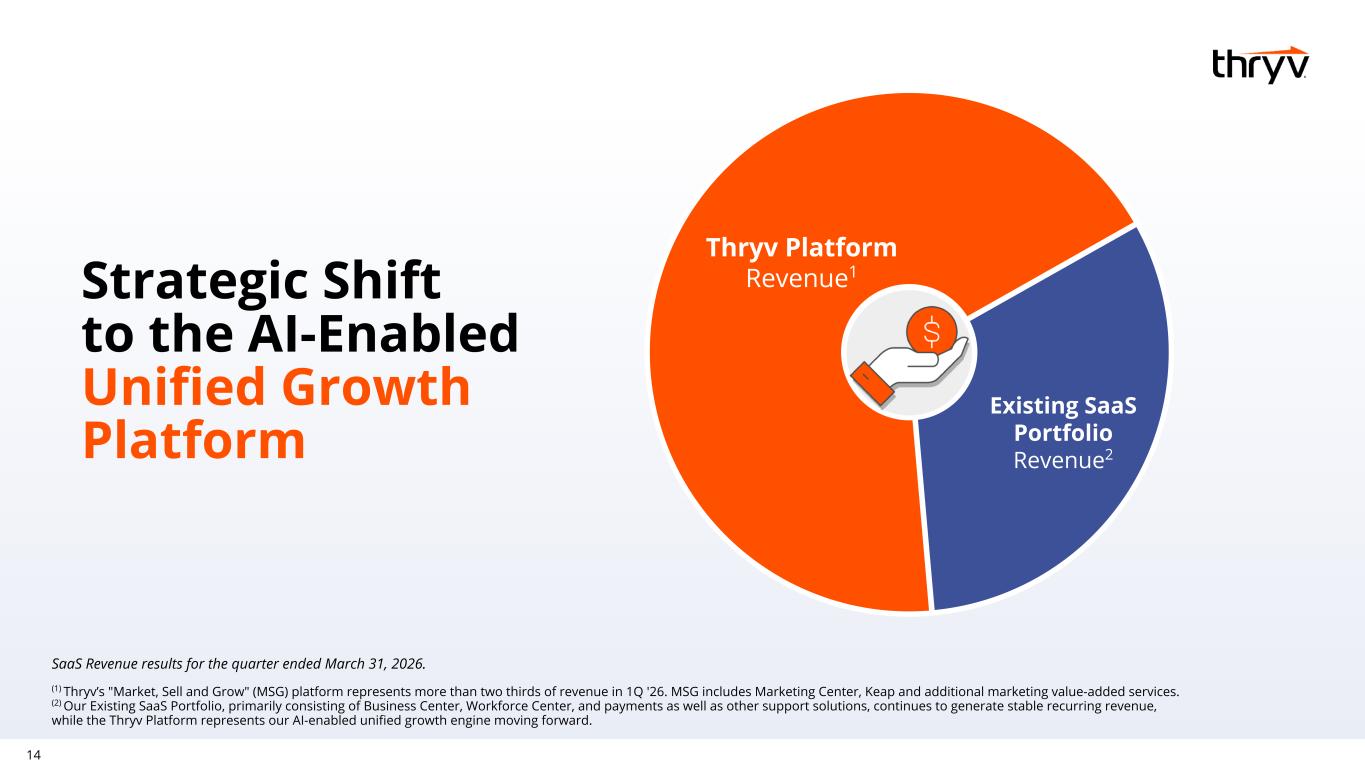
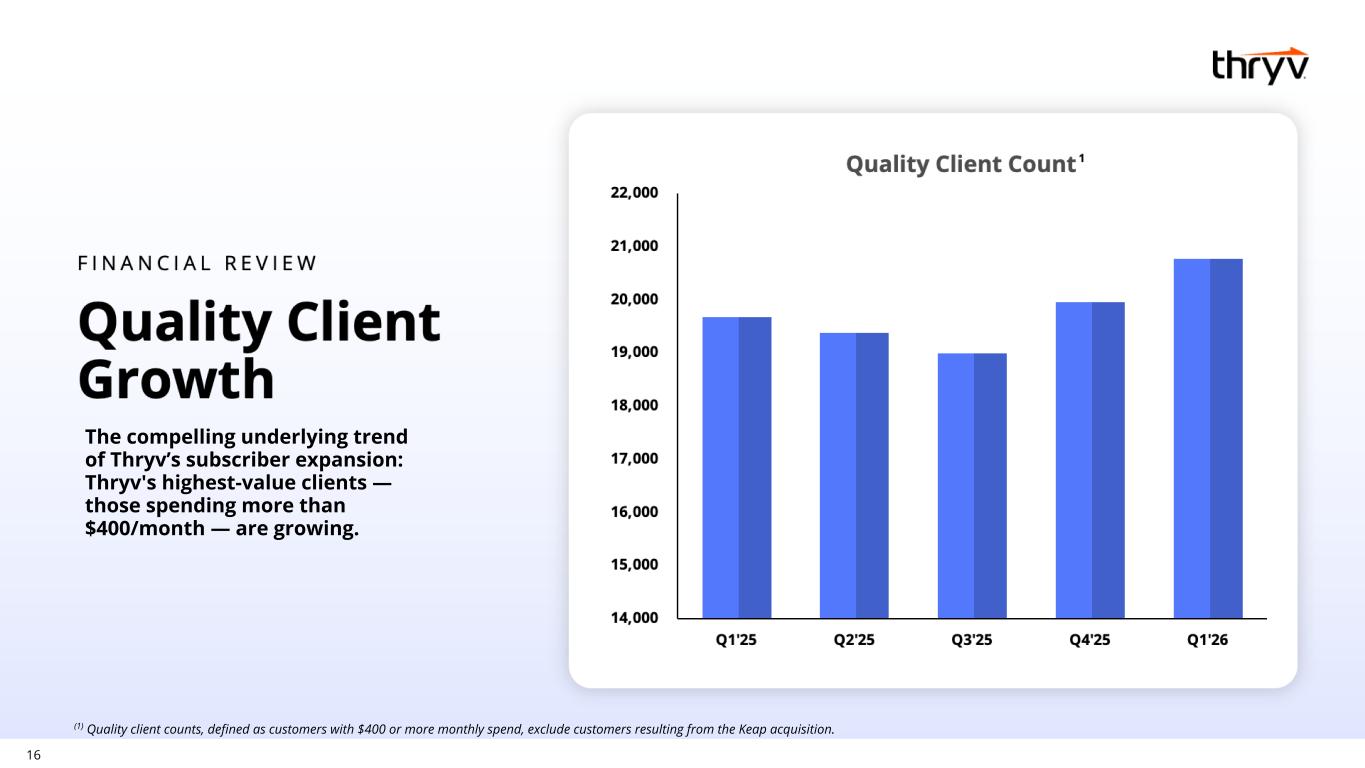
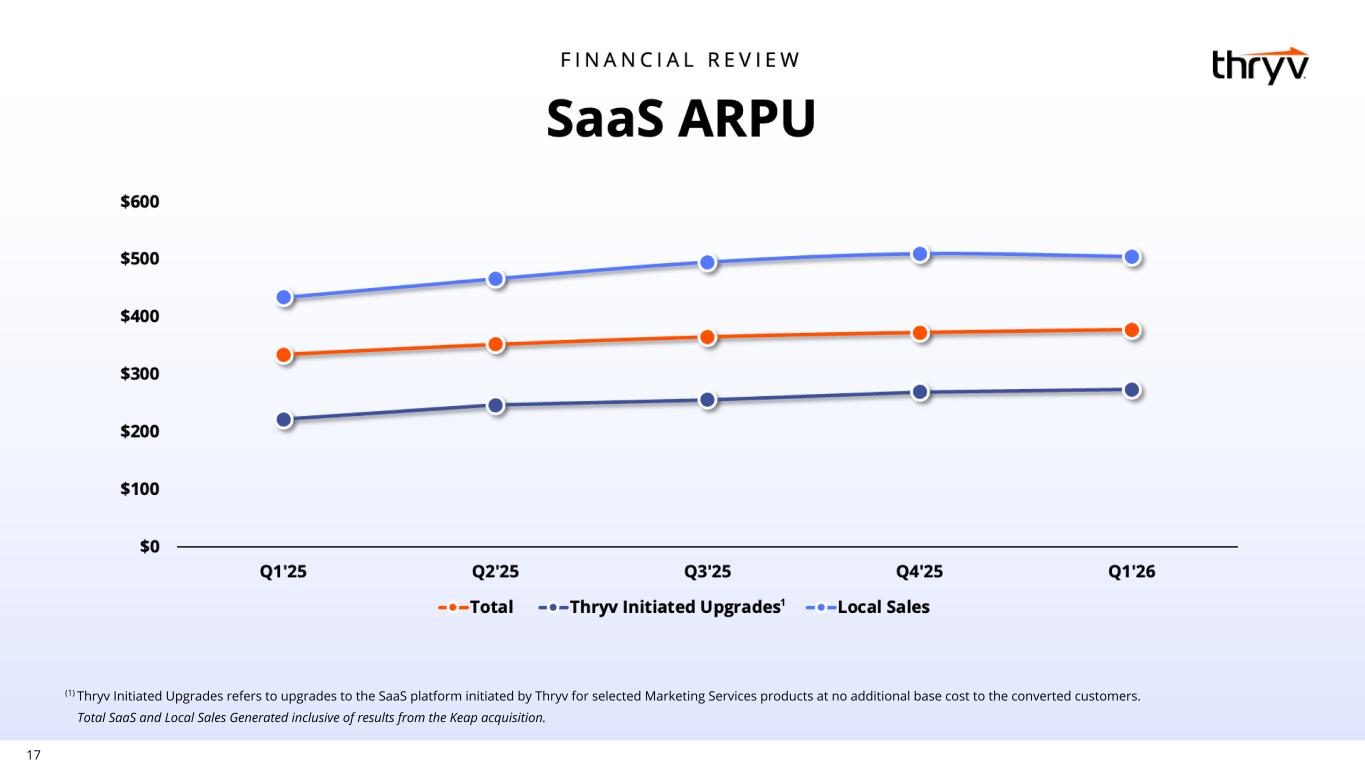
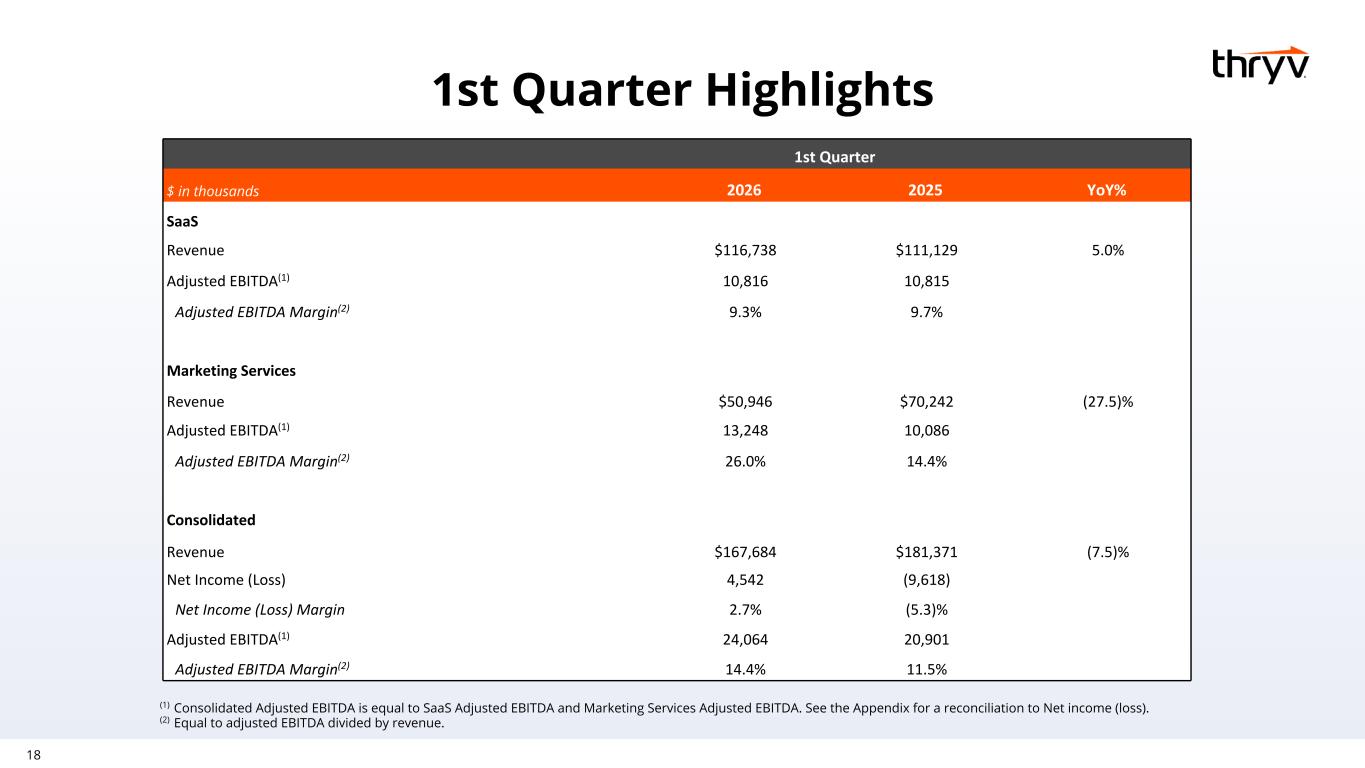
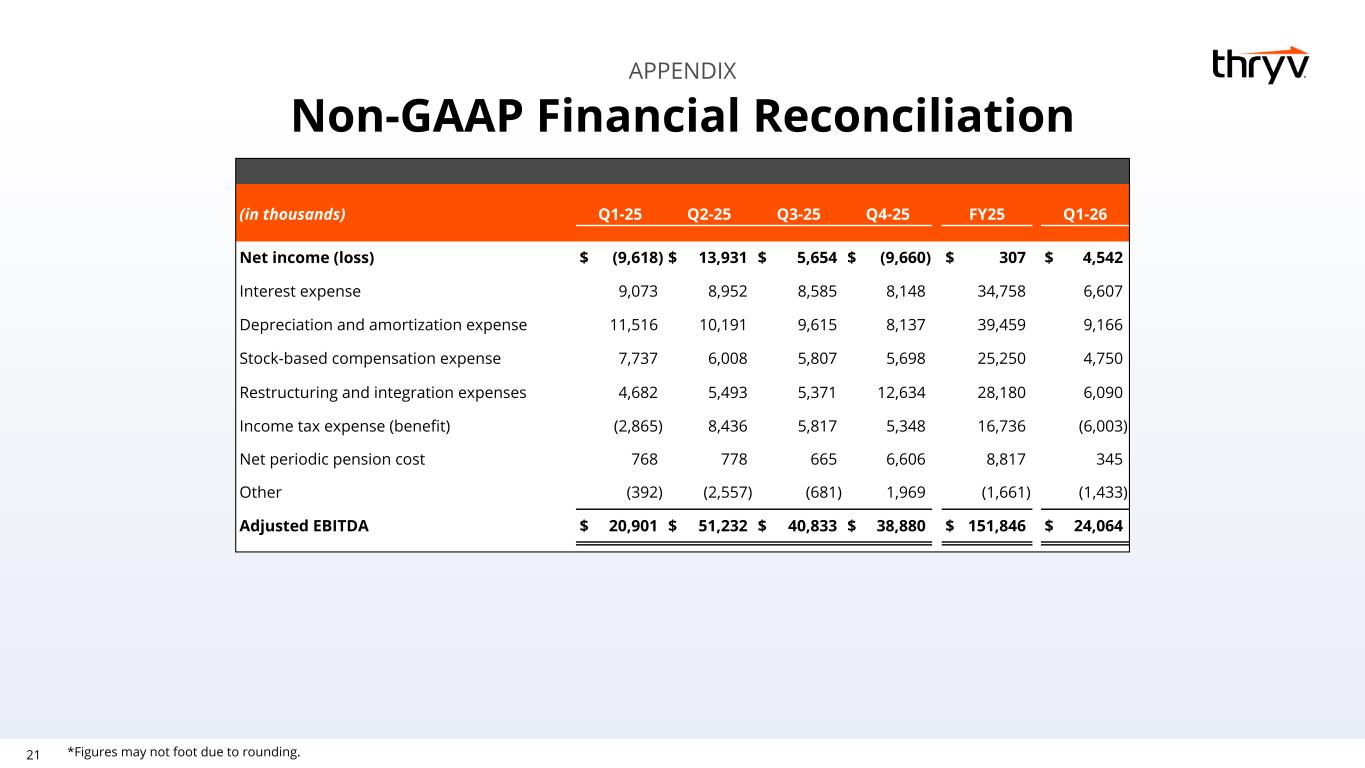
Please refer to the press release we issued this morning for a reconciliation of our non-GAAP measures to most comparable gap measures the press release and accompanying investor presentation are available in the investor relations section of our website at investor.thrive.com with that i'll turn the call over to joe walsh thank you cameron and good morning everyone i will highlight our first quarter results and key trends and hand it over to paul rouse to walk you through the numbers and then cameron will take you through some of our forward guidance we had a strong quarter SaaS revenue of $117 million came in ahead of expectations, and marketing services outperformed as well, resulting in total company-adjusted EBITDA that beat our guidance. Quality customers now represent 70% of revenue, and annualized client spend has eclipsed $4,500. We are now a 70% SaaS revenue company. A few years ago, we were a marketing services business with software on the side. Today, that equation has fully flipped, and it happened because small businesses are telling us, through their buying behavior, that they need what we offer. The clearest signal of that is Marketing Center, which grew around 30% year-over-year in Q1. Small businesses want to get found online, drive high-quality leads, and convert those leads into lasting customer relationships. That's exactly what Marketing Center does, and the growth reflects that fit. It is the centerpiece of our market-sell-grow strategy, and its continued momentum validates that strategy is working. We're also seeing strong results in our up-market motion, attracting and winning larger small businesses than we've historically served. These are clients with more complexity, more needs, and more to spend, and that's showing up directly in our numbers. ARPU grew to $378 a month, up 13% year-over-year, with annualized client spend eclipsing $4,500. A direct result of serving higher caliber clients. And because larger businesses engage more deeply and expand their spend over time and stay longer, the lifetime value of these clients is fundamentally better. You know, you'll remember we've talked about moving from 4,000 to 8,000 over the next, you know, kind of four or five years. We feel strongly that that upmarket move is gaining traction at this point. Quality customer count grew 6% year over year and now represents 70% of SaaS revenue, up from 62% a year ago. That trajectory tells you the mixed shift is working, and it's a dynamic we're leaning into deliberately. I also want to touch on AI because the early results are genuinely encouraging. On prior earnings calls, we shared that we were rolling out a suite of AI-powered capabilities across the platform, and it's validated to come back this quarter and report that the engagement numbers are really strong. AI image generation, AI lead scoring, and our AI-guided dashboard are all seeing strong early adoption since rollout. AI review responses, our AI website builder, and AI caption round out the suite and are performing well, too. These are not features that we are still testing. They're live now. They're being used by clients who are engaging with them. That matters because AI embedded in the daily workflow is what makes Thrive stickier and more valuable over time. We said we were building it. it's built, and it's working. In sum, the business is on solid footing. Our core product is growing, our client base is consistently upgrading toward higher value relationships, and our AI rollout is exceeding early expectations. That's the story of Q1.
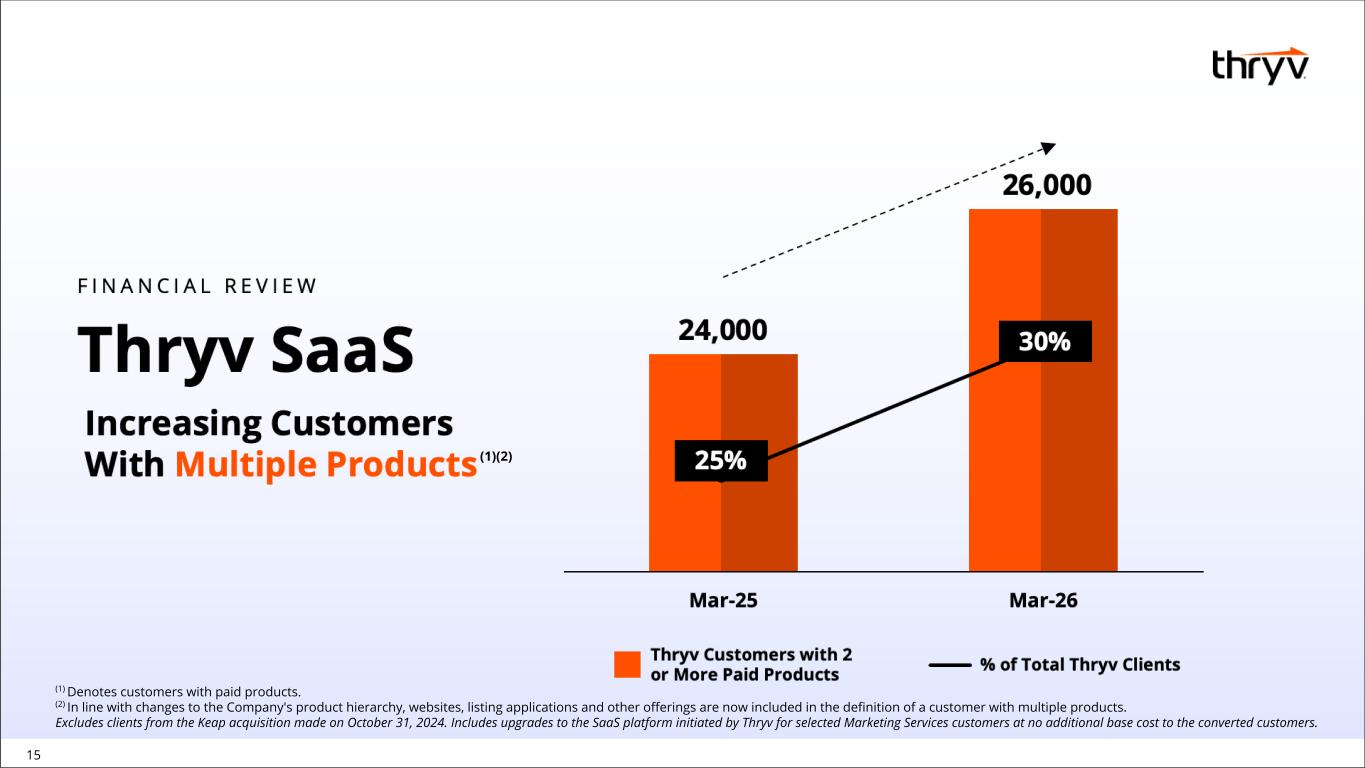
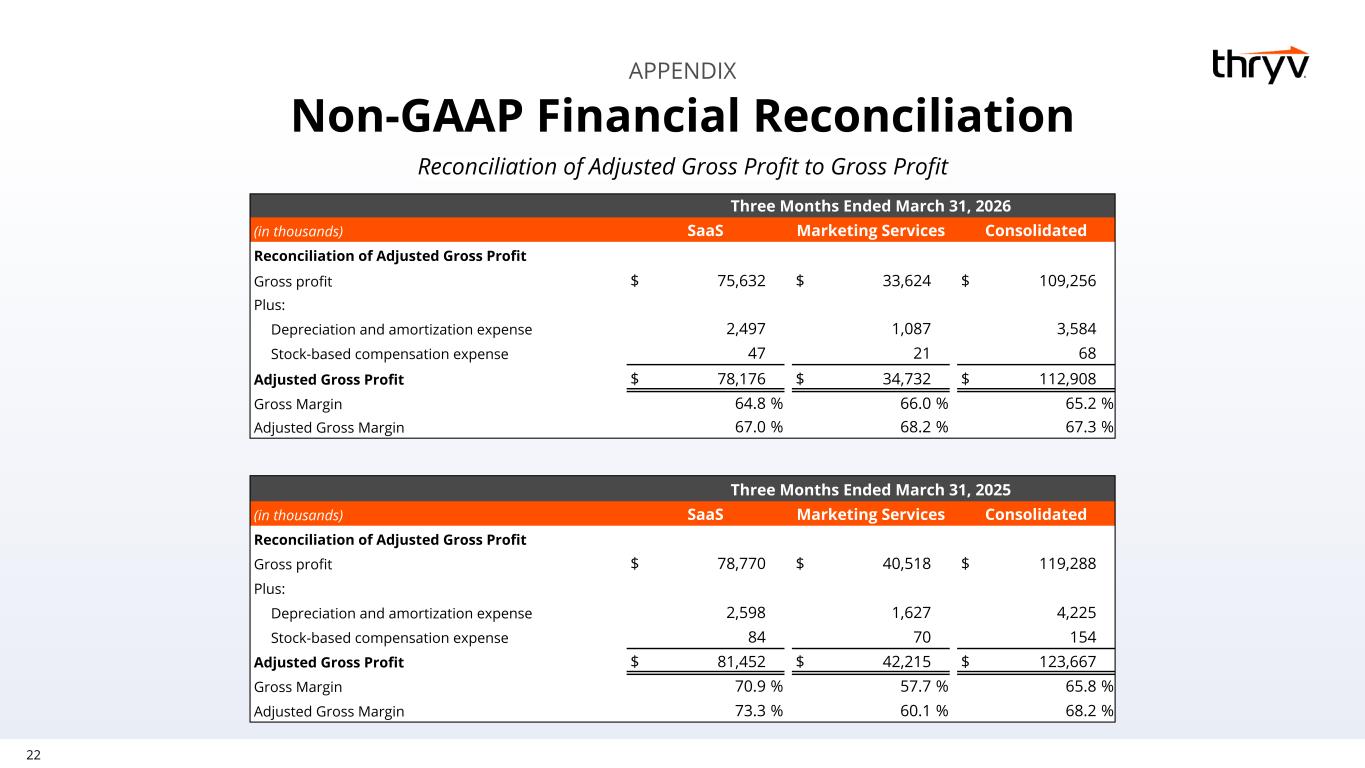
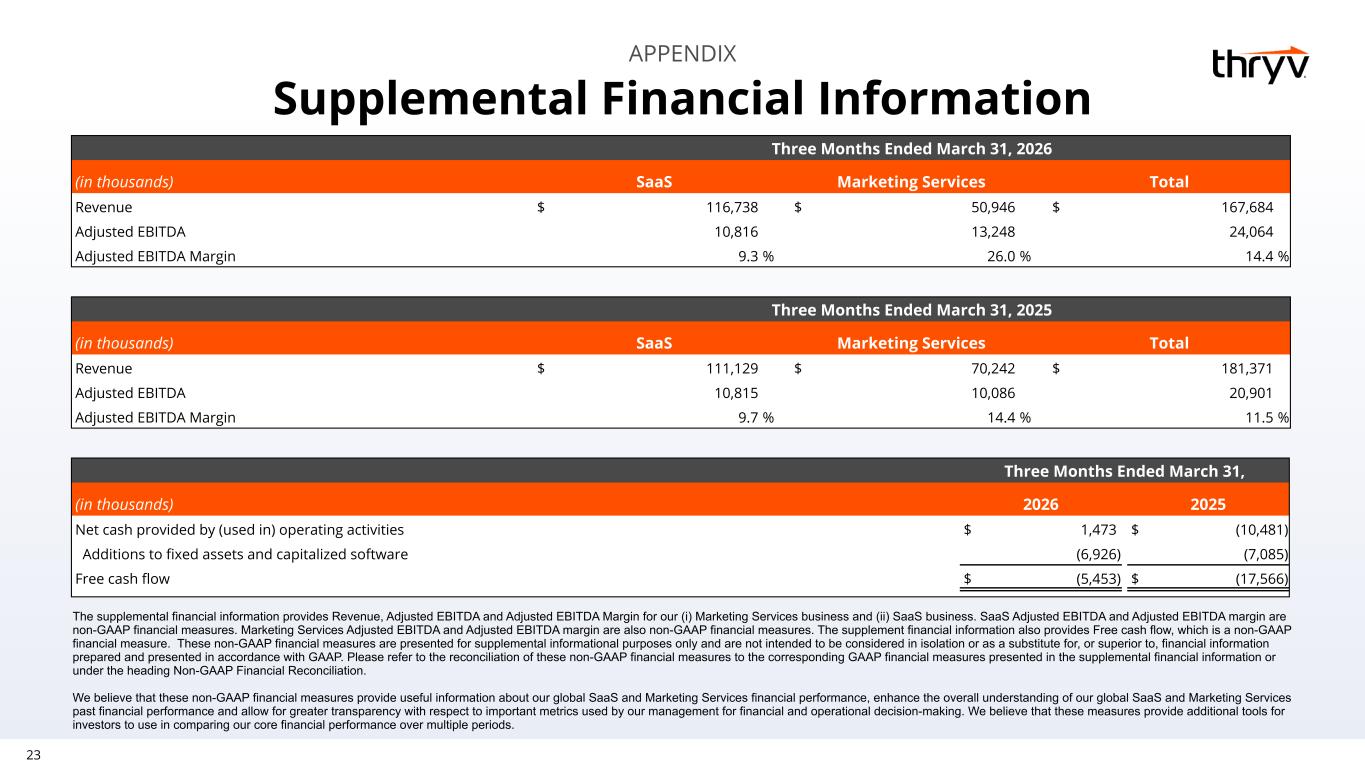
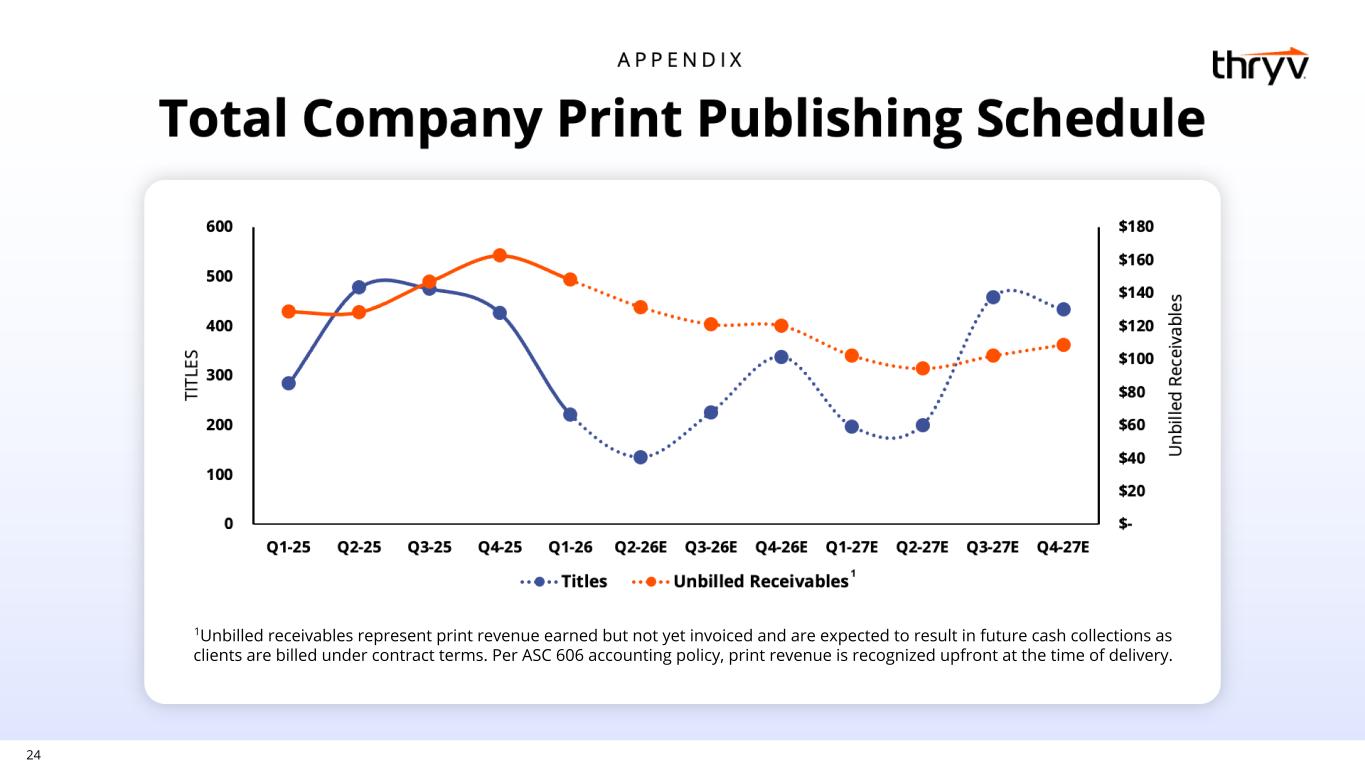
Now I'd like to hand it over to Paul Rouse and Cameron to walk you through the numbers and update you on our guidance. thanks joe let's dive into the numbers sas reporting revenue was 116.7 million in the first quarter representing an increase of five percent year over year and exceeding guidance sas suggested gross margin was 67 percent and sas suggested ebitda was 10.8 million in the first quarter resulting in an adjusted EBITDA margin of 9%. Adjusted gross margin in the first quarter was diluted by the strategic upgrade of our low-margin large digital agency customers from our marketing services base of customers onto SaaS with no change in pricing. Historically, we lacked an upgrade path for these clients with Business Center. But Market So Grow now provides the motion. With keep marketing automations representing a significant upsell opportunity that will drive improved economics over time. This gross margin compression was the primary factor of adjusted EBITDA coming in below guidance for the quarter. We view it as a deliberate near-term investment in a previously under-leveraged segment of our customer base. In the first quarter, SAS ARPU reached $378, an increase of 13% year-over-year. We ended the quarter with 96,000 SAS subscribers. Seasoned NRR of 93% represents the natural attrition of smaller, lower-spend clients within our base. Importantly, churn among our high-valued clients has been trending favorably, underscoring the effectiveness of our client experience initiatives and our confidence in long-term health of the business. Multi-product adoption continues to accelerate in the first quarter. Clients with two or more SaaS products grew to 26,000, or 30% of our base, compared to 24,000, or 25%, a year ago. Moving over to marketing services, first quarter revenue was $50.9 million and above guidance. First quarter marketing services adjusted EBITDA was $13.2 million, resulting in an adjusted EBITDA margin of 26 percent as anticipated this performance reflects the natural cadence of our print publication schedule which is way towards the second half of the year from a revenue recognition standpoint importantly this time dynamic has no impact on billings or free cash flow generation as our book over book decline patterns have remained consistent and predictable over time first quarter marketing services billings total 54.5 million down 33% year-over-year reflecting the intentional shift in our strategy as we continue to initiate upgrades of legacy digital marketing services products for clients to our SaaS platform the decline will persist but at a managed pace we remain on track to exit marketing services by 2028 with cash flows fasting through 2030 ensuring strong liquidity as we fully transformed to a pure play software business we ended the first quarter with net debt of 258 million bringing our leverage ratio to 1.7 times Now I'll turn the call over to Cameron to walk through the guidance.
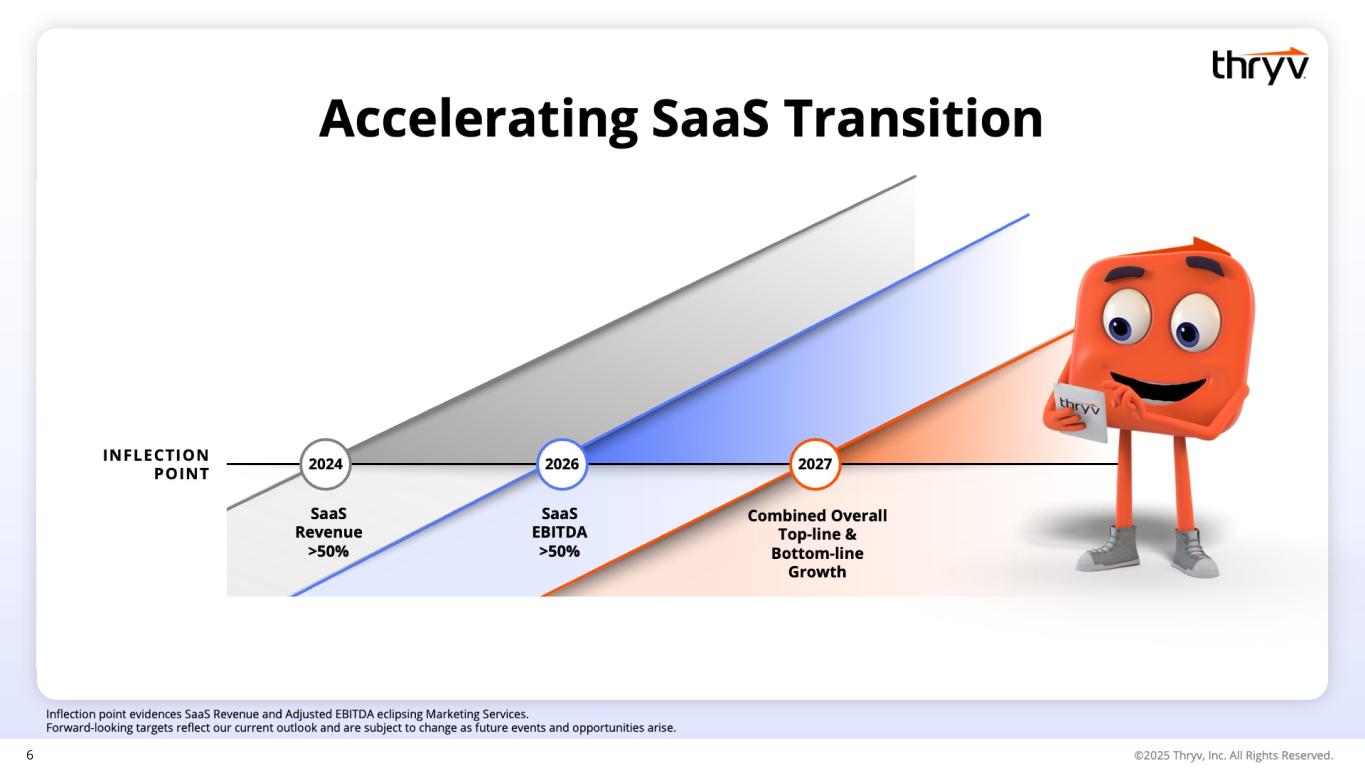
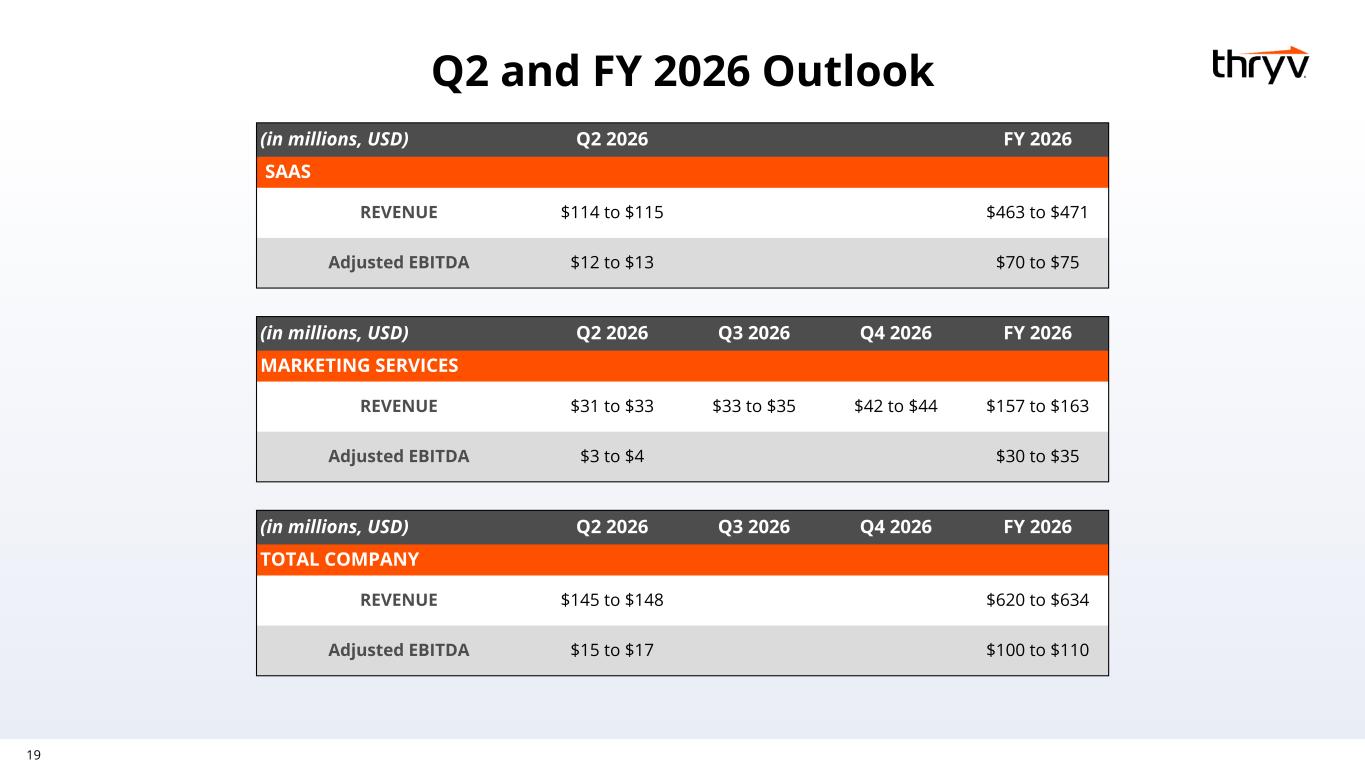
Thanks, Paul. Let's dive into guidance. For the second quarter, we expect SAS revenue in the range of $114 million to $115 million. For the full year, we are raising the low end of our SAS revenue to a range of $463 million to $471 million. For the second quarter, we expect SAS adjusted EBITDA in a range of $12 million to $13 million. For the full year, we are maintaining SaaS-adjusted EBITDA guidance to a range of $70 million to $75 million. For the full year, we are raising our marketing services revenue to be in the range of $157 million to $163 million. For the full year, we are maintaining marketing services-adjusted EBITDA guidance to a range of $30 million to $35 million. One thing worth keeping in mind as you model the year, Q2 carries a lighter print publication schedule relative to other quarters, which will create some timing variation in EBITDA due to the cadence of revenue recognition. This has no impact on billings or free cash flow, and as print volume ramps in the back half of the year, Marketing Services EBITDA will reflect that accordingly. The quarterly phasing is outlined in the investor presentation, and the full year range is unchanged. Before we close, I just want to step back for a second. This transformation is working. SaaS is now 70% of our revenue, something that felt like a distant goal not long ago. And as we look toward 2027, we expect to return to overall top-line growth. For those of you who have been watching this story and waiting for the other side, we're nearly there. The business is at a genuine inflection point. We're no longer managing around decline. We're leaning into growth, advancing our AI initiatives, and building something we're really proud of. We appreciate your continued support and your belief in what we're building. We look forward to updating you next quarter. Operator, let's move to questions.
Operator
We will now begin the question and answer session. Please limit yourself to one question and one follow-up. If you would like to ask a question, please raise your hand now. If you have dialed into today's call, please press star 9 to raise your hand and star 6 to unmute. Please stand by while we compile the Q&A roster. Your first question comes from the line of Scott Berg with Needham & Company. Your line is open. Please go ahead.
Hi, everyone. Thanks for taking my questions here. Joe, I guess the first question is, you're talking about your move-up market that you seem, on the SaaS side at least, that you seem to be continually more positive on. And any anecdotal evidence on, you know, how many more modules those customers are taking or how much larger the ARPU of your larger kind of customer segment is? I think that would be helpful if you have any details there.
Thanks, Scott, for the question. We are moving up market. Our overarching plan here is to move our ARPU from $4,000 to $8,000, and we're making steady progress, 13% ARPU growth in the most recent period. As with everything with us, our metrics don't move in a perfect straight line because there's a lot of noise as we continue to transition the old business away. But we're having a lot of success moving up market, and we're doing it in a few ways. Firstly, and maybe most importantly, you know, we've put very sophisticated sales automation in place over the last few years. And we're targeting all of our sales efforts at larger businesses. We literally have a list of who we want you to go talk to. And, you know, what that means is that rather than selling the solopreneur who maybe has three or four hundred thousand of annual revenue, we're selling a midsize business that has a million of revenue and, you know, 12 employees or something. And it makes a big difference for us in terms of retention, their willingness and ability to pay, and their ability to buy more from us over time. So that is actually the big story here, is if you look at quality customers, and I know that there's noise in our gross number of customers. And that's because we're transitioning legacy customers and legacy systems as we wind down this gigantic marketing services business. it's bringing over some subscale customers. And sometimes we're able to get those customers moving, engage with software and buying more and heading in the right direction. And sometimes they churn out. And so that process is a little bit noisy, which is why gross numbers haven't been a perfect measure. But if you look at quality customers, it's steadily growing. And ARPU is pretty steadily growing. Again, it bounces around a little bit, but the overall direction is up. So as far as, you know, your question about modules, you know, we're, you know, increasingly having more and more success with people buying multiple products from us and becoming stickier. You see that number, you know, moving up. and these bigger businesses a lot of times are coming in bigger to begin with so if you look at our you know new sales velocity they tend to be bigger so you got you got your finger on the story it's it's us moving away from solopreneurs moving to bigger businesses and all the noise that that creates scott understood thanks and then joe you talked about the engagement story and some of your ai functionality is improving i think we're all looking for evidence amongst different enterprise software vendors and how customers are are leveraging these technologies you know through these vendors out there today as as you have more experience or your customers have more experience with this functionality how should we think about the monetization efforts of these going forward is is are you able to monetize any of this functionality separately or do you think this is really something that you embed into the core product and and you know we realize you know some of those financial benefits through just the core pricing maybe improvements over time it's a terrific question that that so that that first or excuse me the way you finished is i think the way we start and that's that we are you know massively enhancing the product by putting ai features by clustering agents around what we're doing so that we can deliver better results we can dial in people's campaigns and there's definitely a data mode that builds over time because you get smarter and smarter with their data, with their campaigns, and there's a switching cost if someone were to ever leave that. So I think it helps, really helps our retention, helps us deliver a better experience for the Some things that were harder to do or that they needed to spend time on the software to do can just happen without them even logging in as you move along here. So I think all of these make the software more attractive, easier to use, will improve retention and improve our ability to get price without having discrete pricing. Now, having said that, when I look at our roadmap of what we're building and what we're doing, I do think that there will be significant monetization opportunities down the road. But we are not going for that at the moment. We're just going for making the product easier to use and more powerful so that we have stronger retention.
Understood. Thank you for taking my questions.
Operator
Your next question comes from the line of Arjun Bhatia with William Blair. Your line is open. Please go ahead.
This is Alinda Leon for Arjun. Thanks for taking my questions. Joe, what are the early customer feedbacks from customers on the new AI products?
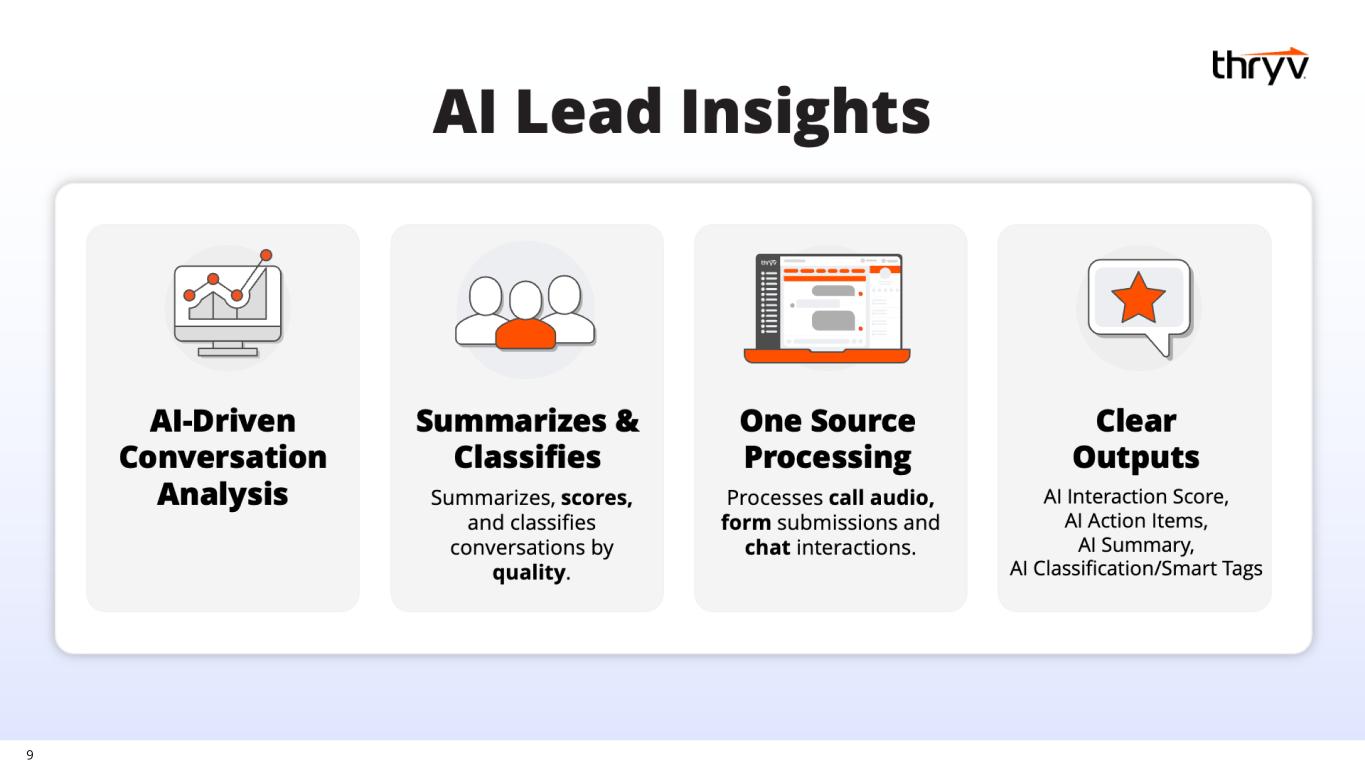
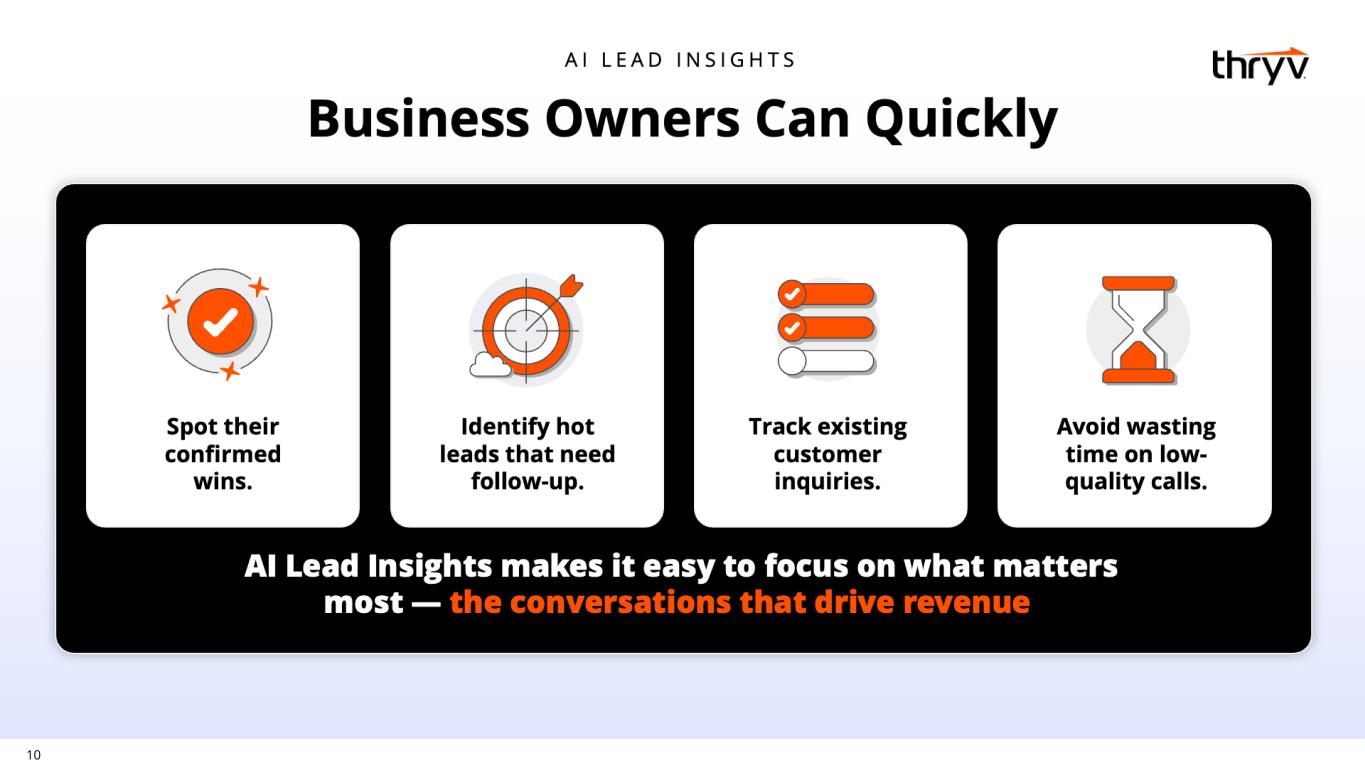
And how are you seeing that in early conversations with prospective customers as well? um so well i mentioned some of them on the call things like um image generation and you know review response uh those have been in for a while and it's just steadily building people are discovering that when they go to do their social posts it's just easier to use these tools and so on. So that's been a steady melt up now for a while and going very well. I think some of the stuff that we're coming out with now is really exciting. We're taking a lot of the keep functionality, melding everything together, and we're able now to take a lead, give you a transcript of the lead, grade the lead one through five based initially on a set of assumptions we make based on the words and the lead. But over time, on your own data, dial that in for you. And those people that are using these tools are experiencing quite a bit stronger conversion of leads. No leads are falling through the cracks. So we've got particularly some of our partners have been taking the lead on that as we've been initially rolling this stuff out in beta, and now it's out out, you know, kind of teaching us what's possible with it. So we're pretty excited about this. We think it's going to be, make our software easier to use. The dream scenario is that this software helps you efficiently grow a local business without having to log in all the time. That gets working in the background for you. And that's the, that's the big deal. It's always hard to get the roofer off the roof, you know, to get the chiropractor to let go of the patient go in there and mess with the software. And so when the tools do it for them, it makes a big, big difference. So that's really, it's moving it closer to them and making it easier for them to get value.
Yep, that's helpful. And last quarter, you talked about the initiative of market sell and grow. And can you just give us a little bit more update of how that initiative and strategy has been going. I know there's a lot of integration in terms of the keep automation inside of the market sell and grow initiative. You can just give a little bit more color from last quarter.
Yeah, we also in the last quarter mentioned the new platform that we're developing. So at the moment, we have keep and marketing center. We have a method that we're able to deliver the value of both. It's sort of a, I hesitate to say bundle, but it's sort of almost like a bundle know, where we're using them together. And that's sort of that market sell growth footprint of things that we're doing. But the new platform just puts it all together. It's not in, it's not a bundle. It's not separate. Everything is together and unified. And it's all AI from, you know, written from the ground up. We basically have rewritten the whole thing. It's been a lot of work to do, but it's incredible. And it's in the hands of some customers right now. And we're dialing dialing in everything so um but yeah market sell grow really is it's it's our mark it's our super fast growing main thrust which is marketing center which is about efficient growth for local kind of bigger small businesses and then with keep you you have you know what what are essentially automations or agentic assistants that help them through the process of responding to leads. If they're busy and they don't follow up right away, it continues to nurture them. And then after a sale is made, it continues to keep that customer warm and stay in touch and create a connection so that the next time they have a need, you get them back. And these are the kinds of things that really genuinely help a small business. These are the tools that they're looking for. So that's what market sell grow is all about.
Operator
Your next question comes from the line of Matt Swanson with RBC. Your line is open. Please go ahead.
Yeah, no, fantastic. Maybe following up on the question that was just asked, marketing center being up 30% is awesome. And it clearly shows the success you guys are having with this new go to market. Last quarter, I think Joe, you had mentioned there was some potential for cannibalization just kind of as you shift the focus. Can you just give us kind of an update on that, I guess, and just how that 30% growth in marketing center will kind of increasingly be reflected in your overall growth rates as maybe some of these other headwinds get offset?
Yeah, I mean, I think over time, that is the company. you know is the we're replacing the current marketing center platform with a new one very soon and the new one has keep fully integrated in it is written you know from the ground up uh with agentic tools everywhere um and an mcp layer on it so i mean it's it's it's very very cool um but yeah our um you know our our sales organization and our customer base see the power and results of marketing center, and that's the center of gravity for the company. Everything is moving in that direction. And so, you know, the sales reps are not as much running around out there trying to sell standalone, you know, keep or standalone business center. Everything is driving toward this market sell grow platform. Everything is driving toward marketing center, particularly the new one. So your read on it is right, and everything is driving up market. So if you think about our business, if I were looking at it from the outside, I would look at the quality customer progress and the way that's moving up. And I would look at marketing center as really the company and look at those. And I'd put my projections and my ruler on the progress there. We're not going to be building keep out in the future as a separate thing. We're bringing the powerful, unbelievably good functionality it has inside of of the main thrive offering um and you know similarly we really are not adding a lot of new business centers you you you sales rep when presented with the choice of selling a business center or a marketing center you know you know all the rapid development a lot of the heat and light are on marketing center so that's really what they're selling. So I think you got it. I'm reading in the way you asked the question, you haven't figured out.
All right. Well, that's good to hear. Another, the quality SaaS client bar chart in the deck, I think it's also telling a pretty compelling story. Could you just give us some context, like a product standpoint of what that $400 threshold looks like, if that makes sense? Just kind of like, what is a customer spending $400? What does that mean from a product standpoint.
Yeah, we've got, you know, a bunch of extensions or add-ons that are beginning to sell really well. You will know, you know, we control a pretty big part of the kind of marketing universe. And there's a, for small businesses, there's a battle for, you know, for them out there. When they look at getting customers, there are two giant trolls standing between them and their customer, Google and Facebook. And those leads are super expensive. I mean, they're very, very efficient at monetizing those leads. And so when you talk with particularly service type businesses, they're like, is there some way I can get leads around Google or around Facebook, like not have to go to them? And so think about all the directories we control around the world. in Australia, New Zealand, and the US. We control these big directory sites. And then we've built a network of other directory type sites, whether it's Nextdoor and Yelp and CitySearch and all these other sites. And we have that all network together. So we have a pretty significant amount of non-Google traffic that we're able to source. And we've packaged these really cool kind of growth packages together that we're able to sell to customers. And in an age of AI answer engines, they're having renewed buoyancy because the AI answer engine doesn't look it up in Google and then give it to you. It goes out and searches the stuff itself directly. And so when you look at a yp.com fence contractor in Tupelo, Mississippi, it's been on our site for 17 years. They look at that as solid authoritative content that answers the query that you put in and it delivers that answer. And so it's pretty cool. So anyway, back to your question, we've got add-ons where we're drawing from who we've been in the past and pulling all that together. And that's working great because not only are we helping you measure your marketing, but we're helping you do some of it too. Thank you.
Operator
Your next question comes from the line of Jason Crayer with Craig Hallam Capital Group. Your line is open. Please go ahead.
Thank you, guys. Joe, can you just maybe step back and talk about the sales motion and the difference between the upmarket clients and those at the low end? And then how do you position the sales team to be in the right place to capitalize on the upsell opportunity?
Yeah, great question. So look, job one for us is to wind down the old directory business. So every morning we get up, that's the first thing we got to do because we've got, you know, this big business and it's got, you know, some legacy technology and legacy processes and systems. And we're winding that business down. And in so doing, we're variabilizing and collapsing that that legacy cost structure down and we're good at this we do it every day but to do it a lot of times we've got customers that are sitting out there on legacy platforms or legacy tools that we need to you know to move off of those in order to shut them down and turn them off and the upgrade over to our modern stack is is phenomenal for them but there's communication involved there's a lot we have to do so so that eats up some of part-time. And it does bring over some subscale customers. There's some customers over there that are just solopreneurs or very small businesses that may not be our perfect ICP. That's why you see noise in the gross client number, because we've brought over some unnatural SaaS customers. And some of them, we were able to talk to them and get them moving and they buy more stuff and they say, hey, this stuff's really cool. And they become a good source. Others are like, that really is not for me. I was trying to buy listings and a phone book or something. So that takes some of our time. When we go outside and start prospecting, we both through our marketing and through our excellent sales force, we're deploying them against a targeted list of our ideal clients. And so, you know, to think about it this way, the HVAC company that has four or five trucks on the road would be our target versus, you know, the guy who, you know, works, his wife runs the office and he does it and his brother-in-law helps him in the summer. You know, that had the total company's got like 400,000 of revenue. That's not our target. We're not really going and looking for that guy. We're putting our sales energy against selling the bigger ones that maybe have a million of revenue or a million, two or three of revenue because they tend to be much stickier and they tend to have a willingness to pay and an ability to buy more stuff over time. And I would say, Jason, if I'm really honest in this journey, if you could go back and maybe change things or whatever, when we first started our software business, we pretty much would sell anybody who would talk to us. And that gave us a lot of experience because when we studied our customer base, we found that the very, very smallest ones were churnier and the bigger ones were steadier and that's just a better way to build our business and now we've we've spent a lot of time developing marketing center for those larger guys for those bigger businesses and we've uh you know we we brought in sean wechter from boomy and we've become really good at integrating with other software tools and so you know if you're on, you know, Service Titan or you're on, you know, I don't know, some other, you know, big CRM tool and you need your marketing cared for, you know, we are interconnecting and working well with those tools. So that was maybe more than you wanted, but gives you some sense of where we're spending our time and how we're focusing.
Yeah, no, that's good. Thank you. I do have a follow-up on, maybe this is for Paul, but just trying to get a sense of the trajectory on both the customer count and the dollar retention figures? Just, you know, if you have any insights into, are we stabilizing now when those things can start to peak up in the next few quarters?
I'll tell you what, I'm going to share this answer with Cameron. Cameron's my data expert, so I'm going to get him involved here. Look, we sort of guided you guys directionally that we would probably be about flattish to maybe down slightly for the year as some of the conversions that we made over the last year or so stick and some didn't. And now the sales that we're making, each sale that we're replacing them with are much larger. So in some cases, two leave and then one new coming in is as big as the two that left. So there's a little bit of just qualification going on, But let me let Cameron assist with the answer a little bit.
That's right, Joe. So, Jason, what you're seeing in the overall customer count is that a factor. You're adding larger customers and losing the subscale customers. So I think we expect that to stay flat starting from the beginning of the year to the end of the year. On the season NRR metric, that will probably stay around the same range as well. You are losing some subscale customers, and that'll weigh on that. But I think if you step back and look at what we've done over the past 12 months, our overall churn has trended in the right direction on their overall customer base. And that'll be reflected in the season base over time. And our quality customers, you know, roughly 70% of the revenue, they have excellent retention as of right now. So that'll start to trend NRR in the right direction as you move out. And so we want to make sure that we keep those quality customers having the best client experience and making sure that retention stays strong. So overall, I think you won't see a lot of big changes in those metrics throughout the year. So I would just forecast relative flatness. Got it.
Thank you, guys. Thanks, Jason.
Operator
There are no further questions at this time. This concludes today's call. Thank you for attending. You may now disconnect. Thank you.