Operator
Good morning, and welcome to the Amalgamated Financial Corporation 4th Quarter 2025 Earnings Today's presentation is listen-only, with Q&A to follow. A replay of the call and the accompanying slides are available on our Investor Relations Please review the forward-looking statements and non-GAAP disposures on slide two. As a reminder, this conference call is being recorded. I would now like to turn the call over to Mr. Jason Darby, Chief Financial Officer. Please go ahead, sir.
Thank you, Operator, and good morning, everyone. We appreciate your participation in our earnings call. With me today is Priscilla Sims-Brown, our President and Chief Executive Officer. Additionally, Sam Brown, our Chief Banking Officer, is here for the Q&A portion of today's call. We'll be continuing with shorter prepared comments this quarter to get to your questions faster and avoid repeating details you've already reviewed in the earnings materials. I'll now turn the call over to Priscilla.
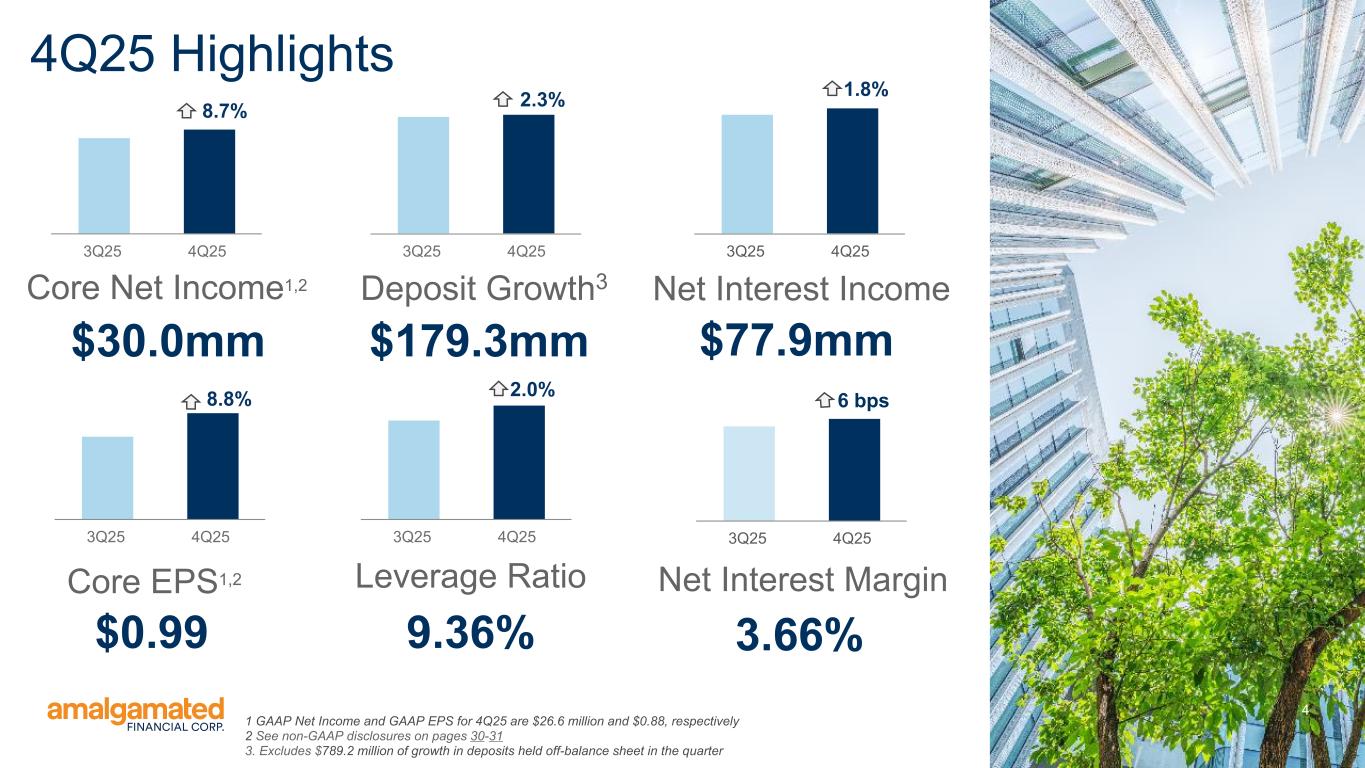
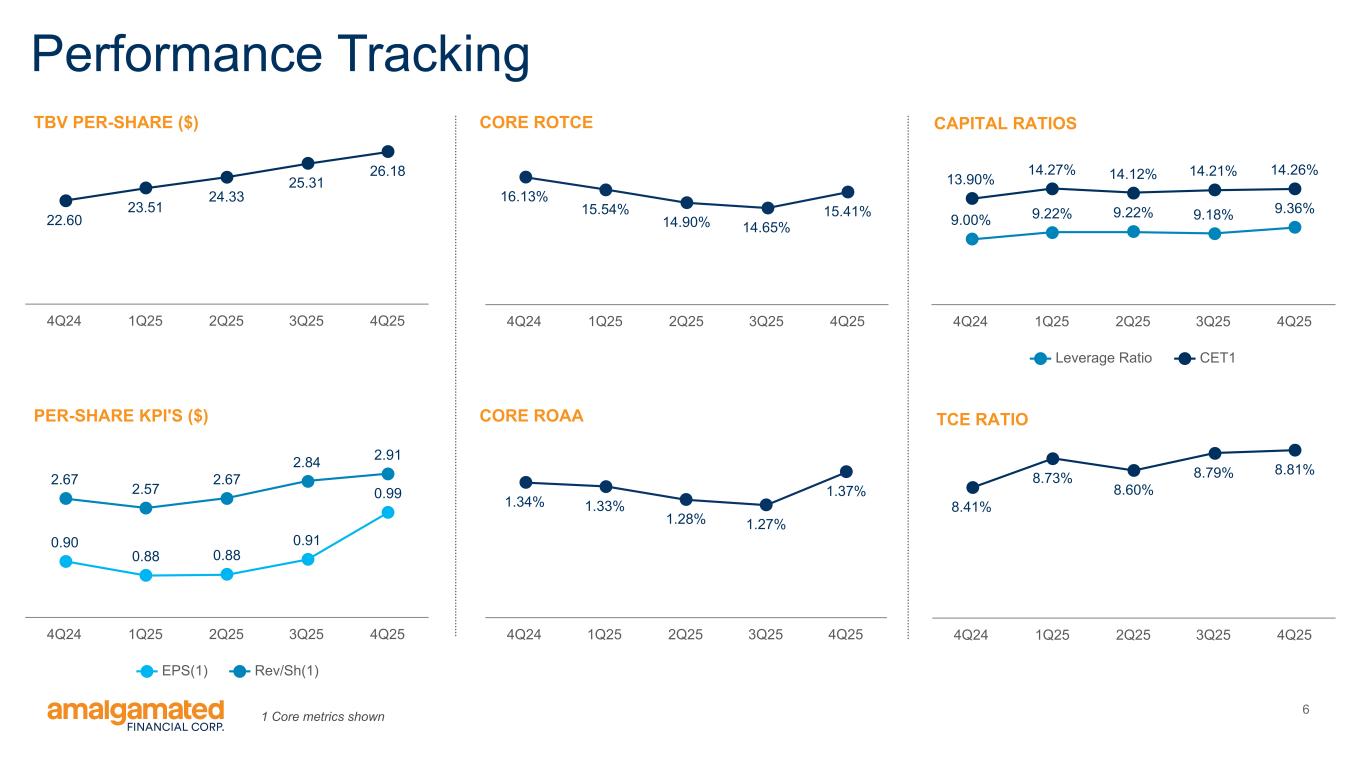
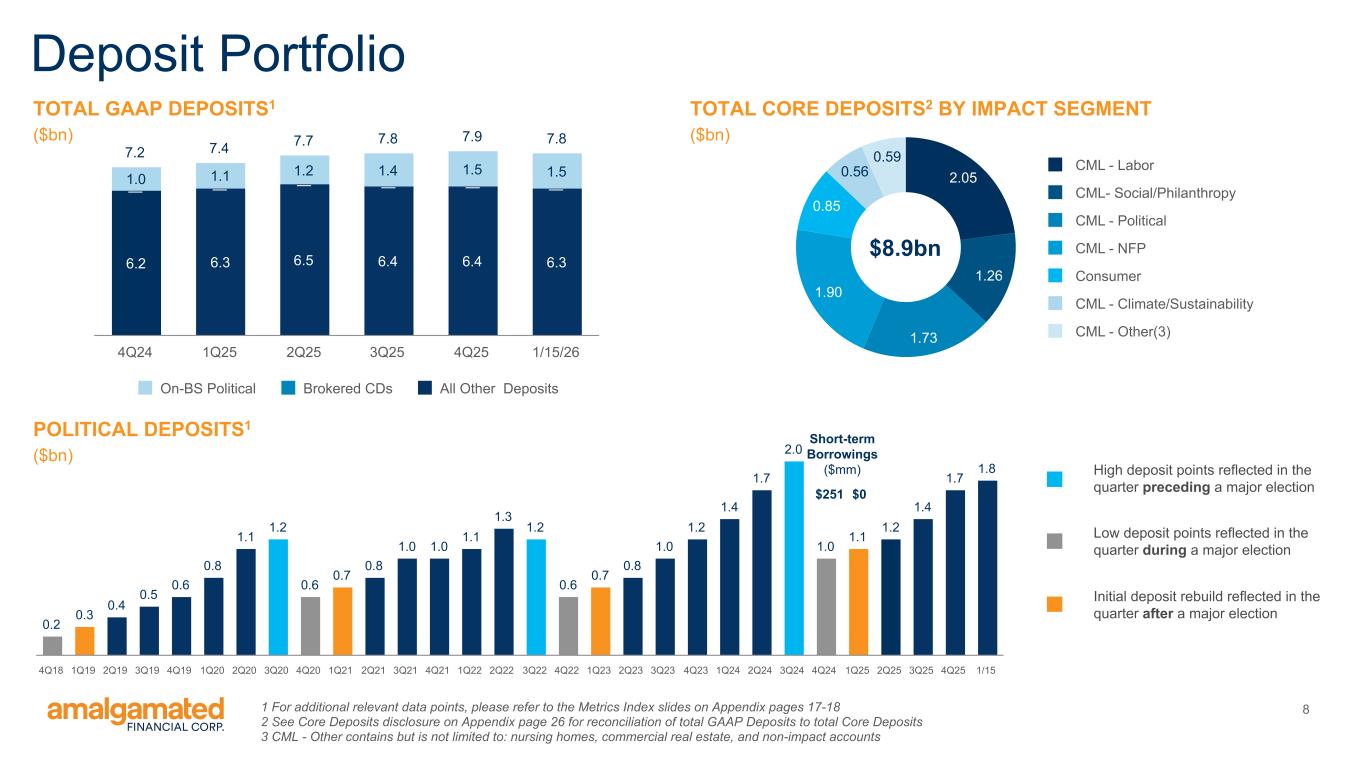
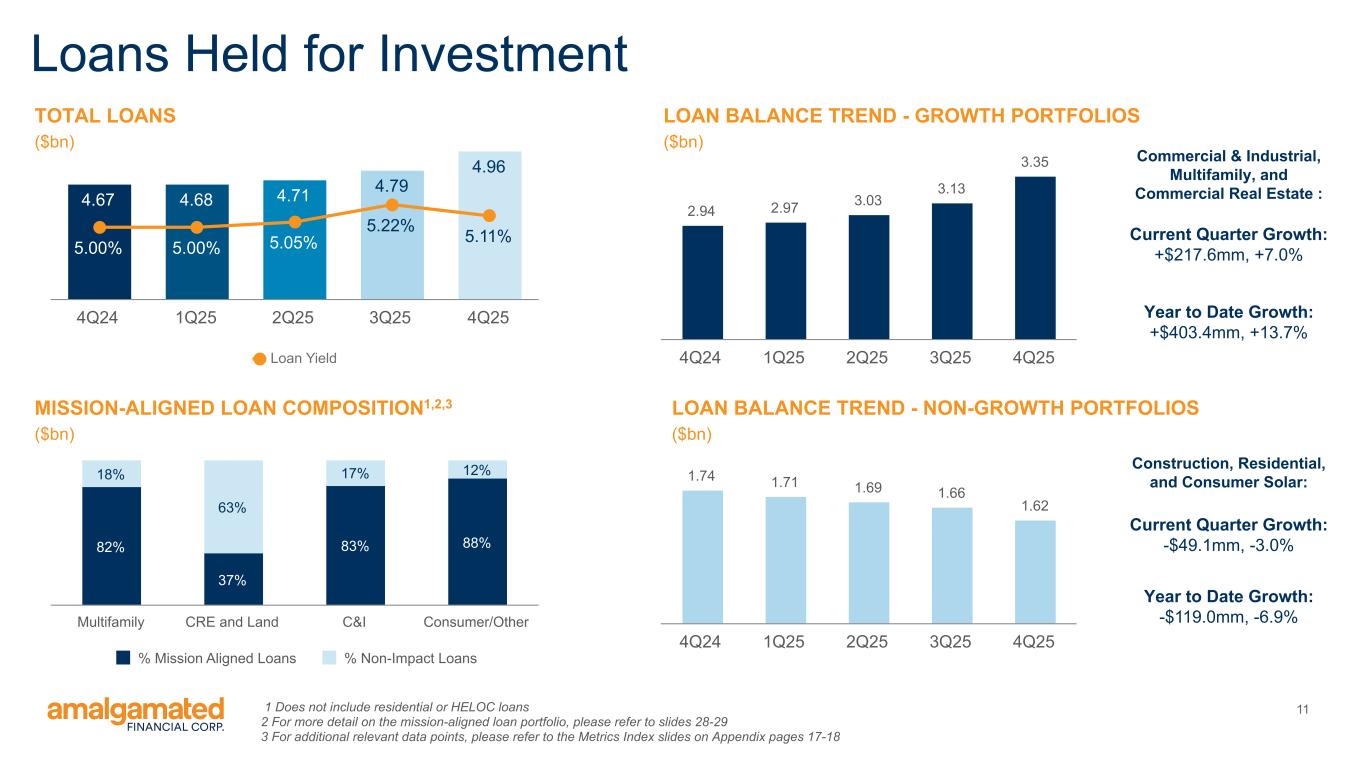
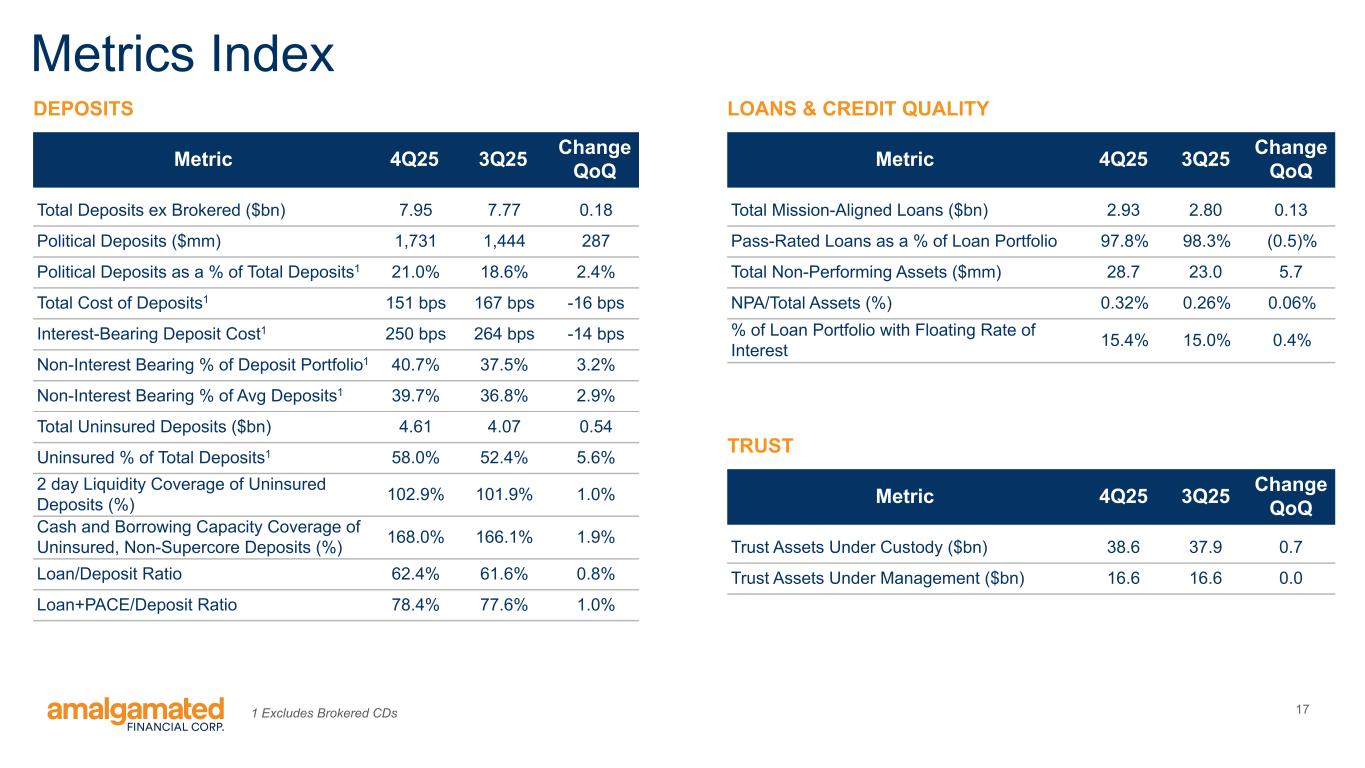
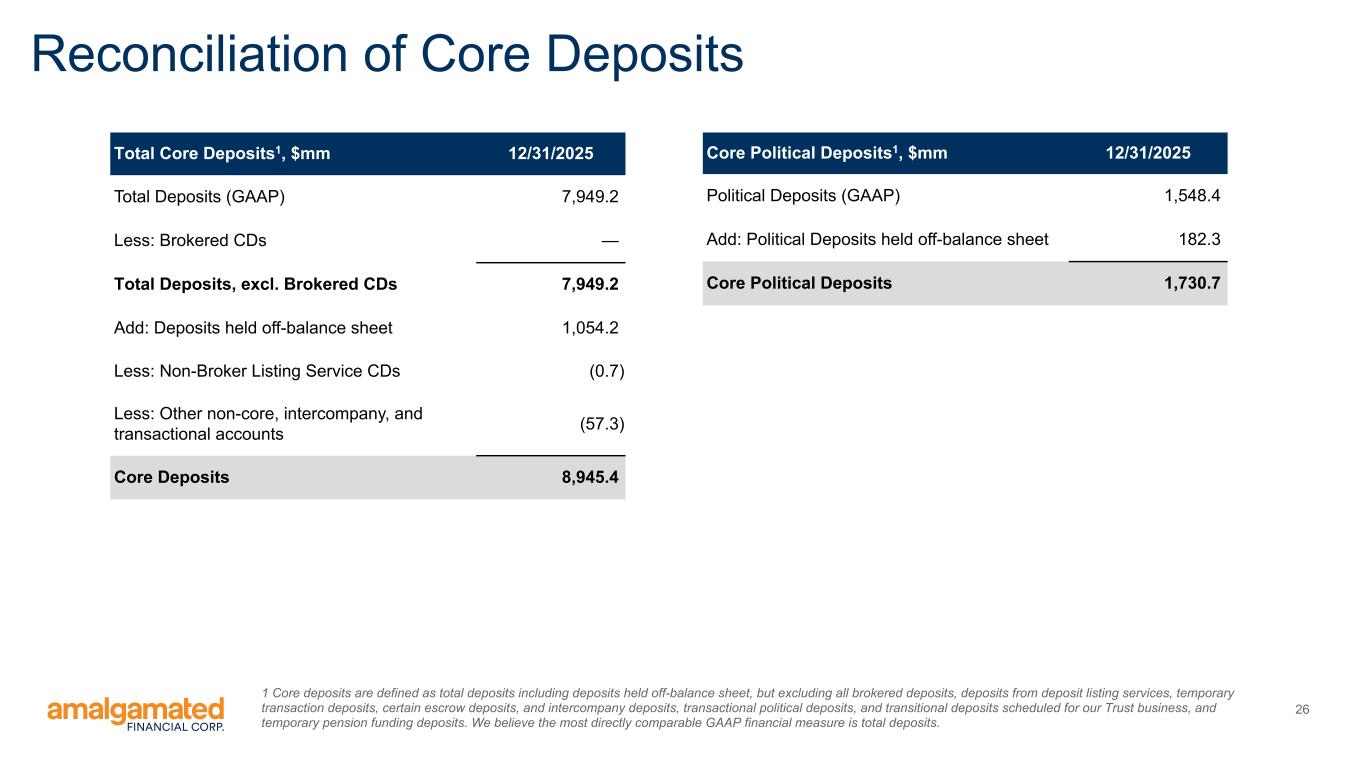
Good morning, everyone, and thank you for joining us. 2025 is in the books, and Amalgamated shined brightly. I have to start by expressing my deep praise and gratitude to all my amazing colleagues at the bank. You are builders, creators, and advancers of our mission to help those who do good do better. We offer unwavering support to our customers. We admire your courage and conviction to serve, and we feel privileged to be your banking partner. And to our shareholders, thanks for believing in us and in our business model. You are the capital engine that makes us go and grow. I'll get to more on growth in a couple of minutes, but first I want to start by recapping another excellent quarter for Amalgamated. Core earnings was $0.99 per diluted share, again showing the consistency of our earnings power and teeing us up to deliver consistent, growing returns on tangible common equity. We had a record-breaking quarter for deposit gathering, generating nearly $1 billion of new deposits. Absolutely incredible, and not even in an election year. This smashes our previous records set way back in Q2 of 2020 during the peak run-up to the presidential election. Our net interest margin expanded again, and we've booked almost $170 million in net new loans, one of our best quarters ever. A lot to like there, so let's dive in a bit more. Deposit gathering was on fire. On-balance sheet deposits grew $179 million to $7.9 billion, and our off-balance sheet deposits increased $789 million to $1.1 billion. Our political deposits increased $287 million to $1.7 billion, as our share of the fundraising taking place ahead of November's midterm elections continues to grow. It's important to note that all of our customer segments experienced deposit growth again this quarter. Not-for-profit grew an eye-popping $388 million. Social and philanthropy grew $122 million. And our climate and sustainability segment grew $77 million. This across-the-board strength demonstrates the mission-aligned, differentiated, competitive advantage that only Amalgamated possesses. Turning to loans, we delivered strong growth with loans increasing $167 million, or 3.5%, to $4.9 billion. Loans in our growth mode portfolios, which include multifamily, CRE, and CNI, increased by 7%, or $218 million, a nice acceleration from the 3.3% growth achieved in the third quarter and 2.1% growth achieved in the second quarter. We continue to benefit from the addition of several C&I experts that we added to our team, and we expect to deliver more growth in 2026 as we continue to expand our reach on the West Coast. Our PACE portfolio also saw a nice acceleration, with total assessments growing $38 million, or 3%, to $1.3 billion in the fourth quarter. The strength came from over $27 million in growth in CPACE, where there's a range of opportunities. We continue to ramp up with the new originator partnership we discussed with you last quarter. the question now is where is all of this leading we believe amalgamated is ready to grow significantly we're ready to cross 10 billion dollars in assets and have made and will continue to make the necessary investments in people and technology the business model is a winner and we have exceptional proven management team that can carry the bank into its next phase While Amalgamated has seen its fair share of specific challenges during our four and a half years as a team, banks broadly have been operating through extraordinary environmental challenges, from the pandemic and inflation shock to sharp swings in growth, asset prices, and depositor behavior, all of which transformed credit demand and risk. In the U.S., we have experienced the fastest rake hike environment in 60 years, the longest inverted yield curve in 40 years, and the largest Fed-driven liquidity drain on record. Thinking of these things really helps put into context the success Amalgamated Bank announced today compared to five years ago. Through these massive challenges, our bank has grown from $6 billion to nearly $9 billion. has become one of the most reliably profitable banks in the country, now employs nearly 500 people, and is making a bigger and longer-lasting impact than ever. Our outstanding management team navigated what was arguably the most difficult banking conditions in modern memory with a steady hand and adherence to a clear strategy. Our expectations for growth and performance in the future will be bold for sure, and Jason will outline some of this in his 2026 guidance in just a few moments. Our team's demonstrated track record provides a clear precedent for future achievement as Amalgamated Bank advances toward its full potential. Jason, take it from here.
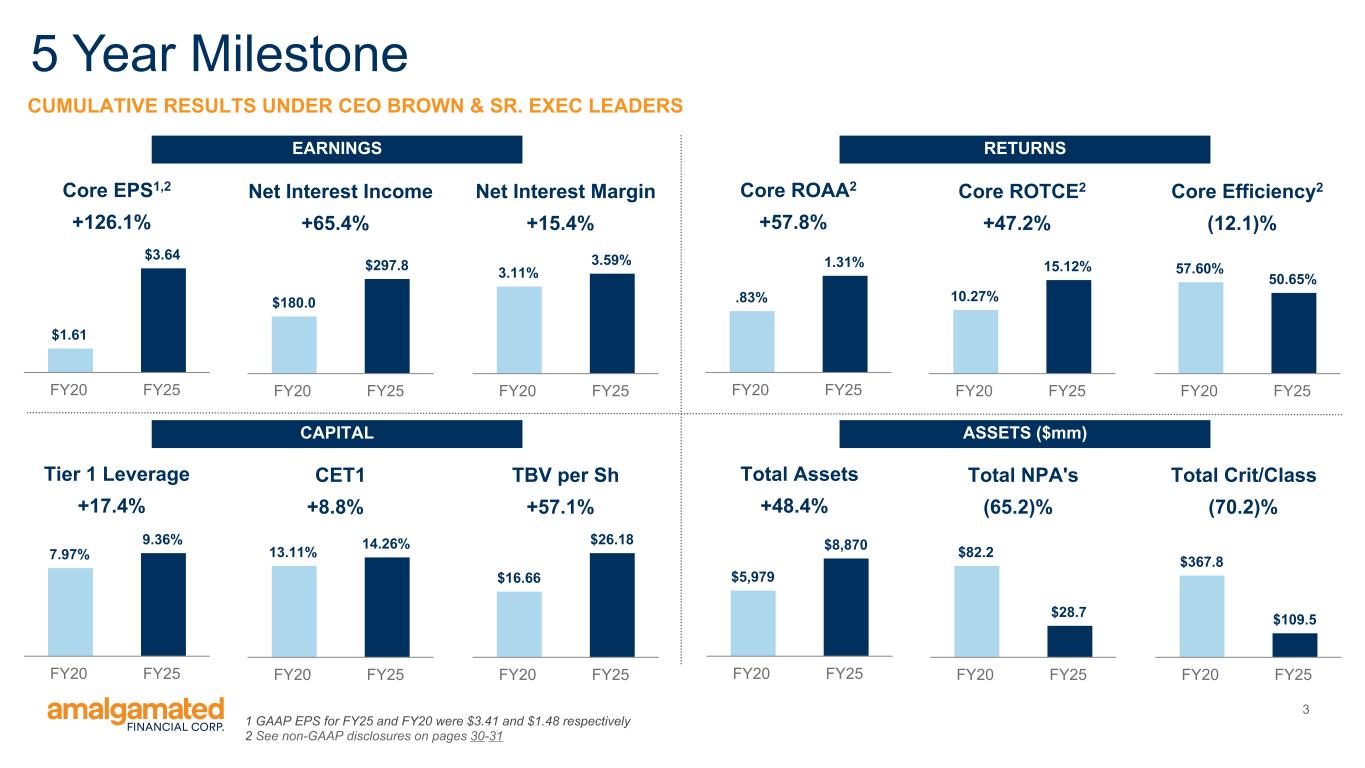
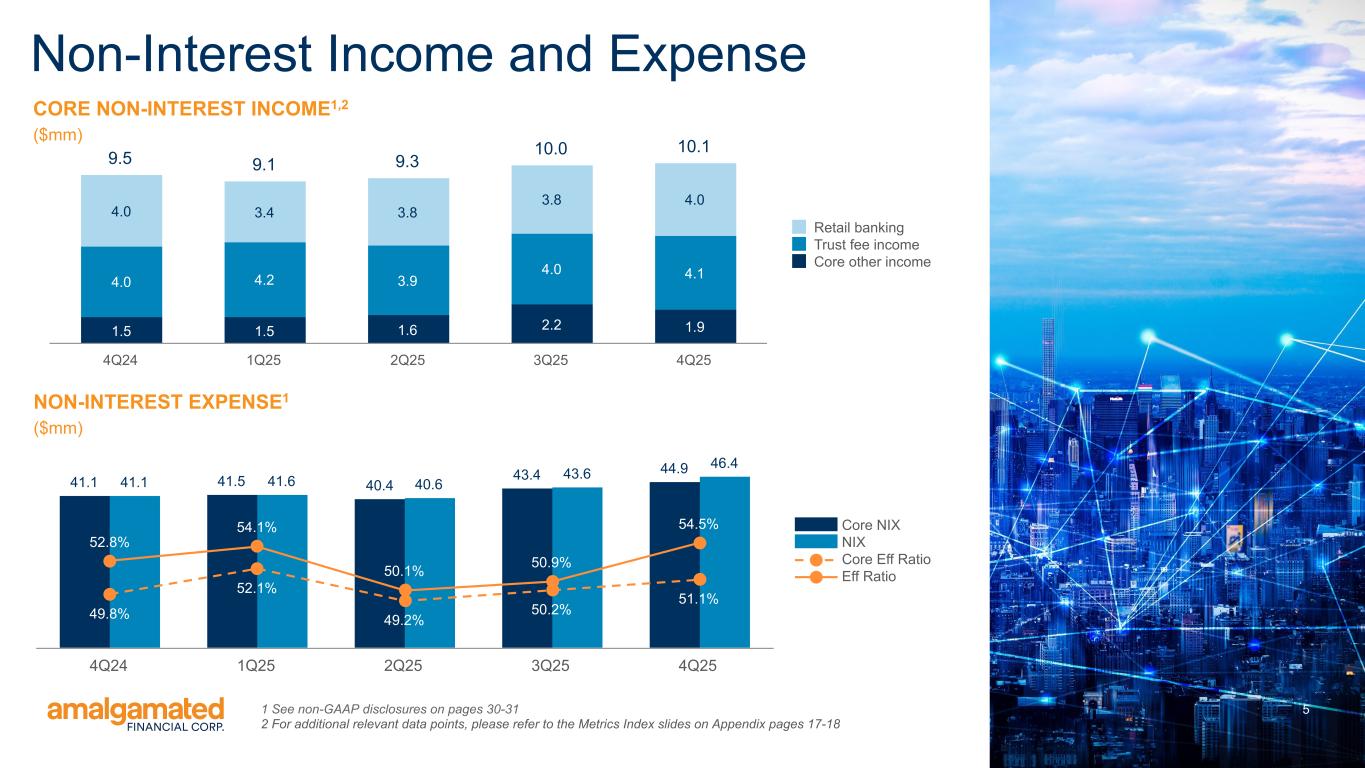
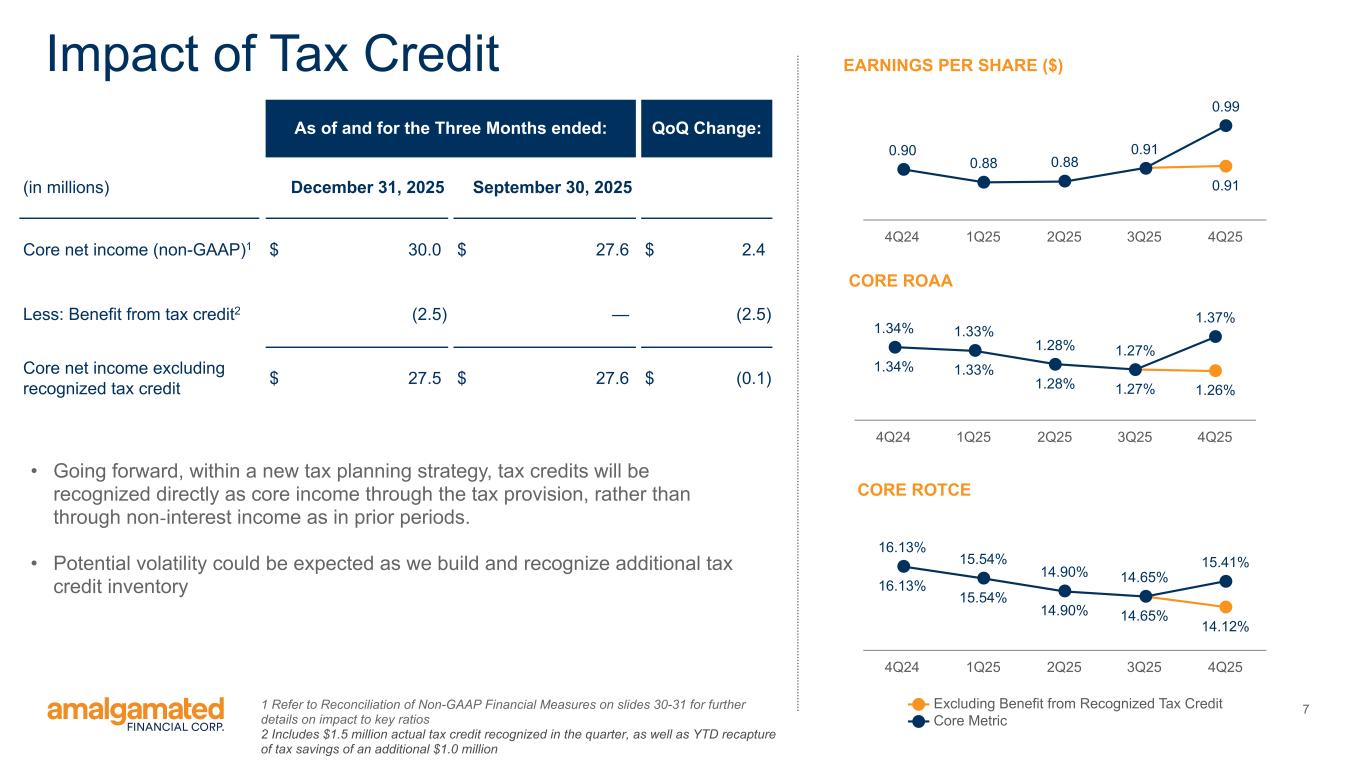
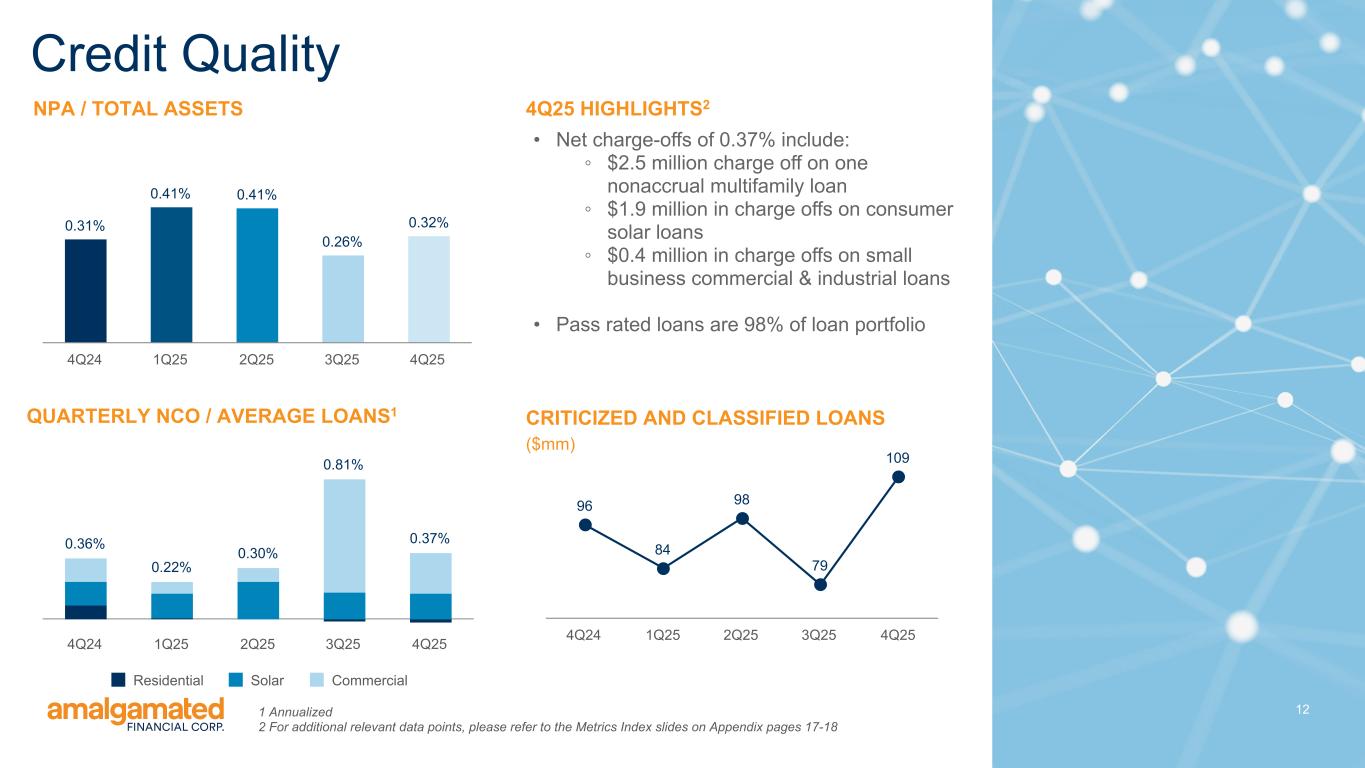
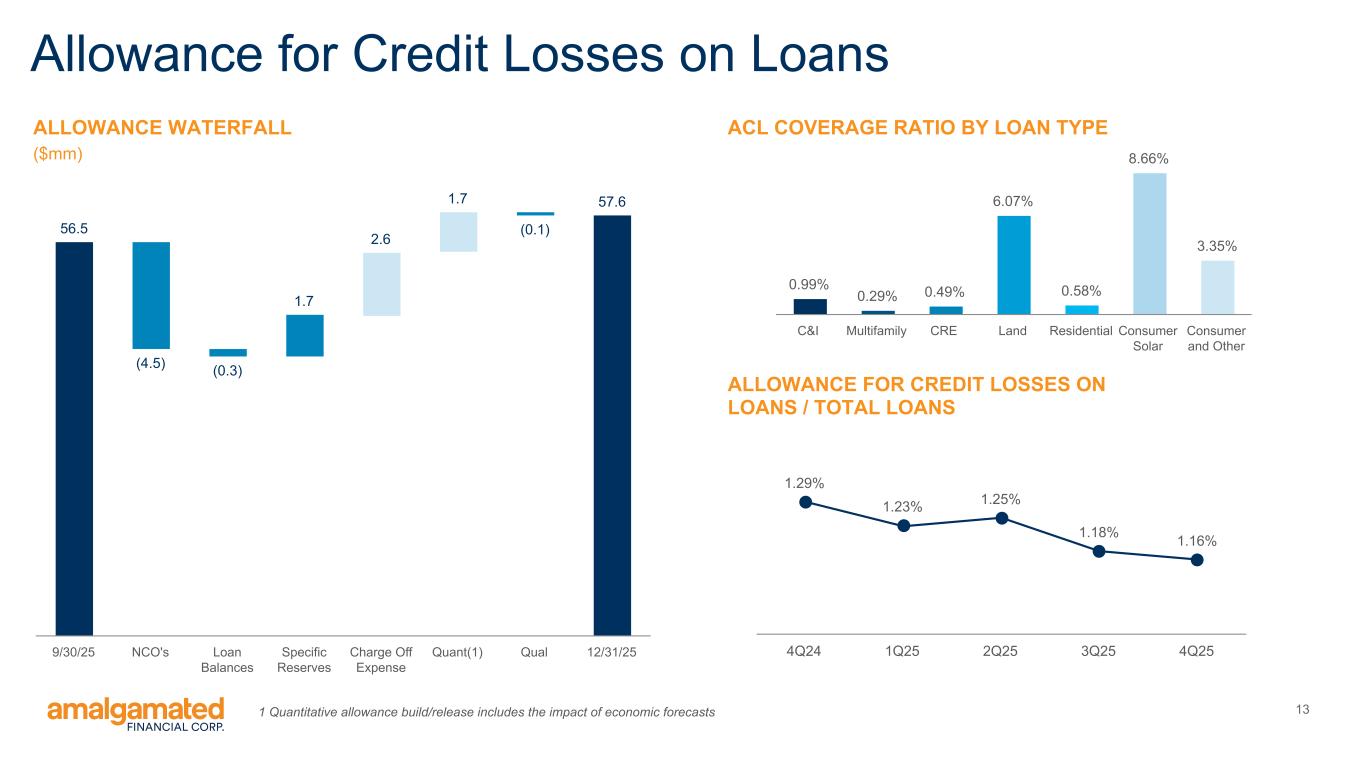
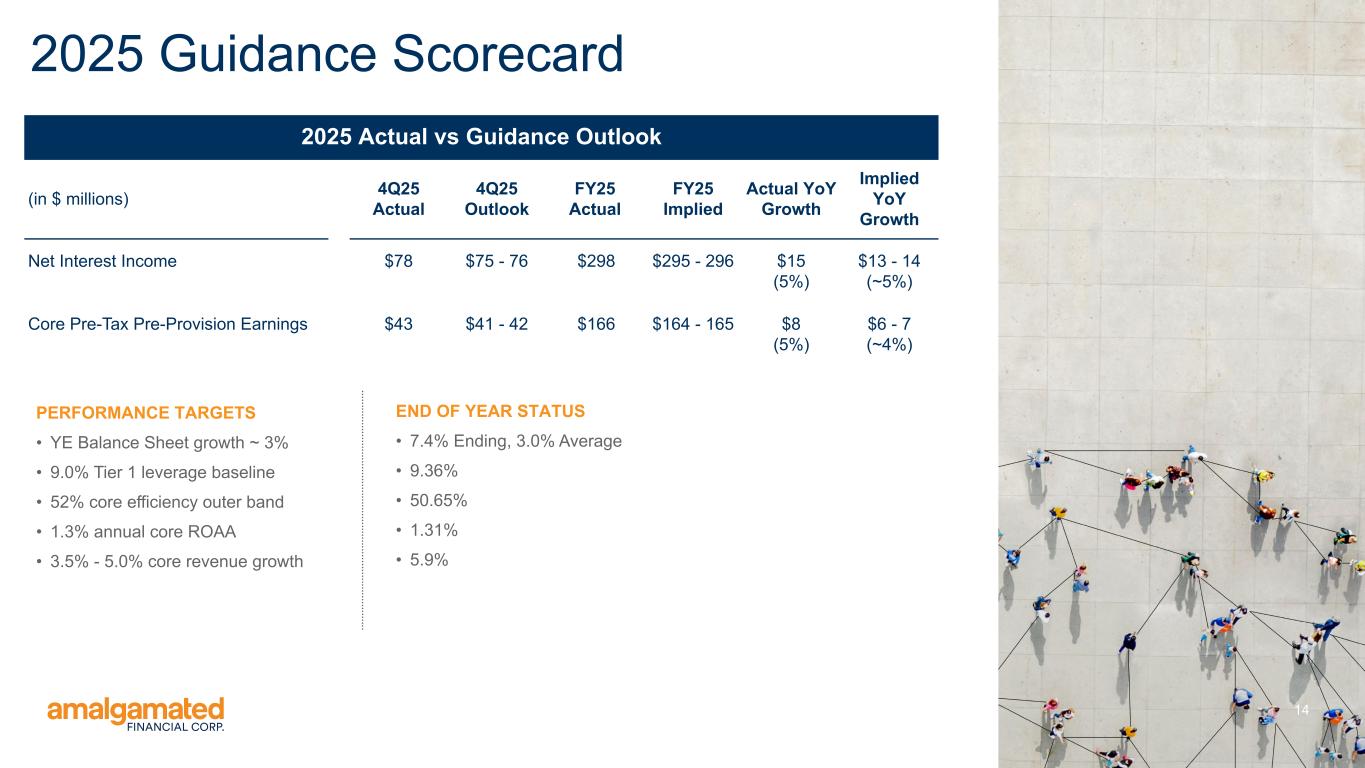
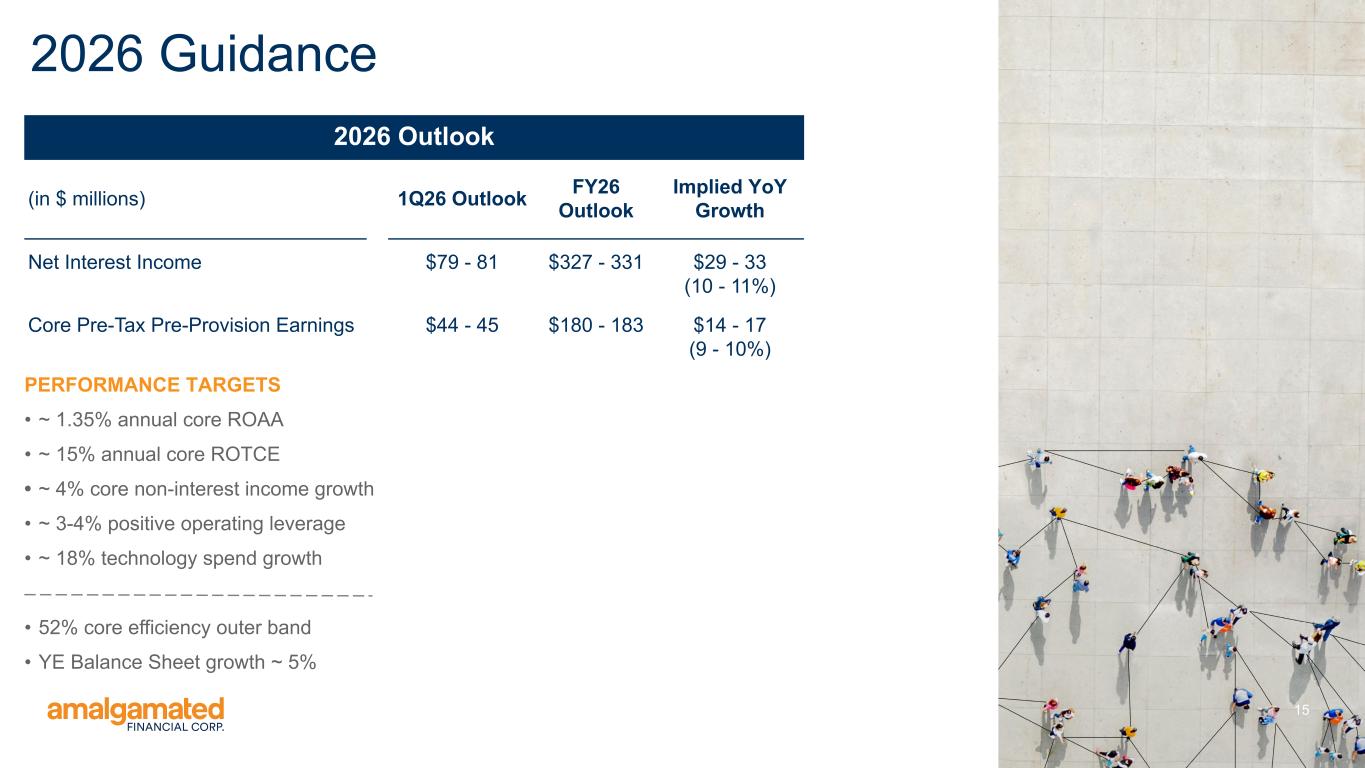
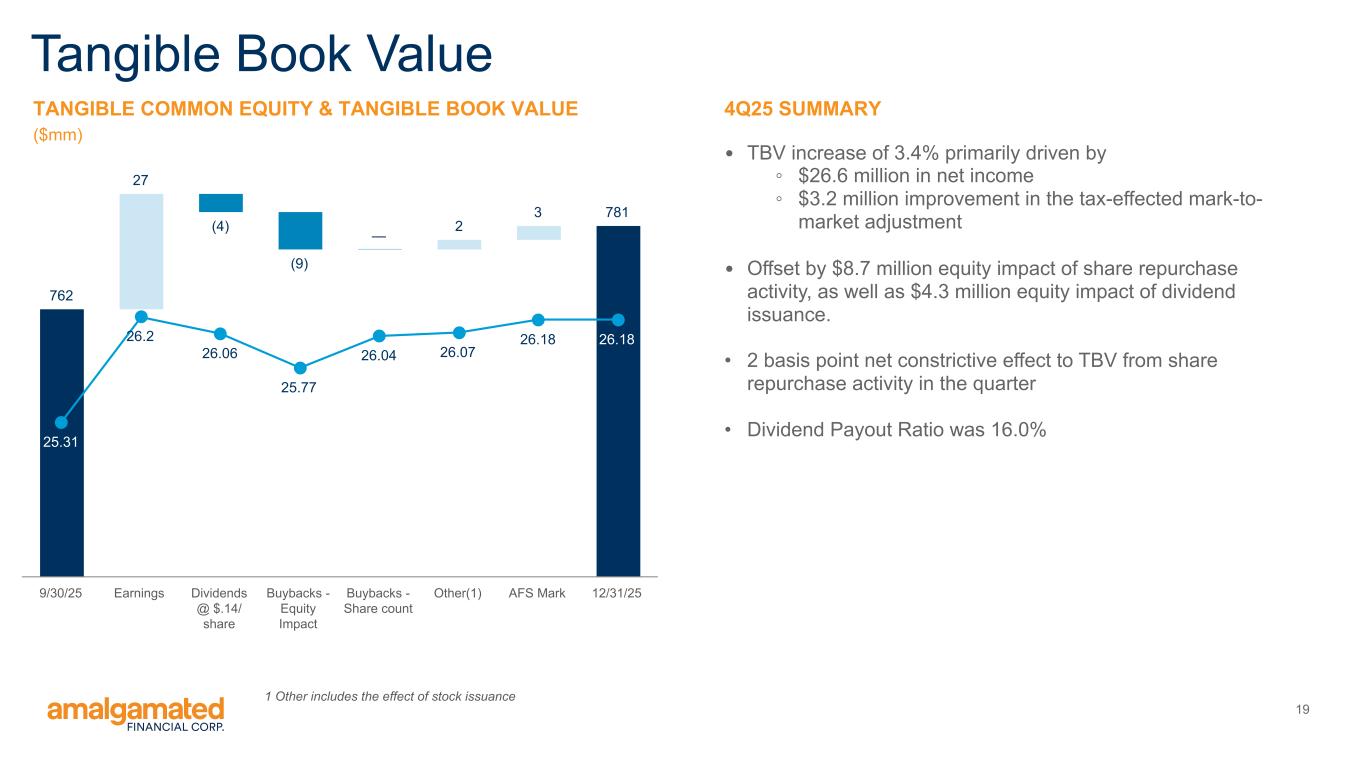
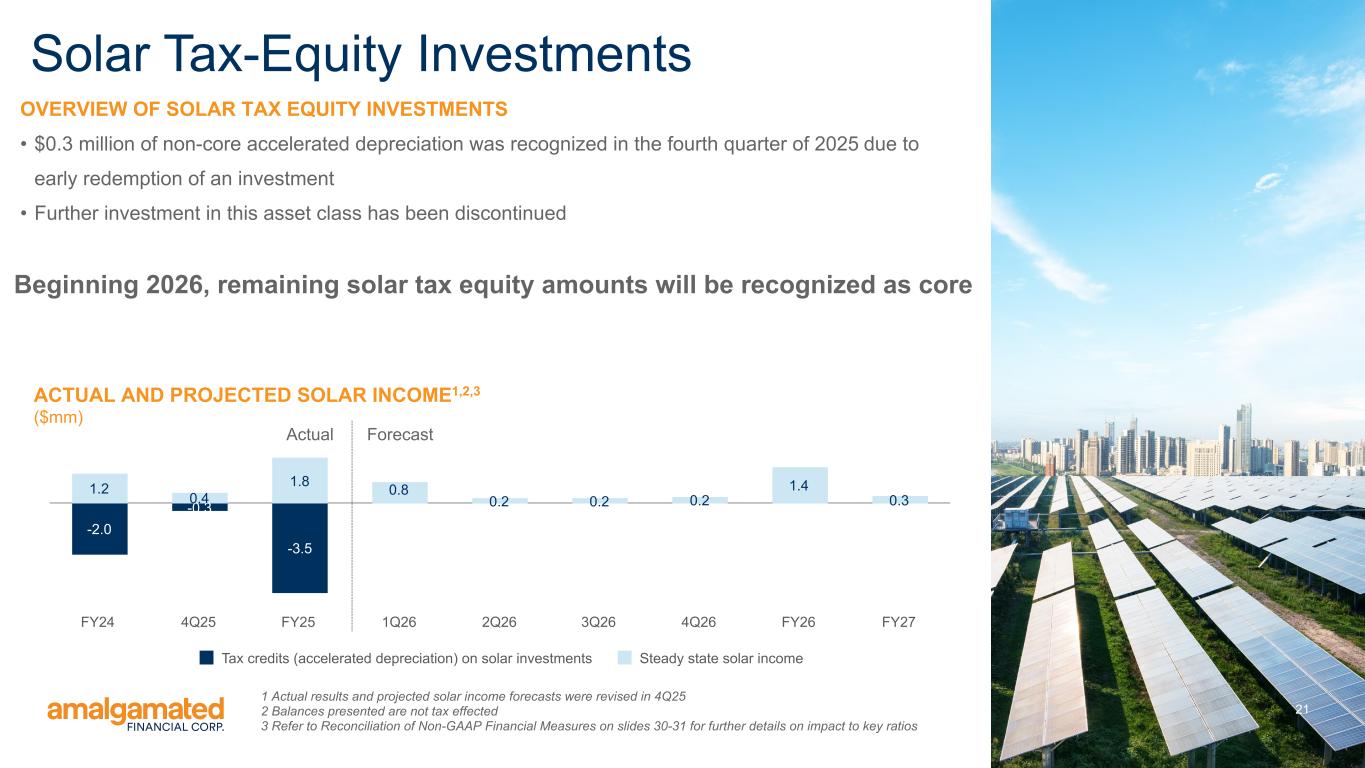
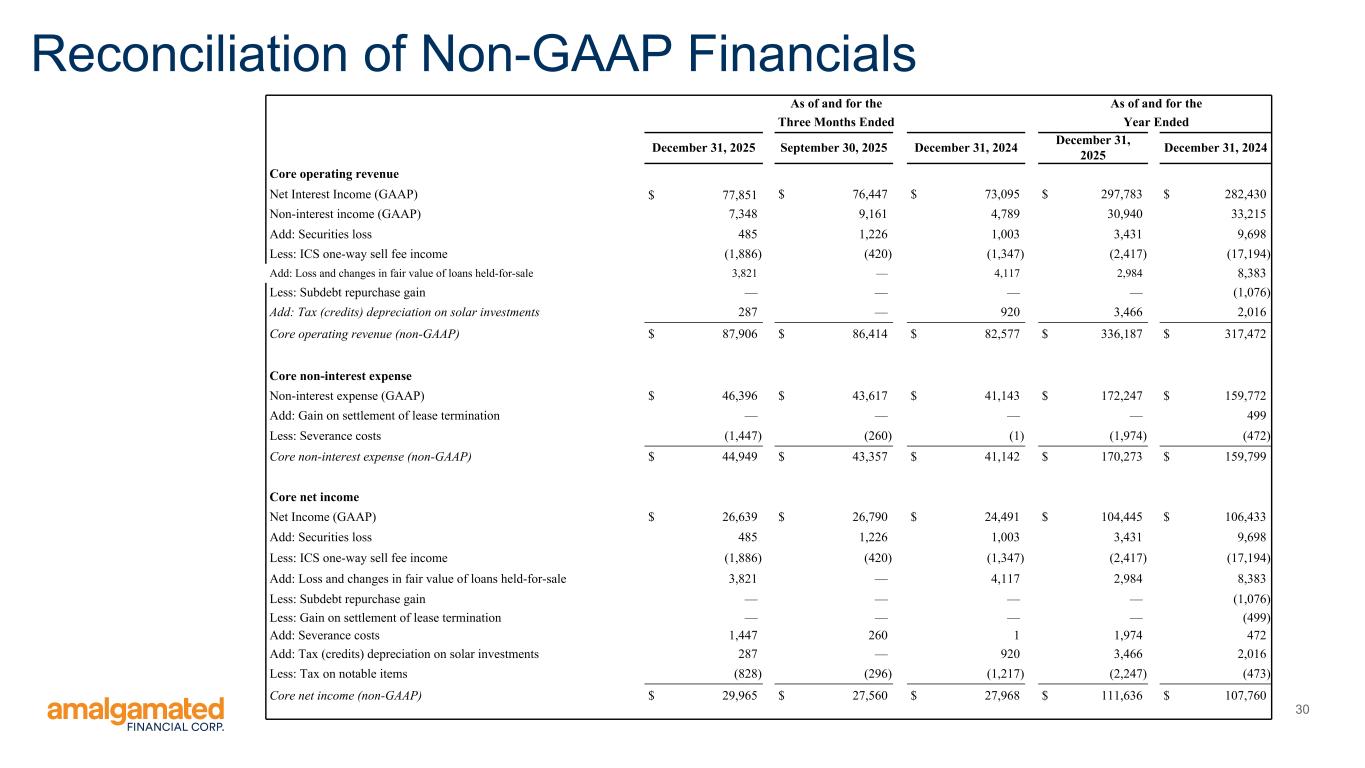
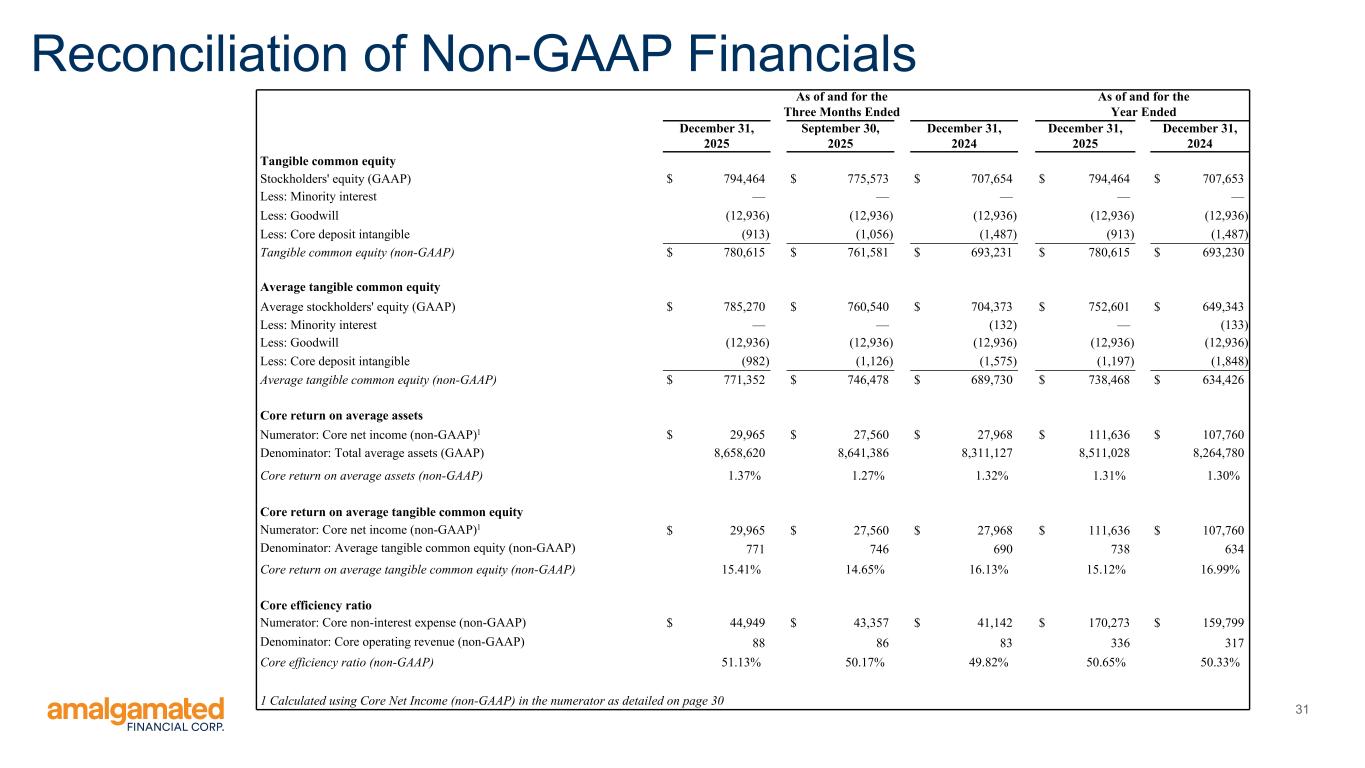
Thanks, Priscilla. The big theme we've been communicating this morning is growth. As Priscilla noted, we have taken the right steps to position the bank for responsible expansion and our 2026 guidance outlines some of our plans. But this quarter also marks a milestone as 2025 concludes the fifth fiscal year since Priscilla joined the bank, and it's worth briefly reflecting on that progress. Slide three illustrates Amalgamian's remarkable growth across multiple metrics during this era. And beyond the numbers, the strategy guiding this progress is clear. Profitability as a North Star inextricably tied with mission purpose. A capital base to match the size of the balance sheet. The balance sheet has a source of strength and asset quality consistent with well-run peers. And when we got started four and a half years ago, our first priority was to rebuild trust. Today, we can confidently say we did what we set out to do. We now look forward to driving the next phase of amalgamated growth, building on this solid foundation. Before we get to guidance, let's review the quarter. In addition to the markers Priscilla mentioned, here are some other key highlights. Net income was $26.6 million, or $0.88 per diluted share, and core net income, which has been on GAP measure, was $30 million, or $0.99 per diluted share. And the spread between GAP and core earnings per share was almost entirely related to a $41.9 million sale of performing residential loans with sub-3% coupons. That resulted in a $3.8 million pre-tax loss. GAP and core earnings were bolstered by the recognition of a $1.5 million tax credit, which I'll talk about more in a moment. Excluding that benefit, core net income would have been a solid $27.5 million, or 91 cents per diluted share, on par with the prior quarter. Our net interest income grew by 1.8% to $77.9 million, which exceeded the high end of our guidance range. Additionally, our net interest margin increased six basis points to 3.66%, driven by a 16 basis point decline in our cost of funds as we benefited from the Fed's recent rate cuts. Core non-interest income was solid at $10.1 million, continuing its steady improvement over the past four quarters, driven primarily by trust income and banking fees. It now represents 11.4% of core revenue, reflecting meaningful progress towards our 85-15 revenue diversification objective. Spenses ticked up a bit during the quarter, largely related to non-core severance costs in our residential lending unit. Core expense of $44.9 million was right in line with our annual target of $170 million. We are very happy with our core efficiency ratio of 51.13%. As expenses have risen as expected, revenue growth has kept pace and sets us up well for 2026. So overall, it was another solid quarter with continued strength across our key performance metrics. Most notably, tangible book value per share rose 87 cents, or 3.4%, and tier one leverage was strong at 9.36%. We returned capital to shareholders through buybacks of $8.7 million and our $0.14 quarterly dividend, and earlier this week, we announced a $0.03 dividend increase to $0.17 based on our confident outlook for 2026 earnings. Now, just a quick note on the tax credit I mentioned earlier. This quarter's credit reflects a new tax planning approach that runs credits through the tax provision instead of non-interest income, and because of this change, past tax credit recognition will no longer be classified as non-core and credits recognized under this new approach will be considered core. We've added a slide on page 7 to explain the change and we'll keep it in for a bit to help clarify any tax line volatility as we build our inventory of credits. The key point, we're reducing non-core adjustments to make our financials simpler to understand. Asset quality metrics remain solid overall, but there was some credit turbulence during the quarter. We marked for sale the non-accrual multifamily asset identified in Q3, which contributed to an elevated charge-off ratio and added approximately $0.8 million to provision expense. In our D.C. market, one borrower showed stress related to the rapid rehousing program restructuring, resulting in increased reserves of $1.9 million and a related $7.5 million increase in non-accrual multifamily loans. This also was the source of the entire increase in multifamily criticized or classified assets during the quarter. We are currently working with this borrower to restructure portions of their portfolio, and we believe we are adequately reserved this time on the non-accruing loans. The other loans with this borrower that moved into classified and criticized for the quarter benefit from additional equity partners to support ongoing right-sizing activities. And while this development is unfortunate, our total exposure to D.C.'s rapid rehousing program beyond this relationship is low, with all loans graded past as of the quarter end. Now, let's move to full year 2025 performance. We've updated our targets as actual results for easier comparison. In what began as a very challenging year, we exceeded all our key performance goals and maintained consistent upward momentum, issuing two guidance increases during the year and ultimately exceeding those projections. looking ahead to 2026 i'll wrap up my comments where priscilla started talking about growth we believe our business model will deliver reliable growth across multiple dimensions with our full year 2026 guidance we aim to hit the following revenue and profitability ranges net interest income of 327 million to 331 million dollars or roughly 10 to 11 percent growth and core pre-tax pre-provision earnings of $180 to $183 million, or 9% to 10% growth. For performance targets, we aim to deliver core return on average assets growth to 1.35%, core return on tangible common equity growth to 15%, and balance sheet growth of approximately 5%. And for expense discipline targets, we aim to deliver return to core positive operating leverage of between 3% and 4%, growth in technology spend of about 18% to continue to scale the business, and annual core OPEX growth to $188 million. Now, underpinning these targets as quarterly net loan growth of 1.5% to 2%, that builds on the momentum we established in the back half of 2025 and considers the effect of our runoff portfolios. This guidance reflects our commitment to disciplined execution and value creation. We enter 2026 with clarity, confidence, and intent to deliver quality returns on tangible common equity consistently. Closing with a lens on the first quarter of 2026, based on a target average balance sheet size at approximately $8.7 billion, we estimate net interest income to increase to between $79 and $81 million, and we also expect our net interest margin to rise from the fourth quarter, primarily from increased yields from the loan growth that came on late in the quarter. We're now happy to take your questions, so operator, please open up the line for Q&A.
Operator
Thank you. We will now be conducting a question and answer session. If you would like to ask a question, please press star 1 on your telephone keypad. A confirmation tone will indicate your line is in the question queue. You may press star 2 to remove yourself from the queue. For participants using speaker equipment, it may be necessary to pick up the handset before pressing the star keys. Our first question comes from the line of Mark Fitzgibbon with Parker Sandler. Please proceed with your question.
Hey, guys. Good morning. Hi, Priscilla. So first question I had, I was curious how you're thinking about the outlook for the provision in 2026 based on what you see today from a credit perspective. Would you expect credit costs to generally be a little bit lower than what we saw in 2025? Just curious on macro thoughts on that as well as the effective tax rate for the new year.
Yeah, great. Hey, Mark, it's Jason. The provision outlook for the coming year is roughly the same from an actual perspective as we've recognized for 2025. Maybe a little bit of improvement there, but I wouldn't on the margin say it's very significant. I think the reason for that is more rooted in just the normal charge-off activity we've seen through the consumer solar portfolio, and we don't expect that to abate very much in the coming year, albeit it would be nice if that came through in a more recovered fashion because that would be a benefit through the provision line. And then we're just keeping a more conservative approach to the overall provisioning just given some of the bumps that we went through in the current year. That said, we still think that the provision expense overall is a very manageable number relative to the core earnings progress that the bank will show, and it actually will not detract from the earnings per share growth that we're looking forward to in the coming year. From an effective tax rate perspective, this is an area I think we've spent a decent amount of time focusing a new tax strategy on. We have the opportunity to make more inroads on our effective tax rate. We're targeting to start off a 26.5% ETR, and that takes into account a small inventory of tax credits related to this new strategy we've deployed, we also think there's potential upside on the ETR throughout the year as we work to build up more of these tax provision-related credits as we go. And hopefully, we'll be able to show a lower ETR. But for now, we're modeling out 26.5%.
Okay, great. And then, since you guys are so close to it, I'm curious how you're thinking about political deposits over the next couple quarters. I think you peaked prior to the presidential election in the third quarter last year at about $2 billion. Given where I think you're $1.7 billion today in total on and off balance sheet deposits, do you think we'll see that by the third quarter soar past that $2 billion level? Are you, based on what you see today, is pipeline fundraising strong? Any thoughts that would be appreciated.
I'll ask Sam to address that, Mark, but I will say, you know, we have been pleasantly surprised, as you know, every cycle in that our projections or our actuals from the prior cycle have been surpassed. So, you're right on the 1.7, and we certainly expect to build through until the election. And Sam, do you have more thoughts on that?
Yeah, Mark, I'll just say that, you know, you're exactly right that, you know, we're really pleased with about our 20 percent growth quarter over quarter and political. That has certainly been right on trend with what we've put out in disclosure. You're exactly right that that political balance usually peaks right, you know, about a month before the election actually happens. And then we see that wind down. You've seen since we've been putting out data since 2018, you know, there's a little bit of a, you know, kind of inflationary impact cycle over cycle. just as the contribution limits get larger each year, and we certainly see that as well. But I think if you look at the trend, you look at the performance quarter of a quarter, I think it's a good kind of straight-line dashboard to where we think this will head and very consistent with prior election cycle performance.
Okay, great. And the last question I had, it looked like you had really strong multifamily growth this quarter. I was curious, I assume it probably wasn't in New York City, or was it across other parts of your footprint? Just any thoughts there would be appreciated.
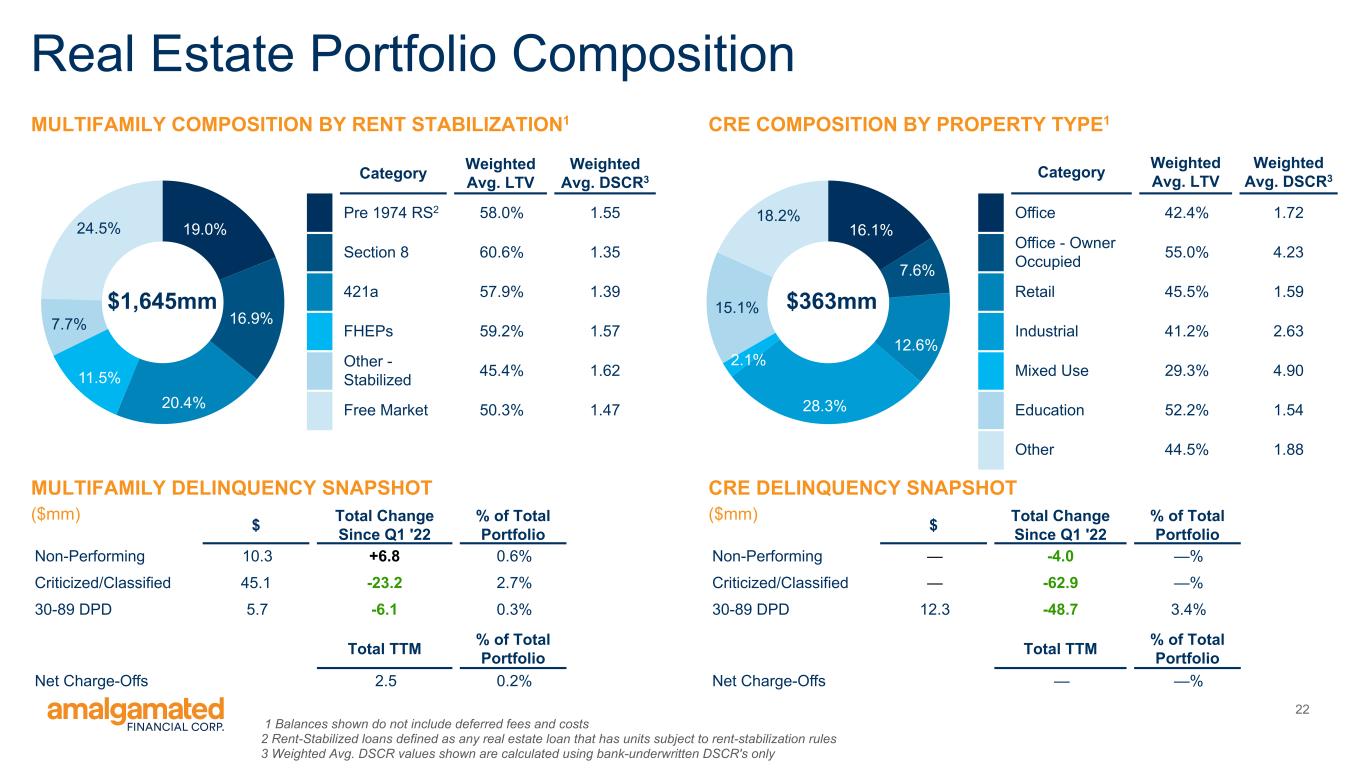
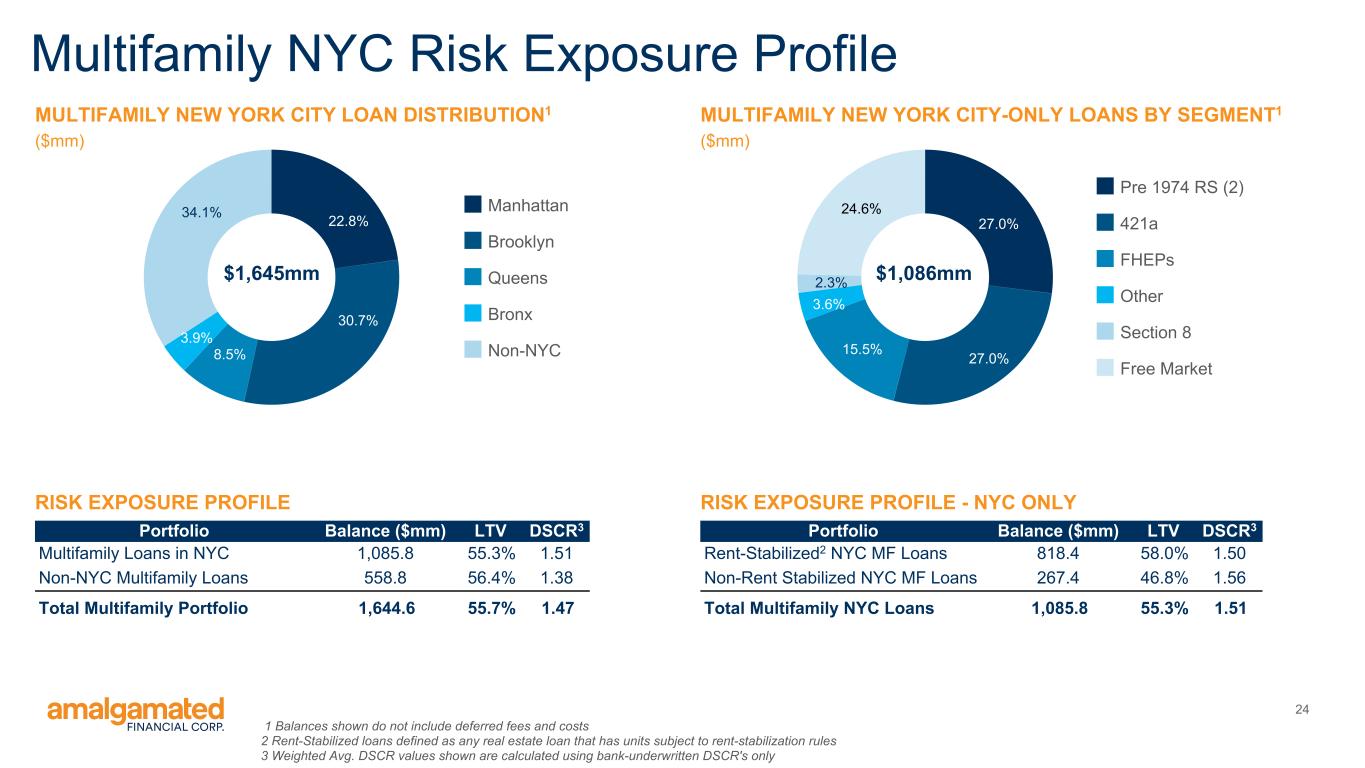
Yeah, we were really proud of that. Obviously, it's a great, great quarter for multifamily. I think, you know, really exciting that, you know, slightly under half of that actually came outside of New York City, which is really good geographic diversification for us. Proud to see, you know, multifamily in all of our physical footprint locales. And so we think that that is also bolstered by pipeline going forward. And so we think that we will definitely continue to see a good geographic representation in multi.
Operator
Thank you. Thank you. Our next question comes from the line of David Conrad with KBW. Please proceed with your question.
Hi, good morning. I had a question. You know, I thought the NIM expansion was really impressive in a down rate quarter, really. Just wanted to follow up on the commercial loan yields and the impact on NIM. You know, what are the yields that you're booking now in the pipeline and kind of the mix of fixed versus floating?
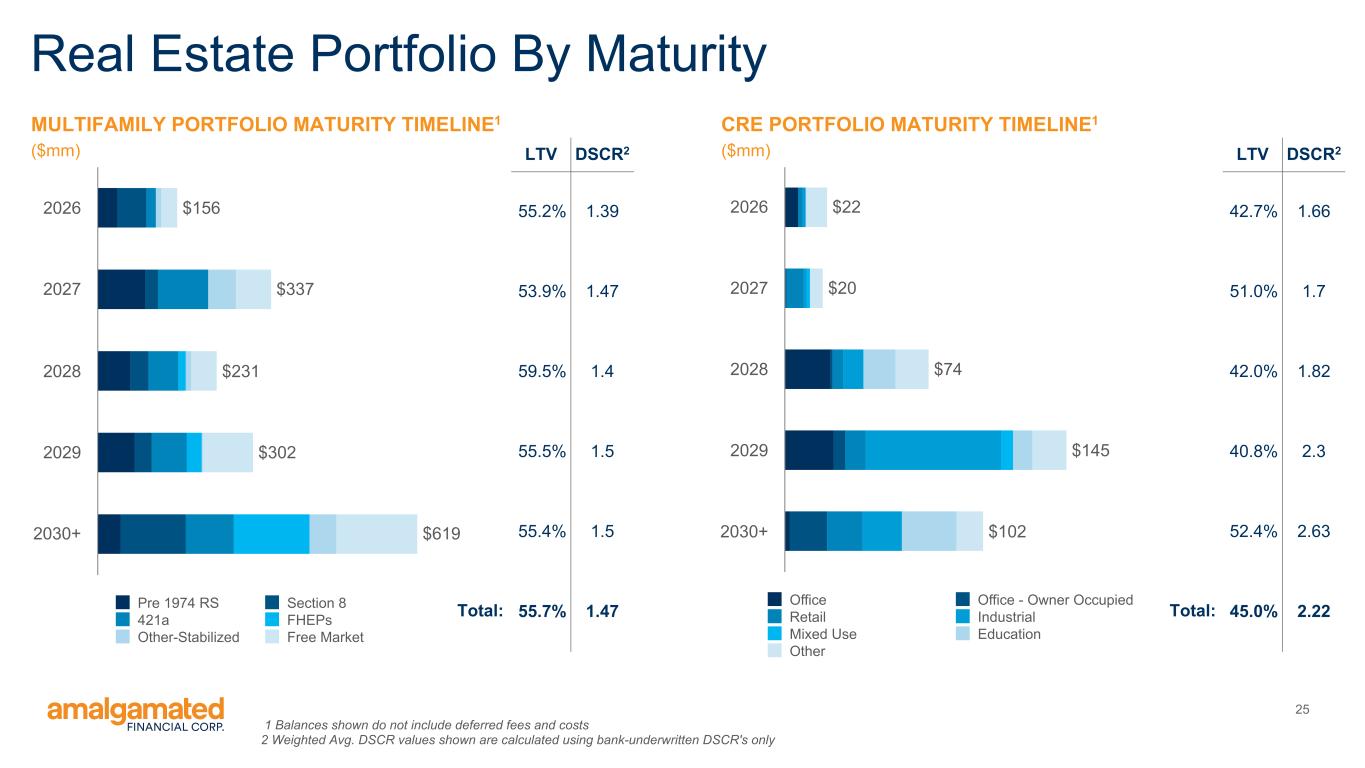
Sure. Hey, David, Jason. So, yeah, the NIM for the fourth quarter was really nice. We were still able to see some baseline loan yield expansion, despite the fact that we had some contraction on the posted numbers. But that really relates to the item that we talked about last quarter, which had that one-timer capture flowing through the interest income line. So, on the whole, loan yields were rising, but we also had quite a bit of benefit from the rate cuts and our deposit betas being higher than we modeled. And I think that bodes well for how we would set up for margin expansion heading into 2026. the bring-on rates, we are looking at probably somewhere in the 5.9% to 6% range for CNI, for multi-family series, probably in the 570 range. So the overall rates are, I think, in line with where market generally is, especially for quality credits. But as we've talked about before the real advantage for the bank is going to be in the repricing of the older real estate loans. And those are coming off this year in the 430 range. So we're going to get a decent clip there in terms of just the overall repricing benefit. Obviously, we still have the PACE portfolio, which comes on at higher rates and that high sixes, even close to 7% range. So the ability ad yield is pretty strong there. And then just looking outward, I think the bank is really in a great place to steadily have margin expansion throughout the year.
Great. And maybe, you know, with all the deposit growth, just following up on the PACE portfolio and the outlook for growth there, and is there any limitations that you look out a few years in terms of percentage of the securities book or percentage of capital with that portfolio because it seems like such a strong yield?
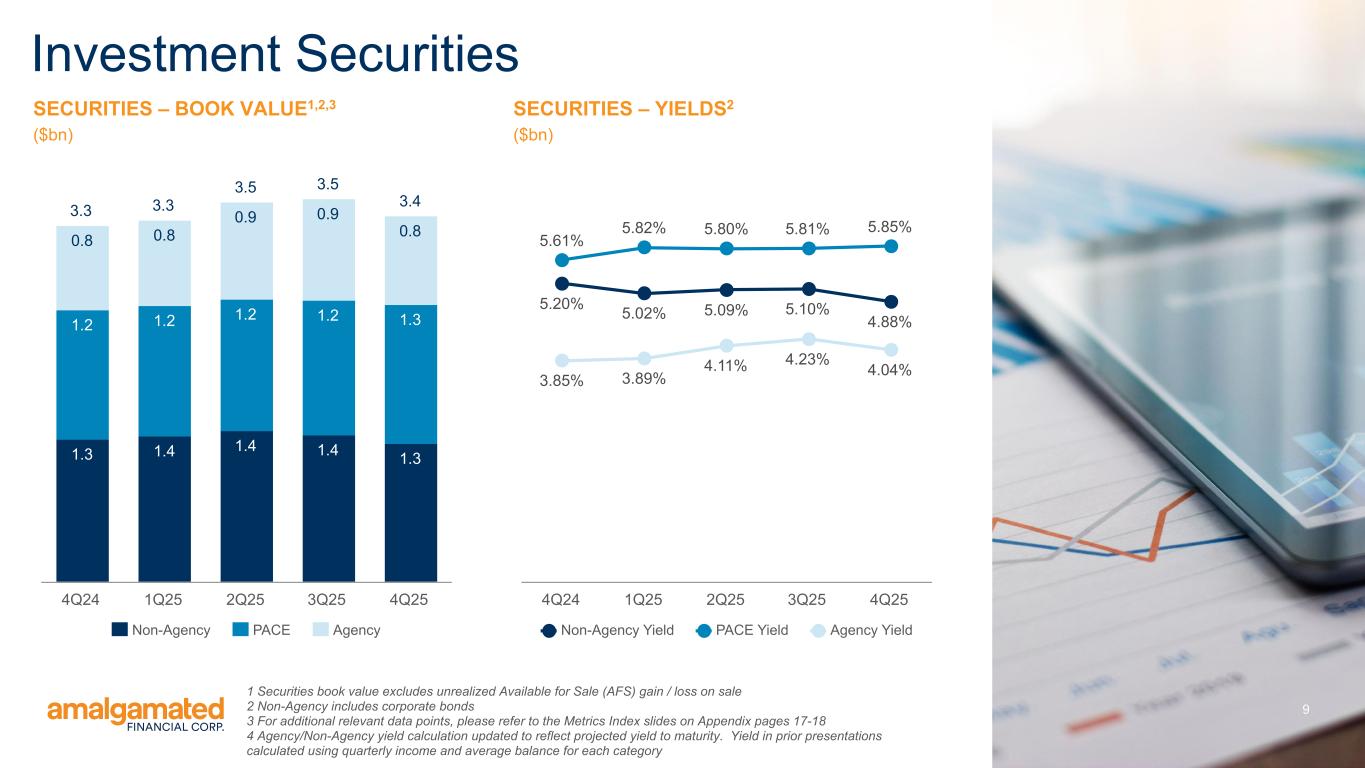
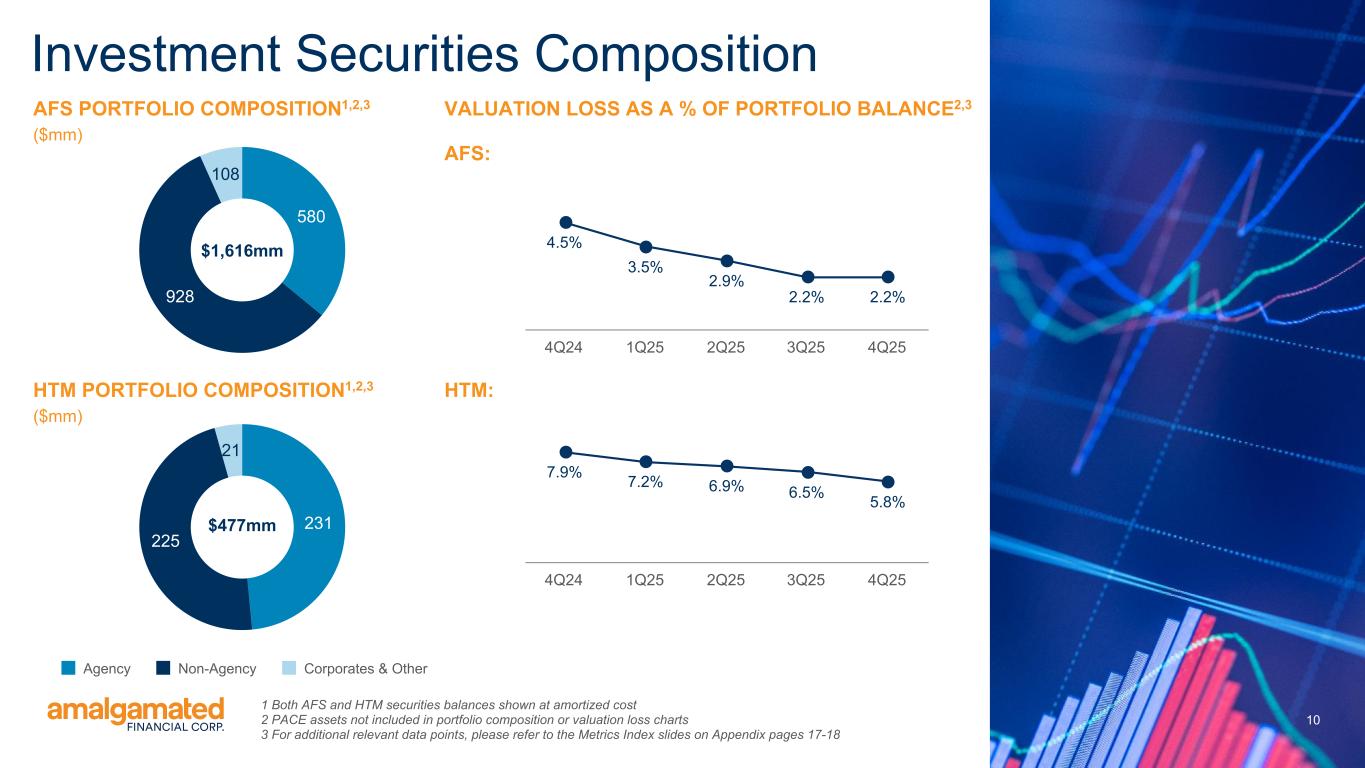
Yeah. From a concentration perspective, we have lots of room on our balance sheet to add CPACE. So, no real restriction there in terms of the ability to add assets in a meaningful way from a growth perspective. I'll ask Sam to talk a little bit more about the prospects of growth in just a moment. But the opportunity for CPACE yield is very, very strong, as we've seen. The risk adjuster returns are excellent. And there's a green space that's continuing to develop in the CPACE market as more and more municipalities throughout the United States add it to the capital stack. So the bank's ability to be first mover in that area is going to be really good. We're going to be taking advantage of a partnership that we've established that drives lower dollar value CPACE, but more volume, which we think will add a lot of opportunity for us. And going forward, CPACE is going to be an opportunity to trade down on our traditional securities portfolio. So from a balancing perspective, we still feel overweight on traditional securities. You saw a little bit of this movement this quarter where we traded down on traditional securities to the tune of about $200 million to fund the combination of loan growth and CPACE, and I expect you'll see more of that as we continue to move out into 2026. Sam, you want to talk about growth potential?
Thanks, David. So, you know, I think one of the great things about the quarter was really this realization on something we've talked about in the past about increasing the percentage of CPACE to RESI-PACE, and as you saw our origination in the quarter, you know, three-quarters of that came from the commercial side, which is really something that we've been focused on, and we see that going forward as a real source of income for us. I think that $27 million number on commercial pace is certainly something that we see as kind of based on where we want to be going forward and feel good about that number as a supplement to the loan activity, and I think you can continue to expect to see more of that.
Operator
Thank you. Nice quarter.
Operator
Thank you. And we have reached the end of the question and answer session. I would like to turn the floor back over to Priscilla Brown for closing remarks.
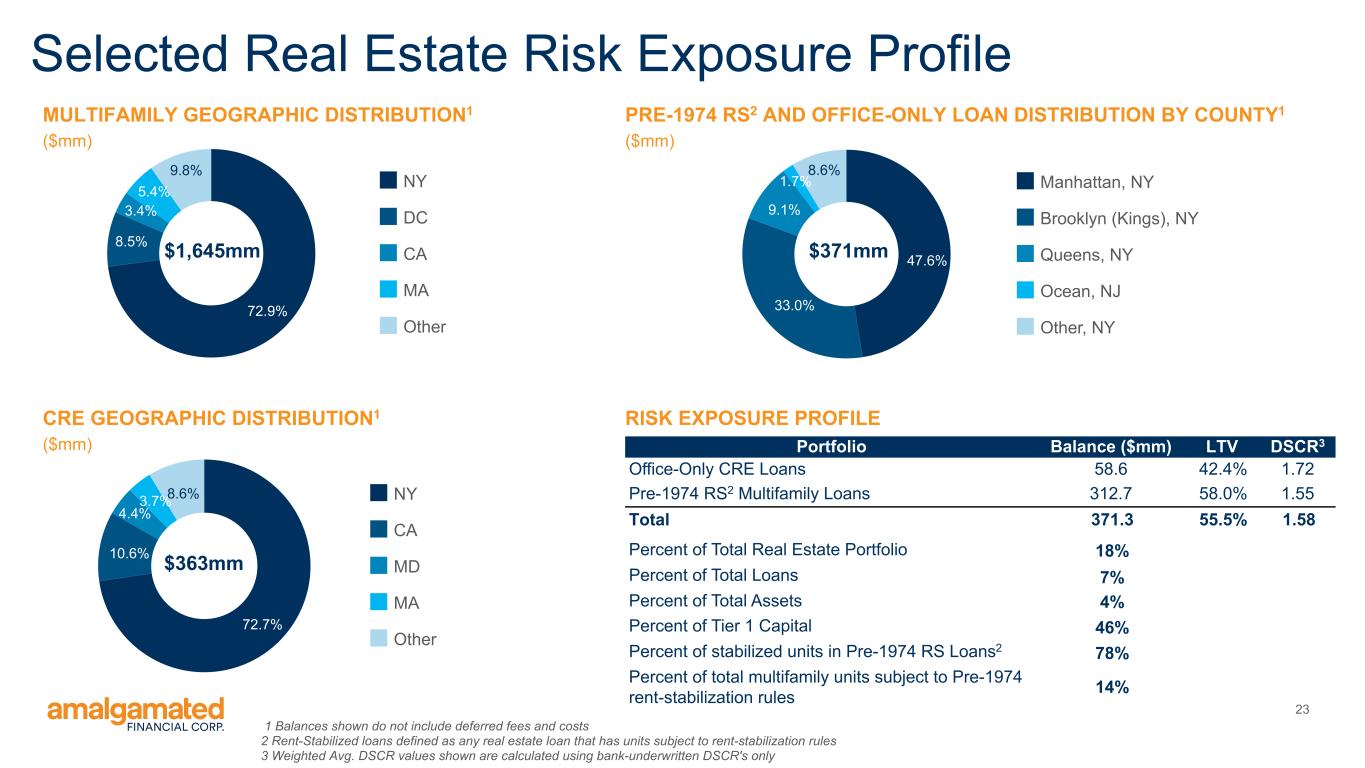
Thank you, Operator, and thank you for those good questions. Amalgamated Bank has delivered a strong, consistent performance through one of the most challenging operating environments in modern banking, growing earnings, expanding margin, and improving capital, while many peers struggled with deposit volatility, credit concerns, and rate shock. Over the last several years, it has combined disciplined balance sheet management, including appropriate commercial real estate concentration, high on balance sheet and contingent liquidity, and above peer capital ratios, with a focused, values-aligned client franchise that has continued to attract mission-driven deposits. Looking forward, Amalgamated is well positioned because our business model sits at the intersection of resilient market opportunities and powerful secular trends, where we've already established deep relationships and differentiated capabilities. This team's track record of mission meets performance, combined with a flexible balance sheet and multiple earnings levers, provide a strong platform for sustainable growth and outsized relevance as the industry continues to evolve. I look forward to updating you on our progress on our first quarter call and accepting your questions in between. Thank you again for your time today.
Operator
And this concludes today's conference. You may disconnect your line at this time. Thank you for your participation, and enjoy the rest of your day.