Operator
Good morning. My name is Van and I will be your conference operator today. At this time, I would like to welcome everyone to Atkore's Second Quarter Fiscal Year 2025 Earnings Conference Call. All lines have been placed in a listen-only mode. After the speakers' remarks, there will be a question-and-answer session. As a reminder, this conference is being recorded. Thank you. I would now like to turn the conference over to your host, Matt Kline, Vice President of Treasury and Investor Relations. Thank you. You may now begin.
Thank you, and good morning everyone. I'm joined today by Bill Waltz, President and CEO; John Deitzer, Chief Financial Officer; and John Pregenzer, Chief Operating Officer and President of Electrical. We will take questions at the conclusion of the call. I would like to remind everyone that during this call, we may make projections or forward-looking statements regarding future events or financial performance of the company. Such statements involve risks and uncertainties such that actual results may differ materially. Please refer to our SEC filings and today's press release which identify important factors that could cause actual results to differ materially from those contained in our projections or forward-looking statements. In addition, any reference in our discussion today to EBITDA means adjusted EBITDA and any reference to EPS or adjusted EPS means adjusted diluted earnings per share. Adjusted EBITDA and adjusted diluted earnings per share are non-GAAP measures. Reconciliations of non-GAAP measures and a presentation of the most comparable GAAP measures are available in the appendix to today's presentation. With that, I'll turn it over to Bill.
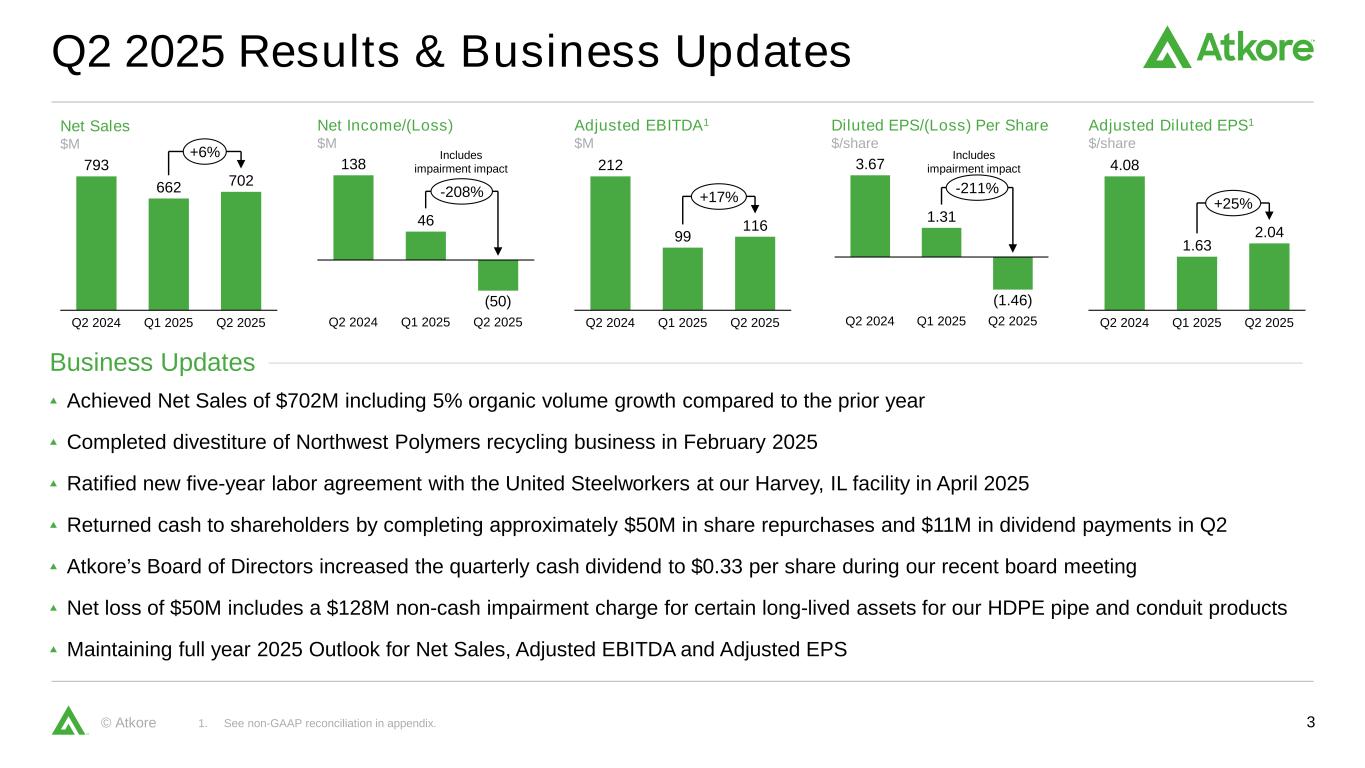
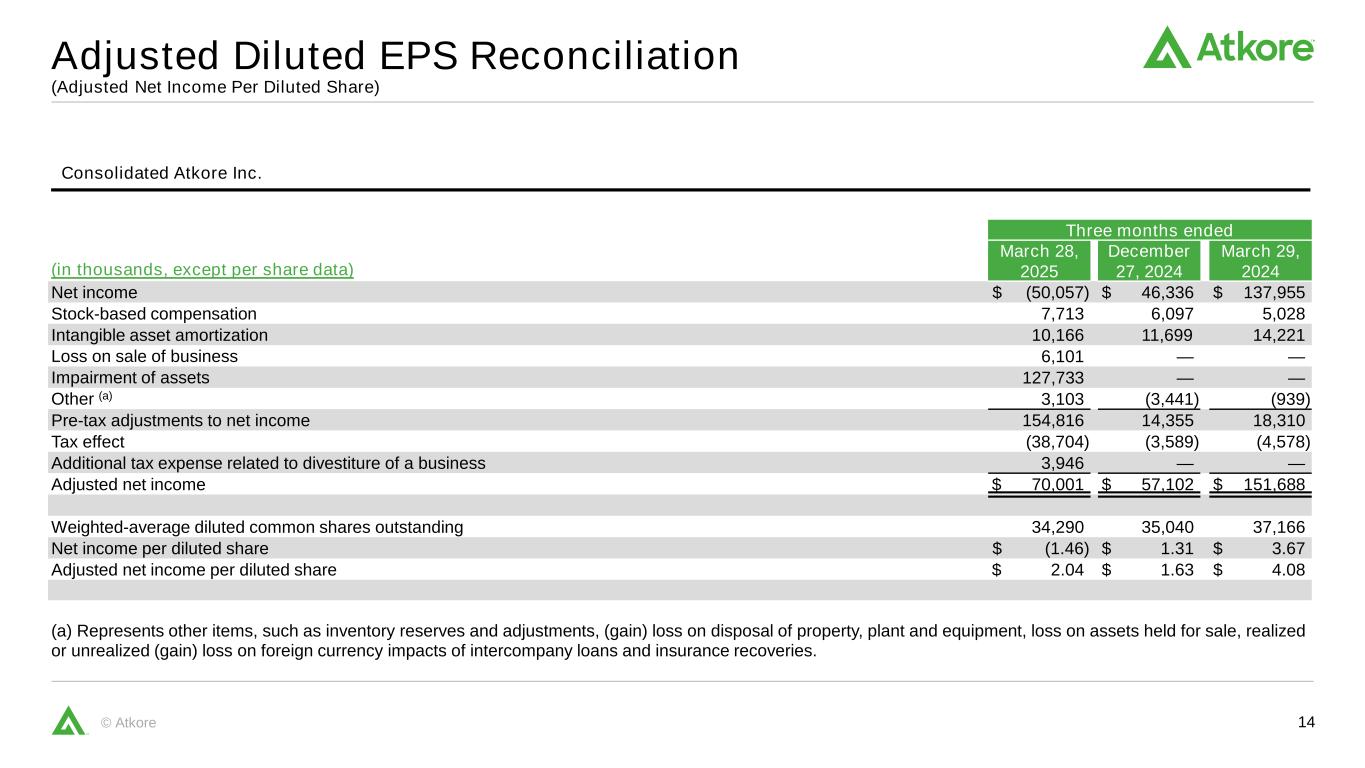
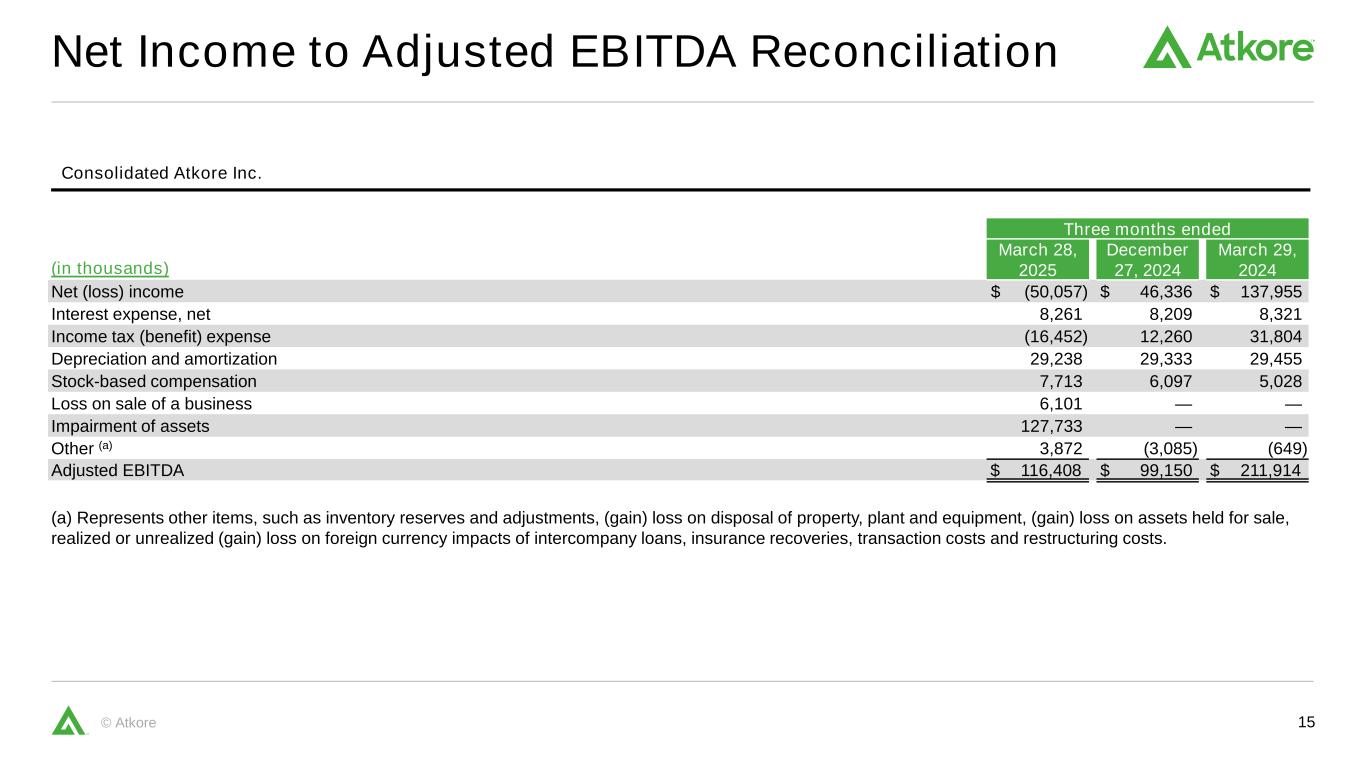
Thanks, Matt and good morning, everyone. We appreciate you joining us today for our fiscal 2025 second quarter earnings call. Starting with our second quarter results on Slide 3. We are very pleased with our second quarter performance. We achieved net sales of $702 million, which included 5% organic volume growth, driven by strong contributions from construction services, steel conduit, metal framing and cable management products. Adjusted EBITDA was $116 million and adjusted EPS was $2.04. In addition to our volume growth, our results benefited from better cost management and productivity. While our pricing was down year-over-year, we saw sequential quarter increases in our prices for our steel conduit products. Our teams have been focused on maximizing shareholder value, which includes assessing the best use for our assets. For example, in February, we announced the divestiture of Northwest Polymers recycling business after careful consideration and strategic review. I'm also pleased to highlight that we ratified a new five-year labor agreement with the United Steelworkers at our Harvey, Illinois facility last month. The new contract is retroactive to April 24, which is when the previous contract expired. This new agreement is a critical element for enabling us to continue building on our commitment to productivity and serving our customers. We redeployed cash to shareholders, having repurchased approximately $50 million in shares in the second quarter and paid our fifth quarterly dividend since adding the dividend to our capital deployment model in FY '24. As we announced last week, I'm also proud to highlight that Atkore's Board of Directors increased the dividend to $0.33 per share during our recent Board meeting. In mid-April, we announced an impairment charge for certain long-lived assets related to our HDP pipe and conduit products. The impairment charge was triggered by the emergence of competing technologies to fiber optic cable and delays in the deployment of government stimulus funding for nationwide broadband infrastructure investments. The net loss of $50 million includes a $128 million noncash impairment charge related to these HDPE assets. When we met in February, we had not yet incorporated the impact that tariffs might have on the broader construction market. We indicated that if tariffs went into effect we expect to be a net beneficiary since most of what we make and sell originates with materials, labor and equipment in the same geography. Following the elimination of exemptions and other actions taken by the administration, imported steel and aluminum products carry a 25% tariff, regardless of the country of origin. As we sit here today, we are more optimistic about demand for U.S.-made steel conduit in 2025. A greater demand for U.S.-made steel conduit helps Atkore. While recent weeks have been encouraging, there remains unpredictability of how long and to what extent tariffs may be part of our economic landscape. We are very mindful of the impact and certainty has on a macroeconomic level. The most recent Dodge Momentum Index suggested planning activity slowed across several nonresidential categories. On balance, we are proud to be maintaining the guidance we presented in February. We continue to expect full-year fiscal 2025 adjusted EBITDA with a midpoint of $400 million. I'm grateful for the dedication and resilience of our teams that have shown through a busy first half of the fiscal year, and I'm confident that we will continue to lead into our business system to execute our strategy and deliver value to our customers and shareholders. With that, I'll turn the call over to John to talk through the results from the quarter.
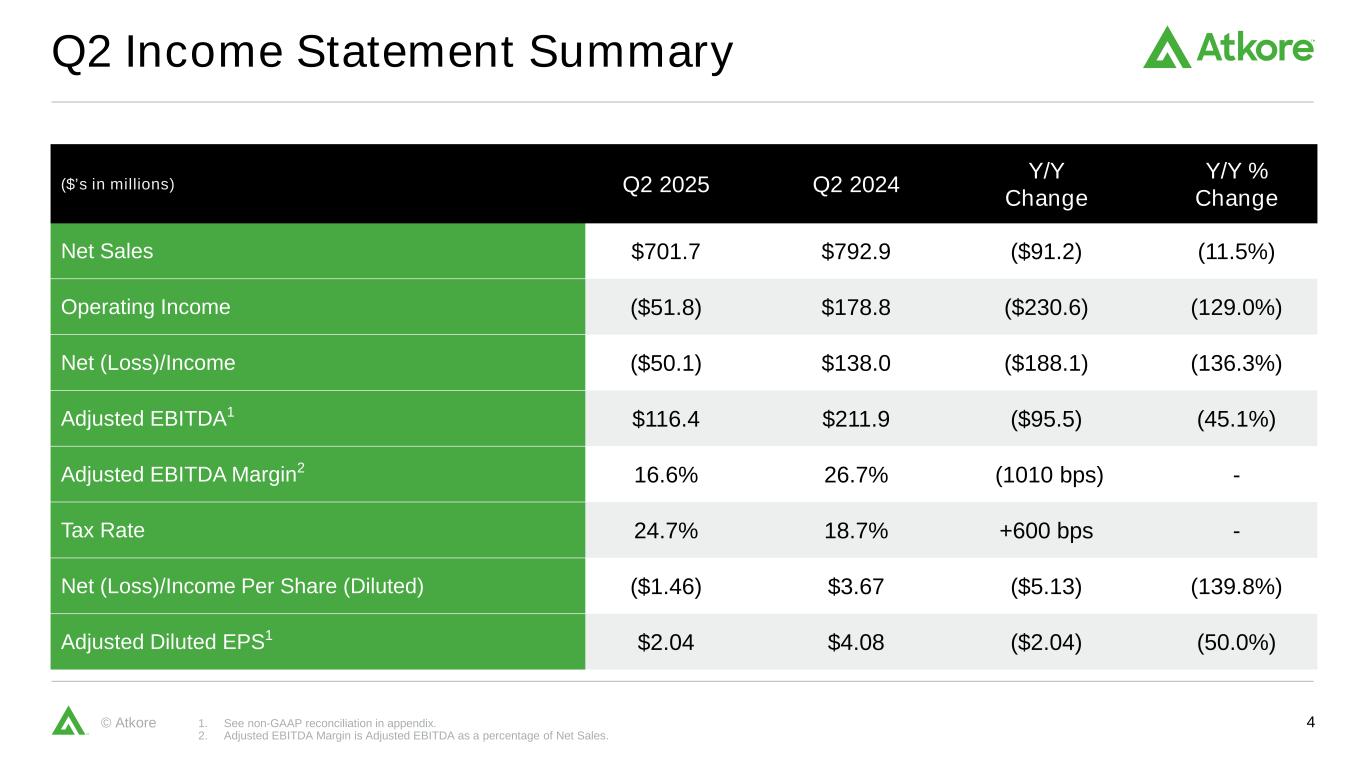
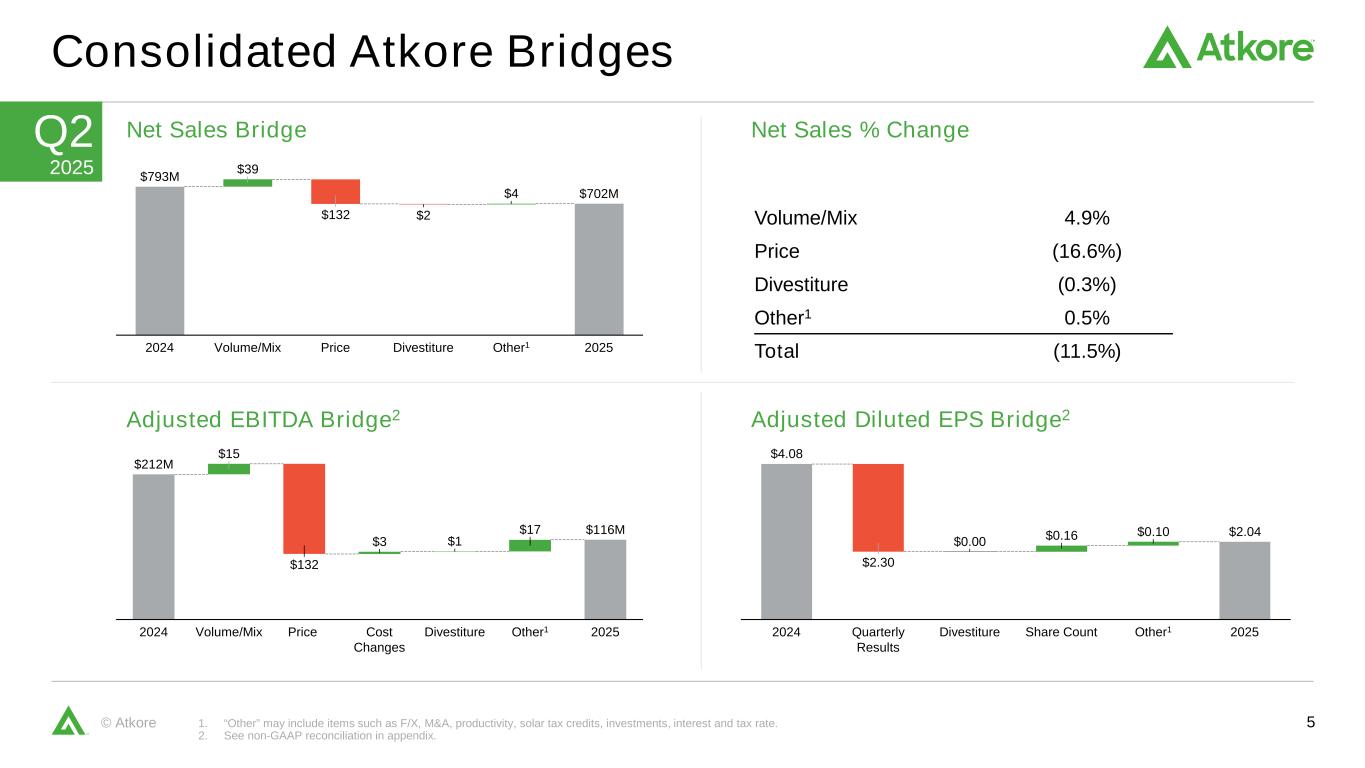
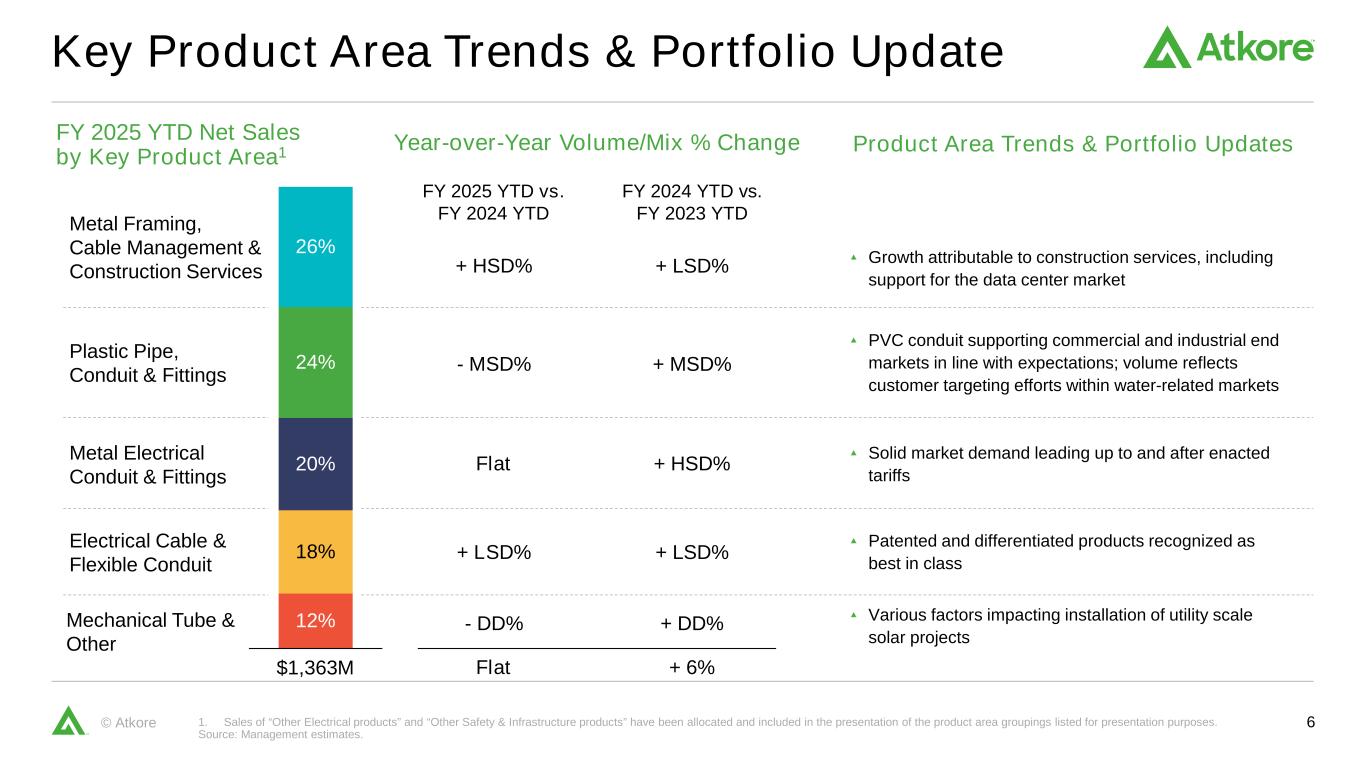
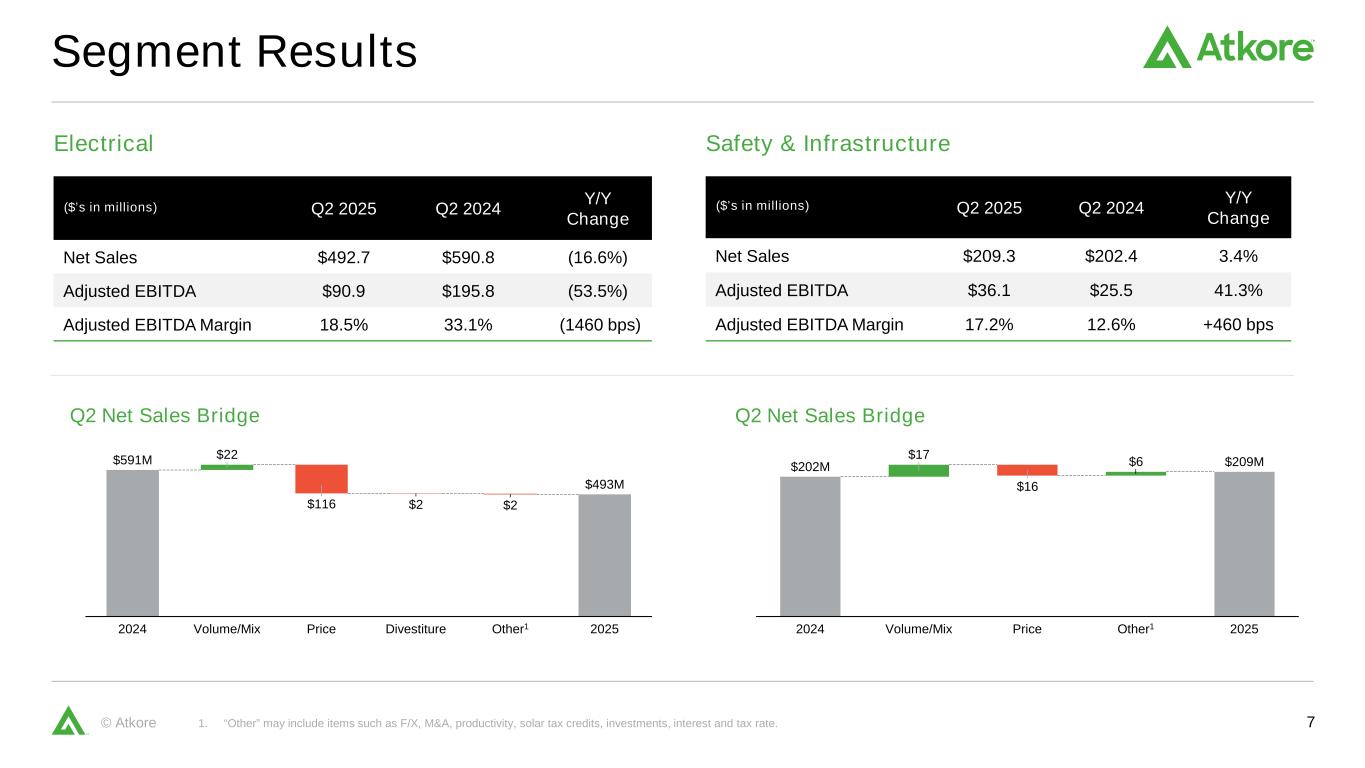
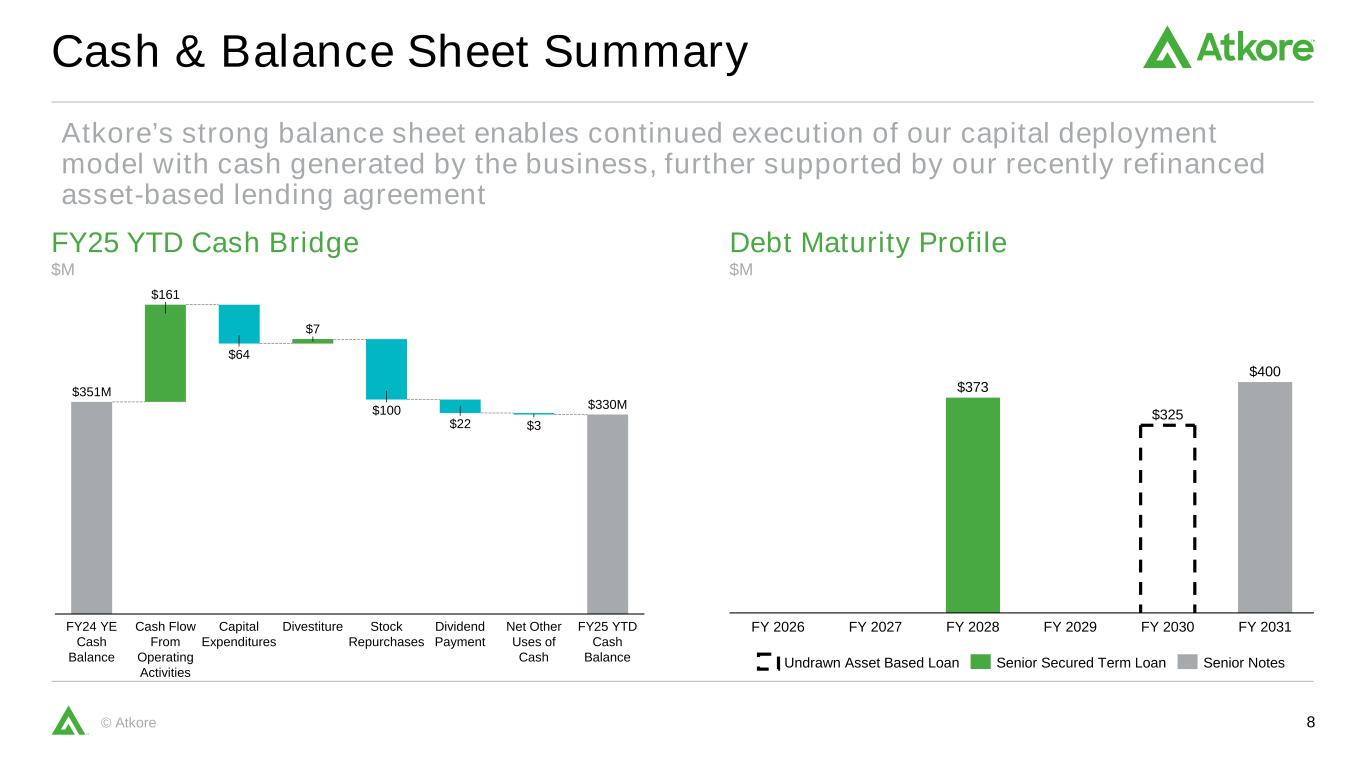
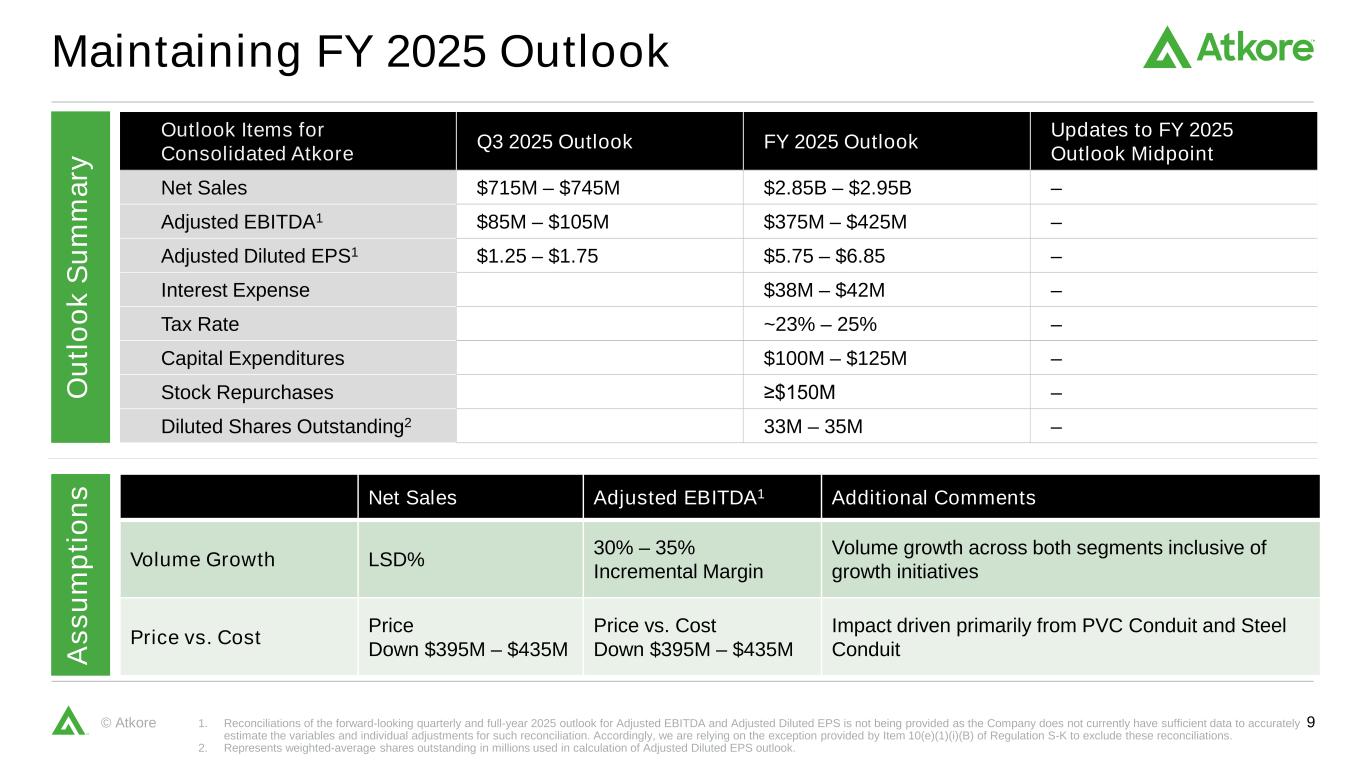
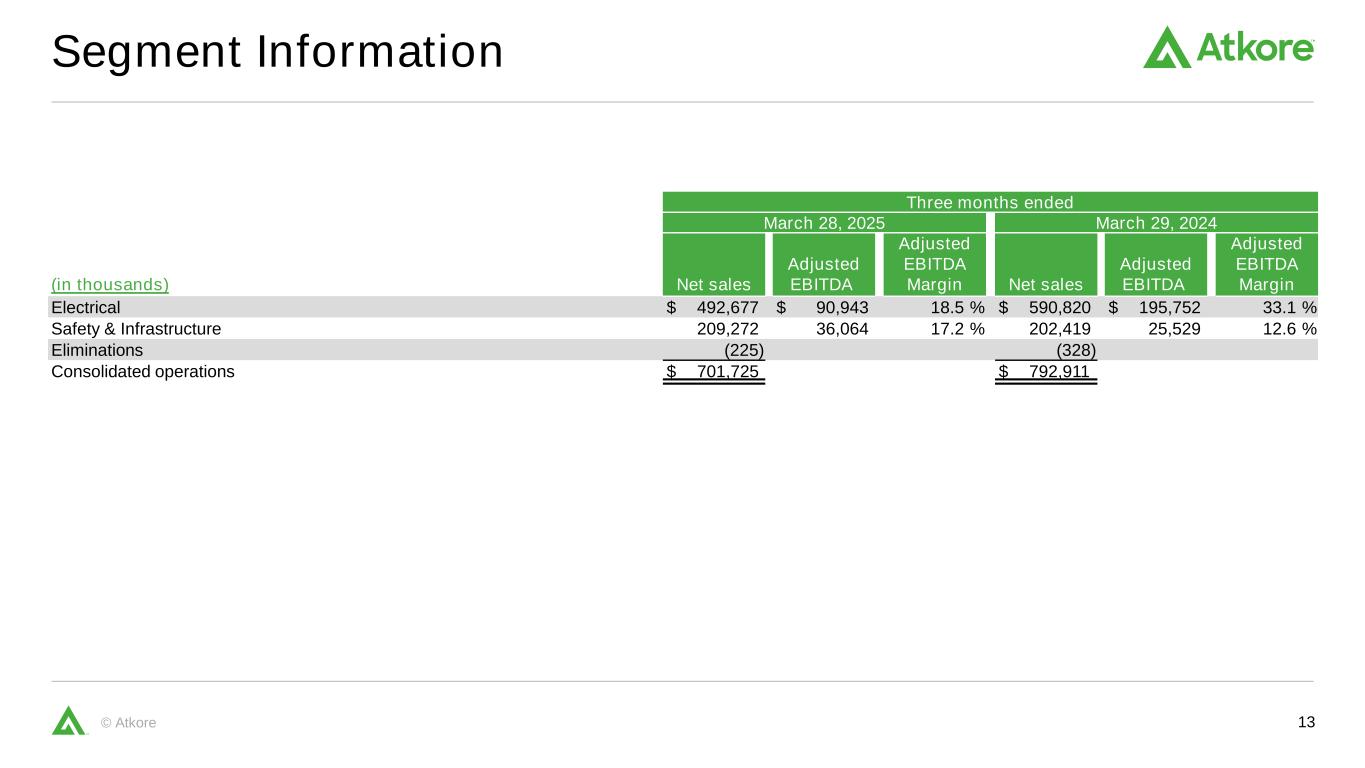
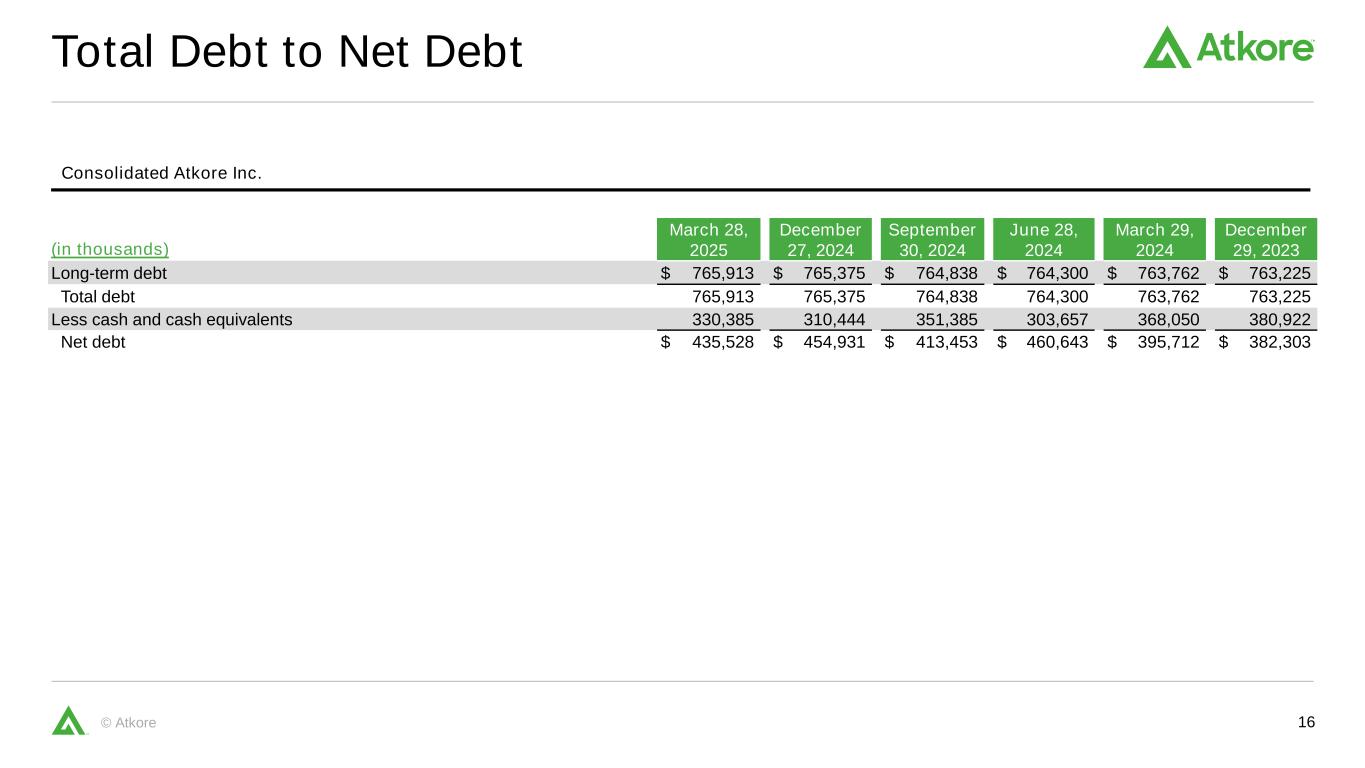
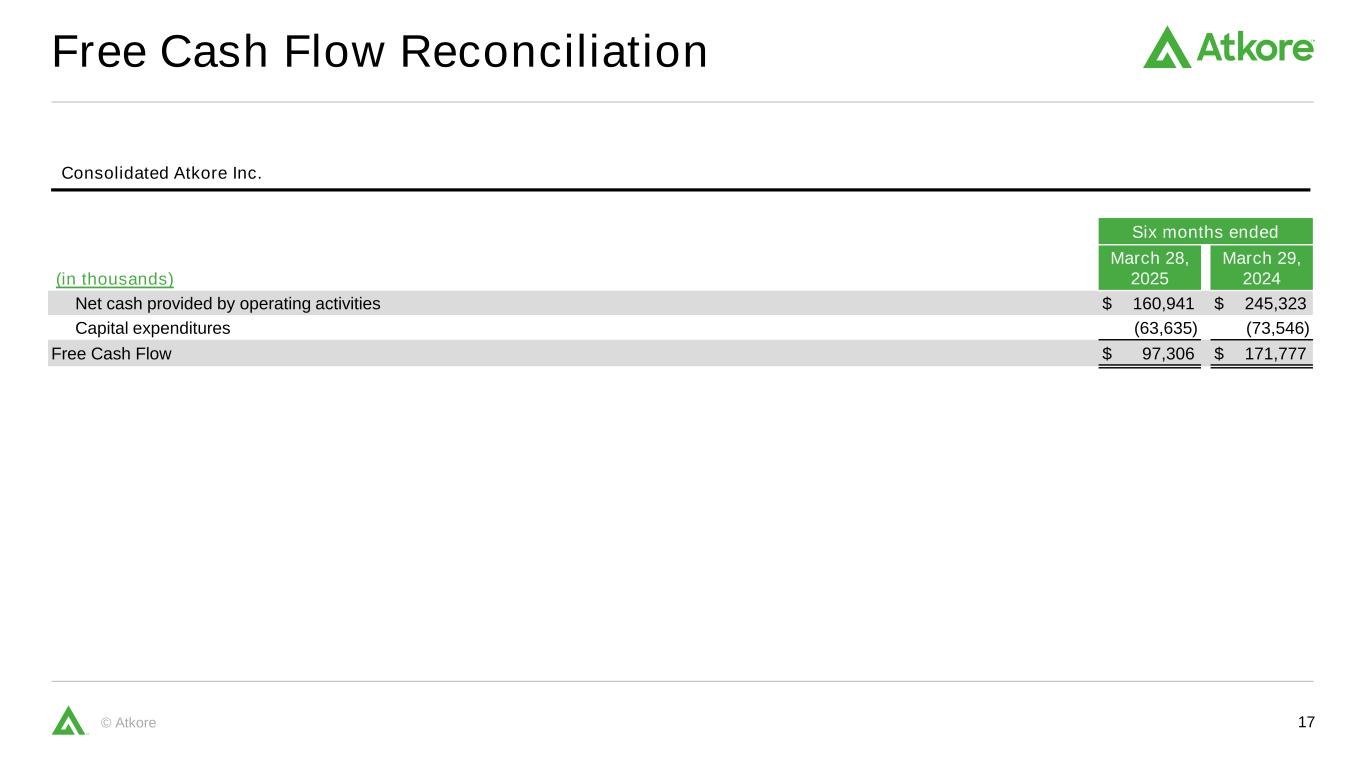
Thank you, Bill, and good morning everyone. Moving to our consolidated results on Slide 4. In the second quarter, we achieved net sales of $702 million and adjusted EBITDA of $116 million. Adjusted EBITDA margins expanded sequentially to 16.6% from 15% in the first quarter of fiscal 2025. Adjusted EPS was $2.04. Turning to Slide 5 and our consolidated bridges. Organic volumes were up 5% compared to down 1% in the second quarter of fiscal 2024. Our average selling prices declined 17% year-over-year, with the majority of the decline coming from our PVC conduit and steel conduit products. However, we were pleased by sequential pricing improvement for our steel conduit products from the first quarter. Moving to Slide 6. Year-to-date, our volume is flat compared to the prior year, having overcome a 5% decline in the first quarter. Last quarter, this slide showed volume growth in only one product area, metal framing, cable management and construction services. Our 5% year-over-year volume growth in the second quarter was supported by volume growth across three out of five product areas, a meaningful improvement over the first quarter. Year-to-date, our metal framing, cable management and construction services have grown high single-digits after being up low single-digits in the first six months of the prior year. As a reminder, this growth is driven by large construction projects and data center activity and also due to the high density of metal framing products required for these types of construction. For the first six months of fiscal 2024, our plastic pipe and conduit products were up mid-single digits in volume driven by strong performance in water-related PVC products. During the first six months of fiscal 2025, electrical PVC conduit serving the commercial and industrial end markets grew, while our water-related products declined. This contributed to the overall decline in the product category. As we build out a broader water-related portfolio, we are reviewing our customer base for both new and existing capacity in order to hopefully maximize our value offering. After our steel-related products were down high single-digits in volume in the first quarter, we are pleased that year-to-date volume for these products is now slightly positive. We believe this is due to the strength in the overall market in particular demand for U.S.-made products. Our electrical cable and flexible conduit category is also growing year-to-date up low-single-digits. Turning to Slide 7. Adjusted EBITDA margins compressed in our Electrical segment, primarily due to pricing declines related to our PVC and steel conduit products, which offset contributions from overall volume growth. Adjusted EBITDA margins improved in our S&I segment due to strong quarterly volume performance from construction services, metal framing and cable management. In addition, the segment had much improved productivity, contributing approximately $11 million to segment EBITDA. Our productivity gains were primarily due to better cost management in our manufacturing and project-based work. While we are pleased with the operational and financial performance for S&I this quarter, we do believe a certain portion of the benefits and margin gains were isolated to Q2 and anticipate margins to be closer to low-double digits for the remainder of the year. Turning to Slide 8. We remain committed to executing a balanced capital deployment model with an emphasis on returning cash to shareholders. Our capital investments are largely to support previously announced growth initiatives. Our balance sheet remains in a strong position with no maturity repayments required until 2028. Subsequent to our quarter end, we refinanced our asset-based lending agreement, maintaining our borrowing capacity for $325 million. This amended agreement expires in 2030. While we have historically not borrowed against this facility, it remains an important component of our overall financial profile. Next, on Slide 9. We expect our Q3 net sales in the range of $715 million and $745 million. Our adjusted EBITDA is expected to be in the range of $85 million to $105 million. Our adjusted EPS is expected to be in the range of $1.25 and $1.75. As we have previously discussed, we are accustomed to anticipating some amount of seasonality and generally build in an expectation that the back half of the year will be stronger than the first half. While our second quarter results were better than our initial expectations, there are multiple factors we considered as we play in forward. Our first half of the year was supported by a strong contribution from our construction services business. We expect that the second half of the year will not provide the same contribution due to the number of projects we have in backlog. While there are numerous opportunities we are pursuing for new projects, we expect growth for the Construction Services business to moderate in the second half of the year. That being said, we are excited about the additional capability and capacity we have for metal framing and cable management products that we believe should help continue to drive growth for this product area for FY '25 and beyond. Despite year-to-date increases in both construction starts and planning activities, recent forward-looking construction sentiment suggests the possibility for slower activity moving forward. The topic of tariffs has received much attention in the past several weeks. Forecasting the impact related to tariffs is challenging. We believe the impact of tariffs for Atkore primarily centers on our ability to reclaim and recapture lost market share and gross margin for certain product categories over time. Since tariffs were first announced, both the time horizon and the applicable percentages have changed multiple times. Framing a forward-looking perspective for six months or even three months comes with the risk of inaccuracy. Due to these factors, we believe our volume expectations for the full year will be closer to low-single digit percentages. Nonetheless, as Bill shared, we are maintaining our full-year 2025 outlook and expect full-year adjusted EBITDA in the range of $375 million to $425 million and adjusted EPS in the range of $5.75 and $6.85. With that, I'll turn it over to John Pregenzer.
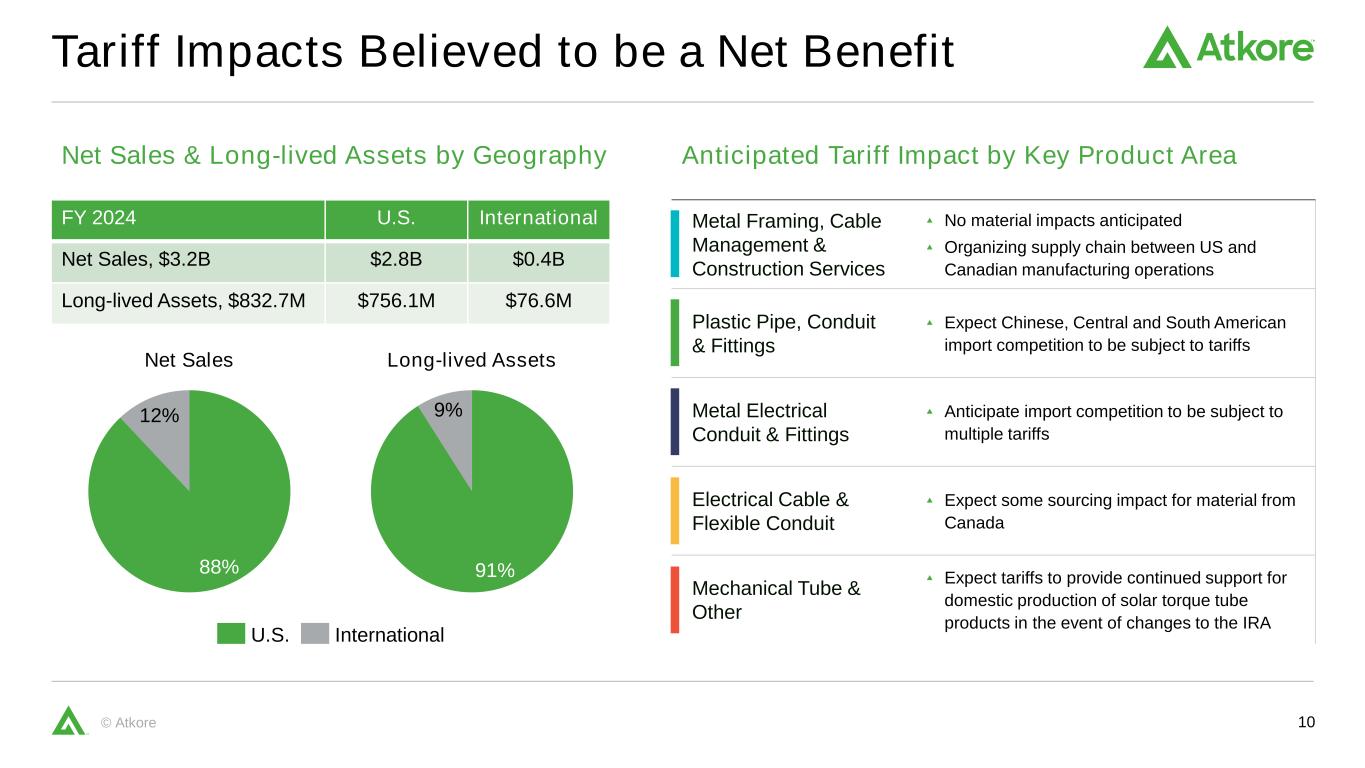
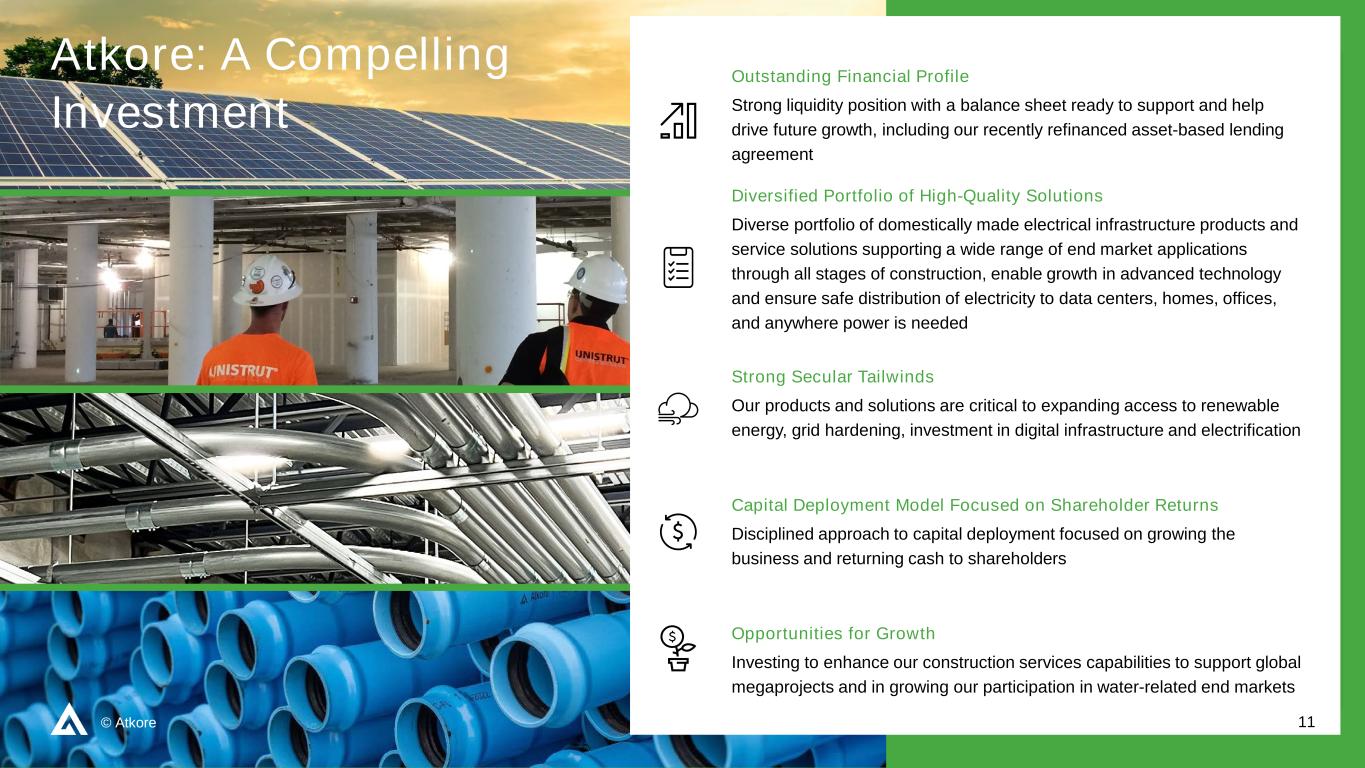
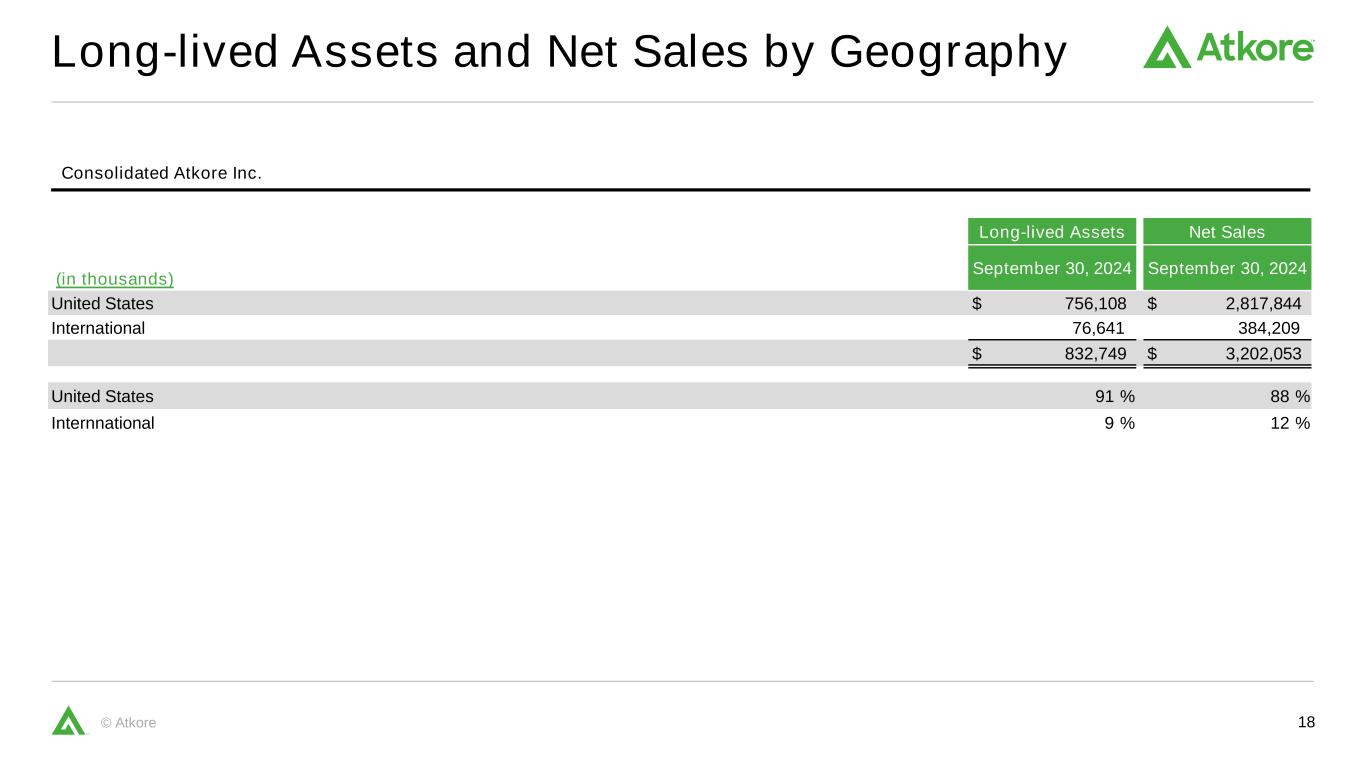
Thanks, John. Moving to Slide 10. Although certain product categories source materials from countries impacted by recently announced or potential tariffs, we believe Atkore should be in a net benefit position. While the magnitude and precise details of various tariffs may continue to evolve over the upcoming quarters, this slide illustrates Atkore's geographic manufacturing footprint with its long-lived assets relative to its revenue generation. Additionally, we've outlined the relevant impact tariffs may create for each of our key product areas. Finally, turning to Slide 11. As we've said before, the electrical industry is a great place to be. Our financial profile remains strong and our diverse portfolio of domestically manufactured electrical infrastructure products provides solutions for nearly all types of construction end markets. Our domestic manufacturing footprint paired with our predominantly domestic customer base positions us well to serve our customers in the markets they operate. As demand for electricity intensifies and the design of environments change, Atkore is prepared with high-quality solutions to enable growth and ensure a safe distribution of electricity to data centers, manufacturing locations, hospitals, and homes. Our products and solutions are situated well with secular tailwinds for increased electrification. We remain focused on a balanced and disciplined approach to capital deployment by returning cash to shareholders through a combination of share repurchases and quarterly cash dividends and investing to grow the business. Through it all, we are guided by our strategy, our process, and our people, the three fundamentals of the Atkore Business System. With that, we thank you again for joining our call this morning. Now we'll turn it to the operator to open the line for questions.
Operator
Your first question comes from Chris Moore at CJS Securities. Please go ahead.
Speaker 5
Hey, good morning guys. Thanks for taking a couple of questions.
Speaker 5
Could you provide an update on PVC conduits and your expectations for the remainder of the year? After the first quarter, there was talk about potential pandemic pricing possibly returning by the end of fiscal '25. Is that still how you're approaching it?
Yes, Chris, I think at this stage, again, as I think John Deitzer said, it's hard to predict out three and six months, even one month. But what we guided in the last quarter still seems to be our best guess from what we've seen, pricing has continued to go down some, at least for us, but it's kind of on track back to our earnings and everything we said with what we expect. So as much as we can forecast the future for ourselves. That's what we are estimating at this stage.
Speaker 5
Got it. And what would be from a market share standpoint on PVC conduit? Would you have a best guess in terms of where Atkore is at this point in time?
I don't know if share; I look to the team for a precise number. I still think we're absolutely a leader out there. And imports, which I'm sure will be a question, seem to be continuing to grow. But it's also hard to almost preempt future questions. As the Wall Street Journal talked about the whole economy and saying it's hard to go what's the tariff impact. It's just noise in different product lines, like, hey, it was up solid imports were up solid double-digits in the last, let's say, three months, but were people trying to get products in ahead of the tariffs and stuff like that. So we're absolutely still a leader, no question about that. And give or take, probably around keeping our same market share. But one of the things I'd also qualify with PVC is unlike other products, it's pure estimates. There's no we can do is look at, for example, how much resins being sold into different markets and try to extrapolate from there what is municipal pipe, plumbing pipe, PVC pipe and so forth. So it's much harder to give precise estimates.
Speaker 5
Got it. I appreciate that. And maybe I'll just say with PVC kind of this my last question. Longer term, I'm talking three to five years. I'm just trying to understand your view of PVC conduits in terms of your overall offering. There's more competition, there's more imports just from a big picture, how important is it to the kind of overall business in the longer term?
I still believe it's a crucial aspect of our business, Chris. It's worth noting that regarding imports, we have previously mentioned the emergence of one company, and we believe there are likely others in the industry, possibly in municipal pipes and similar areas that have expanded into conduits. Both are strong product lines for us and they align perfectly with Atkore's approach of one order, one delivery, one invoice, which we've described over the years as a competitive advantage. Therefore, we are committed to continuing our investment. We've discussed productivity extensively, particularly on the S&I side of the business, but we are also enhancing productivity here to remain competitive and ensure it remains a valuable product in our portfolio.
Speaker 5
Perfect, I will leave it there. Thanks.
Operator
Your next question comes from the line of David Tarantino from KeyBanc. Your line is now open.
Speaker 6
Hey, good morning everyone.
Speaker 6
So maybe starting out. Could you give us some color what you're seeing more recently in terms of the import levels in both PVC and steel, particularly around the improved metal pricing you guys noted? And then maybe on that, could you quantify what the potential upside on pricing could be should these tariffs be more sticky and imports return to more normal levels?
Yes. I'll begin, David. While it's challenging to make precise projections for the future, as I mentioned with Chris, PVC imports increased significantly year-over-year in the last quarter. It's difficult to predict whether this trend will continue or if it's simply a result of customers rushing to import before tariffs were imposed or due to suppliers reaching capacity. I don’t have detailed insights into my competitors, either domestically or internationally, to know their strategies. However, I believe that due to the current variability in administration and tariffs, imports from China are likely to decrease, especially since the tariffs on PVC products exceed 100%. This makes imports less economical for Latin American countries, where the tariff on major importers is currently 10%. It’s important to note that many of the inefficiencies we’ve discussed come from freight costs. Therefore, a simple percentage increase on the entire delivered cost wouldn’t be accurate. Even if we suggest a potential rise of 5% or 7%, it still presents a challenge. Overall, as we've noted in our prepared remarks, tariffs tend to benefit Atkore moving forward. Regarding steel conduit, there was a decrease year-over-year this quarter. Just as with PVC, I don’t want to draw overly strong conclusions about steel trends. However, it’s worth mentioning that with the removal of exemptions related to section 232, the tariff on steel conduit is now 25%. While it is still possible to bring products across economically, this poses a significant headwind. How companies respond to this will vary, but it generally benefits us. Thus, while we don’t specify an exact dollar figure, our guidance reflects that we anticipate tariffs will have a positive impact on EBITDA profits, offsetting potential volume declines. John Deitzer highlighted that predicting economic trends is tricky, especially with possible project delays. There's been mention that contractors may experience up to 20% of jobs delayed or postponed. We're balancing the positive effects of tariffs with the potential for reduced volume. As John mentioned, we still project low single-digit growth. If we hit zero in the first half of the year with a solid Q2, assuming a 3% growth rate shouldn’t be viewed as a fixed number for the entire year. Implicitly, that indicates a potential 6% growth, and we expect mid- to high-single-digit growth in the second half of the year. We remain optimistic, but it’s a balance of tariffs and volume.
Speaker 6
Okay. That's helpful. And is there a way to frame that the steel pricing assumption relative to what normal pricing is or at least pre-pandemic pricing is?
I can't say for certain if we can predict the future, but similar to other PVC trends, we've seen fluctuations. Last year during this quarter, our steel conduit was experiencing modest growth. Year-over-year, our prices were increasing, but then the market shifted unexpectedly. It's challenging to forecast these trends. Currently, as we mentioned, there has been an increase in steel conduit pricing from Q1 to Q2, and the outlook seems positive, yet it's still lower compared to last year. In the past, there have certainly been years with higher and lower prices than what we have now. So, John Deitzer?
It's a good question, David. I would say the one dynamic here is the underlying volatility that you do see with whether it's hot-rolled steel, cold rolled steel, et cetera, you do see significant volatility with that over time. And that probably has a little bit different of a dynamic versus, hey to how does this compare to a certain pinpoint in time kind of dynamic. I think where we're at today is we are seeing sequential improvement essentially month-to-month as we look forward. And so there's probably some puts and takes to across the entirety of the portfolio. As Bill mentioned, we're probably a little softer on the volume expectation for the second half, but that still is a pretty positive one to Bill's math. If we're at flat here in the first half of the year, and we're still seeing that low single-digit type environment, that's pretty positive here from a volume perspective in the back half.
Speaker 6
Okay. Great. And maybe if I could sneak one more in, just to follow up on the volume assumption. Could you just walk us through the approach you guys took to updating the volume assumption just given the rapid change in the macro backdrop? And maybe give us some color on what you're seeing on the ground in terms of end demand that supports it?
Yes. I'll begin, David. It may not seem very scientific, but it's influenced by a few factors. First, our forecasts come from our General Managers and sales teams on specific projects. Aside from a few areas such as global megaprojects and some solar business, we typically ship within four days, meaning our backlog is minimal. Unlike other companies, we can't project our backlog for the coming year. However, these forecasts have been submitted internally and appear to align well. We regularly gather customer feedback directly from my executive team and large customers, who express cautious optimism. We've indicated that the second half of the year should show higher single-digit growth, which aligns with what most product lines suggest. Our sales team has reached out to many customers, and their estimates reflect the same outlook. On the flip side, we also need to consider some contrasting indicators. For instance, the Dodge Momentum Index has declined, and the Architectural Billing Index has been negative for nearly two years. The Association of Building Contractors is expecting project delays, which is concerning. However, as highlighted in our prepared remarks and the chart on Page 6, areas like metal framing and cable management are performing well. Many analysts are focusing on data centers, which, while challenging right now, is still a sector where our products are showing strong performance. Overall, we see a mix of positive and challenging trends in the market.
Speaker 6
Okay, great. Thanks guys.
Thank you, David. Appreciate the questions, sir.
Operator
Our next question comes from the line of Deane Dray from RBC Capital Markets. Your line is open.
Speaker 7
Thank you. Good morning everyone.
Hey, good morning, Deane.
Speaker 7
Look, I appreciate all the commentary about limited visibility. That's just the nature of your short-cycle business. So I know you have to couch it with that condition. But can you size for us maybe directionally, but any position is helpful of what the net tariff benefit is you're assuming now in your updated fiscal '25 guide?
Deane, I would just try to do it this way is for the CEO, Matt and John can add to its CEO, Matt, by the way is John Deitzer, making front of me for high-level generalizations is if you took 2% or 3% off of volume and looked at our fall through, you could do hear how much that is down and then assume it's picked up with the increase in tariffs for the second half. So whatever your estimate that should get you close. Hopefully, that's as precise as you get it.
Speaker 7
Yes. I fully understand the limitations here. Can we return to the topic of steel conduit, specifically regarding Mexican imports, as that was a significant issue last year? Could you provide a real-time update on whether the product flow has increased? Also, was there any indication of pre-buying that led to larger volumes, and how long will it take for that to be processed in the system? John?
Yes, we haven't seen a significant change in the marketplace as it relates to those imports. There was, as Bill mentioned earlier, reduced imports that came in, but it's not that it has completely stopped the inflow of product. Obviously, they have a 25% headwind to deal with going forward, but we'll have to continue to track it and see what comes through in the import numbers.
Deane, I don't expect the Mexican imports subject to a 25% tariff to cease. Most reasonable individuals would conclude that they need to be either more selective or increase their prices. The extent to which they absorb costs versus passing them on is something we can only start to estimate. Regarding your initial question, this situation is a net benefit for Atkore shareholders.
Speaker 7
Understood. And just a last one for me. Related to the impairment of HD PVC, what changed competitively? You made a reference about competing products for that market. Can you expand on that and size the impact?
I'm glad you asked, Deane. What we were referring to in my comments was competing technology for fiber optics, specifically something covered in an article by the Wall Street Journal. The administration is looking to increase funding for satellites, which is the competing technology. Estimates vary, but that Wall Street Journal article indicated it could impact fiber optics by 20% to 50%. Other CEOs in this sector have suggested that the impact may not be as significant. Alongside my other comments about pending funding matters, one of the key drivers has been the administration's actions. In previous quarters, we've discussed the potential for satellites, and now there is a distinction between speculation and the administration's intent to implement funding. Consequently, we decided to take a prudent approach and work with our accounting partners to analyze different models, concluding that it was fiscally responsible to take the impairment now. We are still investing, but that's the reasoning behind our decision.
Speaker 7
And just to be clear, the risk of our opportunity for using satellites, was that factored into the impairment?
Yes, I don’t want to say it was the only factor, because it certainly wasn’t. As an engineer, I typically prefer to wait for averages, but that was a key aspect of the team's analysis.
Speaker 7
That's very helpful. Thank you.
Operator
Our next question comes from the line of Chris Dankert from Loop Capital. Your line is now open.
Speaker 8
Hey good morning guys. Thanks for taking the question.
Speaker 8
Just had a quick follow-up on that last point, actually. I mean, I guess, are you getting any direction from the administration on whether it's tariffs or specifically in this case on the BEI program, I guess, it seems early to be taking an impairment when at least I haven't seen an explicit change to the program, the real wants to preemptively impairing the assets. I guess are you getting any actual concrete word from the administration on how they're rolling this out?
No, at least I'm not aware of any specific coverage regarding directors. I know the Commerce Secretary addressed this, though I could be mistaken about the details. A significant portion has been shorted, and there was a press release published alongside a Wall Street Journal article. Looking back, it raises questions about the timing of the app and the assumptions being made. It's a tricky situation. If we consider that we might see changes in nine months, it begs the question of why now and not earlier. This point is critical in terms of the administration indicating whether they have or intend to make changes. We chose to act prudently and collaborate with our accounting partners on various models, determining that it was financially responsible to recognize the impairment at this time. Thanks, Chris. We are still investing, and that's the reasoning behind our decision.
Speaker 8
That makes sense. And I think taking the more conservative approach given the current environment does make sense. I just wanted to make sure that there wasn't something that we were missing on a more concrete basis.
No, it's quite similar to the last quarter with some internal frustration. Many states have approved it, but when I read other earnings announcements, whether it's companies working on fiber optic lines or those producing HDPE, there's still a general perception that progress is a year out. This has been the case for three or four years, which is frustrating. So, it seemed appropriate to weigh internal discussions alongside feedback from third parties and, as you pointed out, take the charge.
Speaker 8
Makes sense. And I guess, I believe we talked about in the past around the IRA, but just reconfirming, if we do get any withdrawal of support there for the torque tube business, again, I just want to reconfirm that business is still profitable without the IRA and some of the additional support there as well, correct?
Yes, that's our estimate, Chris. To give you some context, if we look back a few years, we initiated the solar torque tube business before the IRA was in place. The IRA has significantly boosted demand, particularly from China to the U.S. However, with the current tariffs on steel, we have a kind of protection against competitively priced imported steel. What I can't quantify is how much the solar credit, which is largely passed on to our customers, incentivizes them to expedite their projects due to a lower return on invested capital. That's a level of detail we don’t know. On the other hand, the solar market currently faces challenges like grid connectivity. I still gather feedback from customers on this, and I'm sure others in the electrical field are aware of the transformer backlog, which continues to be a slight hindrance. Therefore, while it’s difficult to predict with precision what's going to happen in two years, I don't believe these issues will be the primary driving factors.
Yes, I agree, Chris. I think there's a lot we can't predict. However, the bar operation we have invested in has shown significant improvements, and we've highlighted some productivity gains. That said, we don't provide specific details about profitability by subsegment. This part of the business has faced challenges, which we've discussed previously. Looking ahead, as we continue to enhance that operation, I believe the team is doing a great job. Nonetheless, in the short term, there have been commercial dynamics, particularly as the volumes in the mechanical tube segment have decreased year-to-date, which has been a setback for us. If the market begins to recover, I think we'll be able to get back on track.
Speaker 8
Understood. Thanks a lot of the color guys.
Operator
This concludes the question-and-answer session. I would now like to turn the call back over to Bill Waltz for closing remarks.
Thank you. Let me take a moment to summarize my three takeaways from today's discussion. First, Atkore had a strong second quarter of financial performance and was active in taking steps to further strengthen our company for the future. Second, we are maintaining our full-year 2025 outlook, while continuing to monitor the overall market dynamics and competitive landscape. Finally, we remain committed to our capital deployment strategy to create shareholder value over the long term. With that, thank you for your support and interest in our company. This concludes the call for today.
Operator
This concludes today's conference call. You may now disconnect.