Operator
Good morning. My name is Carly, and I will be your conference operator today. At this time, I would like to welcome everyone to ADCOR's first quarter fiscal year 2026 earnings conference call. All lines have been placed in a listen-only mode. After the speaker's remarks, there will be a question and answer session. If you would like to ask a question during this time, simply press star, followed by the number one on your telephone keypad. If you would like to withdraw your question, press star 1 again. As a reminder, this conference is being recorded. Thank you. I would now like to turn the conference over to your host, Matt Klein, Vice President of Treasury and Investor Relations. You may begin.
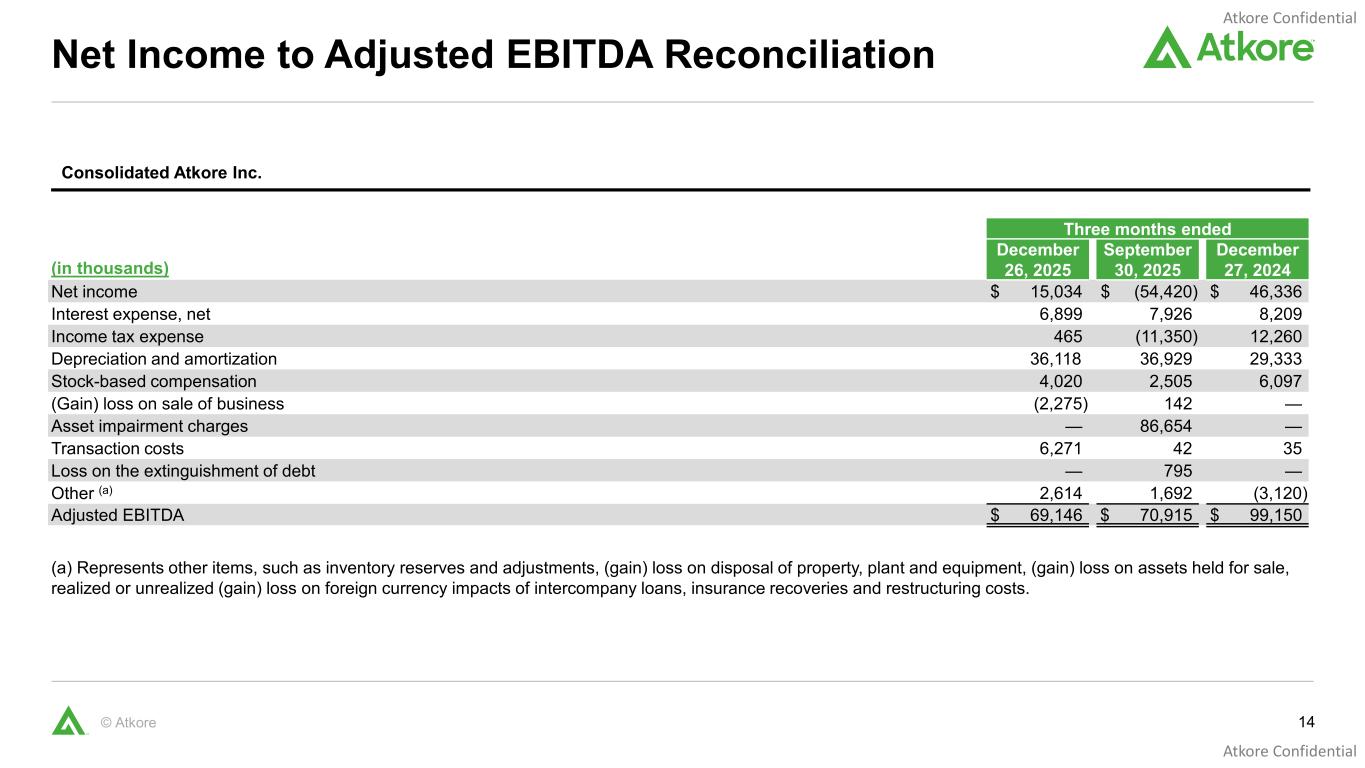
Thank you and good morning, everyone. I'm joined today by Bill Walsh, President and CEO, John Deitzer, Chief Financial Officer, and John Pergenzer, Chief Operating Officer and President of Electrical. We will take questions at the conclusion of the call. I would like to remind everyone that during this call, we may make projections or forward-looking statements regarding future events or financial performance of the company. Such statements involve risks and uncertainties, such that actual results may differ materially. Please refer to our SEC filings in today's press release, which identify important factors that could cause actual results to differ materially from those contained in our projections or forward-looking statements. In addition, any reference in our discussion today to EBITDA means adjusted EBITDA, and any reference to EPS or adjusted EPS means adjusted diluted earnings per share. Adjusted EBITDA and adjusted diluted earnings per share are non-GAAP measures. Reconciliation of non-GAAP measures and a presentation of the most comparable GAAP measures are available in the appendix to today's presentation. With that, I'll turn it over to Bill.
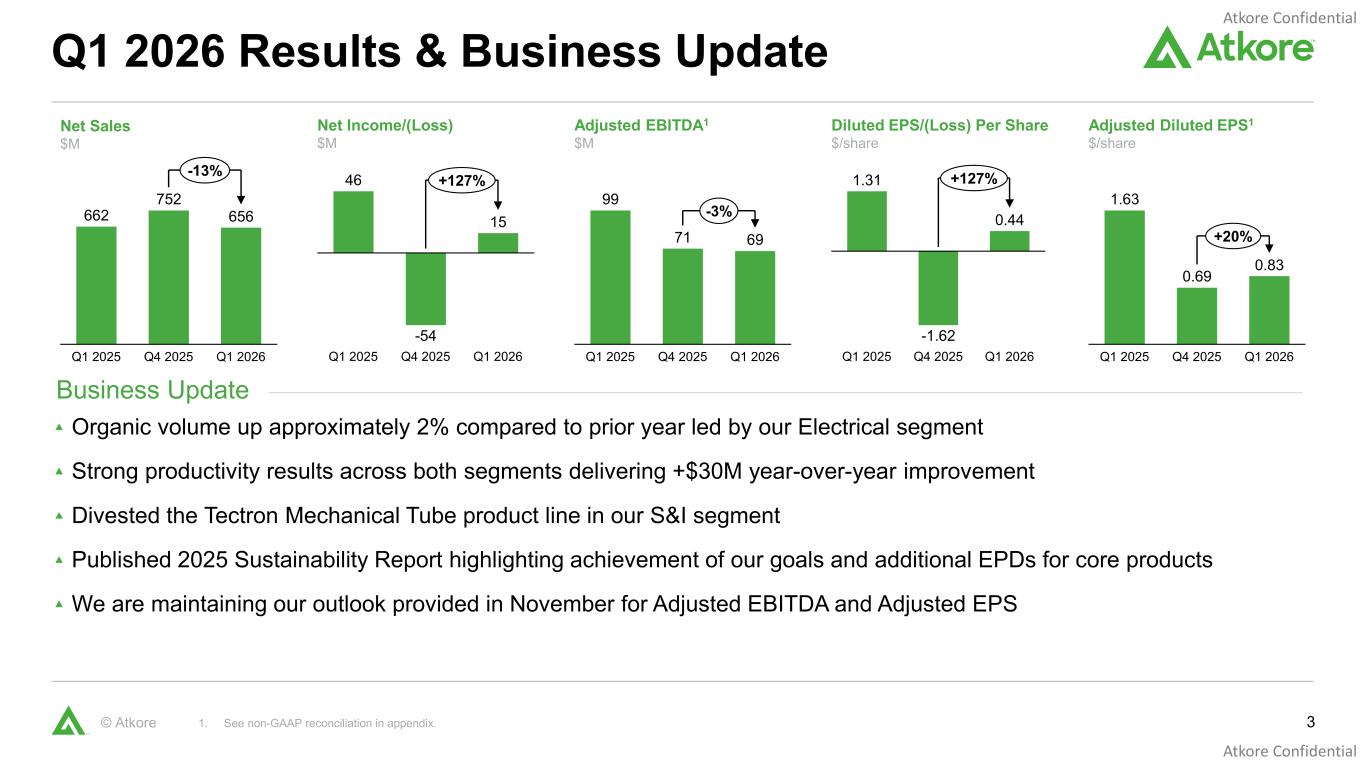
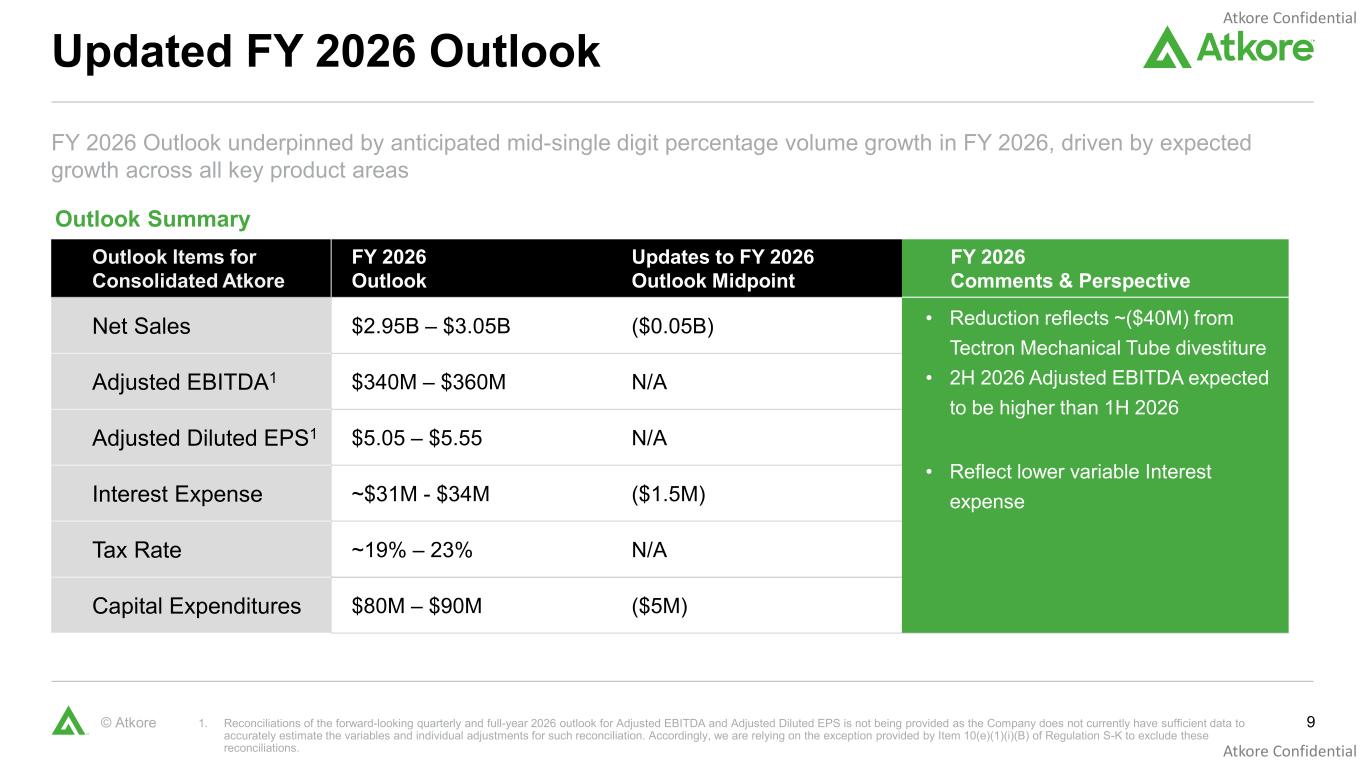
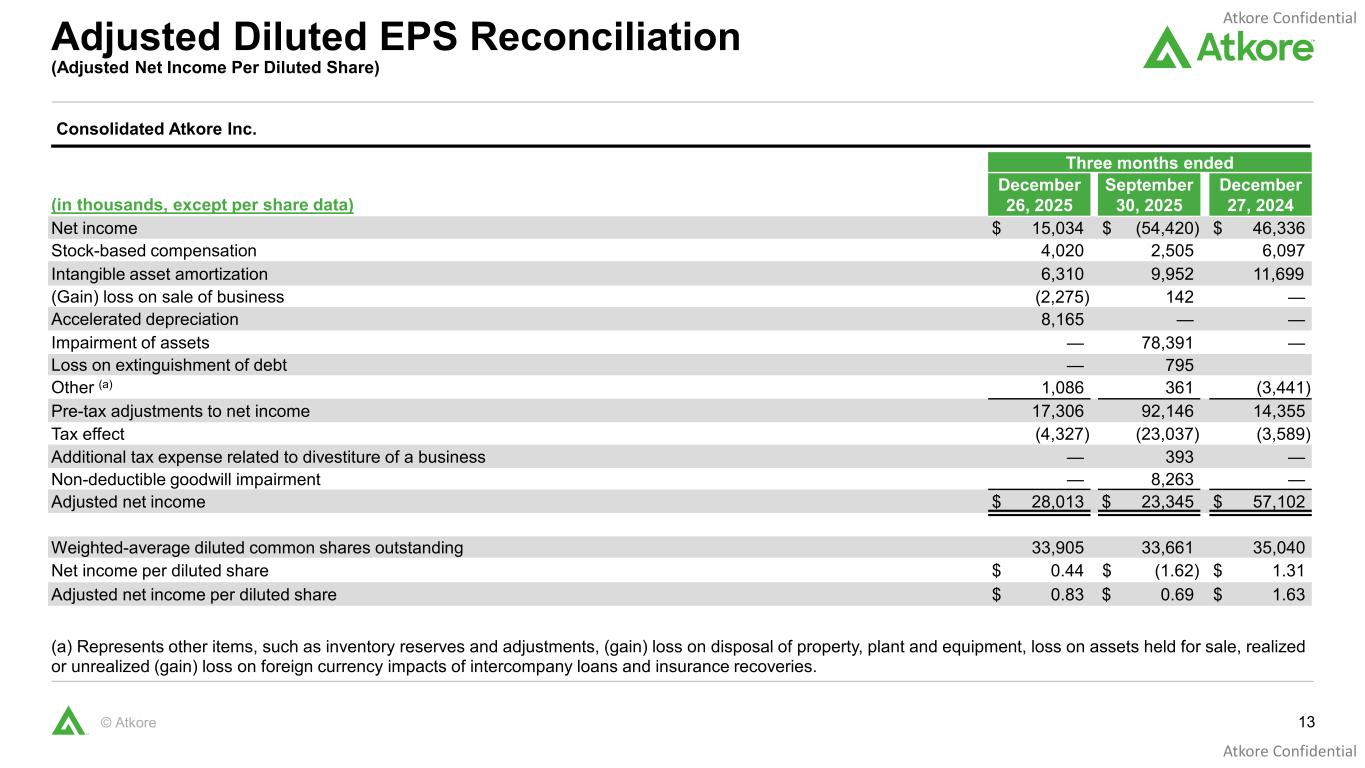
Thanks, Matt, and good morning, everyone. Starting on slide three, we are pleased with our first quarter performance. We achieved net sales of $656 million and adjusted EBITDA of $69 million. dollars both were above our outlook range our 83 cents of adjusted eps was also above the top end of our outlook range organic volume increased two percent in the first quarter driven by strong performance in our electrical segment our teams have been focused on improving manufacturing efficiency and controlling costs which has helped generate over 30 million dollars of productivity savings year over year. We also continue to advance our strategic alternative process to evaluate opportunities to strengthen our business and maximize value for our shareholders. During the quarter we completed the divestiture of our Tektron Mechanical 2 product line and manufacturing facility. The sale further enhances our focus on the electrical infrastructure portfolio and is aligned with our broader 80-20 initiative aimed at directing our manufacturing capacity to the electrical end markets. And in the second fiscal quarter, we expect to complete the previously announced exit of three manufacturing facilities. We will continue to provide updates on our ongoing strategic alternative process as appropriate as we move forward. I also seek to highlight the release of our fiscal year 2025 sustainability report which we recently published. This report details our ongoing initiatives and accomplishments of our 2025 goals. Looking ahead to the remainder of 2026, we are on track to deliver our FY26 outlook that we presented in November. We expect our net sales to be in a range of 2.95 and 3.05 billion dollars. Our net sales outlook adjusts for approximately 40 million dollars of annual sales related to our TECCON mechanical 2 product line resulting from the signature. Adjusting the data between $340 and $360 million made unchanged. Adjusted EPS is expected to be in the range of $5.05 and $5.55. We remain focused on our core electrical infrastructure portfolio which is supported by broader megatrends and where we see the most opportunity to grow. Our team is focused on continuous improvement initiatives in our plants and providing unmatched service and quality for our customers. By doing so, we are confident in our ability to drive sales volume and profitability. I'd like to take a moment to thank all of our employees for everything they do to support our key stakeholders. With that, I'll now turn the call over to John Deicher to talk through the results from the quarter and provide more details on our outlook.
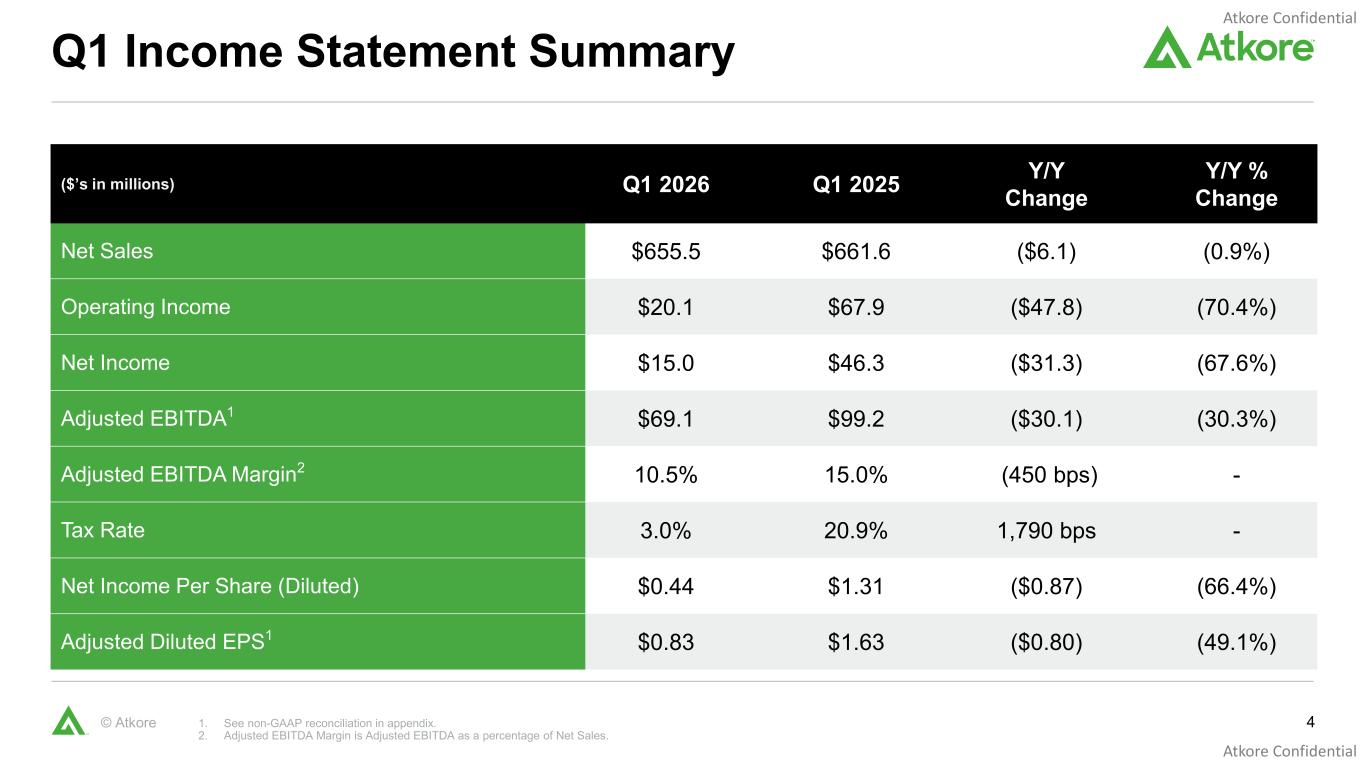
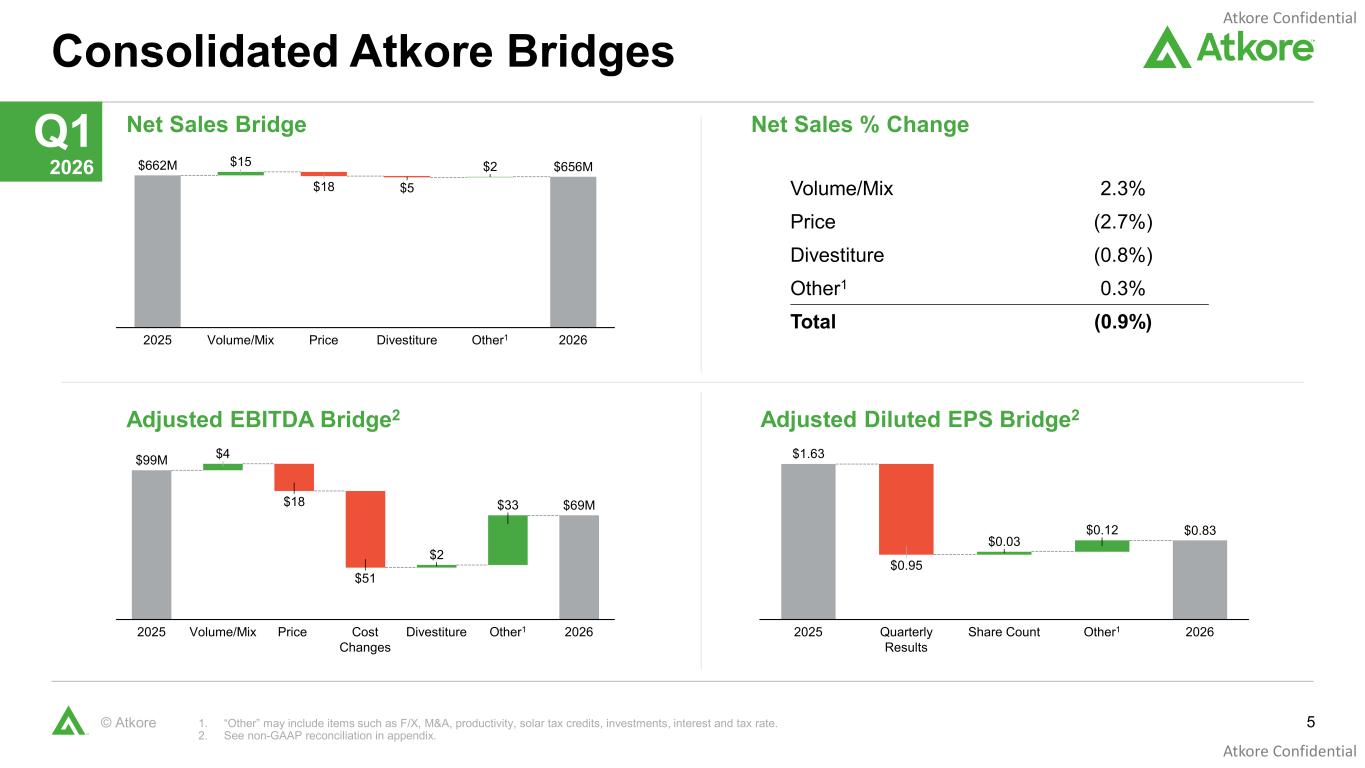
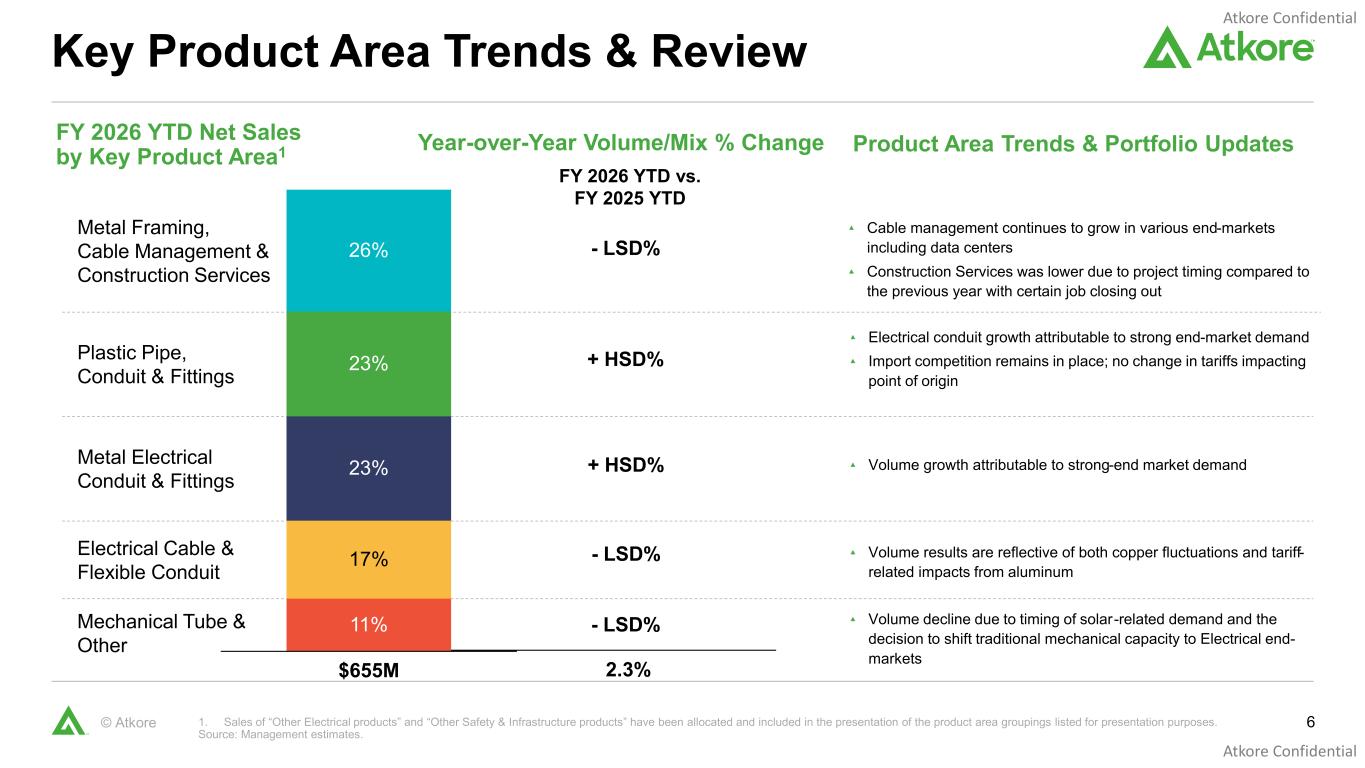
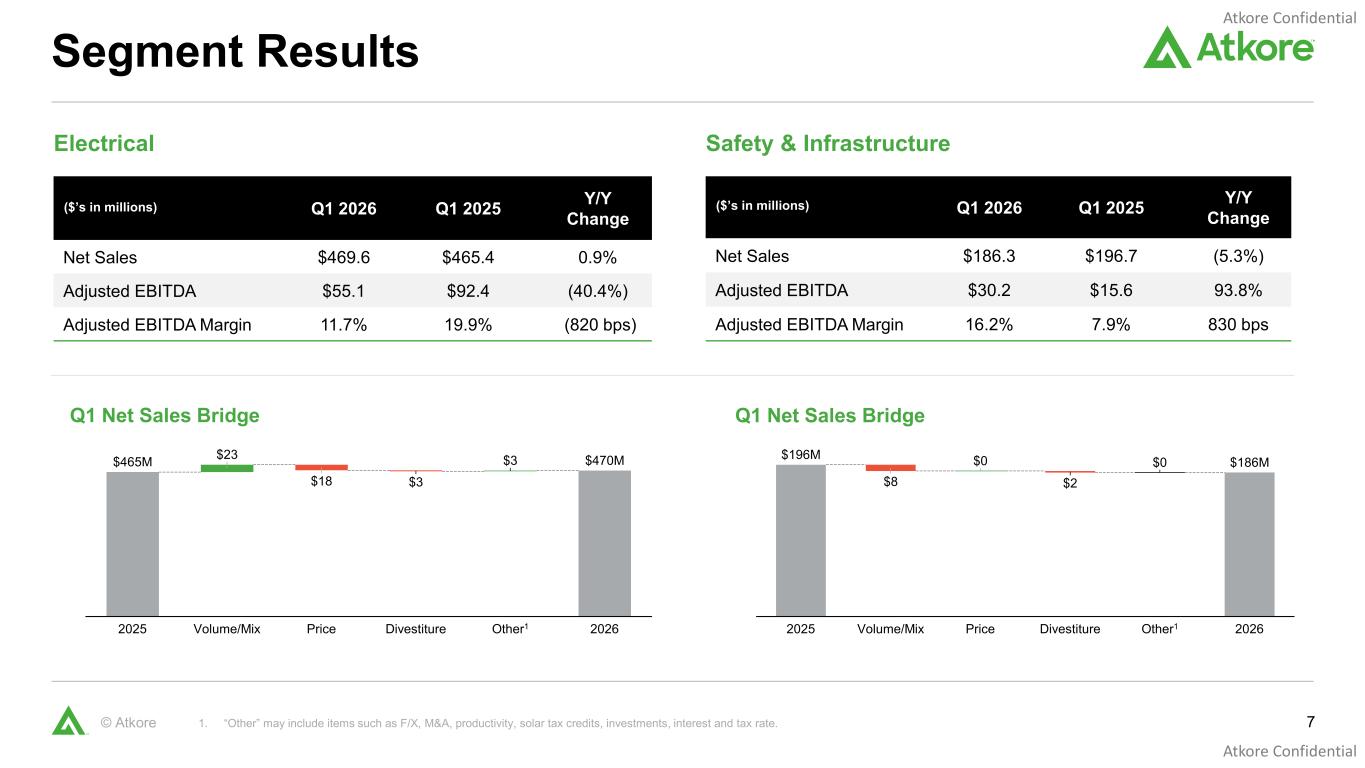
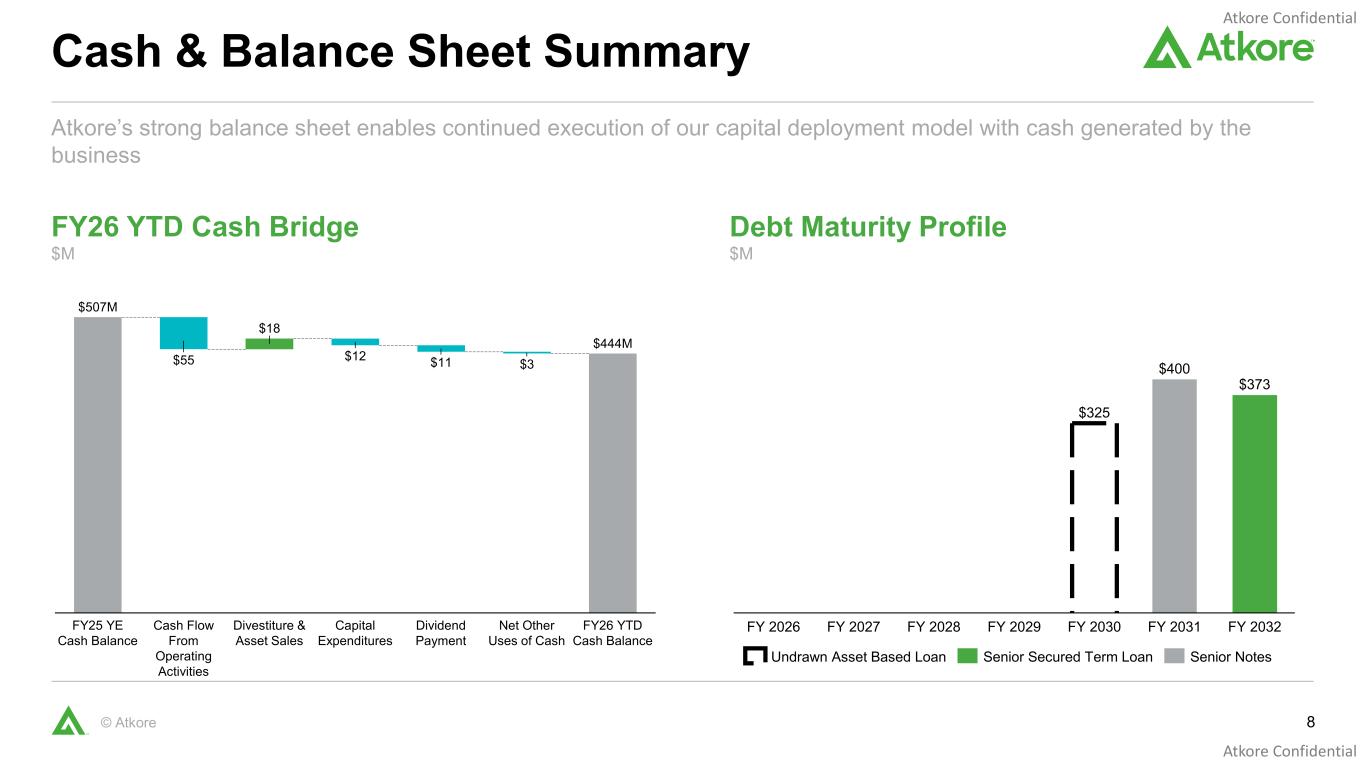
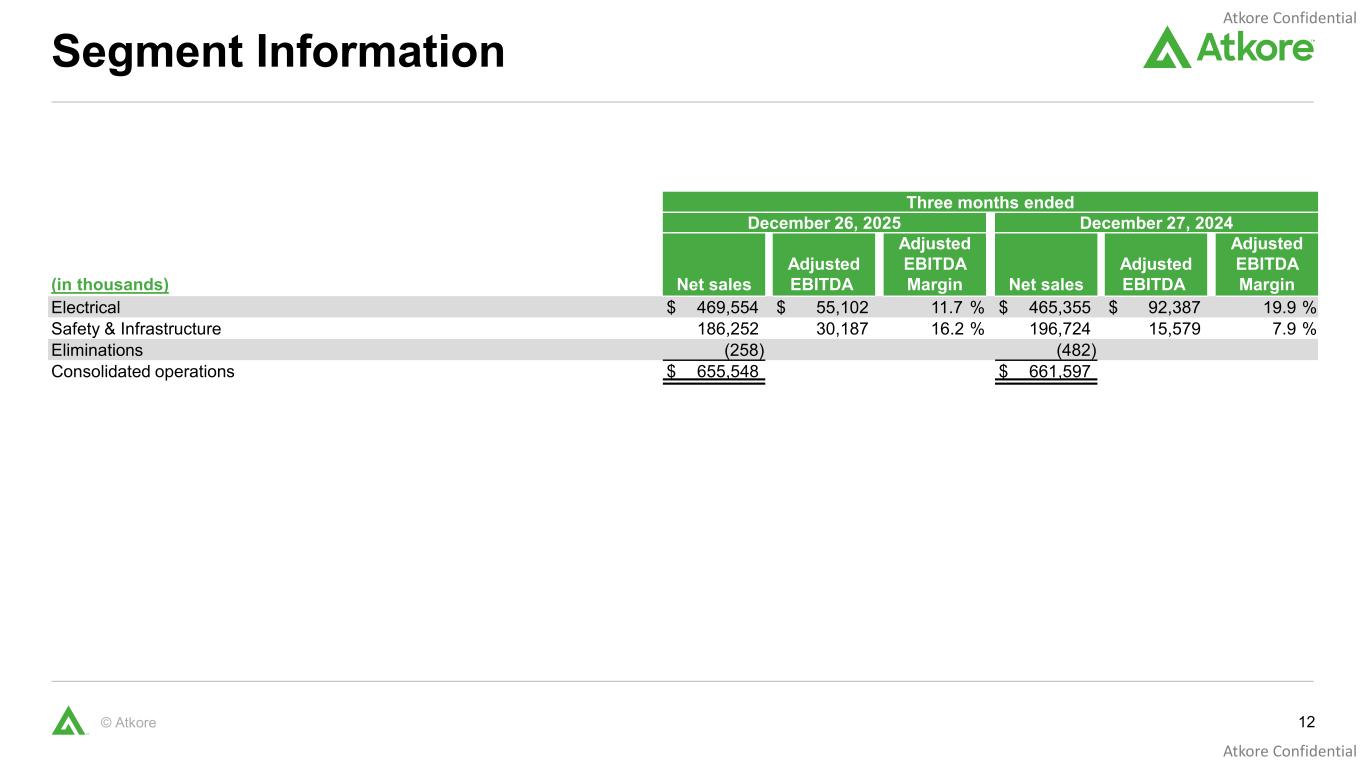
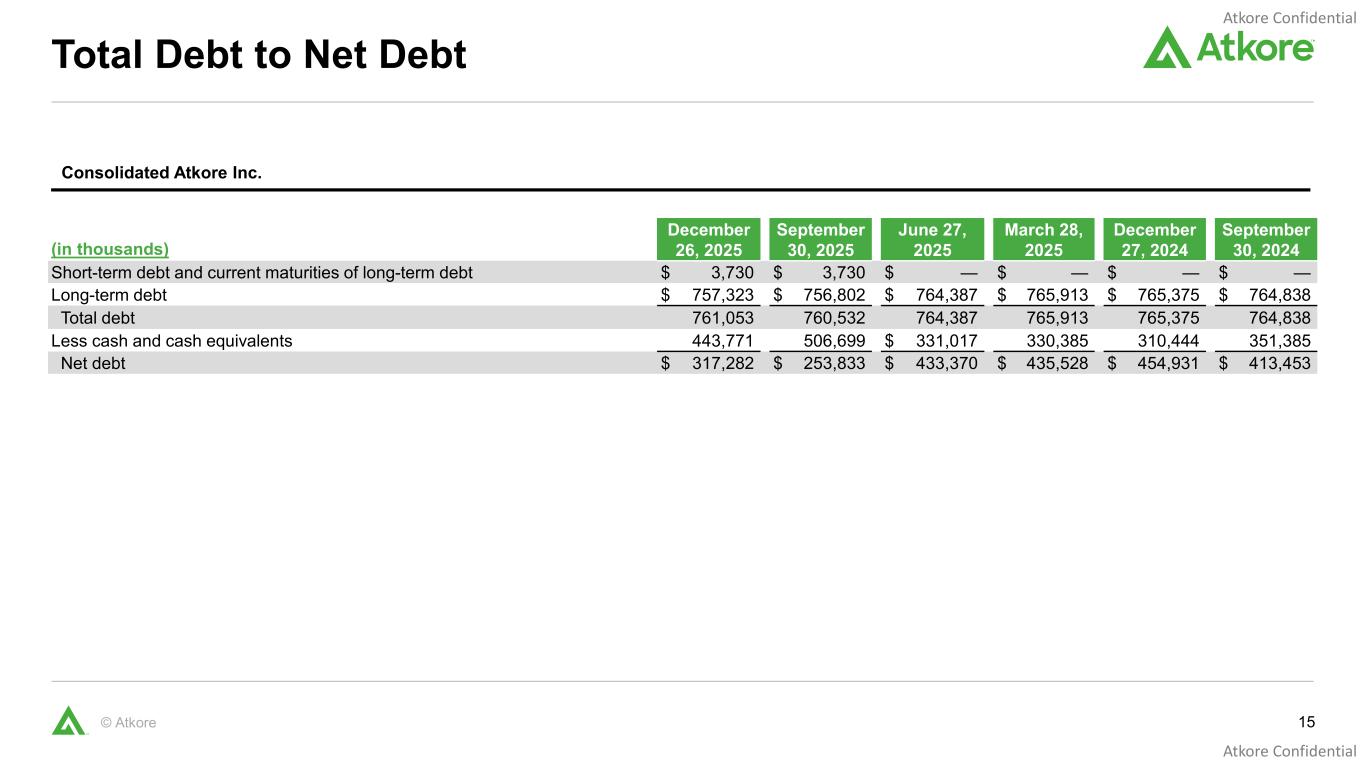
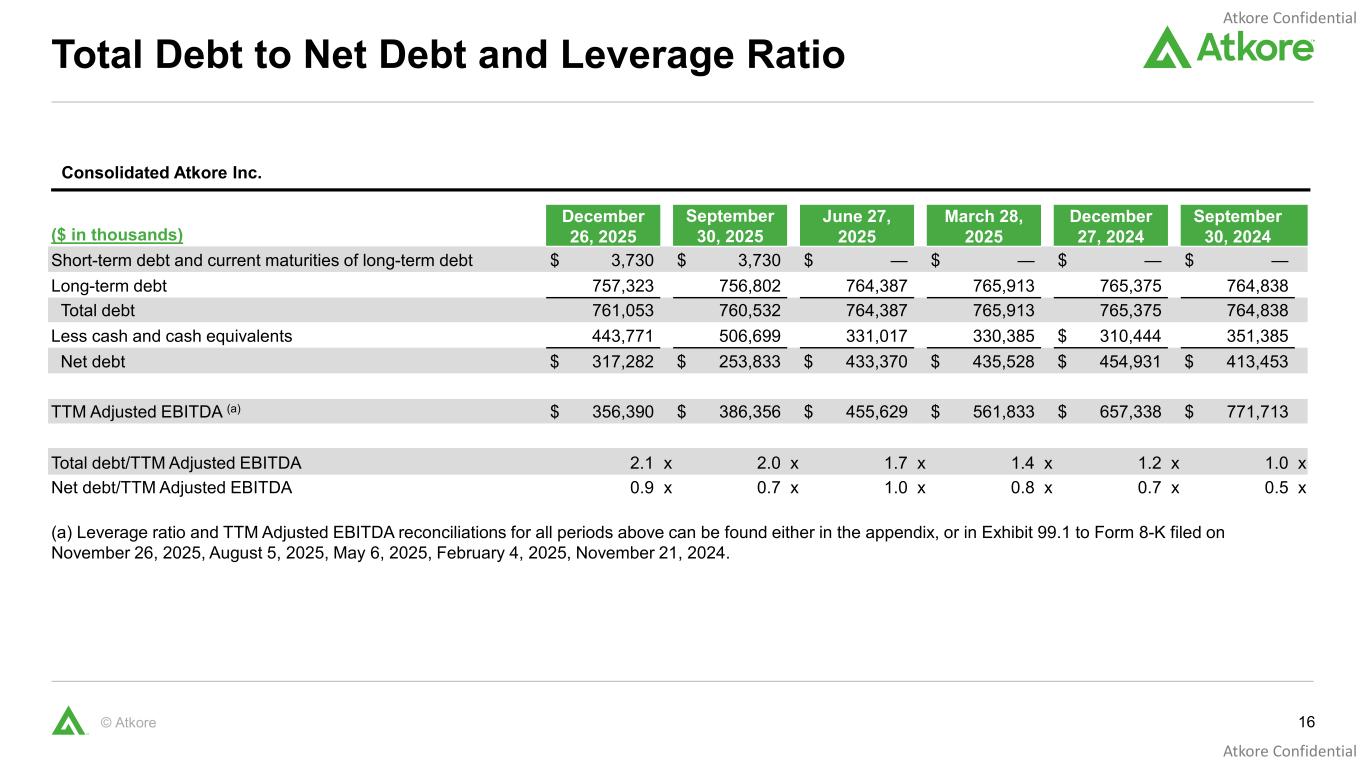
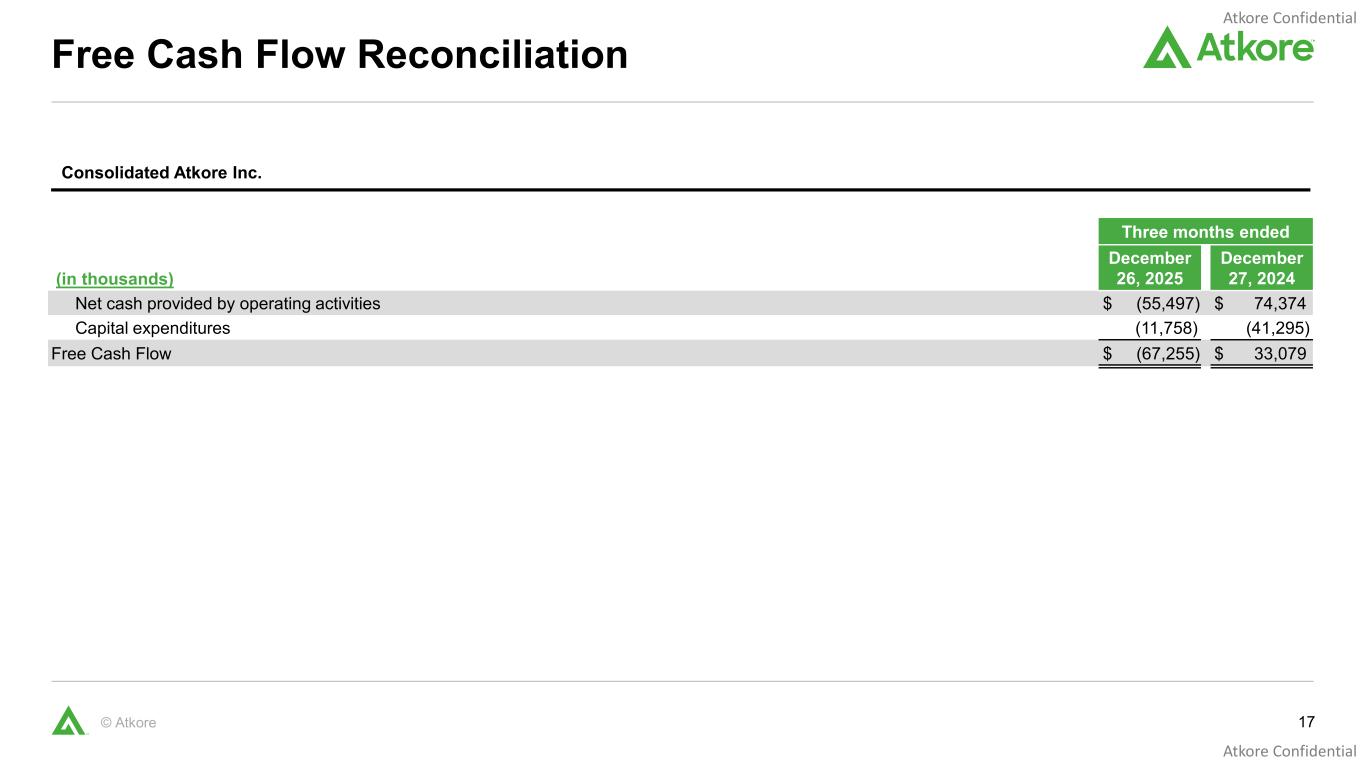
Thank you, Bill, and good morning, everyone. Moving to our consolidated results on slide four. In the first quarter, we achieved net sales of $656 million and adjusted EBITDA of $69 million. Adjusted EPS was $0.83 per share compared to $1.63 in the prior year. Our tax rate in the first quarter was 3%, a decrease from 21% in the prior year. The first quarter tax rate reflects a one-time discrete benefit associated with tax planning related to a foreign operation. Turning to slide five in our consolidated bridges, Organic volumes were up 2% compared to the first quarter of fiscal 25. Our average selling prices declined 3% during the quarter, most of which came from our PVC conduit products, which were partially offset by increased average selling prices for our steel conduit products. Moving to slide 6, our 2% volume increase during the first quarter was driven primarily from our metal electrical conduit and our plastic pipe conduit product categories. Both product categories benefited from healthy non-residential and market demand. Our metal framing, cable management, and construction service businesses saw lower volume compared to the prior year, primarily due to the timing of certain project-based work. We expect growth from these businesses throughout the duration of the year. Our mechanical tube business, which includes our solar-related products, is also expected to grow throughout the year due to the expected timing of large utility-scale solar projects. As we previously communicated, we are shifting certain available capacity from our existing non-solar mechanical products to our electrical conduit products as part of our 80-20 initiative. We would expect that to continue throughout the year to help support electrical and market demand. Overall, we continue to expect mid-single-digit volume growth for the full year. Turning to slide seven, net sales increased year-over-year in our electrical segment, driven by higher volume growth, offset by lower selling prices. Adjusted EBITDA margins compressed in our electrical segment due to higher material costs and lower average selling prices. Net sales in our S&I segment were lower compared to the previous year, primarily due to lower volume. Adjusted EBITDA and adjusted EBITDA margins both increased year-over-year due to increased productivity. As Bill mentioned earlier, ATCOR recognized over $30 million of year-over-year productivity, most of which was generated from our S&I segment. Turning to slide 8, we ended the quarter in a favorable cash position despite a year-over-year decline in our operating cash flow. Keep in mind that our Q4 FY25 operating cash flow was our strongest quarter, generating approximately $200 million. dollars. Our first quarter in FY26 ended before we typically received large collections from our accounts receivables. Those cash collections fell into the first part of our fiscal Q2. Our results included approximately 18 million dollars in cash proceeds recognized from our Tektron tube divestiture. These proceeds represent a portion of the divestiture proceeds. We anticipate receiving an additional $7 million in the second quarter from the sale of our real estate where the products were manufactured. Our balance sheet remains in a strong position with no debt maturity repayments required until 2030. Moving to slide nine, we continue to expect volume growth to be mid-single digits for the full year. Our volume growth expectations are a combination of core construction growth as well as contributions from certain growth initiatives such as solar and global construction services. The recent Dodge Momentum Index forecasts continue to support growth in the core non-residential end markets. As a reminder, we are no longer providing quarterly guidance. Rather, we will continue to update our full-year expectations. In November, we communicated that our full-year expectations are weighted more toward the back half of the year. We still believe this to be true. With that said, we expect our second quarter to be similar to, but slightly better than our first quarter results from an adjusted EBITDA perspective. For the full year, we expect net sales to be in the range of $2.95 to $3.05 billion, an adjusted EBITDA in the range of $340 million to $360 million and adjusted EPS in the range of $5.05 and $5.55. With that, I'll turn it to John Progenzer to give an update on our end markets and our long-term strategic focus.
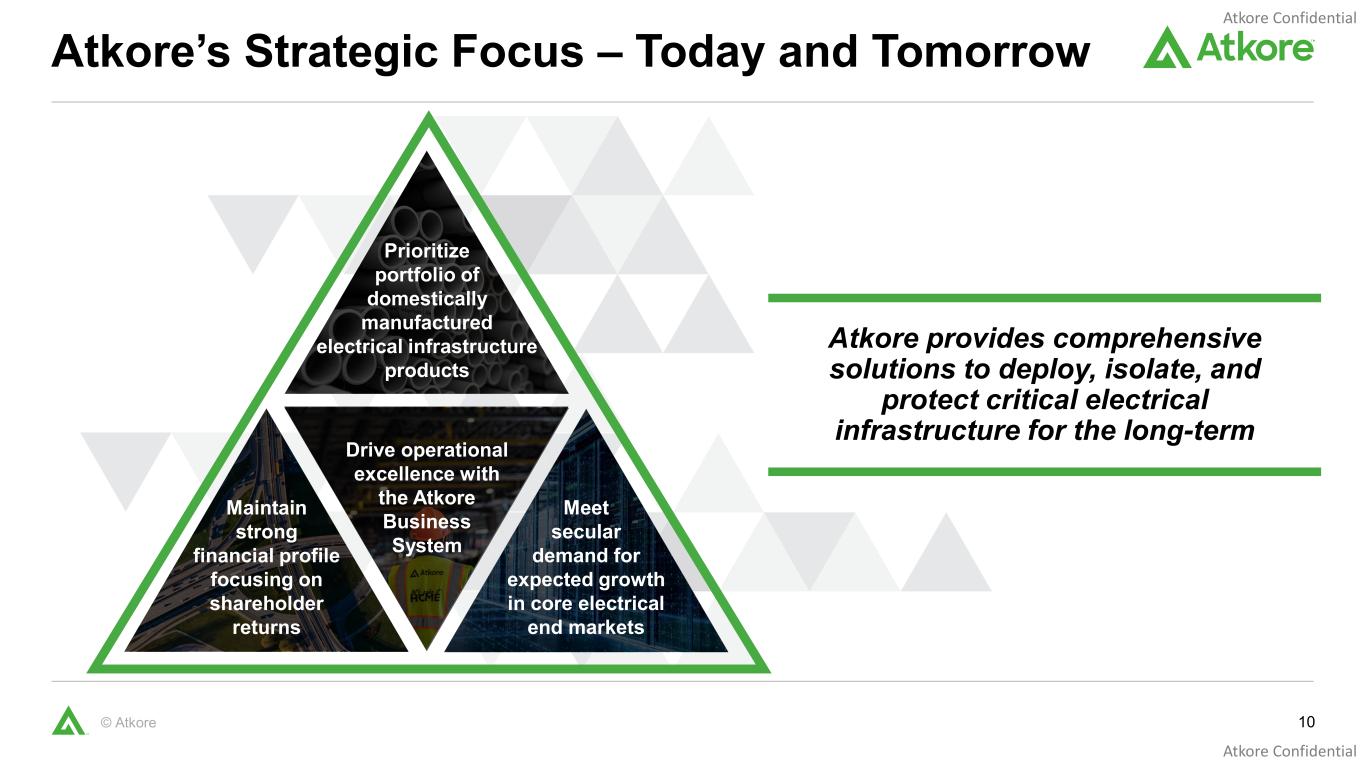
Thanks, John. Turning to slide 10, last year we announced our intention to consolidate three manufacturing facilities. This decision helps us to prioritize our portfolio for domestically manufactured electrical infrastructure products. These actions are part of our broader 80-20 initiative to serve our customers efficiently while also creating a more streamlined cost structure. We are on track to exit these facilities in our second fiscal quarter. As John mentioned, our expected volume growth in fiscal 26 is a combination of base market growth and contributions from certain key strategic investments. The Dodge Momentum Index continues to suggest favorable forward-looking indicators of growth. A recent Moody's ratings analysis suggests that $3 trillion of investment will flow into the data center market in the next five years to support the need for servers, computing equipment, and new power capacity. Our portfolio of metal framing, cable management, and the entirety of our conduit product line are well positioned to benefit from this growth. As the electrical industry plans to support these growth figures available labor continues to be top of mind the associated builders and contractors estimates that approximately 350 000 additional workers are needed to meet the demand for construction services in 2026 and that number grows to 450 000 in 2027. adcor has a history of prioritizing labor saving opportunities for installers through new product development. Our PVC junction boxes, 20-foot conduit, and patented MC Glide armored cable are just a few examples of how ATCOR has made construction installation more efficient. The electrical industry is a great place to be, and we are working to meet the market demand by executing our ATCOR business system centered on strategy, people, and process. With that, we'll turn it over to the operator to open the line for questions.
Operator
At this time, I would like to remind everyone, in order to ask a question, press star, then the number one on your telephone keypad. We'll pause for just a moment to compile the Q&A roster. Your first question comes from Andy Kaplowitz with Citigroup.
Hey, good morning, everyone. Good morning, Andy. Good morning, Andy. Good morning. Can you give us a little more color on the core markets that you're seeing? And I know you just talked about it, but it looks like core PVC and metal condo markets in terms of volume accelerated a bit in Q1 versus what you saw in FY25. So maybe you can talk about that. And then conversely, I know you've talked about construction services ramping up at some point. I mean, there are a lot of mega projects out there, particularly in data centers, as you kind of cited. So when can we see that start to move?
Yeah, Andy, I'll start here and then turn it over to you, the Johns. Yeah, you are correct. And again, John Deitz or something, if we want to get to precise numbers, but PVC, we're seeing good growth with steel, condo, we're seeing good growth with, you know, so up and, you know, you know, good markets overall. And then regarding data centers, it truly is just the timing of year over year in those projects. We are seeing, I mean, again, without giving you precise numbers, we are seeing strong backlogs and commitments for orders and expansion opportunities. So, you know, we're bullish on this fiscal year, and then, you know, even more so as we get into fiscal year 27 and so forth.
And Bill, I beg to – sorry, did you want to say something else?
No, Andy, just a few more information on that is strong Dodge Momentum Index in the We could really see, obviously, being driven by data centers, warehousing is strong, and education, health care, some other end markets. We're seeing some growth. Specifically to PVC, we have seen some increases from the border wall. So that's been one of the areas that's been driving some of the stronger PVC conduit demand.
Very helpful, Collar. And it begs the question, obviously, it's early in the year, but you didn't raise your EBITDA on EPS despite, you know, pretty good Q1, especially given the good productivity. So, is there anything incrementally you're concerned about, or is it just really early in the year?
I mean, yeah, go ahead, Bill. Oh, go, John.
I'll start here, Andy. Yeah, Andy, I think it's just we're first quarter, we're pleased with the results here. i think as we look forward we still have a lot to do so um i can walk through some of the other dynamics here um as we're seeing but just i think the good first quarter and want to maintain where we're at bill anything if you wanted to add no i was going to do very much the same it's like to sit here to let's hit our numbers grow we had great productivity that we called out so i mean things are moving along at this stage but before we get too far out ahead of ourselves sandy let's get it another quarter before we even start talking about the second half of the year because there still is, you know, a reasonable pickup in Q3 and Q4. So it just seems like the wise thing to do at this stage.
Agreed. And then just one more quick one, an update. I think you talked about the competitive environment a little bit. You mentioned PVC, condo pricing still down, but steel condo it up. I think you said import competition and PVC condo remains, but sort of what are you seeing in the two major markets there, particularly from the foreign competition?
Yeah, so specifically from foreign competition, I'll start with PVC and go to steel. PVC continues, imports continue to come in, so maybe not surprised because, again, there's very few tariffs. It's the 10% and as we walk through, you know, it all depends. This is not new news on what somebody claims is the value. So I don't think anything's dramatically changed there, but it's not like it's necessarily improved. But it's still probably, again, we don't have precise numbers on the market size, but it's still probably less than 10% you know, of the whole market. So, but it's growing like our PVC business is also growing. Steel, I think there is moving more in our favor where, you know, again, we had strong growth and, you know, give or take for the last three months, I want to say from a year over year perspective, it was down low to mid single digits for imports. So while they're stepping back slightly, you know, we're continuing to grow. And then I think in the prepared remarks, but if not, you know, both our quarter over quarter, like, excuse me, sequential quarters are up in price and also sequentially, you know, up in margins and so forth. So, moving, you know, definitely in the right direction if we're going to do it.
Appreciate all the color.
Operator
Your next question comes from David Tarantino with KeyBank Capital Market.
Hey, good morning everyone.
I appreciate there's an update specific on a strategic review, but maybe could you give us some more color and an update on the cost-saving effort, what you expect productivity to contribute following the nice start to this quarter, and particularly around the exit of those three facilities that's expected to be completed here soon yeah so i'll walk through it again color from the team here but um so for strategic alternatives we're still being worked so but again as we've already said you know the board doesn't have a time frame so i don't want to sit here and give you know any more handicap on things or time frame or so forth but you know we're continuing to progress through different things obviously We mentioned small things like the divestiture, Tektron, we're still moving forward with HDP, probably at a faster pace than you could imagine in the overall examination if we do consider ACOR as a whole corporation and so forth. So, from that standpoint, moving forward, phenomenal quarter with productivity. I expect this to be our best year probably for productivity. On the same hand, realistically, we're not going to have $30 million every quarter, but we started a good January and it should be, last year was a strong productivity and this should be a good year of productivity. And then finally, to the three plant closures, all the John Bregenzer, John Deitzer had a little bit more color, but I think to what John Deitzer has mentioned in the past, you know, it's 10, 12 million, and we think potentially more, you know, as we get things running. And I would say they're running, you know, the closures that are, you know, smooth and ready to launch schedule complement to John Bregenzer if he wants to add anything to that.
No, Dave, I think everything's going as planned. Seeing favorable transfer of the manufacturing equipment and startup, hiring of the people in the plants that are getting the additional capacity is going well, the training's going well, so we don't see any issues with executing all three of those actually on plan and on Great.
And then just to add, David, just a little bit of color on the productivity dynamic throughout the year. We are very pleased, as Bill mentioned, around the first quarter's performance. And as John mentioned, we're really pleased with where we're going. We have a little bit of dynamics quarter to quarter this year, just meaning the second quarter in particular. Last year in Q2 was a pretty strong, was the high watermark for us from an EBITDA perspective. And so the comp will have a little bit of a dynamic this year, Q2 year over year. That being said, though, we're really pleased with the overall plan for annual productivity this year and then think some of these initiatives will continue to benefit us as we move into 27. But in the second quarter, we're not likely to see the strength here that we saw in the first quarter, largely due to the year over year comparison item. Hopefully that helps in frame it a little bit, the dynamics.
Yes, thanks. That's helpful. And then nice to see the price declines on the top line narrow, but maybe to put a finer point on price costs, could you give us an update on what you have here embedded in the guide? It looks like much of the year over year headwind that was previously expected has kind of already occurred. So how should we be thinking about that previous unmitigated $50 million headwind now and the offsets to it?
Got it, David. Yeah, it's a good question. And the price versus cost headwind that we have this year is largely loaded here in the first half. You see the impact in the first quarter. We, again, I think the second quarter year over year, we're going to have a price versus cost unfavorable. I don't want to start guiding price versus cost, you know, quarter to quarter, but we do anticipate the totality of the back half um to be price versus cost positive here um might be very slightly but but you know that's you know potentially here as we're ramping so it is very much loaded here in the first half so um you know we'll see how the the dynamics play out throughout the year um but but right now to your point uh very much a first half issue here that we're working through okay great thanks for the color guys.
Operator
Your next question comes from Chris Moore with CJS Securities.
Hey, good morning, guys. Yeah, so terrific margins on S&I. Is that 16.2%? Is that sustainable moving forward or just kind of any thoughts there?
I mean, I feel like a little bit of a broken record.
I've said this a few times. We anticipate that business to be more in the, let's call it 12 to 14% adjusted EVE at the margin level. It does have some mixed dynamics when we think about the growth in solar, et cetera, that might have a little bit of margin dynamic with it. But that team has done a very nice job of performing from a productivity perspective and has driven those margins higher so i i do anticipate you know some of the mixed dynamics um probably will level out a little bit and i don't know if we're going to be able to continue exactly at the the positive um productivity level we had we did have you know some items that were more discrete benefits here in the first quarters that that helped push that elevated a little bit um so we'll probably see margin regression in the sni segment here as we move throughout the year.
Got it. And from a cash flow perspective, you talked about Q1 timing, some of the issues there. Just maybe from a fiscal 26 perspective, can you talk a little bit further in terms of kind of overall thoughts and how we should be thinking about it?
Yeah, it's a great question. So as we move through the year, we do anticipate cash from ops to improve. The first quarter was a bit of a headwind, as we mentioned, but you have to go back and remember how strong of a cash flow quarter we had in the fourth quarter of fiscal 25. And so, you know, we had received multiple AR payments, both back in July and then in September. And the way this quarter ended on December 26th, we, you know, several large receivables we have fell into our fiscal January, but really occurred December 28th or 30th type of dynamic. As we look forward, we expect to be modestly here price cash from OPS positive in the second quarter, and then continue to ramp here in the third and fourth quarter from a cash flow perspective. You have seen, we have modestly reduced our expectation on capital expenditures here this year, we're just really ensuring we're investing in the right projects and really dialing that in as well as we move through the year. Got it.
And maybe just the last one for me.
Obviously, backlog is not historically an important metric for you guys, but with some of the focus here on data center, et cetera, is it potentially becoming a little bit more important and is that something that that that's building a little bit at this point in time yeah i think chris there's a couple thoughts there for the core business you know it's shipping five days ten days and little backlog for the data center business itself or you know global construction business the question i answered for andy we are seeing backlogs grow in a couple facets one the amount of orders we have in and then also things if it's not in order kind of like an LOI and so forth so I don't know at this stage or for this year if we want to dimensionalize that publicly but you know there is the potential as it continues to grow it is a business that I think we're all very optimistic at the pace that that business has in front of us got it appreciate it.
I'll leave it there. Thanks, guys. Thanks, Chris.
Operator
Your next question comes from Dan Dre with RBC.
Thank you. Good morning, everyone. Good morning, Dean. Hey, I'd like to circle back on some of the competitive dynamics and how it impacted price in the quarter. Just, you know, when steel being up year over year, that's really encouraging. Is that more of a reflection of stronger volume? Any competitive changes there? And for PVC down, I know there's new capacity coming on. How much of that weighed the ongoing PVC pressure? And this all kind of frames the question of when do you think you get a normalized year-over-year price? It's going to be kind of hard to pinpoint which quarter, but is it still your expectation that it'll happen this year?
Yeah, Dean, I'll start in for John or John if they want to jump in there. So, and with the multi-passive question, I think starting with steel, I think overall demands were strong. So, So I don't know, but I assume my competitors are also, you know, up there. And also with imports going back, you know, you did have a good market for us to grow and for us to get price and us to get margin. So market demand strong and so forth. For imports and so forth there, I don't know. Again, I can't say specifically. I don't think it's necessarily more supply coming into the market as much as I would say in general, you know, back to us hitting our numbers and so forth there. It's probably what we perceived with, you know, price dynamics, both top line and spread and so forth. so in my mind I'm pretty pleased that you know we're back can't commit to the future but we're back paying pretty well how we think the the markets are going to react and I think the earlier comments from John Deitzer um you know we're still expecting spread compression within PVC as to looking out and go when does that stop I may turn over to my peers but at least for me just you know try to pay one quarter with any precision it's a little tougher there that's
really helpful and then just as you talk about shifting some of the manufacturing resources to your core electrical have you been able to size what you think your capacity increase is going to be let's say on a percent basis in conduit or will it be in you know other non-conduit electrolyte cable?
I think especially Dean is thinking more conduit and here's why to go the if you think of what mechanical makes it's your SNI it is metal products so therefore Harvey for example you know one of our largest facilities it is using the 80-20 rule effectively which is actually, I think, helped the S&I margins to earlier questions of, you know, let's get with our key customers with key products, and we don't have to have 1,000 C items. So it's actually helping in our intention future to actually help the margins there. And then it is freeing up capacity for our electrical products to earlier conduits, metal conduits specifically, and to, you know, questions that we just answered, you know, is where we are seeing volume growth and, you know, with data centers and overall markets, it's a place that we would expect long-term growth. So it's working well to say what percents, but I think it's enough that we can keep up with the markets as we go forward. So it's kind of a win-win-win there and compliment John Perginzer and the rest of the team, you know, for really driving that effectively here.
That's helpful. Thank you.
Just one thing to circle back on your earlier question and david's earlier question as well it is a little bit difficult to predict the dynamics associated with price versus cost because there's so many different factors one item that i think we're watching here in the near term a little bit is the volatility and fluctuation that we've seen in copper you know if we just rewind you know like six months ago it's up roughly you know 40 percent give or take from where we gave our outlook um you know back in November, we're probably up around 25%. And there's just been a lot of volatility there. And that would be one variable on also trying to make, you know, some of these assessments as we move forward. I mean, these markets move quickly. And so, you know, that's one of the dynamics here that we're trying to watch and understand as we move throughout the year is that volatility a little bit. But I think the team's done a nice job because one of the facility closures is in the area where we use copper. And I think it's, you know, the team's working to improve the cost structure and try to be reactive to some of that volatility as well. So, you know, there's just a lot of moving parts and dynamics versus trying to pinpoint a singular, hey, this is, you know, when things change in one way or another.
Of course. I appreciate that. Thank you. Thanks, Dean.
Your next question comes from Justin Clare with Roth Capital Partners. good morning good morning uh so just wanted to to follow up on uh steel conduit pricing here so i think it's the fourth quarter in a row that uh pricing is improved so i'm wondering if you just speak a little bit to the trend you expect ahead do you anticipate continued price improvement in fiscal q2 uh and then does the guidance for the year embed uh a uh continued upward trend in steel pricing how are you thinking about that uh and then just lastly uh is the higher pricing supporting uh margin improvement for steel conduit if you could speak to uh potential magnitude or
or how that's being affected yeah so justin i'll start here and the team can add as always so um you are correct that um you know steel conduit prices and it's been four quarters so continue go up with price and also in most of those quarters it's been up you know sequentially and for example our last quarter probably our best quarter for um you know spreads you know you know a long time so those things are moving up i at this stage in our forecasts i don't think we're expecting meaningful spread increases so but i also want to bake anything in to go for what we're guiding for you to say, oh, there's going to be so much more. Steel prices are expected, and I'm just going from different, you know, people's professional forecasts that we use to continue to go up slightly over the next, you know, six, nine months here. So I think we can keep up with pricing, but I wouldn't expect a lot of extra spread, or at least that's not baked into our numbers here.
And then it's just one on the tariffs. I believe aluminum tariffs were potentially expected to have an impact on the cost structure. Wondering how that's evolving if you've secured domestic sources of supply and what the potential impact on the margins could be.
Yeah. Again, without getting too specific on future steps, but you are correct Justin that for us um the tariffs because where we did get our products our aluminum um from offshore at least offshore Canada I'll be specific so they are being impacted by the tariffs we are looking at domestic sources but you know I don't want to give out here if nothing else for our competitors um you know the probability of that you know because even simple things like that getting to through specs and then also you know I do think the domestic manufacturers back to they know that people like us and so forth are looking for domestic supply um you know they're raising the price so how much of an arbitrage we have compared to our competitors or how much we can save compared to the tariffs um is hard to quantify but I will tell you it has been an impact that I don't think we've passed along the impact of the 50 percent aluminum tariffs. That kind of ties back to John Deicher's question or answer, excuse me, even though things like copper are so volatile right now that us predicting that our cable business is a little bit more challenging in the short term here. Got it. Okay, I appreciate it. Thank you. Yeah, thanks Justin.
Operator
Your next question comes from Chris Dankert with Luke Capital.
Hey, good morning, guys. Thanks for taking the questions. I guess just to kind of circle back on solar, and I think you touched on it in your prepared remarks, but I missed it. Can you just kind of give us a sense for what the solar activity is now, kind of how we're shifting capacity in that market, and then just kind of an update there?
Yeah, so what we said, and then it's a great, I'm going to joke and say a setup question for us, is solar from the quarter, just with timing of projects, was down from a year-over-year perspective. That said, you know, we do have a good backlog there almost to other people's questions on global mega projects, you know, borders coming in, commitments from OEMs, And then the other thing that's helping us that we mentioned last year, but our facility Hobart that we make a lot of the solar torque tubes in is performing really well. So that does a couple things. It helps drive some of the productivity we talked about for the first quarter. It helps, you know, with our, you know, overall estimates for productivity for the year. and the increase in throughput is helping as this demand does come up here. So I think solar, like global mega projects, should be a good thing for, you know, this quarter and quite frankly the second half of the year. To earlier questions, you look at the step up, you know, between what we're estimating for profits in Q1 and Q2 compared to what we need to deliver in Q3 and Q4 to hit the average of our numbers of $350 million EBITDA.
As a point of clarification, I assume that the solar torque tubes were generally for domestic projects. Is any of that for export outside of North America right now?
Some. So I don't know long-term how much will be, but it does. one of our customers has ordered a meaningful amount here for projects overseas, but I don't know if that's a long-term trend or not versus a short-term. So I think I would leave it at majority of our focus and our customers are North America base with coincidentally short-term some projects going overseas.
Got it. Got it. That's helpful. And then I guess just finally On Hobart, any update as far as factory loading there, operational metrics, anything worth calling out either in terms of just being on track or any kind of wind or headaches there?
Yeah, John? Yeah, no, Hobart's going well, you know, obviously bringing in the additional solar volume, but their operational rates are continuing to improve. A lot of the productivity that we delivered was contributed by Hobart, so I think everything's progressing as we need it to be. Sounds good. Thank you, Chris.
Operator
This concludes the question and answer session. I would now like to turn the call back over to Bill Waltz for closing remarks.
Thank you. Let me take a moment to summarize my three key takeaways from today's discussion. First, of course, fiscal 2026 is off to a good start. Our results reflect a combination of healthy end markets and self-help productivity gains. We will continue to operate with a proactive mindset as we progress throughout the year. Second, we anticipate favorable market demand for the balance of the year as we reaffirm our full-year outlook. Finally, as we execute previously announced strategic actions and evaluate additional opportunities, we are laser focused on creating long-term value for our shareholders. With that, thank you for your support and interest in our company. We look forward to speaking with you during our next quarterly call. This concludes the call for today.
Operator
This concludes today's conference. You may now disconnect.