
Atkore Inc 8-K, filed May 5, 2020
Atkore Inc. (ATKR)
8-K
2020-05-05
For: 2020-05-05
View Original
Added on
April 08, 2026
About this 8-K
Atkore Inc filed this 8-K on May 5, 2020.
Items reported
- Item 2.02: Financial results
- Item 7.01: Regulation FD disclosure
- Item 9.01: Financial statements and exhibits
UNITED STATES
SECURITIES AND EXCHANGE COMMISSION
Washington, D.C. 20549
FORM 8-K
CURRENT REPORT
Pursuant to Section 13 or 15(d) of
the Securities Exchange Act of 1934
Date of Report (Date of earliest event reported): May 5, 2020

(State or other jurisdiction of incorporation) | (Commission File Number) | (IRS Employer Identification No.) | ||
(Address of principal executive offices) (Zip Code)
(708 ) 339-1610
(Registrant's telephone number, including area code)
Not Applicable
(Former name or former address, if changed since last report)
(Former name or former address, if changed since last report)
Check the appropriate box below if the Form 8-K filing is intended to simultaneously satisfy the filing obligation of the registrant under any of the following provisions:
Securities registered pursuant to Section 12(b) of the Act:
Title of each class | Trading symbol | Name of each exchange on which registered |
Indicate by check mark whether the registrant is an emerging growth company as defined in Rule 405 of the Securities Act of 1933 (§230.405 of this chapter) or Rule 12b-2 of the Securities Exchange Act of 1934 (§240.12b-2 of this chapter).
Emerging growth company ☐
If an emerging growth company, indicate by check mark if the registrant has elected not to use the extended transition period for complying with any new or revised financial accounting standards provided pursuant to Section 13(a) of the Exchange Act. ☐
Item 2.02. Results of Operations and Financial Condition.*
On May 5, 2020, Atkore International Group Inc. (the "Company" or "Atkore") issued a press release announcing the Company’s financial results for the second fiscal quarter ended March 27, 2020. A copy of the press release is being furnished as Exhibit 99.1 and incorporated herein by reference.
Item 7.01. Regulation FD Disclosure.*
The slide presentation attached hereto as Exhibit 99.2, and incorporated herein by reference, will be presented to certain Atkore investors on May 5, 2020 and may be used by Atkore in various other presentations to investors.
Item 9.01. Financial Statements and Exhibits.*
Exhibit No. | Description of Exhibit | ||
99.1 | |||
99.2 | |||
104 | Inline XBRL for the cover page of this Current Report on Form 8-K | ||
* | In accordance with General Instruction B.2 of Form 8-K, the information in Items 2.02 and 7.01 of this Current Report on Form 8-K, including Exhibits 99.1 and 99.2 attached hereto, shall not be deemed “filed” for the purposes of Section 18 of the Securities Exchange Act of 1934 ("Exchange Act"), as amended, or otherwise subject to the liabilities of that section, nor shall it be deemed incorporated by reference in any filing under the Securities Act of 1933, as amended, or the Exchange Act, except as shall be expressly set forth by specific reference in such a filing. | ||
SIGNATURES
Pursuant to the requirements of the Securities Exchange Act of 1934, the registrant has duly caused this report to be signed on its behalf by the undersigned hereunto duly authorized.
ATKORE INTERNATIONAL GROUP INC.
By: /s/ Daniel S. Kelly
Daniel S. Kelly
Vice President, General Counsel and Secretary
Vice President, General Counsel and Secretary
Date: May 5, 2020
EXHIBIT INDEX
Exhibit No. | Description of Exhibit | |
99.1 | ||
99.2 | ||
| Exhibit 99.1 | |
Atkore International Group Inc. Announces Second Quarter 2020 Results
• | Diluted earnings per share increased by $0.19 to $0.80; Adjusted net income per diluted share increased by $0.16 to $0.99 |
• | Net income increased by $9.6 million, or 32.6%, to $39.2 million; Adjusted EBITDA increased by $9.9 million, or 12.9%, to $87.0 million |
• | Full-year Net Sales, Adjusted EBITDA and Adjusted net income per diluted shared expected to be down 10% - 15% compared to prior year |
HARVEY, IL. — May 5, 2020 (BUSINESS WIRE) - Atkore International Group Inc. (the "Company" or "Atkore") (NYSE: ATKR) announced earnings for its fiscal 2020 second quarter ended March 27, 2020.
“I’m pleased to announce Atkore delivered strong second quarter results with net income up 32.6% compared to the prior year,” commented Bill Waltz, Atkore President and Chief Executive Officer. “Our team’s strong operational focus combined with our commitment to teamwork and collaboration enabled the strong earnings growth this quarter.
Waltz continued, “Despite recent market disruptions caused by the COVID-19 pandemic, our team remains focused on ensuring we continue to meet our responsibilities in serving critical infrastructure sectors during this difficult time.
To continue meeting these commitments, Atkore has implemented protocols to enhance the safety of our employees, including daily temperature screenings, social-distancing rules in the plants and warehouses, working remotely whenever possible, enhanced cleaning procedures and increased personal protective equipment measures.
Our adherence to safety, first and foremost, combined with reliance on the Atkore Business System and strong financial management will help us effectively manage through this challenging period of global uncertainty and enable us to continue meeting customers’ needs and driving shareholder value."
2020 Second Quarter Results
Three months ended | ||||||||||||||||
(in thousands) | March 27, 2020 | March 29, 2019 | Change | % Change | ||||||||||||
Net sales | ||||||||||||||||
Electrical Raceway | $ | 339,705 | $ | 353,514 | $ | (13,809 | ) | (3.9 | )% | |||||||
Mechanical Products & Solutions | 116,649 | 116,190 | 459 | 0.4 | % | |||||||||||
Eliminations | (700 | ) | (395 | ) | (305 | ) | 77.2 | % | ||||||||
Consolidated operations | $ | 455,654 | $ | 469,309 | $ | (13,655 | ) | (2.9 | )% | |||||||
Adjusted EBITDA | ||||||||||||||||
Electrical Raceway | $ | 78,954 | $ | 67,375 | $ | 11,579 | 17.2 | % | ||||||||
Mechanical Products & Solutions | 16,144 | 17,421 | (1,277 | ) | (7.3 | )% | ||||||||||
Unallocated | (8,092 | ) | (7,702 | ) | (390 | ) | 5.1 | % | ||||||||
Consolidated operations | $ | 87,006 | $ | 77,094 | $ | 9,912 | 12.9 | % | ||||||||
Net sales decreased by $13.7 million, or 2.9%, to $455.7 million for the three months ended March 27, 2020, compared to $469.3 million for the three months ended March 29, 2019. The decrease is primarily attributed to $18.6 million of lower average selling prices resulting from lower commodity input costs of steel and resin. Additionally, net sales decreased by $3.6 million due to lower volume, primarily in the armored cable and fittings product category sold within the Electrical Raceway segment, partially offset by higher volume in the mechanical pipe product category sold within the Mechanical Products & Solutions segment. The decrease in net sales was partially offset by increased sales of $10.6 million from the acquisition of the assets of United Structural Products, LLC. ("US Tray") and Rocky Mountain Pipe ("Cor-Tek") and the acquisition of Flytec Systems Ltd. and its parent holding company, Modern Associates Ltd., in fiscal 2019 (together, the "2019 acquisitions").
1
| Exhibit 99.1 | |
Gross profit increased by $14.5 million, or 12.4%, to $131.6 million for the three months ended March 27, 2020, as compared to $117.1 million for the prior-year period. Gross margin increased to 28.9% for the three months ended March 27, 2020, as compared to 24.9% for the prior-year period. Gross margin increased primarily due to the benefits from lower material costs and operational efficiencies.
Net income increased by $9.6 million, or 32.6%, to $39.2 million for the three months ended March 27, 2020 compared to $29.6 million for the prior-year period primarily due to higher gross profit and lower interest expense.
Adjusted EBITDA increased by $9.9 million, or 12.9%, to $87.0 million for the three months ended March 27, 2020 compared to $77.1 million for the three months ended March 29, 2019. The increase was primarily due to higher gross profit.
Diluted earnings per share prepared in accordance with accounting principles generally accepted in the United States of America ("GAAP") was $0.80 for the three months ended March 27, 2020, as compared to $0.61 in the prior-year period. Adjusted net income per diluted share increased by $0.16 to $0.99 for the three months ended March 27, 2020, as compared to $0.83 in the prior year period. The increase in diluted earnings per share and adjusted net income per share is primarily attributed to higher gross profit and lower interest expense.
Segment Results
Electrical Raceway
Net sales decreased by $13.8 million, or 3.9%, to $339.7 million for the three months ended March 27, 2020 compared to $353.5 million for the three months ended March 29, 2019. The decrease in net sales is primarily driven by $13.5 million in lower volume, primarily in the armored cable and fitting product category, and lower average selling prices resulting from lower commodity input costs of steel and resin of $9.4 million. The decrease in net sales was partially offset by the 2019 acquisitions, which contributed $10.6 million in sales for the three months ended March 27, 2020.
Adjusted EBITDA for the three months ended March 27, 2020 increased by $11.6 million, or 17.2%, to $79.0 million from $67.4 million for the three months ended March 29, 2019. Adjusted EBITDA margins increased to 23.2% for the three months ended March 27, 2020 compared to 19.1% for the three months ended March 29, 2019. The increase in Adjusted EBITDA was largely due to the benefit of lower material costs, operational efficiencies, and the contributions from the 2019 acquisitions.
Mechanical Products & Solutions ("MP&S")
Net sales increased by $0.5 million, or 0.4%, for the three months ended March 27, 2020 to $116.6 million compared to $116.2 million for the three months ended March 29, 2019. The increase is primarily attributed to higher volume of $9.8 million primarily in the mechanical pipe product category, partially offset by the pass-through impact of lower average input costs of steel products of $9.2 million.
Adjusted EBITDA decreased by $1.3 million, or 7.3%, to $16.1 million for the three months ended March 27, 2020 compared to $17.4 million for the three months ended March 29, 2019. Adjusted EBITDA margins decreased to 13.8% for the three months ended March 27, 2020 compared to 15.0% for the three months ended March 29, 2019. The Adjusted EBITDA decrease is primarily due to additional costs related to equipment maintenance at one of our facilities in the current period.
Full-Year 2020 Outlook
The Company is currently estimating fiscal year 2020 Net Sales, Adjusted EBITDA and Adjusted net income per diluted share to be down in the range of 10% - 15% compared to fiscal year 2019.
Reconciliations of the forward-looking full-year 2020 outlook for Adjusted EBITDA and Adjusted net income per diluted share are not being provided as the Company does not currently have sufficient data to accurately estimate the variables and individual adjustments for such reconciliations.
2
| Exhibit 99.1 | |
Conference Call Information
Atkore management will host a conference call today, May 5, 2020, at 8 a.m. Eastern time, to discuss the Company's financial results. The conference call may be accessed by dialing (877) 407-0789 (domestic) or (201) 689-8562 (international). The call will be available for replay until May 19, 2020. The replay can be accessed by dialing (844) 512-2921, or for international callers, (412) 317-6671. The passcode for the live call and the replay is 13701559
.
.
Interested investors and other parties can also listen to a webcast of the live conference call by logging onto the Investor Relations section of the Company's website at http://investors.atkore.com. The online replay will be available on the same website immediately following the call.
To learn more about the Company, please visit the company's website at http://investors.atkore.com.
About Atkore International Group Inc.
Atkore International Group Inc. is a leading manufacturer of Electrical Raceway products primarily for the non-residential construction and renovation markets and Mechanical Products & Solutions for the construction and industrial markets. The Company manufactures a broad range of end-to-end integrated products and solutions that are critical to its customers’ businesses and employs approximately 3,900 people at 65 manufacturing and distribution facilities worldwide. The Company is headquartered in Harvey, Illinois.
Contact:
John Deitzer |
Vice President - Investor Relations |
708-225-2124 |
jdeitzer@atkore.com |
Forward-Looking Statements
This press release contains "forward-looking statements" within the meaning of the Federal Private Securities Litigation Reform Act of 1995. Forward-looking statements include, but are not limited to, statements relating to financial outlook. Some of the forward-looking statements can be identified by the use of forward-looking terms such as "believes," "expects," "may," "will," "shall," "should," "would," "could," "seeks," "aims," "projects," "is optimistic," "intends," "plans," "estimates," "anticipates" or other comparable terms. Forward-looking statements include, without limitation, all matters that are not historical facts. Forward-looking statements are subject to known and unknown risks and uncertainties, many of which may be beyond our control. We caution you that forward-looking statements are not guarantees of future performance or outcomes and that actual performance and outcomes, including, without limitation, our actual results of operations, financial condition and liquidity, and the development of the market in which we operate, may differ materially from those made in or suggested by the forward-looking statements contained in this press release. In addition, even if our results of operations, financial condition and cash flows, and the development of the market in which we operate, are consistent with the forward-looking statements contained in this press release, those results or developments may not be indicative of results or developments in subsequent periods.
3
| Exhibit 99.1 | |
A number of important factors, including, without limitation, the risks and uncertainties discussed or referenced under the caption "Risk Factors" in our Annual Report on Form 10-K, filed with the U.S. Securities and Exchange Commission ("SEC") on November 22, 2019 could cause actual results and outcomes to differ materially from those reflected in the forward-looking statements. Additional factors that could cause actual results and outcomes to differ from those reflected in forward-looking statements include, without limitation: declines in, and uncertainty regarding, the general business and economic conditions in the United States and international markets in which we operate; weakness or another downturn in the United States non-residential construction industry; changes in prices of raw materials; pricing pressure, reduced profitability, or loss of market share due to intense competition; availability and cost of third-party freight carriers and energy; high levels of imports of products similar to those manufactured by us; changes in federal, state, local and international governmental regulations and trade policies; changes in foreign laws and legal systems, including as a result of Brexit; recent and future changes to tax legislation; adverse weather conditions; failure to generate sufficient cash flow from operations or to raise sufficient funds in the capital markets to satisfy existing obligations and support the development of our business; increased costs relating to future capital and operating expenditures to maintain compliance with environmental, health and safety laws; reduced spending by, deterioration in the financial condition of, or other adverse developments with respect to, one or more of our top customers; increases in our working capital needs, which are substantial and fluctuate based on economic activity and the market prices for our main raw materials, including as a result of failure to collect, or delays in the collection of, cash from the sale of manufactured products; work stoppage or other interruptions of production at our facilities as a result of disputes under existing collective bargaining agreements with labor unions or in connection with negotiations of new collective bargaining agreements, as a result of supplier financial distress, or for other reasons; challenges attracting and retaining key personnel or high-quality employees; changes in our financial obligations relating to pension plans that we maintain in the United States; reduced production or distribution capacity due to interruptions in the operations of our facilities or those of our key suppliers; loss of a substantial number of our third-party agents or distributors or a dramatic deviation from the amount of sales they generate; security threats, attacks, or other disruptions to our information systems, or failure to comply with complex network security, data privacy and other legal obligations or the failure to protect sensitive information; possible impairment of goodwill or other long-lived assets as a result of future triggering events, such as declines in our cash flow projections or customer demand and changes in our business and valuation assumptions; safety and labor risks associated with the manufacture and in the testing of our products; product liability, construction defect and warranty claims and litigation relating to our various products, as well as government inquiries and investigations, and consumer, employment, tort and other legal proceedings; our ability to protect our intellectual property and other material proprietary rights; risks inherent in doing business internationally; our inability to introduce new products effectively or implement our innovation strategies; the inability of our customers to pay off the credit lines extended to them by us in a timely manner and the negative impact on customer relations resulting from our collections efforts with respect to non-paying or slow-paying customers; our inability to continue importing raw materials, component parts and/or finished goods; the incurrence of liabilities and the issuance of additional debt or equity in connection with acquisitions, joint ventures or divestitures and the failure of indemnification provisions in our acquisition agreements to fully protect us from unexpected liabilities; failure to manage acquisitions successfully, including identifying, evaluating, and valuing acquisition targets and integrating acquired companies, businesses or assets; the incurrence of liabilities in connection with violations of the U.S. Foreign Corrupt Practices Act and similar foreign anti-corruption laws; the incurrence of additional expenses, increase in complexity of our supply chain and potential damage to our reputation with customers resulting from regulations related to "conflict minerals"; widespread outbreak of diseases, such as the recent novel coronavirus (COVID-19) pandemic; disruptions or impediments to the receipt of sufficient raw materials resulting from various anti-terrorism security measures; restrictions contained in our debt agreements; failure to generate cash sufficient to pay the principal of, interest on, or other amounts due on our debt; and other factors described from time to time in documents that we file with the SEC. The Company assumes no obligation to update the information contained herein, which speaks only as of the date hereof.
Non-GAAP Financial Information
This press release includes certain financial information, not prepared in accordance with Generally Accepted Accounting Principles in the United States ("GAAP"). Because not all companies calculate non-GAAP financial information identically (or at all), the presentations herein may not be comparable to other similarly titled measures used by other companies. Further, these measures should not be considered substitutes for the performance measures derived in accordance with GAAP. See non-GAAP reconciliations below in this press release for a reconciliation of these measures to the most directly comparable GAAP financial measures.
4
| Exhibit 99.1 | |
Adjusted EBITDA and Adjusted EBITDA Margin
We use Adjusted EBITDA and Adjusted EBITDA Margin in evaluating the performance of our business and in the preparation of our annual operating budgets as indicators of business performance and profitability. We believe Adjusted EBITDA and Adjusted EBITDA Margin allow us to readily view operating trends, perform analytical comparisons and identify strategies to improve operating performance.
We define Adjusted EBITDA as net income (loss) before: depreciation and amortization, interest expense, net, income tax expense (benefit), restructuring charges, stock-based compensation, certain legal matters, transaction costs, gain on purchase of a business and other items, such as inventory reserves and adjustments, and realized or unrealized gain (loss) on foreign currency transactions, loss on disposal of property, pant and equipment, insurance recovery related to damages of property, plant and equipment and release of certain indemnified uncertain tax positions. We define Adjusted EBITDA Margin as Adjusted EBITDA as a percentage of Net sales.
We believe Adjusted EBITDA and Adjusted EBITDA Margin, when presented in conjunction with comparable accounting principles generally accepted in the United States of America ("GAAP") measures, are useful for investors because management uses Adjusted EBITDA and Adjusted EBITDA Margin in evaluating the performance of our business.
Adjusted Net Income and Adjusted Net Income per Share
We use Adjusted net income and Adjusted net income per share in evaluating the performance of our business and profitability. Management believes that these measures provide useful information to investors by offering additional ways of viewing the Company's results that, when reconciled to the corresponding GAAP measure provide an indication of performance and profitability excluding the impact of unusual and or non-cash items. We define Adjusted net income as net income before stock-based compensation, intangible asset amortization, certain legal matters and other items, and the income tax expense or benefit on the foregoing adjustments that are subject to income tax. We define Adjusted net income per share as basic and diluted earnings per share excluding the per share impact of stock-based compensation, intangible asset amortization, certain legal matters and other items, and the income tax expense or benefit on the foregoing adjustments that are subject to income tax.
Leverage Ratio - Net debt/Adjusted EBITDA
We define leverage ratio as the ratio of net debt (total debt less cash and cash equivalents) to Adjusted EBITDA on a trailing twelve-month ("TTM") basis. We believe the leverage ratio is useful to investors as an alternative liquidity measure.
5
| Exhibit 99.1 | |
ATKORE INTERNATIONAL GROUP INC.
CONDENSED CONSOLIDATED STATEMENTS OF OPERATIONS
(Unaudited)
Three months ended | Six months ended | |||||||||||||||
(in thousands, except per share data) | March 27, 2020 | March 29, 2019 | March 27, 2020 | March 29, 2019 | ||||||||||||
Net sales | $ | 455,654 | $ | 469,309 | $ | 903,102 | $ | 921,337 | ||||||||
Cost of sales | 324,051 | 352,221 | 654,655 | 693,993 | ||||||||||||
Gross profit | 131,603 | 117,088 | 248,447 | 227,344 | ||||||||||||
Selling, general and administrative | 62,360 | 56,350 | 118,575 | 112,729 | ||||||||||||
Intangible asset amortization | 8,071 | 8,196 | 16,184 | 16,410 | ||||||||||||
Operating income | 61,172 | 52,542 | 113,688 | 98,205 | ||||||||||||
Interest expense, net | 10,564 | 13,328 | 21,184 | 25,488 | ||||||||||||
Other income, net | (1,685 | ) | (594 | ) | (1,919 | ) | (2,194 | ) | ||||||||
Income before income taxes | 52,293 | 39,808 | 94,423 | 74,911 | ||||||||||||
Income tax expense | 13,100 | 10,253 | 20,440 | 18,407 | ||||||||||||
Net income | $ | 39,193 | $ | 29,555 | $ | 73,983 | $ | 56,504 | ||||||||
Net income per share | ||||||||||||||||
Basic | $ | 0.81 | $ | 0.62 | $ | 1.53 | $ | 1.18 | ||||||||
Diluted | $ | 0.80 | $ | 0.61 | $ | 1.50 | $ | 1.15 | ||||||||
6
| Exhibit 99.1 | |
ATKORE INTERNATIONAL GROUP INC.
CONDENSED CONSOLIDATED BALANCE SHEETS
(Unaudited)
(in thousands, except share and per share data) | March 27, 2020 | September 30, 2019 | ||||||
Assets | ||||||||
Current Assets: | ||||||||
Cash and cash equivalents | $ | 137,202 | $ | 123,415 | ||||
Accounts receivable, less allowance for doubtful accounts of $3,410 and $2,608, respectively | 305,617 | 315,353 | ||||||
Inventories, net | 246,235 | 226,090 | ||||||
Prepaid expenses and other current assets | 54,083 | 34,679 | ||||||
Total current assets | 743,137 | 699,537 | ||||||
Property, plant and equipment, net | 246,304 | 260,703 | ||||||
Intangible assets, net | 269,882 | 285,684 | ||||||
Goodwill | 186,779 | 186,231 | ||||||
Right-of-use assets, net | 41,629 | — | ||||||
Deferred tax assets | 1,016 | 577 | ||||||
Other long-term assets | 4,820 | 4,263 | ||||||
Total Assets | $ | 1,493,567 | $ | 1,436,995 | ||||
Liabilities and Equity | ||||||||
Current Liabilities: | ||||||||
Accounts payable | $ | 128,173 | $ | 150,681 | ||||
Income tax payable | 2,690 | 2,157 | ||||||
Accrued compensation and employee benefits | 23,981 | 35,770 | ||||||
Customer liabilities | 39,307 | 44,983 | ||||||
Lease obligations | 12,048 | — | ||||||
Other current liabilities | 48,911 | 53,943 | ||||||
Total current liabilities | 255,110 | 287,534 | ||||||
Long-term debt | 845,694 | 845,317 | ||||||
Long-term lease obligations | 30,411 | — | ||||||
Deferred tax liabilities | 21,336 | 19,986 | ||||||
Other long-term tax liabilities | 740 | 3,669 | ||||||
Pension liabilities | 32,520 | 34,509 | ||||||
Other long-term liabilities | 12,322 | 13,044 | ||||||
Total Liabilities | 1,198,133 | 1,204,059 | ||||||
Equity: | ||||||||
Common stock, $0.01 par value, 1,000,000,000 shares authorized, 47,175,927 and 46,955,163 shares issued and outstanding, respectively | 473 | 471 | ||||||
Treasury stock, held at cost, 260,900 and 260,900 shares, respectively | (2,580 | ) | (2,580 | ) | ||||
Additional paid-in capital | 482,399 | 477,139 | ||||||
Accumulated deficit | (142,473 | ) | (200,396 | ) | ||||
Accumulated other comprehensive loss | (42,385 | ) | (41,698 | ) | ||||
Total Equity | 295,434 | 232,936 | ||||||
Total Liabilities and Equity | $ | 1,493,567 | $ | 1,436,995 | ||||
7
| Exhibit 99.1 | |
ATKORE INTERNATIONAL GROUP INC.
CONDENSED CONSOLIDATED STATEMENTS OF CASH FLOWS
(Unaudited)
Six months ended | ||||||||
(in thousands) | March 27, 2020 | March 29, 2019 | ||||||
Operating activities: | ||||||||
Net income | $ | 73,983 | $ | 56,504 | ||||
Adjustments to reconcile net income to net cash provided by operating activities: | ||||||||
Depreciation and amortization | 37,208 | 36,301 | ||||||
Deferred income taxes | 1,036 | (1,101 | ) | |||||
Stock-based compensation | 7,646 | 4,816 | ||||||
Amortization of right-of-use assets | 7,384 | — | ||||||
Loss on disposal of property, plant and equipment | 4,560 | — | ||||||
Other adjustments to net income | 2,672 | 3,046 | ||||||
Changes in operating assets and liabilities, net of effects from acquisitions | ||||||||
Accounts receivable | 7,757 | (4,839 | ) | |||||
Inventories | (22,719 | ) | 8,540 | |||||
Accounts payable | (18,856 | ) | (19,135 | ) | ||||
Other, net | (51,387 | ) | (41,343 | ) | ||||
Net cash provided by operating activities | 49,284 | 42,789 | ||||||
Investing activities: | ||||||||
Capital expenditures | (17,139 | ) | (14,712 | ) | ||||
Acquisition of businesses, net of cash acquired | — | (57,899 | ) | |||||
Other, net | 30 | (194 | ) | |||||
Net cash used in investing activities | (17,109 | ) | (72,805 | ) | ||||
Financing activities: | ||||||||
Borrowings under credit facility | — | 17,000 | ||||||
Repayments under credit facility | — | (17,000 | ) | |||||
Repayments of short-term debt | — | (20,980 | ) | |||||
Issuance of common stock | (2,380 | ) | 1,291 | |||||
Repurchase of common stock | (15,011 | ) | (24,419 | ) | ||||
Other, net | (30 | ) | (677 | ) | ||||
Net cash used for financing activities | (17,421 | ) | (44,785 | ) | ||||
Effects of foreign exchange rate changes on cash and cash equivalents | (967 | ) | (363 | ) | ||||
Increase (decrease) in cash and cash equivalents | 13,787 | (75,164 | ) | |||||
Cash and cash equivalents at beginning of period | 123,415 | 126,662 | ||||||
Cash and cash equivalents at end of period | $ | 137,202 | $ | 51,498 | ||||
Supplementary Cash Flow information | ||||||||
Capital expenditures, not yet paid | $ | 713 | $ | 626 | ||||
8
| Exhibit 99.1 | |
ATKORE INTERNATIONAL GROUP INC.
ADJUSTED EBITDA
The following table presents reconciliations of Adjusted EBITDA to net income for the periods presented:
Three months ended | Six months ended | |||||||||||||||
(in thousands) | March 27, 2020 | March 29, 2019 | March 27, 2020 | March 29, 2019 | ||||||||||||
Net income | $ | 39,193 | $ | 29,555 | $ | 73,983 | $ | 56,504 | ||||||||
Interest expense, net | 10,564 | 13,328 | 21,184 | 25,488 | ||||||||||||
Income tax expense | 13,100 | 10,253 | 20,440 | 18,407 | ||||||||||||
Depreciation and amortization | 18,478 | 18,280 | 37,208 | 36,301 | ||||||||||||
Restructuring charges | 2,645 | 1,085 | 2,865 | 2,472 | ||||||||||||
Stock-based compensation | 4,523 | 1,834 | 7,646 | 4,816 | ||||||||||||
Transaction costs | 6 | 123 | 57 | 287 | ||||||||||||
Other (a) | (1,503 | ) | 2,636 | 1,333 | 2,842 | |||||||||||
Adjusted EBITDA | $ | 87,006 | $ | 77,094 | $ | 164,716 | $ | 147,117 | ||||||||
(a) Represents other items, such as inventory reserves and adjustments, realized or unrealized gain (loss) on foreign currency transactions, loss on disposal of property, plant and equipment, insurance recovery related to damages of property, plant and equipment and release of certain indemnified uncertain tax positions. | ||||||||||||||||
9
| Exhibit 99.1 | |
ATKORE INTERNATIONAL GROUP INC.
SEGMENT INFORMATION
The following tables represent reconciliations of Net sales and calculations of Adjusted EBITDA Margin by segment for the periods presented:
Three months ended | ||||||||||||||||||||||
March 27, 2020 | March 29, 2019 | |||||||||||||||||||||
(in thousands) | Net sales | Adjusted EBITDA | Adjusted EBITDA Margin | Net sales | Adjusted EBITDA | Adjusted EBITDA Margin | ||||||||||||||||
Electrical Raceway | $ | 339,705 | $ | 78,954 | 23.2 | % | $ | 353,514 | $ | 67,375 | 19.1 | % | ||||||||||
Mechanical Products & Solutions | 116,649 | 16,144 | 13.8 | % | 116,190 | 17,421 | 15.0 | % | ||||||||||||||
Eliminations | (700 | ) | (395 | ) | ||||||||||||||||||
Consolidated operations | $ | 455,654 | $ | 469,309 | ||||||||||||||||||
Six months ended | ||||||||||||||||||||||
March 27, 2020 | March 29, 2019 | |||||||||||||||||||||
(in thousands) | Net sales | Adjusted EBITDA | Adjusted EBITDA Margin | Net sales | Adjusted EBITDA | Adjusted EBITDA Margin | ||||||||||||||||
Electrical Raceway | $ | 681,081 | $ | 149,175 | 21.9 | % | $ | 696,920 | $ | 135,864 | 19.5 | % | ||||||||||
Mechanical Products & Solutions | 223,309 | 32,798 | 14.7 | % | 225,003 | 28,308 | 12.6 | % | ||||||||||||||
Eliminations | (1,288 | ) | (586 | ) | ||||||||||||||||||
Consolidated operations | $ | 903,102 | $ | 921,337 | ||||||||||||||||||
10
| Exhibit 99.1 | |
ATKORE INTERNATIONAL GROUP INC.
ADJUSTED NET INCOME PER SHARE
The following table presents reconciliations of Adjusted net income to net income for the periods presented:
Three months ended | Six months ended | |||||||||||||||
(in thousands, except per share data) | March 27, 2020 | March 29, 2019 | March 27, 2020 | March 29, 2019 | ||||||||||||
Net income | $ | 39,193 | $ | 29,555 | $ | 73,983 | $ | 56,504 | ||||||||
Stock-based compensation | 4,523 | 1,834 | 7,646 | 4,816 | ||||||||||||
Intangible asset amortization | 8,071 | 8,196 | 16,184 | 16,410 | ||||||||||||
Other (a) | (1,503 | ) | 2,636 | 1,333 | 2,842 | |||||||||||
Pre-tax adjustments to net income | 11,091 | 12,666 | 25,163 | 24,068 | ||||||||||||
Tax effect | (2,773 | ) | (3,103 | ) | (6,291 | ) | (5,897 | ) | ||||||||
Adjusted net income | $ | 47,511 | $ | 39,118 | $ | 92,855 | $ | 74,675 | ||||||||
Diluted weighted average common shares outstanding | 48,095 | 47,369 | 48,229 | 47,817 | ||||||||||||
Net income per diluted share | $ | 0.80 | $ | 0.61 | $ | 1.50 | $ | 1.15 | ||||||||
Adjusted net income per diluted share | $ | 0.99 | $ | 0.83 | $ | 1.93 | $ | 1.56 | ||||||||
(a) Represents other items, such as inventory reserves and adjustments, realized or unrealized gain (loss) on foreign currency transactions, loss on disposal of property, plant and equipment, insurance recovery related to damages of property, plant and equipment and release of certain indemnified uncertain tax positions. | ||||||||||||||||
11
| Exhibit 99.1 | |
ATKORE INTERNATIONAL GROUP INC.
LEVERAGE RATIO
The following table presents reconciliations of Net debt to Total debt for the periods presented:
ATKORE INTERNATIONAL GROUP INC.
TRAILING TWELVE MONTHS ADJUSTED EBITDA
The following table presents a reconciliation of Adjusted EBITDA for the trailing twelve months ended March 27, 2020:
TTM | Three months ended | ||||||||||||||||||
(in thousands) | March 27, 2020 | March 27, 2020 | December 27, 2019 | September 30, 2019 | June 28, 2019 | ||||||||||||||
Net income | $ | 156,530 | $ | 39,193 | $ | 34,790 | $ | 45,997 | $ | 36,550 | |||||||||
Interest expense, net | 46,169 | 10,564 | 10,620 | $ | 12,196 | 12,789 | |||||||||||||
Income tax expense | 47,651 | 13,100 | 7,340 | $ | 16,105 | 11,106 | |||||||||||||
Depreciation and amortization | 73,254 | 18,478 | 18,730 | $ | 18,286 | 17,760 | |||||||||||||
Restructuring charges | 4,197 | 2,645 | 220 | $ | 623 | 709 | |||||||||||||
Stock-based compensation | 14,628 | 4,523 | 3,123 | $ | 2,862 | 4,120 | |||||||||||||
Transaction costs | 970 | 6 | 51 | $ | 837 | 76 | |||||||||||||
Gain on purchase of a business | (7,384 | ) | — | — | $ | (7,384 | ) | — | |||||||||||
Other(a) | 5,992 | (1,503 | ) | 2,836 | $ | (712 | ) | 5,371 | |||||||||||
Adjusted EBITDA | $ | 342,007 | $ | 87,006 | $ | 77,710 | $ | 88,810 | $ | 88,481 | |||||||||
(a) Represents other items, such as inventory reserves and adjustments, realized or unrealized gain (loss) on foreign currency transactions, loss on disposal of property, plant and equipment, insurance recovery related to damages of property, plant and equipment and release of certain indemnified uncertain tax positions. | |||||||||||||||||||
12
Second Quarter 2020 Earnings Presentation May 5, 2020
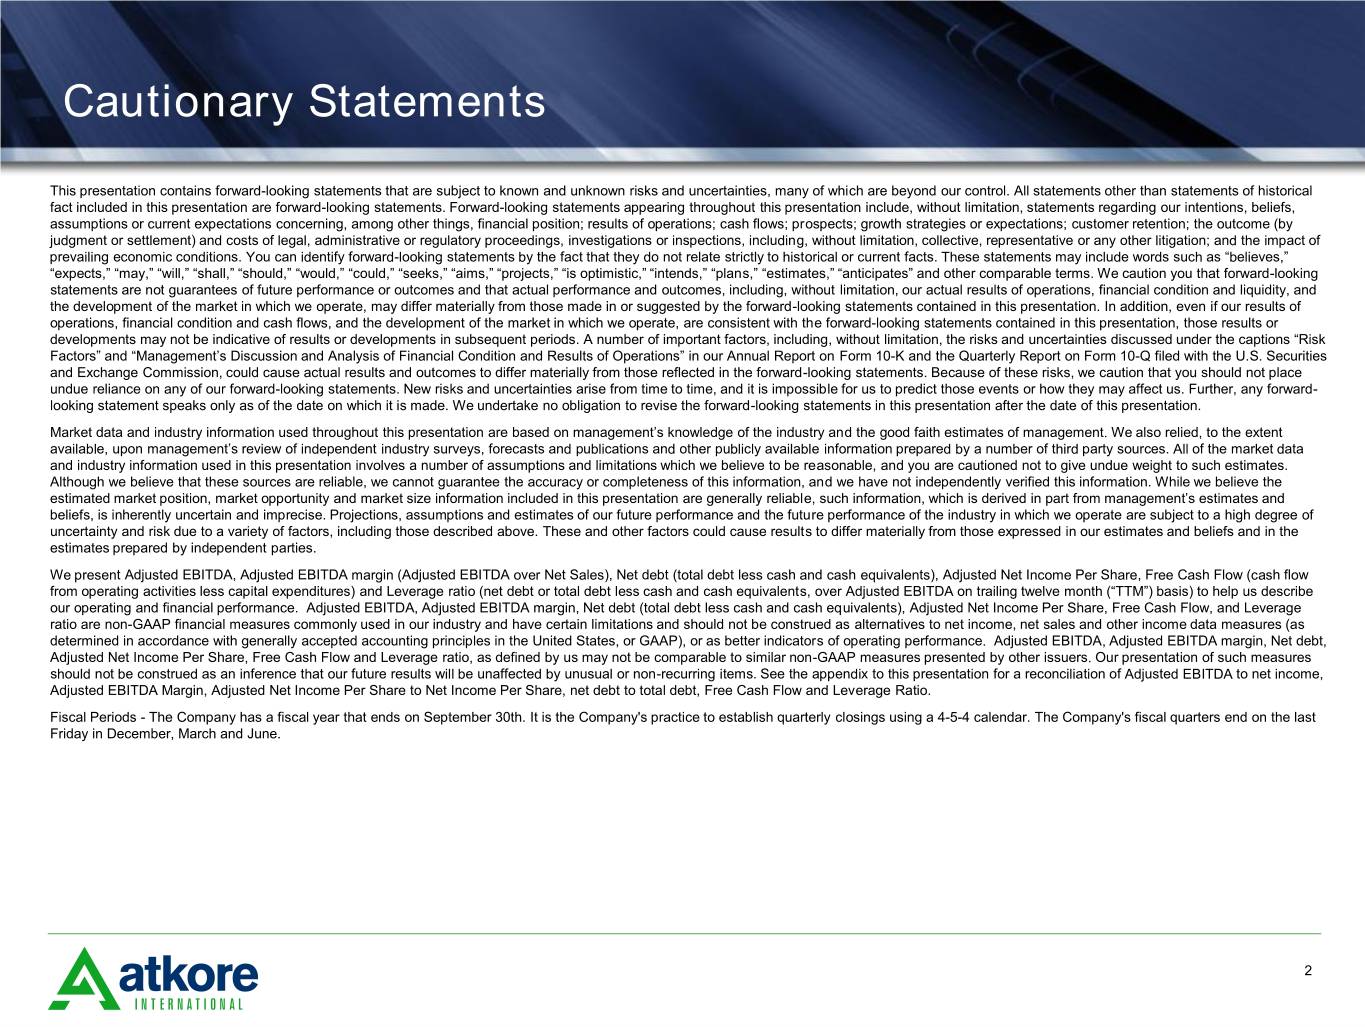
Cautionary Statements This presentation contains forward-looking statements that are subject to known and unknown risks and uncertainties, many of which are beyond our control. All statements other than statements of historical fact included in this presentation are forward-looking statements. Forward-looking statements appearing throughout this presentation include, without limitation, statements regarding our intentions, beliefs, assumptions or current expectations concerning, among other things, financial position; results of operations; cash flows; prospects; growth strategies or expectations; customer retention; the outcome (by judgment or settlement) and costs of legal, administrative or regulatory proceedings, investigations or inspections, including, without limitation, collective, representative or any other litigation; and the impact of prevailing economic conditions. You can identify forward-looking statements by the fact that they do not relate strictly to historical or current facts. These statements may include words such as “believes,” “expects,” “may,” “will,” “shall,” “should,” “would,” “could,” “seeks,” “aims,” “projects,” “is optimistic,” “intends,” “plans,” “estimates,” “anticipates” and other comparable terms. We caution you that forward-looking statements are not guarantees of future performance or outcomes and that actual performance and outcomes, including, without limitation, our actual results of operations, financial condition and liquidity, and the development of the market in which we operate, may differ materially from those made in or suggested by the forward-looking statements contained in this presentation. In addition, even if our results of operations, financial condition and cash flows, and the development of the market in which we operate, are consistent with the forward-looking statements contained in this presentation, those results or developments may not be indicative of results or developments in subsequent periods. A number of important factors, including, without limitation, the risks and uncertainties discussed under the captions “Risk Factors” and “Management’s Discussion and Analysis of Financial Condition and Results of Operations” in our Annual Report on Form 10-K and the Quarterly Report on Form 10-Q filed with the U.S. Securities and Exchange Commission, could cause actual results and outcomes to differ materially from those reflected in the forward-looking statements. Because of these risks, we caution that you should not place undue reliance on any of our forward-looking statements. New risks and uncertainties arise from time to time, and it is impossible for us to predict those events or how they may affect us. Further, any forward- looking statement speaks only as of the date on which it is made. We undertake no obligation to revise the forward-looking statements in this presentation after the date of this presentation. Market data and industry information used throughout this presentation are based on management’s knowledge of the industry and the good faith estimates of management. We also relied, to the extent available, upon management’s review of independent industry surveys, forecasts and publications and other publicly available information prepared by a number of third party sources. All of the market data and industry information used in this presentation involves a number of assumptions and limitations which we believe to be reasonable, and you are cautioned not to give undue weight to such estimates. Although we believe that these sources are reliable, we cannot guarantee the accuracy or completeness of this information, and we have not independently verified this information. While we believe the estimated market position, market opportunity and market size information included in this presentation are generally reliable, such information, which is derived in part from management’s estimates and beliefs, is inherently uncertain and imprecise. Projections, assumptions and estimates of our future performance and the future performance of the industry in which we operate are subject to a high degree of uncertainty and risk due to a variety of factors, including those described above. These and other factors could cause results to differ materially from those expressed in our estimates and beliefs and in the estimates prepared by independent parties. We present Adjusted EBITDA, Adjusted EBITDA margin (Adjusted EBITDA over Net Sales), Net debt (total debt less cash and cash equivalents), Adjusted Net Income Per Share, Free Cash Flow (cash flow from operating activities less capital expenditures) and Leverage ratio (net debt or total debt less cash and cash equivalents, over Adjusted EBITDA on trailing twelve month (“TTM”) basis) to help us describe our operating and financial performance. Adjusted EBITDA, Adjusted EBITDA margin, Net debt (total debt less cash and cash equivalents), Adjusted Net Income Per Share, Free Cash Flow, and Leverage ratio are non-GAAP financial measures commonly used in our industry and have certain limitations and should not be construed as alternatives to net income, net sales and other income data measures (as determined in accordance with generally accepted accounting principles in the United States, or GAAP), or as better indicators of operating performance. Adjusted EBITDA, Adjusted EBITDA margin, Net debt, Adjusted Net Income Per Share, Free Cash Flow and Leverage ratio, as defined by us may not be comparable to similar non-GAAP measures presented by other issuers. Our presentation of such measures should not be construed as an inference that our future results will be unaffected by unusual or non-recurring items. See the appendix to this presentation for a reconciliation of Adjusted EBITDA to net income, Adjusted EBITDA Margin, Adjusted Net Income Per Share to Net Income Per Share, net debt to total debt, Free Cash Flow and Leverage Ratio. Fiscal Periods - The Company has a fiscal year that ends on September 30th. It is the Company's practice to establish quarterly closings using a 4-5-4 calendar. The Company's fiscal quarters end on the last Friday in December, March and June. 2
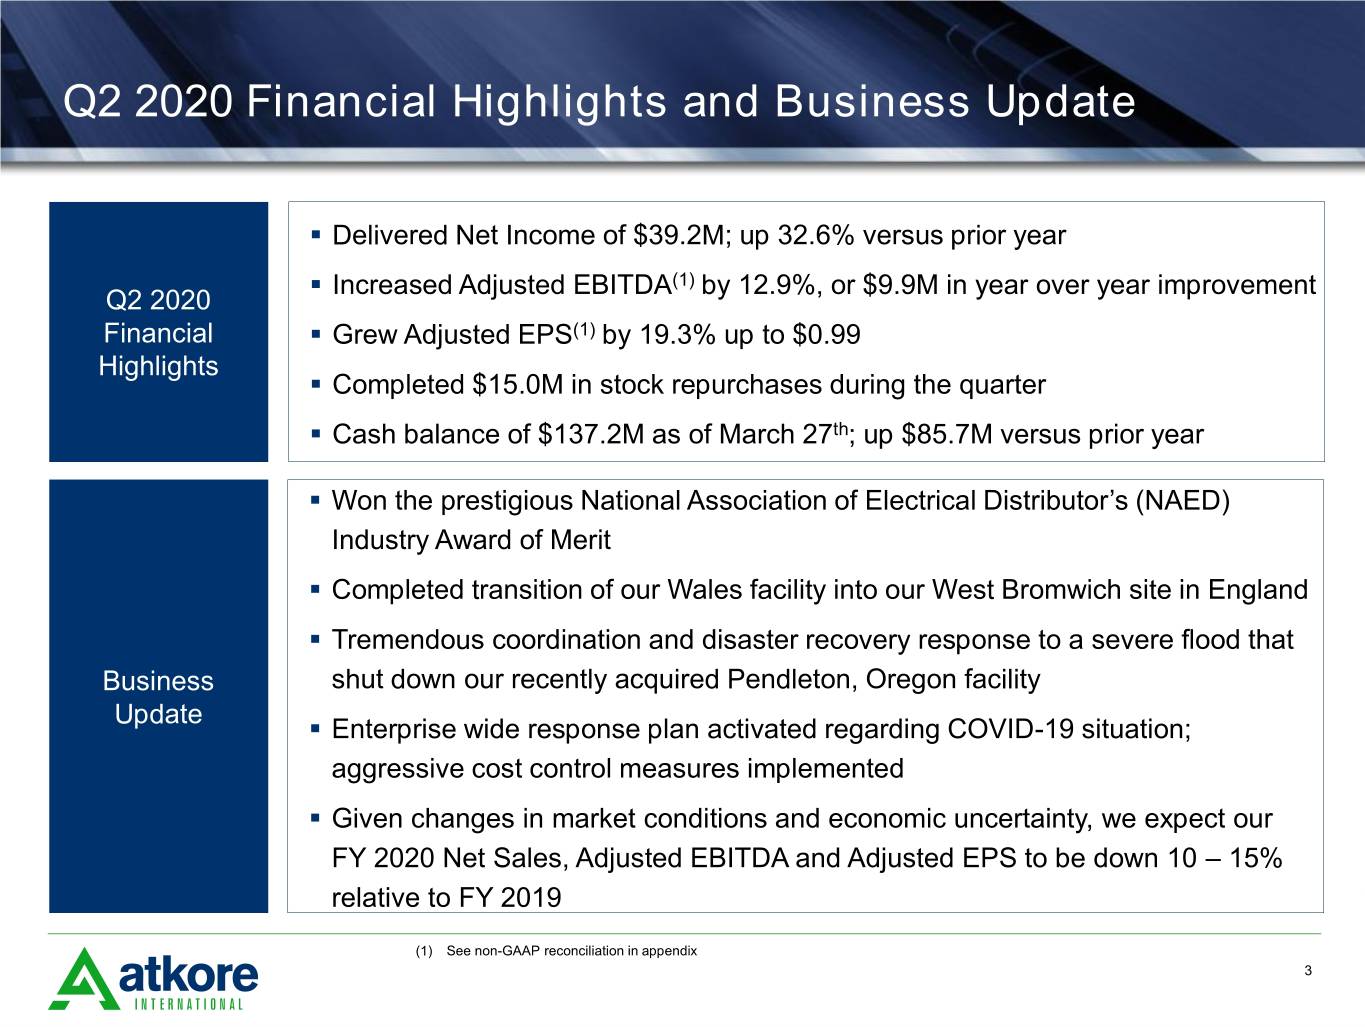
Q2 2020 Financial Highlights and Business Update ▪ Delivered Net Income of $39.2M; up 32.6% versus prior year ▪ Increased Adjusted EBITDA(1) by 12.9%, or $9.9M in year over year improvement Q2 2020 Financial ▪ Grew Adjusted EPS(1) by 19.3% up to $0.99 Highlights ▪ Completed $15.0M in stock repurchases during the quarter ▪ Cash balance of $137.2M as of March 27th; up $85.7M versus prior year ▪ Won the prestigious National Association of Electrical Distributor’s (NAED) Industry Award of Merit ▪ Completed transition of our Wales facility into our West Bromwich site in England ▪ Tremendous coordination and disaster recovery response to a severe flood that Business shut down our recently acquired Pendleton, Oregon facility Update ▪ Enterprise wide response plan activated regarding COVID-19 situation; aggressive cost control measures implemented ▪ Given changes in market conditions and economic uncertainty, we expect our FY 2020 Net Sales, Adjusted EBITDA and Adjusted EPS to be down 10 – 15% relative to FY 2019 (1) See non-GAAP reconciliation in appendix 3
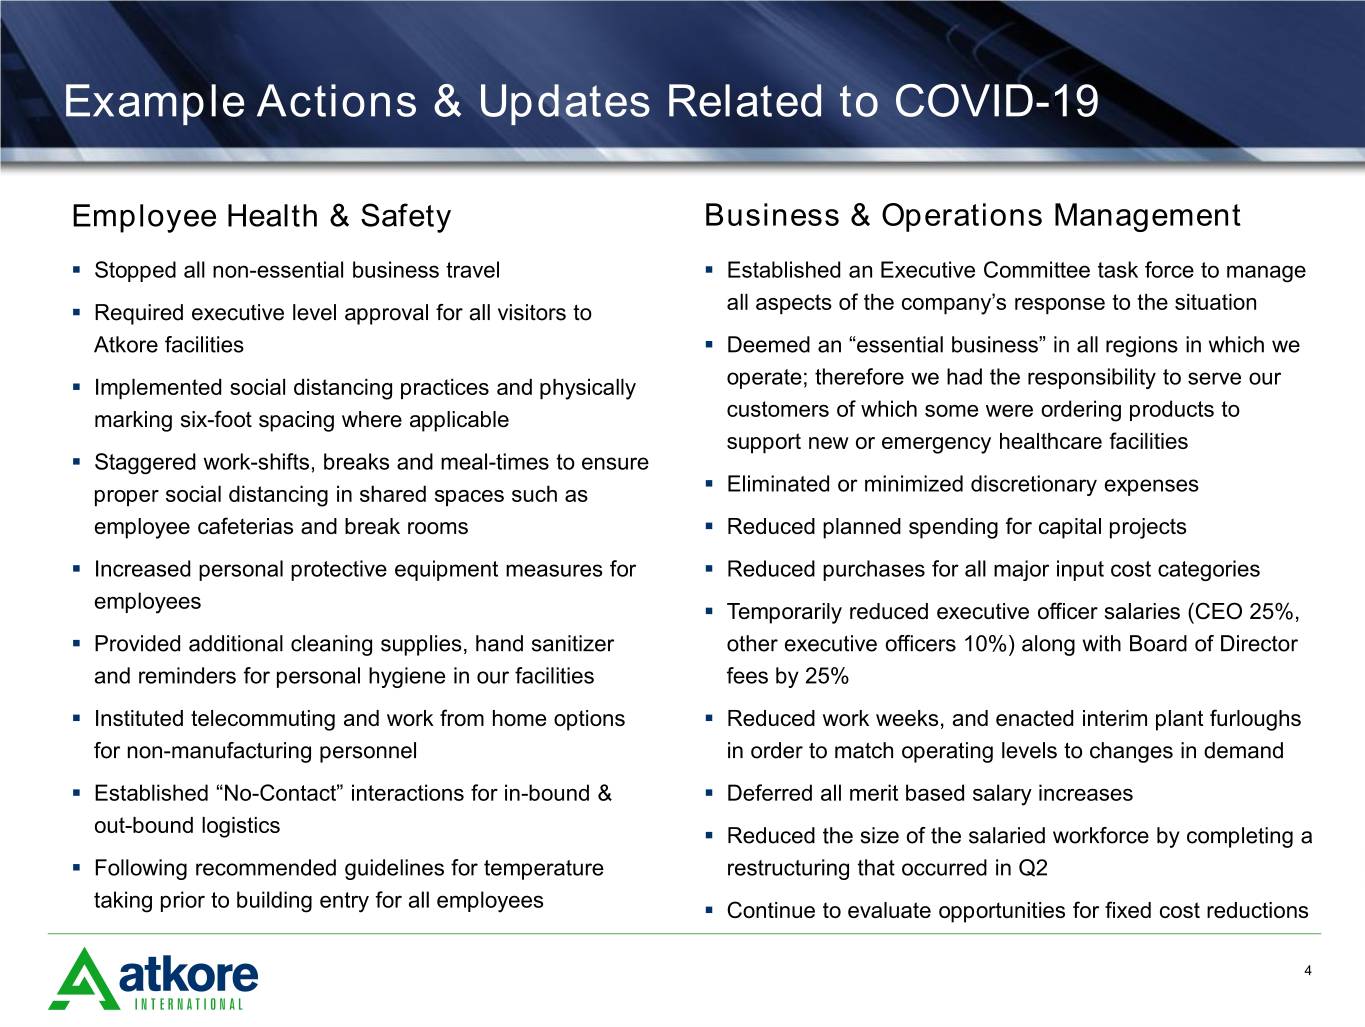
Example Actions & Updates Related to COVID-19 Employee Health & Safety Business & Operations Management ▪ Stopped all non-essential business travel ▪ Established an Executive Committee task force to manage ▪ Required executive level approval for all visitors to all aspects of the company’s response to the situation Atkore facilities ▪ Deemed an “essential business” in all regions in which we ▪ Implemented social distancing practices and physically operate; therefore we had the responsibility to serve our marking six-foot spacing where applicable customers of which some were ordering products to support new or emergency healthcare facilities ▪ Staggered work-shifts, breaks and meal-times to ensure proper social distancing in shared spaces such as ▪ Eliminated or minimized discretionary expenses employee cafeterias and break rooms ▪ Reduced planned spending for capital projects ▪ Increased personal protective equipment measures for ▪ Reduced purchases for all major input cost categories employees ▪ Temporarily reduced executive officer salaries (CEO 25%, ▪ Provided additional cleaning supplies, hand sanitizer other executive officers 10%) along with Board of Director and reminders for personal hygiene in our facilities fees by 25% ▪ Instituted telecommuting and work from home options ▪ Reduced work weeks, and enacted interim plant furloughs for non-manufacturing personnel in order to match operating levels to changes in demand ▪ Established “No-Contact” interactions for in-bound & ▪ Deferred all merit based salary increases out-bound logistics ▪ Reduced the size of the salaried workforce by completing a ▪ Following recommended guidelines for temperature restructuring that occurred in Q2 taking prior to building entry for all employees ▪ Continue to evaluate opportunities for fixed cost reductions 4
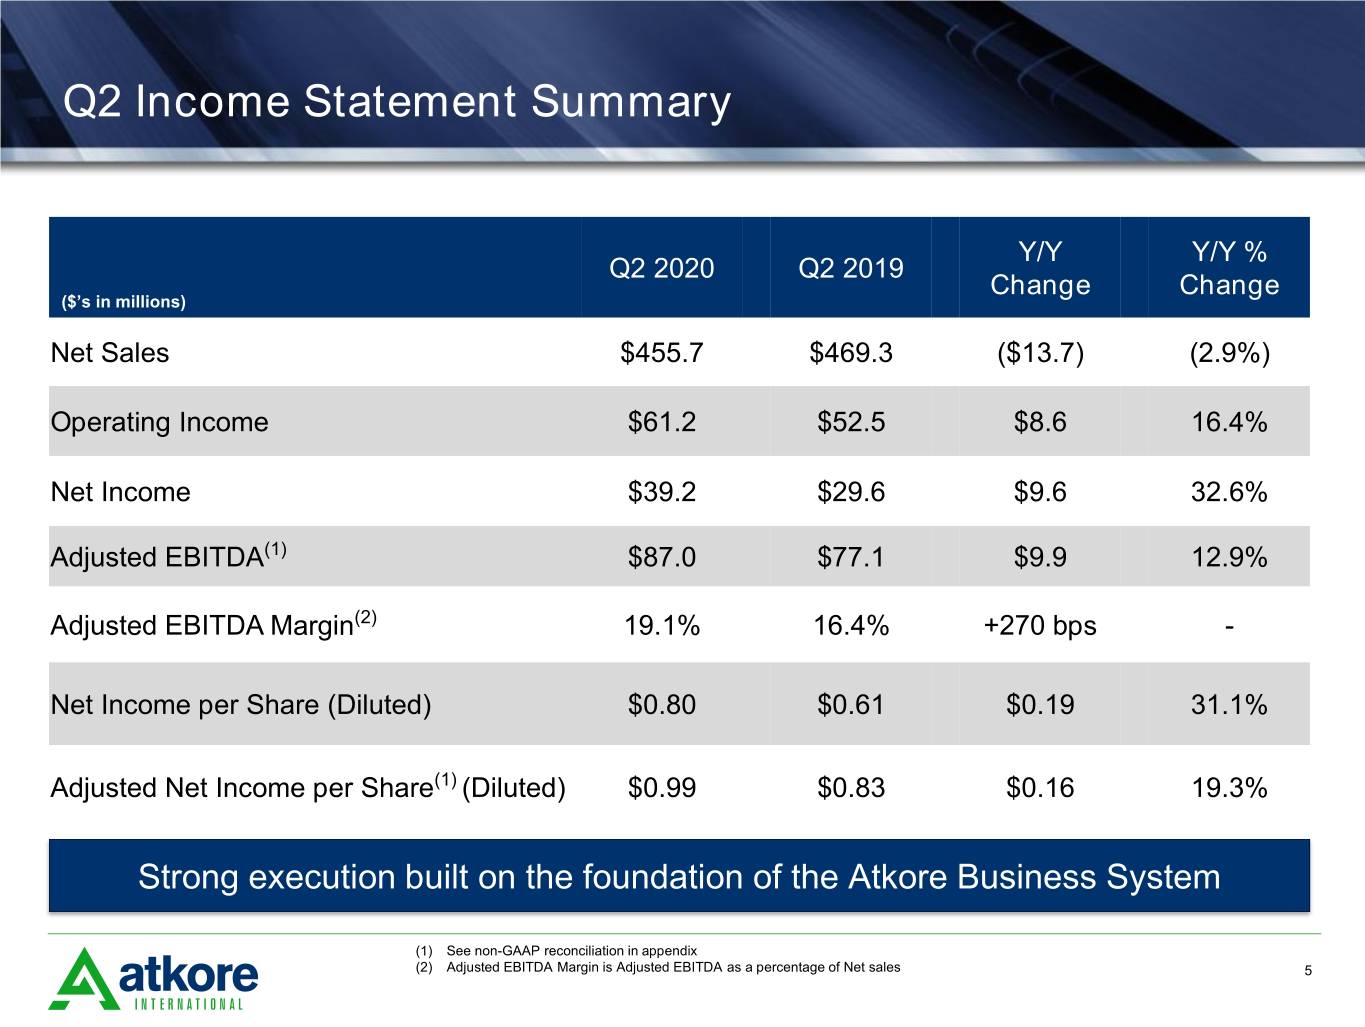
Q2 Income Statement Summary Y/Y Y/Y % Q2 2020 Q2 2019 Change Change ($’s in millions) Net Sales $455.7 $469.3 ($13.7) (2.9%) Operating Income $61.2 $52.5 $8.6 16.4% Net Income $39.2 $29.6 $9.6 32.6% Adjusted EBITDA(1) $87.0 $77.1 $9.9 12.9% Adjusted EBITDA Margin(2) 19.1% 16.4% +270 bps - Net Income per Share (Diluted) $0.80 $0.61 $0.19 31.1% Adjusted Net Income per Share(1) (Diluted) $0.99 $0.83 $0.16 19.3% Strong execution built on the foundation of the Atkore Business System (1) See non-GAAP reconciliation in appendix (2) Adjusted EBITDA Margin is Adjusted EBITDA as a percentage of Net sales 5
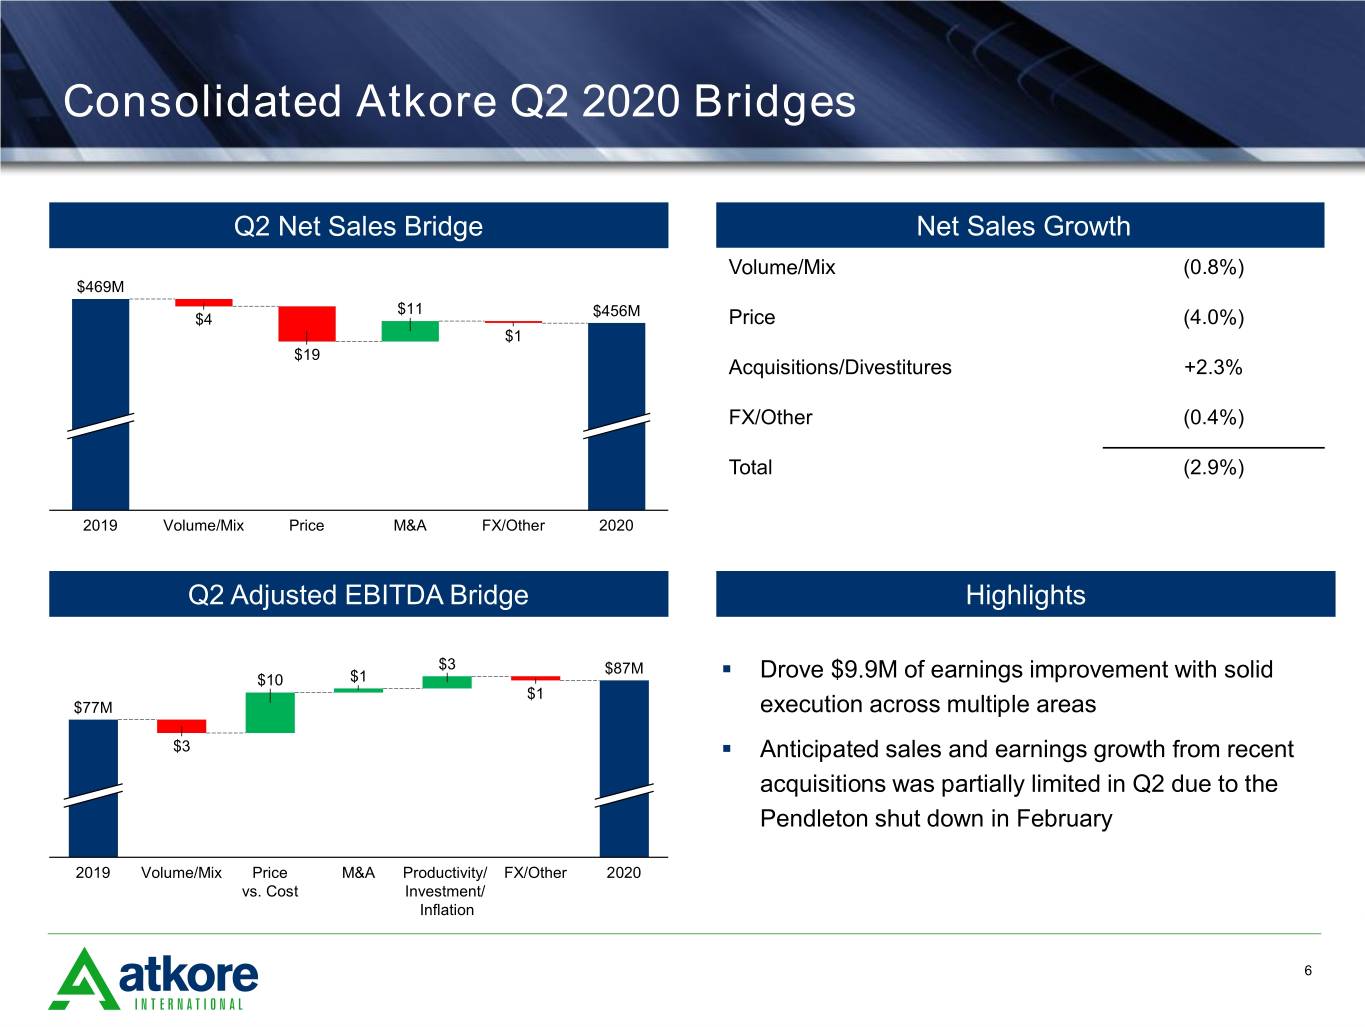
Consolidated Atkore Q2 2020 Bridges Q2 Net Sales Bridge Net Sales Growth Volume/Mix (0.8%) $469M $11 $456M $4 Price (4.0%) $1 $19 Acquisitions/Divestitures +2.3% FX/Other (0.4%) Total (2.9%) 2019 Volume/Mix Price M&A FX/Other 2020 Q2 Adjusted EBITDA Bridge Highlights $3 $87M $10 $1 ▪ Drove $9.9M of earnings improvement with solid $1 $77M execution across multiple areas $3 ▪ Anticipated sales and earnings growth from recent acquisitions was partially limited in Q2 due to the Pendleton shut down in February 2019 Volume/Mix Price M&A Productivity/ FX/Other 2020 vs. Cost Investment/ Inflation 6
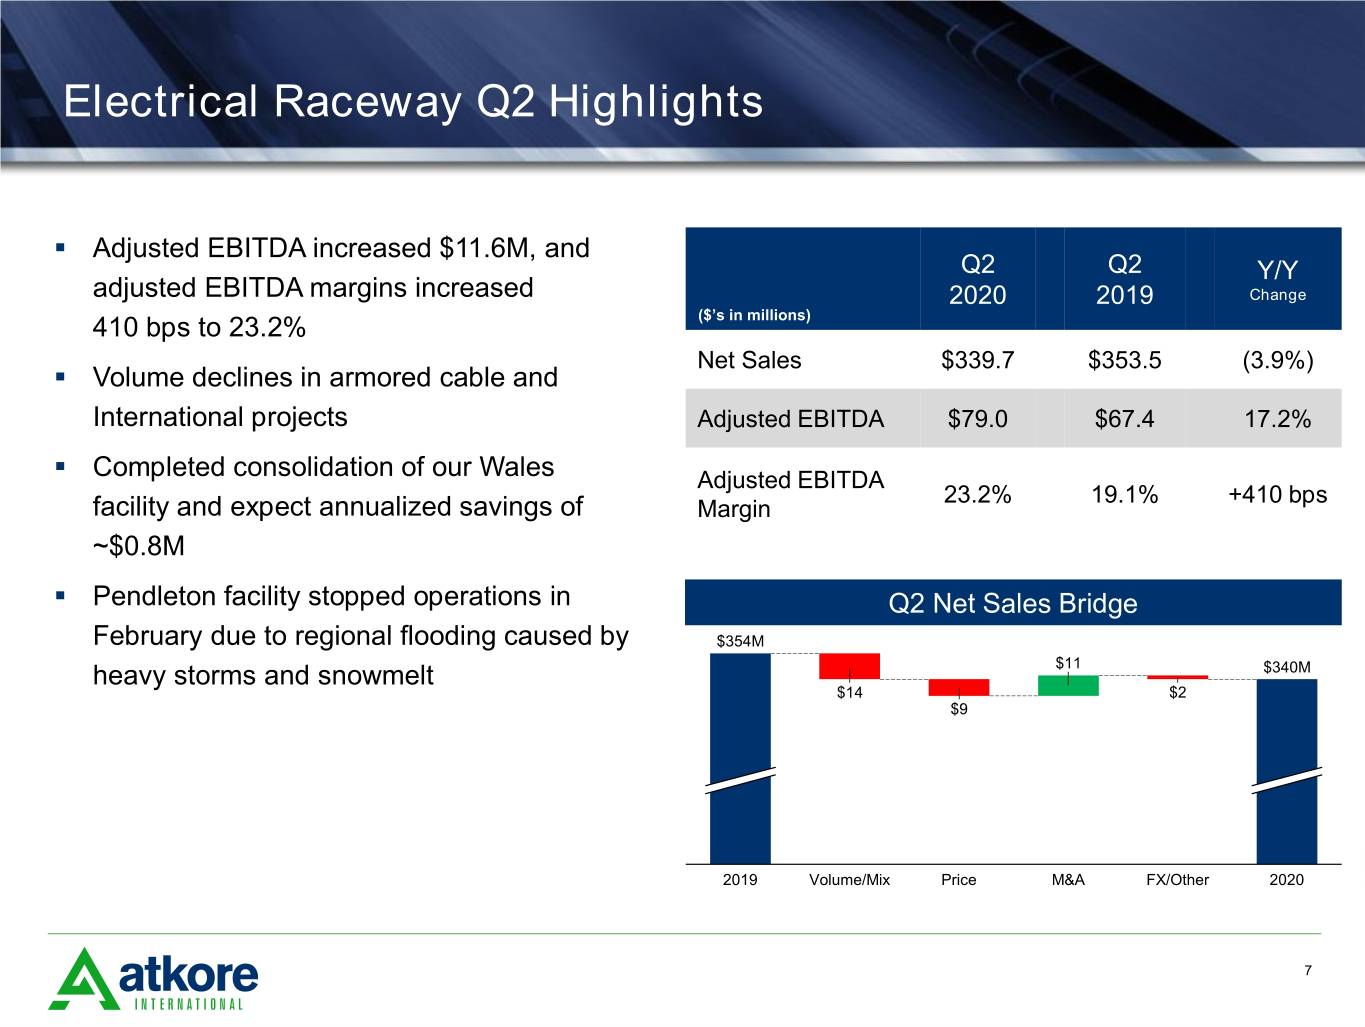
Electrical Raceway Q2 Highlights ▪ Adjusted EBITDA increased $11.6M, and Q2 Q2 Y/Y adjusted EBITDA margins increased 2020 2019 Change 410 bps to 23.2% ($’s in millions) Net Sales $339.7 $353.5 (3.9%) ▪ Volume declines in armored cable and International projects Adjusted EBITDA $79.0 $67.4 17.2% ▪ Completed consolidation of our Wales Adjusted EBITDA 23.2% 19.1% +410 bps facility and expect annualized savings of Margin ~$0.8M ▪ Pendleton facility stopped operations in Q2 Net Sales Bridge February due to regional flooding caused by $354M heavy storms and snowmelt $11 $340M $14 $2 $9 2019 Volume/Mix Price M&A FX/Other 2020 7
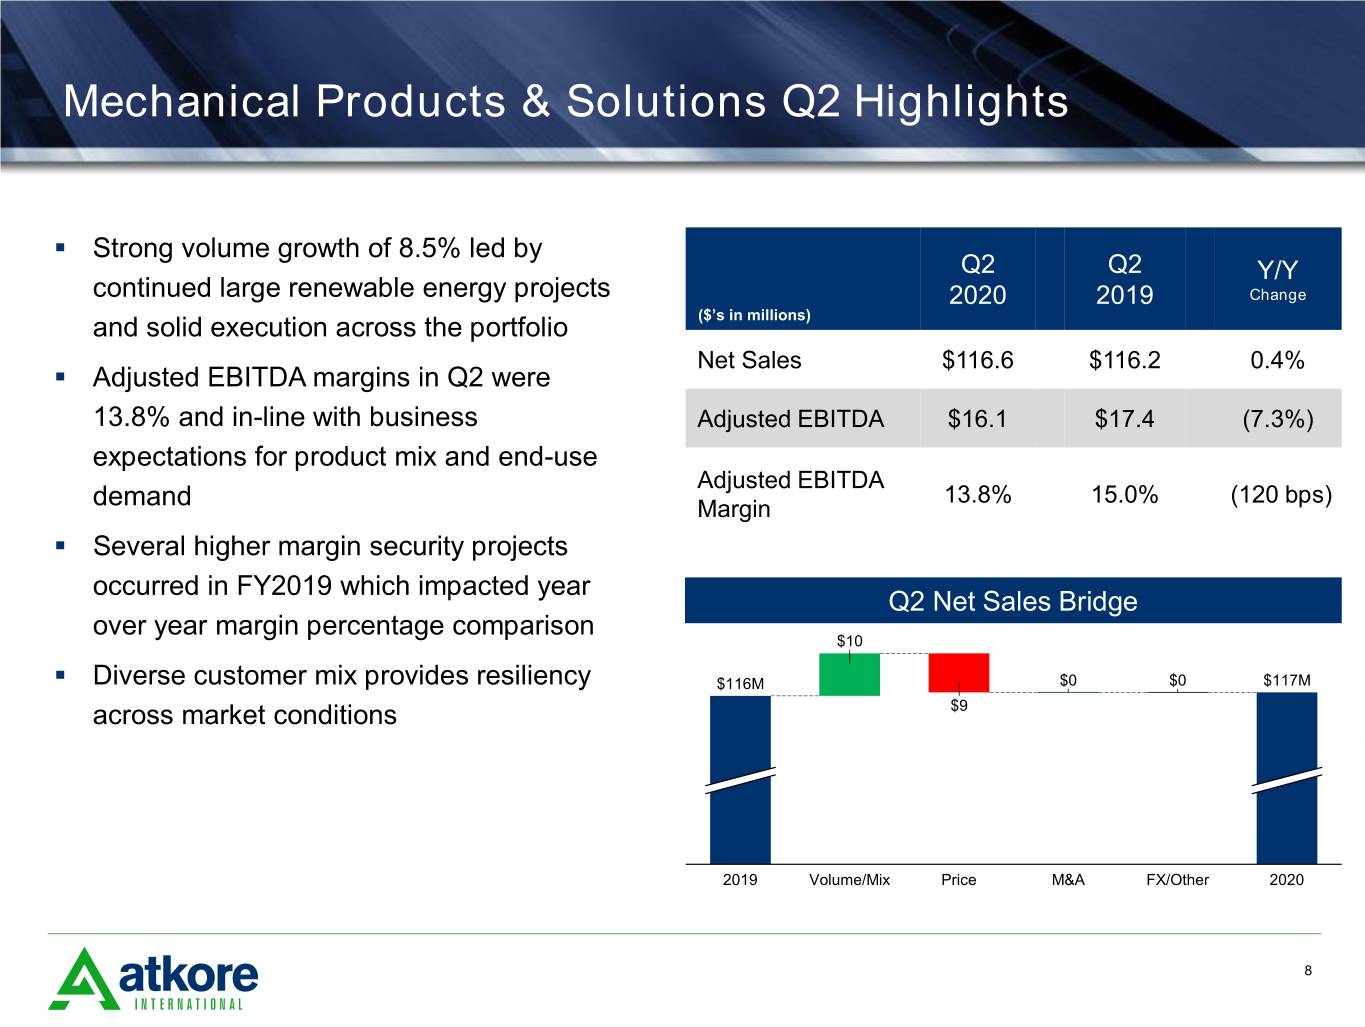
Mechanical Products & Solutions Q2 Highlights ▪ Strong volume growth of 8.5% led by Q2 Q2 Y/Y continued large renewable energy projects 2020 2019 Change and solid execution across the portfolio ($’s in millions) Net Sales $116.6 $116.2 0.4% ▪ Adjusted EBITDA margins in Q2 were 13.8% and in-line with business Adjusted EBITDA $16.1 $17.4 (7.3%) expectations for product mix and end-use Adjusted EBITDA 13.8% 15.0% (120 bps) demand Margin ▪ Several higher margin security projects occurred in FY2019 which impacted year Q2 Net Sales Bridge over year margin percentage comparison $10 ▪ Diverse customer mix provides resiliency $116M $0 $0 $117M across market conditions $9 2019 Volume/Mix Price M&A FX/Other 2020 8
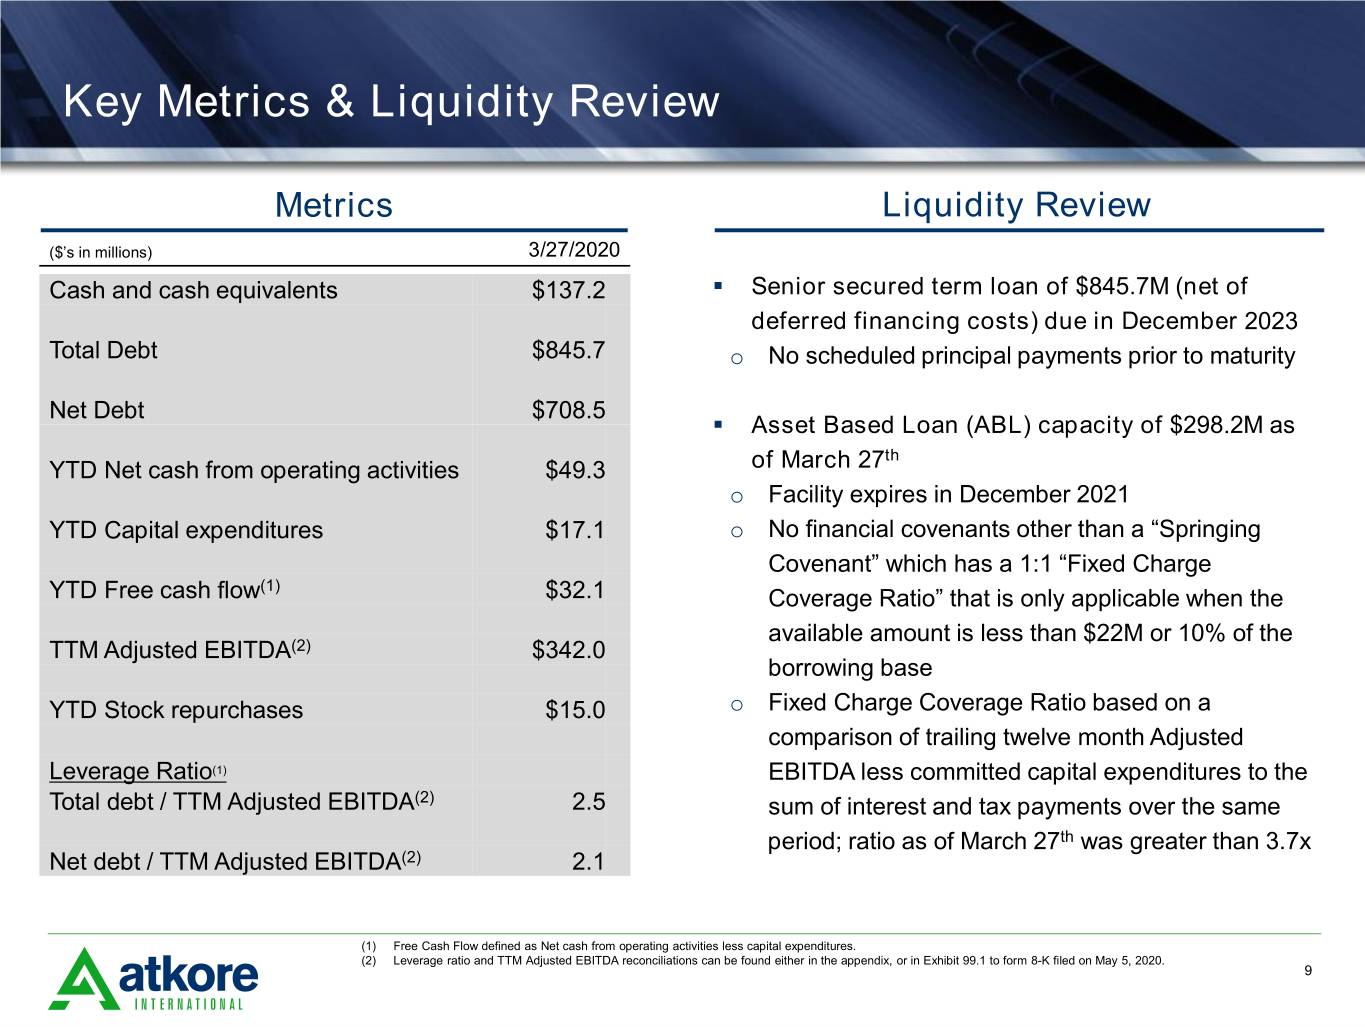
Key Metrics & Liquidity Review Metrics Liquidity Review ($’s in millions) 3/27/2020 Cash and cash equivalents $137.2 ▪ Senior secured term loan of $845.7M (net of deferred financing costs) due in December 2023 Total Debt $845.7 o No scheduled principal payments prior to maturity Net Debt $708.5 ▪ Asset Based Loan (ABL) capacity of $298.2M as th YTD Net cash from operating activities $49.3 of March 27 o Facility expires in December 2021 YTD Capital expenditures $17.1 o No financial covenants other than a “Springing Covenant” which has a 1:1 “Fixed Charge (1) YTD Free cash flow $32.1 Coverage Ratio” that is only applicable when the available amount is less than $22M or 10% of the TTM Adjusted EBITDA(2) $342.0 borrowing base YTD Stock repurchases $15.0 o Fixed Charge Coverage Ratio based on a comparison of trailing twelve month Adjusted Leverage Ratio(1) EBITDA less committed capital expenditures to the Total debt / TTM Adjusted EBITDA(2) 2.5 sum of interest and tax payments over the same period; ratio as of March 27th was greater than 3.7x Net debt / TTM Adjusted EBITDA(2) 2.1 (1) Free Cash Flow defined as Net cash from operating activities less capital expenditures. (2) Leverage ratio and TTM Adjusted EBITDA reconciliations can be found either in the appendix, or in Exhibit 99.1 to form 8-K filed on May 5, 2020. 9
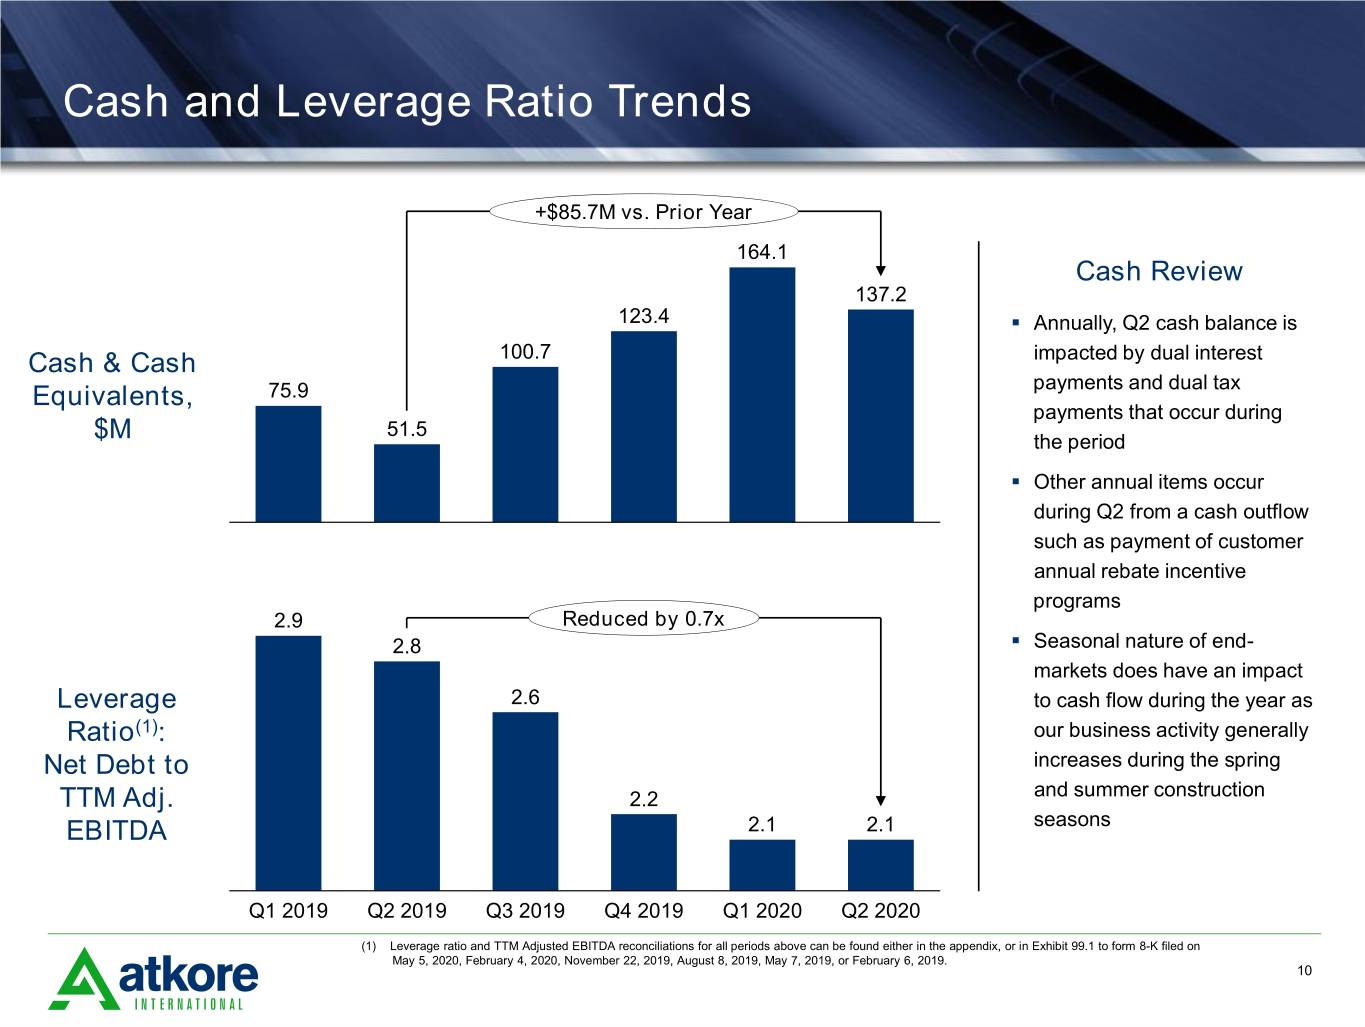
Cash and Leverage Ratio Trends +$85.7M vs. Prior Year 164.1 Cash Review 137.2 123.4 ▪ Annually, Q2 cash balance is Cash & Cash 100.7 impacted by dual interest payments and dual tax Equivalents, 75.9 payments that occur during 51.5 $M the period ▪ Other annual items occur during Q2 from a cash outflow such as payment of customer annual rebate incentive programs 2.9 Reduced by 0.7x 2.8 ▪ Seasonal nature of end- markets does have an impact Leverage 2.6 to cash flow during the year as Ratio(1): our business activity generally Net Debt to increases during the spring TTM Adj. 2.2 and summer construction EBITDA 2.1 2.1 seasons Q1 2019 Q2 2019 Q3 2019 Q4 2019 Q1 2020 Q2 2020 (1) Leverage ratio and TTM Adjusted EBITDA reconciliations for all periods above can be found either in the appendix, or in Exhibit 99.1 to form 8-K filed on May 5, 2020, February 4, 2020, November 22, 2019, August 8, 2019, May 7, 2019, or February 6, 2019. 10
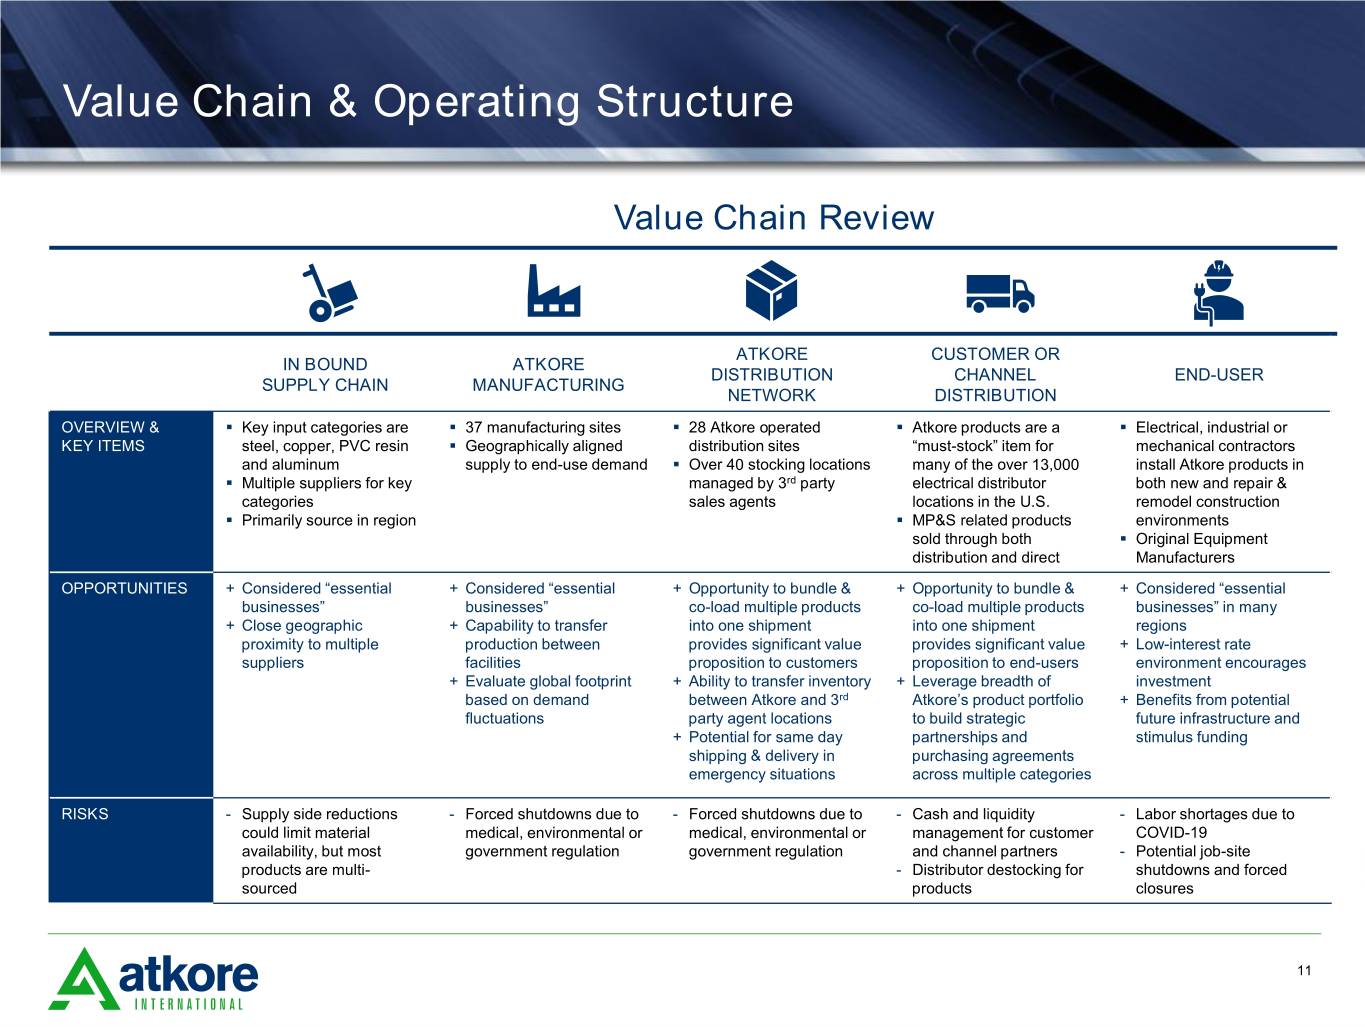
Value Chain & Operating Structure Value Chain Review ATKORE CUSTOMER OR IN BOUND ATKORE DISTRIBUTION CHANNEL END-USER SUPPLY CHAIN MANUFACTURING NETWORK DISTRIBUTION OVERVIEW & ▪ Key input categories are ▪ 37 manufacturing sites ▪ 28 Atkore operated ▪ Atkore products are a ▪ Electrical, industrial or KEY ITEMS steel, copper, PVC resin ▪ Geographically aligned distribution sites “must-stock” item for mechanical contractors and aluminum supply to end-use demand ▪ Over 40 stocking locations many of the over 13,000 install Atkore products in ▪ Multiple suppliers for key managed by 3rd party electrical distributor both new and repair & categories sales agents locations in the U.S. remodel construction ▪ Primarily source in region ▪ MP&S related products environments sold through both ▪ Original Equipment distribution and direct Manufacturers OPPORTUNITIES + Considered “essential + Considered “essential + Opportunity to bundle & + Opportunity to bundle & + Considered “essential businesses” businesses” co-load multiple products co-load multiple products businesses” in many + Close geographic + Capability to transfer into one shipment into one shipment regions proximity to multiple production between provides significant value provides significant value + Low-interest rate suppliers facilities proposition to customers proposition to end-users environment encourages + Evaluate global footprint + Ability to transfer inventory + Leverage breadth of investment based on demand between Atkore and 3rd Atkore’s product portfolio + Benefits from potential fluctuations party agent locations to build strategic future infrastructure and + Potential for same day partnerships and stimulus funding shipping & delivery in purchasing agreements emergency situations across multiple categories RISKS - Supply side reductions - Forced shutdowns due to - Forced shutdowns due to - Cash and liquidity - Labor shortages due to could limit material medical, environmental or medical, environmental or management for customer COVID-19 availability, but most government regulation government regulation and channel partners - Potential job-site products are multi- - Distributor destocking for shutdowns and forced sourced products closures 11
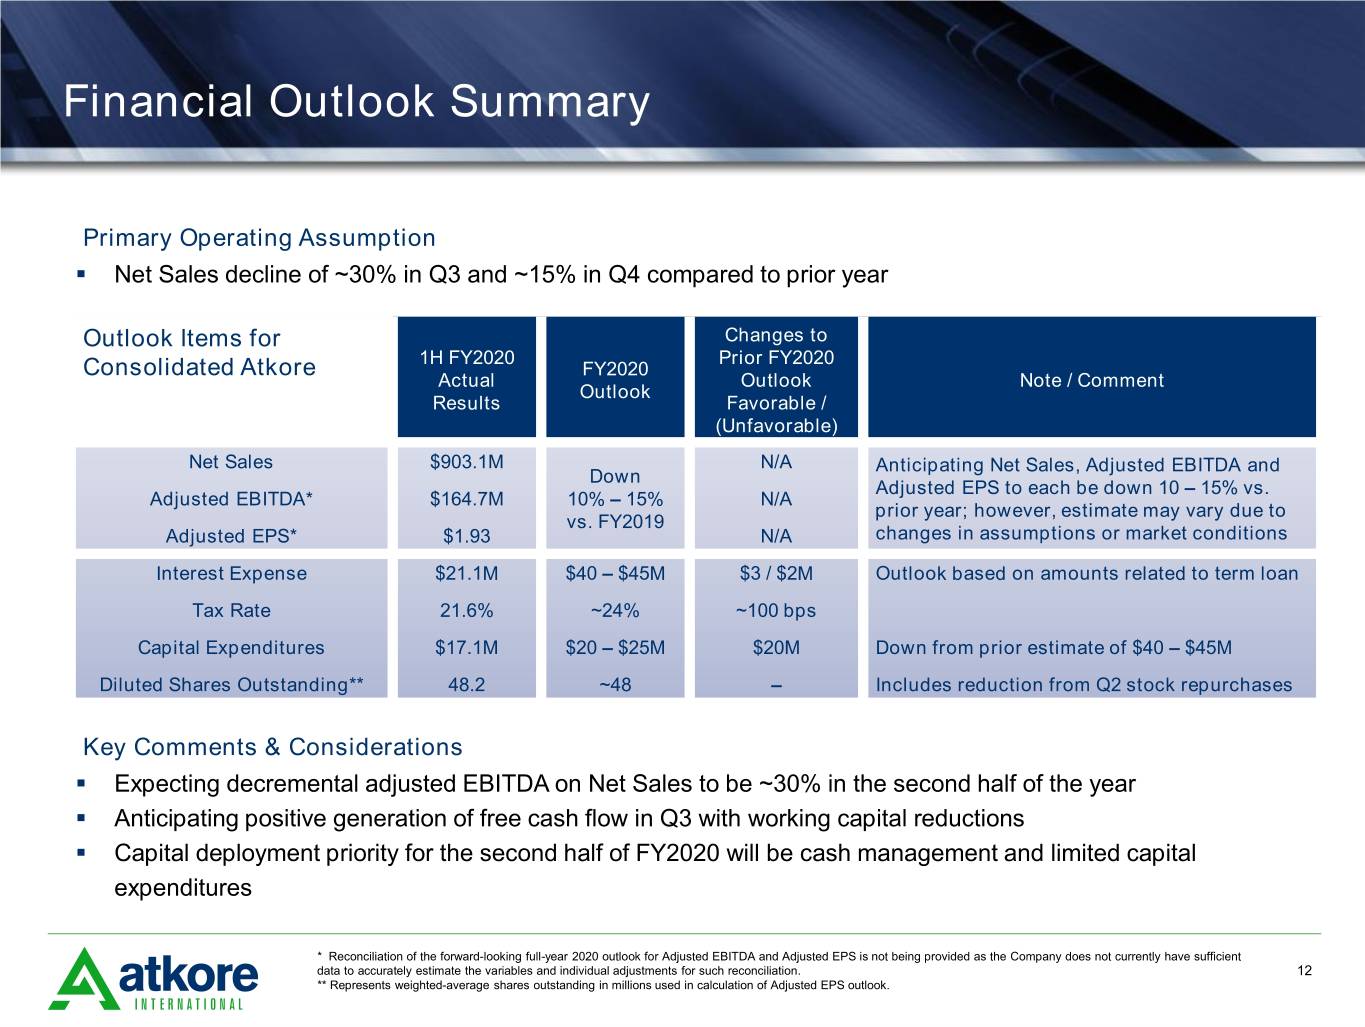
Financial Outlook Summary Primary Operating Assumption ▪ Net Sales decline of ~30% in Q3 and ~15% in Q4 compared to prior year Outlook Items for Changes to 1H FY2020 Prior FY2020 Consolidated Atkore FY2020 Actual Outlook Note / Comment Outlook Results Favorable / (Unfavorable) Net Sales $903.1M N/A Anticipating Net Sales, Adjusted EBITDA and Down Adjusted EPS to each be down 10 – 15% vs. Adjusted EBITDA* $164.7M 10% – 15% N/A prior year; however, estimate may vary due to vs. FY2019 Adjusted EPS* $1.93 N/A changes in assumptions or market conditions Interest Expense $21.1M $40 – $45M $3 / $2M Outlook based on amounts related to term loan Tax Rate 21.6% ~24% ~100 bps Capital Expenditures $17.1M $20 – $25M $20M Down from prior estimate of $40 – $45M Diluted Shares Outstanding** 48.2 ~48 – Includes reduction from Q2 stock repurchases Key Comments & Considerations ▪ Expecting decremental adjusted EBITDA on Net Sales to be ~30% in the second half of the year ▪ Anticipating positive generation of free cash flow in Q3 with working capital reductions ▪ Capital deployment priority for the second half of FY2020 will be cash management and limited capital expenditures * Reconciliation of the forward-looking full-year 2020 outlook for Adjusted EBITDA and Adjusted EPS is not being provided as the Company does not currently have sufficient data to accurately estimate the variables and individual adjustments for such reconciliation. 12 ** Represents weighted-average shares outstanding in millions used in calculation of Adjusted EPS outlook.
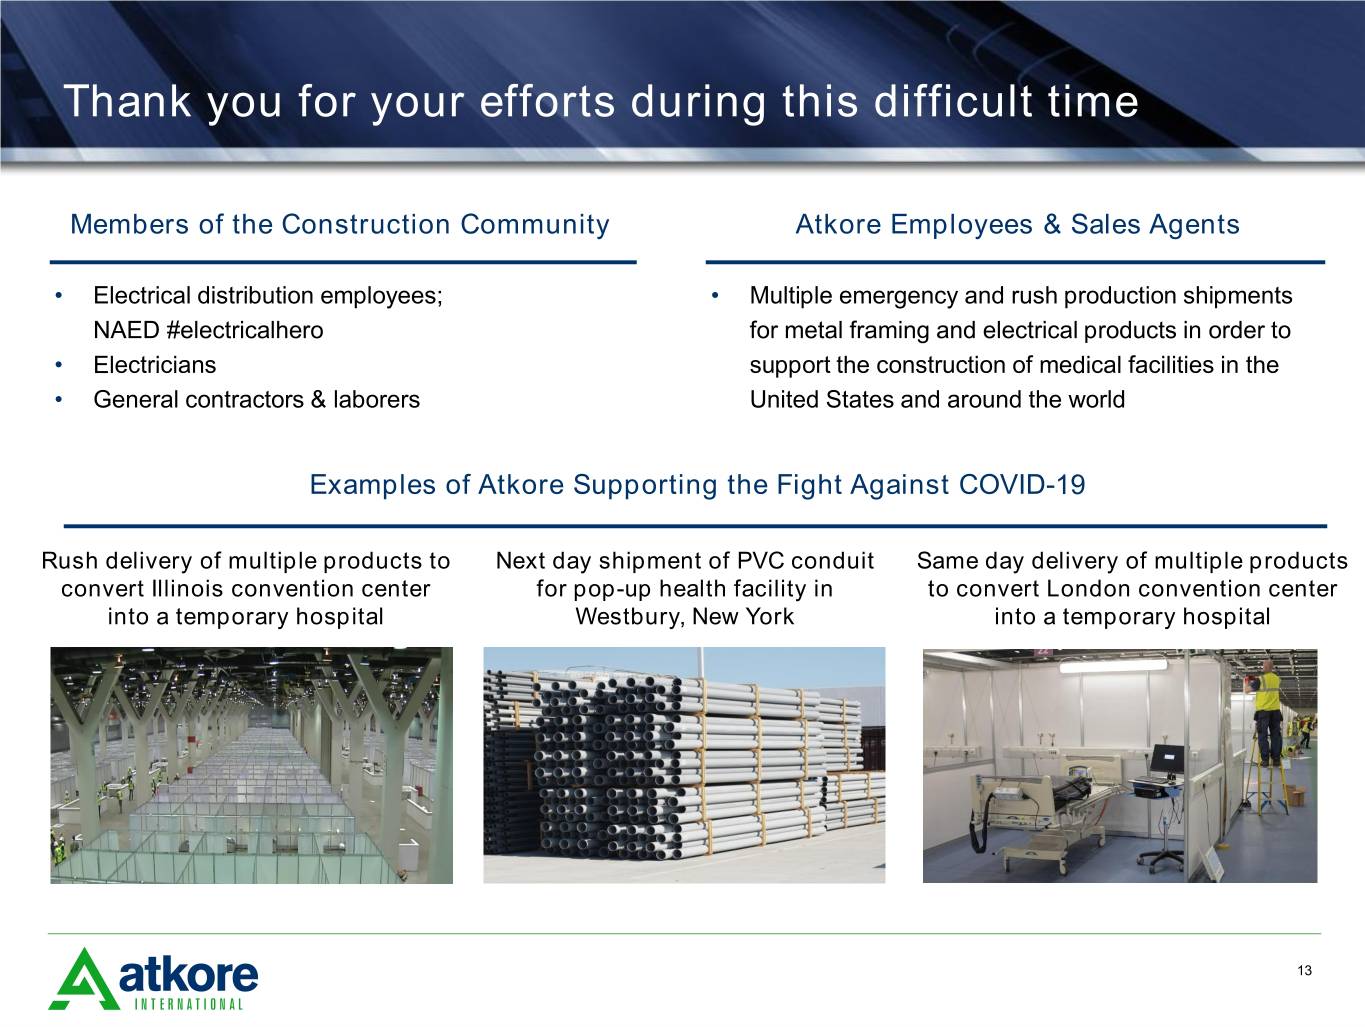
Thank you for your efforts during this difficult time Members of the Construction Community Atkore Employees & Sales Agents • Electrical distribution employees; • Multiple emergency and rush production shipments NAED #electricalhero for metal framing and electrical products in order to • Electricians support the construction of medical facilities in the • General contractors & laborers United States and around the world Examples of Atkore Supporting the Fight Against COVID-19 Rush delivery of multiple products to Next day shipment of PVC conduit Same day delivery of multiple products convert Illinois convention center for pop-up health facility in to convert London convention center into a temporary hospital Westbury, New York into a temporary hospital 13
Questions? Thank You!
Appendix
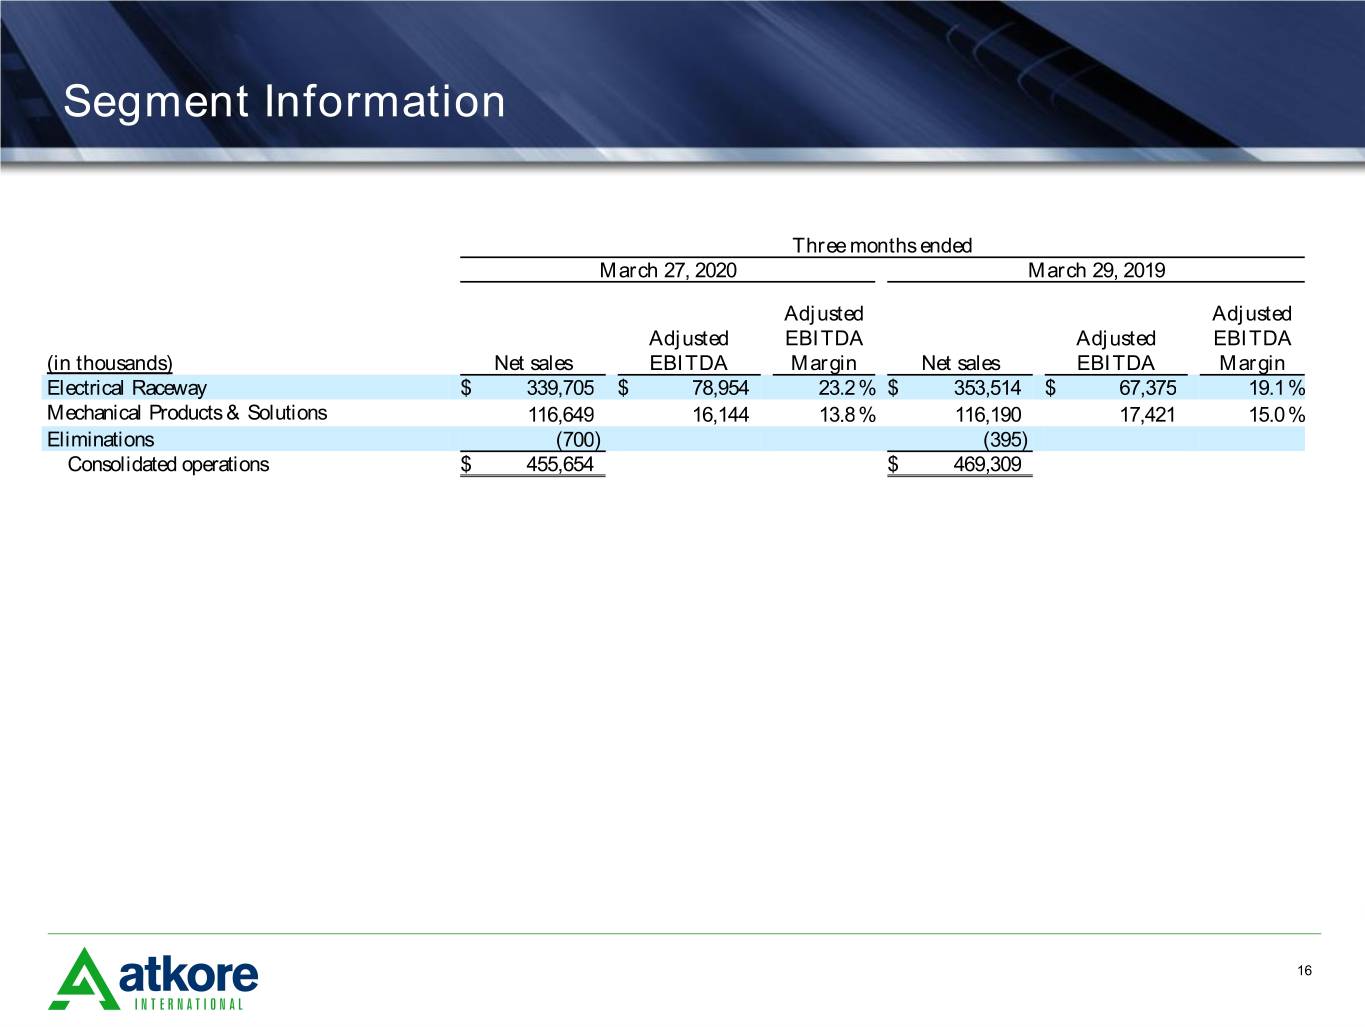
Segment Information Three months ended March 27, 2020 March 29, 2019 Adjusted Adjusted Adjusted EBITDA Adjusted EBITDA (in thousands) Net sales EBITDA Margin Net sales EBITDA Margin Electrical Raceway $ 339,705 $ 78,954 23.2 % $ 353,514 $ 67,375 19.1 % Mechanical Products & Solutions 116,649 16,144 13.8 % 116,190 17,421 15.0 % Eliminations (700) (395) Consolidated operations $ 455,654 $ 469,309 16
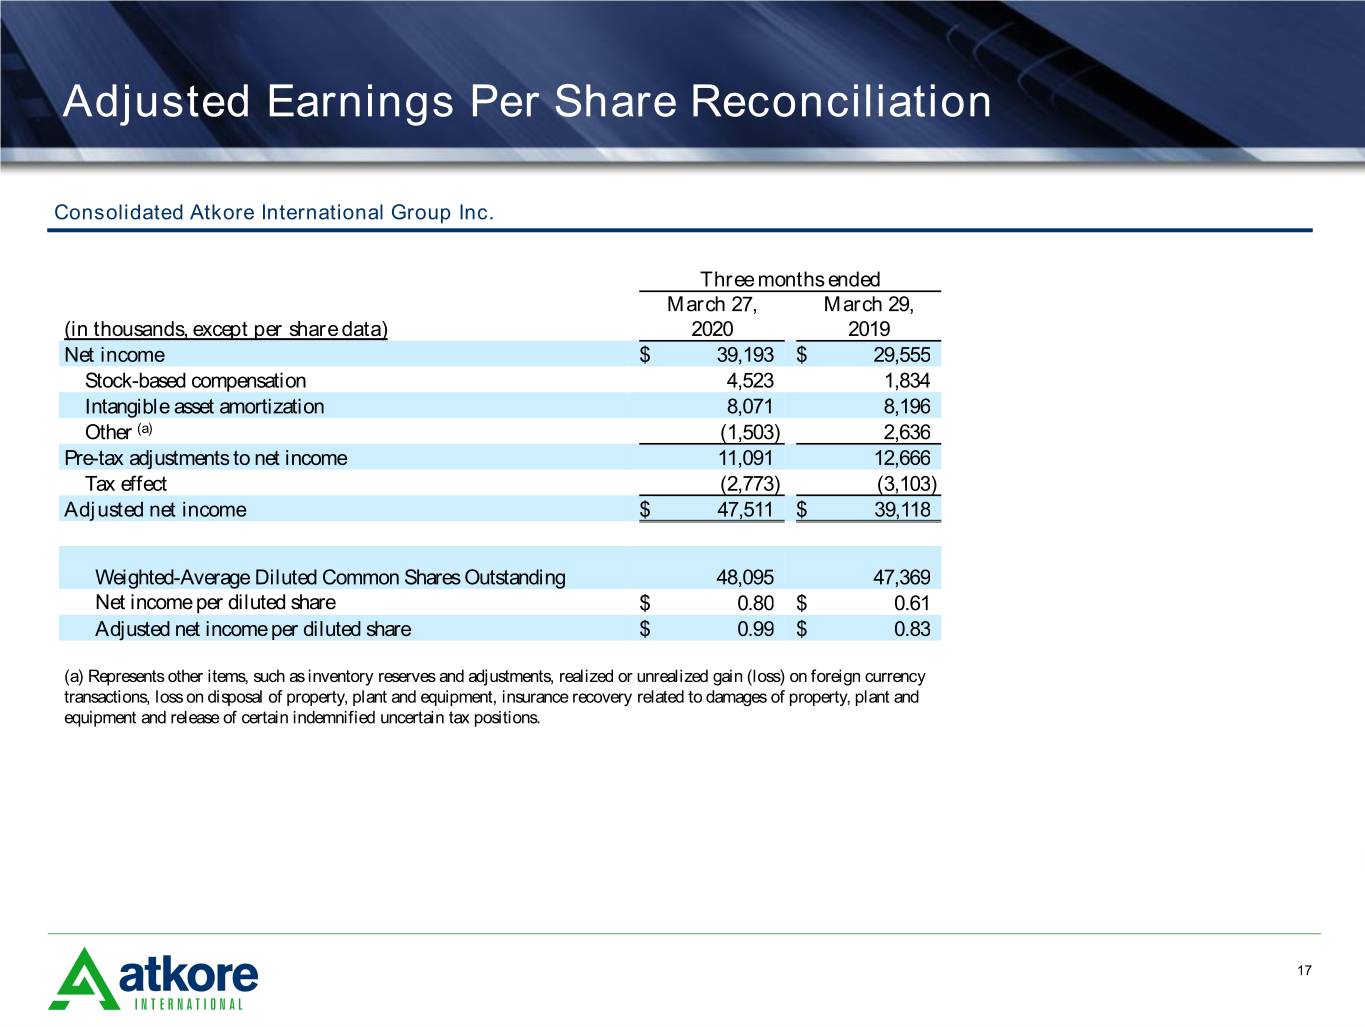
Adjusted Earnings Per Share Reconciliation Consolidated Atkore International Group Inc. Three months ended March 27, March 29, (in thousands, except per share data) 2020 2019 Net income $ 39,193 $ 29,555 Stock-based compensation 4,523 1,834 Intangible asset amortization 8,071 8,196 Other (a) (1,503) 2,636 Pre-tax adjustments to net income 11,091 12,666 Tax effect (2,773) (3,103) Adjusted net income $ 47,511 $ 39,118 Weighted-Average Diluted Common Shares Outstanding 48,095 47,369 Net income per diluted share $ 0.80 $ 0.61 Adjusted net income per diluted share $ 0.99 $ 0.83 (a) Represents other items, such as inventory reserves and adjustments, realized or unrealized gain (loss) on foreign currency transactions, loss on disposal of property, plant and equipment, insurance recovery related to damages of property, plant and equipment and release of certain indemnified uncertain tax positions. 17
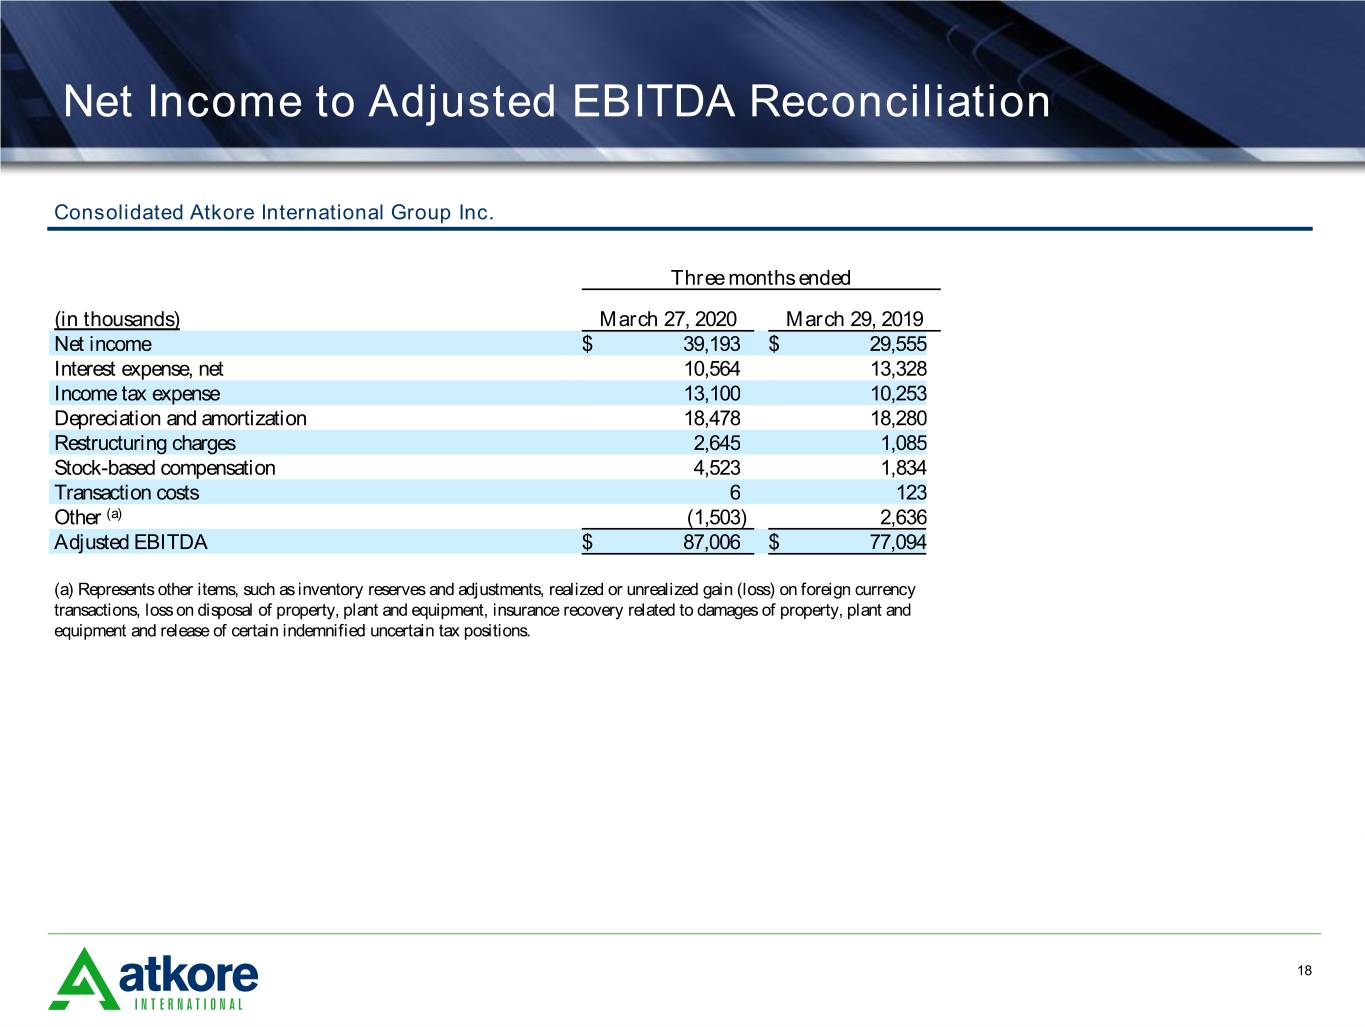
Net Income to Adjusted EBITDA Reconciliation Consolidated Atkore International Group Inc. Three months ended (in thousands) March 27, 2020 March 29, 2019 Net income $ 39,193 $ 29,555 Interest expense, net 10,564 13,328 Income tax expense 13,100 10,253 Depreciation and amortization 18,478 18,280 Restructuring charges 2,645 1,085 Stock-based compensation 4,523 1,834 Transaction costs 6 123 Other (a) (1,503) 2,636 Adjusted EBITDA $ 87,006 $ 77,094 (a) Represents other items, such as inventory reserves and adjustments, realized or unrealized gain (loss) on foreign currency transactions, loss on disposal of property, plant and equipment, insurance recovery related to damages of property, plant and equipment and release of certain indemnified uncertain tax positions. 18
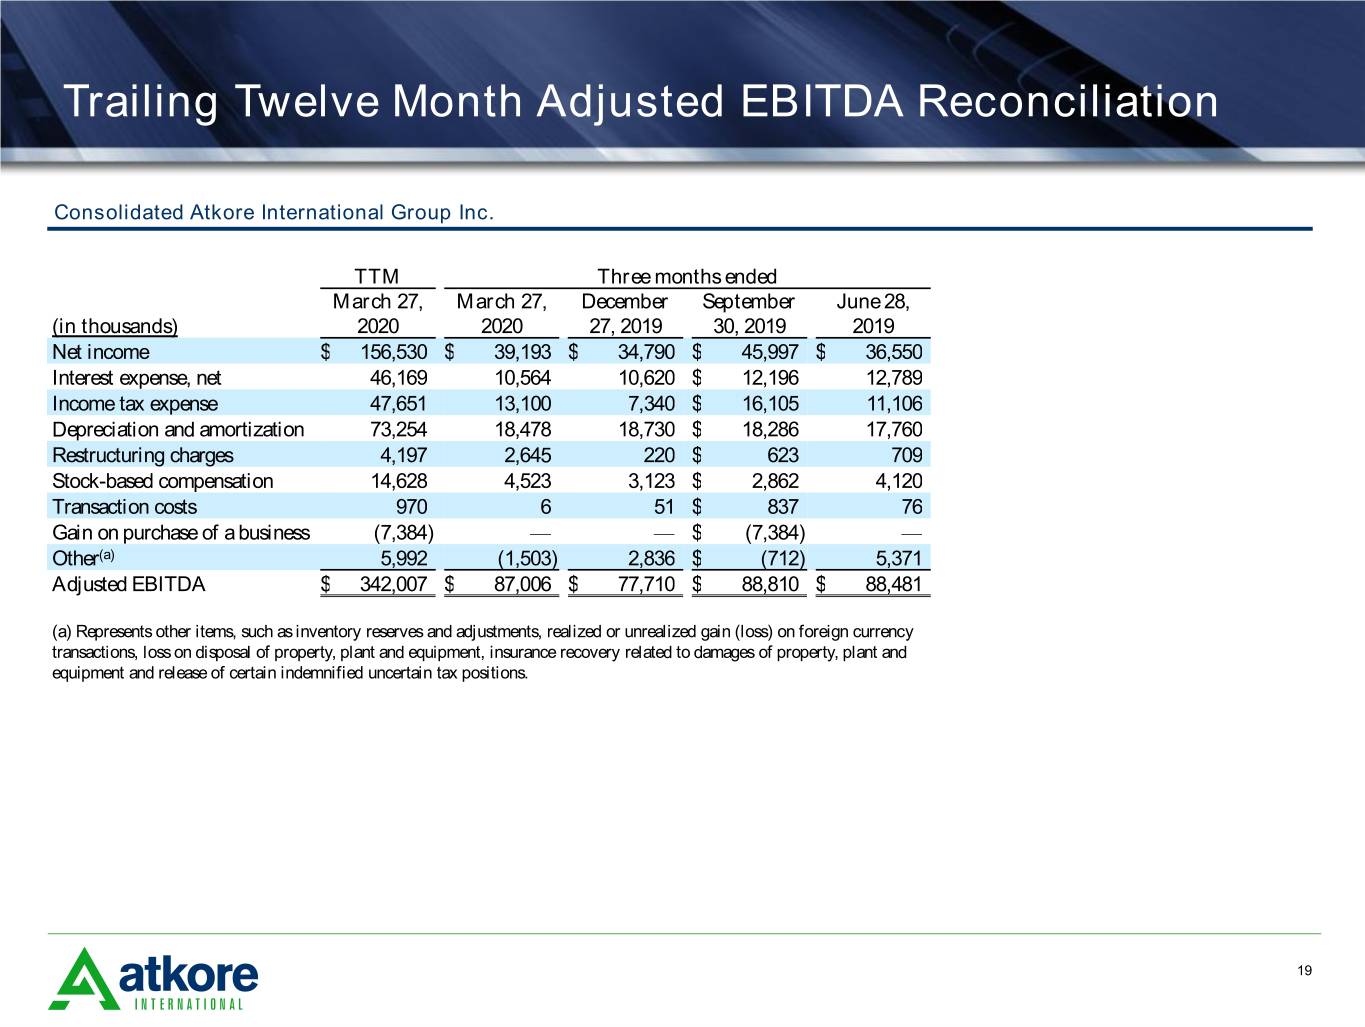
Trailing Twelve Month Adjusted EBITDA Reconciliation Consolidated Atkore International Group Inc. TTM Three months ended March 27, March 27, December September June 28, (in thousands) 2020 2020 27, 2019 30, 2019 2019 Net income $ 156,530 $ 39,193 $ 34,790 $ 45,997 $ 36,550 Interest expense, net 46,169 10,564 10,620 $ 12,196 12,789 Income tax expense 47,651 13,100 7,340 $ 16,105 11,106 Depreciation and amortization 73,254 18,478 18,730 $ 18,286 17,760 Restructuring charges 4,197 2,645 220 $ 623 709 Stock-based compensation 14,628 4,523 3,123 $ 2,862 4,120 Transaction costs 970 6 51 $ 837 76 Gain on purchase of a business (7,384) — — $ (7,384) — Other(a) 5,992 (1,503) 2,836 $ (712) 5,371 Adjusted EBITDA $ 342,007 $ 87,006 $ 77,710 $ 88,810 $ 88,481 (a) Represents other items, such as inventory reserves and adjustments, realized or unrealized gain (loss) on foreign currency transactions, loss on disposal of property, plant and equipment, insurance recovery related to damages of property, plant and equipment and release of certain indemnified uncertain tax positions. 19
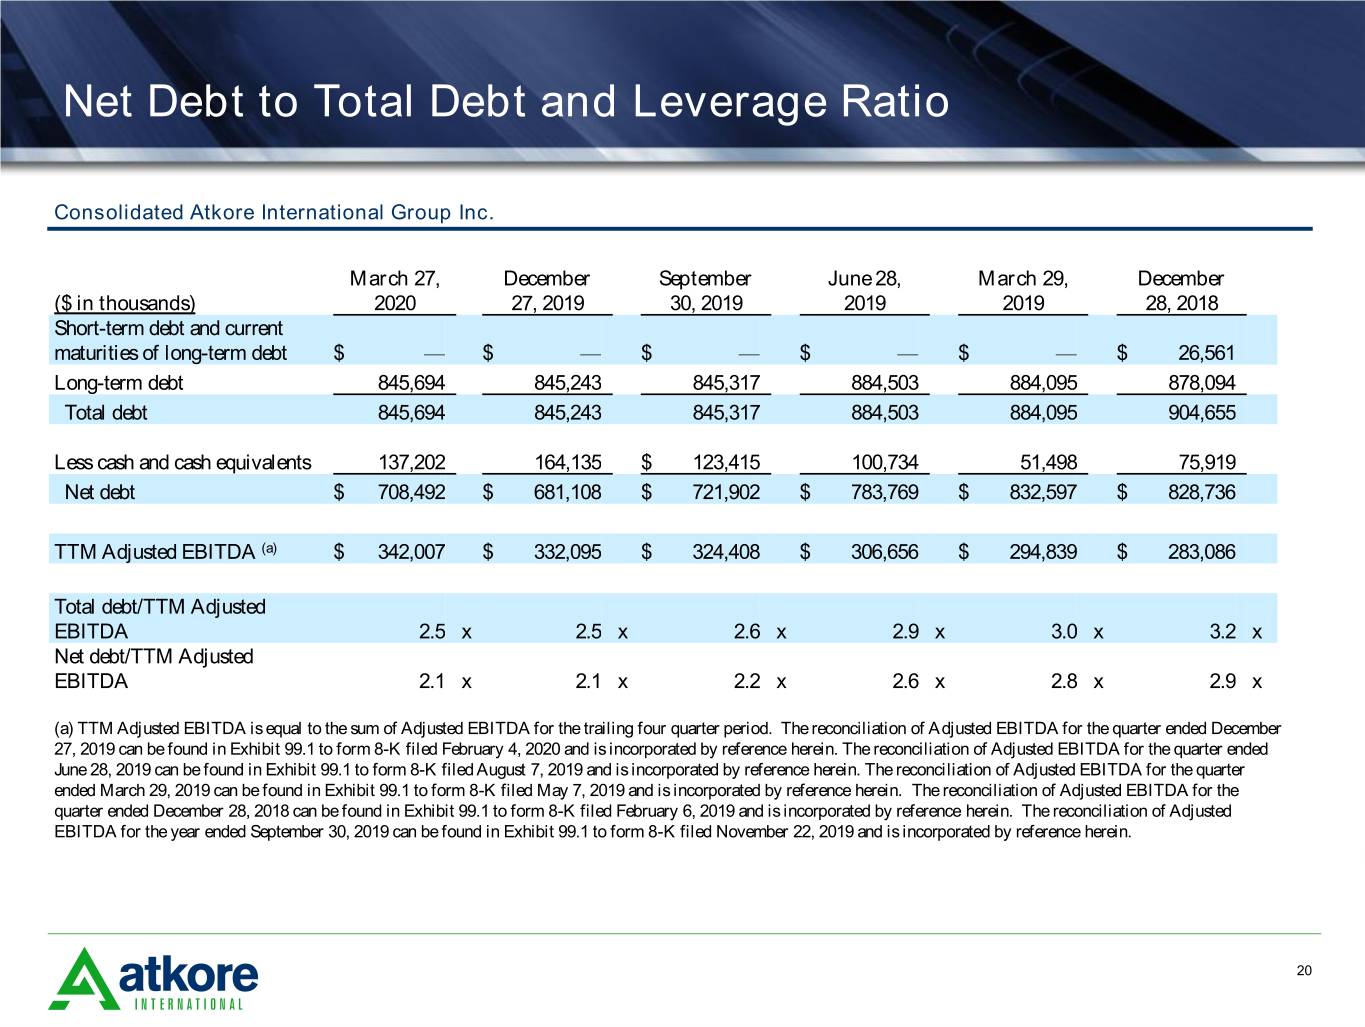
Net Debt to Total Debt and Leverage Ratio Consolidated Atkore International Group Inc. March 27, December September June 28, March 29, December ($ in thousands) 2020 27, 2019 30, 2019 2019 2019 28, 2018 Short-term debt and current maturities of long-term debt $ — $ — $ — $ — $ — $ 26,561 Long-term debt 845,694 845,243 845,317 884,503 884,095 878,094 Total debt 845,694 845,243 845,317 884,503 884,095 904,655 Less cash and cash equivalents 137,202 164,135 $ 123,415 100,734 51,498 75,919 Net debt $ 708,492 $ 681,108 $ 721,902 $ 783,769 $ 832,597 $ 828,736 TTM Adjusted EBITDA (a) $ 342,007 $ 332,095 $ 324,408 $ 306,656 $ 294,839 $ 283,086 Total debt/TTM Adjusted EBITDA 2.5 x 2.5 x 2.6 x 2.9 x 3.0 x 3.2 x Net debt/TTM Adjusted EBITDA 2.1 x 2.1 x 2.2 x 2.6 x 2.8 x 2.9 x (a) TTM Adjusted EBITDA is equal to the sum of Adjusted EBITDA for the trailing four quarter period. The reconciliation of Adjusted EBITDA for the quarter ended December 27, 2019 can be found in Exhibit 99.1 to form 8-K filed February 4, 2020 and is incorporated by reference herein. The reconciliation of Adjusted EBITDA for the quarter ended June 28, 2019 can be found in Exhibit 99.1 to form 8-K filed August 7, 2019 and is incorporated by reference herein. The reconciliation of Adjusted EBITDA for the quarter ended March 29, 2019 can be found in Exhibit 99.1 to form 8-K filed May 7, 2019 and is incorporated by reference herein. The reconciliation of Adjusted EBITDA for the quarter ended December 28, 2018 can be found in Exhibit 99.1 to form 8-K filed February 6, 2019 and is incorporated by reference herein. The reconciliation of Adjusted EBITDA for the year ended September 30, 2019 can be found in Exhibit 99.1 to form 8-K filed November 22, 2019 and is incorporated by reference herein. 20
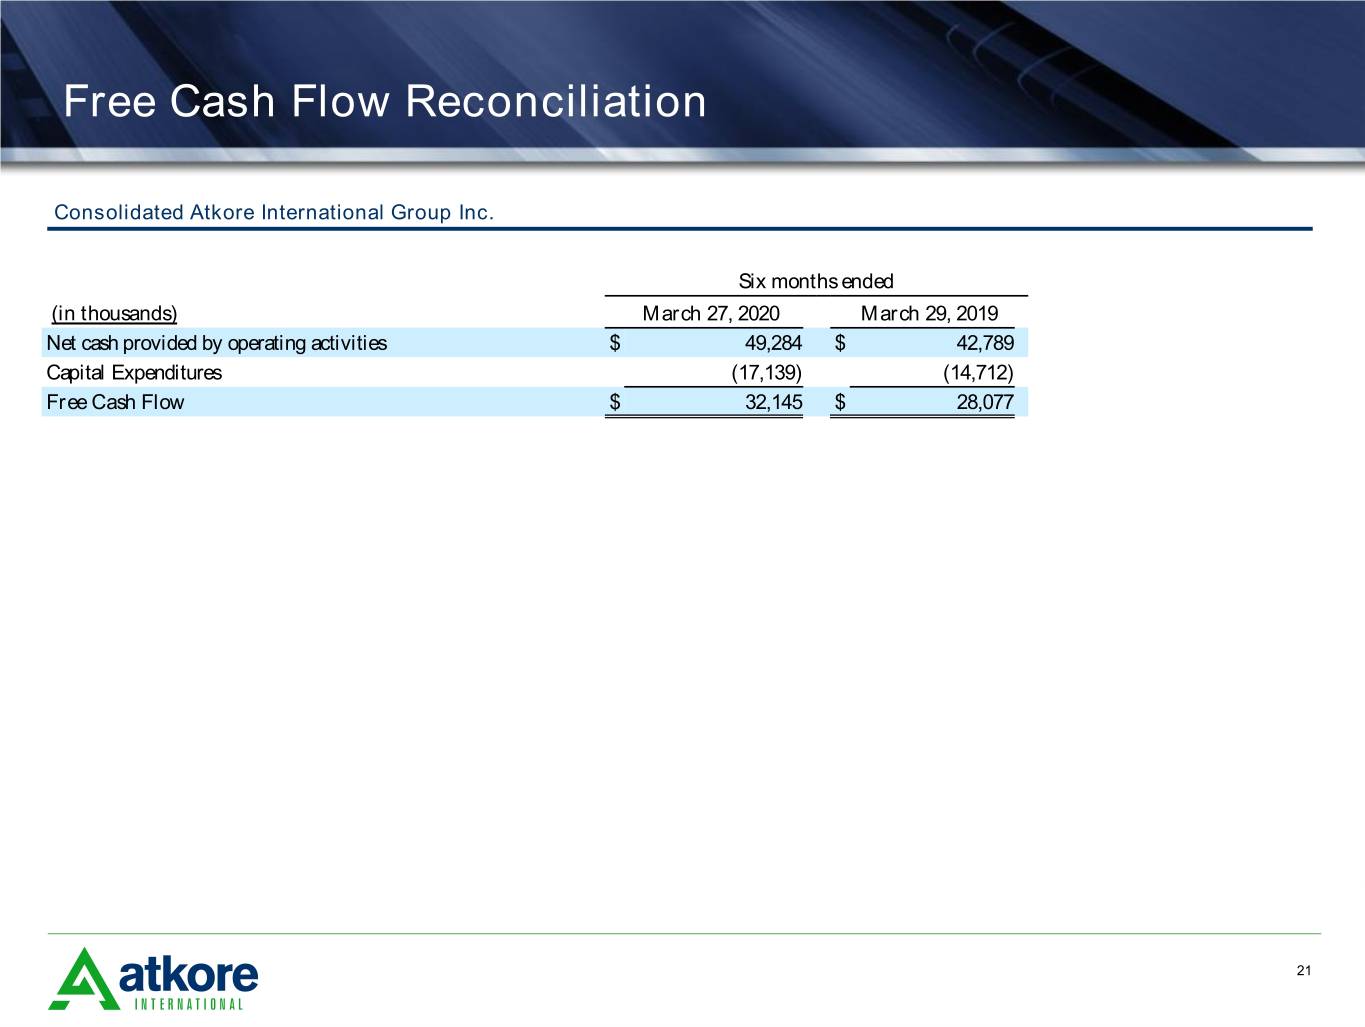
Free Cash Flow Reconciliation Consolidated Atkore International Group Inc. Six months ended (in thousands) March 27, 2020 March 29, 2019 Net cash provided by operating activities $ 49,284 $ 42,789 Capital Expenditures (17,139) (14,712) Free Cash Flow $ 32,145 $ 28,077 21