Operator
Thank you for holding. I am Carly, your conference operator today. I would like to welcome everyone to Clarivate's Fourth Quarter and Full Year 2025 Earnings Conference Call. I will now hand the call over to Mark Donohue, Vice President of Investor Relations. Please proceed.
Speaker 1
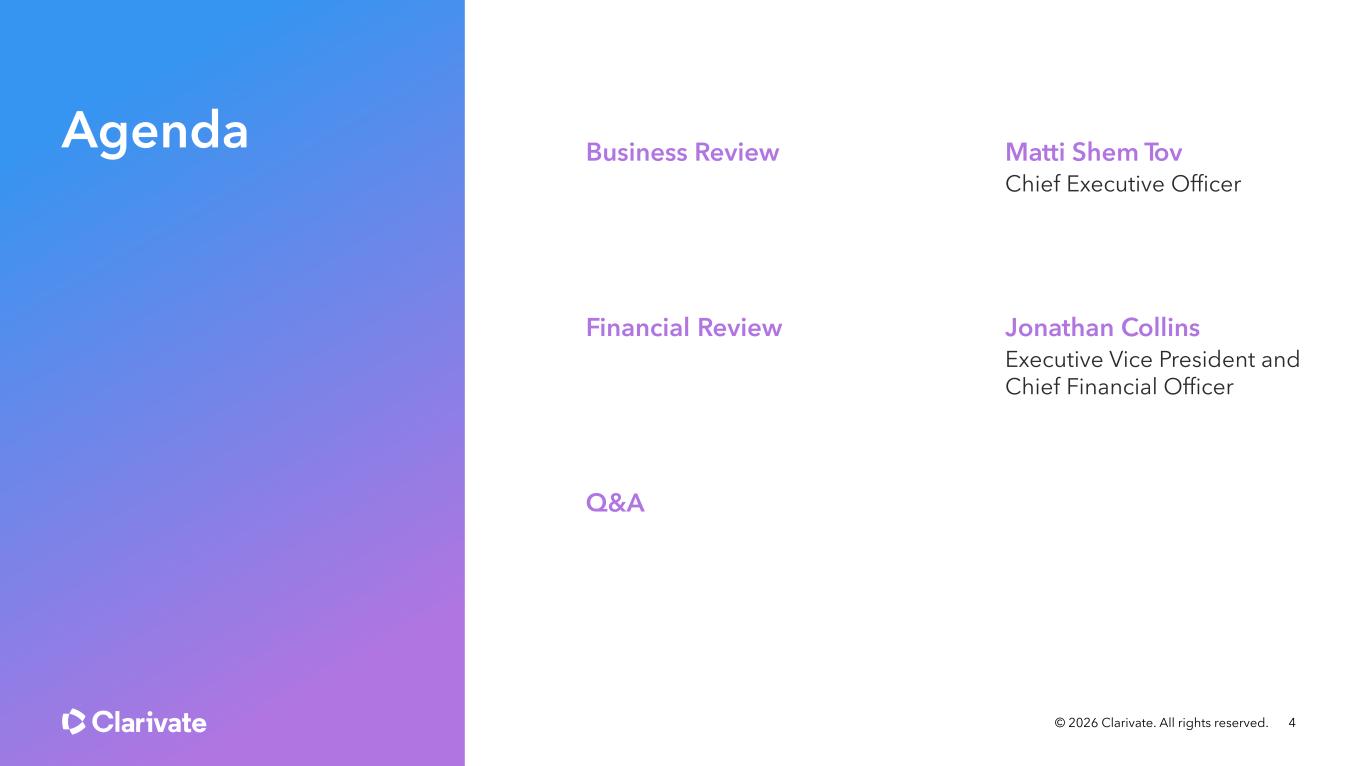
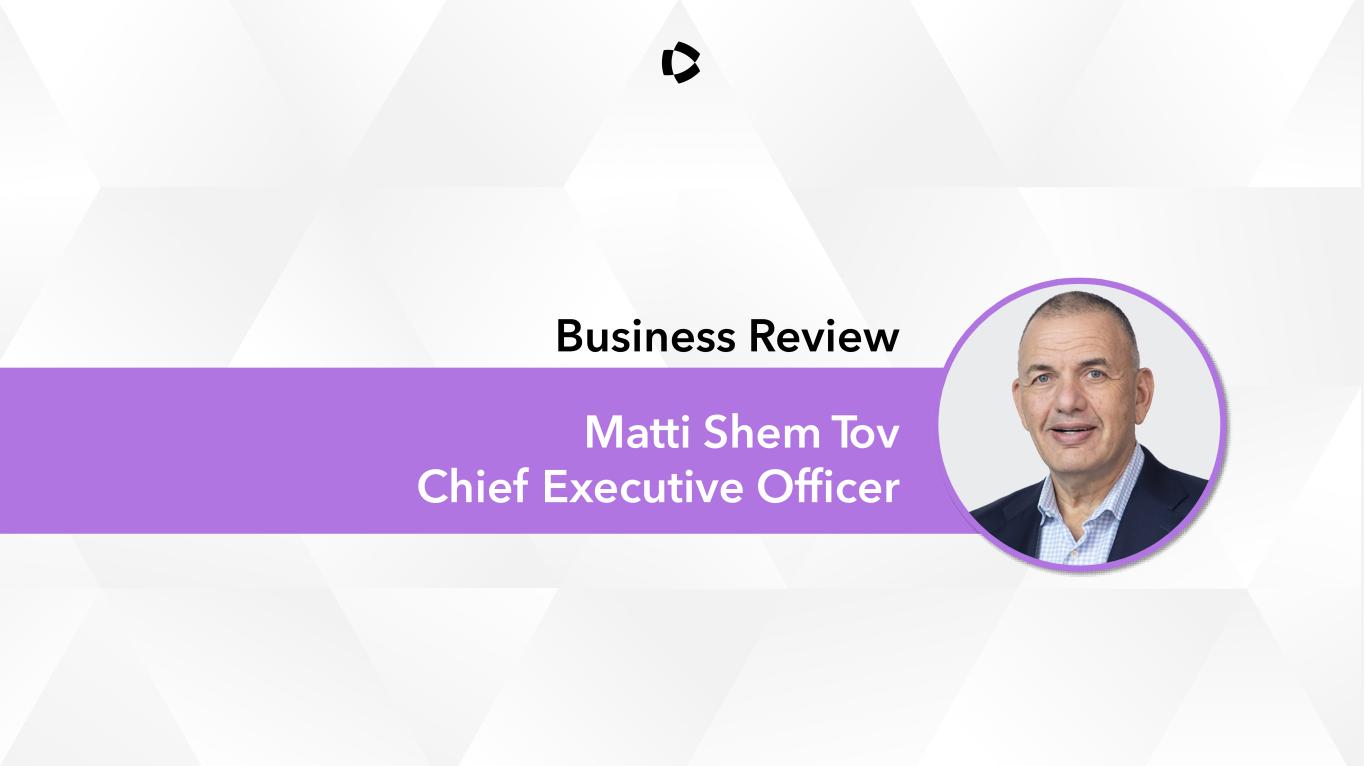
Thank you, and good morning, everyone. Thank you for joining us for the Clarivate's Fourth Quarter and Full Year 2025 Earnings Conference Call. As a reminder, this conference call is being recorded and webcast and is copyrighted property of Clarivate. Any rebroadcast of this information in whole or in part without prior written consent of Clarivate is prohibited, and the accompanying earnings call presentation is available on the Investor Relations section of the company's website. During our call, we may make certain forward-looking statements within the meaning of the applicable securities laws. Such forward-looking statements involve known and unknown risks, uncertainties and other factors that may cause the actual results, performance or achievements of the business or developments in Clarivate's industry to differ materially from the anticipated results, performance achievements or developments expressed or implied by such forward-looking statements. Information about the factors that could cause actual results to differ materially from anticipated results or performance can be found in Clarivate's filings with the SEC and on the company's website. Our discussion will include non-GAAP measures or adjusted numbers. Clarivate believes non-GAAP results are useful in order to enhance understanding of our ongoing operating performance, but they are a supplement to and should not be considered in isolation from or as a substitute for GAAP financial measures. Reconciliations of these measures to GAAP measures are available in our earnings release and supplemental presentation on our website. With me today are Matti Shem Tov, Chief Executive Officer; and Jonathan Collins, Chief Financial Officer. After our prepared remarks, we'll open up the call to your questions. And with that, it's a pleasure to turn the call over to Matti.
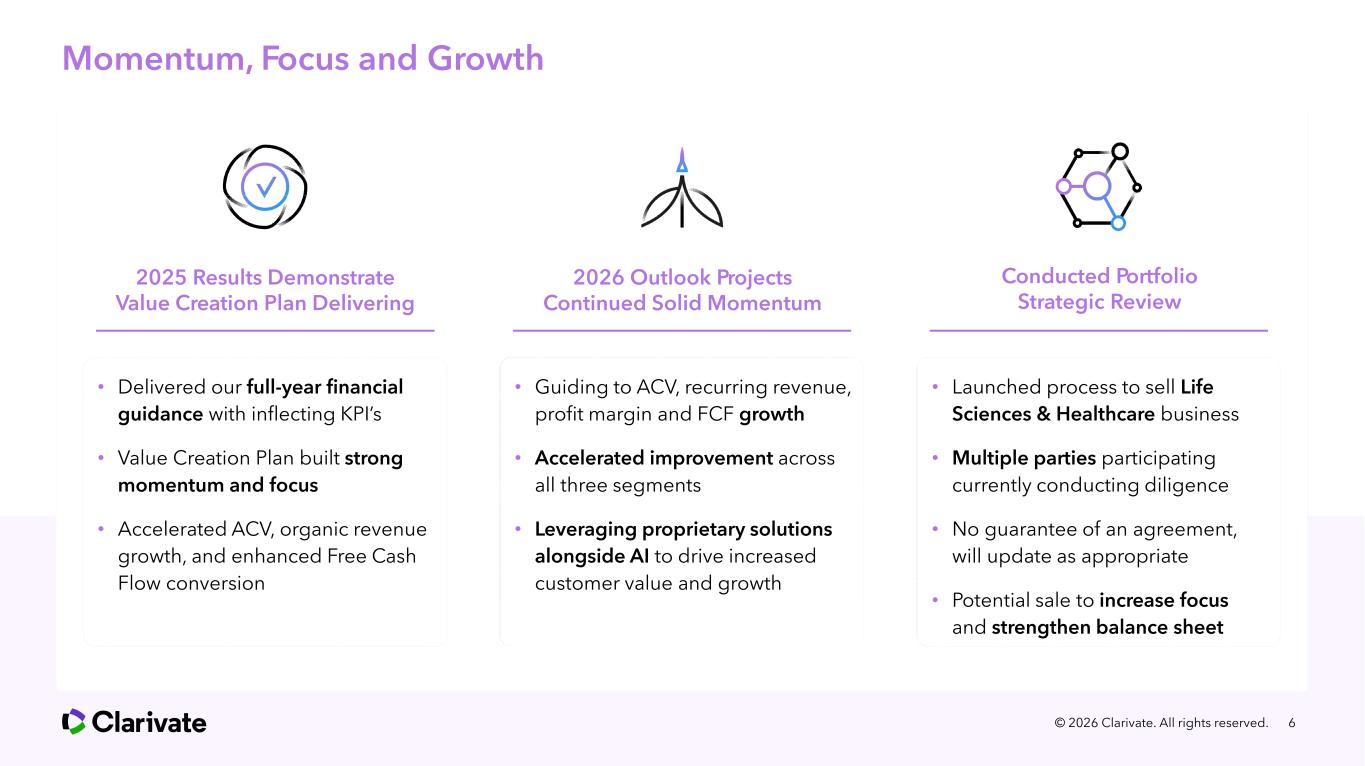
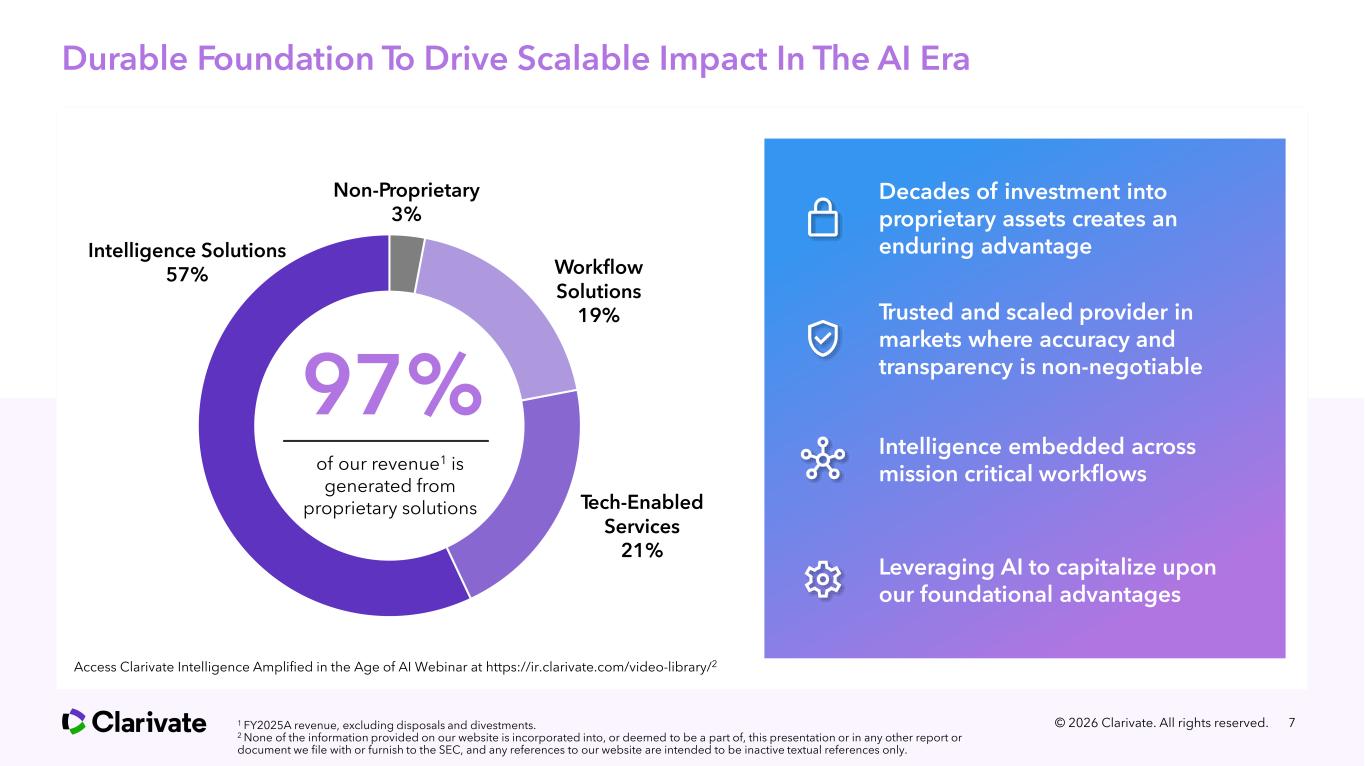
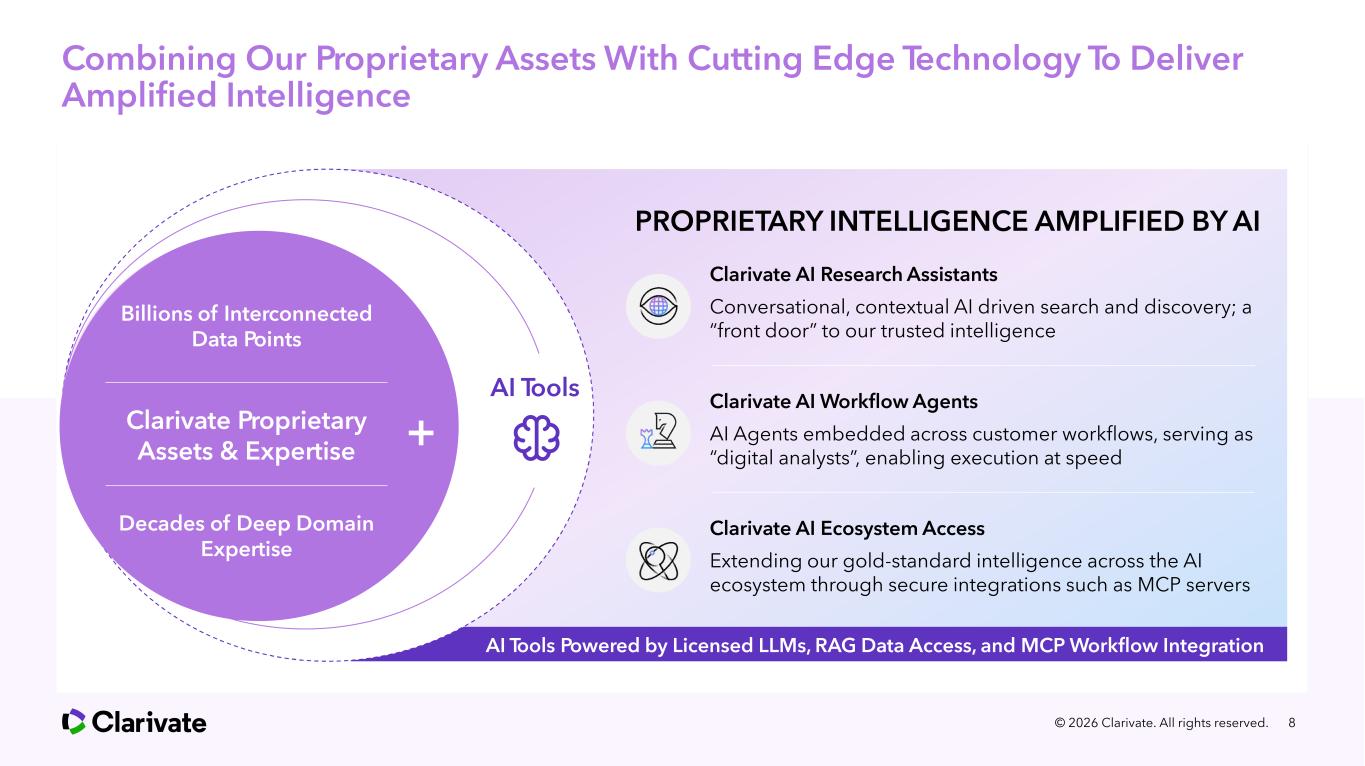
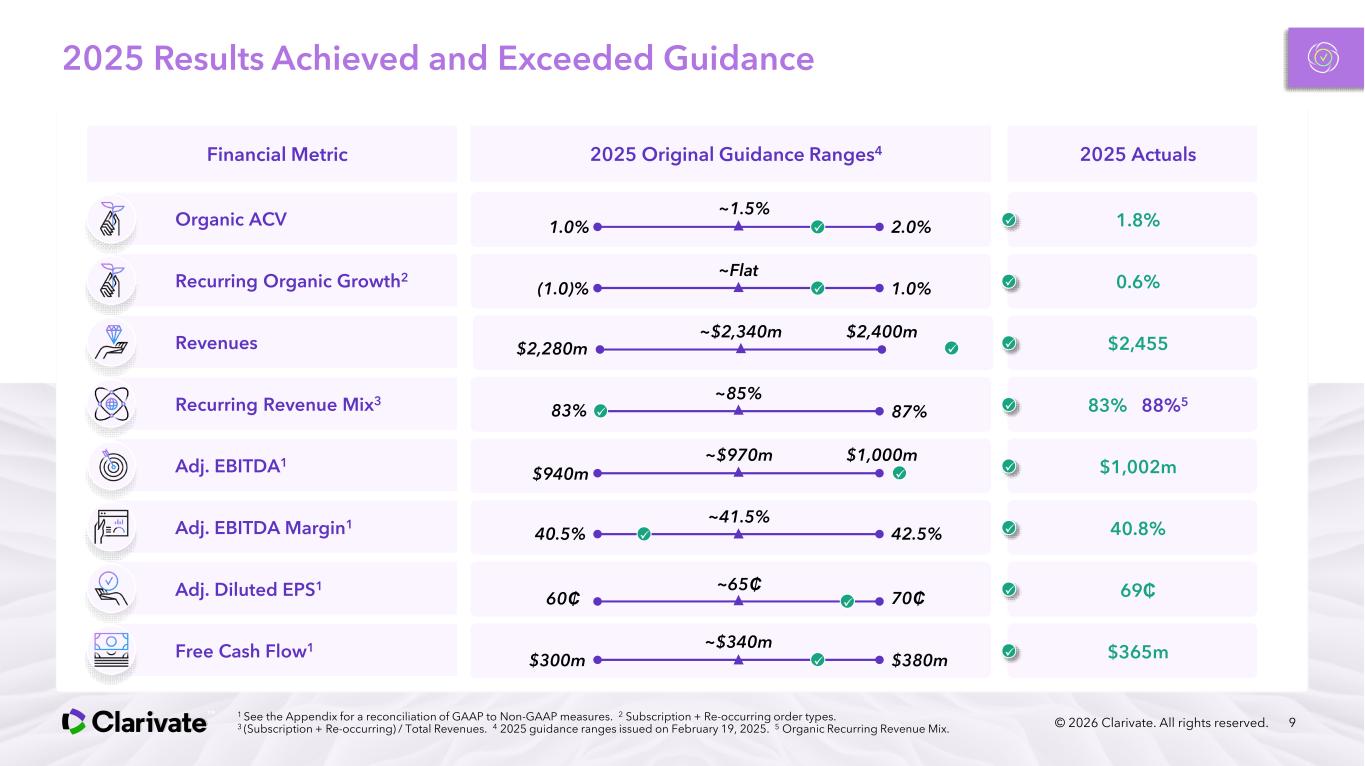
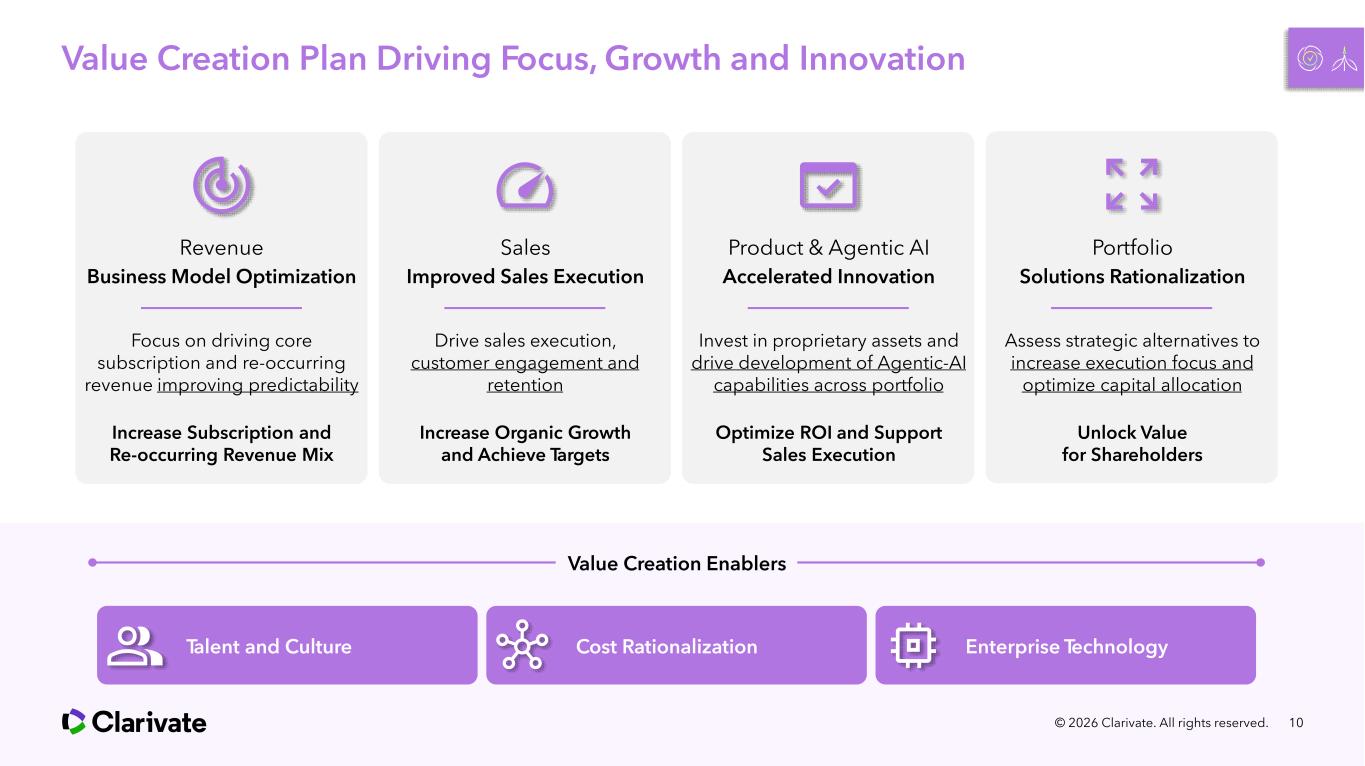
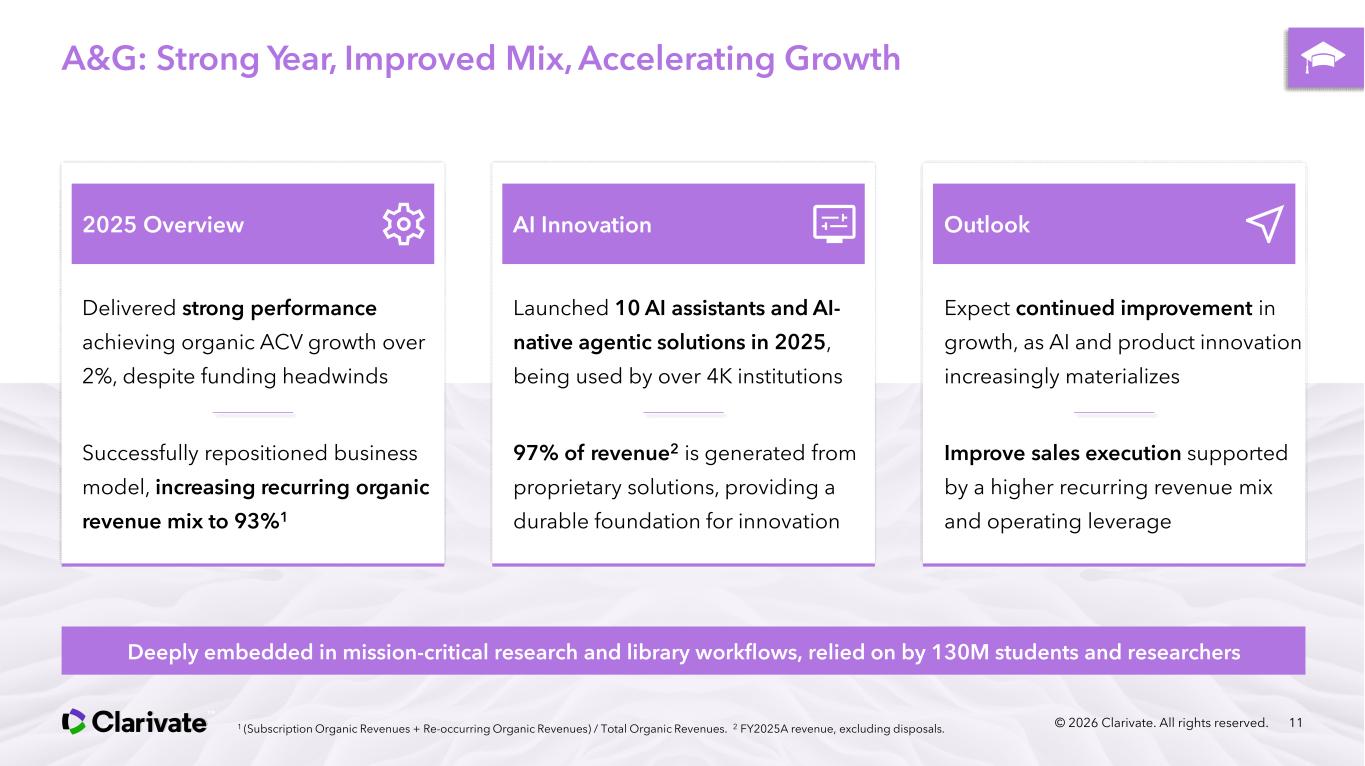
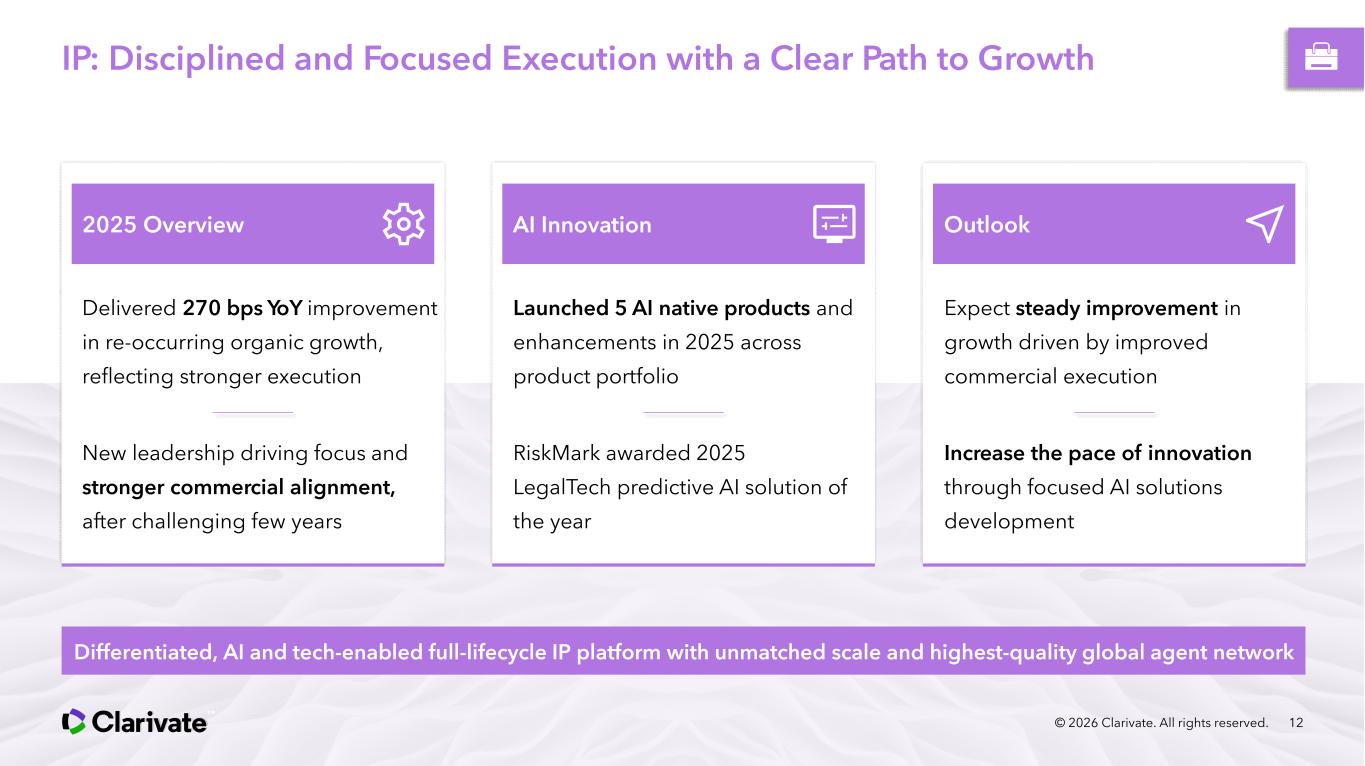
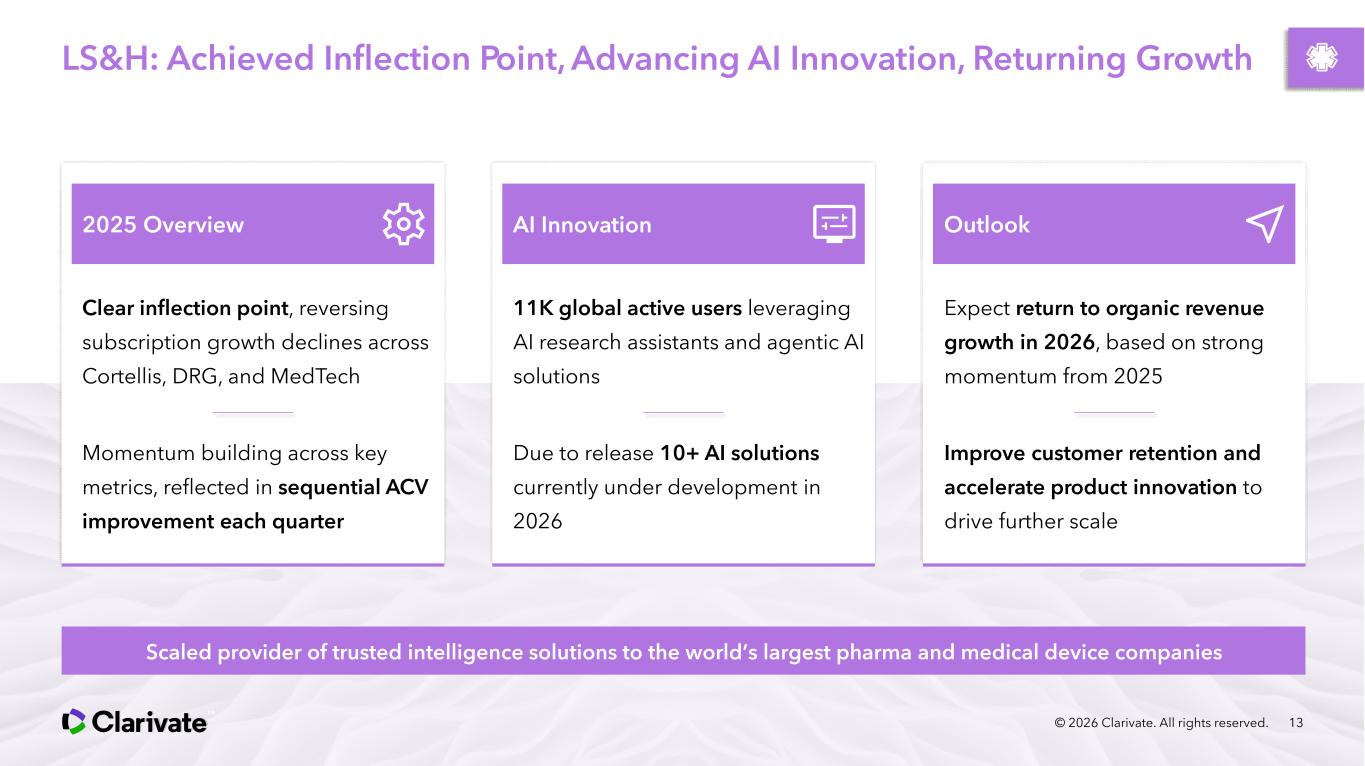
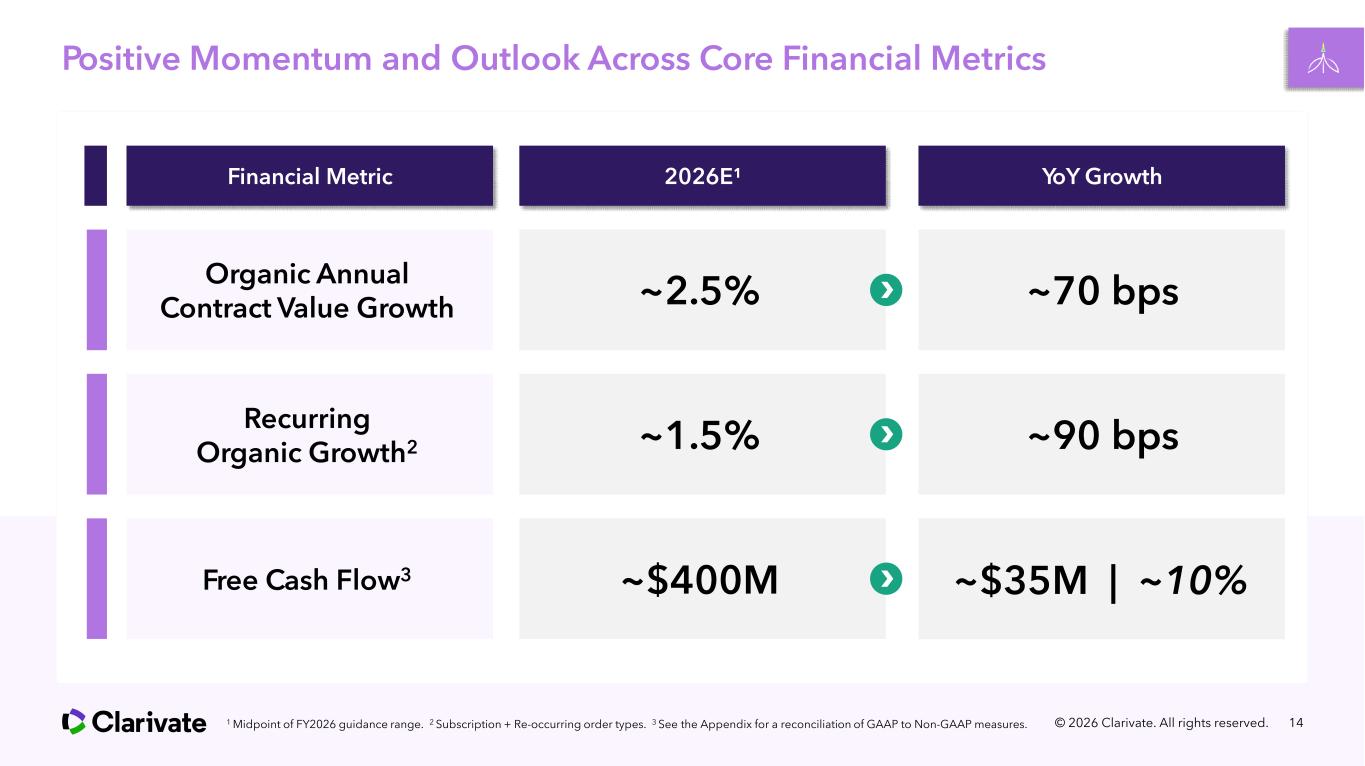
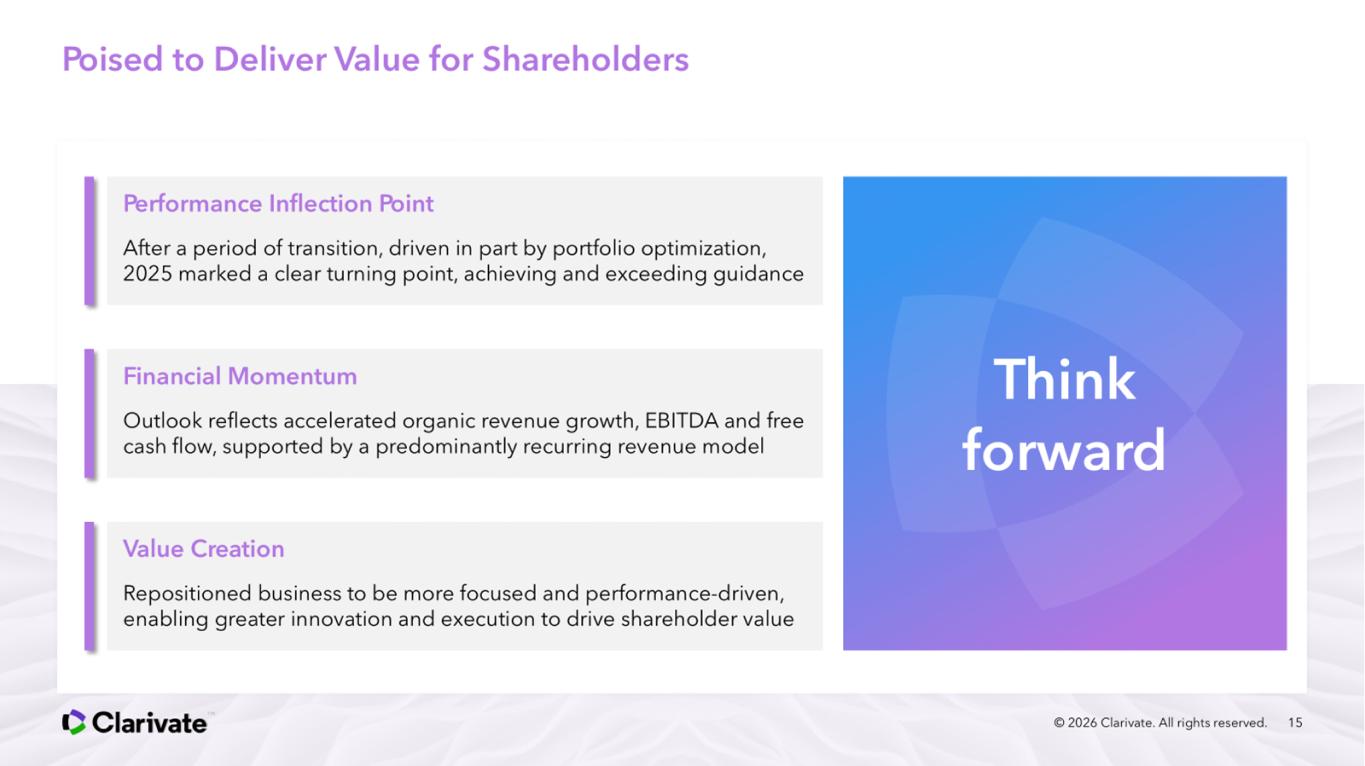
Good morning, everyone, and thank you for joining us today. We are at a positive inflection point in the Clarivate journey. In 2025, we delivered on our initial full year financial guidance for the first time since 2019. The value creation plan is working as evidenced by our improved performance and forward outlook. We have accelerated organic ACV, organic recurring revenue and enhanced our free cash flow conversion. Looking ahead to 2026, our guidance calls for 10% free cash flow growth and continued improvement in our KPIs. With strong cash generation, stable revenue retention rates of 93% and a business that generates 97% of its revenue from proprietary solutions enhanced by AI, we see tremendous opportunity in front of us. Last February, we announced a strategic review of our business portfolio, which involves evaluating multiple options. After an in-depth analysis, we have launched a process to sell our Life Sciences & Health business, which if the deal is concluded, could accelerate value creation for shareholders. We believe selling this segment will allow further emphasis on the A&G and IP market and strengthen our balance sheet through reduced leverage. We are currently engaged in active discussions with interested parties. There are no guarantees we will reach an agreement. We will update the market when appropriate. While we understand the market's concerns around AI disruption for software and information services companies in general, we believe our business is highly proprietary with significant moats. A few weeks ago, we launched a webinar titled 'Clarivate Intelligence Amplified in the Age of AI.' If you have not viewed it yet, I encourage you to do so. For us, AI is not a disruption to our business model; it is an amplifier of what already sets us apart. Today, 97% of Clarivate's revenue comes from proprietary assets, including intelligence solutions, workflow software, and tech-enabled services. This reflects decades of strategic investment in proprietary content, expert enrichment, and curation, and the development of software products embedded across customer workflows. This strong and proven foundation provides us with a significant advantage in the age of AI. Our customers operate in high-stake environments such as research, intellectual property, and highly regulated life science industries where provenance, accuracy, and trust are essential and nonnegotiable. Let me explain our AI strategy. We are leveraging AI to capitalize on our strengths. By combining our proprietary data and deep domain expertise with cutting-edge technology, we are delivering what we call intelligence amplified. This shows up in three ways. First, AI research assistants provide a conversational contextual search and discovery, a front door to our trusted intelligence, where customers can simply ask questions in natural language and get a precise answer backed by our proprietary data. Second, AI workflow agents are embedded directly into customer workflows, acting as digital analysts that enable execution at speed. Tasks that used to take hours or days can now happen in minutes. Imagine a patent analyst who has an AI agent that can monitor thousands of patents, identify relevant prior arts, and flag potential conflicts automatically. That is the power we deliver. And third, through AI ecosystem access, we are extending our gold standard intelligence across the broader AI ecosystem via secured integrations such as MCP servers. By expanding our reach beyond cloud boundaries, we are ensuring our assets remain available to users as they develop new ways of working. For example, we recently introduced Nexus, which exemplifies our ecosystem access strategy. As students increasingly begin their research in general-purpose AI tools, Nexus meets them where they are, embedding our gold standard curated content such as Web of Science directly into public chat tools. This is how we extend the value of our proprietary assets beyond our own platforms, turning AI adoption into a distribution opportunity rather than a displacement risk. We will continue to capitalize on the benefits of AI by enhancing and developing solutions that are trusted by more than 45,000 customers globally. We see this new technology as a legitimate accelerant to our organic growth. Now let's turn to 2025 results. I am proud of the results we delivered in 2025, which lay a strong foundation for 2026. We delivered nearly 2% organic ACV growth at the high end of the range. We also improved the mix of organic recurring revenue to 88%, clear evidence of continued progress towards a more predictable subscription-based model. We delivered more than $1 billion of adjusted EBITDA and $365 million in free cash flow. As Jonathan will cover in more detail, we expect approximately 10% free cash flow growth in 2026. Our value creation plan has built strong momentum and better focus across the organization, which has improved our operational and financial performance. We optimized the business model, which has led to an improvement in our recurring revenue mix. We improved our sales execution and as a result, delivered nearly 2% organic ACV growth, representing approximately 90 basis points improvement year-over-year. We drove innovation forward by introducing 12 major products and AI-powered features, strengthening our unique position in the market. Our strategic review has led to the initiation of a process to sell our Life Science business. If successful, this will focus our organization and strengthen our balance sheet. Let me take you through each of our business segments where we have made meaningful improvements, starting with Academia & Government. This segment delivered solid performance in 2025, achieving 2% organic ACV growth despite funding headwinds in the U.S. academic market. On the innovation front, we launched 10 AI assistants and AI-native agentic solutions, and these are being used by over 4,000 institutions today. And here is the foundation that makes this all possible. 97% of our A&G revenue is generated from proprietary solutions. Last year, we successfully transitioned the business model away from transactional revenues. This increased our organic recurring revenue mix to 93% with mid-90s retention rates. Looking ahead, we expect organic growth acceleration as our AI innovation continues to materialize, supported by improving market dynamics. Now let's talk about the Intellectual Property business. It is powered by the industry's largest agent network and a comprehensive portfolio of solutions covering the full IP life cycle. This includes patent and trademark created proprietary data, decision intelligence, tech-enabled services, IP management software, and the largest annuity book in the market. This gives us scale, reach, and a competitive advantage no one else can match with a new leadership team, including the President, CTO, and the Head of Software and clearer priorities; we are confident in returning IP to growth. On the innovation side, we launched five GenAI and AI-native products and enhancements last year. 2026 will bring additional AI product launches across the IP landscape. The changes we have implemented are starting to show up in the results. We delivered 270 basis points of year-over-year improvement in annuities revenue, reflecting stronger execution. The outlook for IP is increasingly positive. The fundamentals are there. The team is aligned, and the AI-led innovation and products are resonating positively with our customers. Turning to Life Science & Health. Life Science & Health is anchored in expert curated, highly enriched data, which is optimized for compliance-critical workflows where accuracy, governance, and trust are essential. We now have 11,000 global active users leveraging our AI research assistant and workflow agent. That is incredible adoption in a market where accuracy and trust are nonnegotiable. And we are not slowing down. We are due to release more than 10 additional AI solutions this year. We have reached a clear inflection point. Cortellis, DRG and our three major product lines are now moving in the right direction with consistent quarterly ACV growth. Based on the deals we closed last year and our current pipeline visibility, we expect a return to organic revenue growth in 2026. Now let's talk about where we are headed and why we are confident in the outlook. For 2026, we are guiding to 2% to 3% organic annual contract value growth. That is a meaningful acceleration from where we were just two years ago. On recurring organic revenue, we are targeting 1% to 2% growth for 2026, an improvement of almost 100 basis points compared to last year in the middle of the range. Finally, free cash flow is expected to grow to about $400 million, that is approximately a 10% increase over last year. I am optimistic that we can achieve our target in 2026 because we have built the foundation. We have optimized the business model. We have strengthened sales execution. We are accelerating innovation, and we are rationalizing the portfolio. In closing, 2025 was a turning point for Clarivate. In 2026, we expect to continue to improve our key financial metrics. Under my leadership, we have built a more focused, accountable, and performance-driven culture, and we will maximize shareholder value through portfolio simplification and disciplined capital allocation. I will now turn the call over to Jonathan for a review of our financial results and outlook.
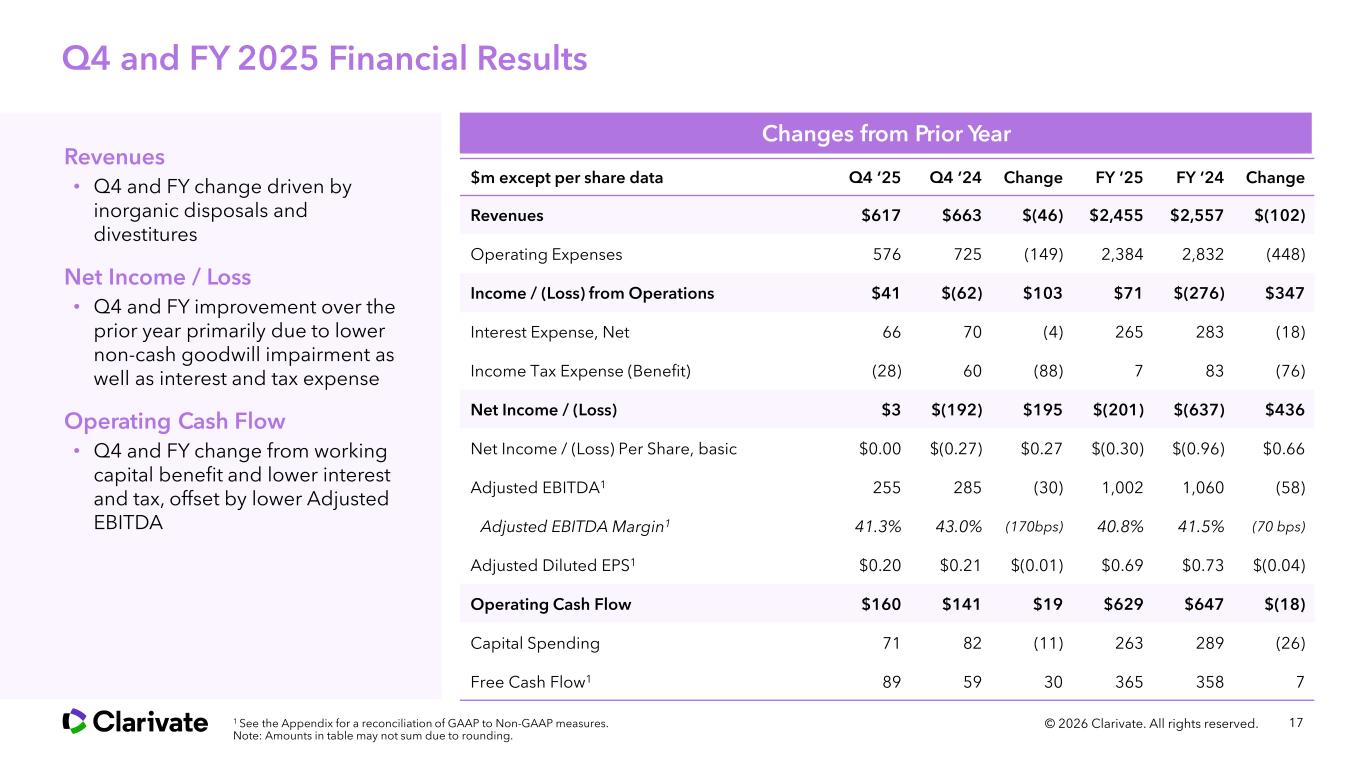
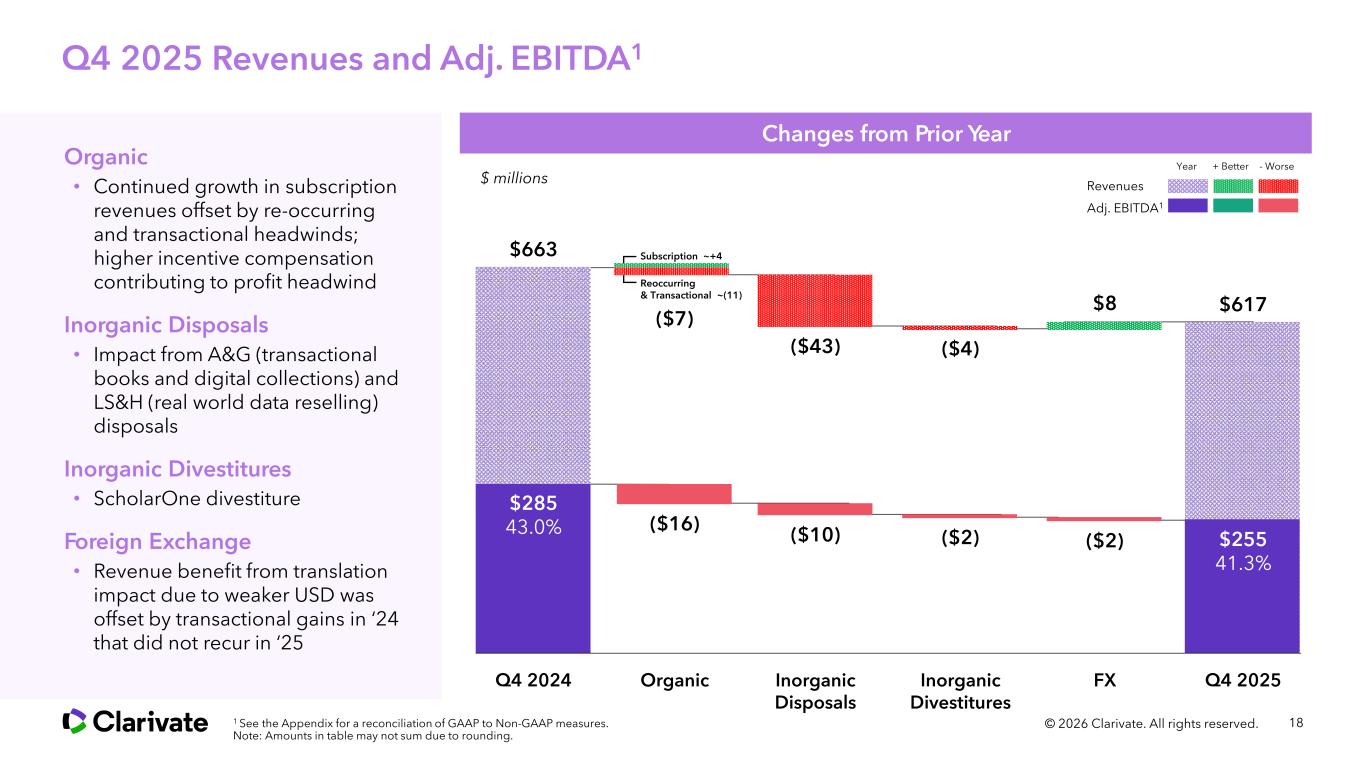
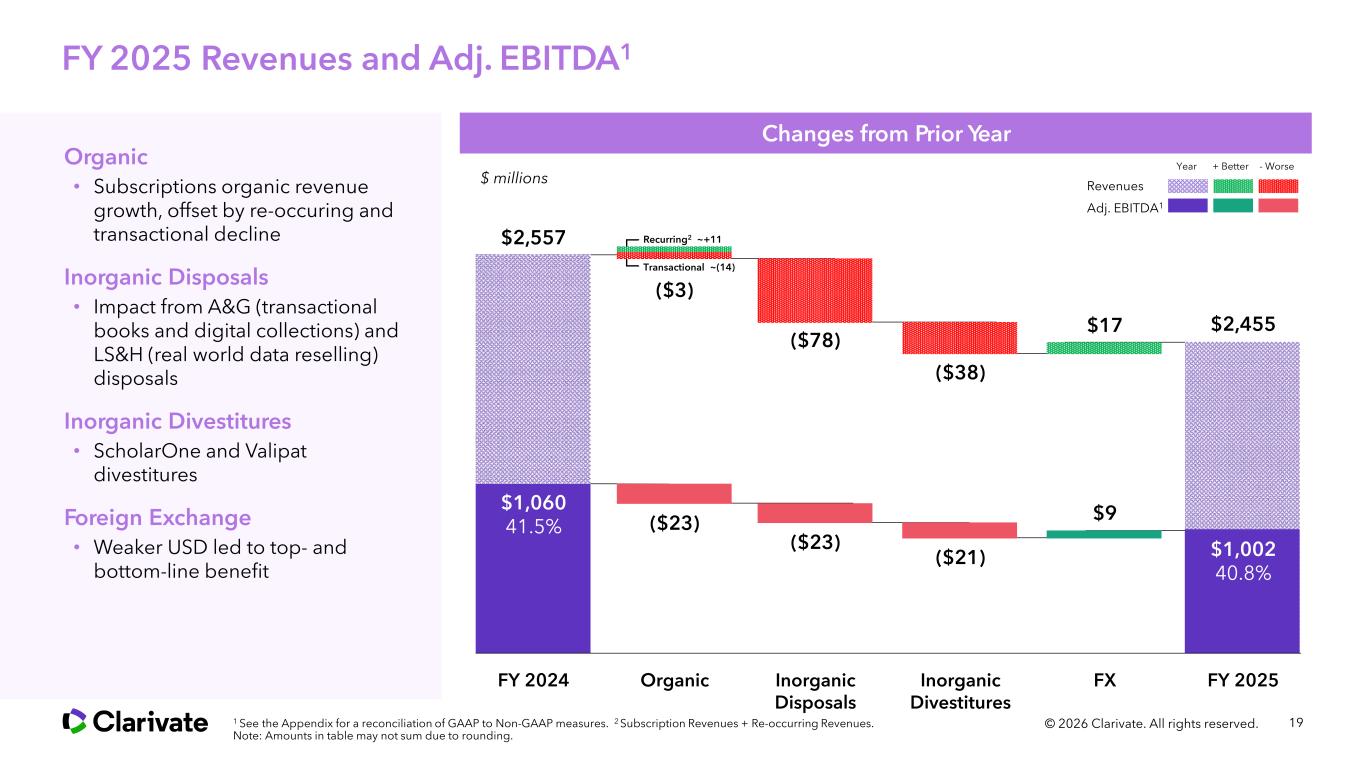
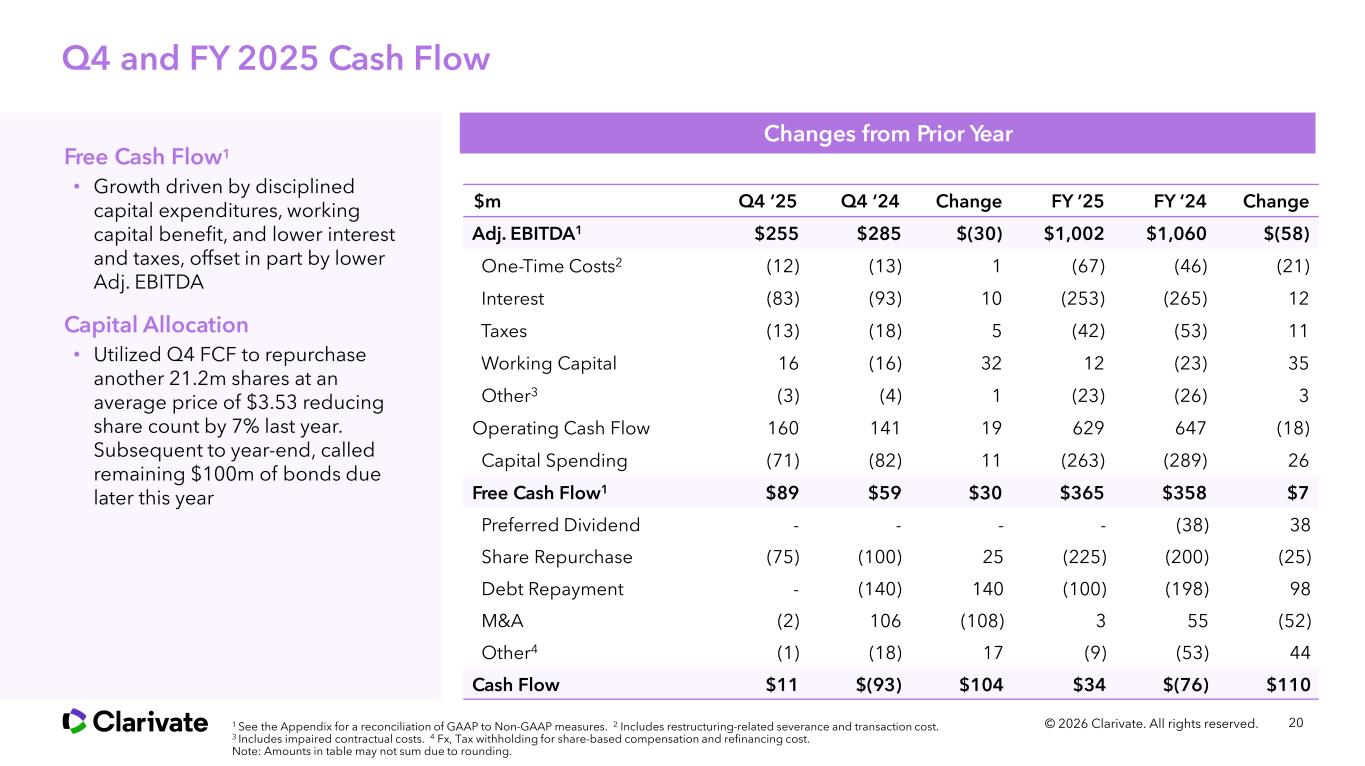
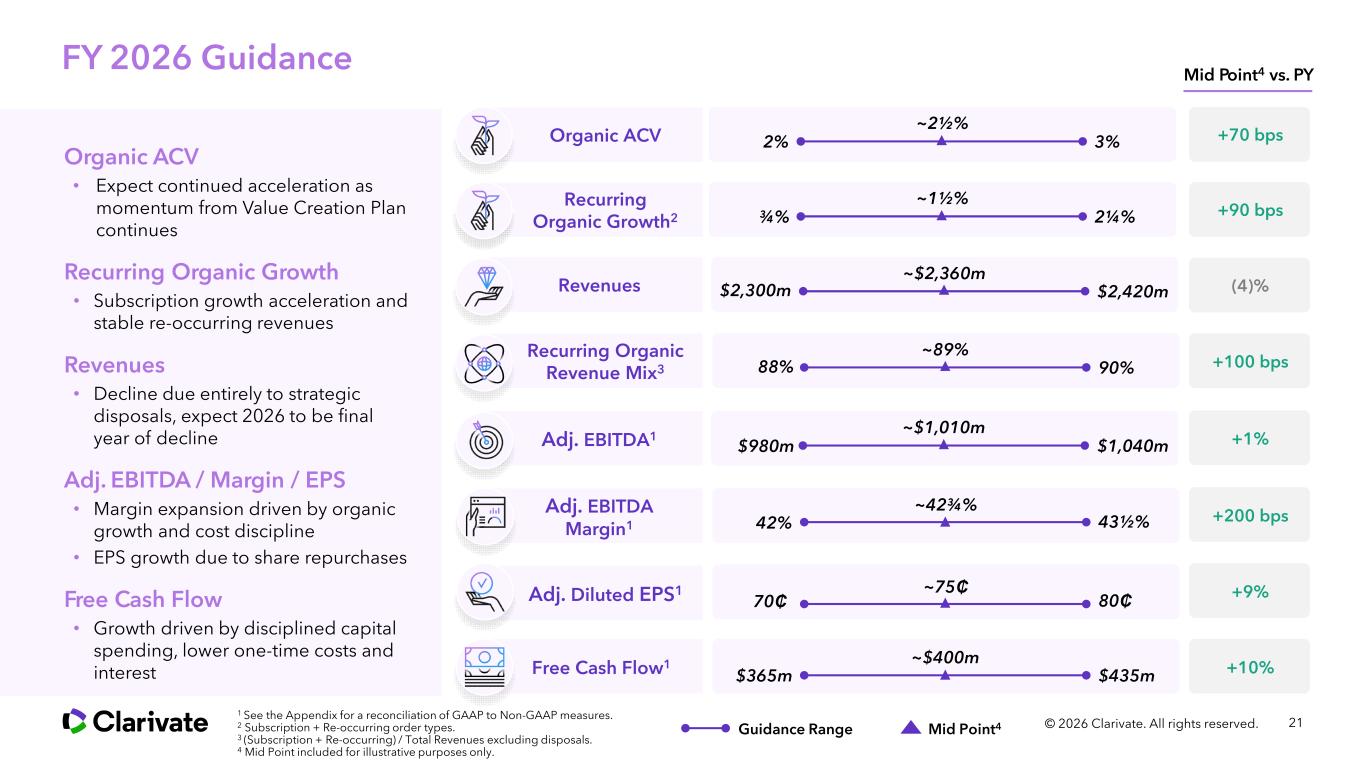
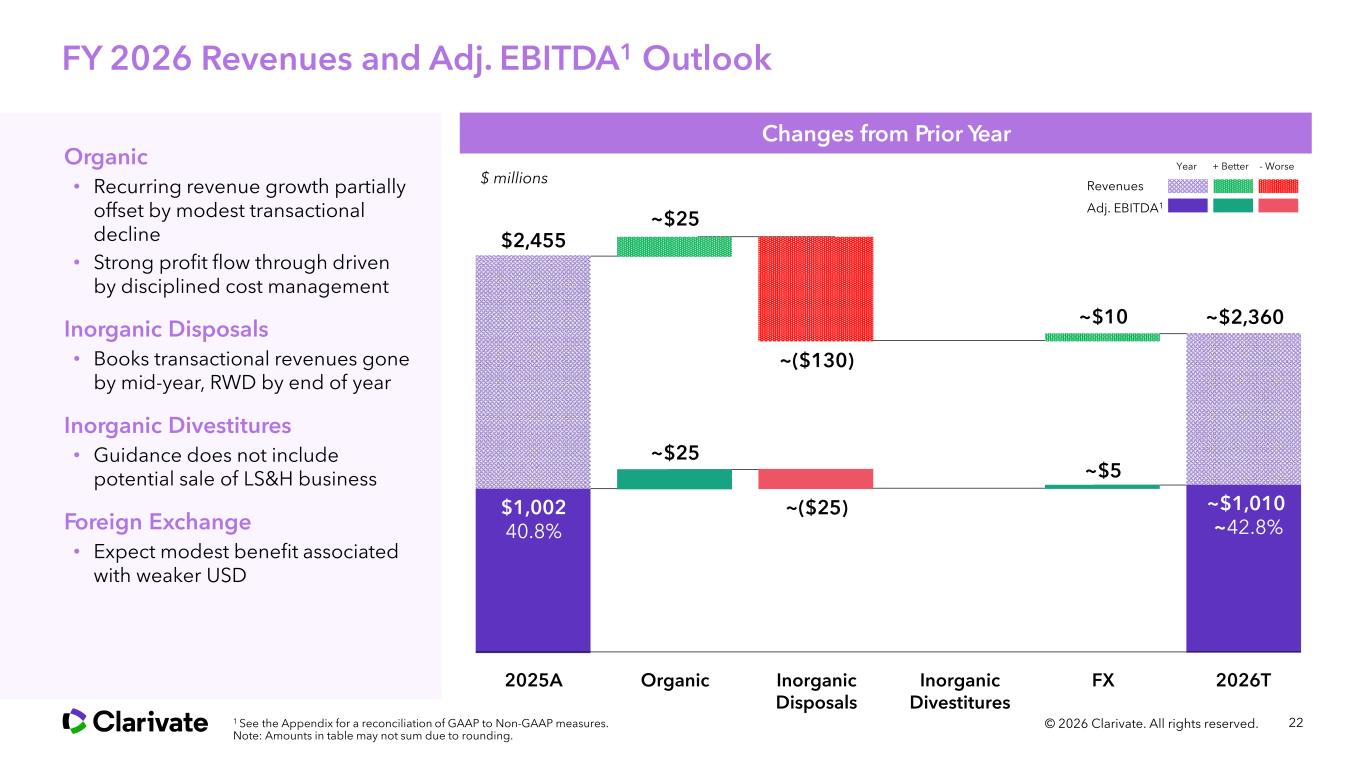
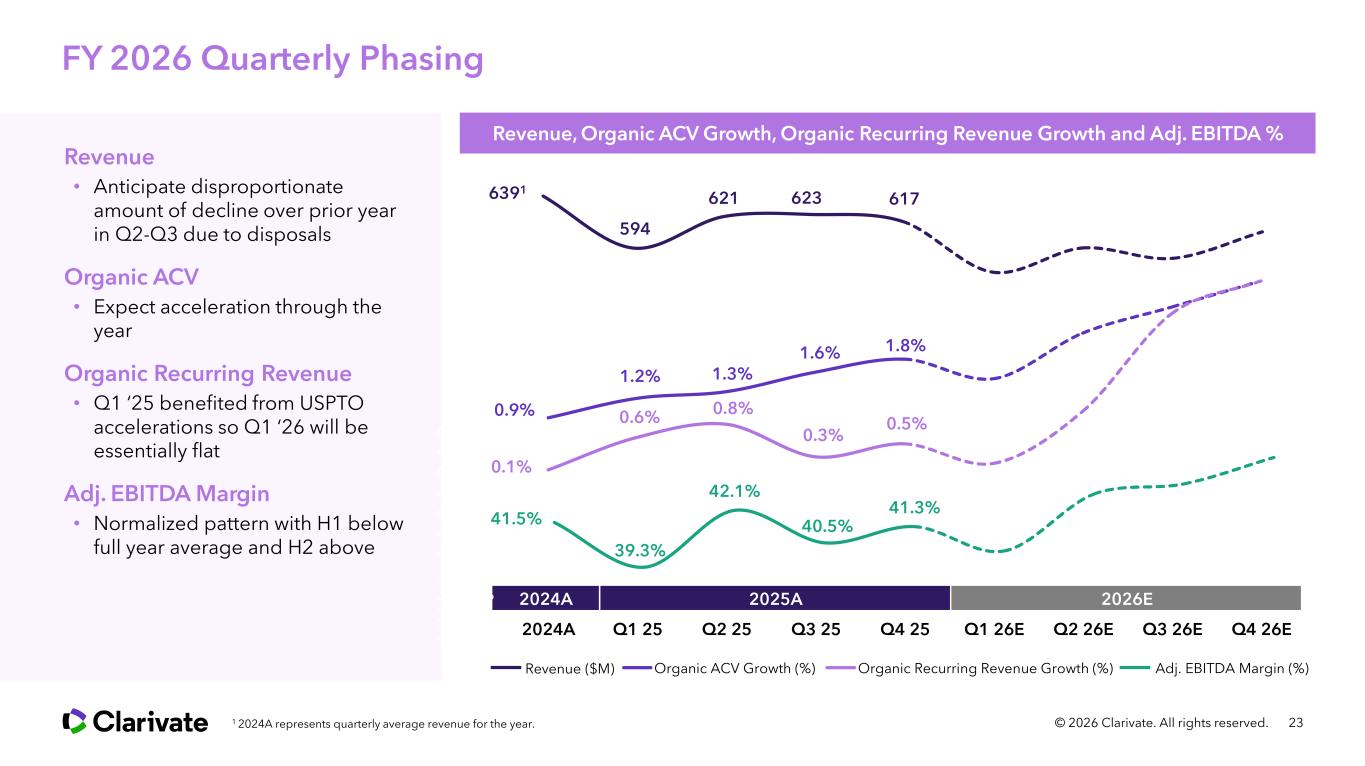
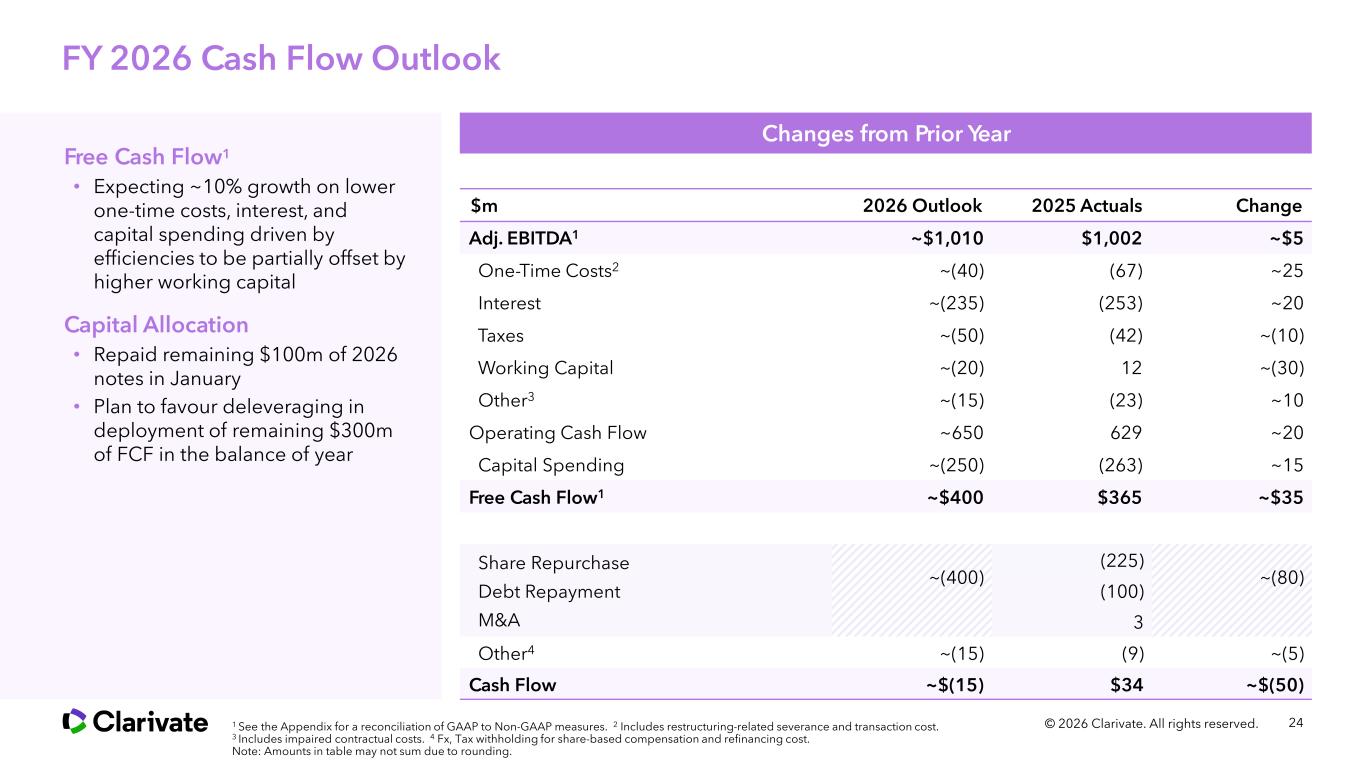
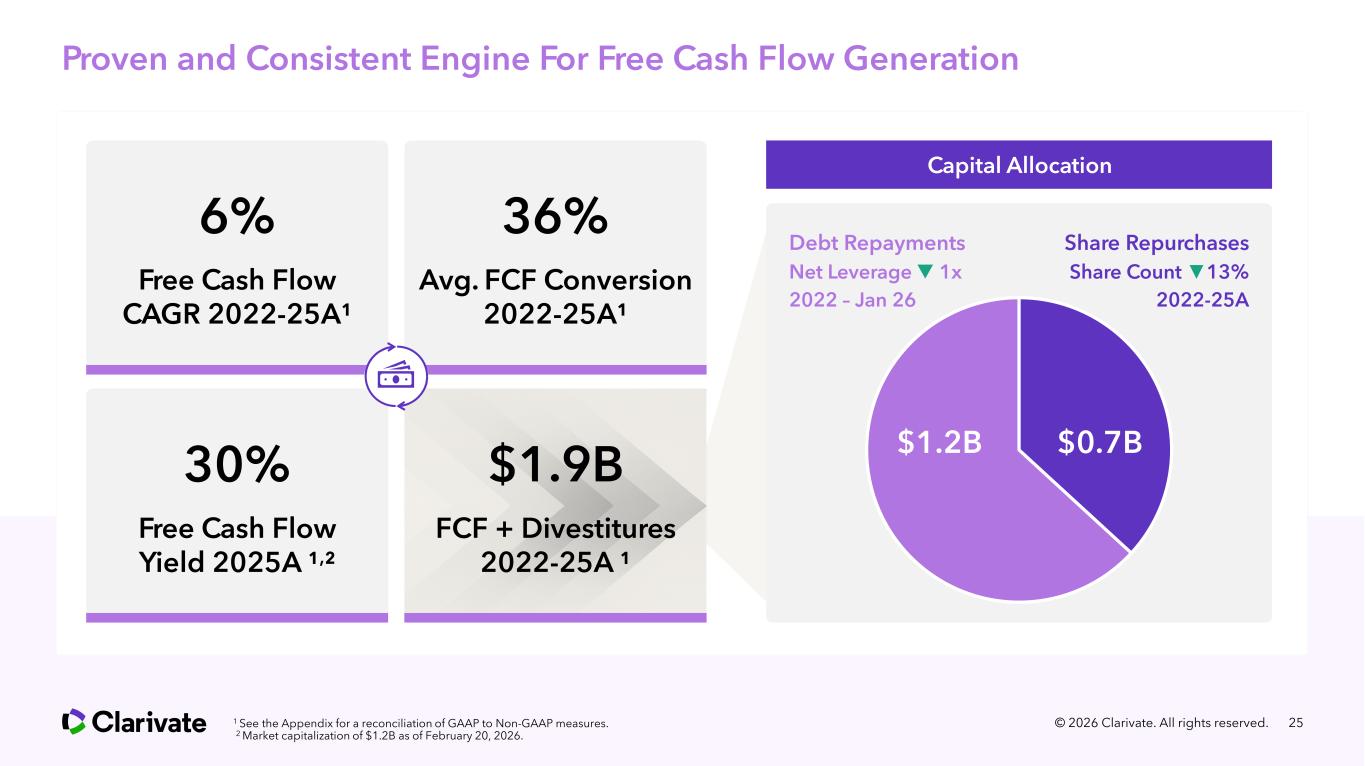
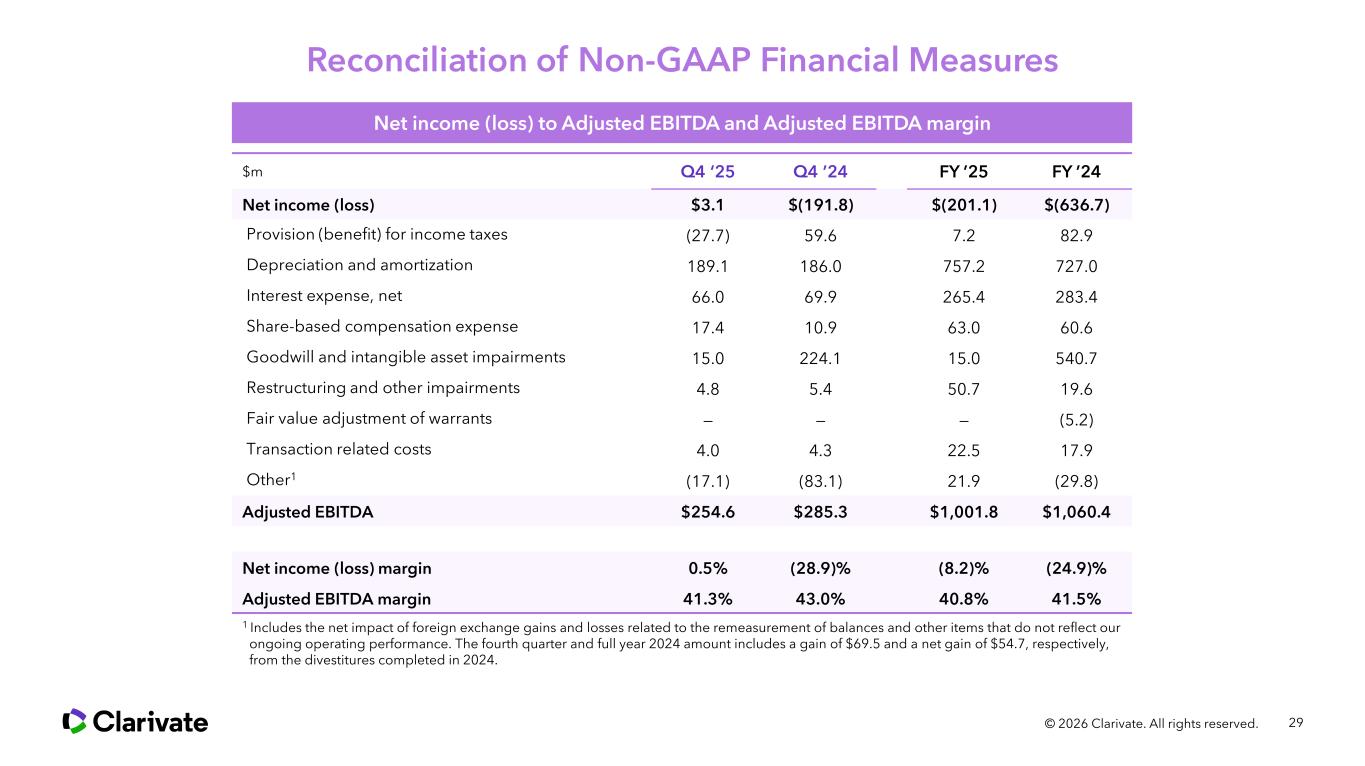
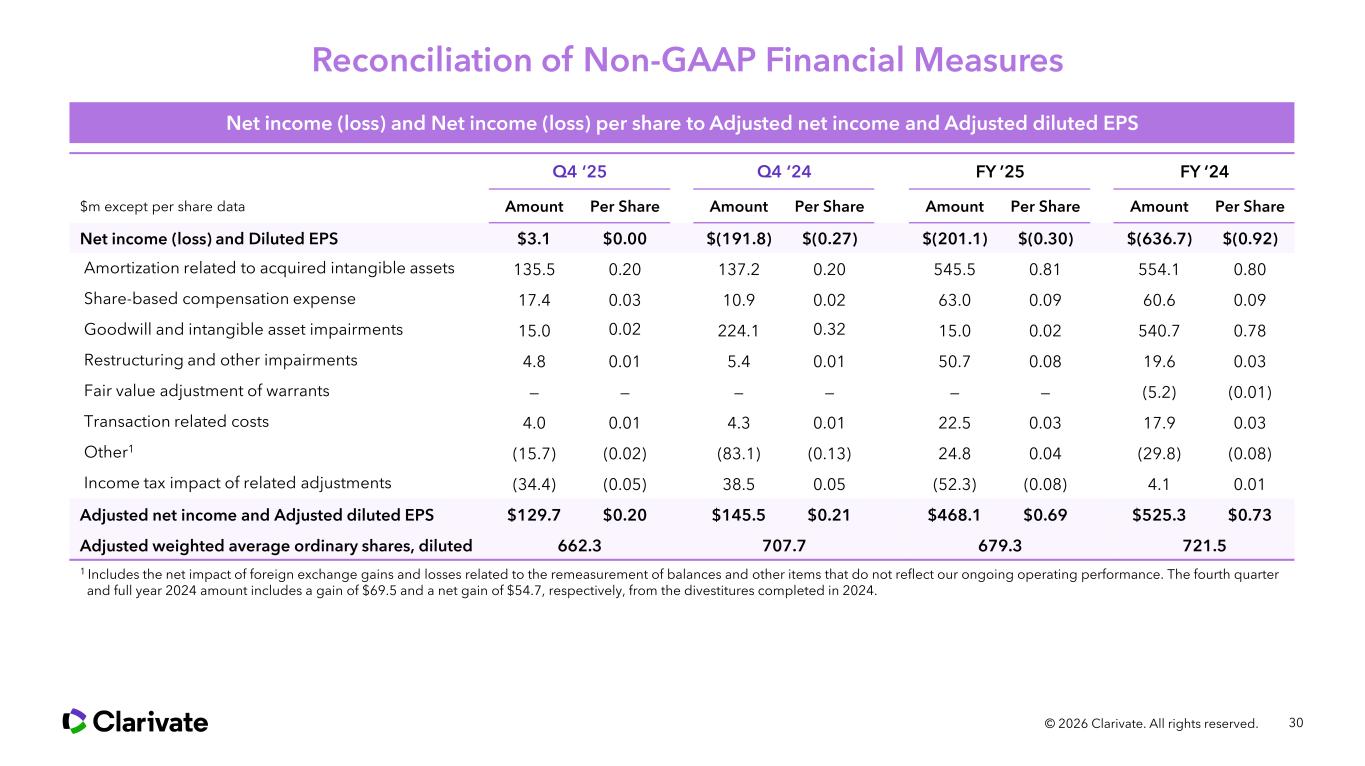
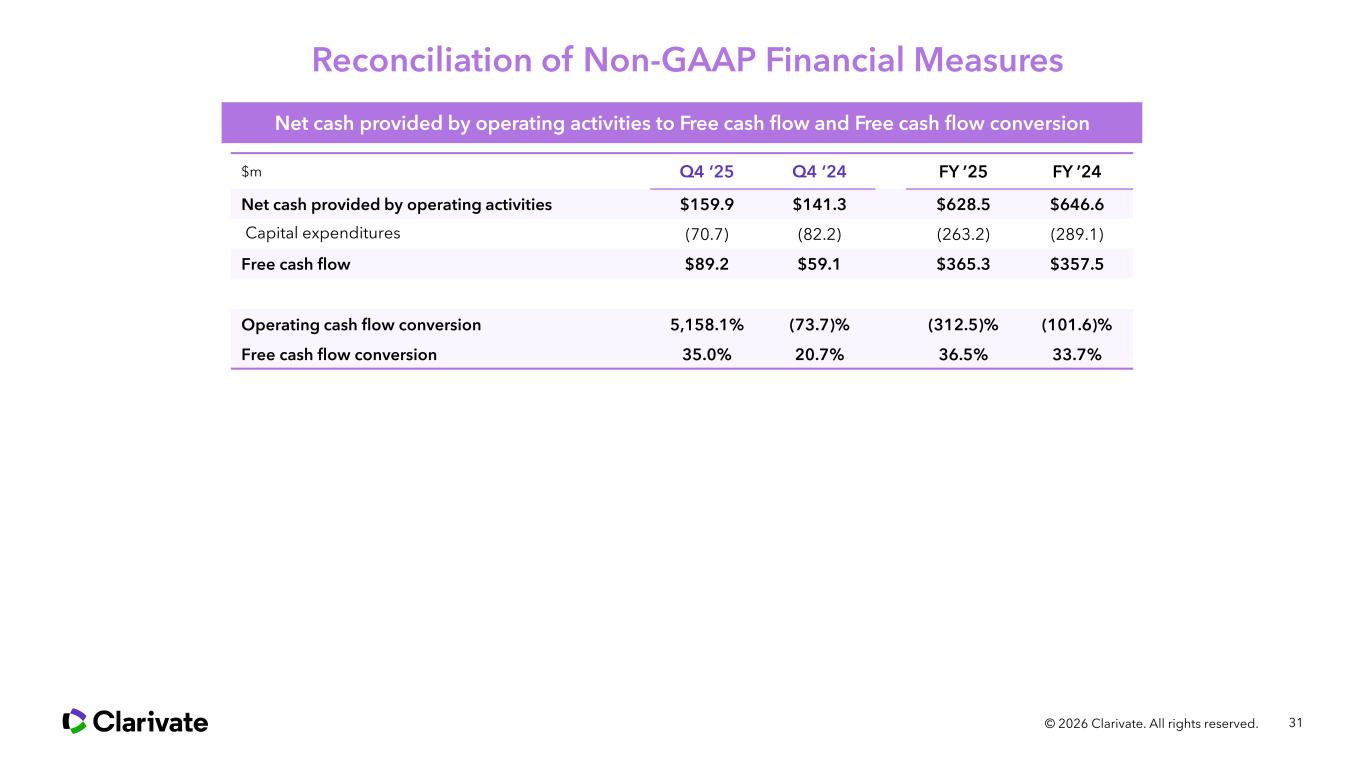
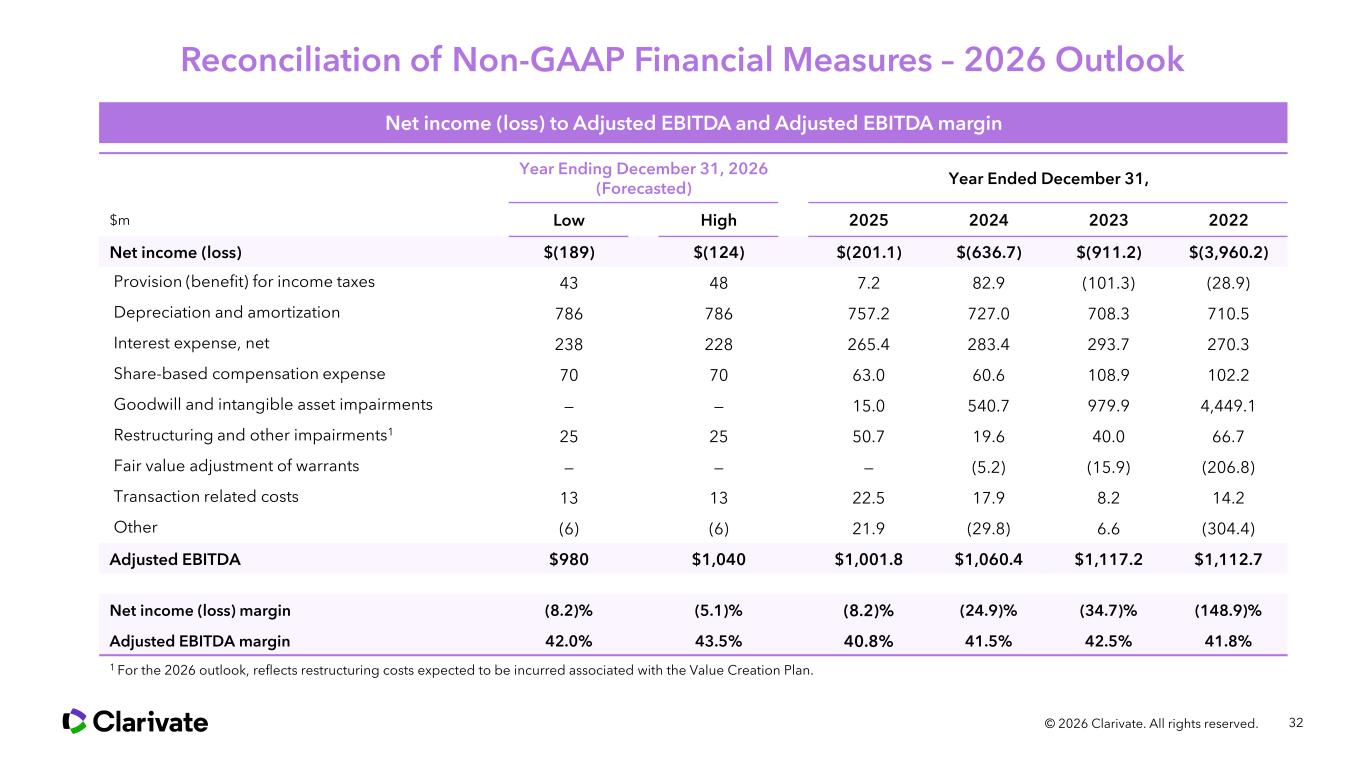
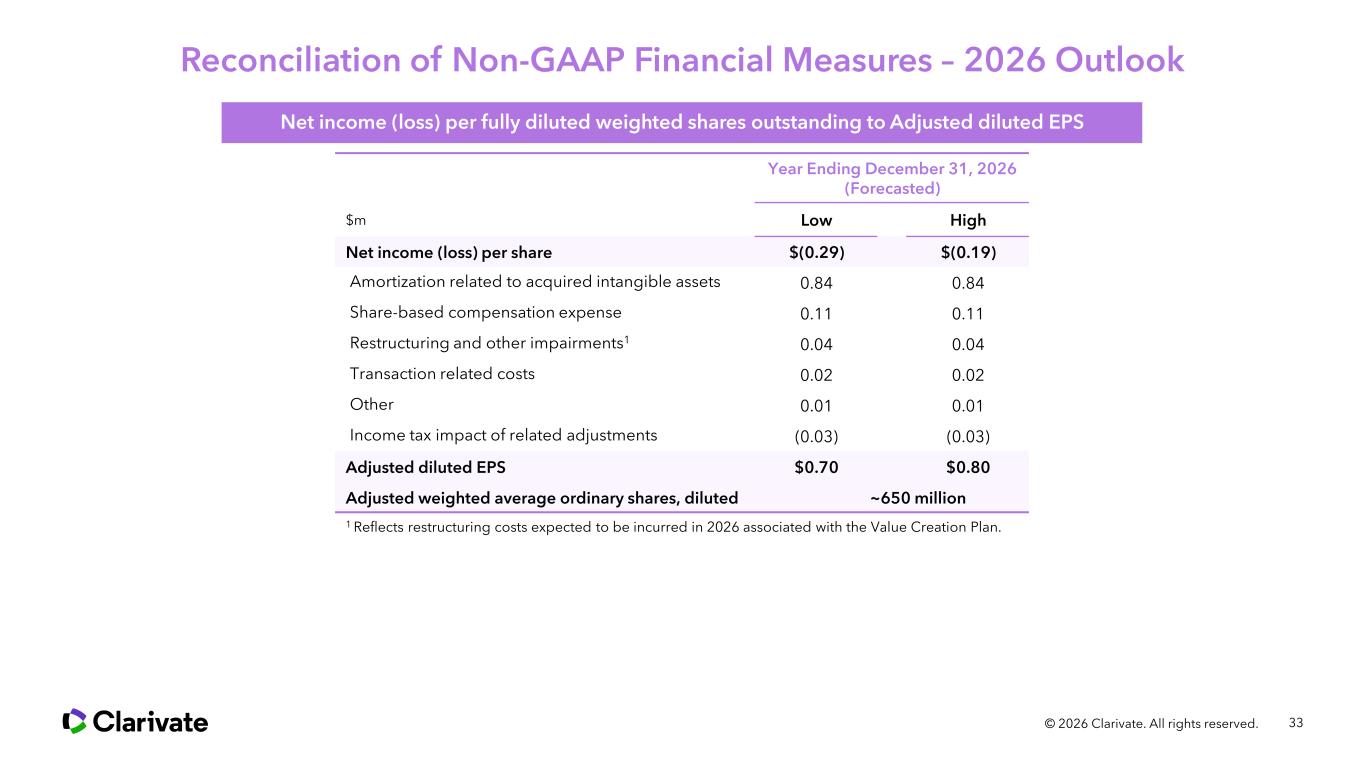
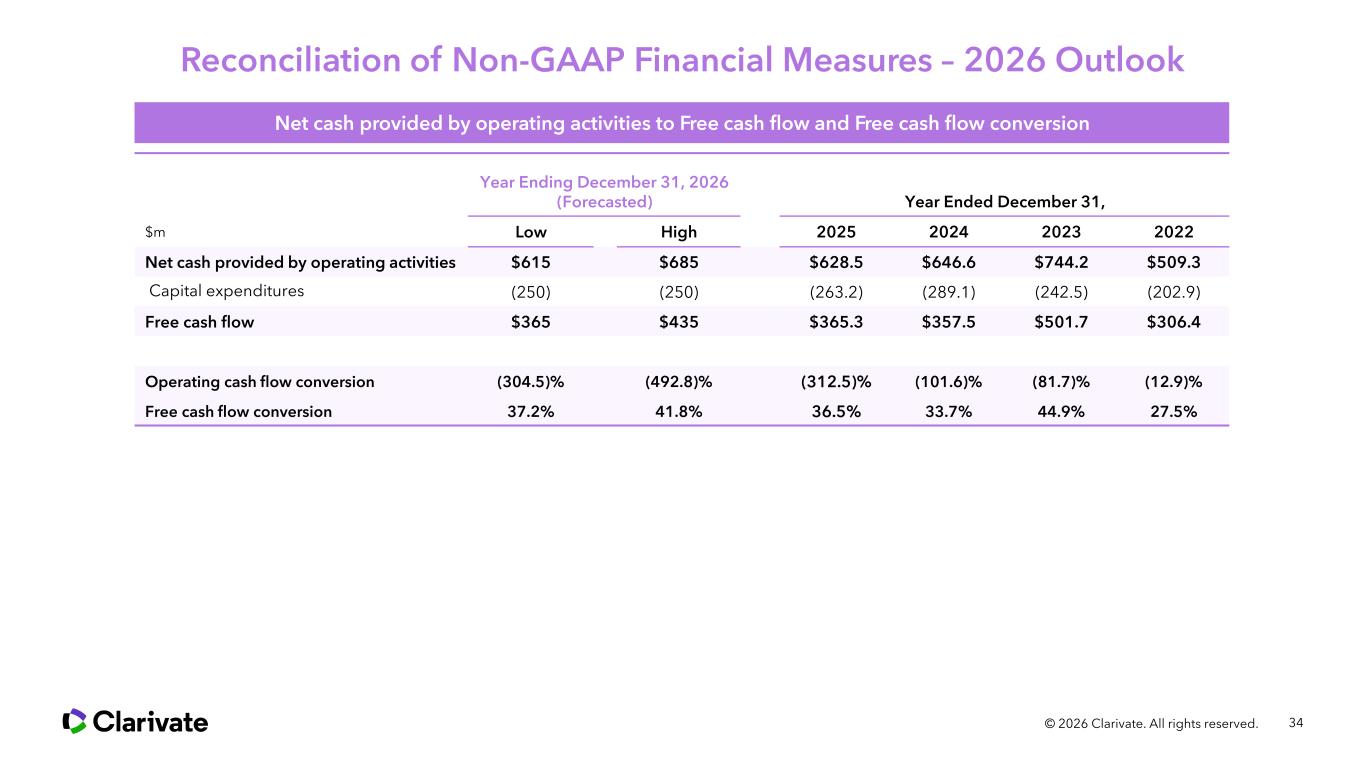
Thank you, Matti. Slide 17 is an overview of our fourth quarter and full-year financial results compared with the same periods from the prior year. Q4 revenue was $617 million, bringing the full year to $2.455 billion. The change in the quarter and the year was entirely inorganic as we disposed of and divested businesses over the last year. Fourth quarter net income was $3 million. The $195 million improvement over Q4 of the prior year and the full year improvement of $436 million was driven by the noncash impairment charges recorded in the prior year that did not recur in 2025 as well as lower income tax and interest expense. Adjusted diluted EPS, which excludes items like the impairment, was up $0.02 sequentially at $0.20. The change over last year was entirely inorganic. Operating cash flow was $160 million in the quarter. The $19 million improvement compared to last year is driven primarily by working capital and lower interest and taxes. Please turn with me now to Page 18 for a closer look at the drivers of the fourth quarter top and bottom line changes from the prior year. As expected, the changes over the prior year were driven by four primary factors. First, while organic subscription revenues continued to grow at 1% following the continued acceleration in our ACV, total organic revenue declined by about 1% as the subscription growth was offset by recurring and transactional. Fourth quarter operating expenses were higher as we continued to invest in innovation and incurred higher incentive compensation expense as we delivered our full-year guidance, resulting in a $16 million profit decline. Second, during Q4, the businesses we are disposing decreased by $43 million over the prior year, but was largely offset by cost reductions in these businesses, yielding a net $10 million reduction in adjusted EBITDA. Third, as we have seen in the last couple of quarters, we experienced a modest inorganic impact from the ScholarOne divestiture. And fourth, the U.S. dollar remained relatively weaker against a basket of foreign currencies, which caused a foreign exchange tailwind on the top line that was partially offset by fewer transaction gains than the prior year, resulting in a small profit impact. We exited 2025 with a Q4 profit margin run rate of just over 41%, which was about 50 bps higher than the full-year results. Please turn with me now to Page 19 to review how these same drivers impacted the top and bottom line changes on a full-year basis compared to 2024. As Matti noted in his remarks, our full-year revenue and profit results were above the high end of the original guidance ranges we provided a year ago. While recurring organic growth approached 1%, this was offset by organic transactional revenues, resulting in essentially flat organic revenue. Full-year operating expenses were higher than the prior year as we continued to invest in growth and incurred higher incentive compensation expense as we delivered our full-year guidance. The entire revenue change and the vast majority of the profit difference came from the combined impact of the disposals and divestitures, which lowered revenue by about $116 million and adjusted EBITDA by about $44 million compared to the prior year. Both the top and bottom lines benefited from foreign exchange translation as the U.S. dollar weakened compared to a basket of foreign currencies. Please turn with me now to Page 20 for a look at how the Q4 and full-year adjusted EBITDA converted to free cash flow and how we allocated the capital. Free cash flow was $89 million in the fourth quarter, bringing the full year to $365 million, towards the higher end of our guidance range, which is about 2% growth over the prior year as lower adjusted EBITDA and higher one-time costs were more than offset by lower working capital, capital spending, interest and taxes. We used the free cash flow we generated to buy back $225 million worth of stock. We called $100 million of the bonds that were due later this year and then called the remaining $100 million in January of 2026. This balanced deployment of capital allowed us to maintain net leverage at approximately four turns while retiring $56 million or 7% of our outstanding shares. Please turn with me now to Page 21 for a look at our full-year financial guidance ranges for this year. Beginning at the top of the page, we anticipate the acceleration of our organic annual contract value last year will continue in 2026, resulting in growth of between 2% and 3%, representing continued steady progress and an increase of about 0.75 percentage point at the midpoint of the range. We expect recurring organic growth of about 1.5% at the midpoint of our range, which is an improvement of nearly 1 percentage point over last year. Due entirely to the wind down of the businesses we are disposing, we expect revenue to decline by almost $100 million at the midpoint of the range to $2.36 billion and that our organic recurring revenue mix, which excludes the impact of the disposals, will improve to between 88% and 90%. Moving down the page, we expect adjusted EBITDA will grow modestly despite the lower revenue, increasing our profit margin to nearly 43% at the midpoint of the range. We anticipate diluted adjusted EPS will grow about 9% at the midpoint of the range to $0.75, largely due to the share repurchases we completed last year. Finally, free cash flow is expected to grow by about 10% to $400 million at the midpoint of the range. Please turn with me now to Page 22 for more details on the full-year top and bottom line changes we are expecting compared to last year. We expect adjusted EBITDA margin will expand by about 200 basis points at the midpoint of the ranges driven by a return to organic growth, continued aggressive cost management and completing the strategic disposals. We anticipate organic growth of about 1%, led by subscription revenue growth from continued ACV acceleration. We have plans in place to achieve cost efficiencies to fully offset inflation, resulting in a full flow-through of the approximately $25 million of revenue growth to profit. This will account for about 1/3 of the profit margin expansion. The strategic disposals are expected to lower revenue this year by approximately $130 million, and we are reducing operating expenses by more than $100 million, which yields a profit impact of about $25 million, delivering the remaining 2/3 of the profit margin expansion. As Matti highlighted, we are pursuing the sale of our LS&H segment. However, our financial guidance for this year assumes we will own this business for the entire year. And if agreement is reached, a revision to our guidance for this potential divestiture may come later in the year. We continue to anticipate a modest foreign exchange translation benefit to the top and bottom lines of $10 million and $5 million, respectively, as the U.S. dollar is expected to remain slightly weaker against other foreign currencies compared to last year. Please turn with me now to Page 23 to step through a high-level overview of the expected seasonality of our revenues and profits this year. Broadly speaking, we expect to make continued progress as we move through the year. However, it's worth highlighting some timing differences that will affect our trajectory. First, in our annual contract value, we often see timing differences with renewals in the first quarter. And as a result, we anticipate a slight sequential pullback in Q1, but steady acceleration through the balance of the year. Second, last year, we saw mid-single-digit organic growth in our recurring revenues in Q1 due largely to patent renewal accelerations in the U.S. that will not recur this year and will unwind in the first half. The combination of these two factors should result in recurring organic revenue growth that is essentially flat in Q1 and will result in a profit margin that's similar to Q1 of last year with the margin expansion occurring in the balance of the year. Finally, it's worth noting that our transactional books revenue will cease this summer, resulting in a sequential step down from the first to second half. But as I noted on the prior page, this disposal will expand our profit margin. Please turn with me now to Page 24 to step through our expected path to delivering approximately $400 million of free cash flow this year. At the midpoint of our range, we expect free cash flow will grow about $35 million or 10% over last year. One-time costs are expected to abate primarily on lower restructuring costs. As noted a couple of pages ago, our guidance does not contemplate the sale of our LS&H segment. If we reach an agreement, this is an area we would update later this year. We expect cash interest to improve by about $20 million over the prior year as a result of the debt we prepaid last year and last month, additional debt we plan to prepay this year and some savings associated with the projected forward base rate curve. Cash taxes are expected to be $5 million to $10 million higher than last year, due largely to new corporate tax in Jersey. We anticipate the change in working capital this year will be a use of approximately $20 million compared to last year's source of just over $10 million, primarily due to incentive compensation payments early this year. We're also expecting a $10 million benefit associated with lower impaired contractual costs. And while we remain committed to investing in product innovation, the strategic disposals and cost efficiencies will improve capital spending by another $15 million following last year's savings of more than $25 million. From a capital allocation perspective, we plan to lean more towards deleveraging this year and started last month by retiring the final $100 million of bonds that were due later this year. In closing on Page 25, I want to draw attention to the consistent free cash flow we have generated over the past four years. Last year's free cash flow of $365 million resulted in a four-year cumulative average growth rate of 6% with expected accelerated growth this year of 10%. At the current stock price, our stock is yielding a free cash flow return of 30%. Over the past four years, we generated a combined $1.9 billion of free cash flow and asset sale proceeds, which we used to repay $1.2 billion of debt, lowering our net leverage by more than a turn and to repurchase about $700 million of stock, lowering our share count by 13%. And we expect to generate another $400 million this year and may generate proceeds from the potential sale of our LS&H business to further strengthen our balance sheet. We continue to believe executing the value creation plan will lead to healthy, sustainable organic revenue growth, further accelerating our free cash flow growth in the coming years, delivering meaningful value for shareholders moving forward. I want to thank everyone for listening in this morning. I'll now turn the call back over to the operator to take your questions.
Operator
Your first question comes from Toni Kaplan with Morgan Stanley.
Speaker 4
I was hoping you could talk about your monetization model for your subscriptions and for the new AI products. I think historically, some of your subscriptions at least were based on seat licenses and which products were being used by clients as well. So is that still the model that is underlying the subscriptions? Or have you been changing that? And I guess, approximately what percentage of revenue is based on seat licenses?
So, thank you, Toni. This is Matti. We continue to use AI to our advantage with protecting and growing the base of our subscription revenue. We have upsell opportunities, upselling some of the AI innovation for existing products. And then we are constantly introducing new products. We are creating totally new revenues. In terms of the business model, we have quite a number of different products with different pricing models. We have rationalized some of our business model. For example, Web of Science, we have actually streamlined to be more and more subscription-based products as opposed to one-time. I'm not sure we can share the numbers. Maybe Jonathan can add to this in terms of the breakdown?
Yes. Thanks, Toni. More broadly, for example, within the A&G segment, as Matti highlighted, the pricing of the subscriptions is based on the size of the institution, so not necessarily the exact amount of students or researchers, but the size of the institution certainly affects that model. As we think about the adoption of AI, we believe that as we bring those features and capabilities into the products, whether it's the researcher assistants, the workflow agents or access to our content via the broader AI ecosystem, there's an opportunity to continue to harden the renewal rates, demonstrate more value and drive better pricing and offer new AI-type solutions such as the research intelligence that we just featured in that market. In our corporate markets and in the law firm markets, it's similar based on the size of the company and based on the size of the law firm is effectively how the pricing grid works for the subscription products. We expect that to continue based on the size of the institution will be broadly how we price the subscription products.
For clarity, some products are influenced by the size of the institution and the actual full-time equivalent users. At this point, I don't see this as a major concern. I understand the origin of the question, but we are not worried about it. Our renewal rates and usage are both increasing. Perhaps you can discuss where we stand in relation to the first quarter?
Yes, we continue to see progress across our key metrics early in Q1. When we release our Q1 results in a couple of months, we believe we will demonstrate that we're on the right path. We are moving in the right direction, which is the best indication of the value we think we can capture from the technology shift.
Operator
Your next question comes from Scott Wurtzel with Wolfe Research.
Speaker 5
Just wondering if you can explain or give a little bit more detail on the 97% of revenue coming from proprietary data and specifically on how the tech-enabled and workflows kind of fit into that would be great.
There are two main questions to address: the AI aspect and the workflow aspect, which are somewhat different for us. To recap, 97% of our business is based on proprietary data, with around 60% coming from information services and approximately 20% from enterprise software. Let's first discuss information services. Our data comes from three sources: public, licensed, and some that are exclusively generated internally. The value we provide is independent of the data source. Most of the value comes from our ability to create, enhance, harmonize, and embed the data within the right algorithms in the end customers' workflow ecosystem. I will give two examples to clarify this. For instance, in Academia & Government, the harmonized data is directly integrated into research, funding allocation, publishing decisions, and science policy workflows. Transparency and auditability are crucial, which is why our platform supports decisions on where researchers publish, how governments allocate funds, and how universities evaluate performance. General-purpose AI tools that lack proper provenance cannot replace this critical workflow. Another example involves pharmaceutical companies using general-purpose language models to inquire about drug safety profiles. These models provide useful information but can be incomplete and outdated. In contrast, using Clarivate's Cortellis platform gives customers access to 3 million expertly curated safety and toxicity alerts that are continuously updated by our in-house scientists. This represents not just better data, but an entirely different level of intelligence that significantly impacts high-stakes decisions in drug and medical device development. Overall, this strong positioning contributes to our improvement in renewal rates, currently at 93%. Now, regarding the workflow component, which makes up 20% of our business, the IPMS software business drives our IP operations. There is also a significant software component within A&G and the Alma and Polaris products. With almost 30 years in enterprise software, I can confidently say that while some fear AI may commoditize coding, we believe we are well-positioned. AI is not meant to develop code; we utilize it to accelerate our own development process. However, we possess inherent competitive advantages as an enterprise software provider, including established commercial channels, switching and implementation dynamics, workflow integration, and critical factors like security and governance. This is why we believe that 93% of our business remains proprietary, and we are committed to demonstrating this in future quarters. Thank you for the question.
Operator
Your next question is from George Tong with Goldman Sachs.
Speaker 6
What were the key considerations that led you to initiate a sale process for your Life Sciences & Healthcare business? Why did you deem LS&H as nonstrategic and A&G and IP as...
When I joined the company, I mentioned that our ultimate goal is to create shareholder value. We launched the value creation plan with four pillars, with the fourth being strategic alternatives. We have shown success in this plan, increasing our recurring sales execution from 80% to 88%. We see significant momentum in AI innovation and believe we can generate shareholder value through strategic alternatives. After evaluating our options, we have decided that the Life Science segment presents the best opportunity for sale. We will also enhance our focus and operational execution in the A&G and IP segments to strengthen our balance sheet. It makes sense to keep the IP and A&G segments together due to the benefits from shared content assets, technology platforms, commercial channel scales, and enhanced innovation. If we ever decide to separate them in the future, we will certainly keep you updated.
Operator
Your next question is from Manav Patnaik with Barclays.
Speaker 7
I would like to follow up on your last comment, Matti, regarding the strategic synergies between IP and Academia & Government. Could you elaborate on what you mentioned towards the end? How might these two segments potentially collaborate?
I believe it is beneficial to keep IP and A&G together due to the shared content that flows between the two segments. We are utilizing our technology platform, and as I mentioned earlier, IPMS and Alma are both software systems. We are currently developing agentic capabilities in Alma and plan to leverage our expertise with both Alma and Polaris through collaboration. Recently, we appointed a new CTO and a new Head of Software in IPMS. This fosters cooperation between the software expertise in A&G and the IPMS software division, which is a critical part of our business. So far, collaboration has been limited, but there is significant potential. We have commercial channels with customers who purchase from both IP and Academia, including major universities' tech transfer accounts. I cannot disclose names, but we are taking over the annuity business, expanding our market, and selling the annuity service to leading universities in the U.S. This is driving innovation, and we see that the academic AI capabilities of A&G will further accelerate AI innovation. We are also running common projects aimed at cost reduction in collaboration with all three segments while exploring additional opportunities. There are many possibilities ahead. At the same time, we can operate the three segments independently. We will continue to benefit from our shared resources while maintaining the flexibility to operate separately in the future to enhance shareholder value.
Operator
Your next question is from Shlomo Rosenbaum with Stifel.
Speaker 8
Can you discuss the IP segment and what it will take to return that business to organic revenue growth after the declines? What is happening behind the scenes that will enable this? Additionally, what is a realistic time frame for investors to expect this improvement? This segment is likely the biggest value driver for your company from an operational perspective.
Yes. I'll start and then Jonathan can join in. First, let's remember that we are the largest player in the IP market, with the best assets in a unique position. I mentioned earlier that we have the largest annuity book and IPMS technology that continues to attract more customers. We provide patent searches and trademark services. While we have noticed some weaknesses in recent years, we are coming from a very strong foundation with an almost $800 million business and an impressive customer base. With Maroun joining us as the new CTO and the new Head of Software, we need to focus more on innovation, execution, and subscription models. I am very confident that we can turn this IP segment around, and we are beginning to see early signs of this turnaround. In 2025, we achieved a 200 basis points year-over-year improvement in our annuity books. Surveys indicate that the overall worldwide annuity book is growing, and we are poised to reclaim our market share. The outlook for IP is increasingly positive, and our team is aligned, which makes me optimistic about the turnaround, though it will take time and won't happen overnight. Jonathan, do you have anything to add?
Yes, Shlomo, I want to highlight two key points that Matti mentioned. First, the commercialization and adoption of new product innovations will be a significant driver for our intelligence offerings within IP. Last year, we launched the new Derwent Patent search, which entered the market early. The Derwent Patent monitor, utilizing agentic AI to identify potential infringements, helps companies safeguard their intellectual property. The uptake of these tools is exciting and will propel growth in patent intelligence. Matti also mentioned the new RiskMark product for trademarks, which employs AI capabilities to assist companies in protecting their brands and trademarks. Product innovation is essential, as he noted. Secondly, I want to emphasize the ongoing market recovery. As Matti pointed out, the annuity business experienced a slight decline in 2024 but returned to flat last year. Key indicators, such as the growth in global patent activity, suggest an upward trend. We’ve observed healthy growth in this area for a few consecutive years, although it typically takes 2 to 3 years for these changes to impact the annuity business. We are optimistic about the recovery in global IP. Furthermore, we believe the AI boom will continue to encourage new patent filings worldwide, providing a positive push for our business. It's a combination of our controllable factors and the recovering market.
Operator
Your next question comes from Ashish Sabadra with RBC.
Speaker 9
Solid free cash flow generation in the quarter and the guidance also reflects on robust free cash flow generation. My question was more focused on capital allocation priorities. You talked about leaning more towards deleveraging, but at the same time, talked about stock trading at 30% free cash flow. So I just wanted to better understand the rationale for deleveraging over buyback this year. And just if you could provide us incremental color on when is the debt due? My understanding is it's not due until 2028. So any color on those capital allocation priorities?
You got it, Ashish. This is Jonathan. Yes, I'll just touch on that second point. You're right. We have a patient capital structure. We don't have any maturities for the next couple of years. But our current judgment is that just based on the overall market environment, we will best serve all of our investors by focusing on deleveraging this year. So we noted in the materials that we've done a balance over the course of the last four years. Most of it's been deleveraging, but we've also lowered the share count in the business by 13%. And we do think that the stock is yielding a very attractive free cash flow return. But on balance, we think leaning more towards repaying debt over the next 2026 time frame makes the most sense. So we'll continue to look at conditions in the market, but our judgment right now is that leaning towards deleveraging is the best way to create value.
Operator
Your final question comes from Andrew Nicholas with William Blair.
Speaker 10
I just wanted to ask about price realization. Can you speak a little bit to the composition of both ACV and recurring revenue growth in '25? How much of that came from price and what your expectation is in terms of price realization going forward?
Yes. Thank you for the question, Andrew. It's Jonathan. Just a couple of points here. The headline is our price realization has been pretty consistent over the last couple of years. Where we are seeing improvements in our ACV and in our recurring organic growth is really from volume. So we're seeing improvements in our renewal rate. We're seeing acceleration of new subscription sales. That's what's driving the improvement there. We continue to see opportunities to monetize investments that we make into the product through the price increases, but we do expect that it's that volume component of our subscription and recurring organic growth that's really going to help us to continue to accelerate through this year, monetizing the investments that we've made into the products with fewer cancellations and downgrades, more new subscription sales, and we think that's really what's going to help propel us to an improved outcome in 2026.
Operator
There are no further questions at this time. I'll now turn the call back over for closing remarks.
Yes. Thank you, everyone, for listening in this morning.
Operator
This concludes today's conference call. Thank you all for participating. You may now disconnect.