Operator
Thank you for standing by. My name is Danica and I will be your conference operator today. At this time, I would like to welcome everyone to the Clearwater Paper Second Quarter 2025 Earnings Call. All lines have been placed on mute to prevent any background noise. After the speaker's remarks, there will be a question and answer session. If you would like to ask a question during this time, simply press star followed by the number 1 on your telephone keypad. If you would like to withdraw your question, press star 1 again. Thank you. I would now like to turn the call over to Sloan Bolin, Investor Relations. Please go ahead.
Thank you, Danica, and thank you all for joining Clearwater Papers' second quarter 2025 earnings conference call. Joining me on the call today are Arson Kitsch, President and Chief Executive Officer, and Sherry Baker, Senior Vice President, who were released shortly after today's market close. You will find a presentation of supplemental information including a slide providing the company's current outlook posted on the investor relations page of our website. Additionally, we will be hosting or we will be providing certain non-GAAP financial information in this afternoon's discussion. Reconciliation of the non-GAAP information to comparable GAAP information is included in the press release and in the supplemental information provided on our website.
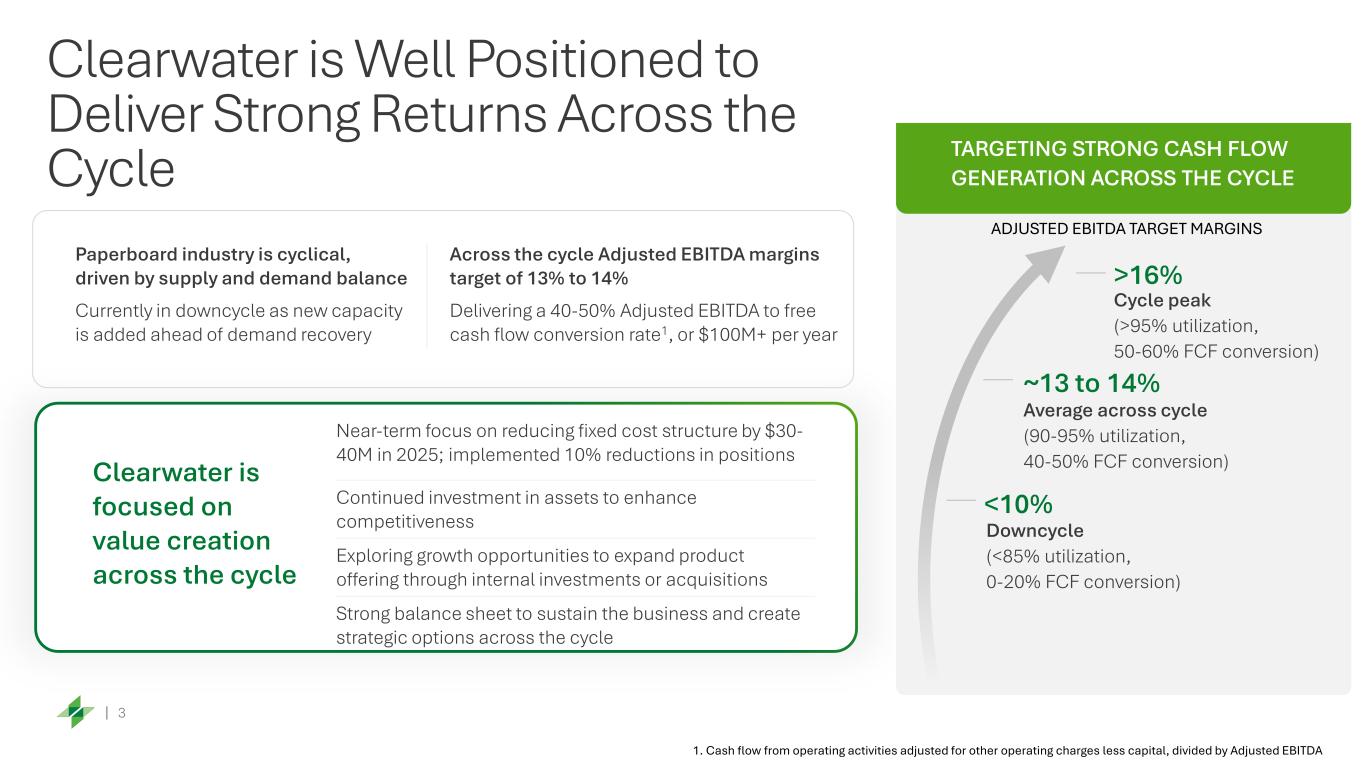
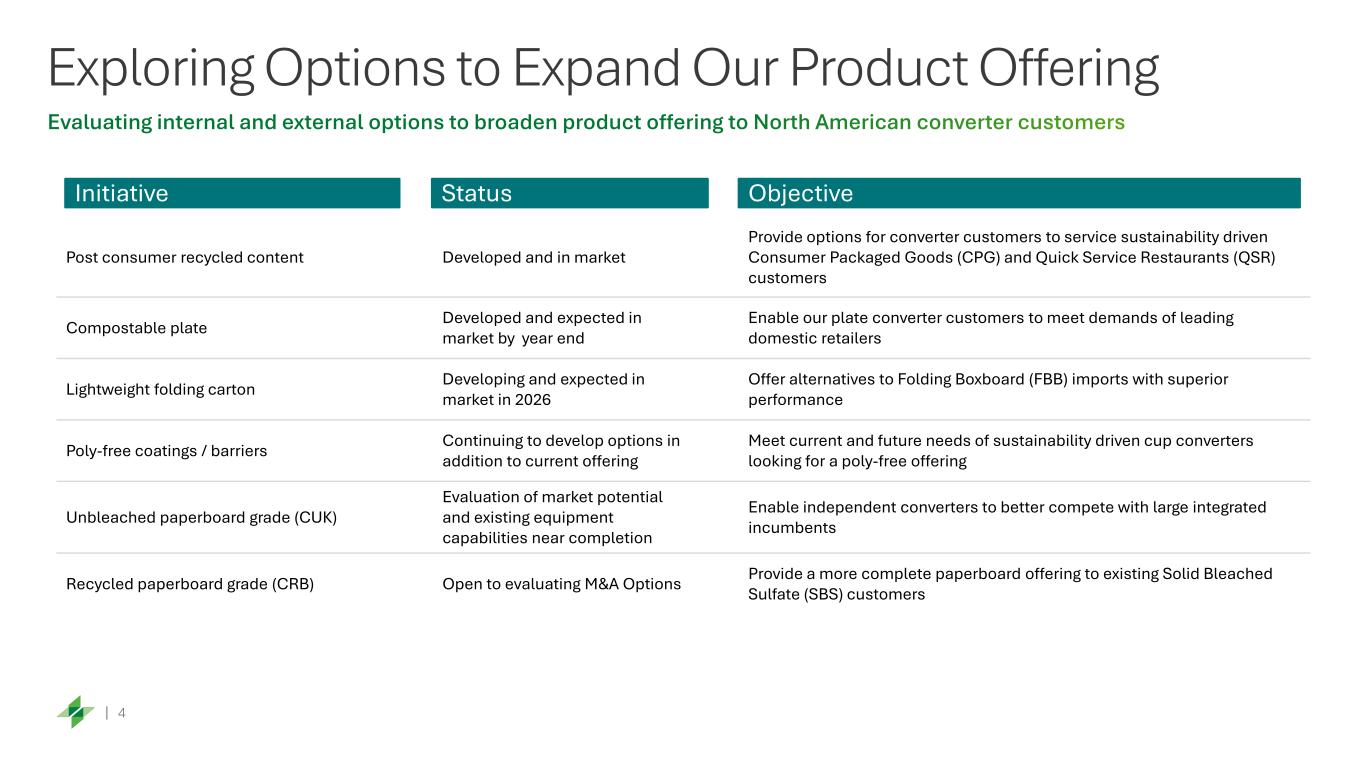
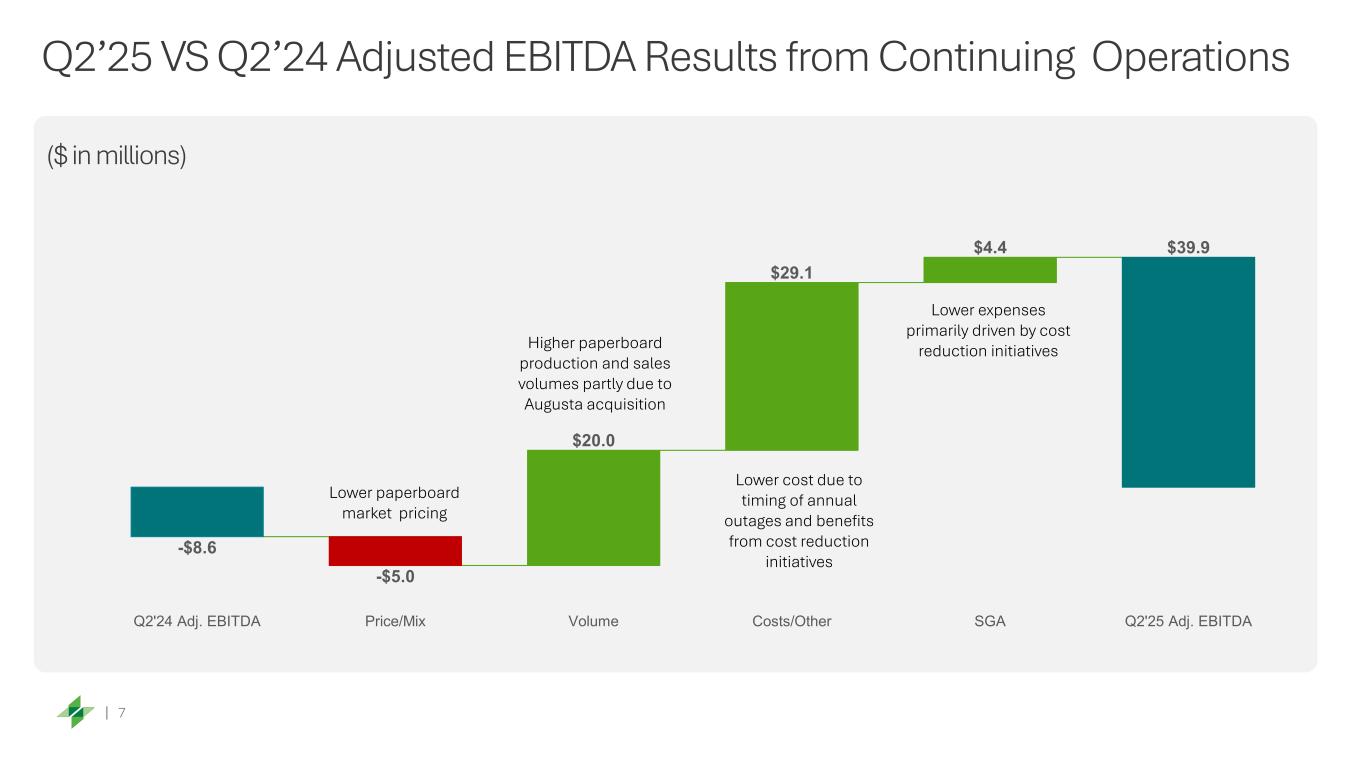
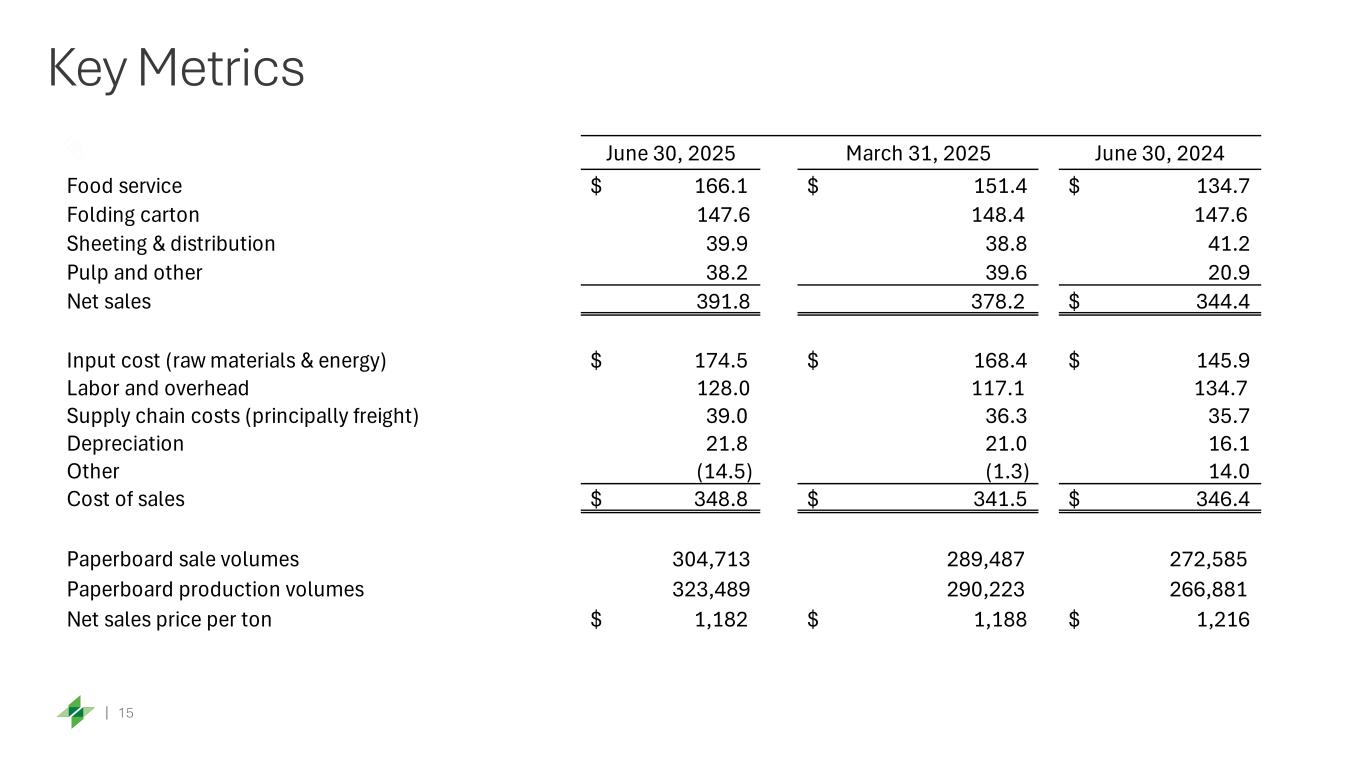
Please note slide two of our supplemental information covering forward-looking statements rather than reading this slide we will incorporate it by reference into our prepared remarks and with that let me turn the call over good afternoon and thank you for joining us today we delivered a strong second quarter that was in line with our expectations this was driven by higher production volumes increased shipments and continued benefits from our fixed cost reduction efforts let me share a few highlights before diving into industry conditions in our strategic initiatives. We delivered $40 million of adjusted EBITDA in the second quarter, which was right in the middle of our guidance range of $35 to $45 million. Our net sales were at $392 million, up 14% versus prior year, primarily driven by the Augusta acquisition and partly offset by lower market-driven pricing. Net sales were also up 4% versus the first quarter of this year, primarily driven by increased shipments in our food service business. Pricing remained relatively stable versus the first quarter, but was down approximately 3% versus prior year, reflecting broader market trends. We successfully completed the planned major maintenance outage at our Cypress Bend, Arkansas mill at a cost of approximately $9 million, which was in line with our estimates. As part of this outage we completed the installation of a new emissions control device replacing the original piece of equipment which was installed in 1970s. This was a large capital project with a total cost of nearly 45 million. We continue to benefit we continue to capture benefits from our fixed cost reduction efforts and are on track to deliver a 30 to 40 million dollar reduction this year versus 2024. as GNA expenses were down nearly 14% versus last year to 6.7% of net sales within our target range of six to 7%. This was driven by our cost reduction initiatives and the completion of the Augusta integration. And finally, we repurchased approximately $4 million of outstanding shares for a total of $15 million since the beginning of this year and $18 million since the new authorization in november of last year our team is doing a great job navigating challenging industry conditions by focusing on items within our control namely driving operational execution reducing cost and defending our market position we believe that this discipline will translate to sustained improvements in performance and higher margins upon a recovery in our industry cycle next i'd like to provide some commentary on broader industry conditions at a macro level industry shipments of sbs slowed in q2 decreasing by 4.6 percent versus the prior year and by 3.4 percent versus the first quarter based on afnpa data while shipments decreased backlogs increased by 5% versus prior year and 14.2% versus the first quarter. These mixed demand signals are reflective of broader economic uncertainty that is also impacting other industry segments. Now let's turn to supply. Industry utilization rates fell to 83.1% in the second quarter versus 84.7% in the first quarter based on the latest data of NPA data. This likely reflects the startup of new capacity in the second quarter by a competitor. We expect SPS industry utilization rates to remain well below historical norms in the coming quarters as this new capacity ramps up. As a reminder, we believe that in a balanced supply and demand environment, utilization rates should be between 90 and 95 percent. While demand trends are mixed, we believe that we're in an industry down cycle primarily driven by oversupply. It is difficult to predict when and how the industry will return to a mid-cycle utilization level. We believe that there are a few different ways that industry utilization rates can improve in the medium to long term. First, RECI is projecting that net SBS capacity in the U.S. will decrease by approximately 350,000 tons in 2026 versus 2025, which would drive utilization rates to around 91%. This would move the industry back into a more balanced mid-cycle position. Second, proposed tariffs, trade investigations, and anti-dumping actions may also impact the viability of imports in our market. We estimate that approximately 700,000 to 800,000 tons of bleached paperboard and finished goods are imported to the U.S. annually. The shift to domestic supply by U.S. customers could improve industry operating rates. We also believe that there's some swing SBS capacity in North America that can move to other grades, which could further alleviate the oversupply position that our industry is facing. A combination of these three variables would help return the industry to more sustainable operating rates and lead to a margin recovery. Finally, we believe that current demand softness is temporary and not a permanent or secular decline as a reminder we're targeting 13 to 14 percent adjusted EBITDA margins across the cycle which assumes that industry utilization rates recover to 90 to 95 percent this would result in more than 1.3 million tons of paperboard volume which we estimate would translate into approximately 1.8 to 1.9 billion of revenue around $250 million of adjusted EBITDA, and more than $100 million of free cash flow per year. Let me take a moment to illustrate the operating and price leverage that exists in our system. A 100,000 ton increase in sales and production volumes would result in more than $50 million of adjusted contribution margin with improved cost absorption. A modest $50 per ton upward price movement would result in more than 60 million of additional adjusted EBITDA. Let's shift gears and discuss our strategic initiatives and potential next steps. As we mentioned previously, we're focused on expanding our product offering to better serve our converter customers. Our goal is to continue to build on our position as a premier independent supplier of paperboard packaging products in North America. Today we are the third largest producer of paperboard in North America representing approximately 14 percent of a 10 million ton market. We are focused on SBS or bleached paperboard which makes up approximately half of the total paperboard market. We are looking at opportunities to expand into CUK or unbleached paperboard and CRB or recycled paperboard. We believe that today independent converters are underserved in these substrates by the large integrated players we have an opening to participate in one share in these parts of the market due to our lack of channel conflict and our history of prioritizing independent converters let me get a bit more specific on the work that we're doing we're nearing completion of market and engineering studies on the potential entry into cuk i expect for us to make a decision regarding this potential investment by year end At this stage, we're focused on creating C-U-K capability on one of our existing SBS machines and not expanding our overall capacity. This would enable us to swing production between high-quality SBS and C-U-K on an existing machine based on market demand. This capability would also allow us to better serve our customers' needs, optimize our network, and improve utilization across all our assets. while capital while capital estimates have not been finalized we expect this investment would be in the 50 million dollar range and take around 18 months to complete in addition to adding cuk capabilities to an existing asset we're also considering additional options to broaden our product offering including entry into crv this would likely require an acquisition either of existing CRB capacity or of a good candidate for a conversion. In addition to our focus on these additional substrates, we're continuing to make progress on developing compostable and lightweight products. We received a BPI compostable certification at our Lewiston and Cypress Bend mills that cover most of our folding carton and food service grades. In addition, we expect to have a lightweight offering in the market by 2026. We remain optimistic on the long-term prospects of paperboard packaging and our position as a premier supplier of these products to North American converters. With that, let me turn the call over to Sherry to review our results in more detail.
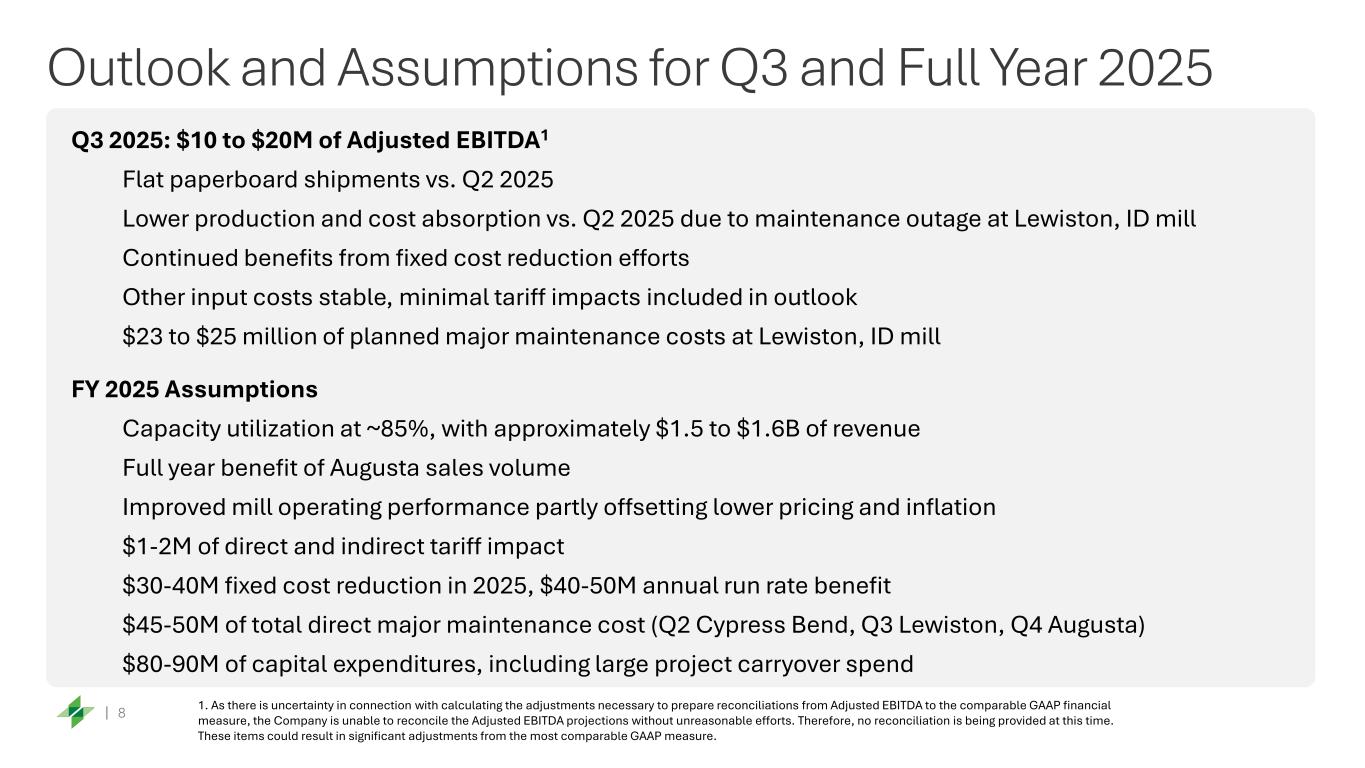
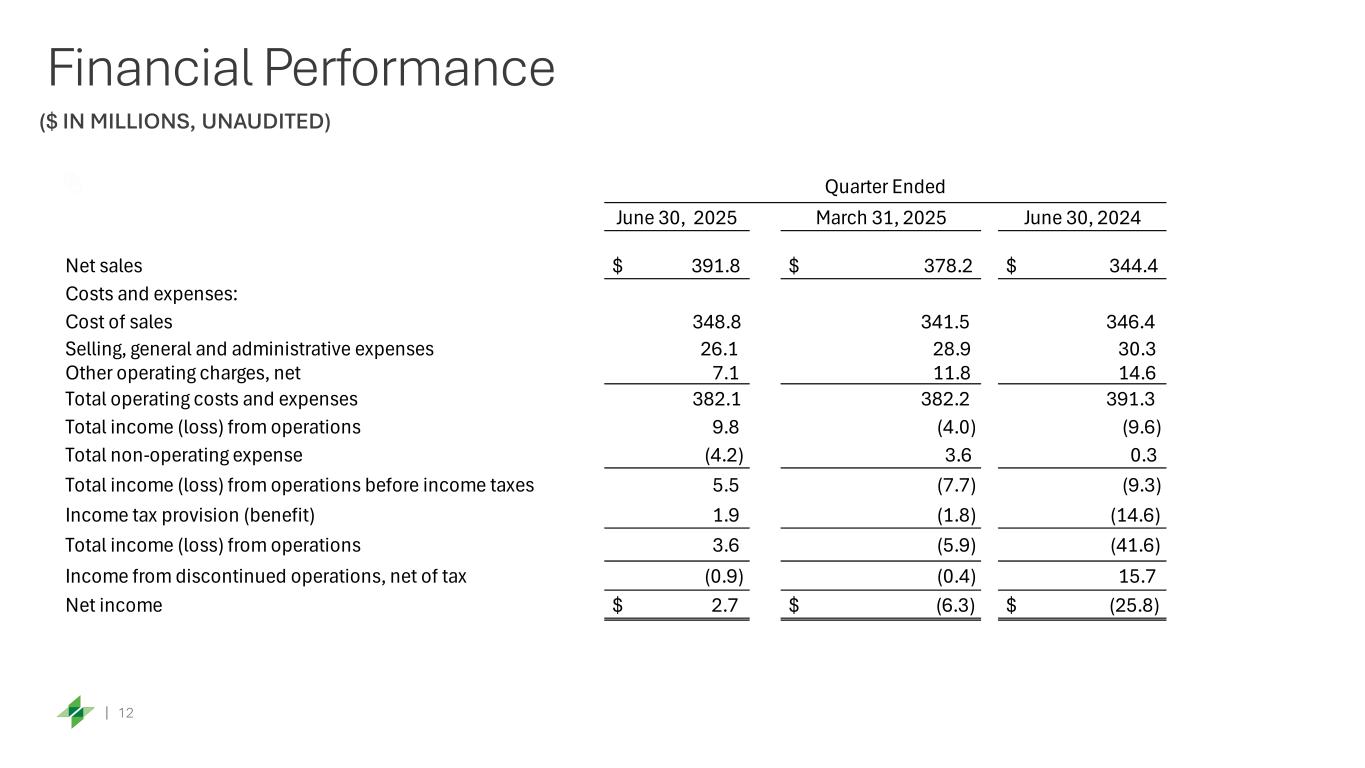
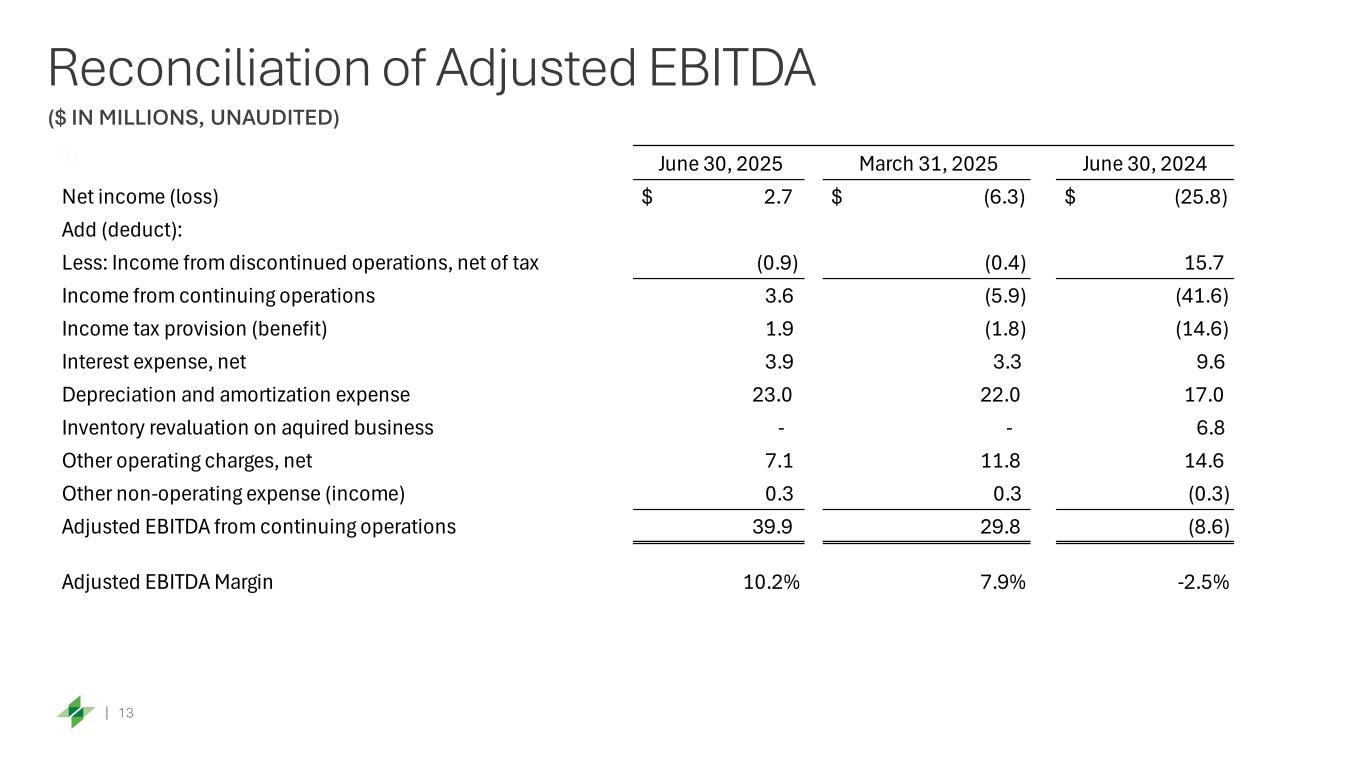
Thank you, Arson. As we mentioned, we had a strong quarter with consolidated net income from continuing operations of $4 million, or 22 cents per diluted share. At the top line, we achieved net sales of $392 million for the quarter, which represents a 4% increase compared to the first quarter of this year and a 14% increase compared to the second quarter of last year. This was driven by contributions from our Augusta acquisition, growth with existing and new customers, partly offset by lower market-driven SBS pricing. As to Augusta, this will be the last quarter where year-over-year comparisons are impacted by the timing of our acquisition. As a reminder, we completed the Augusta acquisition on May 1st of 2024. Moving to adjusted EBITDA, we delivered $40 million, which was at the midpoint of our guidance range of $35 to $45 million. This was up substantially compared to a negative $8.6 million of adjusted EBITDA last year. The resulting adjusted EBITDA margin was 10.2% in the quarter. Improved cost performance and lower major maintenance expenses more than offset lower pricing and higher input costs we are well on track to deliver the 30 to 40 million of cost savings in 2025 as outlined earlier this year as part of those efforts we reduced our q2 sdna as a percent of net sales to 6.7 compared to 8.8 a year ago we maintain our view that these efforts are sustainable and can produce annualized savings in the range of 40 to 50 million These efforts, along with the cost and price leverage that exist in our business, drive our conviction and our long-term adjusted EBITDA and free cash flow outlook. Shifting now to our balance sheet and capital allocation. Excluding our cash tax payment of $57 million related to 2024, in Q2 we drove approximately $30 million in operating cash flow, which was largely offset by capital spend as part of our projected 80 to 90 million annual CapEx guidance. In the quarter, we continued to execute against our share buyback authorization of $100 million. We repurchased $4 million of shares in Q2 and have repurchased $18 million to date against the full authorization. We view share buybacks as a sound opportunistic investment at times when we believe our shares are undervalued and we are generating sufficient free cash flows. We do not plan to use debt to fund these buybacks because maintaining a strong balance sheet continues to be a top priority. Given the nearly 40 million of planned major maintenance costs that we are anticipating in the second half of this year, continued investments into our assets, it is unlikely that we will generate sufficient free cash flows to fund material share repurchases for the balance of the year. I will close my remarks with an update on our view for 2025, including our forecast assumptions for the third quarter. We expect adjusted EBITDA in the range of 10 to 20 million based on the following assumptions. First, we expect flat paperboard shipments as compared to the second quarter of 2025. Second, we expect that our Lewiston major maintenance outage will have a direct cost impact of 23 to 25 million in addition due to the outage we will see approximately five percent lower product production volumes versus the first quarter resulting in lower cost absorption we expect to see similar benefits from our cost reduction spend that we saw in q2 for the full year 2025 our key assumptions remain largely unchanged We believe that our demand will be stable and recovering, but utilization rates will continue to be in the mid 80% range. We expect revenue to be in the 1.5 to 1.6 billion range. We are executing well against our fixed cost reduction plans and expect to deliver 30 to 40 million of savings in 2025, resulting in a 40 to 50 million annual run rate benefit. These cost savings will help to partly offset the expected price and cost inflation headwinds. We currently expect full-year tariff-related impact across our direct and indirect spend of approximately $1 to $2 million. Our full-year expectation for capital expenditures continues to be $80 to $90 million, of which we have incurred $56 million year-to-date. Recall this year's CapEx program is approximately $10 million higher than normal due to carryover spend from large projects being completed this year. Lastly, as I detailed earlier, we expect $45 to $50 million in direct major maintenance costs across our 3 mil network. Let me now turn the call back over to Arson for closing remarks.
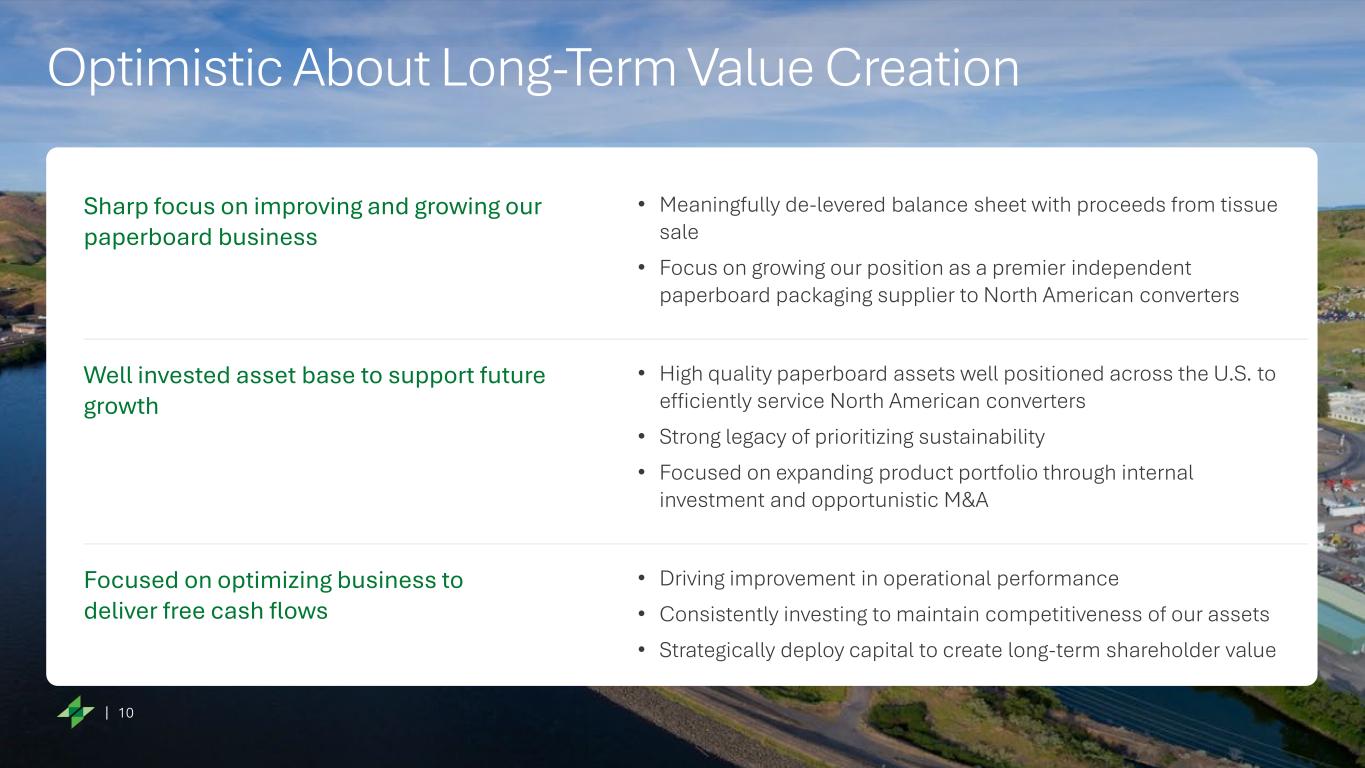
Thank you, Sherry. I'll summarize where we are today. We transformed Clearwater into a paperboard focused company with two major strategic actions in 2024. We're now focused on strengthening our position as an independent supplier of paperboard packaging products to North American converters. We're looking at opportunities to expand our product portfolio, which may include new applications for our existing paperboard as well as new substrates. We have a well-invested asset base and a strong balance sheet that will help us persevere through this part of the industry cycle. We remain optimistic about the medium to long-term prospects for our industry and our company. and as a result we expect strong margins and cash flows through the cycle and aim to strategically deploy capital to create long-term shareholder value. Finally, I'd like to thank our people for their efforts to remain focused on operating safely and providing excellent service to our customers. I would also like to thank our customers for putting their trust in us and our shareholders for their continued interest. With that we'll open it up to your questions.
Operator
At this time, I would like to remind you all, in order to ask a question, press star, then the number one on your telephone keypad. Matthew, your first question comes from Matthew McKellar with RBC. Please go ahead.
Hi, good afternoon. Thanks for taking my questions. Good afternoon, Matt. Just first here, it looks like you're expecting modest growth at an industry level in 2025, which I guess would imply a better back half for demand, are you seeing that year-over-year improvement in demand in the market today? And is the uptick in unmade NCPS orders a signal of that? And then I guess more broadly, I guess the demand outlook has softened a little bit. Your expectations around net import seems to soften a little bit as well. Could you just walk us through what's changed around your outlook at an industry level since your last update? Thanks.
That's a great question, Matt. So I think we're getting mixed mixed demand signals in Q2. So if you look at our data, our shipments were up by about 5% versus Q1 and our backlogs are stable. Industry shipments were down sequentially and they were down year over year and they're down year to date, but backlogs are up 14% versus the first quarter. So a lot of mixed signals. What we are hearing from our customers that there really isn't a serious demand issue uh there's just some near-term economic uncertainty that that's really hard to uh hard to decipher we're comfortable with where we are um i know some of the industry forecasts have come down a bit um this year from call it you know maybe mid single digits to to low single digits maybe even below one percent um but it's it's hard for me to point to a to a specific driver of of these of these forecast uh changes from a um from an import um perspective you know as we mentioned before our our industry um imports about five or six hundred thousand tons of bleach paperboard and probably another a couple hundred thousand tons of finished goods and exports over eight hundred thousand tons um you know i think there is a um there's a scenario where these tariffs and trade investigations and anti-dumping duties could impact those imports. It could impact those 700,000 or 800,000 tons of imports and could drive up domestic capacity utilization. Are you at all surprised that imports haven't dropped a little further just given how much you know change in sx we've seen over the past while here probably in particular so that's so tariffs and fx changes so it's hard it's hard to tell what's happening in in in those markets it represents call it 10 percent we're just talking bleached paperboard um um imports it's hard it's hard to know what uh what the importers are are thinking and and what what their plans are um but i do think between tariffs and and a and a an exchange rate and unfavorable exchange rate for them i you know i i'd be surprised if there is no impact thanks that's fair
um i guess next for me just just thinking sequentially uh you know he did 40 million in q2 for ebitda maintenance costs at lewison maybe 25 million call it um you know that bridge is either the midpoint of the range you of course would have had i think it was 9 million he called out in maintenance costs at Cypress Bend in Q2, I guess I would have thought you'd have a little bit more benefit from cost reduction efforts in the Q3 as well. So just thinking about that Q3 guide, are the other moving parts here just that lower production and fixed cost absorption issues you called out that aren't in the $23 to $25 million of costs quoted for Lewiston?
Or what are the other kind of incremental pressures here on either price or cost that are sort of embedded your outlook thanks yeah that's you've got it exactly right so you've got roughly call it 15 million of sequential increase in and outage expense we did not call out the absorption impact but we expect to see about five percent lower production volume so that would be the other piece that you would have to factor in and then the third piece is a modest amount of tariff impact so those would be the three big pieces okay and aside from tariffs really nothing else around kind of incremental pressure on price or other kind of costs it's worth calling out here
yeah from you know from a price from a price perspective we saw stable q1 to q2 price um you know we tend not to comment on future looking on future looking uh prices okay um how do you think about the most important swing factors that could either take you to the top or bottom end of that range, is that mostly Lewiston startup or are there other factors you'd be looking I think Lewiston, the Lewiston outage startup, this is a large outage that frankly last year cost us more than we expected. So there's a lot of focus on executing that outage well and starting up well. You know, demand, where we're counting on demand being stable, there's, you know, I I don't see any reason why that would not be the case. And, of course, we're still watching the impact of the new capacity coming online from a competitor.
And then last for me, you're guiding the flat shipment sequentially, but still capacity utilization of around 85% for 2025.
I guess based on year-to-date results in that guide, is it fair for us to assume the shipments could be up a little bit sequentially in Q4? yes i i think if you look at our capacity utilization we have two major outages in q3 and q4 so i think that drives down uh capacity utilization we we built some inventories you can tell from our balance sheet in in preparation um for for the lewiston outage um so q2 to q3 we're expecting flat q4 sometimes there's some seasonality impact maybe slightly lower shipments but that that's varied over the years okay thanks very much for all the color i'll turn it back thank you matt thank you everyone that concludes our q a i appreciate you all joining you may now
Operator
I'll disconnect.