Operator
Thank you for standing by. At this time, I would like to welcome everyone to today's Clearwater Paper third quarter 2025 earnings conference call. All lines have been placed on mute to prevent any background noise. After the speaker's remarks, there will be a question and answer session. If you'd like to ask a question during this time, simply press star followed by the number one on your telephone keypad. Once again, star one. And if you'd like to withdraw your question, simply press star one again. Thanks. I'd now like to turn the call over to Sloan Boland, Investor Relations. Sloan?
Thank you, Greg. Good afternoon, and thank you for joining Clearwater Papers' third quarter 2025 earnings conference call. Joining me on the call today are Arson Kitsch, President and Chief Executive Officer, and Sherry Baker, Senior Vice President and Chief Financial Officer. Financial results for the third quarter 2025 were released shortly after today's market close. You will find a presentation of supplemental information, including a slide providing the company's current outlook posted on our Investor Relations page at our website at clearwaterpaper.com. Additionally, we will be providing certain non-GAAP financial information in this afternoon's discussion. A reconciliation of the non-GAAP financial information to comparable GAAP information is included in the press release and in the supplemental information provided on our website. Please note slide two of our supplemental information covering forward-looking statements. Rather than reading this slide, we'll incorporate it by reference into our prepared remarks. And with that, let me turn the call over to Arson. Thank you, and good afternoon, everyone.
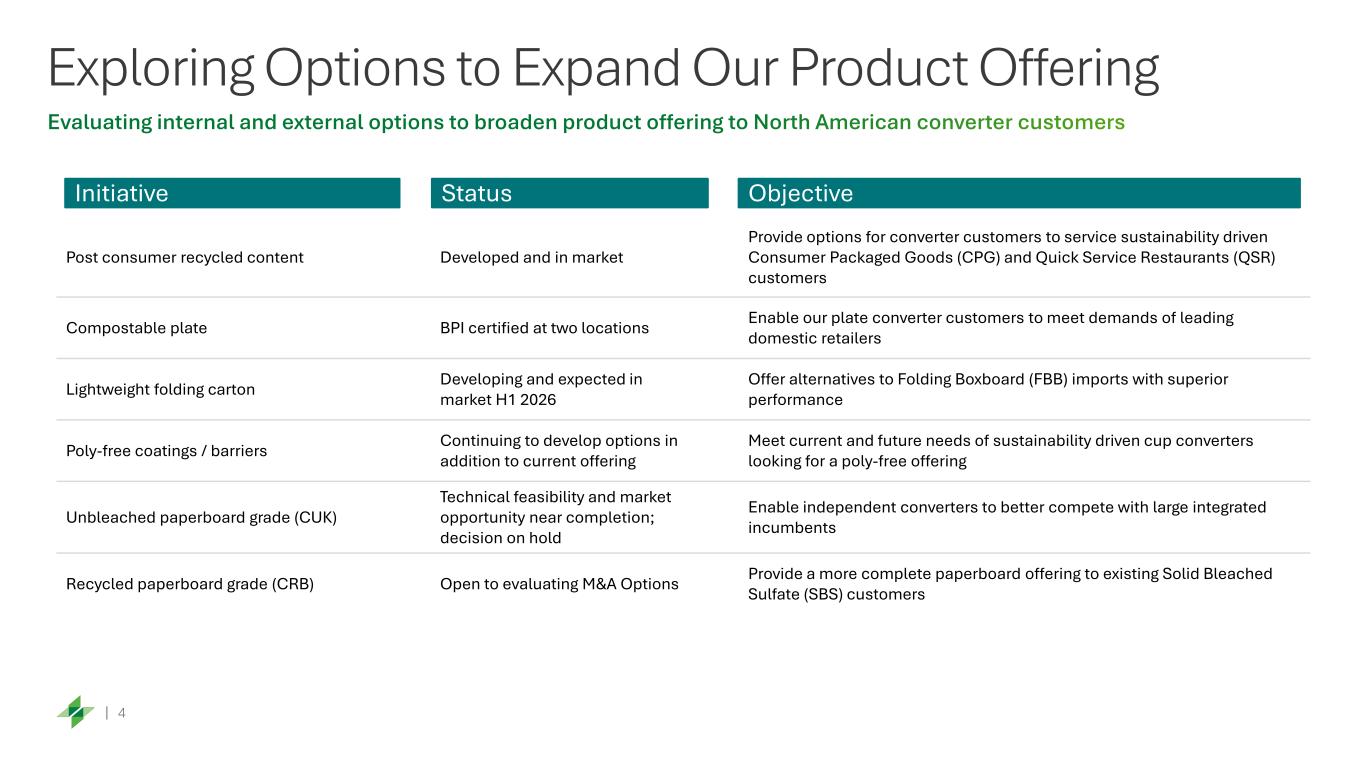
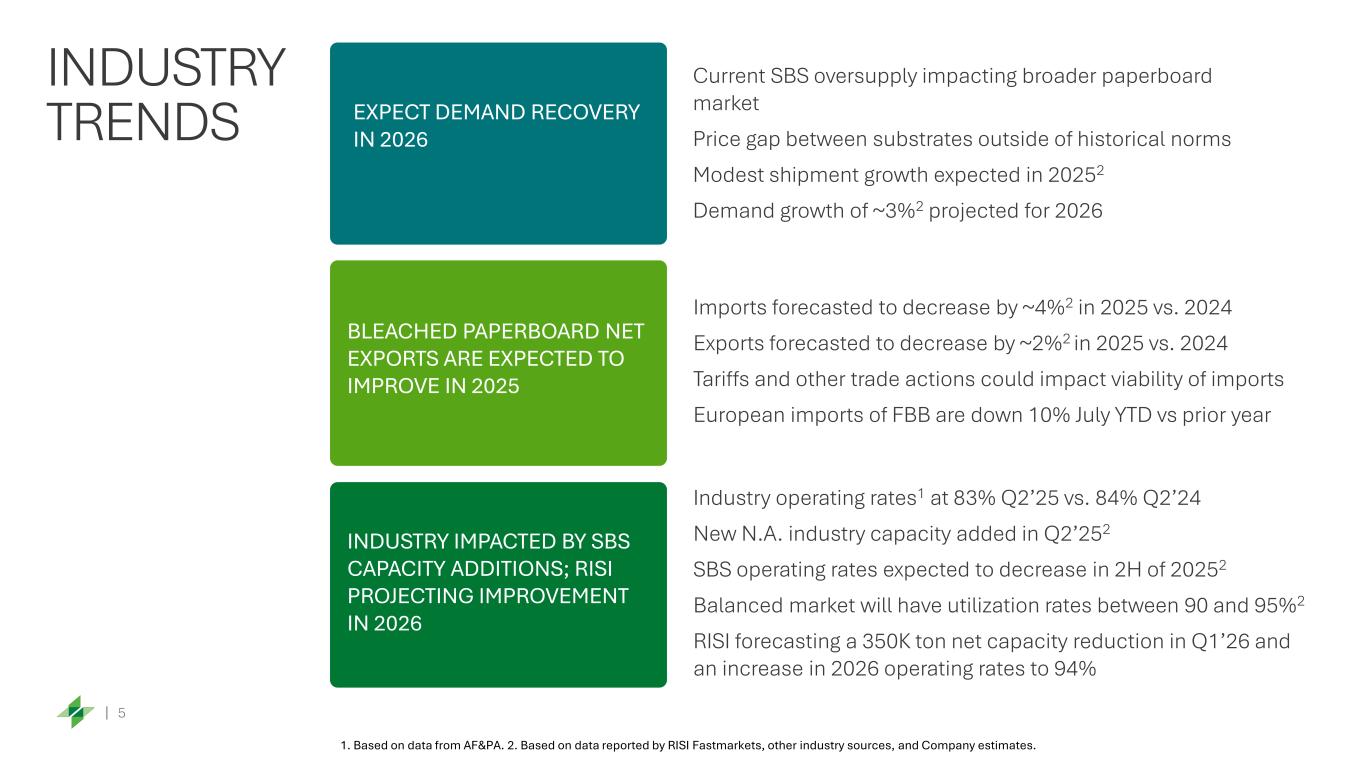
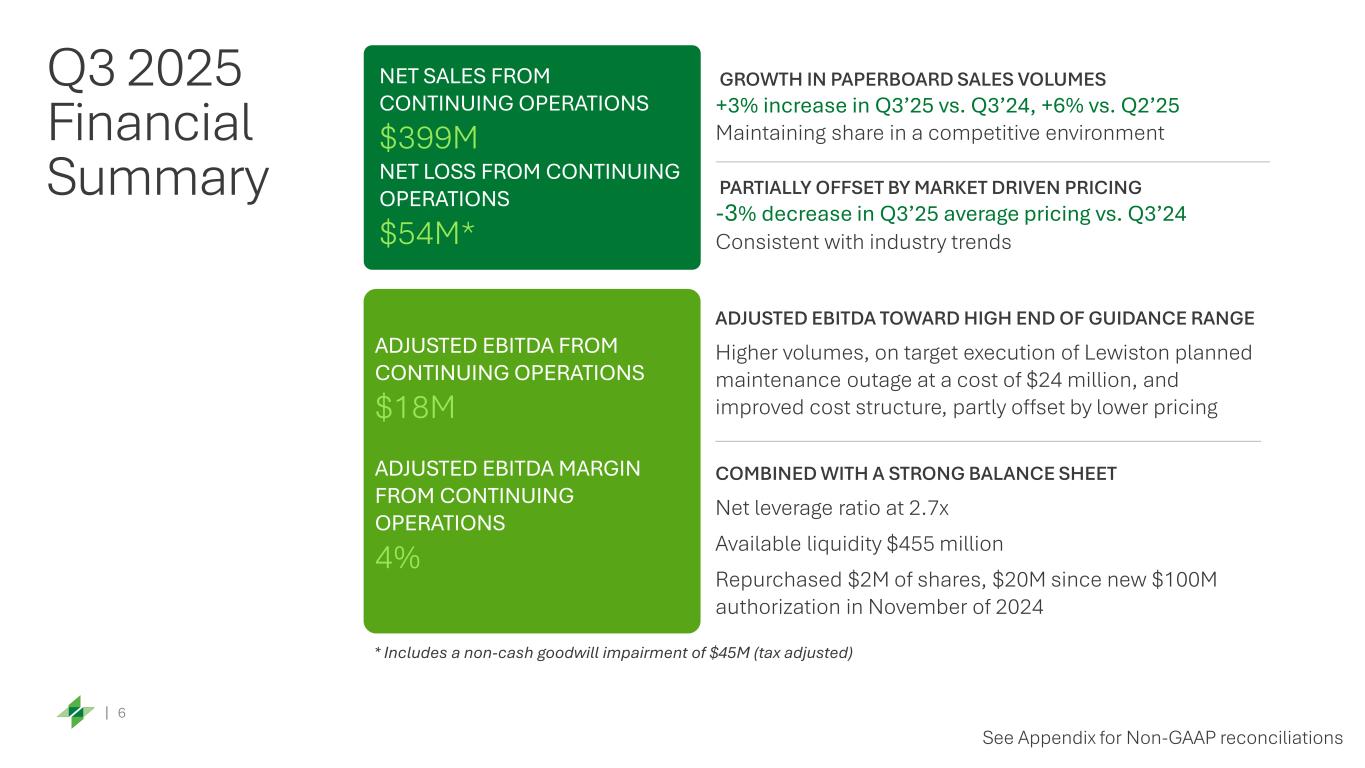
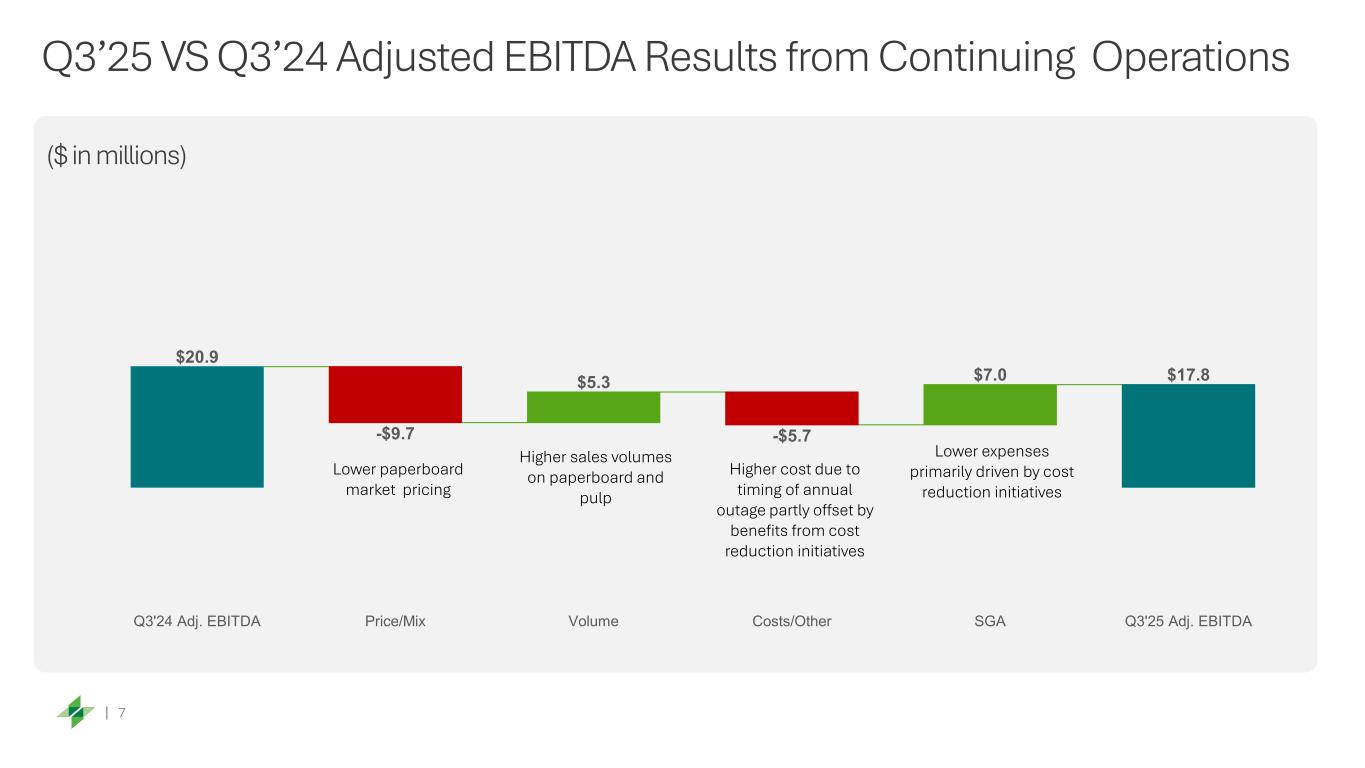
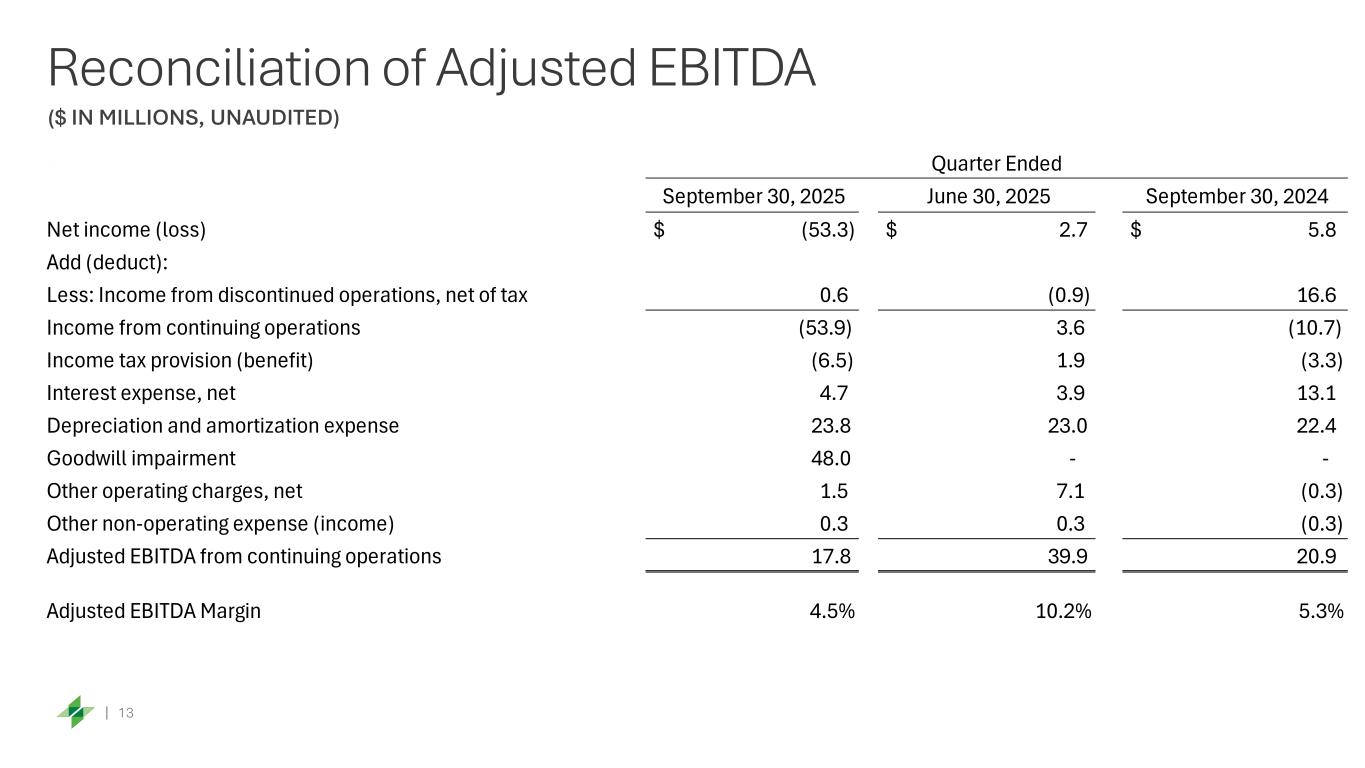
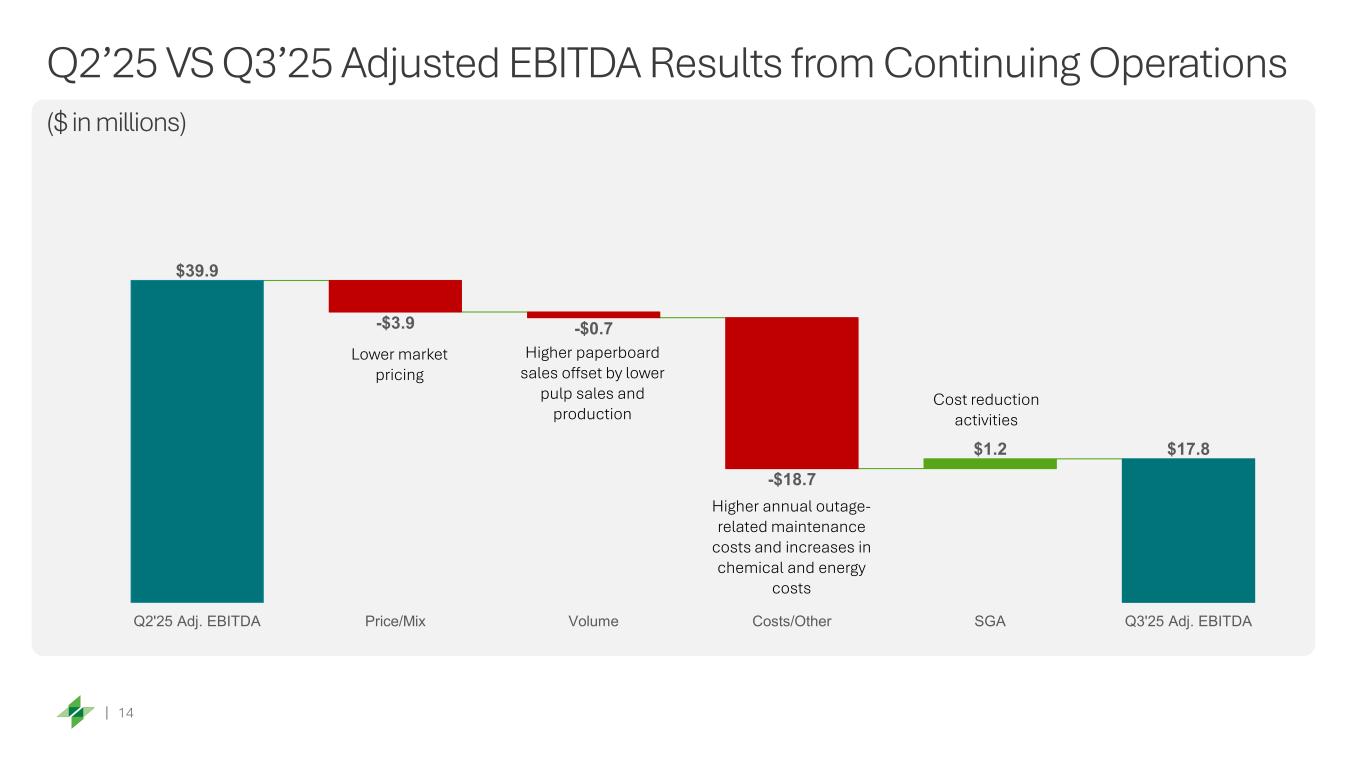
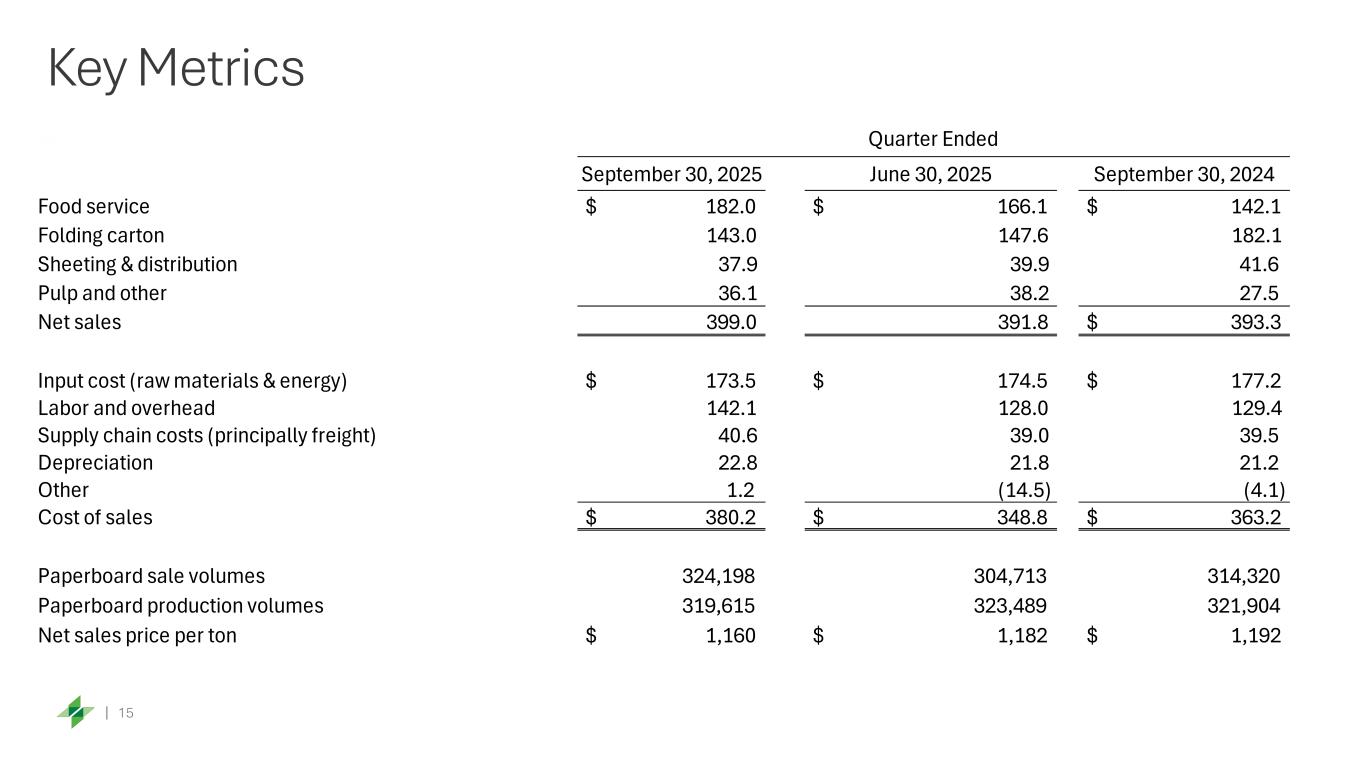
Let me begin with a summary of our third quarter performance highlights. We delivered adjusted EBITDA of $18 million, which is toward the high end of our guidance range of $10 to $20 million. Year-to-date adjusted EBITDA from continuing operations stands at $87 million, up from $26 million during the same period last year. This increase is driven mostly by our efforts to reduce fixed costs and for incremental months of Augusta results included in our P&O. Net sales grew by 2% versus the prior quarter, driven by a 6% increase in shipment volumes, partly offset by lower market-driven pricing. We successfully completed all three of our planned major maintenance outages for 2025. 25. The Lewiston outage was completed in August at a direct cost of 24 million. The Augusta outage was completed in October at a direct cost of 16 million. I'm pleased to report that the execution of our planned major maintenance outages was significantly improved versus prior year. This confirms our belief that an annual cadence delivers generally more manageable and predictable outages we've also largely captured the run rate benefits of our fixed cost reduction initiatives these are now tracking to around 50 million dollars in savings for the year which would exceed our original estimate of 30 to 40 million these savings are helping us offset some of the margin pressure that we're facing during this industry down cycle let's now turn to some commentary on the industry and our key strategic initiatives While the latest third-quarter AFMPA report is not yet available, the trends that we saw in Q2 have largely persisted into Q3. We believe a competitor is continuing to ramp new SPS capacity, which may add up to 10% of additional supply to the industry. Without other changes, this level of new capacity would result in utilization rates in the low 80% range by year-end. This would be well below the normalized cross-cycle average of 90-95% and would result in supply exceeding demand by more than 500,000 tons. These low utilization rates have led to margin pressure, resulting in returns that can't support investments into our capital-intensive industry. This is simply not a sustainable position to be in for the industry, which is why we We believe that the industry will rebalance supply with demand in the medium to long term. As we previously discussed, there are several potential paths to this recovery. First, RECI is forecasting an approximately 350,000 ton net capacity reduction in the first half of 2026, which would drive utilization rates to above 90%. Second, tariffs and a weakening dollar may put pressure on the price of some of the more than 700,000 tons of imports into the U.S., encouraging customers to seek domestic suppliers. And lastly, industry participants may choose to swing capacity to other grades, such as C-U-K, White Top, or other non-bleached applications. This could help absorb excess SBS capacity. Without a combination of these supply changes, we believe that it will take more than five years of demand growth to fully absorb the excess capacity that exists today. While the current industry oversupplies primarily limited to SDS, we believe that it is having an impact on the other two paperboard substrates. Each substrate has its own strengths and applications, but there's meaningful overlap between them, presenting substitution opportunities to customers. This is why we believe that pricing has been historically correlated between SBS, CUK, and CRB. Today, CUK is priced $50 per ton higher than SBS, according to RISI, which is not intuitive, given SBS's superior print quality and higher bleaching costs. If you look at the 30-year history of this market, it is only in recent years that CUK pricing has exceeded SBS. CRB today is priced $120 per ton lower than SBS, according to RISI, which is a narrower gap than we've seen historically. SBS has superior performance characteristics versus CRB, with a higher production cost of more than $200 per ton due to the use of virgin fiber and bleaching. Buying decisions and packaging are driven by several factors, including performance, cost, and sustainability. Most importantly, customers buy paperboard by area or square feet and not tons. To match the strength performance characteristics of SBS, a customer would need to use a heavier weight of CRB, resulting in a price that we estimate to be equal to or higher on a per square foot basis than SBS in today's market. If these trends persist, we believe that CPG and retail customers will look closely at substitutions, which would support higher SBS demand, put a ceiling on C-U-K and C-R-B, and return to historical pricing correlations between the three substrates. Let me now shift to some comments on a potential C-U-K investment that we previously discussed. As a reminder, we're exploring adding C-U-K swing capability to one of our S-B-S machines. We have nearly completed the engineering work, and now I can share some additional details on the project. The estimated capital required for the investment is approximately $50 million, with a 12- to 18-month lead time to complete. At today's prices, the project return is estimated to be more than 20%, largely based on trading up lower-end SBS volume to CUK. The returns would be considerably higher if we assume that we're filling up open SBS capacity. Our mill in Cypress Bend Arkansas is best positioned for this project, given its proximity to customers and access to low-cost softwood fiber required for CUK. We estimate that open market demand for C-U-K is around 300,000 to 400,000 tons, with potential upside if independent converters had reliable domestic supply. Our goal would be to capture around 100,000 tons of this volume, utilizing about one-third of Cypress-Benz's capacity. The remaining two-thirds of the capacity would remain in SPS. We see two upsides to this project. First, there's a strategic benefit to expanding our product portfolio to better serve our converter customers. Second, it would enable us to more fully utilize our network capacity during an SBS industry downturn. We may conclude in the future that this is a good investment, but we're putting a final decision on hold at this time. We remain focused on running all three of our SBS mills, vigorously defending our SBS market share, and preserving the strength of our balance sheet. With that, I'll turn the call over to Sherry to discuss our Q3 financial results in more detail, as well as provide an outlook for Q4 and some additional thoughts and some initial thoughts on 2026.
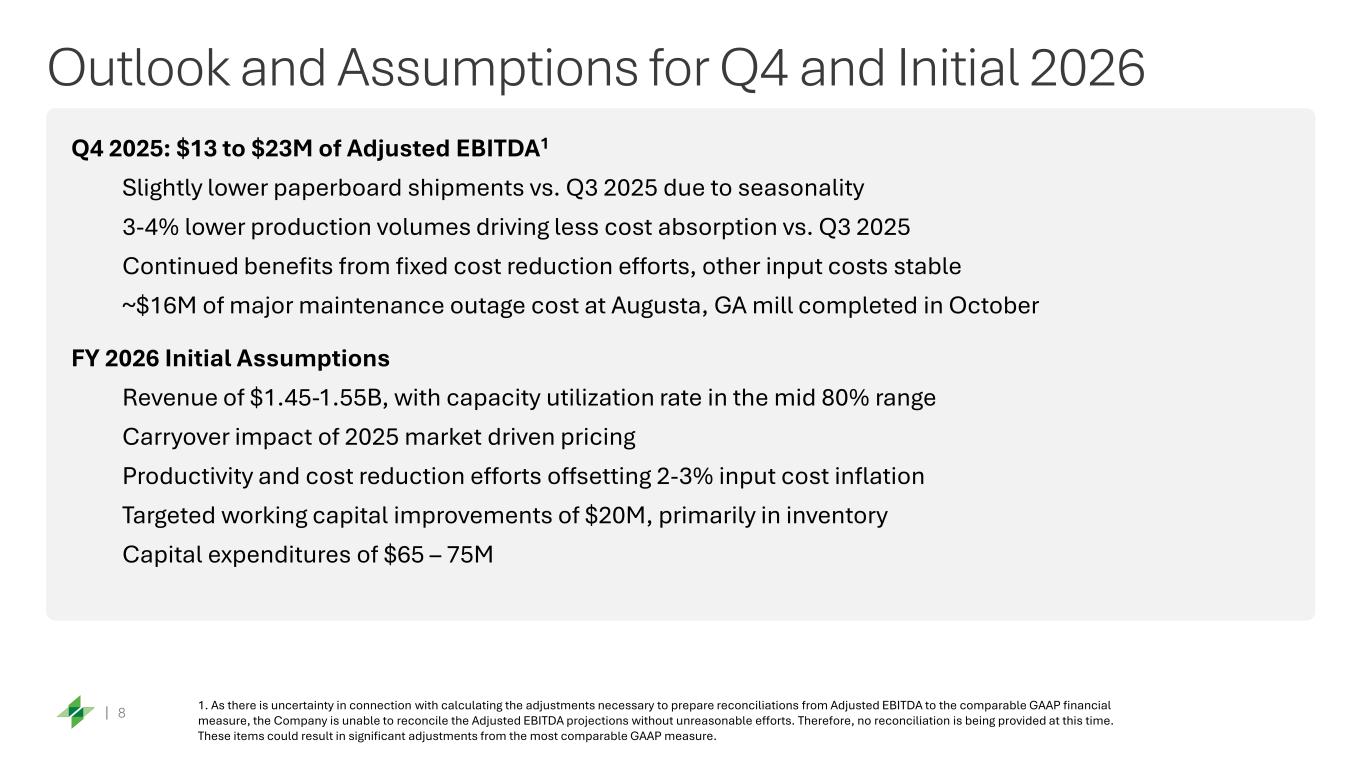
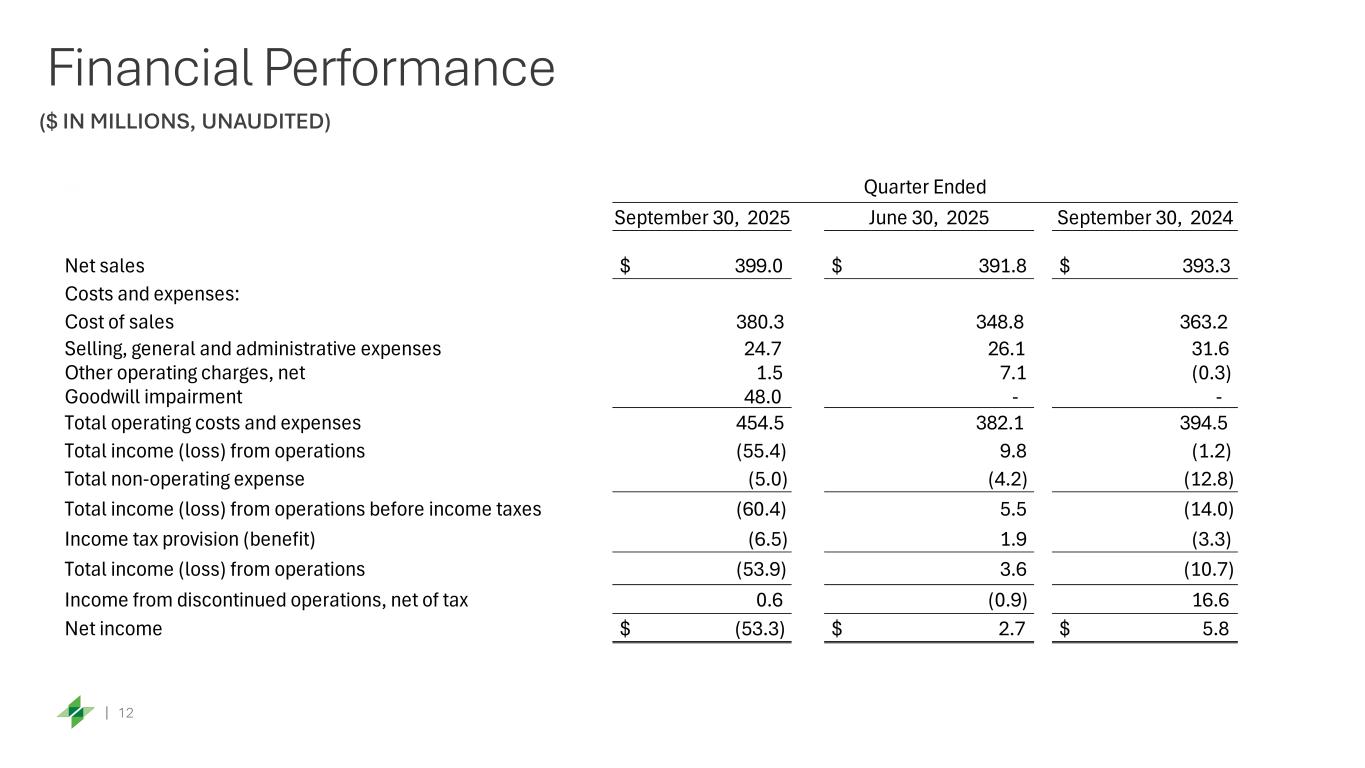
Thank you, Arson. Let's start by reviewing our financial performance in the third quarter in more detail. Net sales were at $399 million, up 1% year over year, driven by a 3% increase in paperboard shipment volumes, partially offset by lower market pricing. Net loss from continuing operations was $54 million, or $3.34 per diluted share, primarily due to a $48 million non-cash impairment of goodwill. This non-cash impairment represents all of our remaining goodwill. Most of this goodwill was accumulated through the acquisition of Manchester Industries in 2016. The impairment was driven by the decline in our market capitalization as compared to the increase in our book value, which was driven by the gain from divestiture of our tissue business late last year. Adjusted EBITDA was at $18 million towards the higher end of our guidance range of 10 to 20 million. We saw improved cost performance due to our fixed cost reduction initiative, which more than offset lower pricing and higher input costs. SG&A as a percent of sales was at 6.2% at the lower end of our targeted range of 6 to 7% of net sales. We believe that this is at the lower end of our industry benchmark, demonstrating our commitment to running a lean, cost-effective company. Let's now turn to our balance sheet and capital allocation. We generated $34 million in cash from operations during the quarter and approximately $3.5 million in free cash flows. Our net leverage ratio is at 2.7 times, and we have ample available liquidity of $455 million. While our leverage ratio has increased due to the current industry down cycle, our aggregate debt level has remained stable as we continue our focus on maintaining a strong balance sheet. We also repurchased $2 million of shares, bringing our total to $20 million against our $100 million authorization. We will consider additional share repurchases when we have a line of sight to free cash flow generation in the near to medium term. Turning now to our outlook for the fourth quarter. We expect adjusted EBITDA of $13 to $23 million. We expect slightly lower paperboard shipments versus the third quarter due to seasonality. We expect 3% to 4% lower production volume, driving less cost absorption than during the prior quarter. We have largely captured the benefits from our fixed cost reduction efforts in previous quarters, and while we will maintain those savings, we do not expect significant additional savings between the third and fourth quarters. We expect other input costs to remain relatively stable, And our guidance includes $16 million of major maintenance outage costs at our Augusta mill, which was completed in October. And lastly, let me provide you with some of our initial assumptions for 2026. We expect revenue of around $1.45 to $1.55 billion and a capacity utilization rate in the mid-80% range. We are also assuming that we'll see the carryover impact from 2025 market-driven price changes into 2026. We expect to generate enough productivity and cost reductions to offset 2 to 3 percent of cost inflation. We expect capital expenditures of $65 to $75 million. To generate incremental cash flow, we will target more than $20 million in working capital improvements, primarily in inventory. And lastly, given newly enacted tax legislation, we do not expect to be a net cash taxpayer next year. The biggest variable that is difficult for us to predict is price changes in 2026. Currently, RECI is forecasting an increase in SBS folding carton price of $30 per ton and cup stock of $40 per ton in the first half of next year. This corresponds to their assumption that utilization rates will improve to over 90 percent with a net industry capacity reduction of approximately 350,000 tons. Regardless of industry conditions, we remain focused on operating effectively, reducing our costs, and maintaining a strong balance sheet. I'll now turn the call back to Arson for closing remarks.
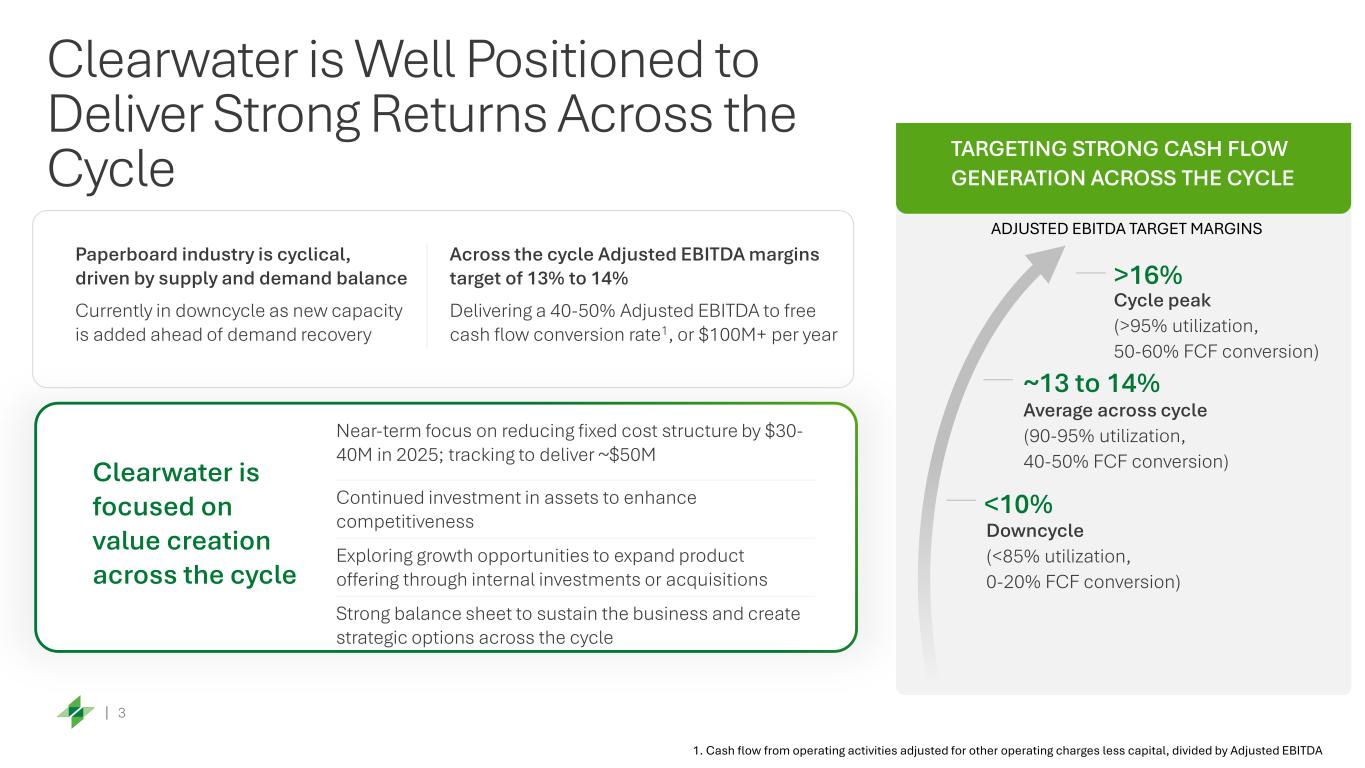
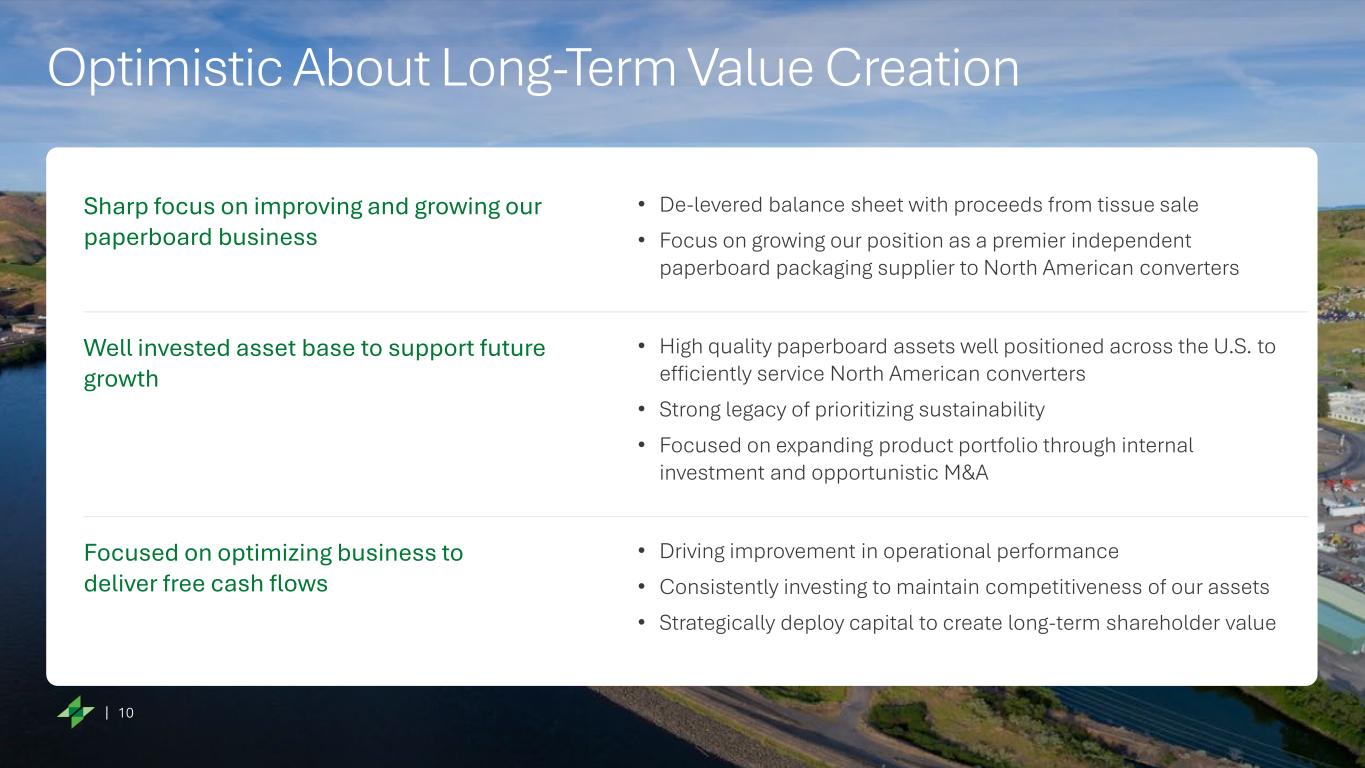
Thank you, Sherry. While we're navigating a challenging industry environment, we remain confident in the long-term fundamentals of the paperboard market and our ability to generate strong returns. We have high-quality assets that are geographically well-positioned to serve independent customers, and we intend to maintain our market share. We believe that paperboard packaging has strong demand fundamentals as consumers and customers continue to seek sustainable and renewable packaging solutions. We have a strong balance sheet with manageable debt levels, and more than $450 million in liquidity, positioning us to weather this current downturn. In an environment where utilization rates return to 90-95%, we expect to achieve cross-cycle adjusted EBITDA margins of 13-14%, resulting in free cash flow conversion of 40-50%, or over $100 million in free cash flow per year, assuming $1.8 to $1.9 billion and net sales let me conclude my remarks by thanking our people for their efforts to remain focused on operating safely and providing excellent service to our customers i would also like to thank our customers for putting their trust in us and our shareholders for their continued interest with that we'll open it up to your questions great thanks arson and
Operator
at this time i would like to remind everyone in order to ask a question it's a star and the number one on your telephone keypad once again star one and we will pause just a moment to compile the q a roster and it looks like our first question today comes from the line of sean stewart with td cowan sean please go ahead thanks good afternoon everyone arson i want to start with the decision to to hold the cuk swing capacity project you know i gather given a pretty strong return profile for that project this is more around wanting to hit balance sheet targets uh assuming that's correct can you give us a sense of where you would like to see leverage ratios get to or you know free cash flow profile for the overall company improved to before you would green light that project yeah good question um so you're right i i think it's a good it's likely a good project, but we're putting that decision on hold.
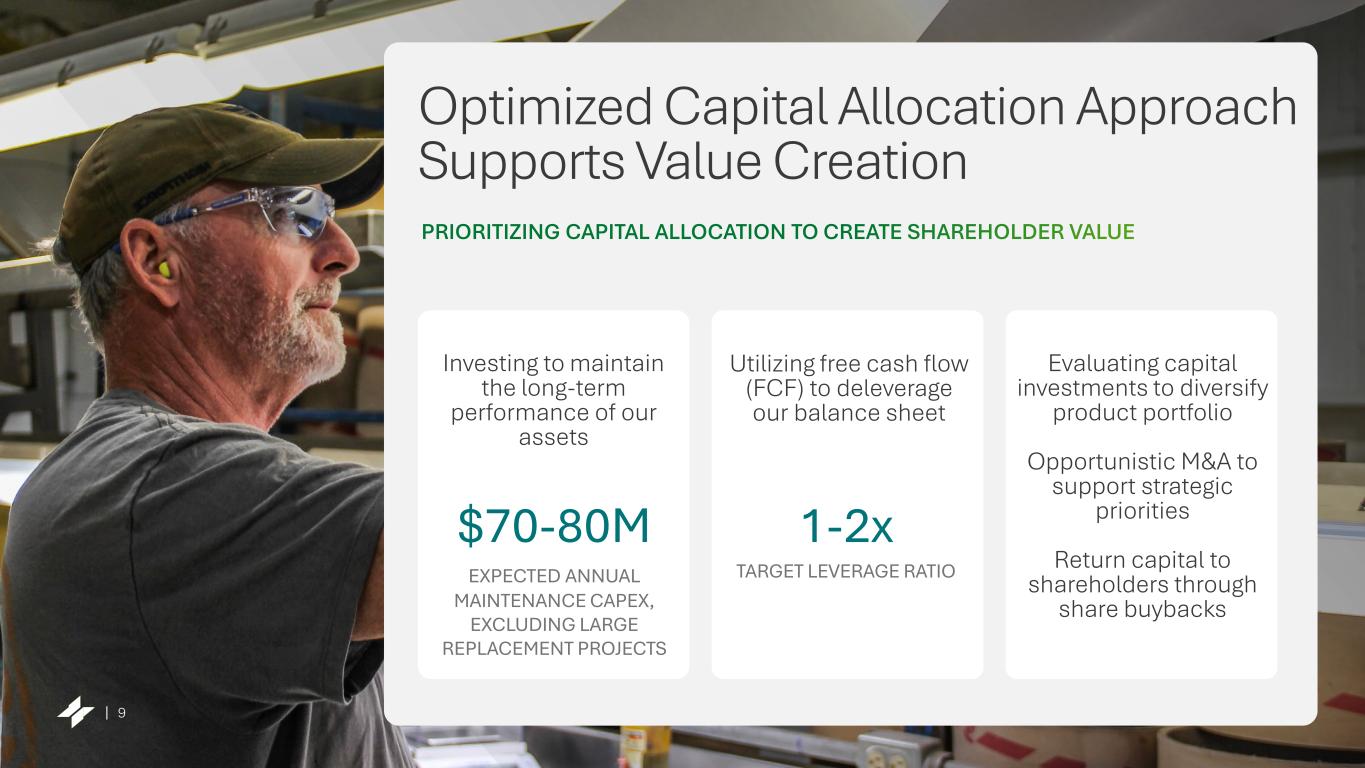
It would take more than two years for us to deliver cash flow from this project, which means we'd have to finance it through debt. And right now we need to prioritize maintaining a strong balance sheet and focusing on running our SPS mills and defending our market share. You know, we said previously we're targeting leverage ratio in the one to two uh one to two percent uh range uh EBITDA margins cross cycle 13 14 percent so we'll revisit this decision uh decision later um at today's in today's market environment at today's prices it is a very attractive return but we have to revisit it in in in the future and see what what those conditions look like and see if we need to update our assumptions.
Operator
Okay, understood on that front. And then with respect to your view on the market outlook for SPS, you know, I gather a lot of this is based on what RECI's forecasting in terms of forthcoming capacity closures. According to their forecast, you know, we would need to see those announcements soon. I guess I'm wondering on your perspective of industry willingness to take these initiatives, to rebalance the market, and the extent to which you're seeing any import relief at this point as tariffs take hold and if that's helping at the margin at all.
Yeah, listen, we're not going to comment on what our competitors may or may not do. You're right. RECI is forecasting a first half net capacity reduction of 350,000 tons. So they're assuming a turn in the market. We're certainly hoping for that, but we're planning for tomorrow looking like today. From an import perspective, it's still a bit early to tell, but as we look at European imports July year-to-date, they're down, I believe, approximately 10%. So I think you're starting to see some cracks in the import balance into North America. You know, between a 15% tariff and a weakening dollar, absorbing 20 or 30% of additional costs for an importer into North America, I think is getting harder and harder. And for domestic customers, I think they're looking for more reliable, stable domestic supply. So we're We're optimistic that this will be a tailwind for us as we head into 2026.
Operator
Okay. Just one last one, maybe for Sherry. You went through a bunch of 2026 metrics that you're targeting. Do you have an initial view on what the maintenance schedule is going to look like?
And I appreciate you're smoothing this out now with a more regular schedule across the mill platform. can you give us perspective on the cadence of anticipated closures in 2026 and are we safe to assume that the overall expense that you're targeting would be similar to 2025 levels yeah so I'll answer the the second part first you should expect uh the cost to look very similar to what we we see in 25 so I would start there we're still finalizing the schedules for next year so So we'll be able to come out and and tell you exactly which facilities in which quarters probably by our by our February call. And then we'll we'll highlight if there's any overlap inconsistencies if we change the Sean, maybe one more comment on that.
We we had our our Lewiston outage in late late Q2. So it was it was in August with Augusta and in October of doing an outage in the middle of summer is pretty challenging from just a heat perspective. So we are looking at potentially moving up that outage into earlier in the summer, maybe late Q2, just to make it a safer, more manageable outage. So we're still finalizing those details, but that is a potential for us to have the Lewiston outage a bit earlier in the year, which would mean that we would have two Lewiston outages within a 12-month period, potentially. But we'll share that with you in February.
Operator
Okay. Okay, that's all I have for now. Thanks very much.
Operator
Thanks, Sean. And our next question comes from the line of Matthew McKellar at RBC. Matthew, please go ahead.
Hi, thanks very much for taking my questions. First of all, shipments in the quarter were solidly ahead of where you sort of got it to. It looks like food service sales are pretty healthy, but could you provide some maybe additional perspective on where you saw the incremental strength versus your expectations as of late July, and if you could provide any other broader commentary around relative strength and weakness you're seeing in conditions across, you know, liquid packaging, folding carton, food service, that'd be great. Thanks.
I think summertime is normal seasonality uptick for food service. We certainly saw some nice strength in food service, and our team is doing a really nice job of competing vigorously in the market and filling out our um filling out our our capacity uh you know i think we've we've had uh some optimism from for some from some of our food service customers i think you may be seeing some import relief helping um on things like on things like paper plates um that is helping some of our paper plate uh customers see see stronger demand so i think those are some of the uh i think those are some of the variables that that came came into play in q3 okay that that's great and um i think it's just following for the second part of that any other comments around kind of weakness you're seeing in the Q4 or strength uh relatively between uh those kind of product categories yeah I think Q4 is seasonally a little weaker than than Q3 and it's it's typically in in in food service um just the season the summer season is over so we're expecting um a little bit of seasonality decline as we head into Q4 and I think as as Sherry mentioned we'll also see a few percentage points less of production as we head into into q4 versus q3 that that will have some absorption um absorption impact and matt as we as we stated in the last earnings call um absorption is a is a meaningful component of our of our of our pnl and you know if you do the math it could be upwards of five hundred dollars a ton of absorption um with with production changes so i think that's part of um that that's part of the reason why q4 is flat versus q3 is i think it's uh we'll see some impact of absorption Okay, and just kind of pulling on that string, you know, it's a fairly large range for guidance on EBITDA and Q4 considering you're through the maintenance.
Is it mostly seasonality of demand and maybe energy costs that would take you to the top of the bottom of that range? Do you maybe even see any risks around, I guess, the government shutdown and the Supplemental Nutrition Assistance Program? What else would you be watching for in terms of variability within that range? Thanks.
I think energy is right. We did make in some energy into Q4 versus Q3, but it's very much weather dependent. And some of our – one of our mills at least is more susceptible to bigger swings in energy prices than the other mills just due to its location. So, I think part of it is energy, part of it is just production. You know, a thousand tons of production is worth upwards of 500 000 and for those folks that spend time in paper mills know that a thousand tons plus or minus in a given in a given week or given month is a rounding error but it has a pretty substantial impact um on on our earnings um citing it's uh it's the nature of being a paperboard focused business with three mills okay fair enough um and last for me just the uh working capital improvements of 20 million for 26 can you just share a little bit more about how you plan to achieve that.
It sounds like it's mostly inventory, but also the timing of when you'd expect to reach that target. Thanks.
Yeah, it will be primarily an inventory. I think you'll see us start to work those pieces down in the second half of next year. So that would be the timing of when I would be looking to achieve those estimates.
And I think back to the production comment, you know, this year think we probably built a little bit of inventory and we'll be reducing inventory next year to free up some some working capital so there will be a trade-off between uh fixed cost absorption and just cash coming off the balance sheet um so there'll be some trade-off as we head into next year and we'll provide a bit more context on this in the coming quarters okay thanks very much for the help i'll turn it back all right thanks matt and one last reminder in order to ask a question again press star and the number one on your telephone keypad once again star one and we will pause just a moment going once going twice all right ladies and gentlemen
Operator
that does conclude today's call thank you so much for joining us today and you may now disconnect