
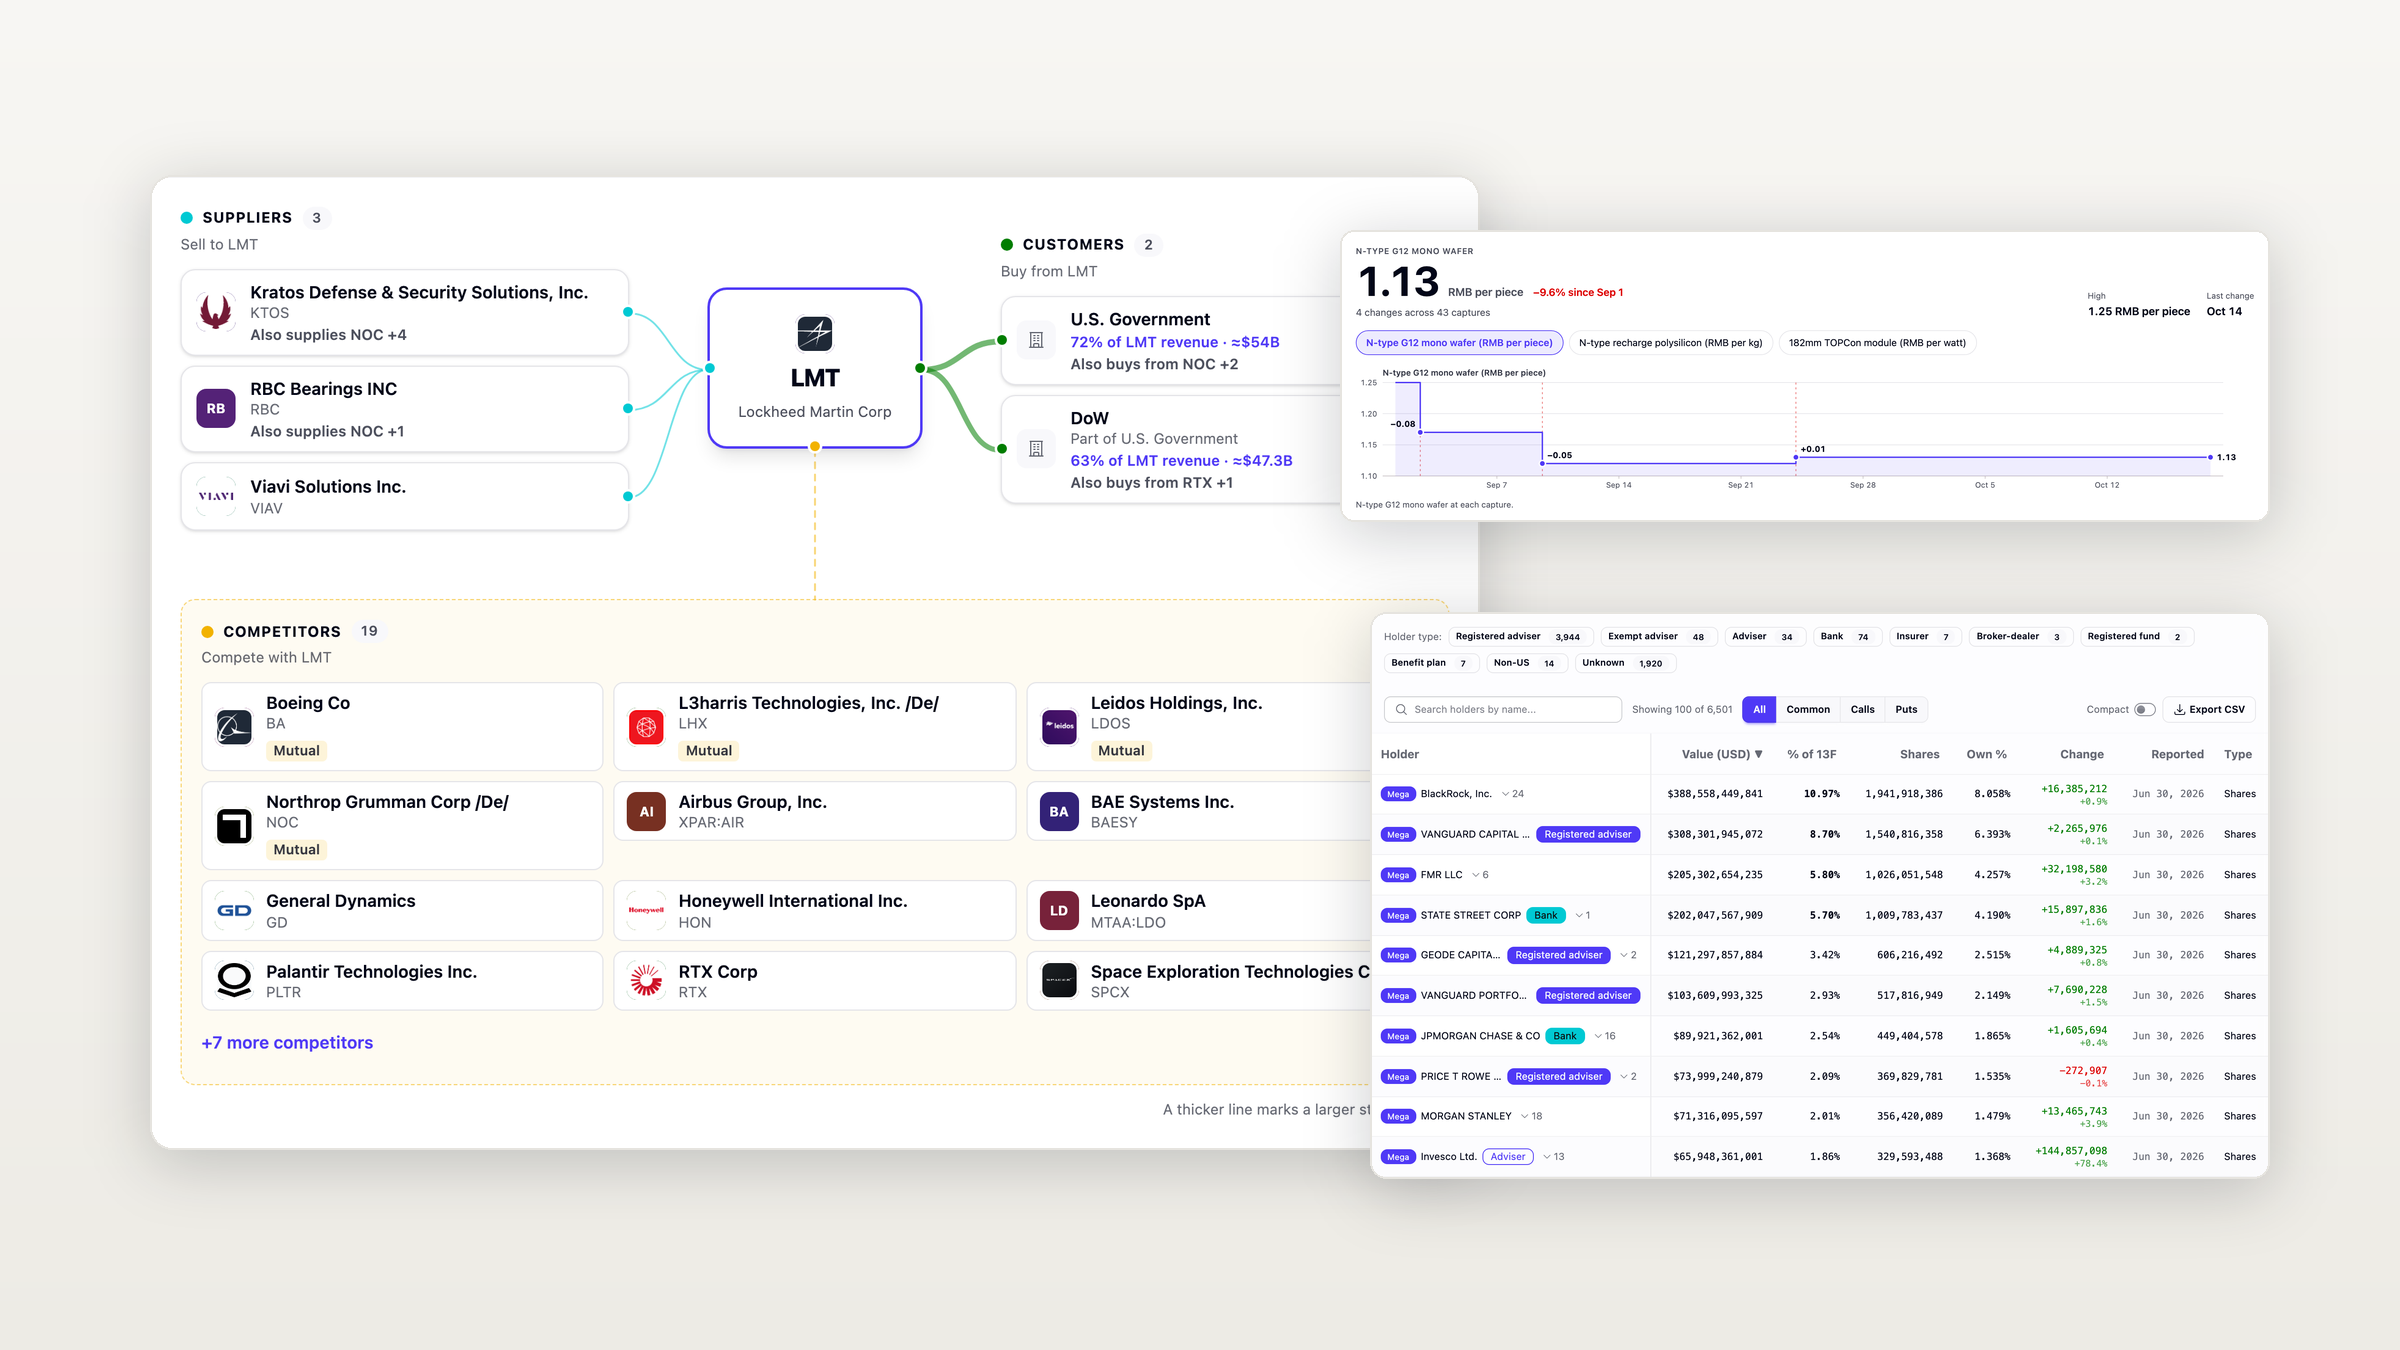
This update covers everything new on Equibles since the start of October: supply chains for every company, private ones included, earnings calls from around the world on a redesigned call page, 13F holders by type, public trackers and analyst estimates.
Supply chains for every company, private ones included
Equibles' intelligence now recreates the supply chain of every company, including private ones. Every stock page has a Supply Chain tab that maps its customers, suppliers, competitors and partners, and shows a customer's share of revenue in dollars when it is known: the U.S. Government accounts for 72% of Lockheed Martin's revenue, about $54 billion.
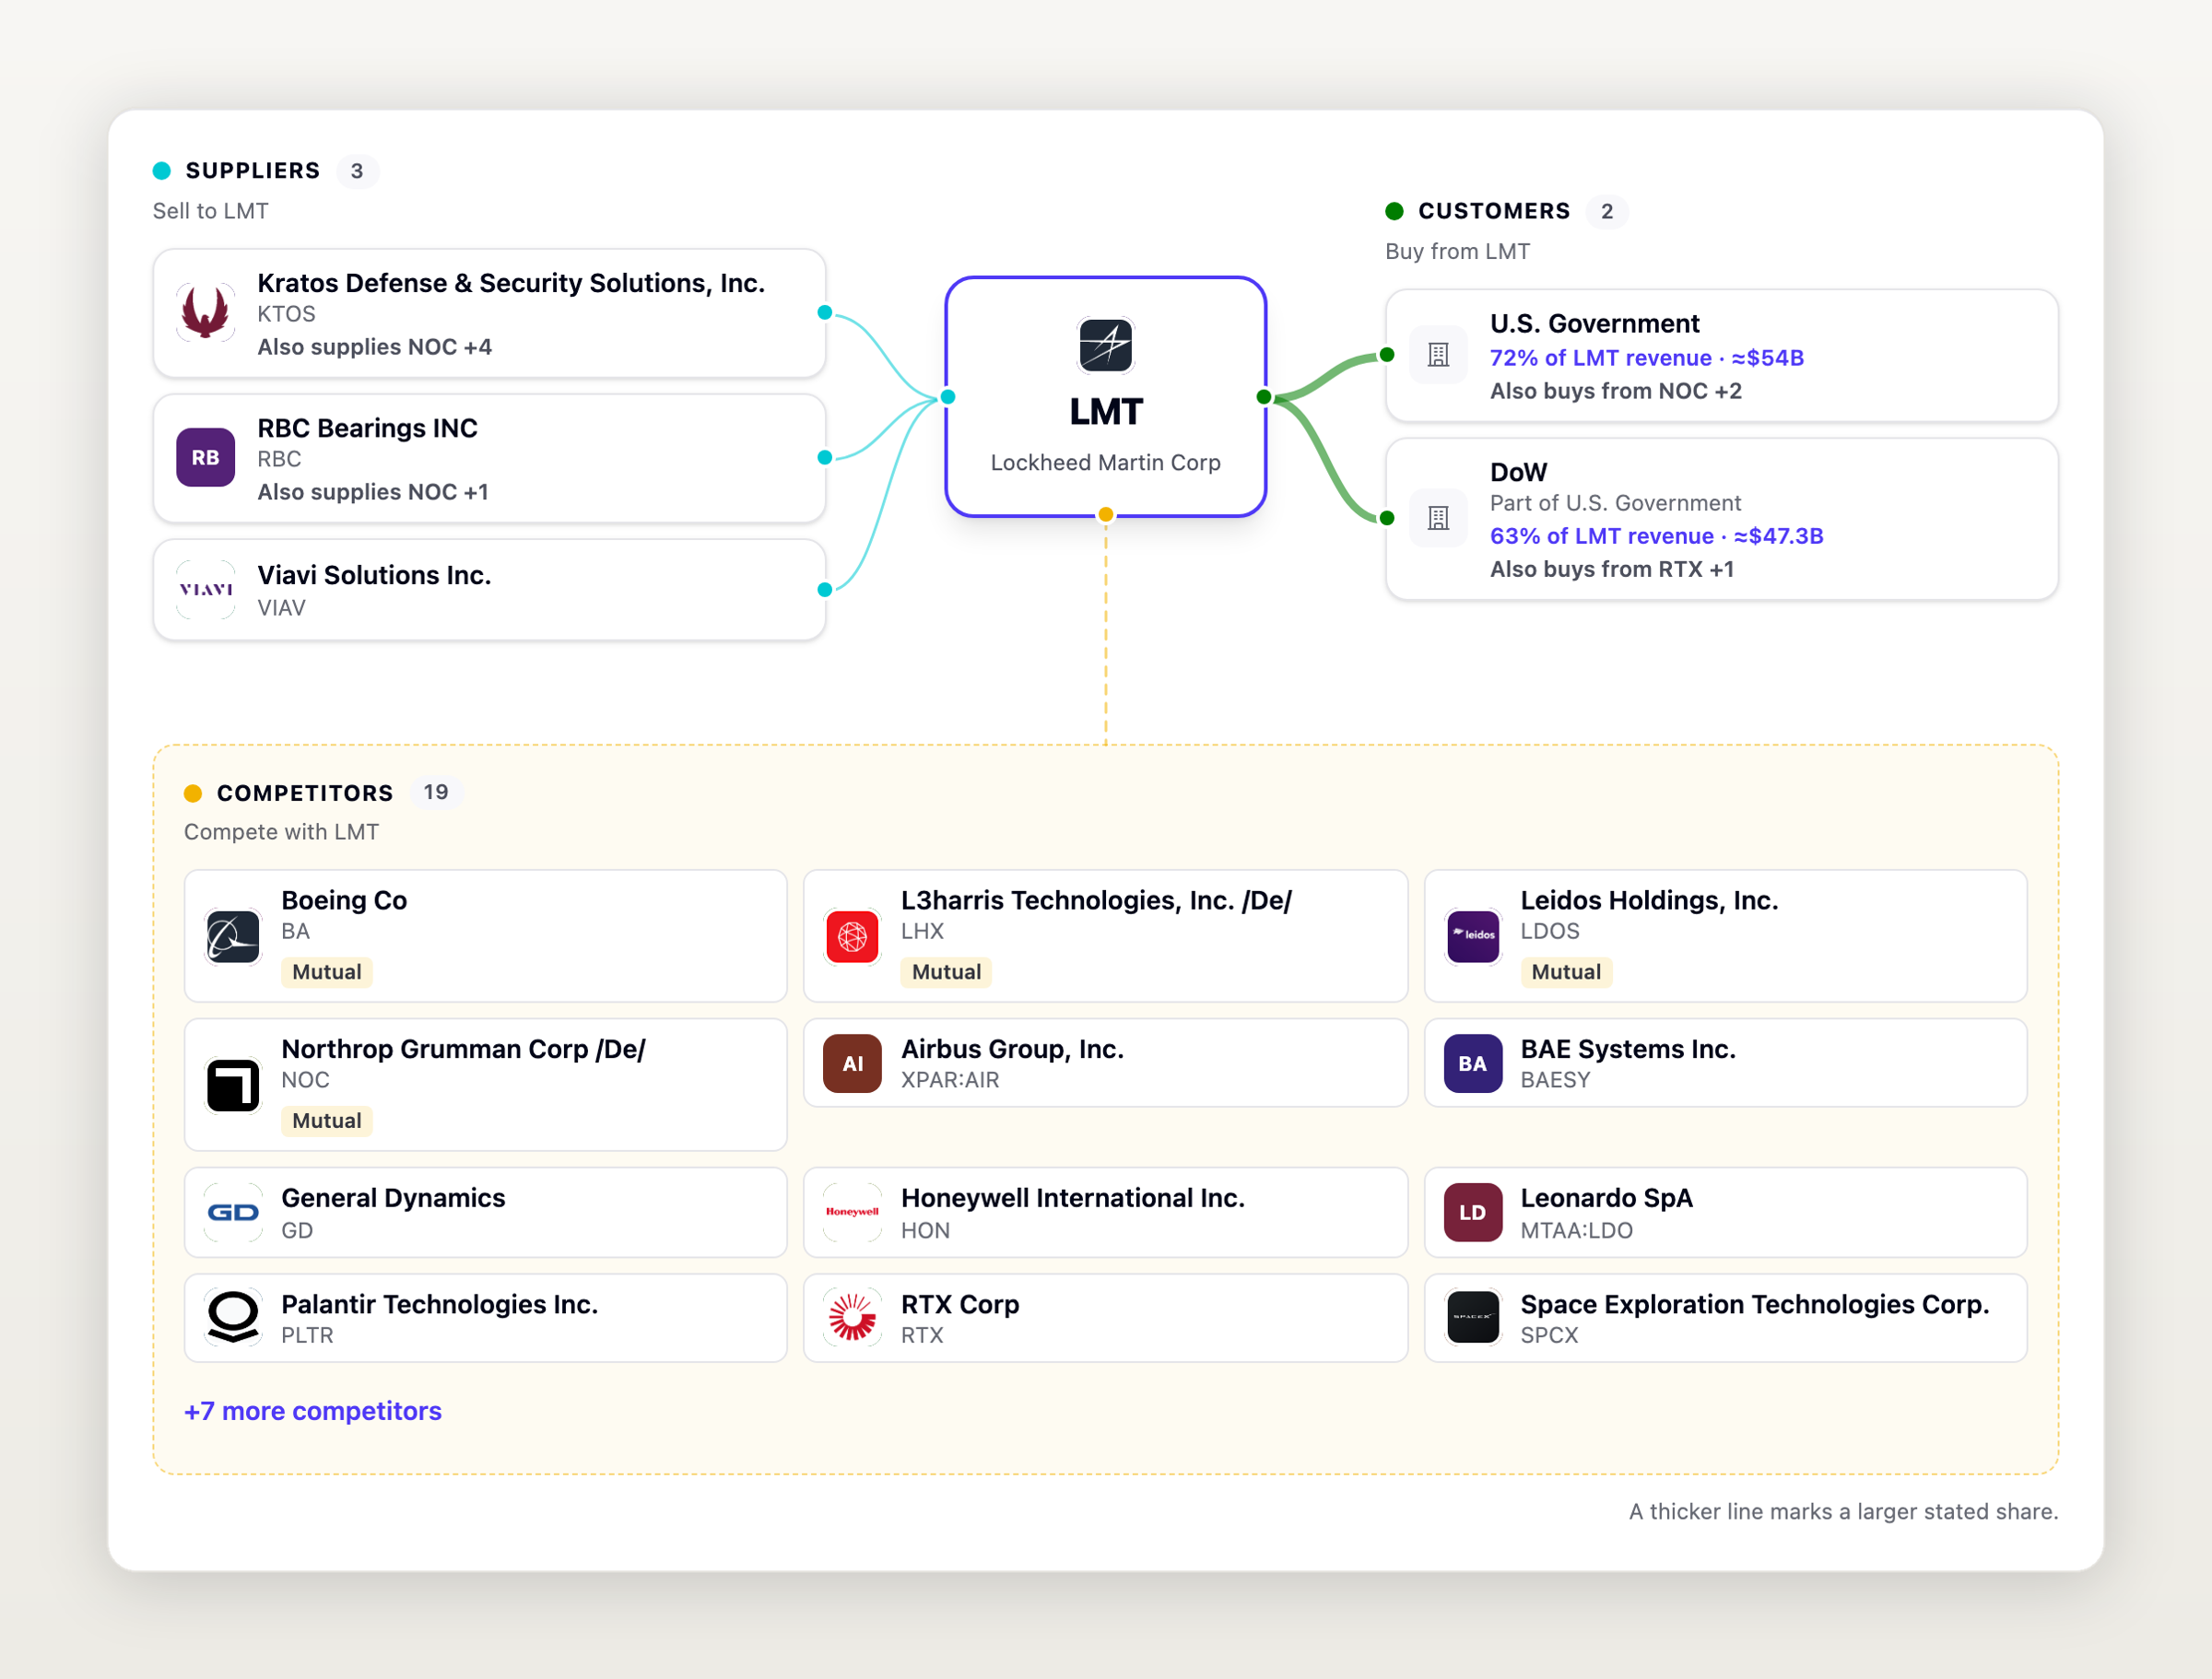
- Three views: a wired diagram, a sortable table with a CSV export, and an overlap view of the suppliers and customers a company shares with its listed competitors.
- Coverage: 929 companies so far, with 11,036 relationships, read from the largest companies first and growing every day.
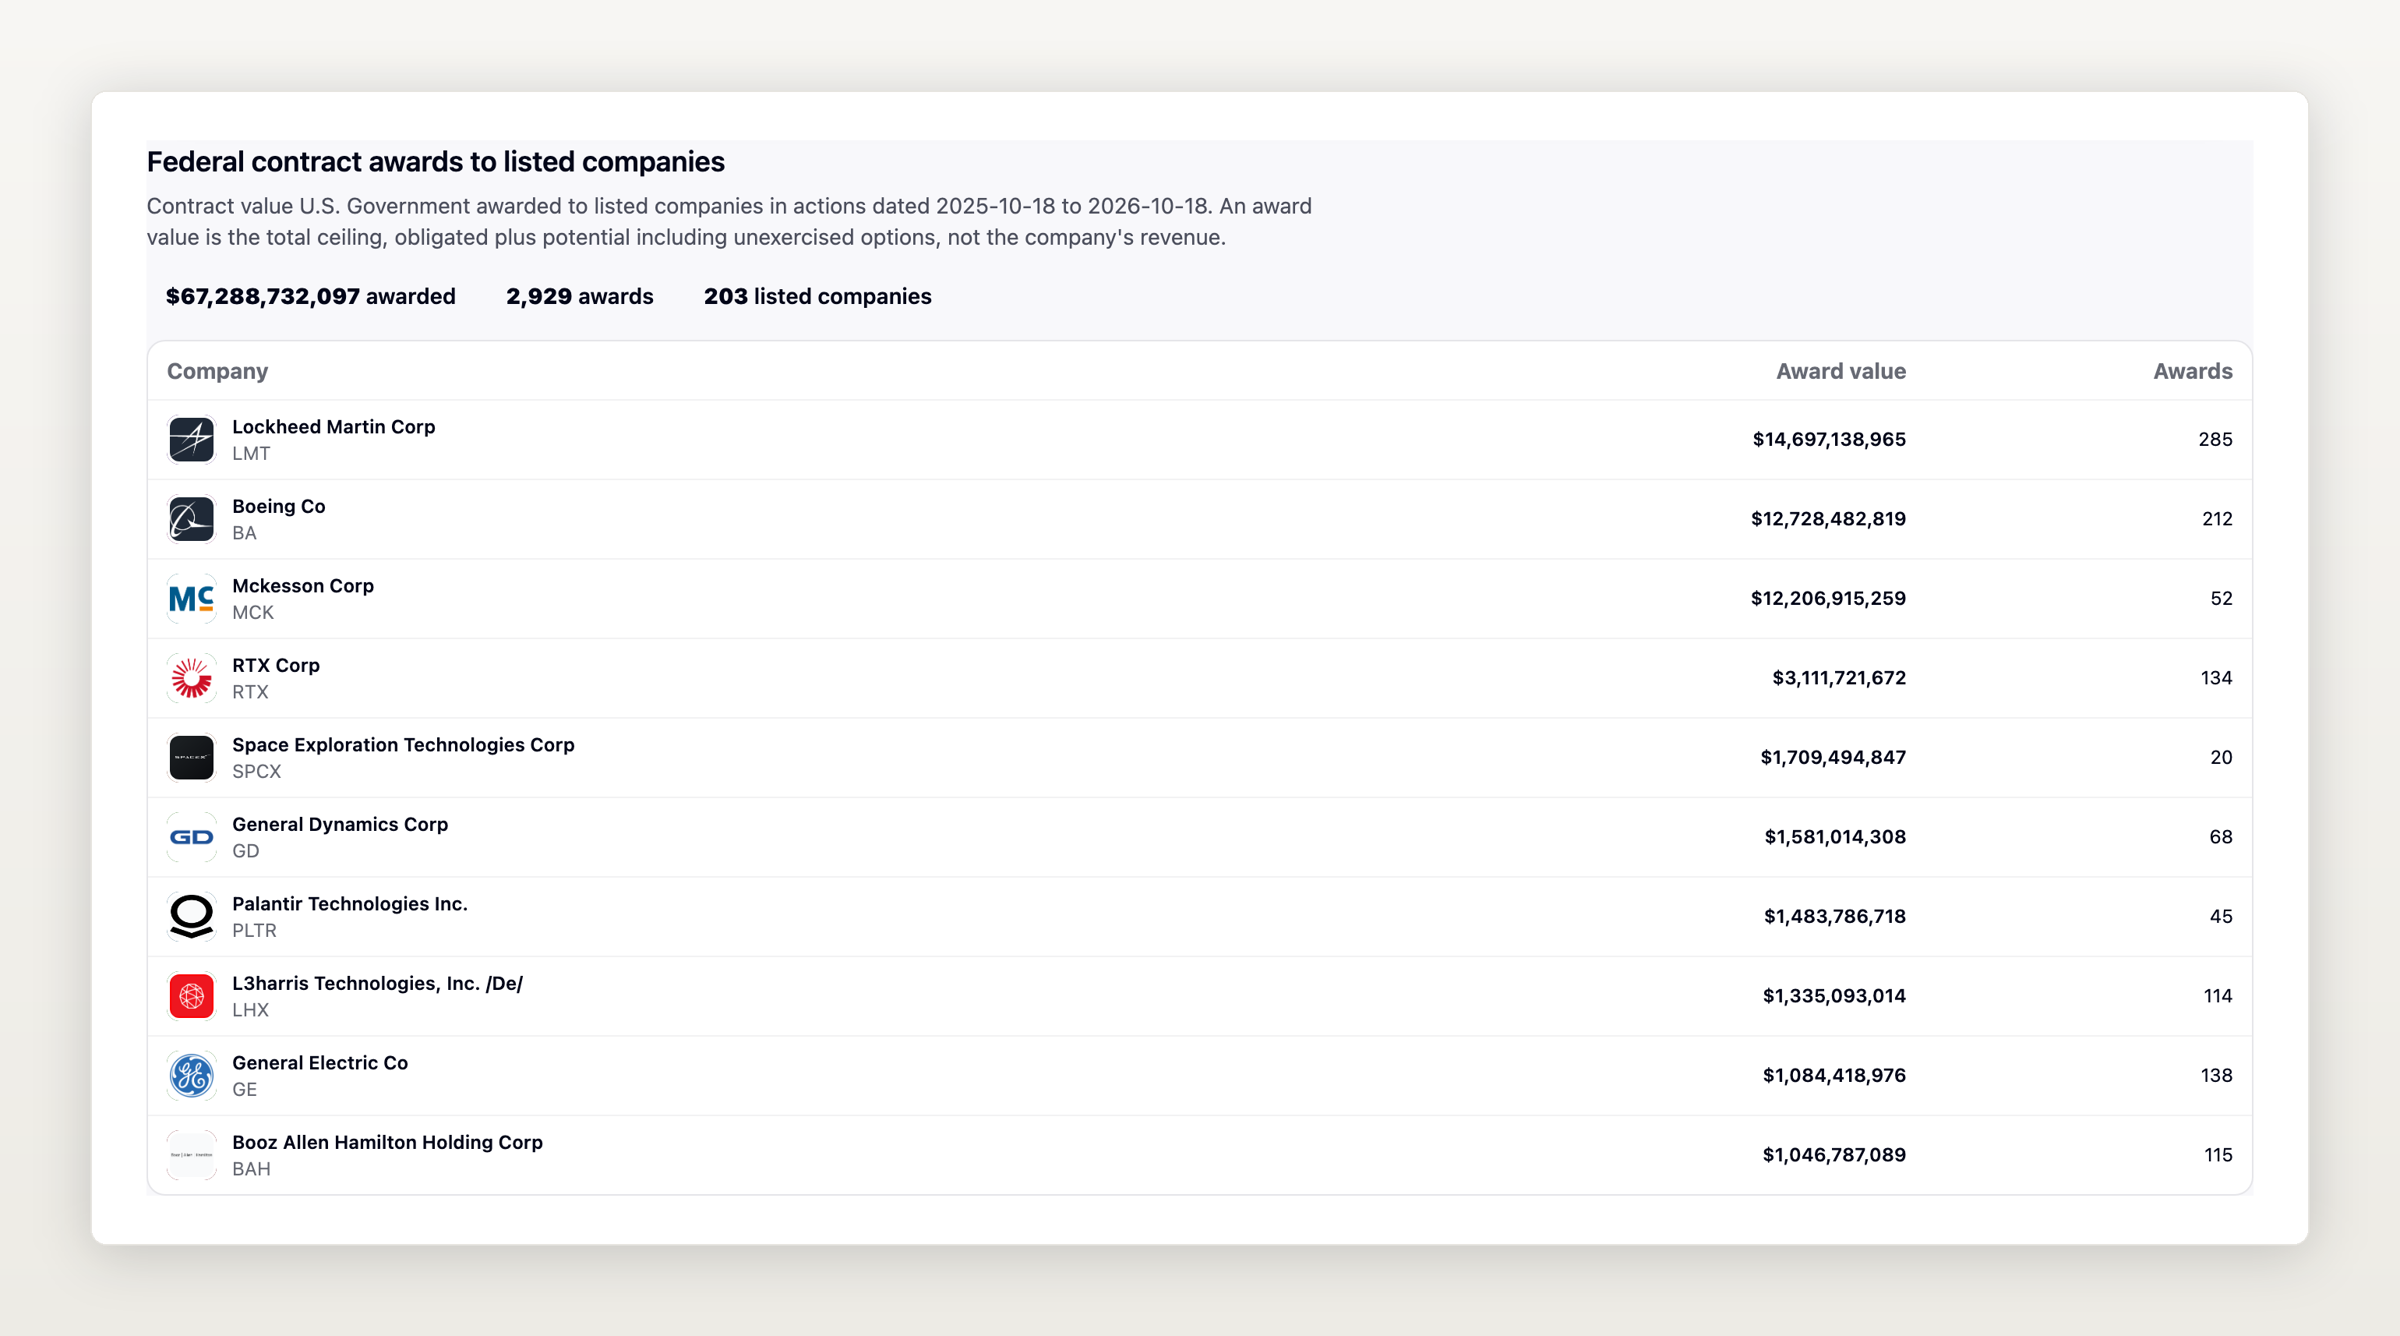
- Private companies and governments: a company no market lists, such as OpenAI, or a government customer such as the U.S. Government, has its own page with the listed companies it does business with and, for a federal agency, the listed companies it awarded the most contract value over the last 12 months.
- In your AI and your code: supply chains are in the MCP server and the REST API. The supply chain docs cover both.
The Supply Chain tab, and the names in it, are part of Pro. Other plans see how many relationships a company has and its overview figures.
Earnings calls from around the world
Earnings calls now come from around the world, each transcribed in the language it was spoken: Chinese, Spanish, German, Portuguese, Italian, Swedish and more. Calls from companies listed in Europe, mainland China and Hong Kong open on the same page as US calls, such as China State Construction in Chinese, Sacyr in Spanish and RWE in German.
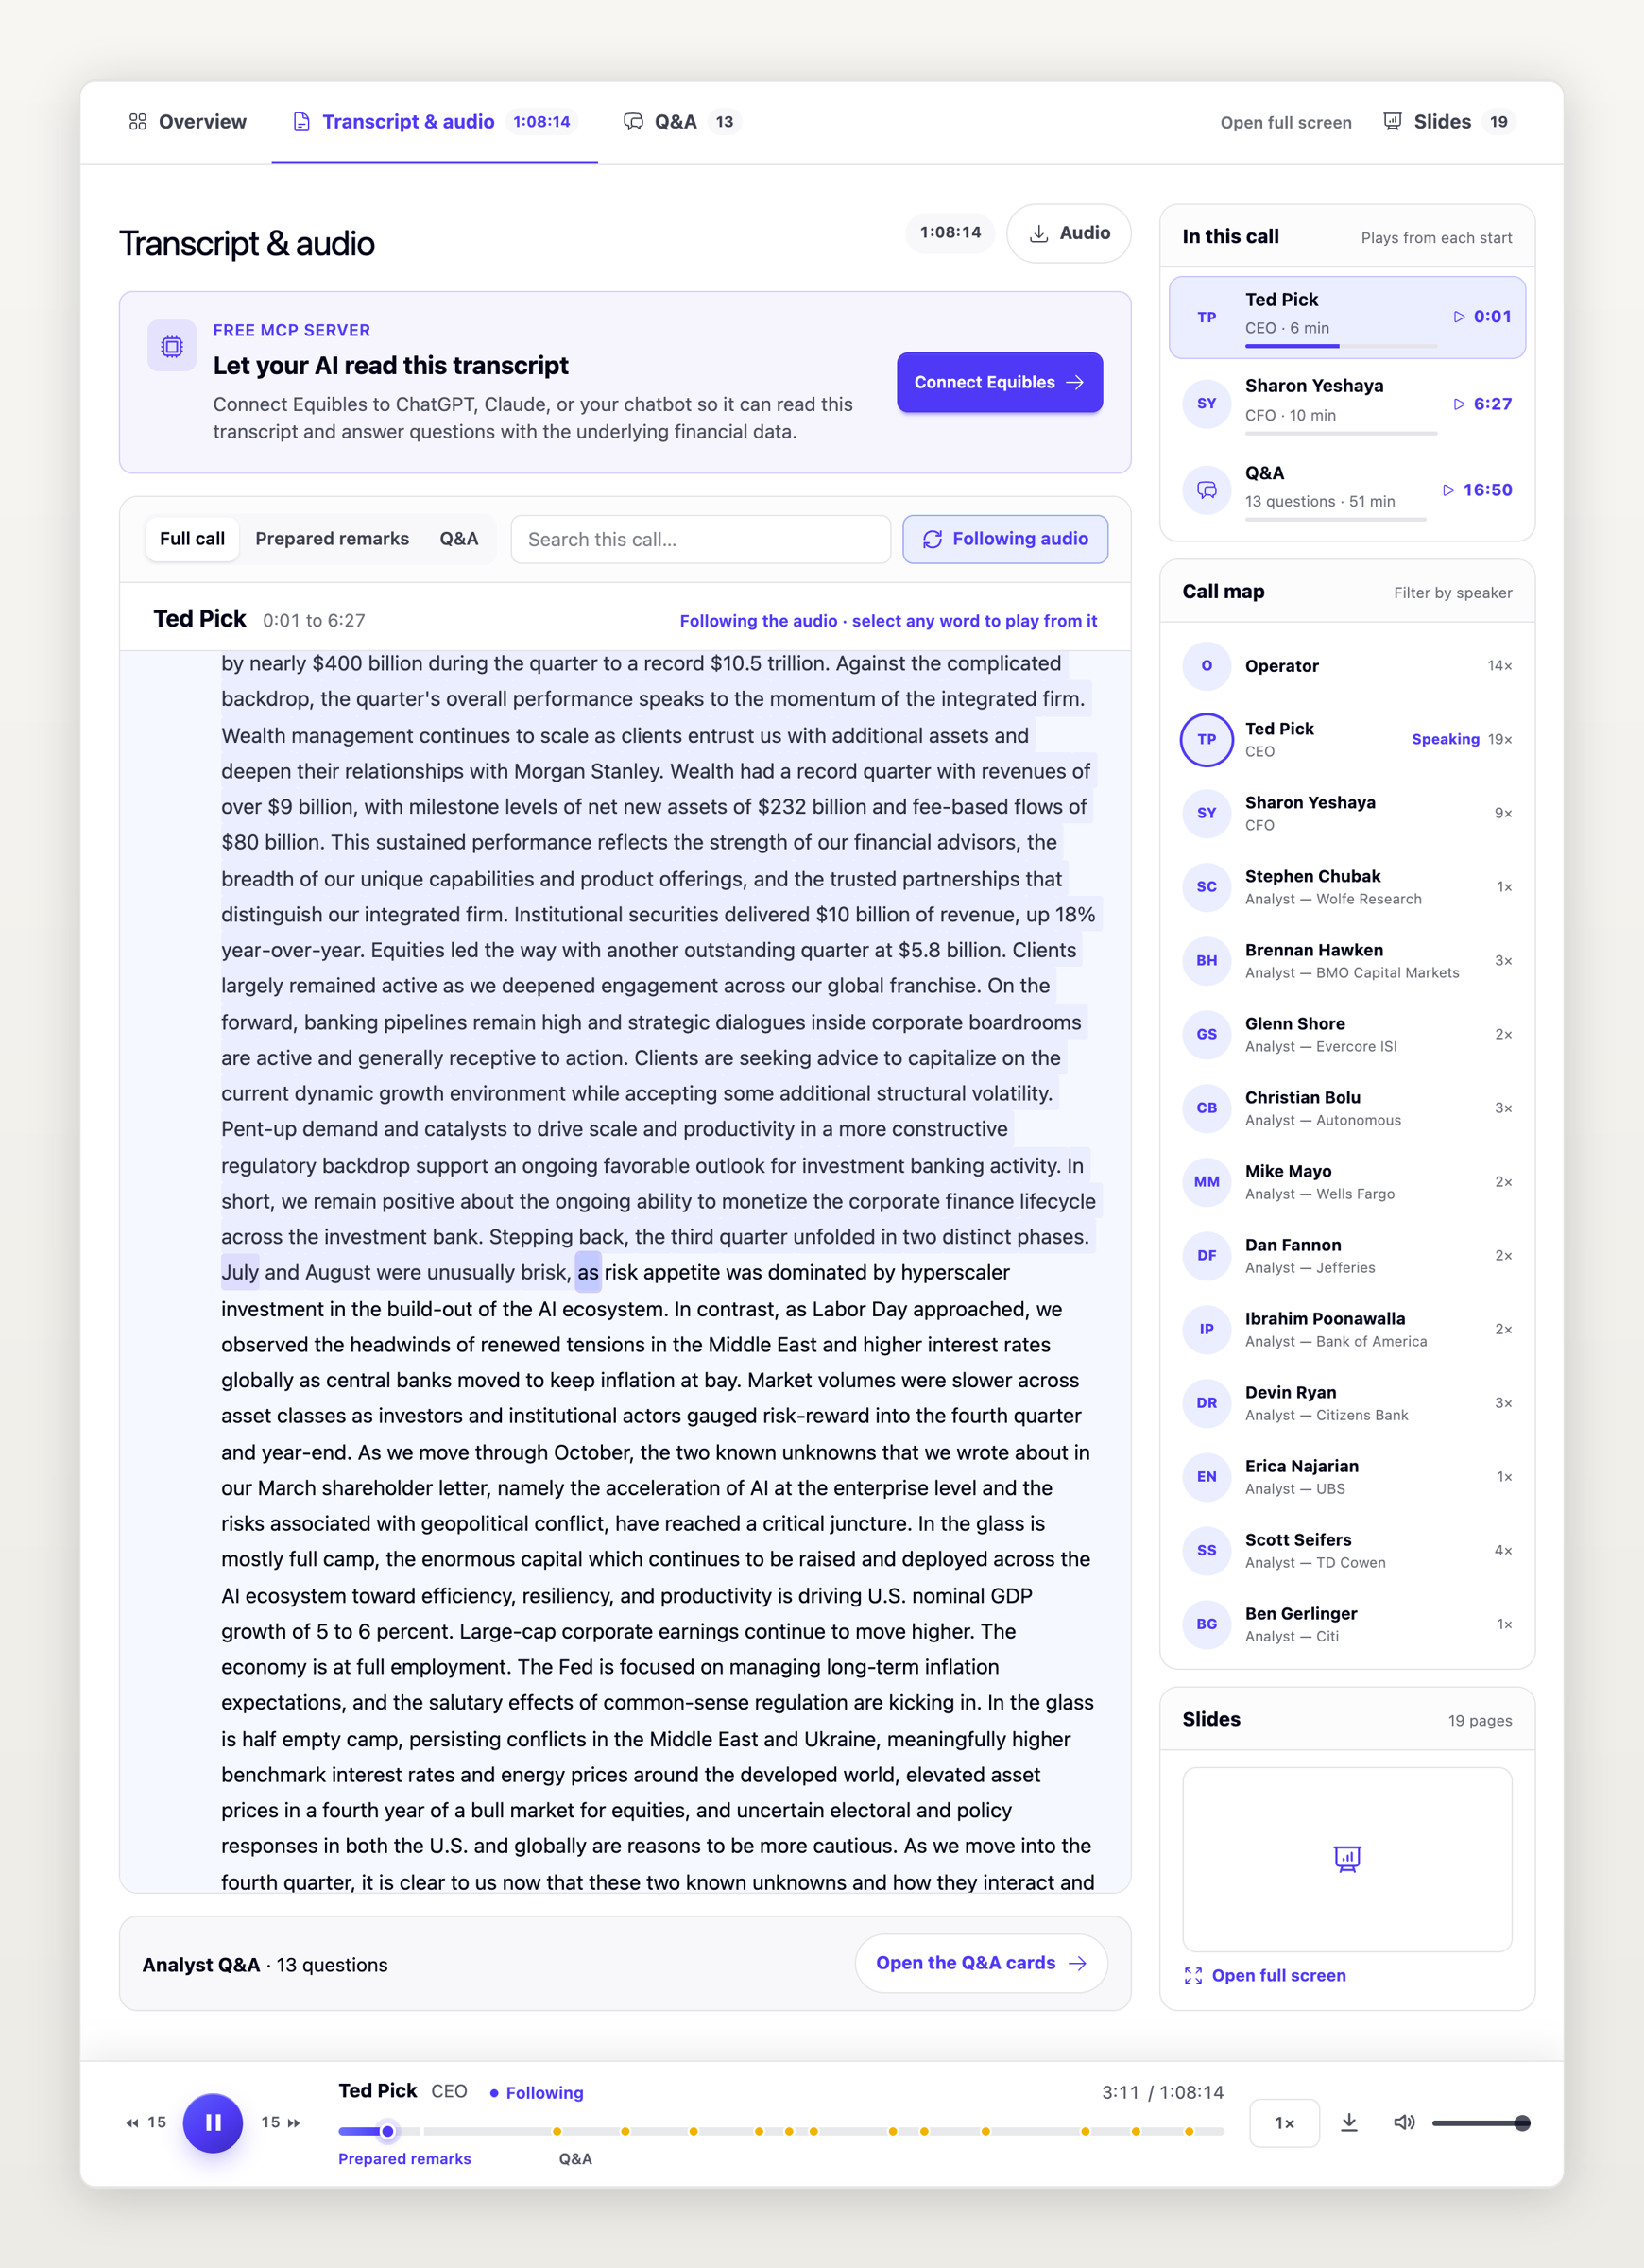
Every earnings call now opens as one research workspace: a one-minute readout with management's tone and the call's main themes, an audio player that stays docked while the transcript follows along, the slides, and the analyst Q&A as one card per analyst. Morgan Stanley's third-quarter call shows all of it.
- Phrase trends: ask your AI how often a word or phrase comes up across a company's last calls.
- Themes over time: your AI can follow each theme's mentions and tone from quarter to quarter, and see which ones are new or dropped.
- Analyst questions: every analyst question from a call, with the analyst's firm and who answered.
- Calendar feeds: add a company's earnings calls and investor events to Google Calendar, Apple Calendar or Outlook from its Webcasts tab.
- Live calls: a call page says so while the call is in progress.
The earnings call docs cover all of it.
Who holds a stock, by holder type
The Institutional Holders tab now labels each 13F filer by its type in regulatory records, never by its name: registered adviser, exempt adviser, bank, insurer, broker-dealer, registered fund, benefit plan or non-US. Filter the holders, and the largest filers, by type, and open any filer for a profile that shows the record behind its type.
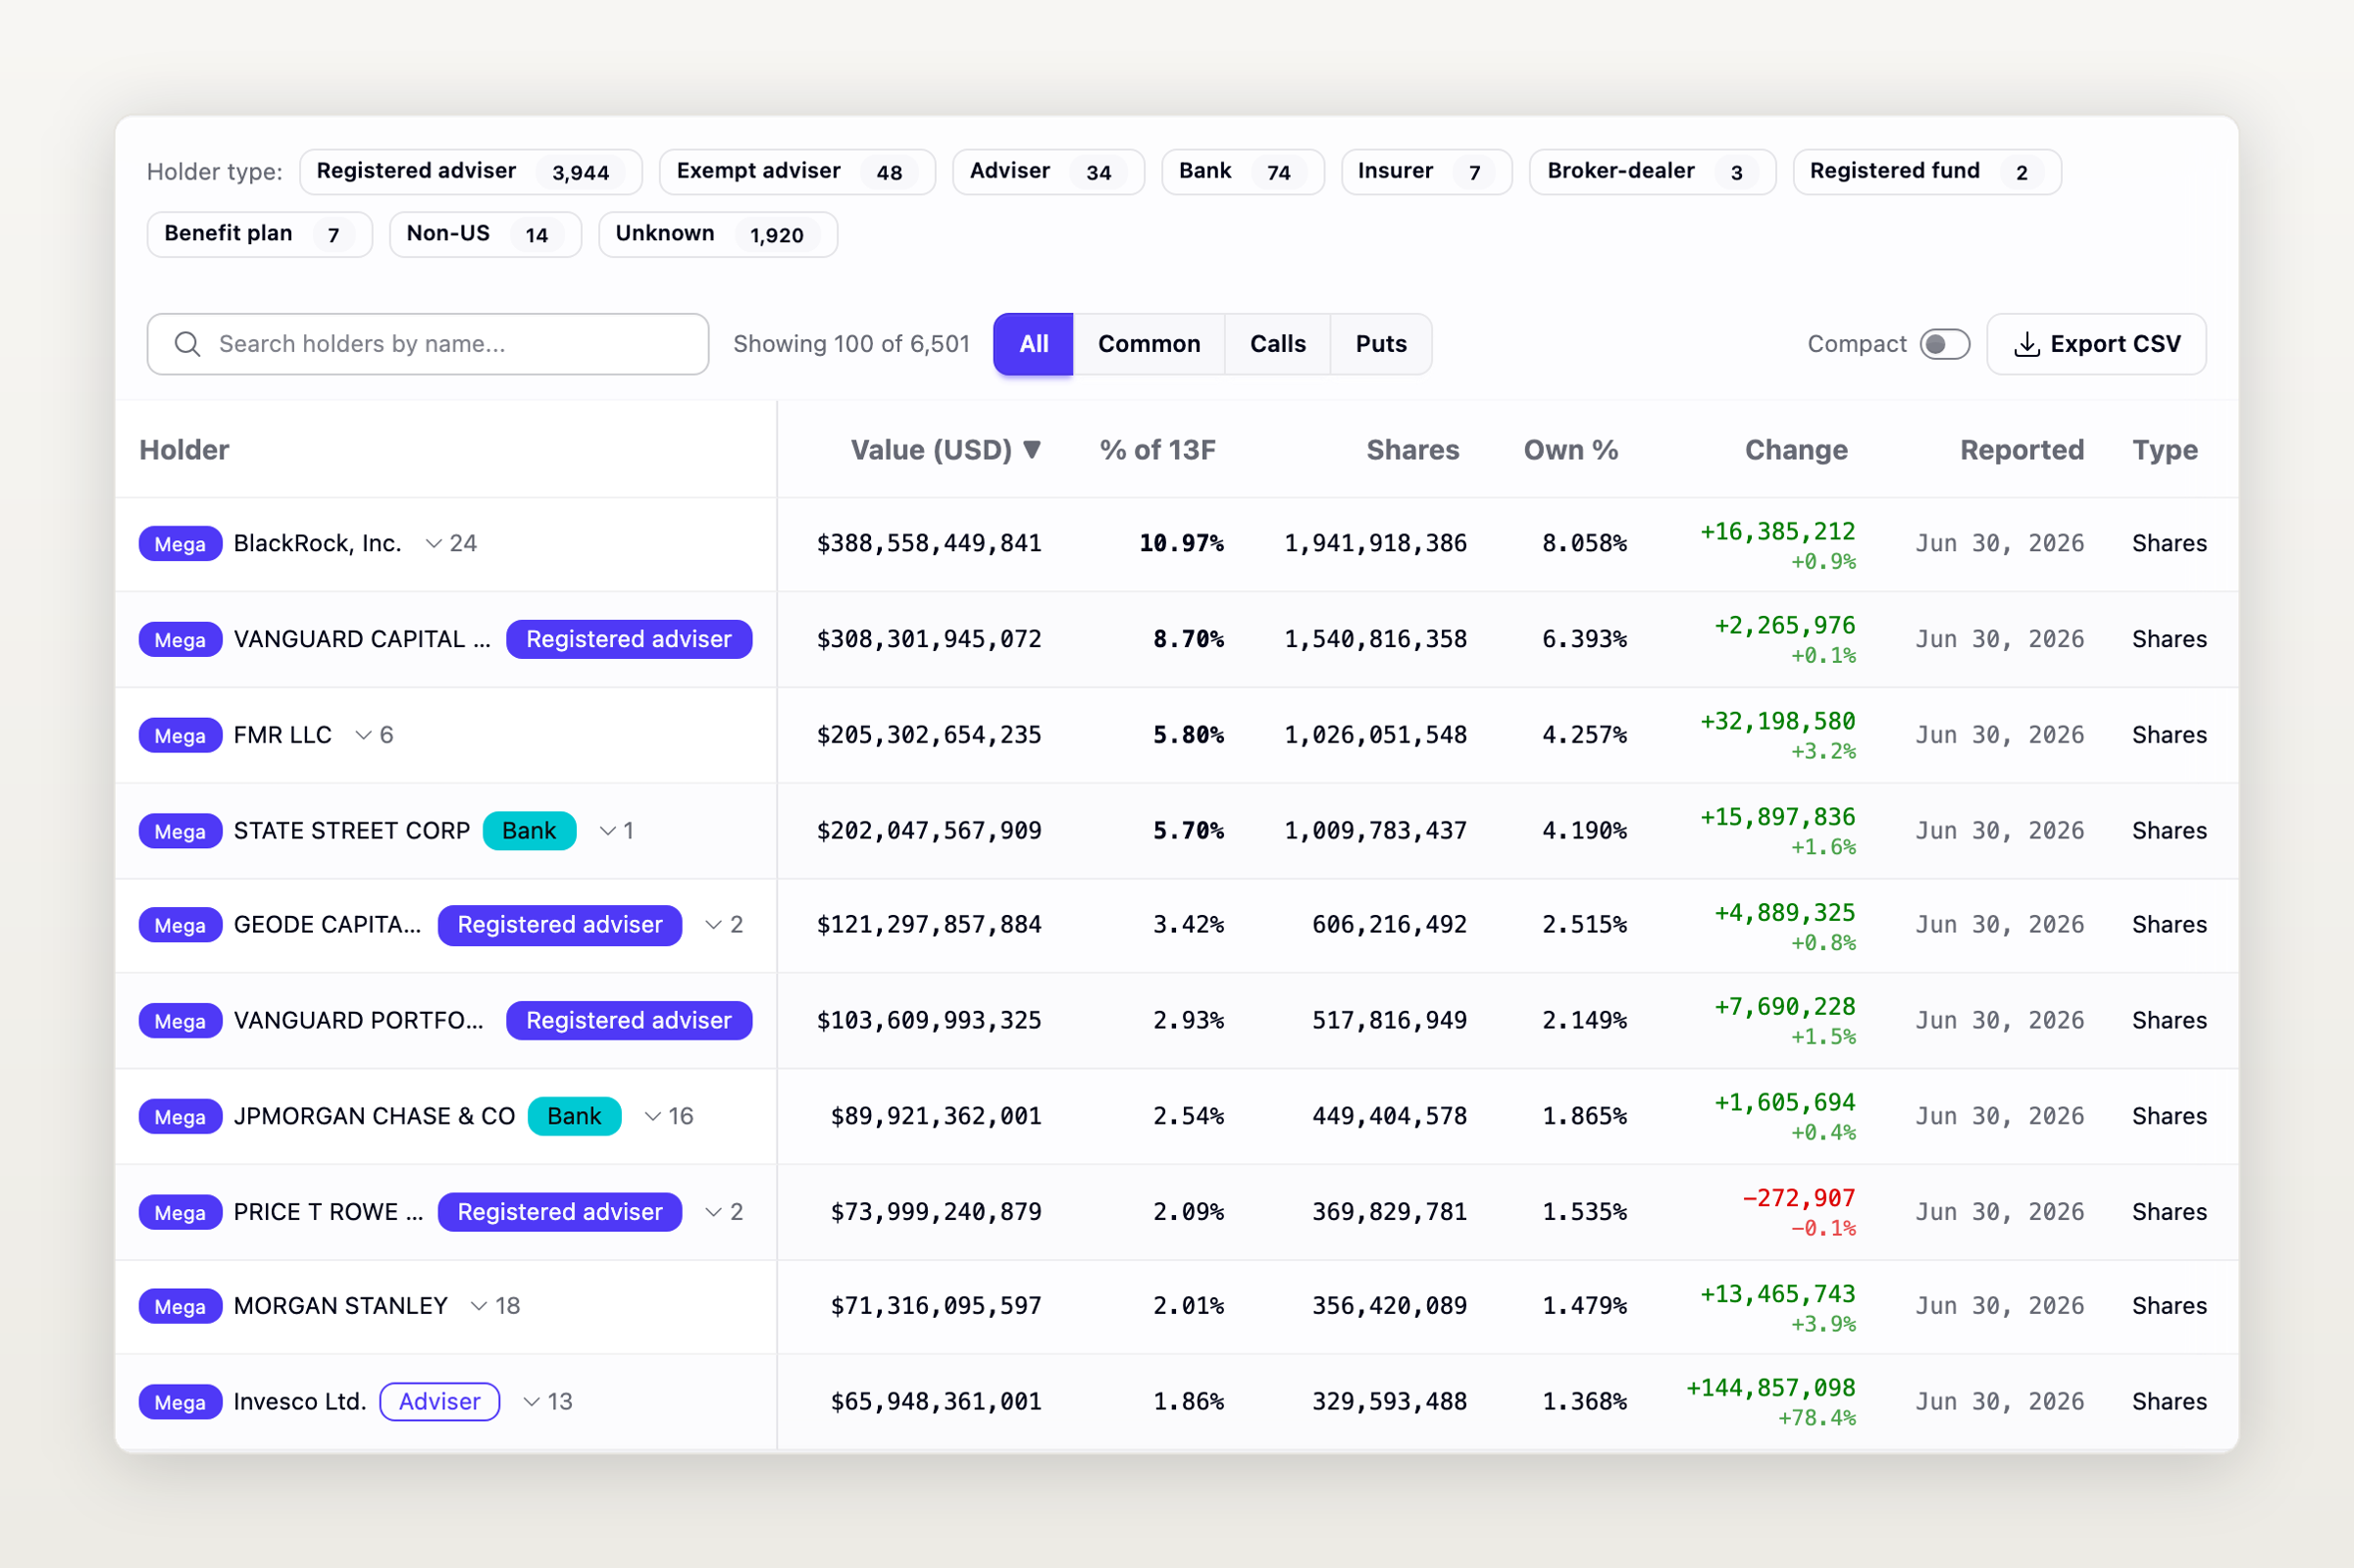
- Like-for-like movers: quarterly buyers and sellers now compare only filers that reported in both quarters, so a filer's first 13F no longer reads as a purchase. When a manager moves its reports to a new CIK, as Vanguard and BlackRock did, the comparison follows it.
- Investing style: the MCP server and the REST API measure each filer's style from the book it filed: index-like, systematic, concentrated or diversified active, with its turnover and holding period.
Trackers
Web Data Feeds are now called Trackers. Describe the data you want from a web page and a tracker collects it on a schedule, verifying each result before it is stored. Pro includes up to 50.
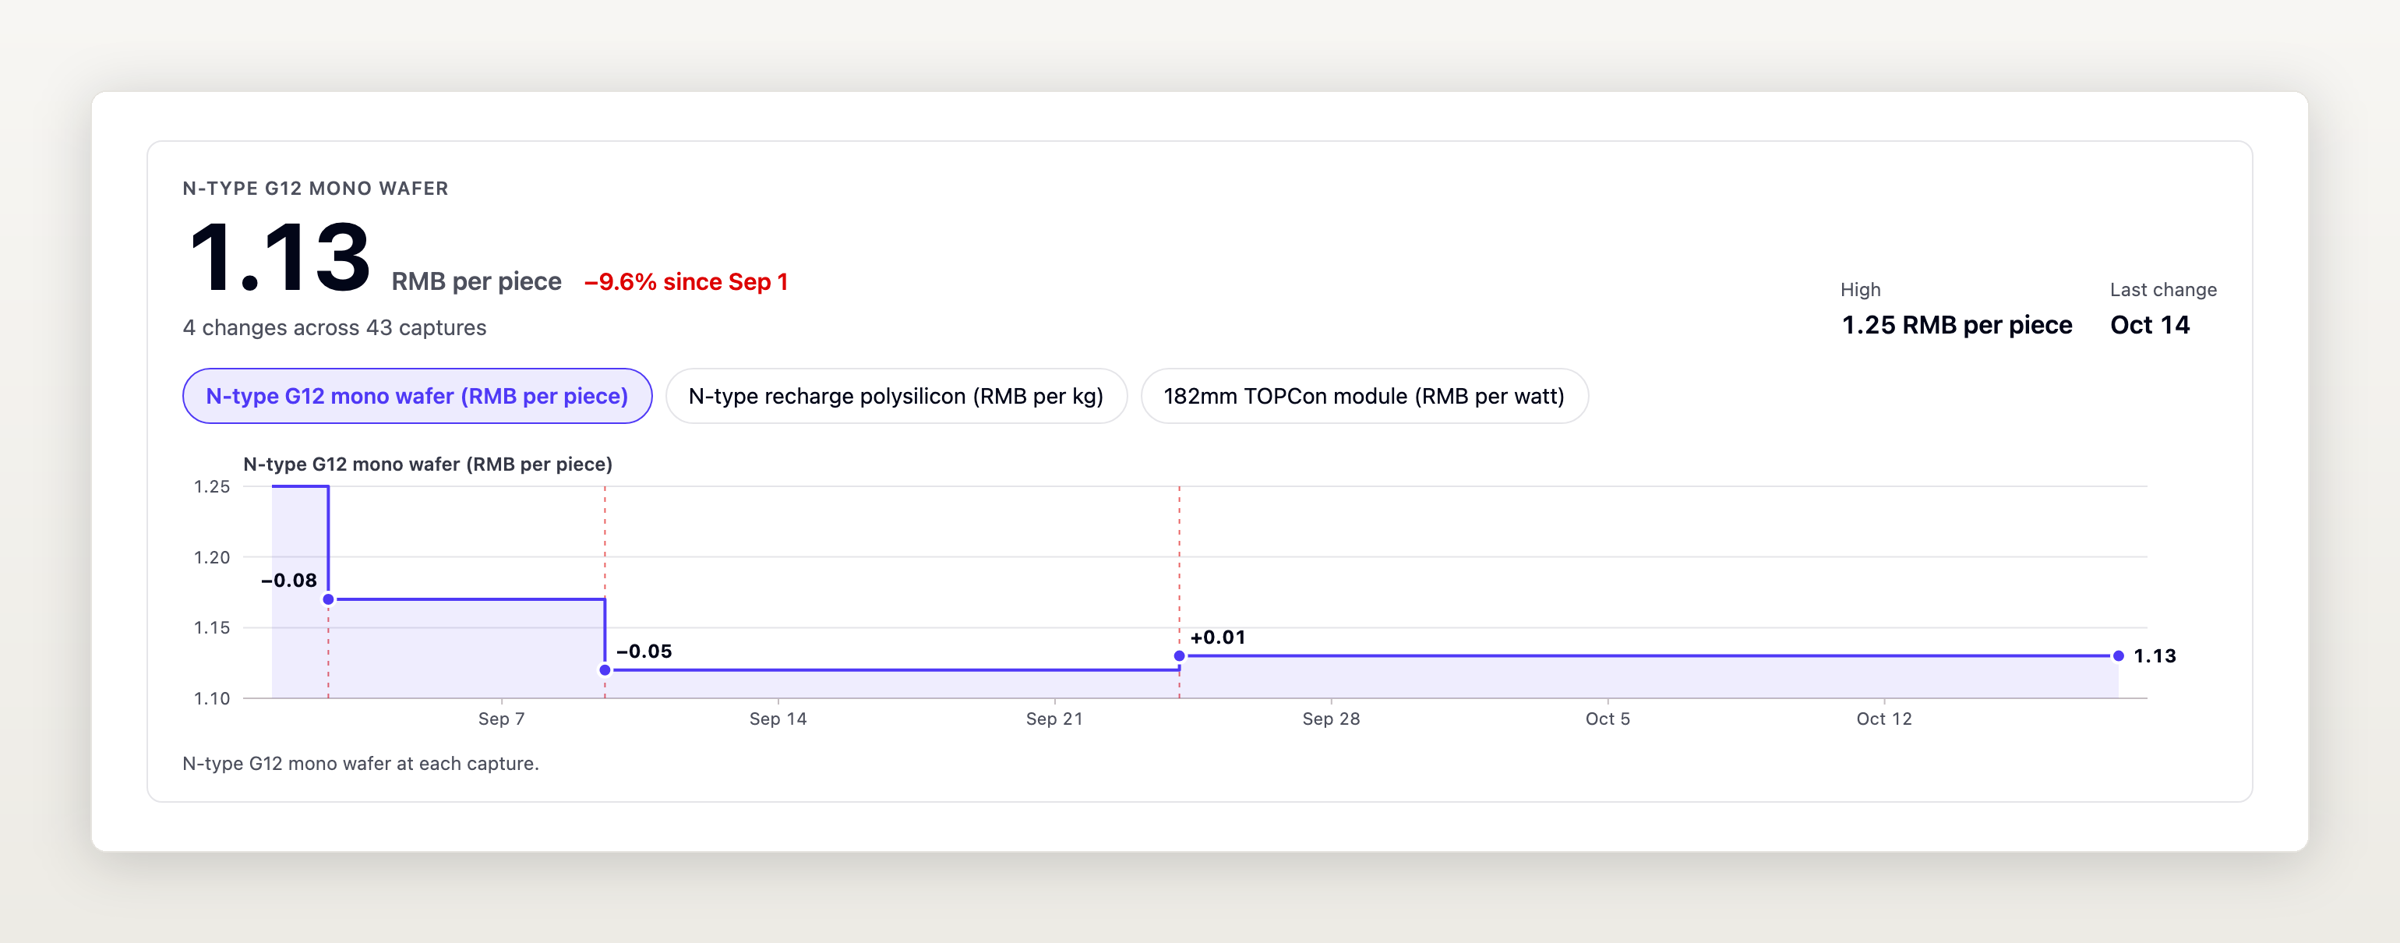
- Compiled runs: once a tracker has a verified run, its scheduled runs use a compiled extraction program instead of asking an AI model to read the page again, so every refresh returns the same fields in the same shape. The model steps back in only when a run fails, the page changes or you change what the tracker collects.
- Public trackers: a public tracker has its own page with a chart of its main value, a timeline of what changed and every capture, listed in the tracker directory. Any account can follow one.
- On stock pages: a stock's new Trackers tab lists the public trackers about that company.
- Date charts: a tracker whose rows carry dates charts each value over its own dates.
Analyst estimates on more than 5,600 companies
Stocks with analyst coverage have an Analyst Estimates tab, and your AI can read the same figures through the MCP server. Estimates are grouped by forecast period, with the low, average and high estimate side by side, the number of analysts, how the average moved over the last 7, 30, 60 and 90 days, and how many estimates were raised or lowered.
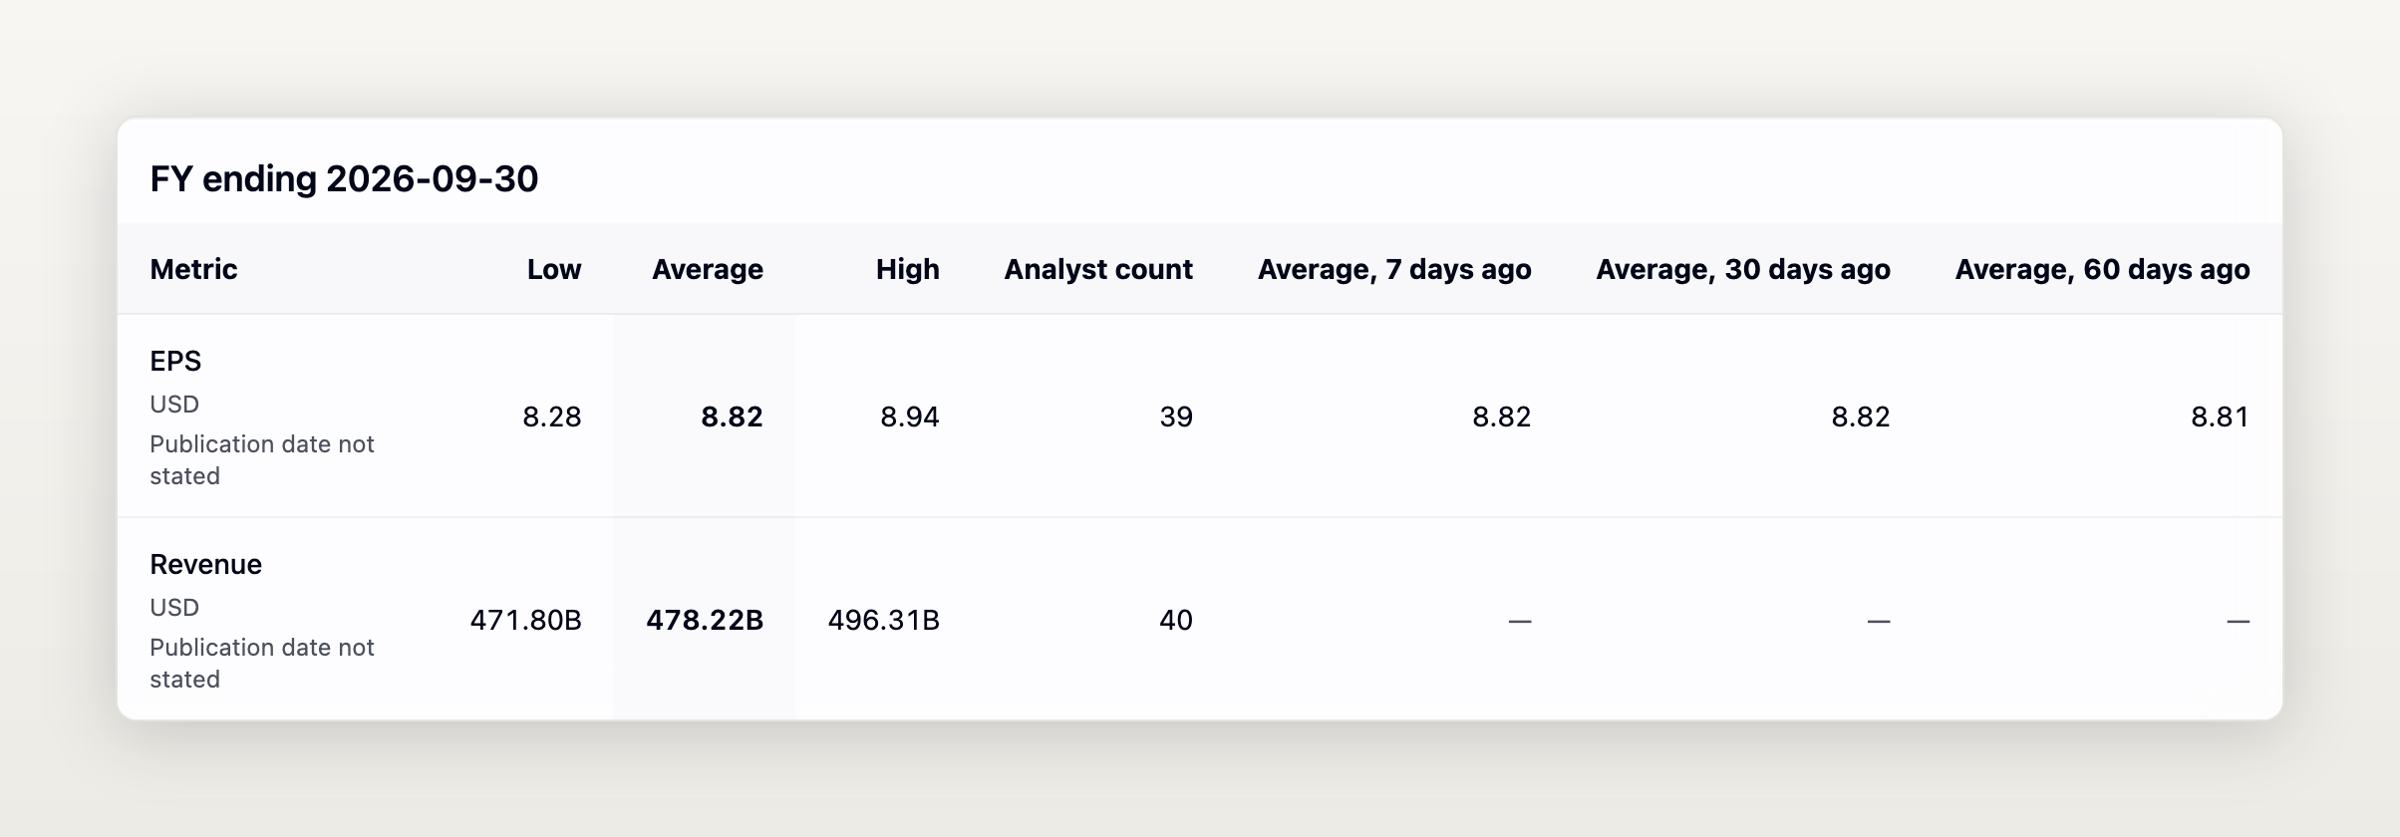
Each page says where its figures come from. For more than 5,500 companies they are a compiled consensus of analyst forecasts. When there is none but the company publishes its own analyst survey on its investor-relations site, as Nokia does, the page shows that survey, labelled "Published by the company". Earlier snapshots stay one click away, so you can see how the consensus moved.
Also new
- Congressional trading statistics: trades and filings per year since 2012, late disclosures past the 45-day deadline, the most traded stocks and trade sizes, each figure dated so you can cite it.
- Outside the US: Hong Kong and mainland China financial statements from HKEX and CNINFO results, and European short positions, director dealings and Swedish fund holdings in the MCP server and ALVIS.
- Portfolios: hold stocks listed outside the US, report a portfolio in its own currency, and get an email when a company you hold announces a call or posts its transcript, slides or replay.
- Filings: proxy materials, registration statements and their amendments, tender offers, late-filing notices and annual reports to shareholders, each with its original document, and accession numbers and acceptance times on every filing list.
- REST API: financial statements, screener exports to CSV, stock splits, and holder types and institution profiles.
- Transcripts: transcripts that companies publish on their investor-relations sites, and the newest call linked from each summary.
- Charts and metrics: the summary chart pans and zooms back to 2020, and REIT stock pages show P/FFO and P/AFFO.
The changelog lists every MCP and REST change.
What should we add next?
What feature would you like to see next? Tell us, whether it is a new dataset, a tool or a change to a page you already use.