Operator
Hello, everyone. Thank you for joining us, and welcome to the Clearwater Paper 4th Quarter and Full Year 2025 Earnings Conference Call. After today's prepared remarks, we will host a question and answer session. If you would like to ask a question, please press star 1 on your telephone keypad. To withdraw your question, press star 1 again. I will now hand the call over to Sloan Bolin, Investor Relations. please go ahead.
Thank you so much. Good afternoon, and thank you for joining Clearwater Papers' fourth quarter and full year 2025 earnings conference call. Joining me on the call today are Arson Kitsch, President and Chief Executive Officer, and Sherry Baker, Senior Vice President and Chief Financial Officer. Financial results for the fourth quarter of 2025 are released shortly after today's market close. You will find a presentation of supplemental information, including a slide providing the company's current outlook, posted on the Investor Relations page of our website at clearwaterpaper.com. Additionally, we will be providing certain non-GAAP financial information in this afternoon's discussion. A reconciliation of the non-GAAP information to comparable GAAP information is included in the press release and in the supplemental information provided on our website. Please note slide two of our supplemental information covering forward-looking statements. Rather than reading this slide, we'll incorporate it by reference into our prepared remarks.
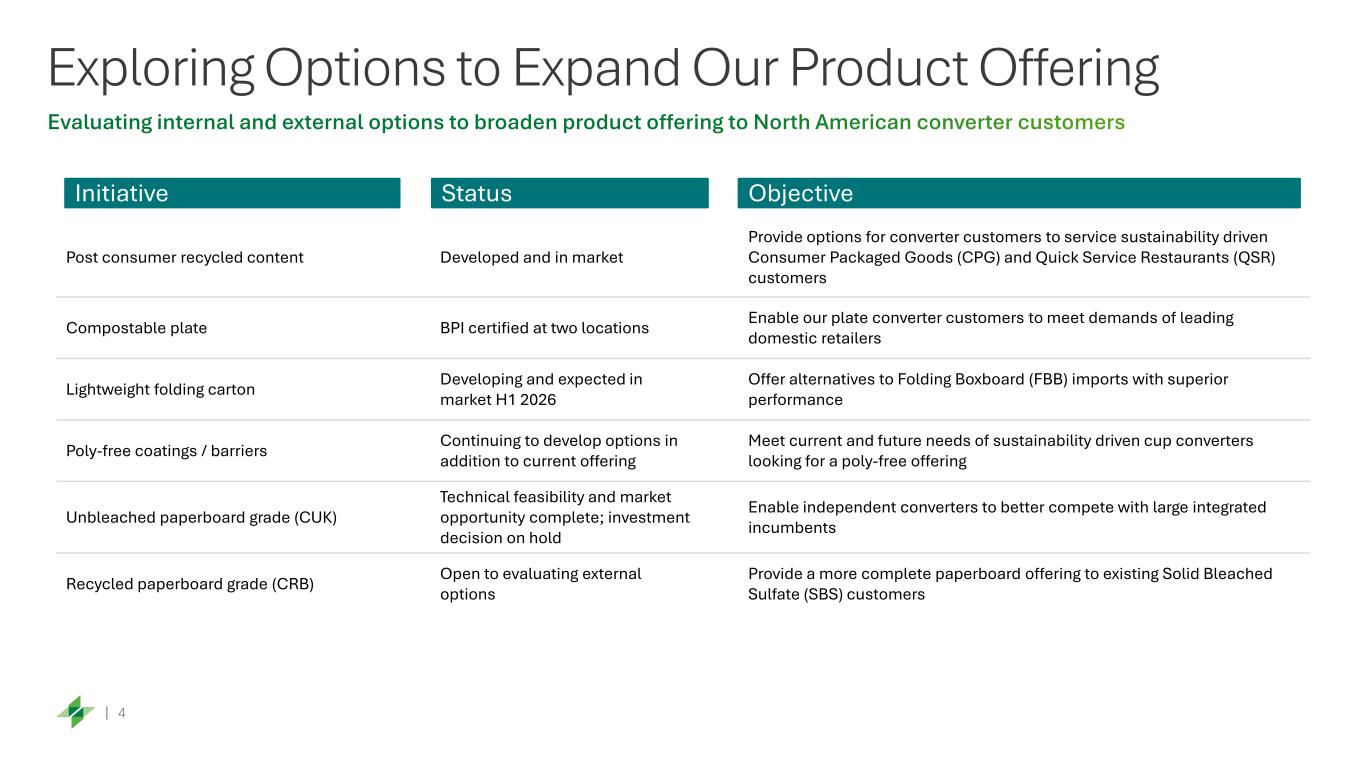
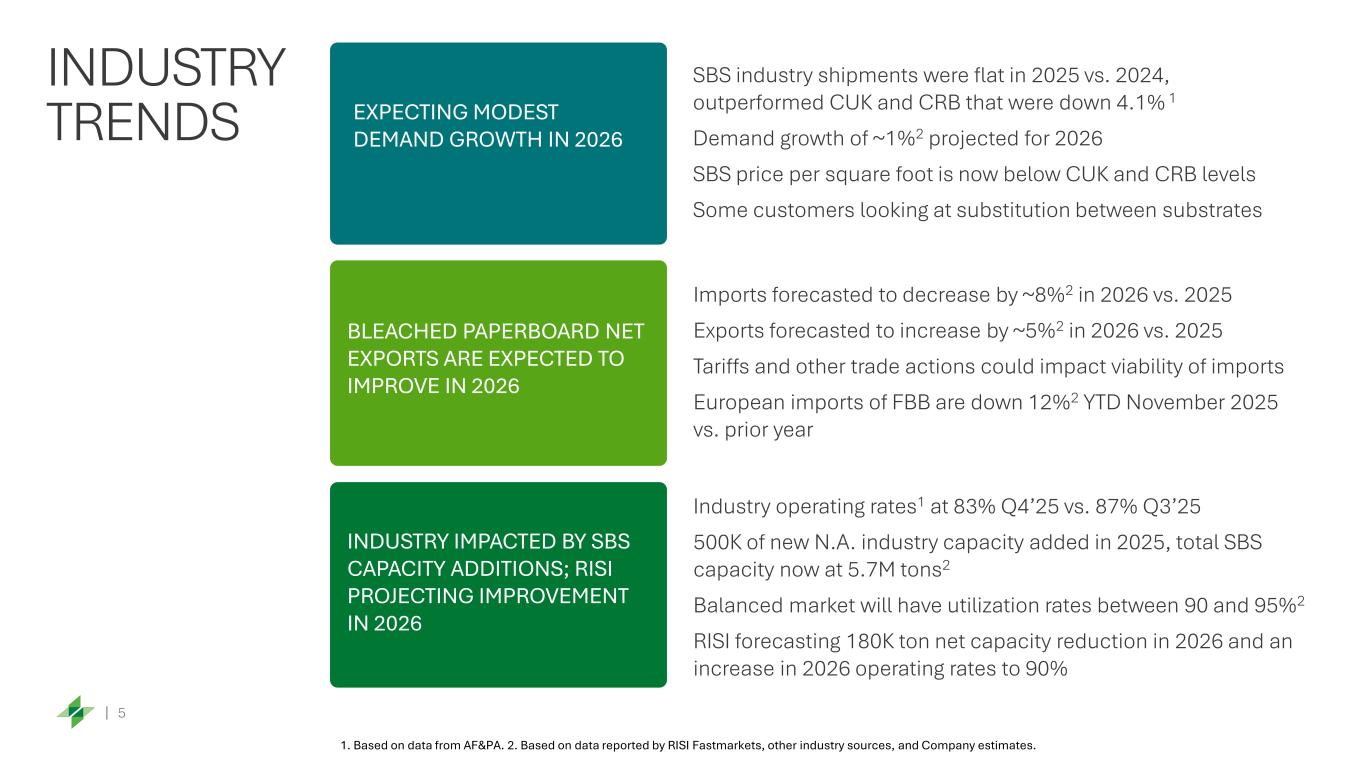
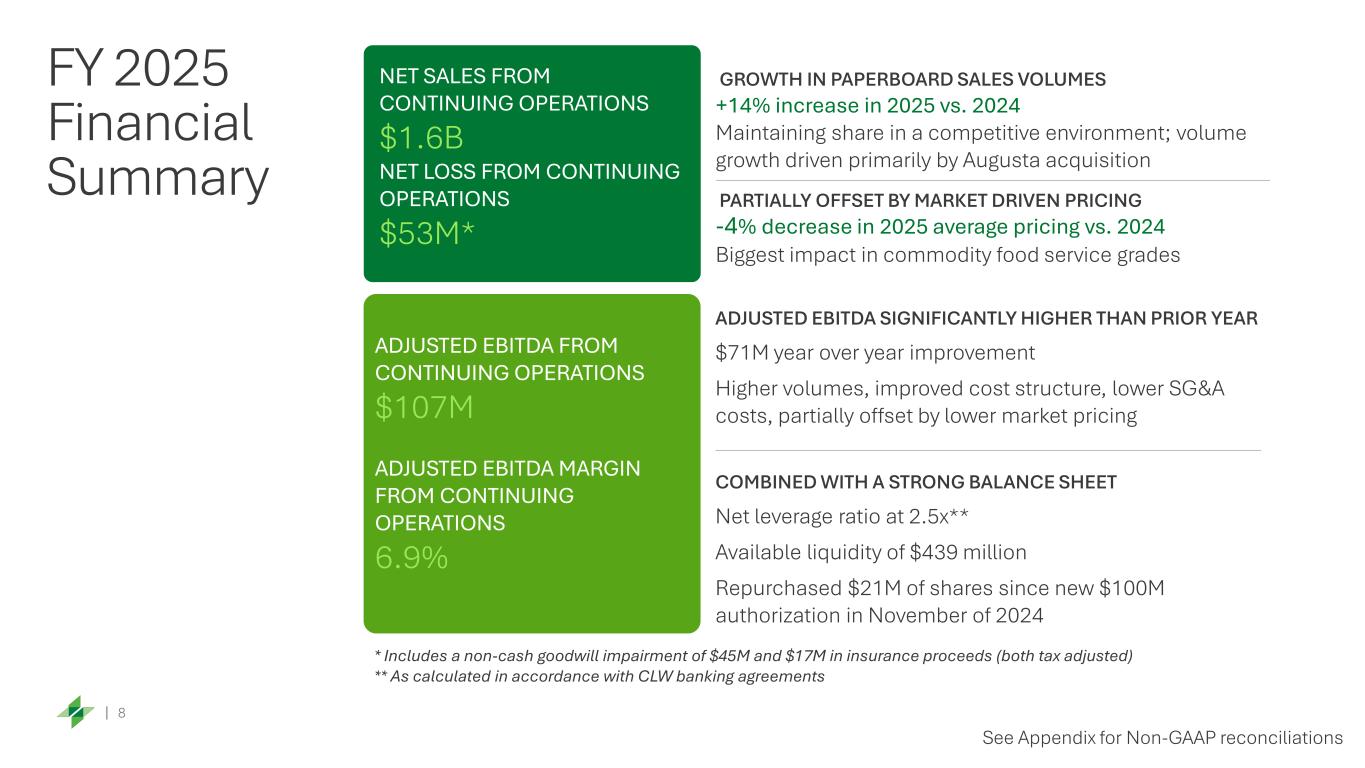
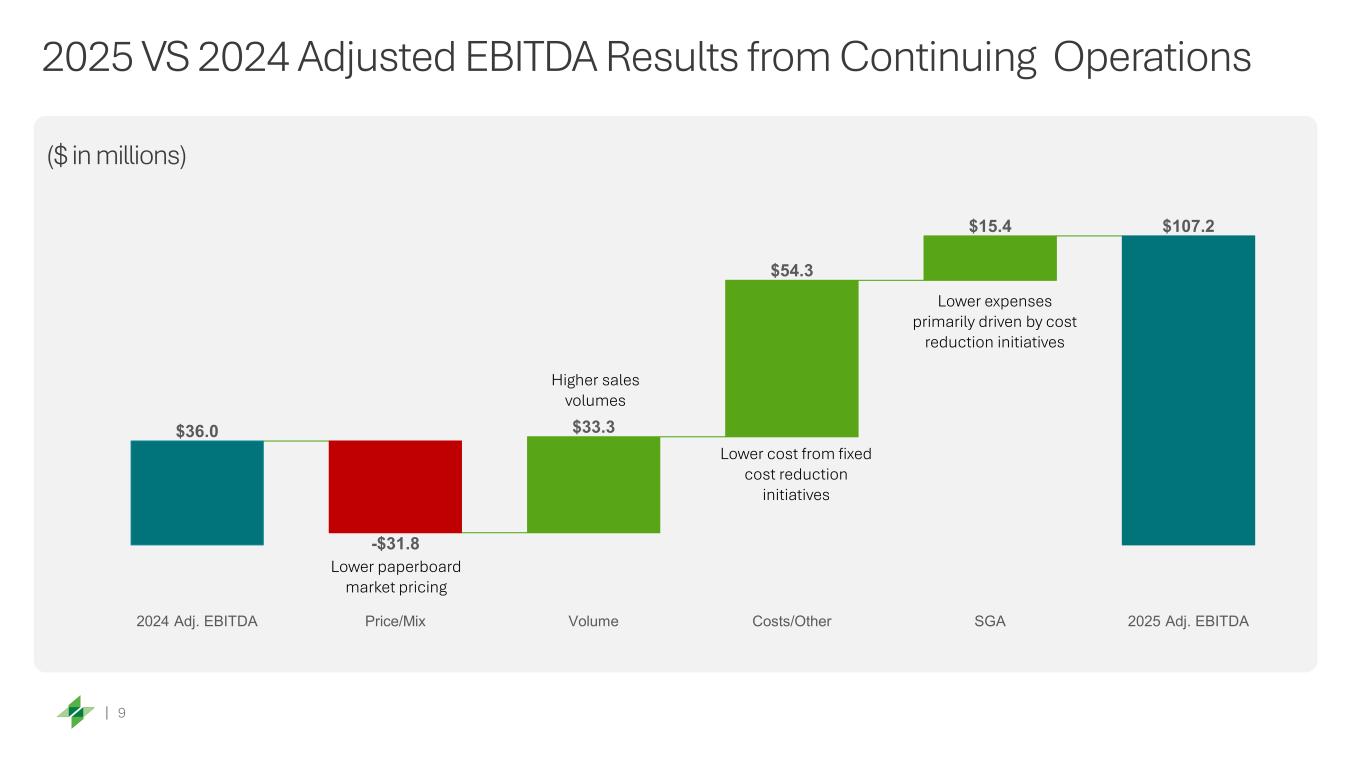
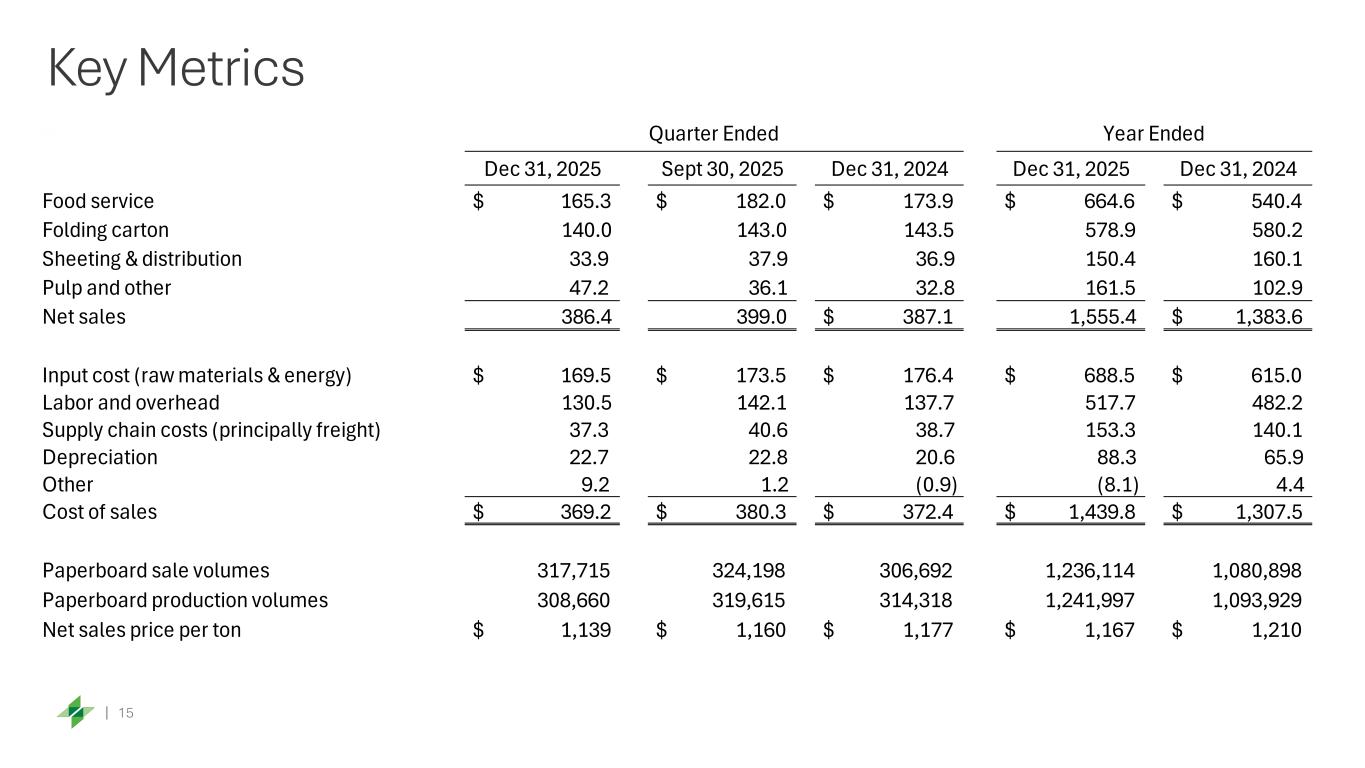
With that, let me turn the call over to Arson. good afternoon and thank you for joining us today 2025 was a transformational year for clearwater paper it was our first full year operating as a paperboard focused business and i'm pleased with how well our team executed even as we faced a challenging industry environment let me provide a brief recap of our 2025 performance we successfully completed the integration of the Augusta mill and the separation of our tissue business, both ahead of schedule. Net sales increased by 12% year over year, driven by a 14% increase in shipments, primarily from operating the Augusta mill mill for a full year. Adjusted EBITDA was 107 million, an improvement of 71 million versus the prior year, driven by exceptional cost control and execution. We completed all three major maintenance outages in 2025, on schedule with total direct costs of $50 million, marking a significant improvement in execution and cost versus 2024. We delivered more than $50 million in fixed cost reductions, including $16 million in SG&A savings, which should improve our long-term earning potential as our industry recovers. SG&A declined to 6.5% of net sales, down from 8.4% in 2024, for which we believe positions us as an industry leader on this metric we repurchased 17 million dollars worth of shares during the year with 79 million remaining under our under our authorization and importantly we maintained a strong balance sheet ending the year with more than 400 million in liquidity looking ahead we will continue to evaluate our options and alternatives to maintain financial flexibility and optimized capital allocation, including refinancing our 2020 notes, which go current in August of 2027. Let me spend the next few minutes discussing current industry dynamics and the actions that we're taking to position us for return to cross-cycle margins and cash flows. Sherry will then review our financial results in more detail, including our first quarter out and key assumptions for 2026. I will then conclude with remarks on our shareholder value proposition. Let's start with our industry. Paperboard continues to face challenging supply and demand dynamics, particularly in SBS. We believe that there are three factors that are driving this imbalance. First, demand recovery for packaging is not materialized as expected. Industry shipments of SBS were largely flat year-over-year based on the latest AFMPA data and down in CRB and C-UK. CPG and QSR volumes remain lackluster, pressured by inflation, economic uncertainty, and the likely impact of GLP-1 drugs on consumption. While demand for SBS is relatively flat, a competitor added more than 500,000 tons of and new capacity in 2025, representing approximately a 10% increase in industry supply. As a result, industry operating rates decreased to the low 80% range by the end of 2025, leading to pricing and margin pressure. At these margin levels, we do not believe that Clearwater can produce the cash flows and returns that are necessary to reinvest in these types of capital-intensive assets in the long run. We also believe that these dynamics are beginning to impact other paperboard substrates, as there is meaningful overlap in end-use applications. Today, SBS is priced lower on a per-ton basis than C-U-K, even though SBS has higher manufacturing costs and a superior print service. SDS is also priced lower on a per-score foot basis versus CRV, since a heavier weight CRV is required to replicate the performance characteristics of SDS. We are aware of CPG customers that are actively moving their business from CRV to SDS, a trend that we expect to continue at these price levels. Let me briefly discuss the most recent RECI-reported price movements in SPS and the impact on our business. Recy reported a $100 per ton decrease in their SPS folding card index during the fourth quarter. From our vantage point, this change did not accurately reflect industry pricing as a price declined by an average of only $21 per ton from Q3 to Q4 and not $100 per ton. While we disagree with Recy's latest reported decrease, we're faced with a $50 million price headwind as a result. After the Augusta acquisition, approximately 40% of our volume is now tied to the RECI Folding Card Index, while 10% is tied to the RECI Cup Index. In total, including the latest fourth quarter RECI Index change, we're faced with an approximately $70 million pricing headwind in 2026 versus 2025. While the most recent fourth-quarter pricing movements were negative, RECI is projecting a recovery in both SBS operating rates and pricing in 2026. Specifically, RECI is projecting operating rates to improve to 90%, with a price increase of $60 per ton in 2026 and a total of $130 per ton by the end of 2027. If these projections were to hold, our margins would improve by more than 10% and get us back towards cross-cycle returns and cash flows. As I mentioned previously, this is a supply-driven downturn that is unsustainable. Specifically, we believe that supply now exceeds demand by about 400,000 to 500,000 tons, resulting in industry operating rates being around 10% below historical norms. We believe that this is a temporary condition and that a combination of three factors will drive an improvement in the supply and demand balance and get us back to cross-cycle margins and cash flow. First, SPS demand is forecasted to grow in 2026, and we should benefit from substitutions. Second, imports are forecasted to decrease by 8% in 2026, while exports increase by five percent. And third, RECI has forecasted a net capacity reduction of 180,000 tons in 2026. With all these changes, RECI is forecasting industry operating rates to approach 90 percent by year-end, and we believe that these factors will accelerate an improvement in industry conditions going forward. While the industry environment remains challenging, we're focused on controlling the controllables and assessing our options. First, we continue to focus on running efficiently, reducing costs, and maintaining share with our long-standing strategic customers. Second, we recently announced a price increase to our customers of $60 per ton in our Cub grades and $50 per ton for all other products. These increases are necessary to offset the cumulative impact of inflation over the last several years and to enable us to continue to invest in our assets. These increases impact approximately 50% of our volume that is not tied to the RECI price index. The remaining 50% of our volume will move as industry pricing is reflected in the RECI price index. Lastly, we plan to balance Clearwater's supply with demand in 2026, which may include with extended curtailments on our assets and variabilizing our costs whenever possible. In addition, we will look at our manufacturing assets to determine what actions we can take to reduce our costs further and improve our margins and cashflow. Let me wrap up with a few comments in our strategic efforts to diversify our product portfolio. We believe that these efforts will deepen our relationships with our converter customers and allow us to sell incremental volume. We are preparing to launch Valora, a new lightweight paperboard product line, in the second quarter. This brand incorporates mechanical pulp in the middle layer and is designed to compete with FBB, which represents approximately 10% of North American bleached paperboard demand. We have completed the engineering feasibility for a C-U-K investment at our Cypress Bend facility, with a cost now estimated at $60 million, with a 12- to 18-month execution timeline. We believe that annual C.U.K. supply is roughly 2.5 million tons in North America, of which 300,000 to 400,000 tons is currently sold to independent converters. With this investment, we believe that we can capture approximately 100,000 to 150,000 of these tons. The remaining 200,000 tons of capacity at Cypress Bend would provide flexibility to meet bleached paperboard demand or target additional unbleached products, such as White Top. We believe that this project offers an attractive return and enhances our ability to manage through market cycles. We have not made the final decision on this project at this point. In addition, we're continuing to evaluate external options to add CRB to our portfolio, further diversifying our end market exposure. With that, I'll turn the call over to Sherry to walk through our fourth quarter and full year financial results, along with our first quarter outlook and full-year assumptions.
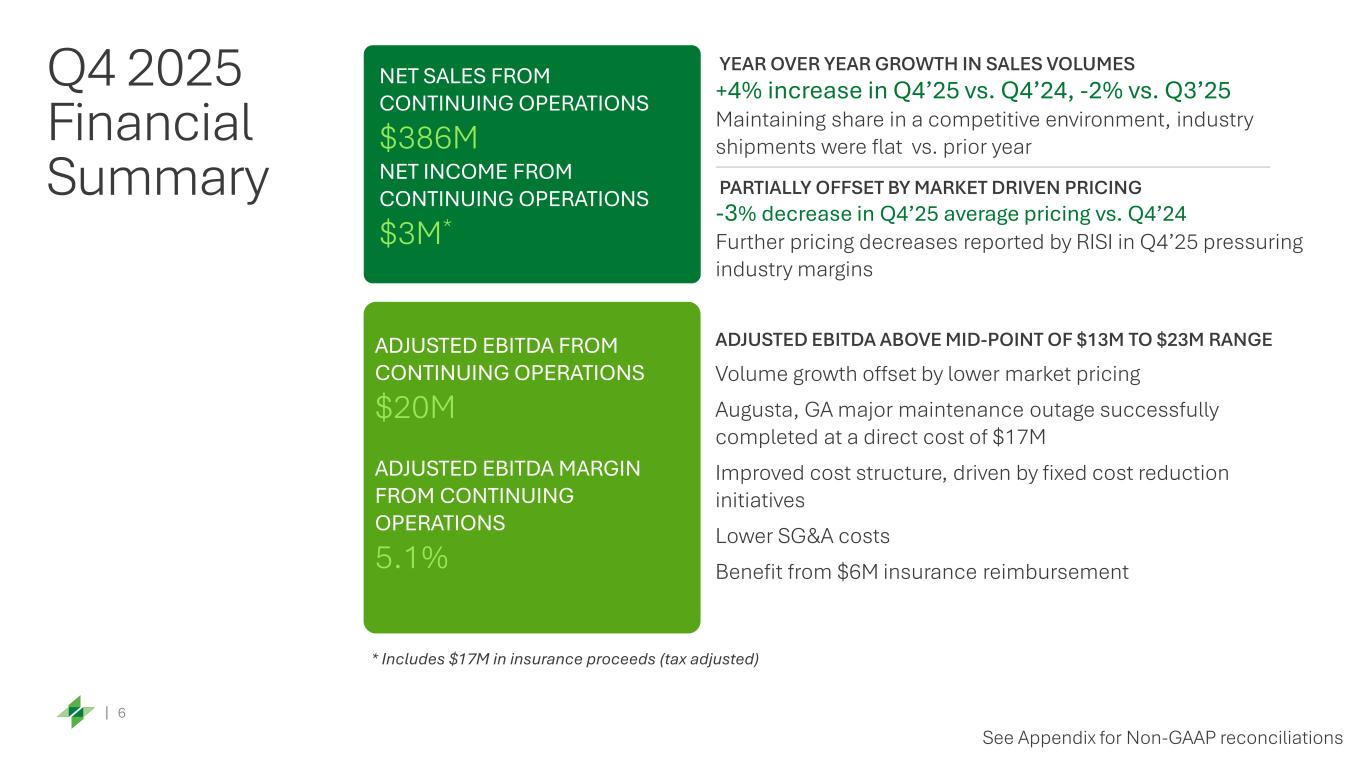
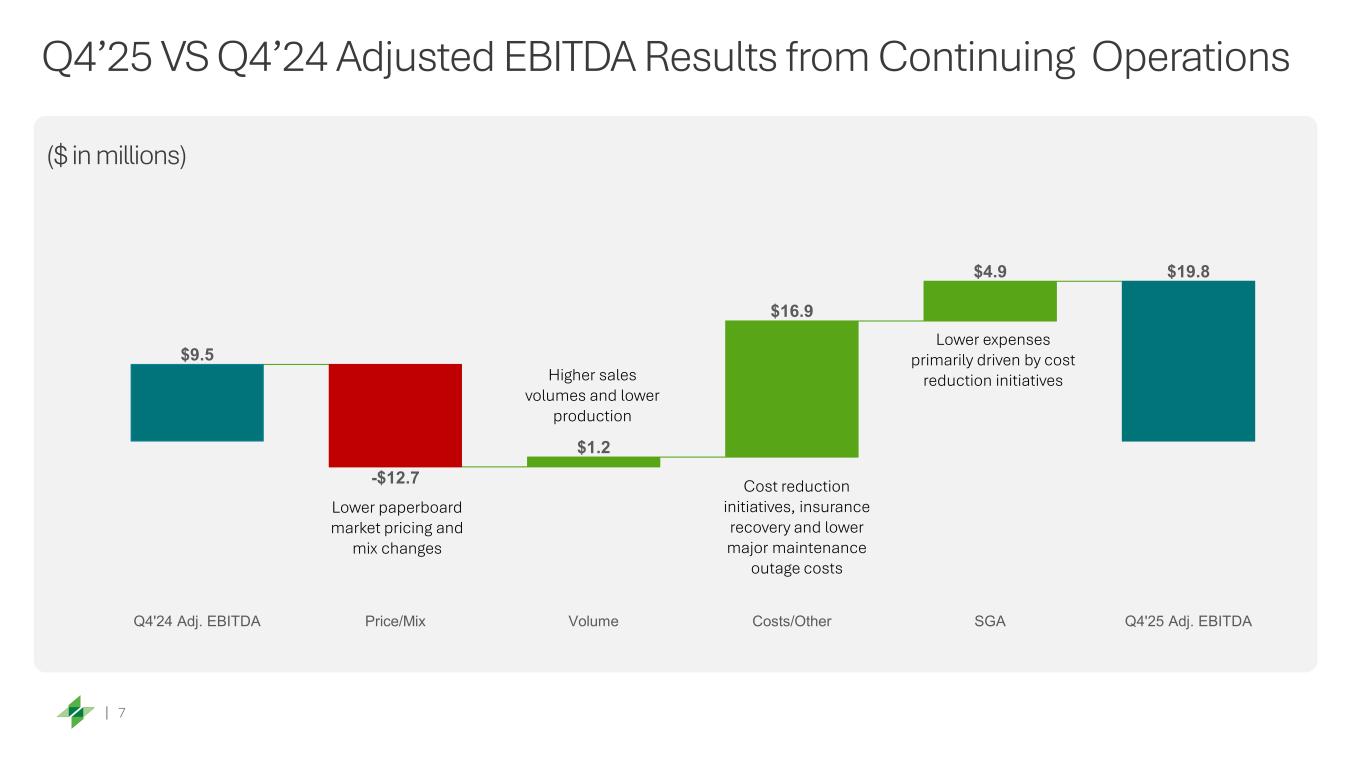
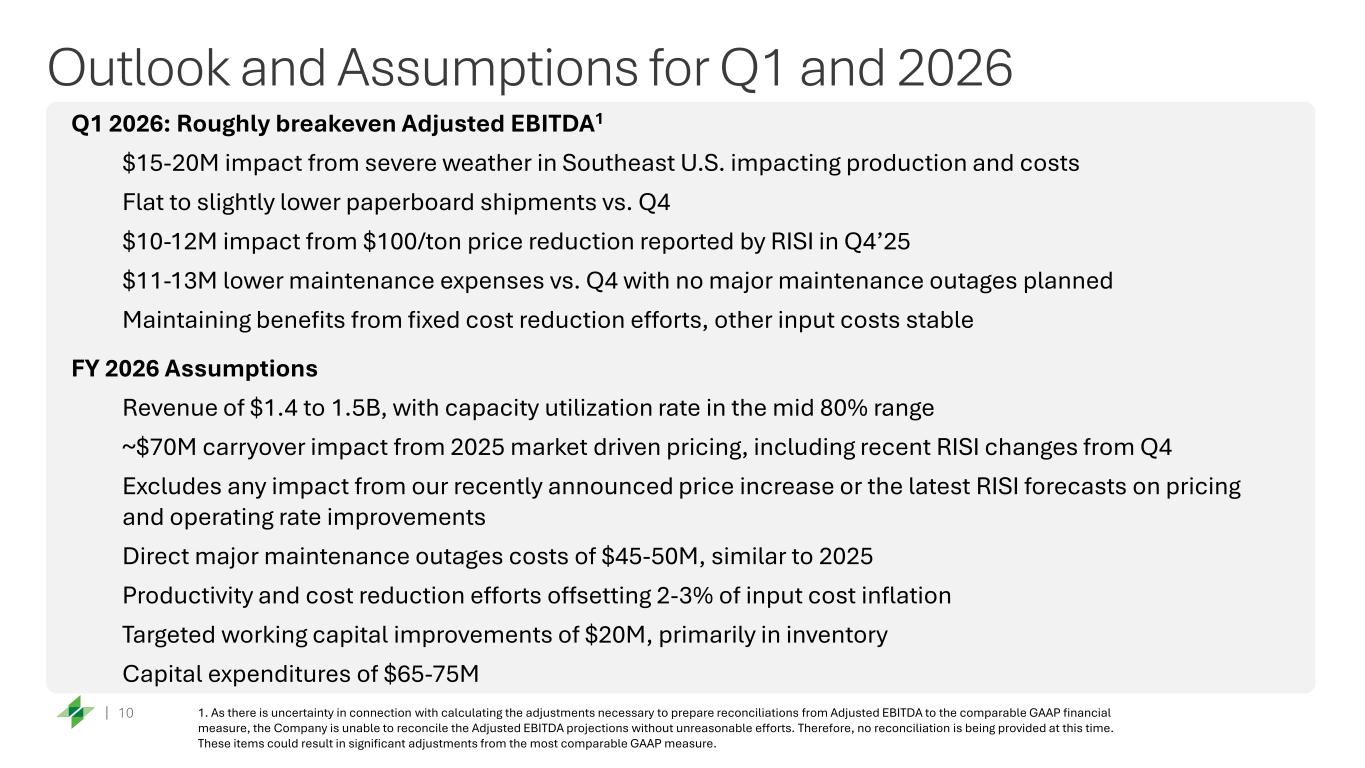
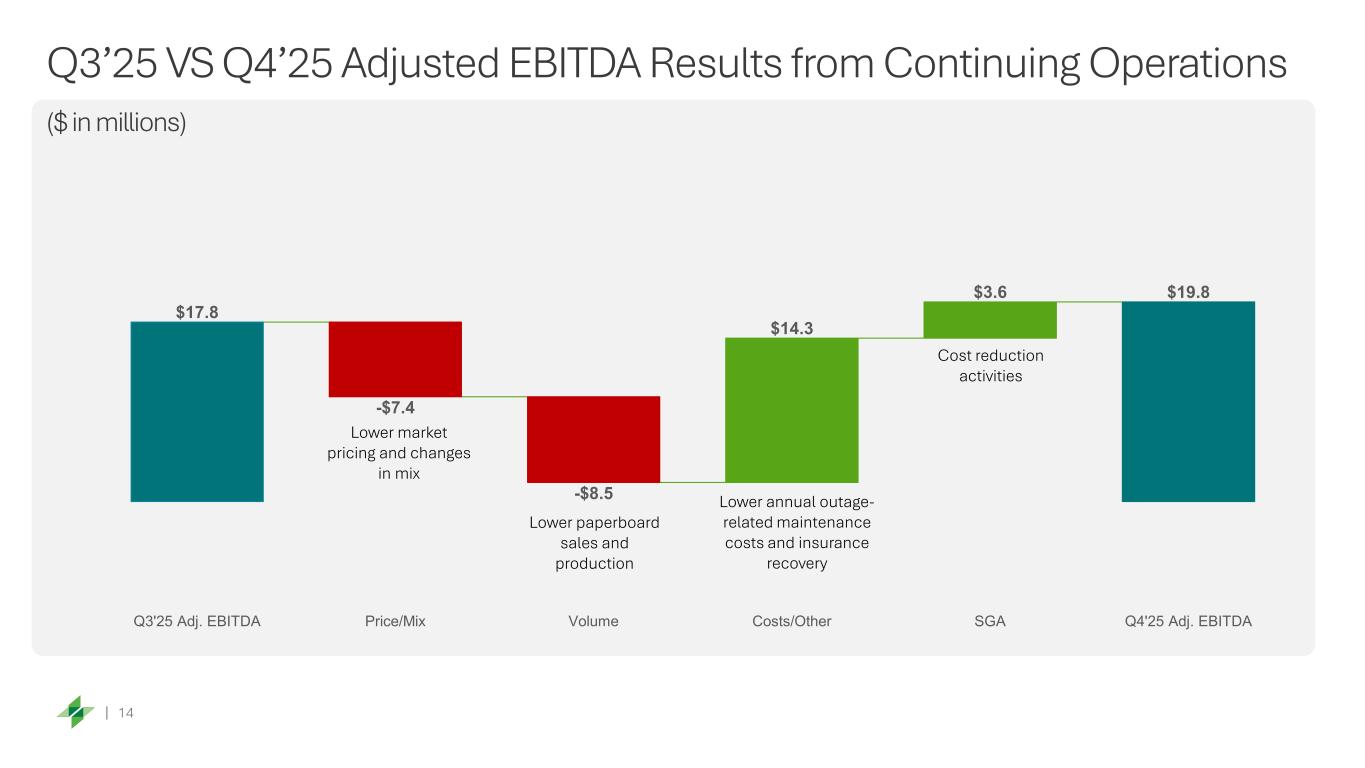
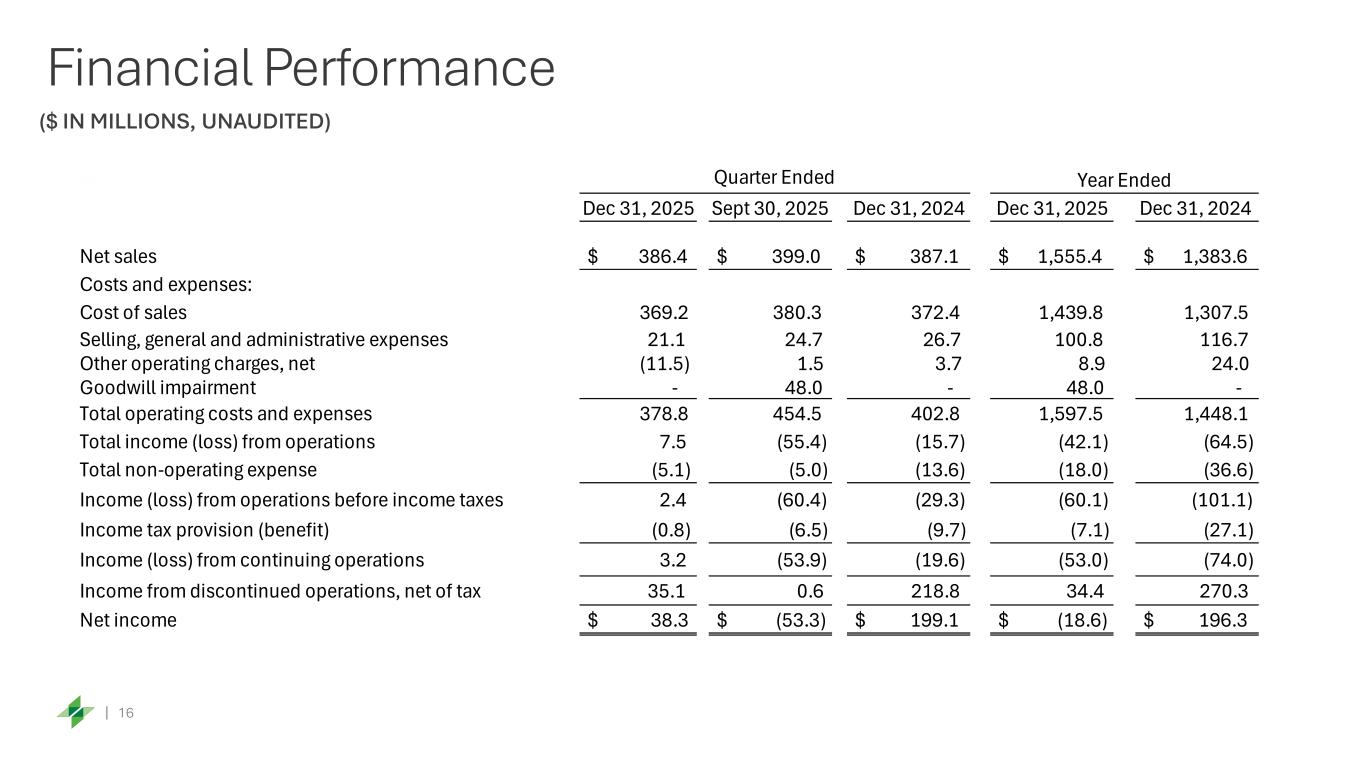
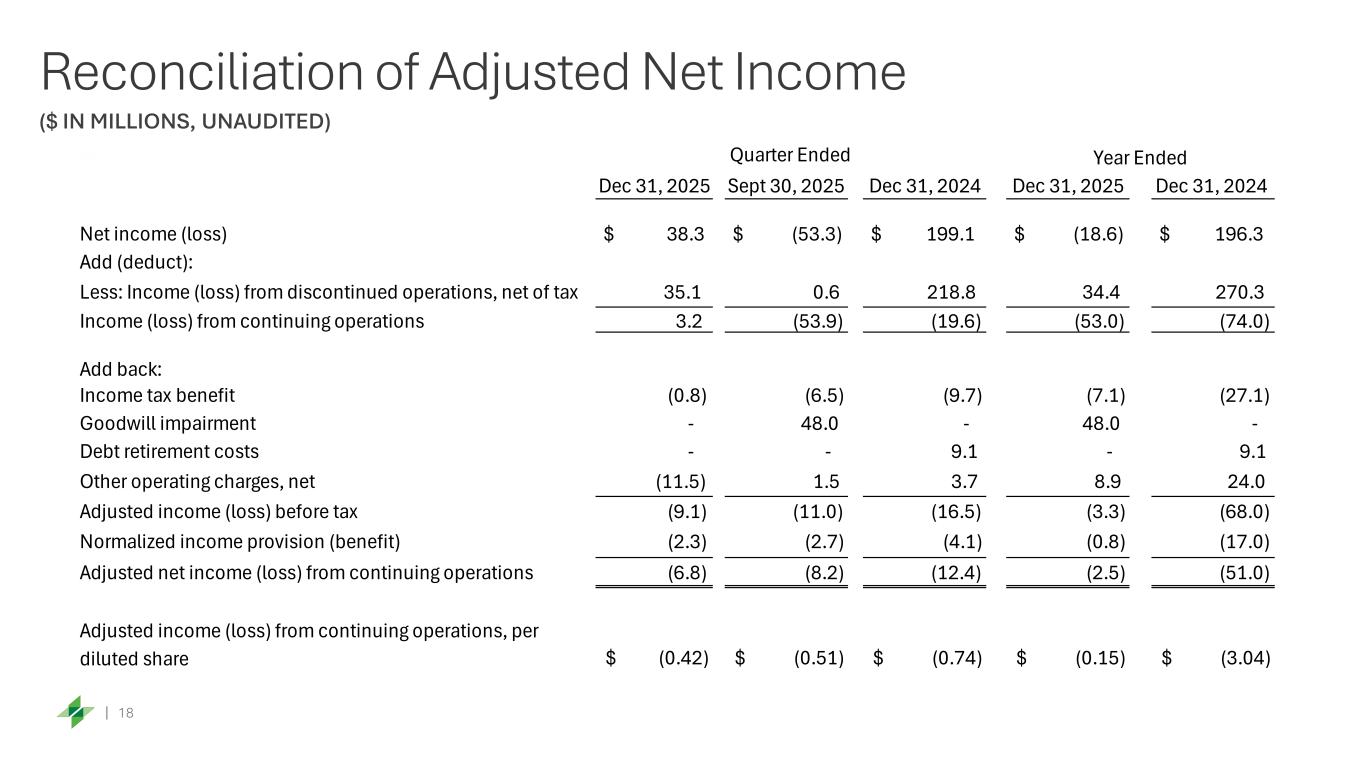
Thank you, Arson, and good afternoon, everyone. Let me start by sharing our results for the fourth quarter. Net income from continuing operations was $3 million, or $0.20 per diluted share, including $17 million of insurance proceeds. Net sales were $386 million, flat versus Q4 of 2024, as higher shipments were offset by lower pricing. Adjusted EBITDA from continuing operations was $20 million, above the midpoint of our guidance range of $13 to $23 million, driven by cost reduction efforts and $6 million of insurance proceeds. We executed the Augusta maintenance outage successfully, with $17 million in total direct spending. SG&A remained below our targeted 6% to 7% range, reflecting our continued cost disciplines. For the full year, net loss from continuing operations was $53 million, or $3.28 per diluted share, primarily driven by a non-cash goodwill impairment. Net sales were $1.6 billion, up 12% versus 2024, with higher shipments from our Augusta acquisition, as well as growth from our existing customers. Adjusted EBITDA from continuing operations was $107 million, up $71 million year over year driven by strong cost management leading to a 50 million dollar fixed cost reduction as well as higher volumes and lower input costs total major maintenance out of spending with 50 million significantly lower than prior year due to improved planning and solid execution let me provide a few additional comments on the insurance recovery as part of the augusta acquisition, we obtained representation and warranty insurance with a coverage limit of $105 million. During integration, we identified matters inconsistent with representations made to us and notified the insurers accordingly. In Q4, we received an initial settlement payment of $23 million, of which $6 million is related to operating costs incurred in 2025. We have approximately 75 million remaining of our 105 million coverage limit and continue to work through the claims process with our carriers. Let us now turn to our outlook for the first quarter. We expect adjusted EBITDA of approximately break-even for the quarter. We experienced operational disruptions and higher costs due to severe weather at our Augusta and Cyprus spend facilities in January and February. Our team was able to safely navigate this event without any long-term impact to our assets, and we are now back to running normally. As a result of higher energy costs and impact on production, we incurred approximately $15 to $20 million in incremental costs during the quarter. We expect flat to slightly lower paperboard shipments versus the fourth quarter. We expect 10 to 12 million of lower pricing related to Q4 RECI movements and 11 to 13 million of lower maintenance expense versus Q4 as there are no major outages in the quarter. Turning now to our key assumptions for 2026, which include revenue of 1.4 to 1.5 billion with flat to modest shipment growth, approximately 70 million in pricing headwind from 2025 carryover. Importantly, our assumptions do not include any impact from our recently announced price increase or the latest RECI forecast on pricing and operating rate improvements. We expect our net productivity to offset 2-3% of input cost inflation. Capital expenditures will be in the $65-75 million range. We expect approximately $20 million of working capital improvements, and we are planning to maintain SG&A at 6% to 7% of net sales. With that, I'll turn the call back over to Arson for closing remarks.
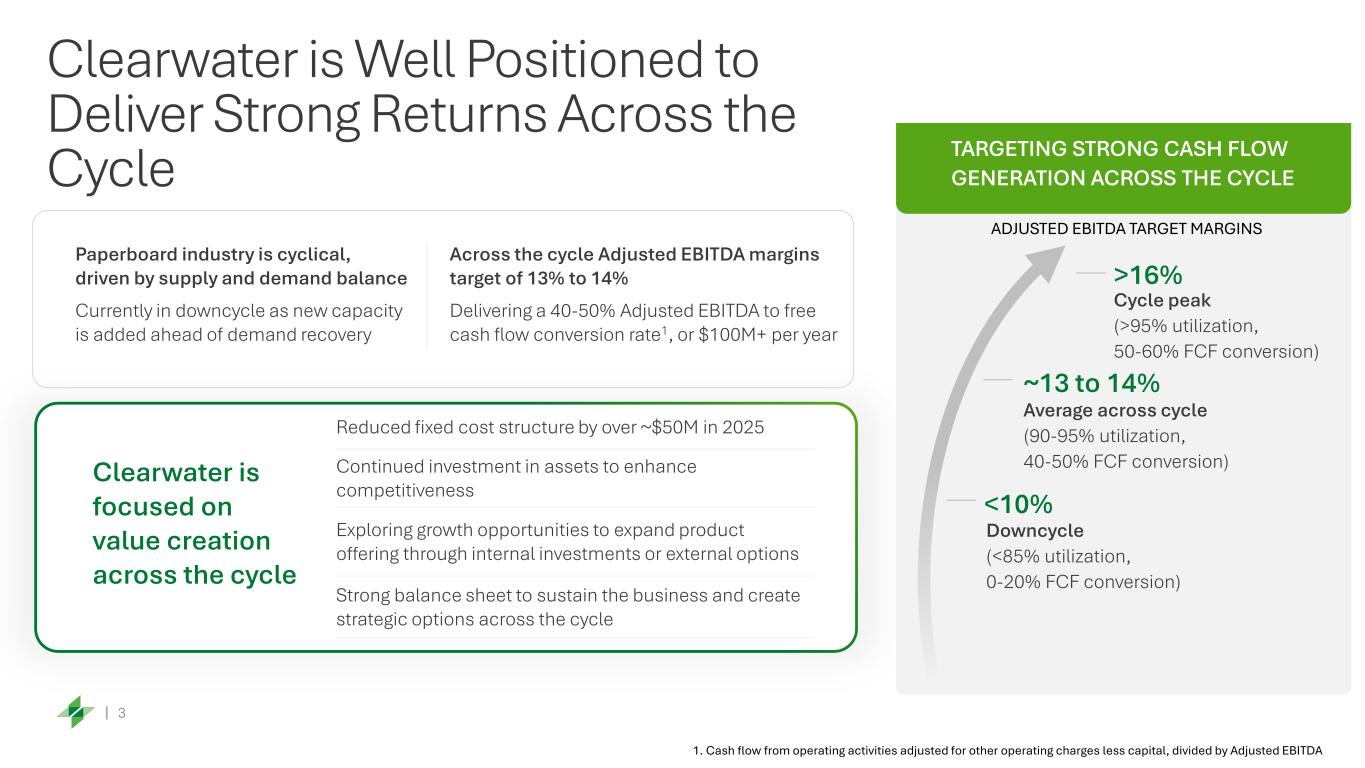
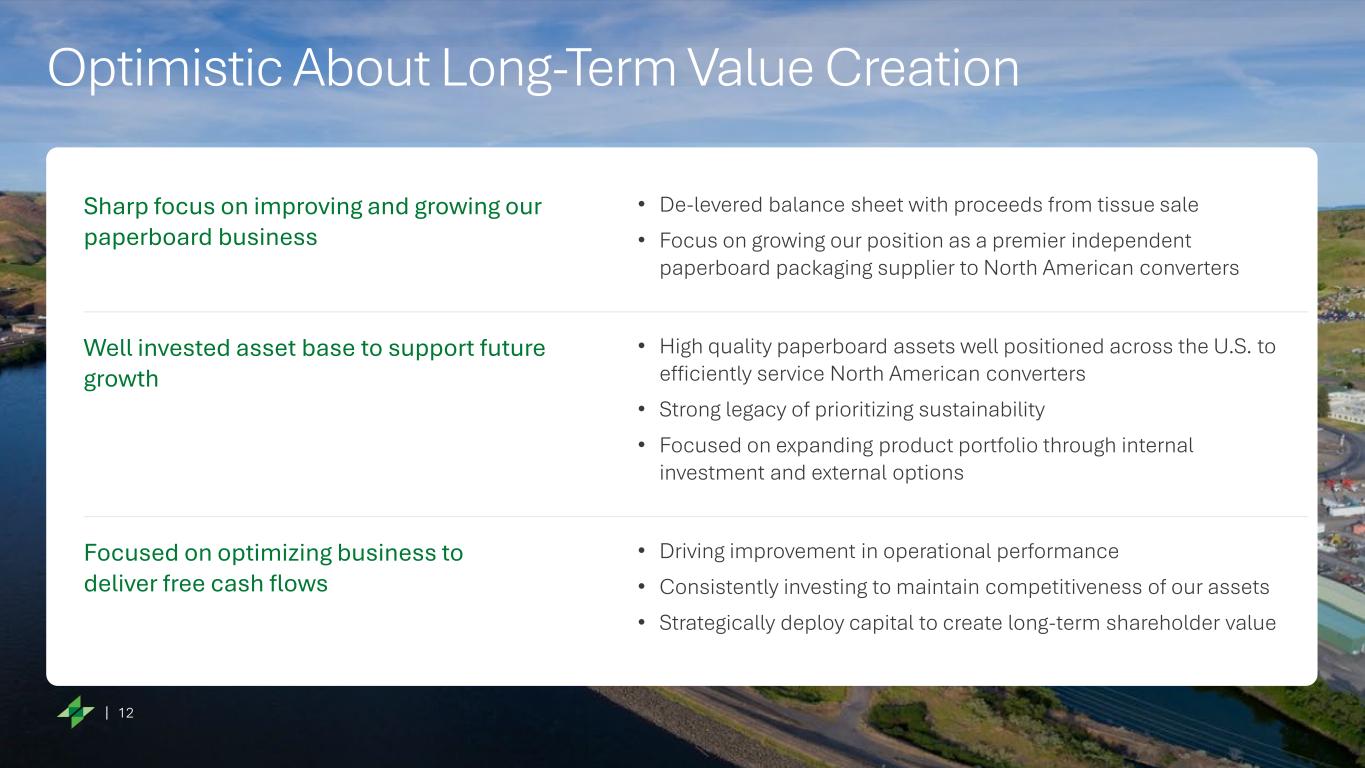
Thanks, Sherry. To close, I want to emphasize that we operate high-quality assets, are executing well, and have long-standing strategic customer relationships. We took several difficult but significant actions in 2025, including reducing our overall workforce by more than 10%. This includes a reduction in our corporate SG&A headcount of around 40%. Our team is operating with a lean, disciplined mindset, intensely focused on results. We have a strong balance sheet with more than $400 million of liquidity, which positions us to weather this supply-driven downturn. I remain confident that this cycle will turn. and then we will return to cross-cycle EBITDA margins of 13% to 14% and generate more than $100 million of annual free cash flow. That said, today's margins and cash flow levels are not tenable for us for an extended period. This is a capital-intensive industry, and adequate returns are required to reinvest in these types of assets over the long term. Simply put, current margins are not sustainable for us. We are taking action, starting with recent price increases, being prepared to take market-related downtime to address our operating rates, assessing our costs and assets, and continuing to evaluate alternative uses of our capacity, including a CUK conversion. Above all, we will continue to make disciplined decisions that drive long-term shareholder value while supporting our customers, employees, and communities. Thank you for your time today. Operator, please open the lineup for questions.
Operator
We will now begin the question and answer session. If you would like to ask a question, please press star 1 on your telephone keypad. To withdraw your question, press star 1 again. Please pick up your handset when asking a question. If you are muted locally, please remember to unmute your device.
Please stand by while we compile the Q&A roster. your first question comes from the line of mike roxland with truest securities your line is open please go ahead uh yeah thank you austin and sherry for taking my questions um hey mike welcome to the call um it's good to be here and you know uh grass to the extent i could say in terms of trying to trying to manage a very difficult environment um obviously there's lot going a lot of moving pieces and uh it's really the the efforts you're putting in terms of managing costs are you're seeing you're seeing some of those benefits uh flow through so uh good job in that regard um also i wanted to start on um grade switching that you called out uh your comments as well as in slides uh from crb to testbs uh you mentioned mentioned where your customers are looking at that any color in terms of or additional color i should say in terms of have you seen that in your own portfolio like to the extent you come how many tons have actually pursued that um are are you seeing more and more customers line up particularly as the fact that given the fact that sbs is now cheaper uh than the other two so just any any uh any any type of great substitution that you're you're seeing uh that would be very helpful thank you yeah good good question listen i think we're in early early days of this we know customers are are looking at
this, they're facing a lot of cost pressure, just like everyone else. And right now, there's an arbitrage with SBS being priced lower than both CUK on a per ton basis and CRB on a per square foot basis. There is a lot of overlap in applications. Frankly, I think there's very few applications where you aren't able to substitute. So I think we're in early days of this, but I know our customers are talking about it. We know competitors are talking about it, but I think we're still in early days of this. This is not something that happens overnight.
Got it. Okay. And you mentioned, you know, that you expected, you cited DC in terms of their forecasted demand to improve. But, you know, what gives you the confidence that demand will inflect this year? What are you hearing from your customers? You know, some of the comments out of Cagney weren't so positive this week. General Mills just lowered their sale for his outlook for the year. So what keeps you confident that you're going to see this demand improvement? And if you don't see this demand improvement, I mean, how much additional capacity do you think has to come out of the market for things to balance accordingly?
Yeah, a few questions in there. So, you know, first and foremost, I think paperboard's been in this volume recession now for a couple of years. And a lot of it is frankly inflation and CPG and QSR companies not promoting and not driving as much innovation as they have historically. Every single CPG and QSR company that you listen to is now talking about growth and foot traffic and volume growth and share. So we think that's a positive sign. Inflation is slowing. That's another positive sign. There's some possible substitutions. That's a positive sign. And our customers are generally are generally optimistic as we head into 2026. Now, 2025, you know, with zero, call it zero shipment growth, and SBS was below our expectations. But SBS outperformed both C-U-K and C-R-B. And if you look at those shipments, they were down about 4% year over year. So, right now the forecast is, you know, call it maybe about a percent growth, you know, we're seeing green shoots, but we need to see that translate into real volume.
Got it. One last one. I'll turn it over. You mentioned taking extended curtailments if the situation doesn't improve the backdrop. Have you made any concrete decisions, like in terms of mills, where, when, how long, just any kind of providing around extended downtime? Thank you.
Yeah, good question. We have not. You know, we're obviously thinking about it. We'll, you know, we think we'll have a path forward by the end of Q2 and a strategy by the end of Q2. We have been balancing supply and demand over the last year or two. So that's not new news for us. but we haven't spent much time trying to variableize those costs. At this point, I think we need to look at it more in the longer run and see where can we actually take out costs as we think about these more extended curtailments. So more on this to come.
Got it. Thank you very much.
Operator
Your next question comes from Sean Stewart with TD Cohen. Your line is now open. You may go ahead.
I want to follow up with the supply management piece of this, you know, it sounds like you're biased towards taking rolling market-related downtime to supplement the maintenance schedule. Any, you know, it feels like the need here is more permanent or indefinite supply closures. example like Smurfette West Rock is stepped up with something small. Any perspective on your portfolio machines that might make sense to curtail on a longer term basis? I guess just weighing the cost of permanent or indefinite closures versus this rolling downtime approach, which can be expensive. Any thoughts on that front?
Thanks, Sean. That's a great question. Listen, we've taken downtime over the last couple of years to balance our supply and demand. It was mostly inventory driven. We've also taken not a lot of cost out of our system, but there's still a fundamental issue with underutilized capacity within the industry and within Clearwater. I'm not prepared to talk about any specific decisions that we are or aren't going to make, but we need to look at further cost reductions, and we need to look at our assets and see what makes sense for us in the long run. As I mentioned in my comments, at these margin levels and these pricing levels, we're simply not earning enough cash or margin to be able to reinvest in our assets in the long run. We have ample liquidity. We can weather the storm. The question just becomes, what are the right decisions to make for the business?
Okay, got it. And on that liquidity position, it is healthy. I think the messaging last call was, you know, you would consider reengaging on buybacks when leverage ratios have come into at least closer to target ranges long term. Is that perspective changed? I've always seen a decent capitulation in your share price, valuation on long-run metrics. Any perspective on appetite for buybacks into a much weaker share price of late?
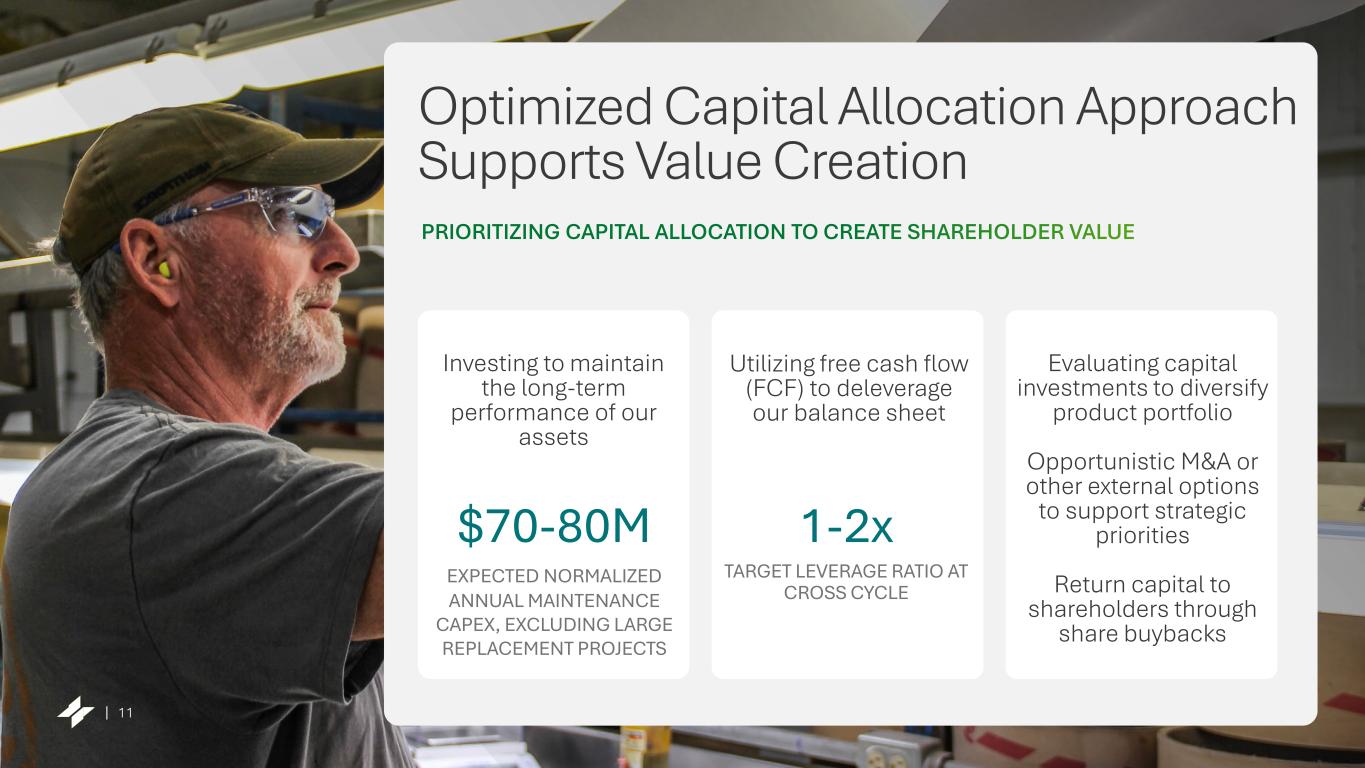
Thanks for the question. So first and foremost, we continue to prioritize investing in our assets, strong balance sheet. Those are our top priorities to maintain and preserve both long-term buyability and success. We will look at strategic capital in support of our potential Cuk investment is a good example for this. And then third, we would look at share repurchases as another lever when we have better line aside to more positive free cash flows.
Okay. Okay. Thanks for that, Sherry. That is all I have for now. Thanks. Thanks, John.
Operator
Your next question comes from Amit Prasad with RBC Capital Markets. Your line is now open. Please go ahead.
Hey, it's Amit on for Matt. Just one quick question for me. Thinking about input costs throughout the year, is there any risk on the fiber cost side in Georgia and North Carolina with kind of the reduced pulpwood salvage harvest in the year?
No, we haven't identified any risk. We feel that we're in good shape from from that perspective.
I think if you look at inflation in general, I mean, I think we're expecting two to three percent. A lot of it is labor, some chemicals, maybe some wood, some transportation like rail. But I think we have enough productivity in the pipeline and carryover to be able to offset that that call at 20 to 30 million dollars of inflation.
OK, perfect. Thanks for the color. And then one kind of cleanup question on the working capital improvements. how should we think about the cadence of that kind of $20 million? Should that be kind of evenly split throughout the year or any other help there would be appreciated?
It'll be heavily weighted towards the back half of the year.
Okay, perfect. Thank you so much. That's all I had. I'll turn it over.
Operator
There are no further questions at this time. This concludes today's call. Thank you for attending.