
Columbus Mckinnon Corp 8-K, filed May 26, 2021
Columbus Mckinnon Corp (CMCO)
8-K
2021-05-26
For: 2021-05-26
View Original
Added on
April 08, 2026
About this 8-K
Columbus Mckinnon Corp filed this 8-K on May 26, 2021.
Items reported
- Item 2.02: Financial results
- Item 7.01: Regulation FD disclosure
- Item 9.01: Financial statements and exhibits
SECURITIES AND EXCHANGE COMMISSION
Washington, D.C. 20549
FORM 8-K
CURRENT REPORT
Pursuant to Section 13 or 15(d) of
the Securities Exchange Act of 1934
Date of Report (Date of earliest event reported): May 26, 2021
(Exact name of registrant as specified in its charter)
(State or other jurisdiction of incorporation)
| (Commission File Number) | (IRS Employer Identification No.) | |||||||
| (Address of principal executive offices) | (Zip Code) | ||||||||||
Registrant's telephone number including area code: (716 ) 689-5400
_________________________________________________
(Former name or former address, if changed since last report)
Securities registered pursuant to Section 12(b) of the Act:
| Title of each class | Trading Symbol(s) | Name of each exchange on which registered | ||||||
Check the appropriate box below if the Form 8-K filing is intended to simultaneously satisfy the filing obligation of the registrant under any of the following provisions:
| Written communications pursuant to Rule 425 under the Securities Act (17 CFR 230.425) | |||||
| Soliciting material pursuant to Rule 14a-12 under the Exchange Act (17 CFR 240.14a-12) | |||||
| Pre-commencement communications pursuant to Rule 14d-2(b) under the Exchange Act (17 CFR 240.14d-2(b)) | |||||
| Pre-commencement communications pursuant to Rule 13e-4(c) under the Exchange Act (17 CFR 240.13e-4(c)) | |||||
Indicate by check mark whether the registrant is an emerging growth company as defined in Rule 405 of the Securities Act of 1933 (§230.405 of this chapter) or Rule 12b-2 of the Securities Exchange Act of 1934 (§240.12b-2 of this chapter).
| Emerging Growth Company | |||||
| If an Emerging Growth Company, indicate by check mark if the registrant has elected not to use the extended transition period for complying with any new or revised financial accounting standards provided pursuant to Section 13(a) of the Exchange Act. ☐ | ||
| Item 2.02 | RESULTS OF OPERATIONS AND FINANCIAL CONDITION. | ||||
On May 26, 2021, the registrant issued a press release announcing its financial results for the fourth quarter, which ended March 31, 2021. The press release is annexed as Exhibit 99.1 to this Current Report on Form 8-K.
| Item 7.01 | REGULATION FD DISCLOSURE. | ||||
The slides used during the earnings call are annexed as Exhibit 99.2 to this Current Report on Form 8-K.
The information contained in this Form 8-K and the Exhibits annexed hereto shall not be deemed “filed” for purposes of Section 18 of the Securities Exchange Act of 1934, as amended, nor shall it be deemed incorporated by reference into any filing under the Securities Act of 1933, as amended, except as shall be expressly set forth in such filing.
| Item 9.01 | FINANCIAL STATEMENTS AND EXHIBITS. | ||||
(d) Exhibits.
| EXHIBIT NUMBER | DESCRIPTION | |||||||
| Press Release dated May 26, 2021 | ||||||||
| Earnings call slides dated May 26, 2021 | ||||||||
| 104 | Cover Page Interactive Data File (the cover page XBRL tags are embedded within the Inline XBRL document) | |||||||
SIGNATURES
Pursuant to the requirements of the Securities Exchange Act of 1934, the registrant has duly caused this report to be signed on its behalf by the undersigned thereunto duly authorized.
| COLUMBUS McKINNON CORPORATION | |||||
| By: | /s/ Gregory P. Rustowicz | ||||
| Name: | Gregory P. Rustowicz | ||||
| Title: | Vice President Finance and Chief Financial Officer | ||||
| (Principal Financial Officer) | |||||
Dated: May 26, 2021

EXHIBIT 99.1
News Release
205 Crosspoint Parkway
Buffalo, NY 14068
Immediate Release
Columbus McKinnon Reports Financial Results for Fourth Quarter Fiscal Year 2021
BUFFALO, NY, May 26, 2021 - Columbus McKinnon Corporation (Nasdaq: CMCO), a leading designer, manufacturer and marketer of intelligent motion solutions for material handling, today announced financial results for its fiscal year 2021 fourth quarter, which ended March 31, 2021.
Fourth Quarter and Fiscal Year 2021 Highlights
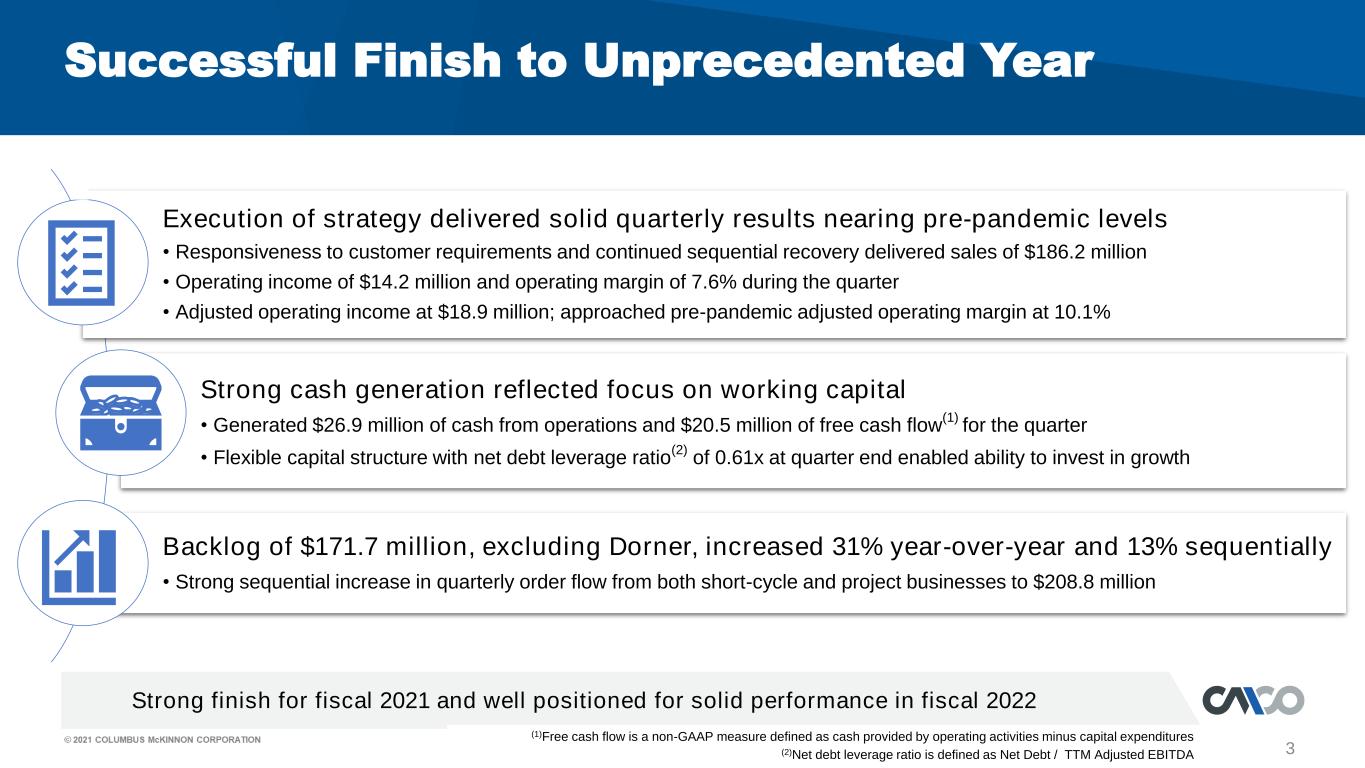
•Executed on Blueprint for Growth 2.0 strategy to deliver solid results in challenging year while building momentum for fiscal 2022
•Ended year with much improved order volume in fourth quarter; orders up 24% over trailing third quarter and up 6% over prior-year period
•Delivered $186.2 million in revenue in the quarter, up 12% sequentially
•Generated strong cash from operations in fiscal year of $98.9 million
•Entered fiscal 2022 with backlog of $171.7 million, up 31% over prior-year period and 13% over trailing quarter
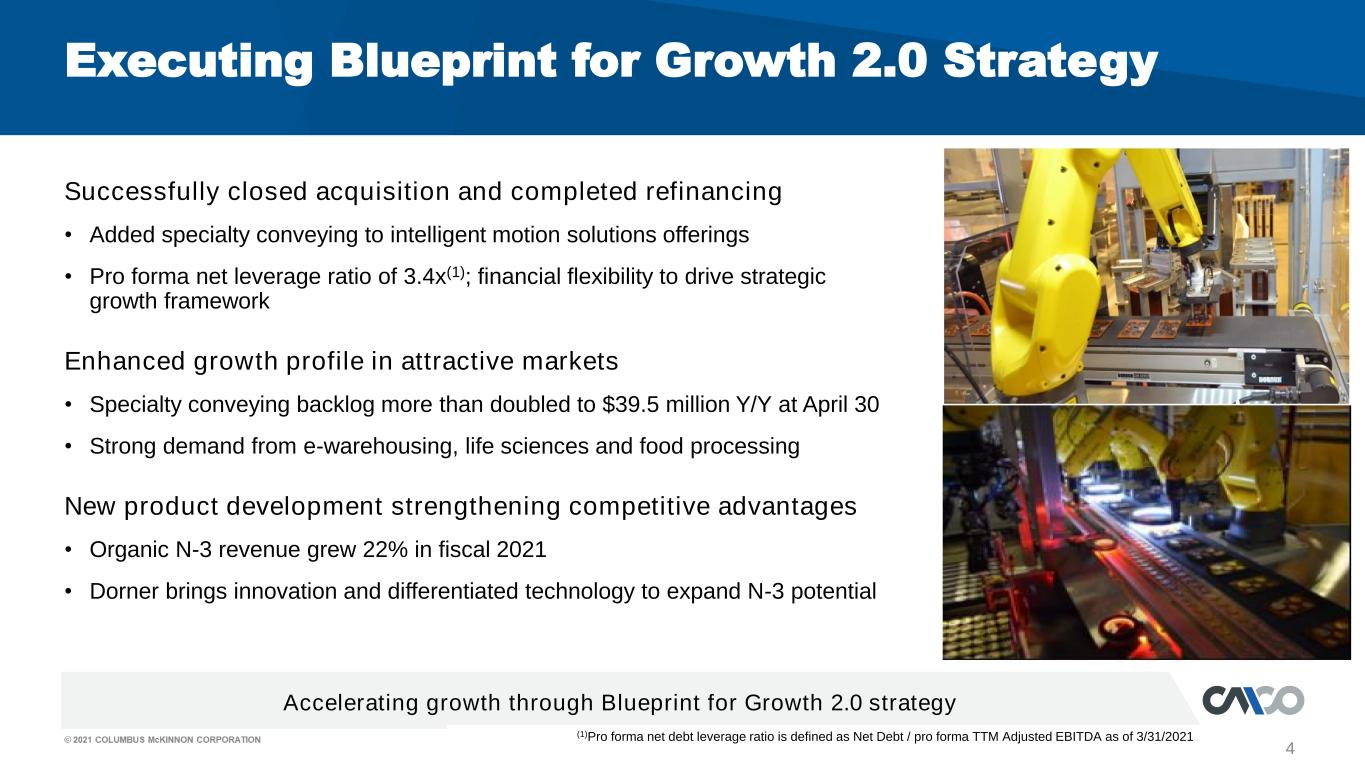
•Advanced strategy with the acquisition of new platform of high-precision conveying systems for intelligent motion in material handling
•Successfully completed equity and debt financing transactions
David Wilson, President and CEO of Columbus McKinnon, commented, “We ended fiscal 2021 on a high note with orders growing in both our project and short cycle businesses. While the year was challenged with the impact of the global pandemic and resulting recession, we employed the tools of the Columbus McKinnon Business System to keep our momentum building and make our Company stronger. We delivered improved decremental leverage over previous downturns, generated robust cash flow, reduced our working capital requirements, and introduced several new products including our line of Intelli-Crane™ solutions. In addition, we identified and announced the Dorner acquisition which establishes a new platform for growth. It provides a catalyst for faster growth in attractive markets with strong tailwinds and presents strategic opportunities in a fragmented market. Since entering fiscal 2022, we have successfully issued equity, restructured our debt and are well positioned to quickly de-lever our balance sheet.”
Columbus McKinnon Reports Financial Results for Fourth Quarter Fiscal Year 2021
Page 2 of 13
May 26, 2021
Fourth Quarter Fiscal 2021 Sales
| ($ in millions) | Q4 FY 21 | Q4 FY 20 | Change | % Change | |||||||||||||||||||
| Net sales | $ | 186.2 | $ | 189.5 | $ | (3.3) | (1.7) | % | |||||||||||||||
| U.S. sales | $ | 94.8 | $ | 104.1 | $ | (9.3) | (8.9) | % | |||||||||||||||
| % of total | 51 | % | 55 | % | |||||||||||||||||||
| Non-U.S. sales | $ | 91.4 | $ | 85.4 | $ | 6.0 | 7.0 | % | |||||||||||||||
| % of total | 49 | % | 45 | % | |||||||||||||||||||
Revenue recovered sequentially throughout fiscal 2021 almost approaching levels recorded in the fourth quarter of fiscal 2020 when the COVID-19 global pandemic had an approximate $10 million impact on revenue. A 0.8% price improvement in the U.S. partially offset approximately $10.1 million in lower volume. Outside the U.S., a $5.9 million, or 6.9%, positive impact from foreign currency translation and price improvement of 1.2% more than offset $0.9 million of lower volume.
Compared with the trailing third quarter, sales improved 11.8% with short cycle sales up 11.7% and project sales up 11.9%.
Fourth Quarter Fiscal 2021 Operating Results
($ in millions) | Q4 FY 21 | Q4 FY 20 | Change | % Change | |||||||||||||||||||
| Gross profit | $ | 64.1 | $ | 66.2 | $ | (2.1) | (3.2) | % | |||||||||||||||
| Gross margin | 34.4 | % | 34.9 | % | (50) bps | ||||||||||||||||||
| Income from operations | $ | 14.2 | $ | 16.7 | $ | (2.5) | (14.8) | % | |||||||||||||||
| Operating margin | 7.6 | % | 8.8 | % | (120) bps | ||||||||||||||||||
| Adjusted income from operations* | $ | 18.9 | $ | 20.2 | $ | (1.3) | (6.5) | % | |||||||||||||||
| Adjusted operating margin* | 10.1 | % | 10.7 | % | (60) bps | ||||||||||||||||||
| Net income | $ | 9.6 | $ | 9.2 | $ | 0.3 | 3.7 | % | |||||||||||||||
| Diluted EPS | $ | 0.39 | $ | 0.39 | $ | — | — | % | |||||||||||||||
| Net income margin | 5.1 | % | 4.9 | % | 20 bps | ||||||||||||||||||
| Adjusted EBITDA* | $ | 25.8 | $ | 27.3 | $ | (1.5) | (5.5) | % | |||||||||||||||
| Adjusted EBITDA margin* | 13.9 | % | 14.4 | % | (50) bps | ||||||||||||||||||
*Adjusted operating income, adjusted operating margin as well as adjusted EBITDA and adjusted EBITDA margin are non-GAAP measures. See accompanying discussion and reconciliation tables in this release regarding adjusted operating income and adjusted operating margin as well as a reconciliation of adjusted EBITDA to GAAP net income (loss).
First Quarter Fiscal 2022 Outlook
The Company expects first quarter fiscal 2022 sales to be within a range of approximately $212 million to $217 million at current exchange rates and including the Dorner acquisition.
Mr. Wilson concluded, “We are encouraged with growing demand for our lifting solutions as customers release projects and short cycle order trends improve. We are also excited about the addition of Dorner to our relevant portfolio of intelligent motion solutions and are seeing strong demand for high-precision conveying solutions. In fact, the business ended April with a record backlog, further confirming our conviction in the value of this acquisition.”
Columbus McKinnon Reports Financial Results for Fourth Quarter Fiscal Year 2021
Page 3 of 13
May 26, 2021
Teleconference/webcast
Columbus McKinnon will host a conference call and live webcast today at 10:00 AM Eastern Time, at which management will review the Company’s financial results and strategy. The review will be accompanied by a slide presentation, which will be available on Columbus McKinnon’s website at investors.columbusmckinnon.com. A question and answer session will follow the formal discussion.
The conference call can be accessed by dialing 201-493-6780. The listen-only audio webcast can be monitored at investors.columbusmckinnon.com. To listen to the archived call, dial 412-317-6671 and enter the passcode 13718341. The telephonic replay will be available from 1:00 PM Eastern Time on the day of the call through Wednesday, June 2, 2021. Alternatively, an archived webcast of the call can be found on the Company’s website. In addition, a transcript of the call will be posted to the website once available.
About Columbus McKinnon
Columbus McKinnon is a leading worldwide designer, manufacturer and marketer of intelligent motion solutions that efficiently and ergonomically move, lift, position and secure materials. Key products include hoists, crane components, precision conveyor systems, rigging tools, light rail workstations and digital power and motion control systems. The Company is focused on commercial and industrial applications that require the safety and quality provided by its superior design and engineering know-how. Comprehensive information on Columbus McKinnon is available at www.columbusmckinnon.com.
Safe Harbor Statement
This news release contains “forward-looking statements” within the meaning of the Private Securities Litigation Reform Act of 1995. Such statements include, but are not limited to, statements concerning future sales and earnings, involve known and unknown risks, uncertainties and other factors that could cause the actual results of the Company to differ materially from the results expressed or implied by such statements, including the impact of Covid-19, the ability of the Company to integrate Dorner and achieve cost and revenue synergies and the amount of such synergies, the level of earnings per share accretion expectations; the ability of the Company to achieve its Blueprint for Growth 2.0 strategy; and the amount of integration costs and the Company’s efforts to reduce costs, maintain liquidity and generate cash in the current pandemic, the effectiveness of the Company’s 80/20 Process to simplify operations, the ability of the Company’s Operational Excellence initiatives to drive profitability, the Company’s ability to grow market share, the ability to achieve revenue expectations, global economic and business conditions, conditions affecting the industries served by the Company and its subsidiaries, the Company's customers and suppliers, competitor responses to the Company's products and services, the overall market acceptance of such products and services, the ability to expand into new markets and geographic regions, and other factors disclosed in the Company's periodic reports filed with the Securities and Exchange Commission. The Company assumes no obligation to update the forward-looking information contained in this release.
Contacts:
| Gregory P. Rustowicz | Investor Relations: | ||||
| Vice President - Finance and Chief Financial Officer | Deborah K. Pawlowski | ||||
| Columbus McKinnon Corporation | Kei Advisors LLC | ||||
| 716-689-5442 | 716-843-3908 | ||||
| greg.rustowicz@cmworks.com | dpawlowski@keiadvisors.com | ||||
Financial tables follow.
Columbus McKinnon Reports Financial Results for Fourth Quarter Fiscal Year 2021
Page 4 of 13
May 26, 2021
COLUMBUS McKINNON CORPORATION
Condensed Consolidated Income Statements - UNAUDITED
(In thousands, except per share and percentage data)
| Three Months Ended | ||||||||||||||||||||
| March 31, 2021 | March 31, 2020 | Change | ||||||||||||||||||
| Net sales | $ | 186,235 | $ | 189,486 | (1.7) | % | ||||||||||||||
| Cost of products sold | 122,147 | 123,277 | (0.9) | % | ||||||||||||||||
| Gross profit | 64,088 | 66,209 | (3.2) | % | ||||||||||||||||
| Gross profit margin | 34.4 | % | 34.9 | % | ||||||||||||||||
| Selling expenses | 20,820 | 22,253 | (6.4) | % | ||||||||||||||||
| % of net sales | 11.2 | % | 11.7 | % | ||||||||||||||||
| General and administrative expenses | 22,193 | 21,167 | 4.8 | % | ||||||||||||||||
| % of net sales | 11.9 | % | 11.2 | % | ||||||||||||||||
| Research and development expenses | 3,702 | 2,891 | 28.1 | % | ||||||||||||||||
| % of net sales | 2.0 | % | 1.5 | % | ||||||||||||||||
| Amortization of intangibles | 3,174 | 3,234 | (1.9) | % | ||||||||||||||||
| Income from operations | 14,199 | 16,664 | (14.8) | % | ||||||||||||||||
| Operating margin | 7.6 | % | 8.8 | % | ||||||||||||||||
| Interest and debt expense | 2,889 | 3,200 | (9.7) | % | ||||||||||||||||
| Investment (income) loss | (264) | 48 | NM | |||||||||||||||||
| Foreign currency exchange (gain) loss | (142) | (996) | (85.7) | % | ||||||||||||||||
| Other (income) expense, net | 769 | 221 | 248.0 | % | ||||||||||||||||
| Income (loss) before income tax expense (benefit) | 10,947 | 14,191 | (22.9) | % | ||||||||||||||||
| Income tax expense (benefit) | 1,362 | 4,947 | (72.5) | % | ||||||||||||||||
| Net income | $ | 9,585 | $ | 9,244 | 3.7 | % | ||||||||||||||
| Average basic shares outstanding | 23,977 | 23,735 | 1.0 | % | ||||||||||||||||
| Basic income per share | $ | 0.40 | $ | 0.39 | 2.6 | % | ||||||||||||||
| Average diluted shares outstanding | 24,384 | 23,938 | 1.9 | % | ||||||||||||||||
| Diluted income per share | $ | 0.39 | $ | 0.39 | — | % | ||||||||||||||
| Dividends declared per common share | $ | 0.12 | $ | 0.12 | ||||||||||||||||
Columbus McKinnon Reports Financial Results for Fourth Quarter Fiscal Year 2021
Page 5 of 13
May 26, 2021
COLUMBUS McKINNON CORPORATION
Condensed Consolidated Income Statements - UNAUDITED
(In thousands, except per share and percentage data)
| Year Ended | ||||||||||||||||||||
| March 31, 2021 | March 31, 2020 | Change | ||||||||||||||||||
| Net sales | $ | 649,642 | $ | 809,162 | (19.7) | % | ||||||||||||||
| Cost of products sold | 429,417 | 525,976 | (18.4) | % | ||||||||||||||||
| Gross profit | 220,225 | 283,186 | (22.2) | % | ||||||||||||||||
| Gross profit margin | 33.9 | % | 35.0 | % | ||||||||||||||||
| Selling expenses | 76,907 | 91,054 | (15.5) | % | ||||||||||||||||
| % of net sales | 11.8 | % | 11.3 | % | ||||||||||||||||
| General and administrative expenses | 76,035 | 77,880 | (2.4) | % | ||||||||||||||||
| % of net sales | 11.7 | % | 9.6 | % | ||||||||||||||||
| Research and development expenses | 12,405 | 11,310 | 9.7 | % | ||||||||||||||||
| % of net sales | 1.9 | % | 1.4 | % | ||||||||||||||||
| Loss on sales of businesses | — | 176 | NM | |||||||||||||||||
| Amortization of intangibles | 12,623 | 12,942 | (2.5) | % | ||||||||||||||||
| Income from operations | 42,255 | 89,824 | (53.0) | % | ||||||||||||||||
| Operating margin | 6.5 | % | 11.1 | % | ||||||||||||||||
| Interest and debt expense | 12,081 | 14,234 | (15.1) | % | ||||||||||||||||
| Investment (income) loss | (1,693) | (891) | 90.0 | % | ||||||||||||||||
| Foreign currency exchange (gain) loss | 941 | (1,514) | NM | |||||||||||||||||
| Other (income) expense, net | 20,850 | 839 | 2,385.1 | % | ||||||||||||||||
| Income (loss) before income tax expense (benefit) | 10,076 | 77,156 | (86.9) | % | ||||||||||||||||
| Income tax expense (benefit) | 970 | 17,484 | (94.5) | % | ||||||||||||||||
| Net income | $ | 9,106 | $ | 59,672 | (84.7) | % | ||||||||||||||
| Average basic shares outstanding | 23,897 | 23,619 | 1.2 | % | ||||||||||||||||
| Basic income per share | $ | 0.38 | $ | 2.53 | (85.0) | |||||||||||||||
| Average diluted shares outstanding | 24,173 | 23,855 | 1.3 | % | ||||||||||||||||
| Diluted income per share | $ | 0.38 | $ | 2.50 | (84.8) | |||||||||||||||
| Dividends declared per common share | $ | 0.24 | $ | 0.24 | ||||||||||||||||
Columbus McKinnon Reports Financial Results for Fourth Quarter Fiscal Year 2021
Page 6 of 13
May 26, 2021
COLUMBUS McKINNON CORPORATION
Condensed Consolidated Balance Sheets
(In thousands)
| March 31, 2021 | March 31, 2020 | |||||||||||||
| (unaudited) | ||||||||||||||
| ASSETS | ||||||||||||||
| Current assets: | ||||||||||||||
| Cash and cash equivalents | $ | 202,127 | $ | 114,450 | ||||||||||
| Trade accounts receivable | 105,464 | 123,743 | ||||||||||||
| Inventories | 111,488 | 127,373 | ||||||||||||
| Prepaid expenses and other | 22,763 | 17,180 | ||||||||||||
| Total current assets | 441,842 | 382,746 | ||||||||||||
| Property, plant, and equipment, net | 74,753 | 79,473 | ||||||||||||
| Goodwill | 331,176 | 319,679 | ||||||||||||
| Other intangibles, net | 213,362 | 217,962 | ||||||||||||
| Marketable securities | 7,968 | 7,322 | ||||||||||||
| Deferred taxes on income | 20,080 | 26,281 | ||||||||||||
| Other assets | 61,251 | 59,809 | ||||||||||||
| Total assets | $ | 1,150,432 | $ | 1,093,272 | ||||||||||
| LIABILITIES AND SHAREHOLDERS’ EQUITY | ||||||||||||||
| Current liabilities: | ||||||||||||||
| Trade accounts payable | $ | 68,593 | $ | 57,289 | ||||||||||
| Accrued liabilities | 110,816 | 93,585 | ||||||||||||
| Current portion of long-term debt | 4,450 | 4,450 | ||||||||||||
| Total current liabilities | 183,859 | 155,324 | ||||||||||||
| Term loan and revolving credit facility | 244,504 | 246,856 | ||||||||||||
| Other non-current liabilities | 191,920 | 227,507 | ||||||||||||
| Total liabilities | 620,283 | 629,687 | ||||||||||||
| Shareholders’ equity: | ||||||||||||||
| Common stock | 240 | 238 | ||||||||||||
| Additional paid-in capital | 296,093 | 287,256 | ||||||||||||
| Retained earnings | 293,802 | 290,441 | ||||||||||||
| Accumulated other comprehensive loss | (59,986) | (114,350) | ||||||||||||
| Total shareholders’ equity | 530,149 | 463,585 | ||||||||||||
| Total liabilities and shareholders’ equity | $ | 1,150,432 | $ | 1,093,272 | ||||||||||
Columbus McKinnon Reports Financial Results for Fourth Quarter Fiscal Year 2021
Page 7 of 13
May 26, 2021
COLUMBUS McKINNON CORPORATION
Condensed Consolidated Statements of Cash Flows - UNAUDITED
(In thousands)
| Year Ended | ||||||||||||||
| March 31, 2021 | March 31, 2020 | |||||||||||||
| Operating activities: | ||||||||||||||
| Net income | $ | 9,106 | $ | 59,672 | ||||||||||
| Adjustments to reconcile net income (loss) to net cash provided by (used for) operating activities: | ||||||||||||||
| Depreciation and amortization | 28,153 | 29,126 | ||||||||||||
| Deferred income taxes and related valuation allowance | (8,704) | 7,364 | ||||||||||||
| Net loss (gain) on sale of real estate, investments, and other | (1,594) | (563) | ||||||||||||
| Stock based compensation | 8,022 | 4,507 | ||||||||||||
| Amortization of deferred financing costs | 2,646 | 2,655 | ||||||||||||
| Loss on sales of businesses | — | 176 | ||||||||||||
| Non-cash pension settlement expense | 19,038 | — | ||||||||||||
| Gain on sale of building | (2,638) | — | ||||||||||||
| Non-cash lease expense | 7,447 | 7,923 | ||||||||||||
| Changes in operating assets and liabilities, net of effects of business acquisitions and divestitures: | ||||||||||||||
| Trade accounts receivable | 21,472 | 2,899 | ||||||||||||
| Inventories | 20,659 | 15,752 | ||||||||||||
| Prepaid expenses and other | (5,128) | (3,857) | ||||||||||||
| Other assets | 874 | 724 | ||||||||||||
| Trade accounts payable | 10,343 | 8,110 | ||||||||||||
| Accrued liabilities | (3,174) | (14,304) | ||||||||||||
| Non-current liabilities | (7,632) | (13,389) | ||||||||||||
| Net cash provided by (used for) operating activities | 98,890 | 106,795 | ||||||||||||
| Investing activities: | ||||||||||||||
| Proceeds from sales of marketable securities | 5,111 | 5,380 | ||||||||||||
| Purchases of marketable securities | (4,945) | (5,747) | ||||||||||||
| Capital expenditures | (12,300) | (9,432) | ||||||||||||
| Proceeds from sale of building, net of transaction costs | 5,453 | — | ||||||||||||
| Proceeds from insurance reimbursement | 100 | — | ||||||||||||
| Dividend received from equity method investment | 587 | — | ||||||||||||
| Proceeds from sale of fixed assets | 446 | 51 | ||||||||||||
| Net (payments) proceeds from sales of businesses | — | (214) | ||||||||||||
| Net cash provided by (used for) investing activities | (5,548) | (9,962) | ||||||||||||
| Financing activities: | ||||||||||||||
| Proceeds from issuance of common stock | 1,973 | 6,000 | ||||||||||||
| Borrowings under line-of-credit agreements | 25,000 | — | ||||||||||||
| Payments under line-of-credit agreements | (25,000) | — | ||||||||||||
| Repayment of debt | (4,450) | (51,113) | ||||||||||||
| Fees paid for revolver extension | (826) | — | ||||||||||||
| Payment of dividends | (5,733) | (5,670) | ||||||||||||
| Other | (1,153) | (768) | ||||||||||||
| Net cash provided by (used for) financing activities | (10,189) | (51,551) | ||||||||||||
| Effect of exchange rate changes on cash | 4,524 | (1,925) | ||||||||||||
| Net change in cash and cash equivalents | 87,677 | 43,357 | ||||||||||||
| Cash, cash equivalents, and restricted cash at beginning of year | 114,700 | 71,343 | ||||||||||||
| Cash, cash equivalents, and restricted cash at end of period | $ | 202,377 | $ | 114,700 | ||||||||||
Columbus McKinnon Reports Financial Results for Fourth Quarter Fiscal Year 2021
Page 8 of 13
May 26, 2021
COLUMBUS McKINNON CORPORATION
Q4 FY 2021 Sales Bridge
| Quarter | Year To Date | |||||||||||||||||||||||||
| ($ in millions) | $ Change | % Change | $ Change | % Change | ||||||||||||||||||||||
| Fiscal 2020 Sales | $ | 189.5 | $ | 809.2 | ||||||||||||||||||||||
| Volume | (11.1) | (5.8) | % | (177.3) | (21.9) | % | ||||||||||||||||||||
| Pricing | 1.9 | 1.0 | % | 8.6 | 1.1 | % | ||||||||||||||||||||
| Foreign currency translation | 5.9 | 3.1 | % | 9.1 | 1.1 | % | ||||||||||||||||||||
| Total change | $ | (3.3) | (1.7) | % | $ | (159.6) | (19.7) | % | ||||||||||||||||||
| Fiscal 2021 Sales | $ | 186.2 | $ | 649.6 | ||||||||||||||||||||||
COLUMBUS McKINNON CORPORATION
Q4 FY 2021 Gross Profit Bridge
| ($ in millions) | Quarter | Year To Date | |||||||||
| Fiscal 2020 Gross Profit | $ | 66.2 | $ | 283.2 | |||||||
| Pricing, net of material cost inflation | 1.7 | 8.3 | |||||||||
| Gain on sale of building | — | 2.2 | |||||||||
| Tariffs | 0.1 | 1.7 | |||||||||
| Foreign currency translation | 2.1 | 3.4 | |||||||||
| Product liability | 0.3 | 0.2 | |||||||||
| Business realignment costs | 0.5 | 0.2 | |||||||||
| Insurance settlement | — | (0.4) | |||||||||
| Factory closures | 1.3 | 0.1 | |||||||||
| Productivity, net of other cost changes | (4.5) | (15.9) | |||||||||
| Sales volume and mix | (3.6) | (62.8) | |||||||||
| Total change | $ | (2.1) | $ | (63.0) | |||||||
| Fiscal 2021 Gross Profit | $ | 64.1 | $ | 220.2 | |||||||
| U.S. Shipping Days by Quarter | ||||||||||||||||||||||||||||||||
| Q1 | Q2 | Q3 | Q4 | Total | ||||||||||||||||||||||||||||
| FY 22 | 63 | 64 | 61 | 63 | 251 | |||||||||||||||||||||||||||
| FY 21 | 63 | 64 | 61 | 63 | 251 | |||||||||||||||||||||||||||
| FY 20 | 63 | 63 | 61 | 64 | 251 | |||||||||||||||||||||||||||
Columbus McKinnon Reports Financial Results for Fourth Quarter Fiscal Year 2021
Page 9 of 13
May 26, 2021
COLUMBUS McKINNON CORPORATION
Additional Data - UNAUDITED
| March 31, 2021 | December 31, 2020 | March 31, 2020 | |||||||||||||||||||||||||||
| ($ in millions) | |||||||||||||||||||||||||||||
| Backlog | $ | 171.7 | $ | 152.4 | $ | 131.0 | |||||||||||||||||||||||
| Long-term backlog | |||||||||||||||||||||||||||||
| Expected to ship beyond 3 months | $ | 68.0 | $ | 62.1 | $ | 49.1 | |||||||||||||||||||||||
| Long-term backlog as % of total backlog | 39.6 | % | 40.7 | % | 37.5 | % | |||||||||||||||||||||||
| Trade accounts receivable | |||||||||||||||||||||||||||||
| Days sales outstanding | 51.5 | days | 51.5 | days | 59.4 | days | |||||||||||||||||||||||
| Inventory turns per year | |||||||||||||||||||||||||||||
| (based on cost of products sold) | 4.4 | turns | 3.9 | turns | 3.9 | turns | |||||||||||||||||||||||
| Days' inventory | 83.3 | days | 93.1 | days | 94.3 | days | |||||||||||||||||||||||
| Trade accounts payable | |||||||||||||||||||||||||||||
| Days payables outstanding | 58.7 | days | 46.4 | days | 48.6 | days | |||||||||||||||||||||||
| Working capital as a % of sales | 9.3 | % | 13.3 | % | 14.5 | % | |||||||||||||||||||||||
| Net cash provided by (used for) operating activities | $ | 26.9 | $ | 25.0 | $ | 36.5 | |||||||||||||||||||||||
| Capital expenditures | $ | 6.4 | $ | 3.1 | $ | 2.7 | |||||||||||||||||||||||
Free cash flow (1) | $ | 20.5 | $ | 21.9 | $ | 33.9 | |||||||||||||||||||||||
| Debt to total capitalization percentage | 32.0 | % | 33.4 | % | 35.2 | % | |||||||||||||||||||||||
| Debt, net of cash, to net total capitalization | 8.1 | % | 11.1 | % | 22.8 | % | |||||||||||||||||||||||
(1) Free cash flow is defined as cash from operations less capital expenditures. Free cash flow is not a measure determined in accordance with generally accepted accounting principles in the United States, commonly known as GAAP, and may not be comparable with the measures as used by other companies. Nevertheless, Columbus McKinnon believes that providing non-GAAP information, such as free cash flow, is important for investors and other readers of the Company’s financial statements.
Components may not add due to rounding.
Columbus McKinnon Reports Financial Results for Fourth Quarter Fiscal Year 2021
Page 10 of 13
May 26, 2021
COLUMBUS McKINNON CORPORATION
Reconciliation of GAAP Gross Profit to Non-GAAP Adjusted Gross Profit
($ in thousands, except per share data)
| Three Months Ended March 31, | Year Ended March 31, | ||||||||||||||||||||||
| 2021 | 2020 | 2021 | 2020 | ||||||||||||||||||||
| GAAP gross profit | $ | 64,088 | $ | 66,209 | $ | 220,225 | $ | 283,186 | |||||||||||||||
| Add back (deduct): | |||||||||||||||||||||||
| Factory closures | — | 1,349 | 2,671 | 2,800 | |||||||||||||||||||
| Business realignment costs | 264 | 774 | 830 | 1,037 | |||||||||||||||||||
| Insurance settlement | — | (15) | — | (382) | |||||||||||||||||||
| Gain on sale of building | — | — | (2,189) | — | |||||||||||||||||||
| Non-GAAP adjusted gross profit | $ | 64,352 | $ | 68,317 | $ | 221,537 | $ | 286,641 | |||||||||||||||
| Sales | $ | 186,235 | $ | 189,486 | $ | 649,642 | $ | 809,162 | |||||||||||||||
| Gross margin - GAAP | 34.4 | % | 34.9 | % | 33.9 | % | 35.0 | % | |||||||||||||||
| Adjusted gross margin - Non-GAAP | 34.6 | % | 36.1 | % | 34.1 | % | 35.4 | % | |||||||||||||||
Adjusted gross profit is defined as gross profit as reported, adjusted for certain items. Adjusted gross profit is not a measure determined in accordance with generally accepted accounting principles in the United States, commonly known as GAAP, and may not be comparable with the measures as used by other companies. Nevertheless, Columbus McKinnon believes that providing non-GAAP information, such as adjusted gross profit, is important for investors and other readers of the Company’s financial statements and assists in understanding the comparison of the current quarter’s and current year's gross profit to the historical periods' gross profit, as well as facilitates a more meaningful comparison of the Company’s gross profit to that of other companies.
Columbus McKinnon Reports Financial Results for Fourth Quarter Fiscal Year 2021
Page 11 of 13
May 26, 2021
COLUMBUS McKINNON CORPORATION
Reconciliation of GAAP Income from Operations to Non-GAAP Adjusted Income from Operations
($ in thousands, except per share data)
| Three Months Ended March 31, | Year Ended March 31, | ||||||||||||||||||||||
| 2021 | 2020 | 2021 | 2020 | ||||||||||||||||||||
| GAAP income from operations | $ | 14,199 | $ | 16,664 | $ | 42,255 | $ | 89,824 | |||||||||||||||
| Add back (deduct): | |||||||||||||||||||||||
| Acquisition deal costs | 3,951 | — | 3,951 | — | |||||||||||||||||||
| Factory closures | 306 | 1,621 | 3,778 | 4,709 | |||||||||||||||||||
| Business realignment costs | 412 | 1,755 | 1,470 | 2,831 | |||||||||||||||||||
| Insurance recovery legal costs | — | 160 | 229 | 585 | |||||||||||||||||||
| Loss on sales of businesses | — | — | — | 176 | |||||||||||||||||||
| Insurance settlement | — | (15) | — | (382) | |||||||||||||||||||
| Gain on sale of building | — | — | (2,638) | — | |||||||||||||||||||
| Non-GAAP adjusted income from operations | $ | 18,868 | $ | 20,185 | $ | 49,045 | $ | 97,743 | |||||||||||||||
| Sales | $ | 186,235 | $ | 189,486 | $ | 649,642 | $ | 809,162 | |||||||||||||||
| Operating margin - GAAP | 7.6 | % | 8.8 | % | 6.5 | % | 11.1 | % | |||||||||||||||
| Adjusted operating margin - Non-GAAP | 10.1 | % | 10.7 | % | 7.5 | % | 12.1 | % | |||||||||||||||
Adjusted income from operations is defined as income from operations as reported, adjusted for certain items. Adjusted income from operations is not a measure determined in accordance with generally accepted accounting principles in the United States, commonly known as GAAP, and may not be comparable with the measures as used by other companies. Nevertheless, Columbus McKinnon believes that providing non-GAAP information, such as adjusted income from operations, is important for investors and other readers of the Company’s financial statements and assists in understanding the comparison of the current quarter’s and current year's income from operations to the historical periods' income from operations, as well as facilitates a more meaningful comparison of the Company’s income from operations to that of other companies.
Columbus McKinnon Reports Financial Results for Fourth Quarter Fiscal Year 2021
Page 12 of 13
May 26, 2021
COLUMBUS McKINNON CORPORATION
Reconciliation of GAAP Net Income and Diluted Earnings per Share to
Non-GAAP Adjusted Net Income and Diluted Earnings per Share
($ in thousands, except per share data)
| Three Months Ended March 31, | Year Ended March 31, | ||||||||||||||||||||||
| 2021 | 2020 | 2021 | 2020 | ||||||||||||||||||||
| GAAP net income | $ | 9,585 | $ | 9,244 | $ | 9,106 | $ | 59,672 | |||||||||||||||
| Add back (deduct): | |||||||||||||||||||||||
| Non-cash pension settlement expense | — | — | 19,046 | — | |||||||||||||||||||
| Acquisition deal costs | 3,951 | — | 3,951 | — | |||||||||||||||||||
| Factory closures | 306 | 1,621 | 3,778 | 4,709 | |||||||||||||||||||
| Business realignment costs | 412 | 1,755 | 1,470 | 2,831 | |||||||||||||||||||
| Insurance recovery legal costs | — | 160 | 229 | 585 | |||||||||||||||||||
| Loss on sales of businesses | — | — | — | 176 | |||||||||||||||||||
| Insurance settlement | — | (15) | — | (382) | |||||||||||||||||||
| Gain on sale of building | — | — | (2,638) | — | |||||||||||||||||||
Normalize tax rate to 22% (1) | (2,074) | 1,050 | (6,931) | (1,232) | |||||||||||||||||||
| Non-GAAP adjusted net income | $ | 12,180 | $ | 13,815 | $ | 28,011 | $ | 66,359 | |||||||||||||||
| Average diluted shares outstanding | 24,384 | 23,938 | 24,173 | 23,855 | |||||||||||||||||||
| Diluted income per share - GAAP | $ | 0.39 | $ | 0.39 | $ | 0.38 | $ | 2.50 | |||||||||||||||
| Diluted income per share - Non-GAAP | $ | 0.50 | $ | 0.58 | $ | 1.16 | $ | 2.78 | |||||||||||||||
(1) Applies a normalized tax rate of 22% to GAAP pre-tax income and non-GAAP adjustments above, which are each pre-tax.
Adjusted net income and diluted EPS are defined as net income and diluted EPS as reported, adjusted for certain items and at a normalized tax rate. Adjusted net income and diluted EPS are not measures determined in accordance with generally accepted accounting principles in the United States, commonly known as GAAP, and may not be comparable to the measures as used by other companies. Nevertheless, Columbus McKinnon believes that providing non-GAAP information, such as adjusted net income and diluted EPS, is important for investors and other readers of the Company’s financial statements and assists in understanding the comparison of the current quarter’s and current year's net income and diluted EPS to the historical periods' net income and diluted EPS, as well as facilitates a more meaningful comparison of the Company’s net income and diluted EPS to that of other companies.
Columbus McKinnon Reports Financial Results for Fourth Quarter Fiscal Year 2021
Page 13 of 13
May 26, 2021
COLUMBUS McKINNON CORPORATION
Reconciliation of GAAP Net Income to Non-GAAP Adjusted EBITDA
($ in thousands)
| Three Months Ended March 31, | Year Ended March 31, | ||||||||||||||||||||||
| 2021 | 2020 | 2021 | 2020 | ||||||||||||||||||||
| GAAP net income | $ | 9,585 | $ | 9,244 | $ | 9,106 | $ | 59,672 | |||||||||||||||
| Add back (deduct): | |||||||||||||||||||||||
| Income tax expense (benefit) | 1,362 | 4,947 | 970 | 17,484 | |||||||||||||||||||
| Interest and debt expense | 2,889 | 3,200 | 12,081 | 14,234 | |||||||||||||||||||
| Investment (income) loss | (264) | 48 | (1,693) | (891) | |||||||||||||||||||
| Foreign currency exchange (gain) loss | (142) | (996) | 941 | (1,514) | |||||||||||||||||||
| Other (income) expense, net | 769 | 221 | 20,850 | 839 | |||||||||||||||||||
| Depreciation and amortization expense | 6,950 | 7,135 | 28,153 | 29,126 | |||||||||||||||||||
| Acquisition deal costs | 3,951 | — | 3,951 | — | |||||||||||||||||||
| Factory closures | 306 | 1,621 | 3,778 | 4,709 | |||||||||||||||||||
| Business realignment costs | 412 | 1,755 | 1,470 | 2,831 | |||||||||||||||||||
| Insurance recovery legal costs | — | 160 | 229 | 585 | |||||||||||||||||||
| Loss on sales of businesses | — | — | — | 176 | |||||||||||||||||||
| Insurance settlement | — | (15) | — | (382) | |||||||||||||||||||
| Gain on sale of building | — | — | (2,638) | — | |||||||||||||||||||
| Non-GAAP adjusted EBITDA | $ | 25,818 | $ | 27,320 | $ | 77,198 | $ | 126,869 | |||||||||||||||
| Sales | $ | 186,235 | $ | 189,486 | $ | 649,642 | $ | 809,162 | |||||||||||||||
| Net income margin - GAAP | 5.1 | % | 4.9 | % | 1.4 | % | 7.4 | % | |||||||||||||||
| Adjusted EBITDA margin - Non-GAAP | 13.9 | % | 14.4 | % | 11.9 | % | 15.7 | % | |||||||||||||||
Adjusted EBITDA is defined as net income before interest expense, income taxes, depreciation, amortization, and other adjustments. Adjusted EBITDA is not a measure determined in accordance with generally accepted accounting principles in the United States, commonly known as GAAP, and may not be comparable with the measures as used by other companies. Nevertheless, Columbus McKinnon believes that providing non-GAAP information, such as adjusted EBITDA, is important for investors and other readers of the Company’s financial statements.
Q4 Fiscal Year 2021 Financial Results Conference Call May 26, 2021 David J. Wilson President and Chief Executive Officer Gregory P. Rustowicz Vice President – Finance & Chief Financial Officer
2 Safe Harbor Statement These slides, and the accompanying oral discussion (together, this “presentation”), contain “forward-looking statements” within the meaning of the Private Securities Litigation Reform Act of 1995. Such statements include, but are not limited to, statements concerning: future sales, earnings and plans; the success of the integration of Dorner Mfg. Corp. (“Dorner”) into Columbus McKinnon Corporation (the “Company”, “Columbus McKinnon”, “CMCO” or “our”) to achieve cost and revenue synergies and the amount of such synergies; the ability of the Company to achieve market success and earnings per share accretion expectations; the ability of the Company to achieve its Blueprint for Growth 2.0 strategy; and the amount of integration costs, involve known and unknown risks, and are based upon current information and expectations. Actual results may differ materially from those anticipated if the information on which those estimates were based ultimately proves to be incorrect or as a result of certain risks and uncertainties that could cause our actual results to differ materially from the results expressed or implied by such statements, including the integration of Dorner into the Company to achieve cost and revenue synergies, the ability of the Company and Dorner to achieve revenue expectations, global economic and business conditions including the impact of COVID-19, conditions affecting the industries served by us and our subsidiaries, conditions affecting our customers and suppliers, competitor responses to our products and services, the overall market acceptance of such products and services, facility consolidations and other restructurings, the ability to expand into new markets and geographic regions, foreign currency fluctuations, the integration of acquisitions, including the acquisition of Dorner, and other factors disclosed in our periodic reports filed with the Securities and Exchange Commission. Consequently, such forward-looking statements should be regarded as our current plans, estimates and beliefs. Except as required by applicable law, we do not undertake and specifically decline any obligation to publicly release the results of any revisions to these forward-looking statements that may be made to reflect any future events or circumstances after the date of such statements or to reflect the occurrence of anticipated or unanticipated events. Non-GAAP Financial Measures This presentation will discuss some non-GAAP (“adjusted”) financial measures which we believe are useful in evaluating our performance. You should not consider the presentation of this additional information in isolation or as a substitute for results compared in accordance with GAAP. The non-GAAP (“adjusted”) measures are noted and reconciliations of comparable GAAP with non-GAAP measures can be found in tables included in the Supplemental Information portion of this presentation.
Execution of strategy delivered solid quarterly results nearing pre-pandemic levels • Responsiveness to customer requirements and continued sequential recovery delivered sales of $186.2 million • Operating income of $14.2 million and operating margin of 7.6% during the quarter • Adjusted operating income at $18.9 million; approached pre-pandemic adjusted operating margin at 10.1% Strong cash generation reflected focus on working capital • Generated $26.9 million of cash from operations and $20.5 million of free cash flow (1) for the quarter • Flexible capital structure with net debt leverage ratio (2) of 0.61x at quarter end enabled ability to invest in growth Backlog of $171.7 million, excluding Dorner, increased 31% year-over-year and 13% sequentially • Strong sequential increase in quarterly order flow from both short-cycle and project businesses to $208.8 million 3 Successful Finish to Unprecedented Year Strong finish for fiscal 2021 and well positioned for solid performance in fiscal 2022 (1)Free cash flow is a non-GAAP measure defined as cash provided by operating activities minus capital expenditures (2)Net debt leverage ratio is defined as Net Debt / TTM Adjusted EBITDA
Successfully closed acquisition and completed refinancing • Added specialty conveying to intelligent motion solutions offerings • Pro forma net leverage ratio of 3.4x(1); financial flexibility to drive strategic growth framework Enhanced growth profile in attractive markets • Specialty conveying backlog more than doubled to $39.5 million Y/Y at April 30 • Strong demand from e-warehousing, life sciences and food processing New product development strengthening competitive advantages • Organic N-3 revenue grew 22% in fiscal 2021 • Dorner brings innovation and differentiated technology to expand N-3 potential 4 Executing Blueprint for Growth 2.0 Strategy Accelerating growth through Blueprint for Growth 2.0 strategy (1)Pro forma net debt leverage ratio is defined as Net Debt / pro forma TTM Adjusted EBITDA as of 3/31/2021
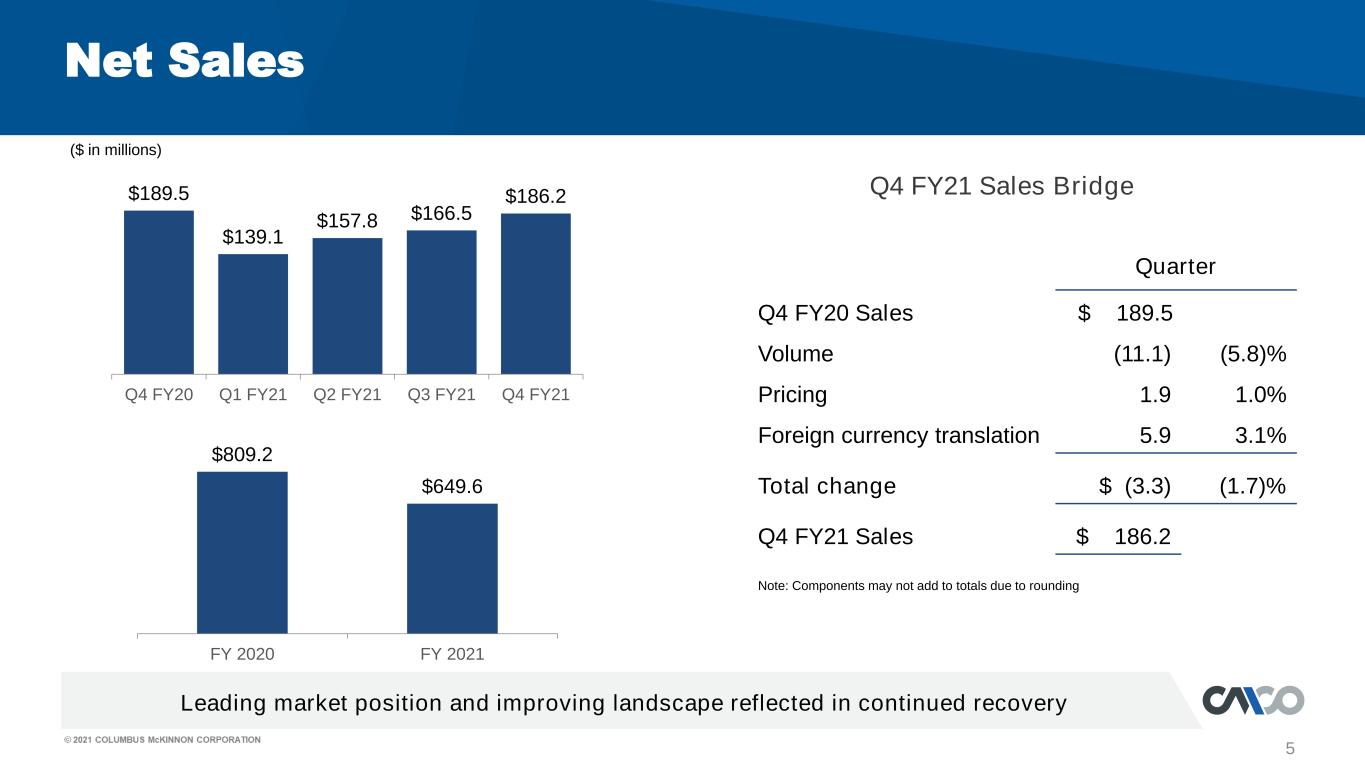
5 Q4 FY21 Sales Bridge Net Sales Leading market position and improving landscape reflected in continued recovery $809.2 $649.6 FY 2020 FY 2021 Quarter Q4 FY20 Sales $ 189.5 Volume (11.1) (5.8)% Pricing 1.9 1.0% Foreign currency translation 5.9 3.1% Total change $ (3.3) (1.7)% Q4 FY21 Sales $ 186.2 Note: Components may not add to totals due to rounding ($ in millions) $189.5 $139.1 $157.8 $166.5 $186.2 Q4 FY20 Q1 FY21 Q2 FY21 Q3 FY21 Q4 FY21
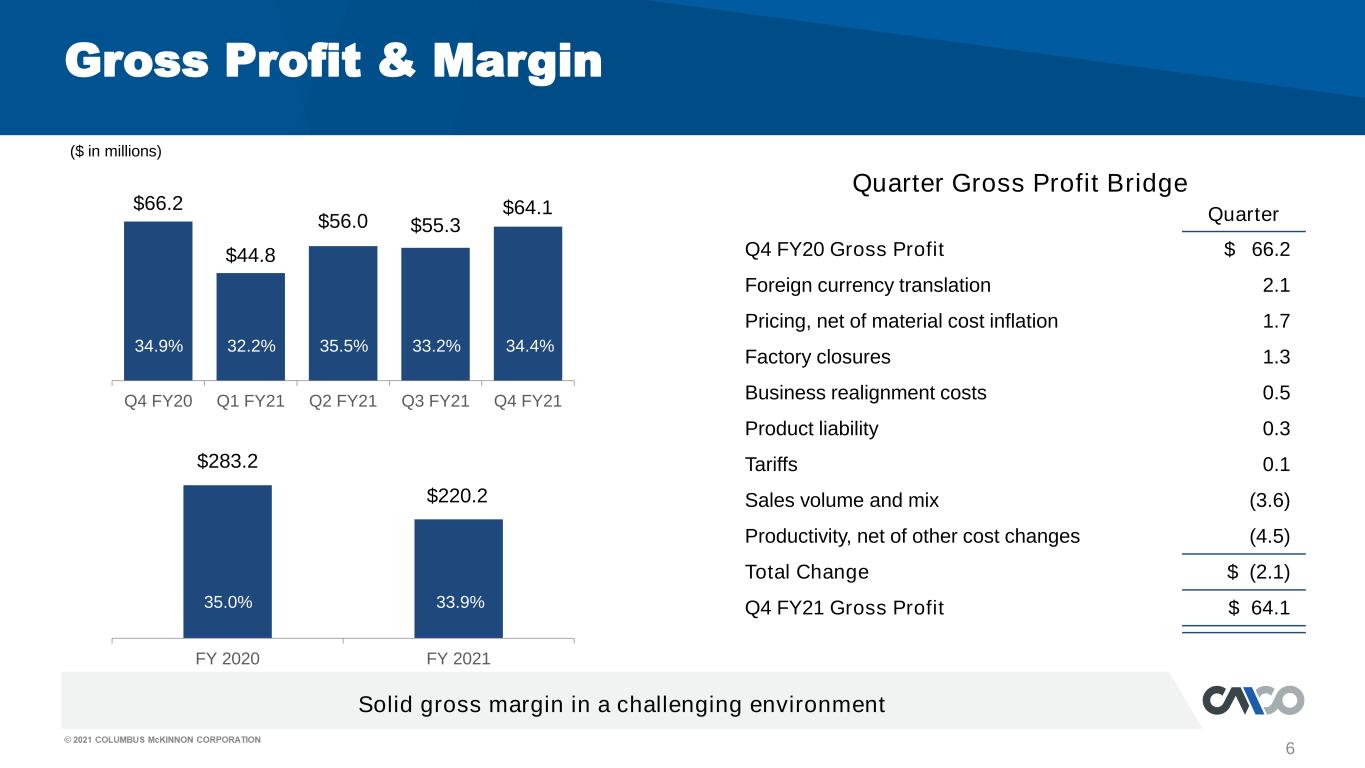
$66.2 $44.8 $56.0 $55.3 $64.1 Q4 FY20 Q1 FY21 Q2 FY21 Q3 FY21 Q4 FY21 6 Solid gross margin in a challenging environment Gross Profit & Margin 34.9% 32.2% 33.2%35.5% 34.4% Quarter Gross Profit Bridge Quarter Q4 FY20 Gross Profit $ 66.2 Foreign currency translation 2.1 Pricing, net of material cost inflation 1.7 Factory closures 1.3 Business realignment costs 0.5 Product liability 0.3 Tariffs 0.1 Sales volume and mix (3.6) Productivity, net of other cost changes (4.5) Total Change $ (2.1) Q4 FY21 Gross Profit $ 64.1 ($ in millions) $283.2 $220.2 FY 2020 FY 2021 35.0% 33.9%
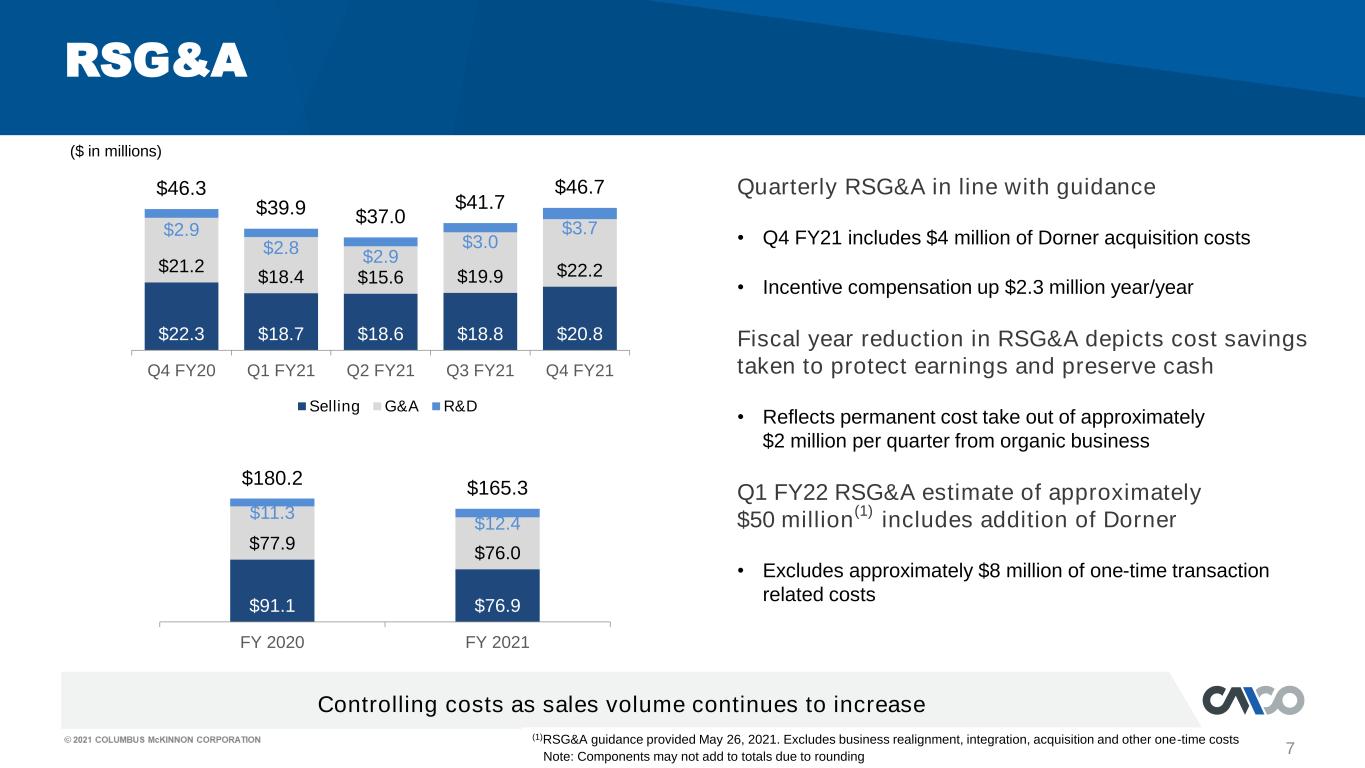
7 RSG&A $22.3 $18.7 $18.6 $18.8 $20.8 $21.2 $18.4 $15.6 $19.9 $22.2 $2.9 $2.8 $2.9 $3.0 $3.7 $46.3 $39.9 $37.0 $41.7 $46.7 Q4 FY20 Q1 FY21 Q2 FY21 Q3 FY21 Q4 FY21 Selling G&A R&D Controlling costs as sales volume continues to increase ($ in millions) Quarterly RSG&A in line with guidance • Q4 FY21 includes $4 million of Dorner acquisition costs • Incentive compensation up $2.3 million year/year Fiscal year reduction in RSG&A depicts cost savings taken to protect earnings and preserve cash • Reflects permanent cost take out of approximately $2 million per quarter from organic business Q1 FY22 RSG&A estimate of approximately $50 million (1) includes addition of Dorner • Excludes approximately $8 million of one-time transaction related costs (1)RSG&A guidance provided May 26, 2021. Excludes business realignment, integration, acquisition and other one-time costs $91.1 $76.9 $77.9 $76.0 $11.3 $12.4 $180.2 $165.3 FY 2020 FY 2021 Note: Components may not add to totals due to rounding
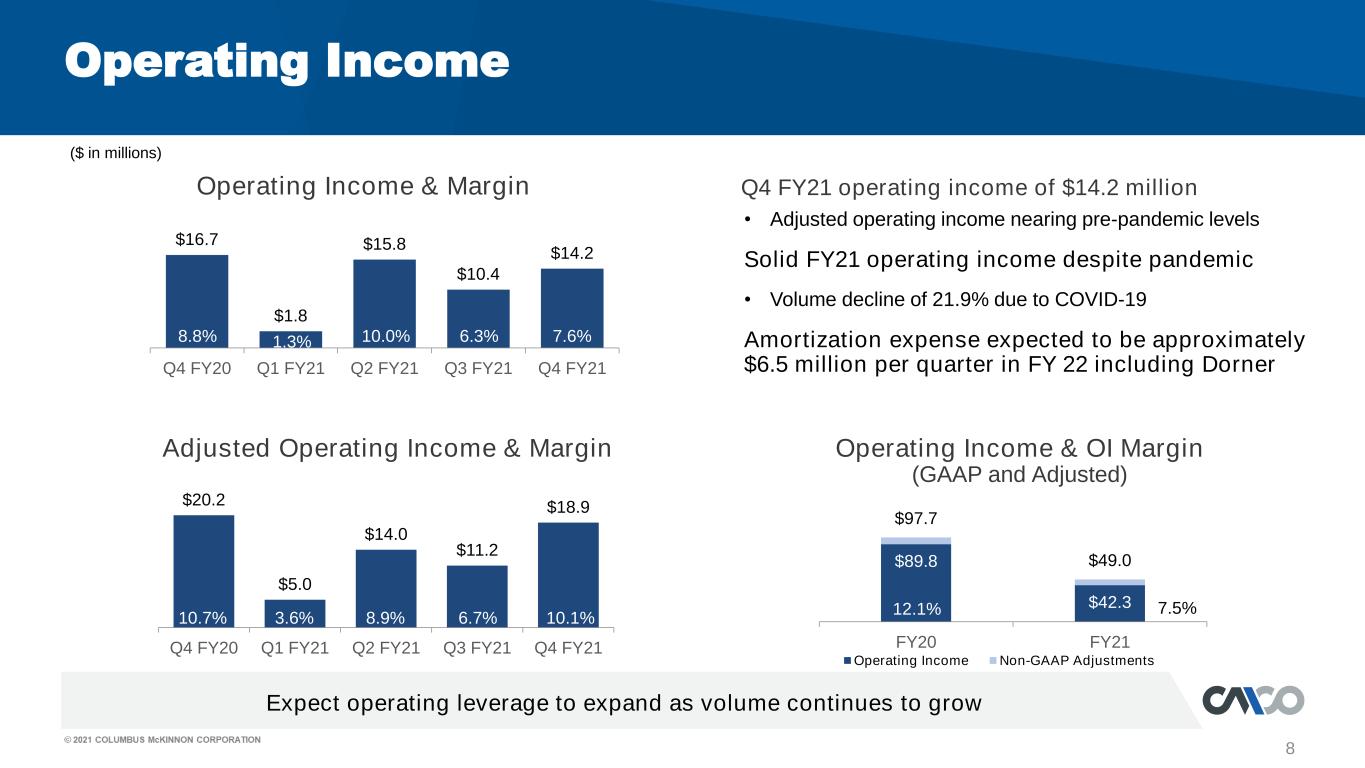
8 Q4 FY21 operating income of $14.2 million Operating Income • Adjusted operating income nearing pre-pandemic levels Solid FY21 operating income despite pandemic • Volume decline of 21.9% due to COVID-19 Amortization expense expected to be approximately $6.5 million per quarter in FY 22 including Dorner Expect operating leverage to expand as volume continues to grow ($ in millions) Operating Income & Margin Adjusted Operating Income & Margin $20.2 $5.0 $14.0 $11.2 $18.9 Q4 FY20 Q1 FY21 Q2 FY21 Q3 FY21 Q4 FY21 8.9% 10.1%10.7% 3.6% 6.7% $16.7 $1.8 $15.8 $10.4 $14.2 Q4 FY20 Q1 FY21 Q2 FY21 Q3 FY21 Q4 FY21 10.0% 7.6%8.8% 1.3% 6.3% Operating Income & OI Margin (GAAP and Adjusted) $89.8 $42.3 $97.7 $49.0 FY20 FY21 Operating Income Non-GAAP Adjustments 12.1% 7.5%
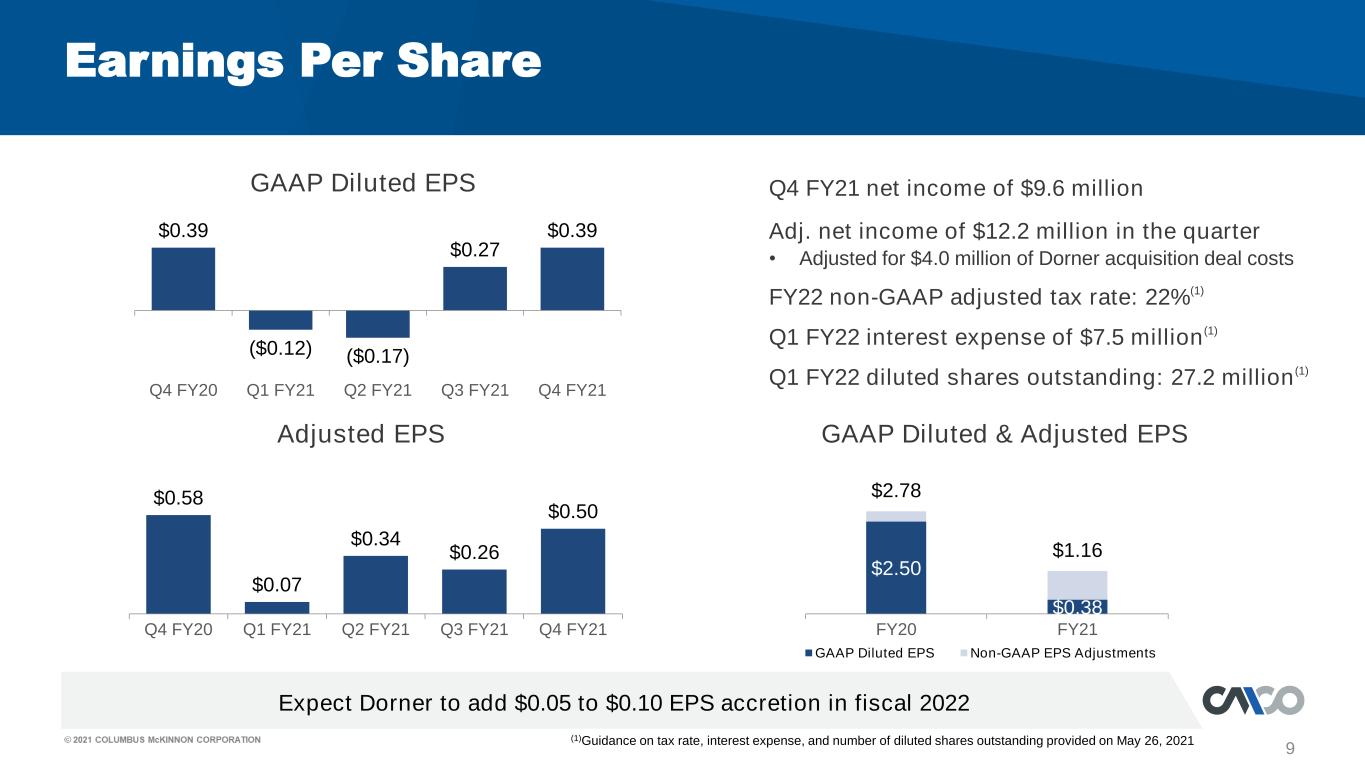
9 Q4 FY21 net income of $9.6 million Earnings Per Share Adjusted EPS GAAP Diluted EPS $0.39 ($0.12) ($0.17) $0.27 $0.39 Q4 FY20 Q1 FY21 Q2 FY21 Q3 FY21 Q4 FY21 $0.58 $0.07 $0.34 $0.26 $0.50 Q4 FY20 Q1 FY21 Q2 FY21 Q3 FY21 Q4 FY21 Adj. net income of $12.2 million in the quarter • Adjusted for $4.0 million of Dorner acquisition deal costs FY22 non-GAAP adjusted tax rate: 22% (1) Q1 FY22 interest expense of $7.5 million (1) Q1 FY22 diluted shares outstanding: 27.2 million (1) (1)Guidance on tax rate, interest expense, and number of diluted shares outstanding provided on May 26, 2021 $2.50 $0.38 $2.78 $1.16 FY20 FY21 GAAP Diluted EPS Non-GAAP EPS Adjustments GAAP Diluted & Adjusted EPS Expect Dorner to add $0.05 to $0.10 EPS accretion in fiscal 2022
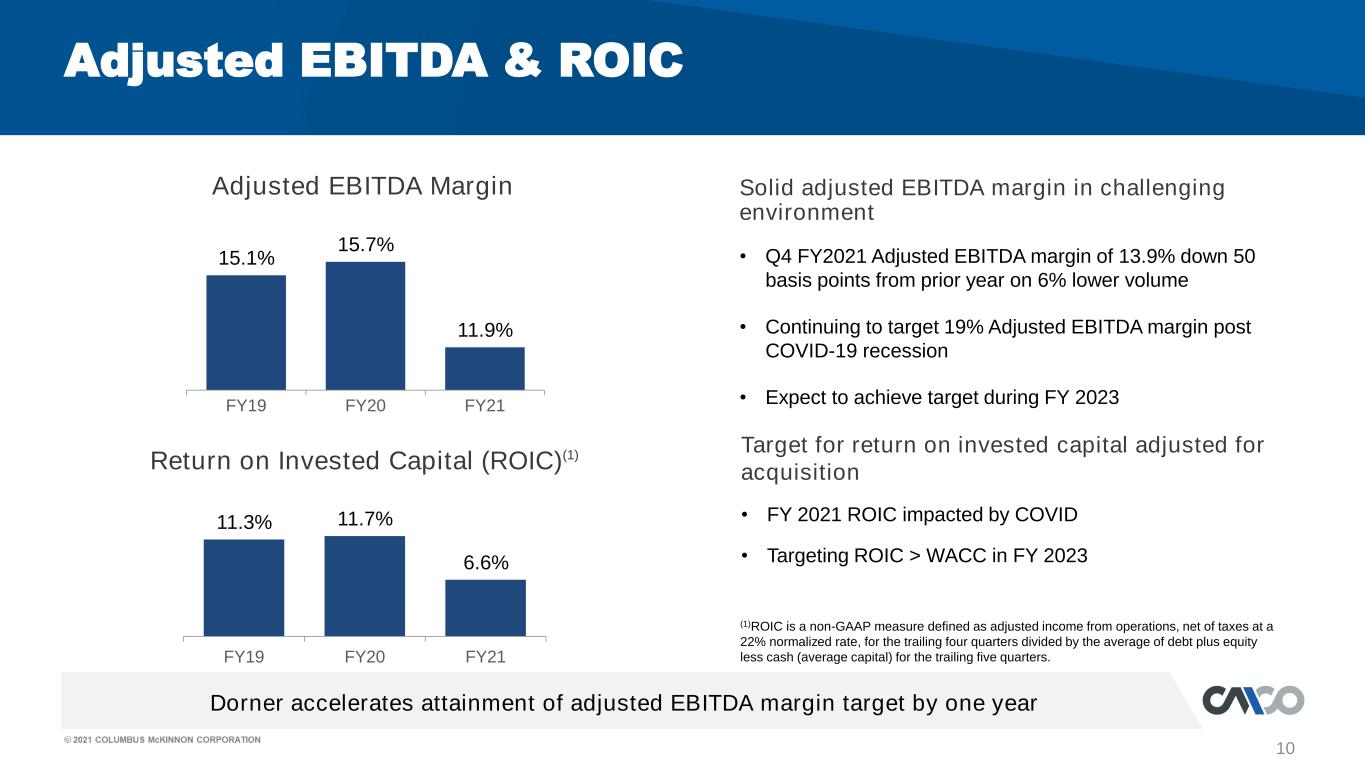
10 Adjusted EBITDA Margin Solid adjusted EBITDA margin in challenging environment Adjusted EBITDA & ROIC Return on Invested Capital (ROIC)(1) Dorner accelerates attainment of adjusted EBITDA margin target by one year 15.1% 15.7% 11.9% FY19 FY20 FY21 11.3% 11.7% 6.6% FY19 FY20 FY21 (1)ROIC is a non-GAAP measure defined as adjusted income from operations, net of taxes at a 22% normalized rate, for the trailing four quarters divided by the average of debt plus equity less cash (average capital) for the trailing five quarters. • Q4 FY2021 Adjusted EBITDA margin of 13.9% down 50 basis points from prior year on 6% lower volume • Continuing to target 19% Adjusted EBITDA margin post COVID-19 recession • Expect to achieve target during FY 2023 Target for return on invested capital adjusted for acquisition • FY 2021 ROIC impacted by COVID • Targeting ROIC > WACC in FY 2023
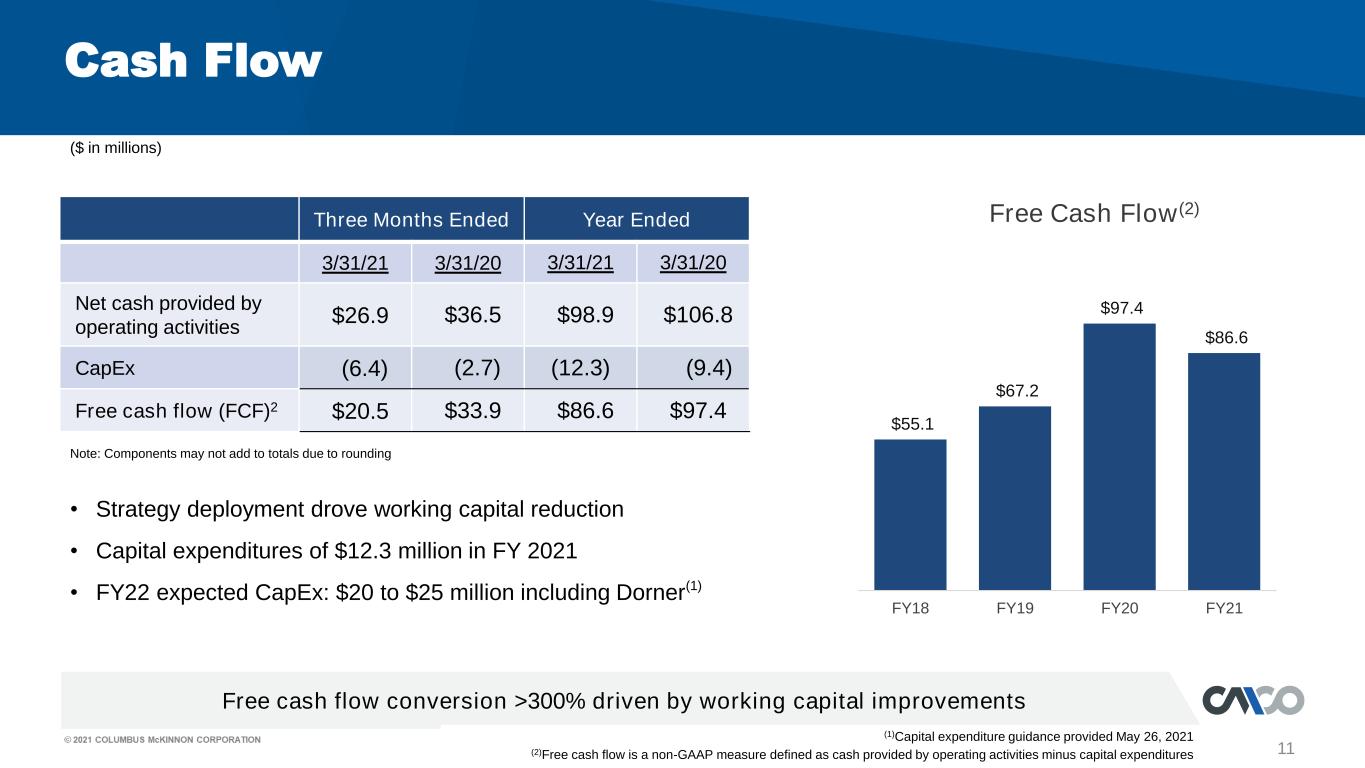
$55.1 $67.2 $97.4 $86.6 FY18 FY19 FY20 FY21 11 Free Cash Flow(2) Cash Flow • Strategy deployment drove working capital reduction • Capital expenditures of $12.3 million in FY 2021 • FY22 expected CapEx: $20 to $25 million including Dorner (1) Three Months Ended Year Ended 3/31/21 3/31/20 3/31/21 3/31/20 Net cash provided by operating activities $26.9 $36.5 $98.9 $106.8 CapEx (6.4) (2.7) (12.3) (9.4) Free cash flow (FCF)2 $20.5 $33.9 $86.6 $97.4 Free cash flow conversion >300% driven by working capital improvements Note: Components may not add to totals due to rounding (1)Capital expenditure guidance provided May 26, 2021 (2)Free cash flow is a non-GAAP measure defined as cash provided by operating activities minus capital expenditures ($ in millions)
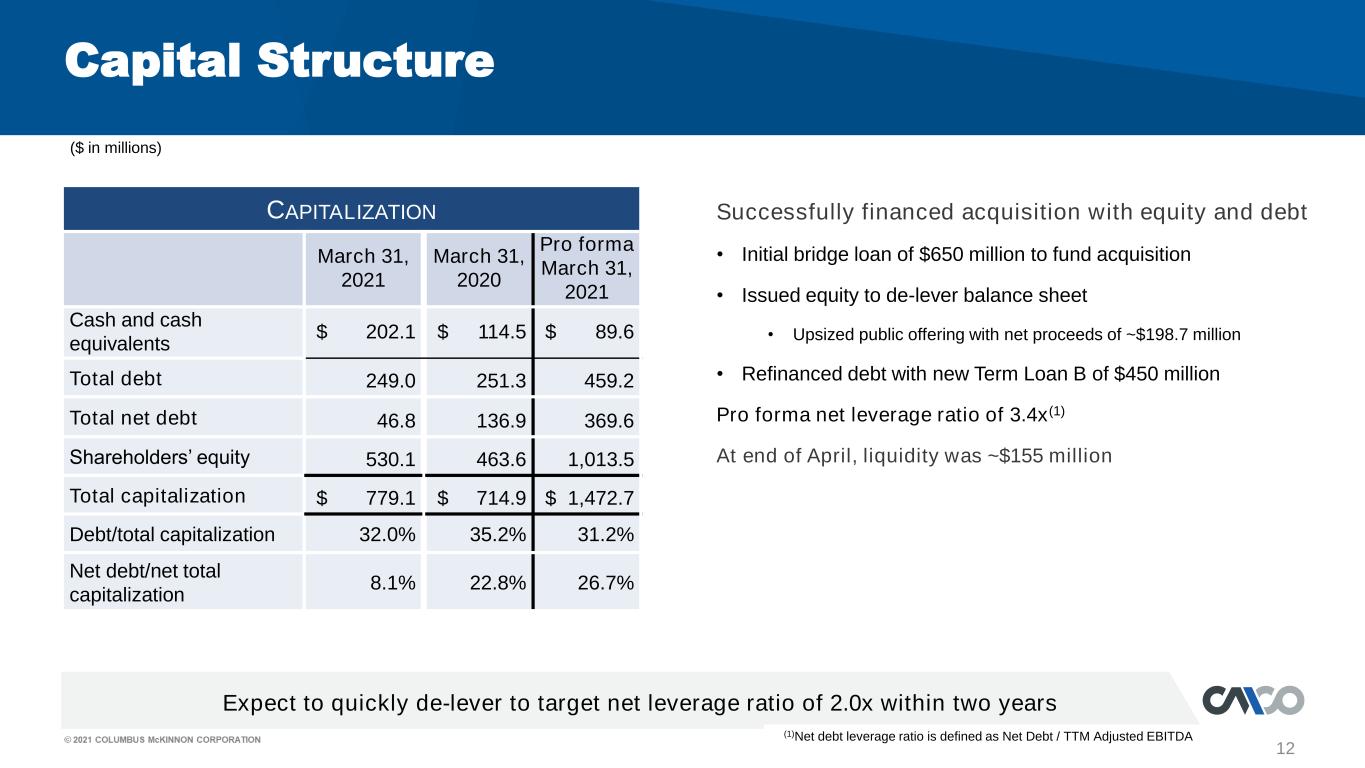
12 Capital Structure Successfully financed acquisition with equity and debt • Initial bridge loan of $650 million to fund acquisition • Issued equity to de-lever balance sheet • Upsized public offering with net proceeds of ~$198.7 million • Refinanced debt with new Term Loan B of $450 million Pro forma net leverage ratio of 3.4x(1) At end of April, liquidity was ~$155 million Expect to quickly de-lever to target net leverage ratio of 2.0x within two years CAPITALIZATION March 31, 2021 March 31, 2020 Pro forma March 31, 2021 Cash and cash equivalents $ 202.1 $ 114.5 $ 89.6 Total debt 249.0 251.3 459.2 Total net debt 46.8 136.9 369.6 Shareholders’ equity 530.1 463.6 1,013.5 Total capitalization $ 779.1 $ 714.9 $ 1,472.7 Debt/total capitalization 32.0% 35.2% 31.2% Net debt/net total capitalization 8.1% 22.8% 26.7% (1)Net debt leverage ratio is defined as Net Debt / TTM Adjusted EBITDA ($ in millions)
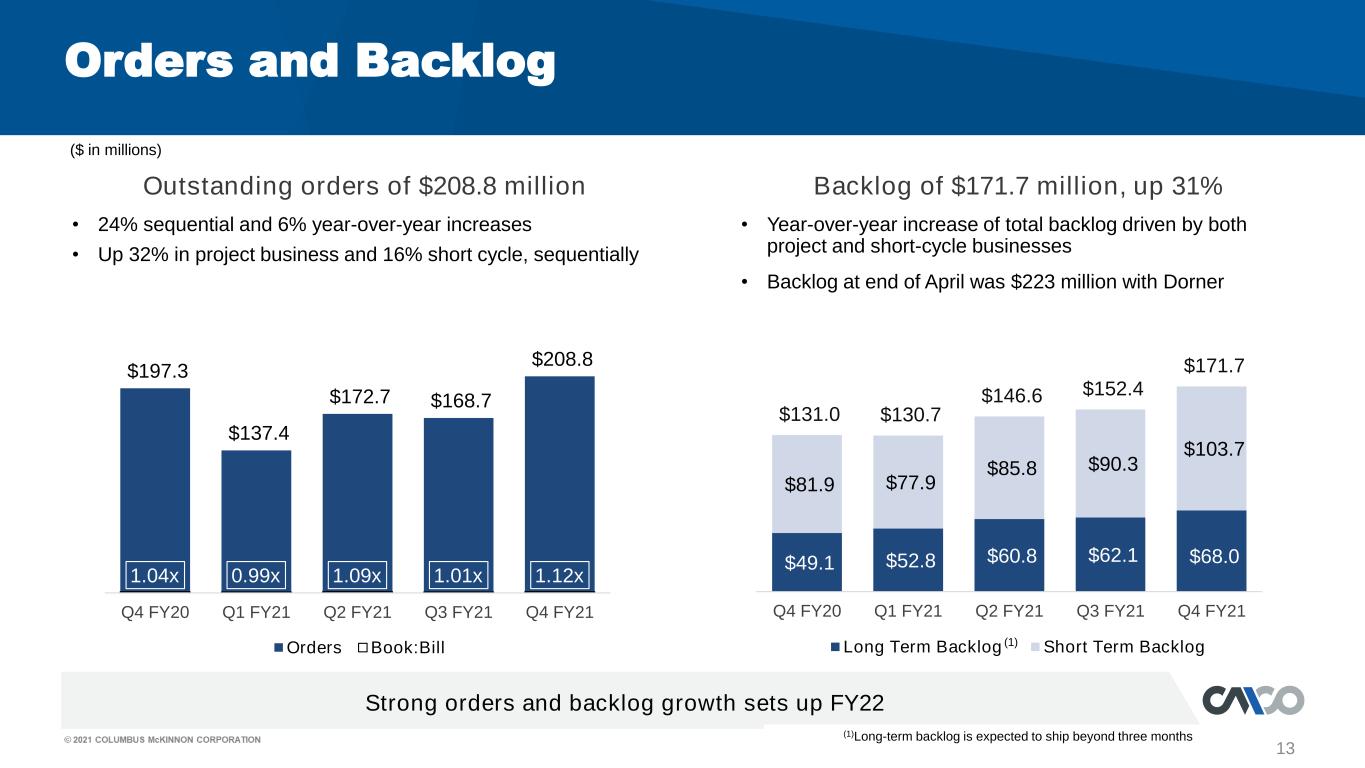
13 Outstanding orders of $208.8 million Backlog of $171.7 million, up 31% Orders and Backlog • 24% sequential and 6% year-over-year increases • Up 32% in project business and 16% short cycle, sequentially • Year-over-year increase of total backlog driven by both project and short-cycle businesses • Backlog at end of April was $223 million with Dorner Strong orders and backlog growth sets up FY22 ($ in millions) $197.3 $137.4 $172.7 $168.7 $208.8 1.04x 0.99x 1.09x 1.01x 1.12x Q4 FY20 Q1 FY21 Q2 FY21 Q3 FY21 Q4 FY21 Orders Book:Bill (1)Long-term backlog is expected to ship beyond three months $49.1 $52.8 $60.8 $62.1 $68.0 $81.9 $77.9 $85.8 $90.3 $103.7 $131.0 $130.7 $146.6 $152.4 $171.7 Q4 FY20 Q1 FY21 Q2 FY21 Q3 FY21 Q4 FY21 Long Term Backlog Short Term Backlog(1)
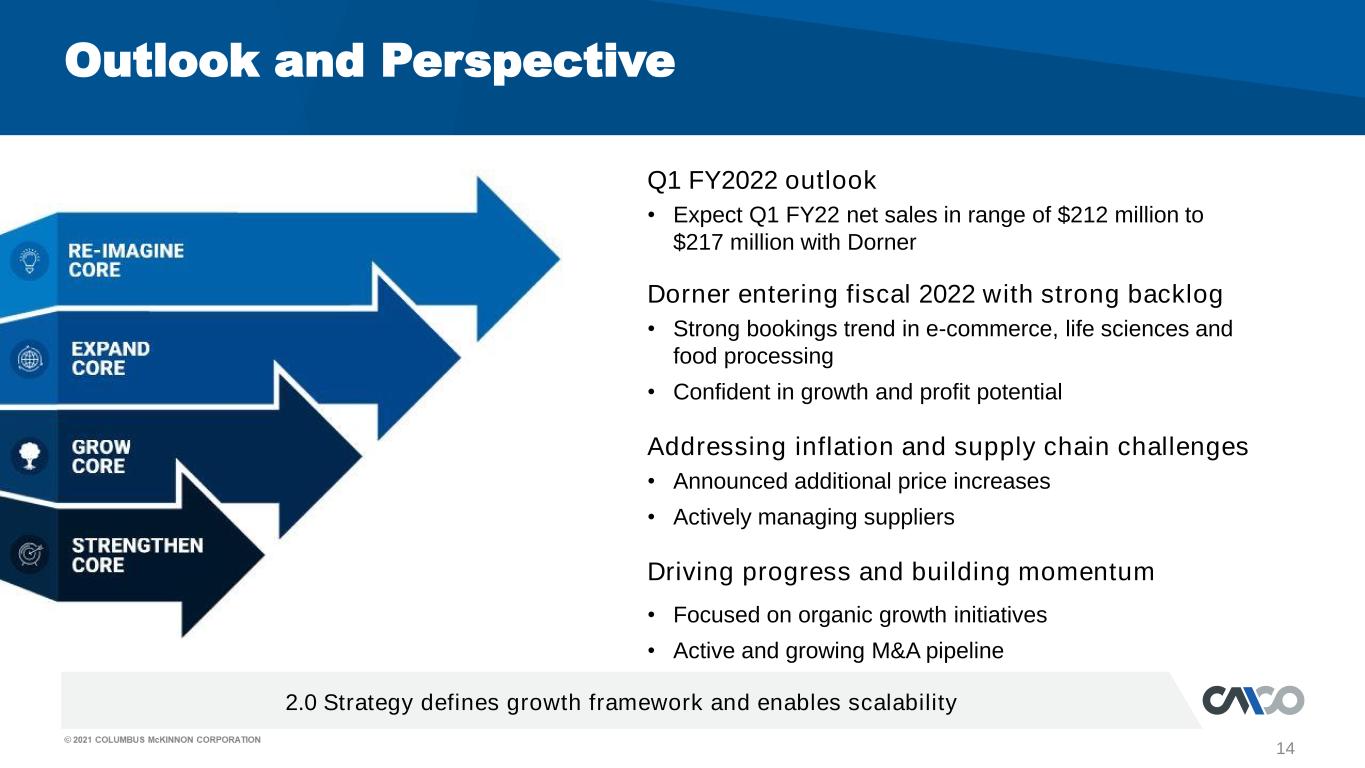
14 2.0 Strategy defines growth framework and enables scalability Outlook and Perspective Q1 FY2022 outlook • Expect Q1 FY22 net sales in range of $212 million to $217 million with Dorner Dorner entering fiscal 2022 with strong backlog • Strong bookings trend in e-commerce, life sciences and food processing • Confident in growth and profit potential Addressing inflation and supply chain challenges • Announced additional price increases • Actively managing suppliers Driving progress and building momentum • Focused on organic growth initiatives • Active and growing M&A pipeline
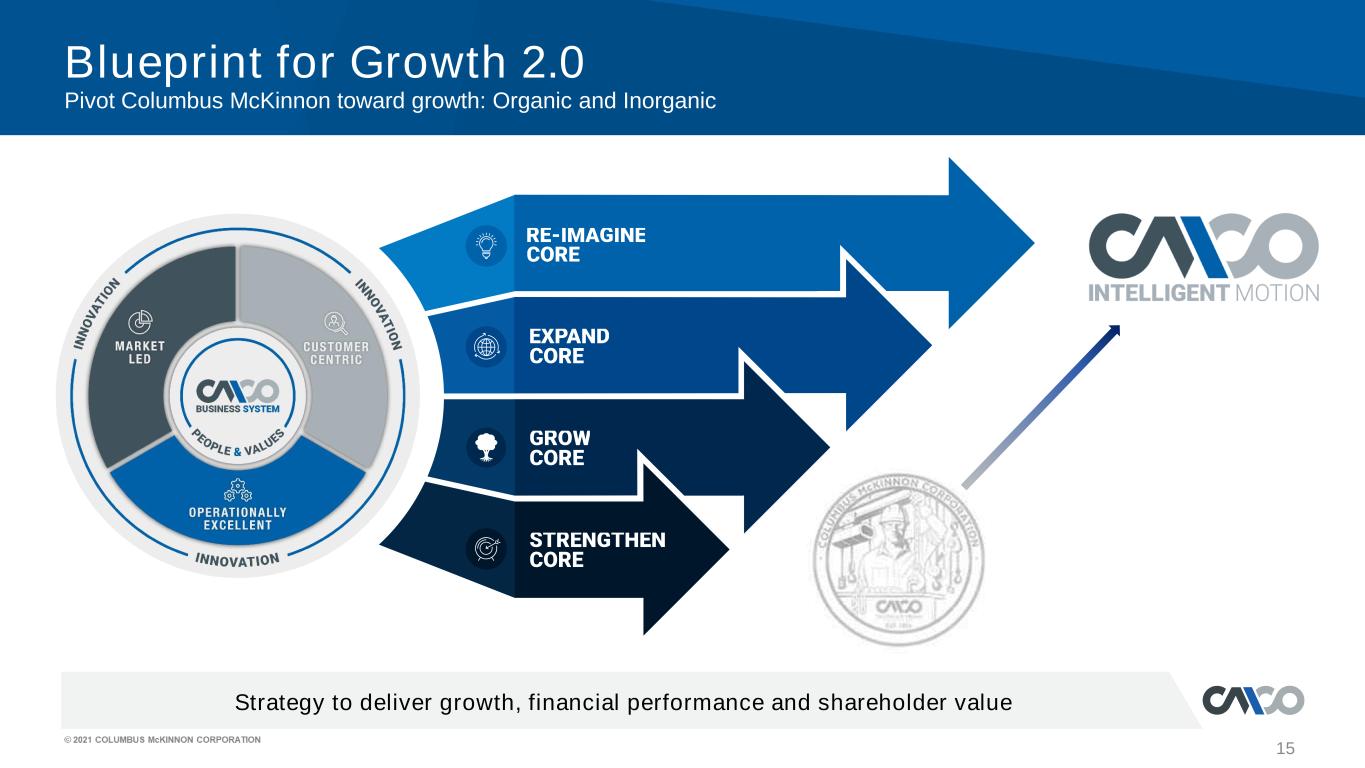
Blueprint for Growth 2.0 Pivot Columbus McKinnon toward growth: Organic and Inorganic 15 Strategy to deliver growth, financial performance and shareholder value
Q4 Fiscal Year 2021 Financial Results Conference Call May 26, 2021 David J. Wilson President and Chief Executive Officer Gregory P. Rustowicz Vice President – Finance & Chief Financial Officer
Supplemental Information
18 Conference Call Playback Info Replay Number: 412-317-6671 passcode: 13718341 Telephone replay available through June 2, 2021 Webcast / PowerPoint / Replay available at investors.columbusmckinnon.com Transcript, when available, at investors.columbusmckinnon.com
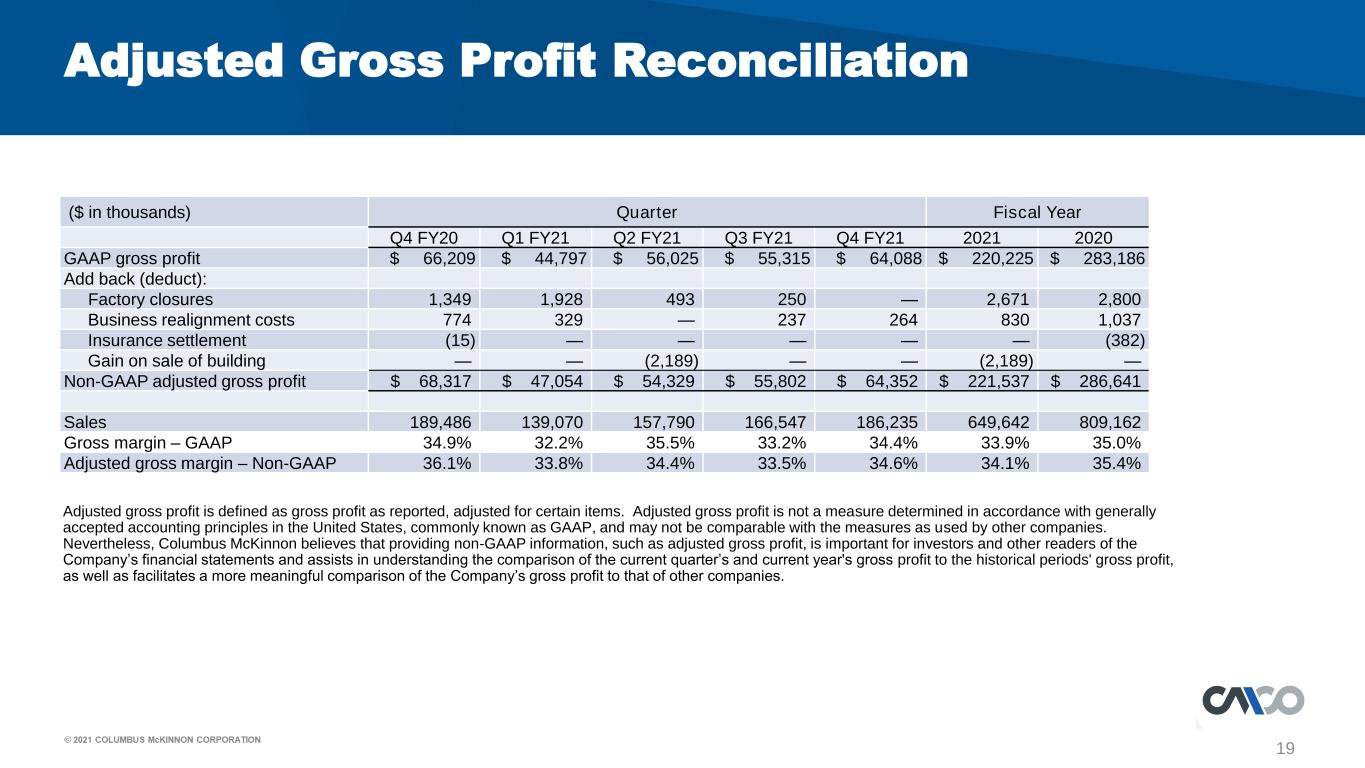
19 Adjusted Gross Profit Reconciliation Adjusted gross profit is defined as gross profit as reported, adjusted for certain items. Adjusted gross profit is not a measure determined in accordance with generally accepted accounting principles in the United States, commonly known as GAAP, and may not be comparable with the measures as used by other companies. Nevertheless, Columbus McKinnon believes that providing non-GAAP information, such as adjusted gross profit, is important for investors and other readers of the Company’s financial statements and assists in understanding the comparison of the current quarter’s and current year's gross profit to the historical periods' gross profit, as well as facilitates a more meaningful comparison of the Company’s gross profit to that of other companies. ($ in thousands) Quarter Fiscal Year Q4 FY20 Q1 FY21 Q2 FY21 Q3 FY21 Q4 FY21 2021 2020 GAAP gross profit $ 66,209 $ 44,797 $ 56,025 $ 55,315 $ 64,088 $ 220,225 $ 283,186 Add back (deduct): Factory closures 1,349 1,928 493 250 — 2,671 2,800 Business realignment costs 774 329 — 237 264 830 1,037 Insurance settlement (15) — — — — — (382) Gain on sale of building — — (2,189) — — (2,189) — Non-GAAP adjusted gross profit $ 68,317 $ 47,054 $ 54,329 $ 55,802 $ 64,352 $ 221,537 $ 286,641 Sales 189,486 139,070 157,790 166,547 186,235 649,642 809,162 Gross margin – GAAP 34.9% 32.2% 35.5% 33.2% 34.4% 33.9% 35.0% Adjusted gross margin – Non-GAAP 36.1% 33.8% 34.4% 33.5% 34.6% 34.1% 35.4%
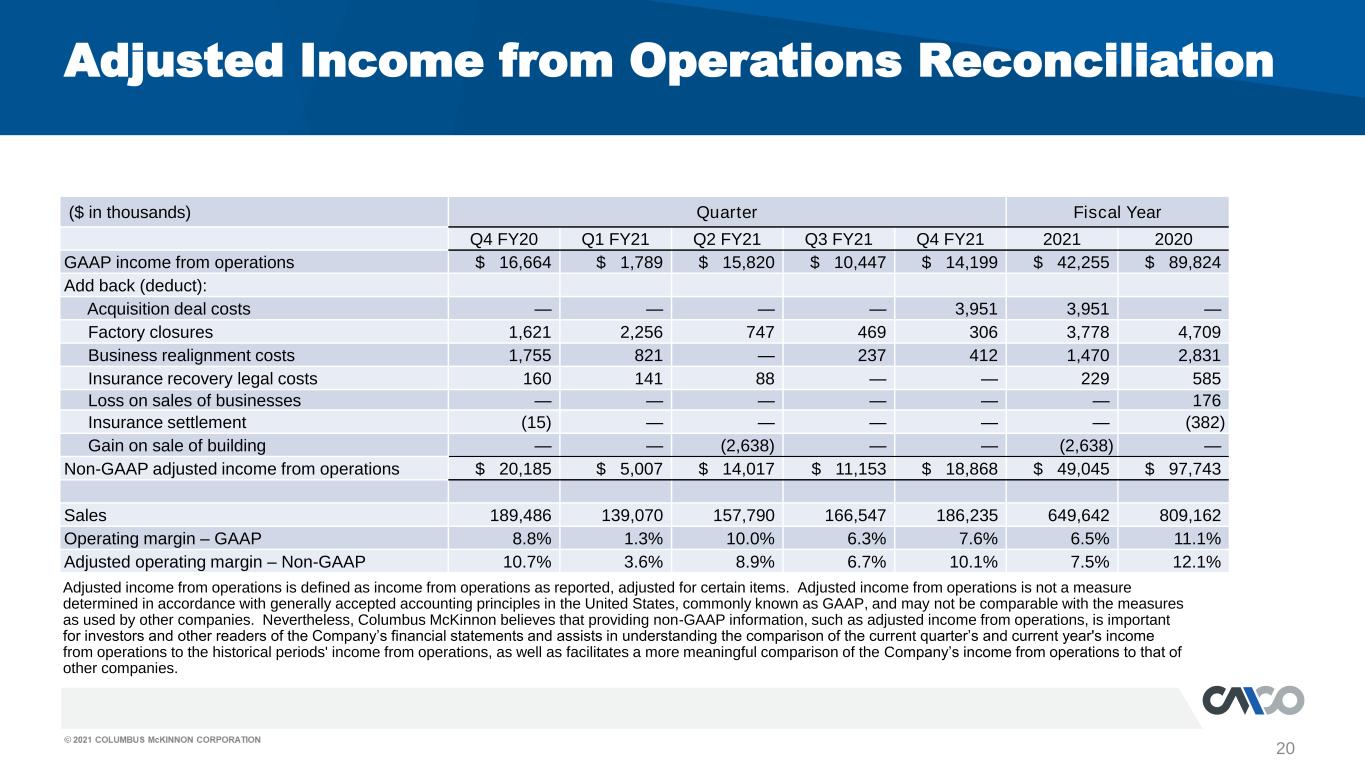
20 Adjusted Income from Operations Reconciliation Adjusted income from operations is defined as income from operations as reported, adjusted for certain items. Adjusted income from operations is not a measure determined in accordance with generally accepted accounting principles in the United States, commonly known as GAAP, and may not be comparable with the measures as used by other companies. Nevertheless, Columbus McKinnon believes that providing non-GAAP information, such as adjusted income from operations, is important for investors and other readers of the Company’s financial statements and assists in understanding the comparison of the current quarter’s and current year's income from operations to the historical periods' income from operations, as well as facilitates a more meaningful comparison of the Company’s income from operations to that of other companies. ($ in thousands) Quarter Fiscal Year Q4 FY20 Q1 FY21 Q2 FY21 Q3 FY21 Q4 FY21 2021 2020 GAAP income from operations $ 16,664 $ 1,789 $ 15,820 $ 10,447 $ 14,199 $ 42,255 $ 89,824 Add back (deduct): Acquisition deal costs — — — — 3,951 3,951 — Factory closures 1,621 2,256 747 469 306 3,778 4,709 Business realignment costs 1,755 821 — 237 412 1,470 2,831 Insurance recovery legal costs 160 141 88 — — 229 585 Loss on sales of businesses — — — — — — 176 Insurance settlement (15) — — — — — (382) Gain on sale of building — — (2,638) — — (2,638) — Non-GAAP adjusted income from operations $ 20,185 $ 5,007 $ 14,017 $ 11,153 $ 18,868 $ 49,045 $ 97,743 Sales 189,486 139,070 157,790 166,547 186,235 649,642 809,162 Operating margin – GAAP 8.8% 1.3% 10.0% 6.3% 7.6% 6.5% 11.1% Adjusted operating margin – Non-GAAP 10.7% 3.6% 8.9% 6.7% 10.1% 7.5% 12.1%
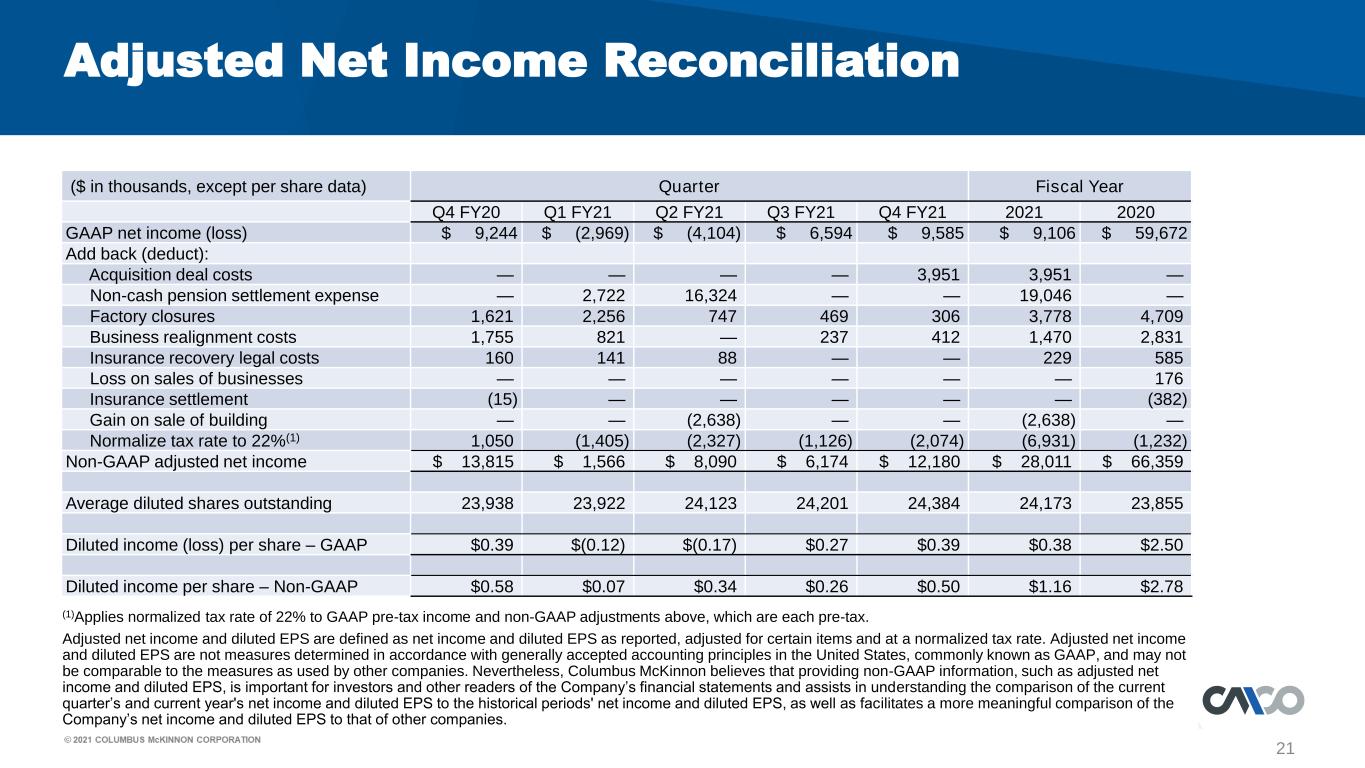
21 Adjusted Net Income Reconciliation ($ in thousands, except per share data) Quarter Fiscal Year Q4 FY20 Q1 FY21 Q2 FY21 Q3 FY21 Q4 FY21 2021 2020 GAAP net income (loss) $ 9,244 $ (2,969) $ (4,104) $ 6,594 $ 9,585 $ 9,106 $ 59,672 Add back (deduct): Acquisition deal costs — — — — 3,951 3,951 — Non-cash pension settlement expense — 2,722 16,324 — — 19,046 — Factory closures 1,621 2,256 747 469 306 3,778 4,709 Business realignment costs 1,755 821 — 237 412 1,470 2,831 Insurance recovery legal costs 160 141 88 — — 229 585 Loss on sales of businesses — — — — — — 176 Insurance settlement (15) — — — — — (382) Gain on sale of building — — (2,638) — — (2,638) — Normalize tax rate to 22%(1) 1,050 (1,405) (2,327) (1,126) (2,074) (6,931) (1,232) Non-GAAP adjusted net income $ 13,815 $ 1,566 $ 8,090 $ 6,174 $ 12,180 $ 28,011 $ 66,359 Average diluted shares outstanding 23,938 23,922 24,123 24,201 24,384 24,173 23,855 Diluted income (loss) per share – GAAP $0.39 $(0.12) $(0.17) $0.27 $0.39 $0.38 $2.50 Diluted income per share – Non-GAAP $0.58 $0.07 $0.34 $0.26 $0.50 $1.16 $2.78 (1)Applies normalized tax rate of 22% to GAAP pre-tax income and non-GAAP adjustments above, which are each pre-tax. Adjusted net income and diluted EPS are defined as net income and diluted EPS as reported, adjusted for certain items and at a normalized tax rate. Adjusted net income and diluted EPS are not measures determined in accordance with generally accepted accounting principles in the United States, commonly known as GAAP, and may not be comparable to the measures as used by other companies. Nevertheless, Columbus McKinnon believes that providing non-GAAP information, such as adjusted net income and diluted EPS, is important for investors and other readers of the Company’s financial statements and assists in understanding the comparison of the current quarter’s and current year's net income and diluted EPS to the historical periods' net income and diluted EPS, as well as facilitates a more meaningful comparison of the Company’s net income and diluted EPS to that of other companies.
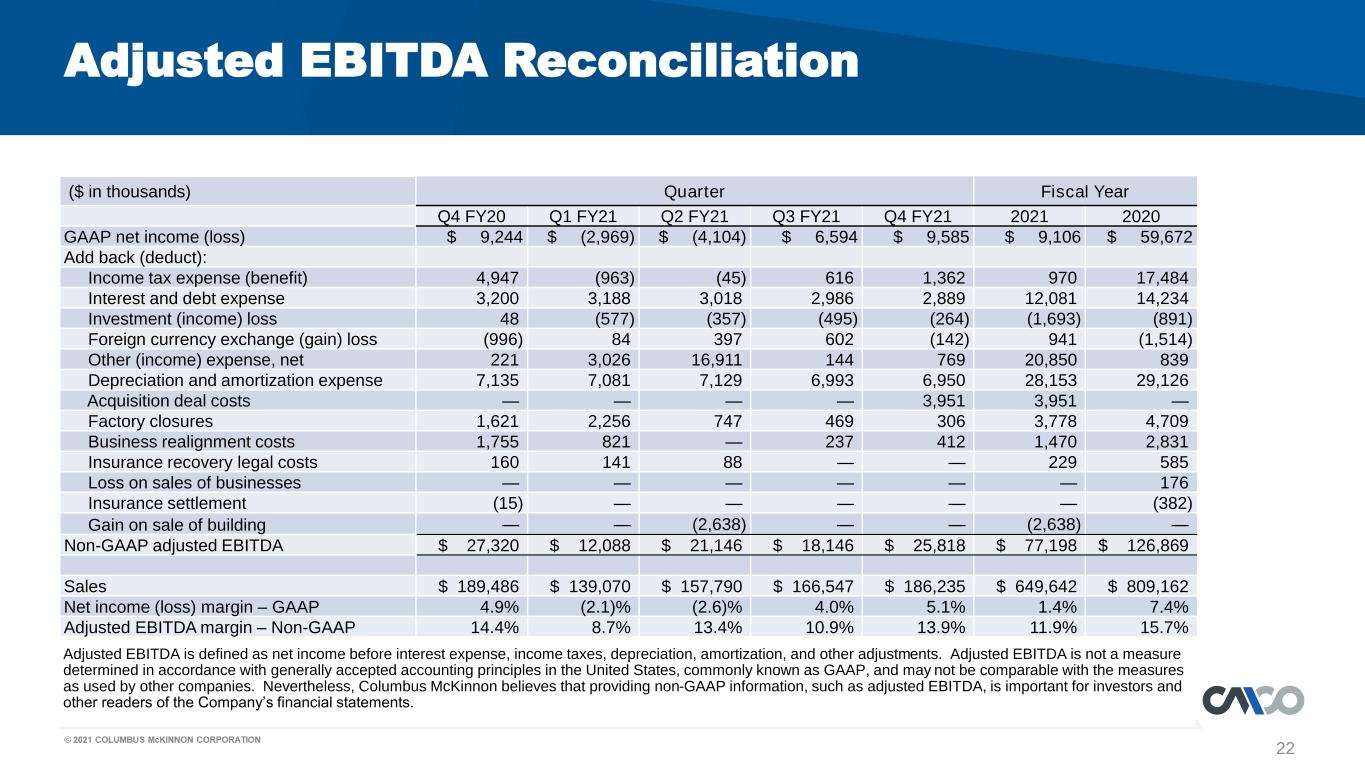
22 Adjusted EBITDA Reconciliation Adjusted EBITDA is defined as net income before interest expense, income taxes, depreciation, amortization, and other adjustments. Adjusted EBITDA is not a measure determined in accordance with generally accepted accounting principles in the United States, commonly known as GAAP, and may not be comparable with the measures as used by other companies. Nevertheless, Columbus McKinnon believes that providing non-GAAP information, such as adjusted EBITDA, is important for investors and other readers of the Company’s financial statements. ($ in thousands) Quarter Fiscal Year Q4 FY20 Q1 FY21 Q2 FY21 Q3 FY21 Q4 FY21 2021 2020 GAAP net income (loss) $ 9,244 $ (2,969) $ (4,104) $ 6,594 $ 9,585 $ 9,106 $ 59,672 Add back (deduct): Income tax expense (benefit) 4,947 (963) (45) 616 1,362 970 17,484 Interest and debt expense 3,200 3,188 3,018 2,986 2,889 12,081 14,234 Investment (income) loss 48 (577) (357) (495) (264) (1,693) (891) Foreign currency exchange (gain) loss (996) 84 397 602 (142) 941 (1,514) Other (income) expense, net 221 3,026 16,911 144 769 20,850 839 Depreciation and amortization expense 7,135 7,081 7,129 6,993 6,950 28,153 29,126 Acquisition deal costs — — — — 3,951 3,951 — Factory closures 1,621 2,256 747 469 306 3,778 4,709 Business realignment costs 1,755 821 — 237 412 1,470 2,831 Insurance recovery legal costs 160 141 88 — — 229 585 Loss on sales of businesses — — — — — — 176 Insurance settlement (15) — — — — — (382) Gain on sale of building — — (2,638) — — (2,638) — Non-GAAP adjusted EBITDA $ 27,320 $ 12,088 $ 21,146 $ 18,146 $ 25,818 $ 77,198 $ 126,869 Sales $ 189,486 $ 139,070 $ 157,790 $ 166,547 $ 186,235 $ 649,642 $ 809,162 Net income (loss) margin – GAAP 4.9% (2.1)% (2.6)% 4.0% 5.1% 1.4% 7.4% Adjusted EBITDA margin – Non-GAAP 14.4% 8.7% 13.4% 10.9% 13.9% 11.9% 15.7%
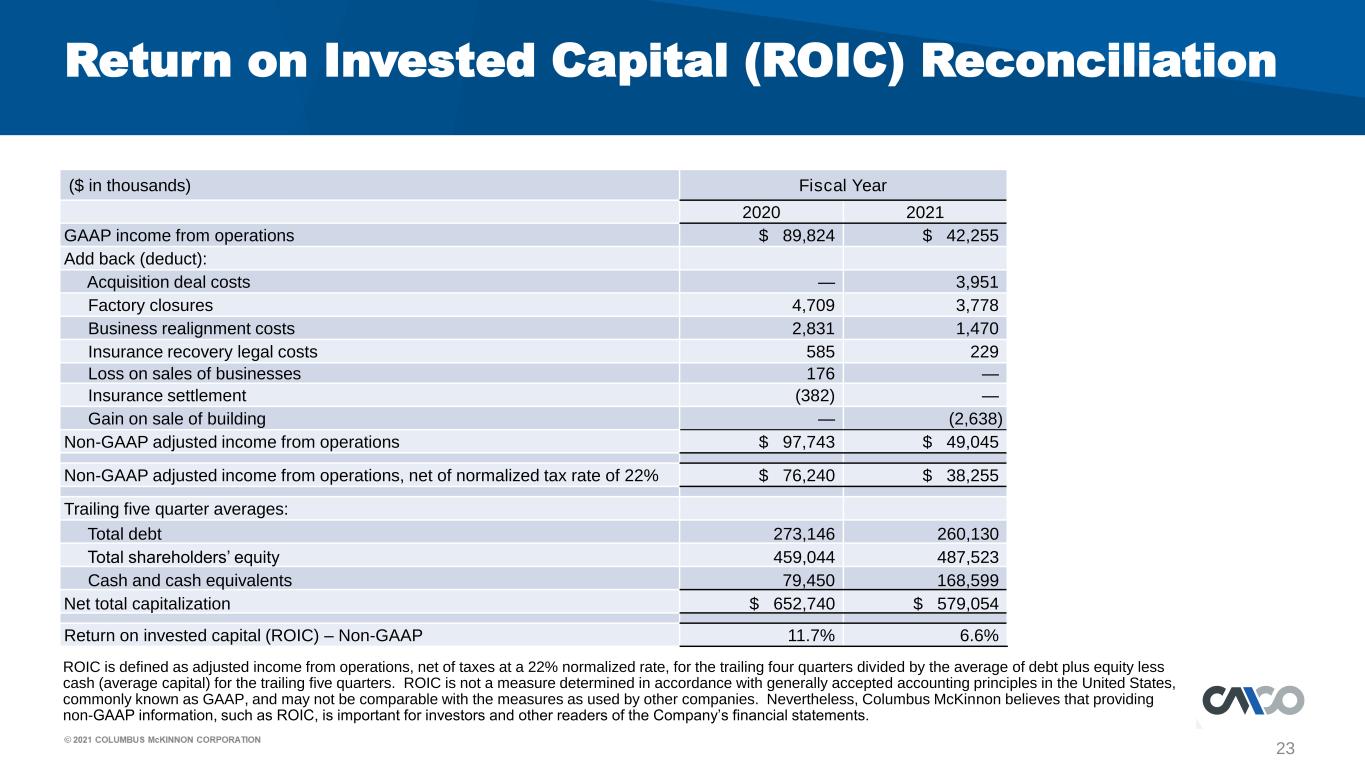
23 Return on Invested Capital (ROIC) Reconciliation ROIC is defined as adjusted income from operations, net of taxes at a 22% normalized rate, for the trailing four quarters divided by the average of debt plus equity less cash (average capital) for the trailing five quarters. ROIC is not a measure determined in accordance with generally accepted accounting principles in the United States, commonly known as GAAP, and may not be comparable with the measures as used by other companies. Nevertheless, Columbus McKinnon believes that providing non-GAAP information, such as ROIC, is important for investors and other readers of the Company’s financial statements. ($ in thousands) Fiscal Year 2020 2021 GAAP income from operations $ 89,824 $ 42,255 Add back (deduct): Acquisition deal costs — 3,951 Factory closures 4,709 3,778 Business realignment costs 2,831 1,470 Insurance recovery legal costs 585 229 Loss on sales of businesses 176 — Insurance settlement (382) — Gain on sale of building — (2,638) Non-GAAP adjusted income from operations $ 97,743 $ 49,045 Non-GAAP adjusted income from operations, net of normalized tax rate of 22% $ 76,240 $ 38,255 Trailing five quarter averages: Total debt 273,146 260,130 Total shareholders’ equity 459,044 487,523 Cash and cash equivalents 79,450 168,599 Net total capitalization $ 652,740 $ 579,054 Return on invested capital (ROIC) – Non-GAAP 11.7% 6.6%
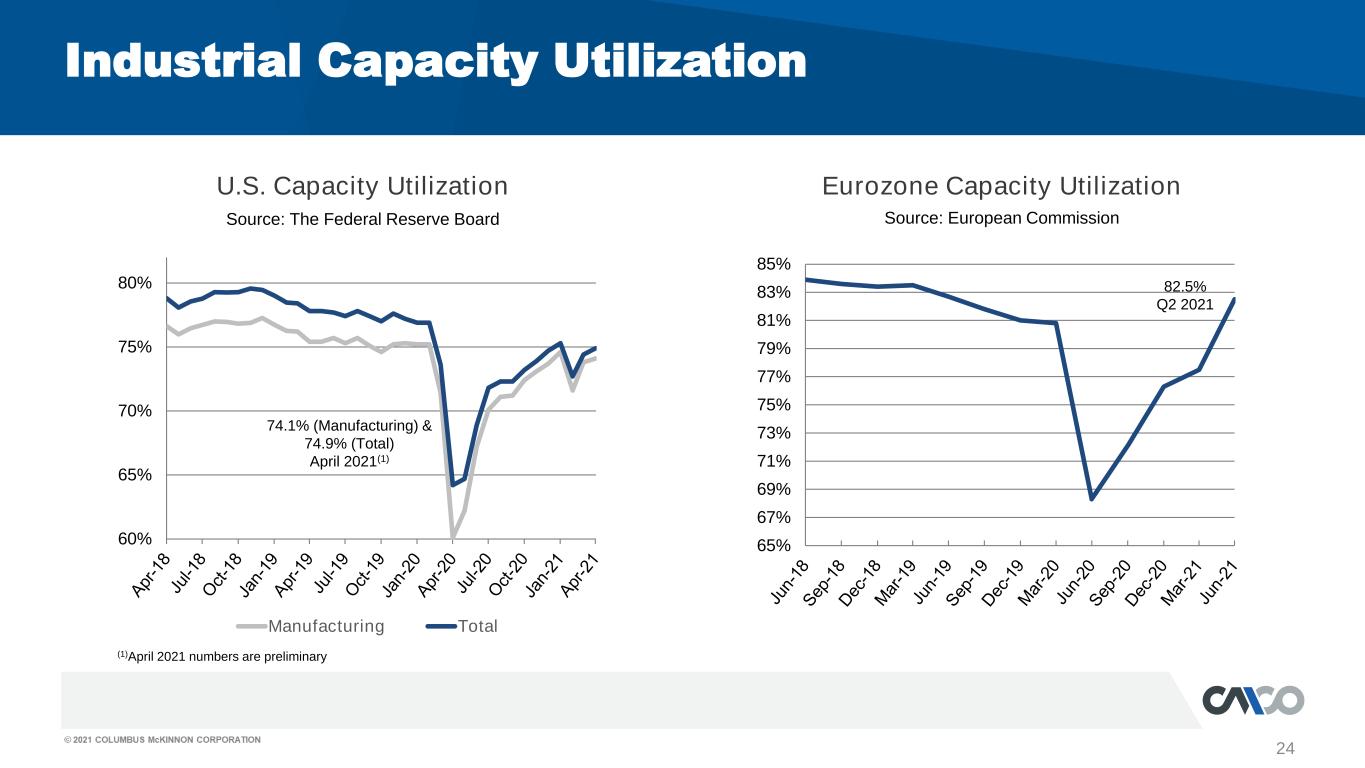
24 U.S. Capacity Utilization Eurozone Capacity Utilization Industrial Capacity Utilization Source: The Federal Reserve Board Source: European Commission 60% 65% 70% 75% 80% Manufacturing Total 74.1% (Manufacturing) & 74.9% (Total) April 2021(1) 65% 67% 69% 71% 73% 75% 77% 79% 81% 83% 85% 82.5% Q2 2021 (1)April 2021 numbers are preliminary
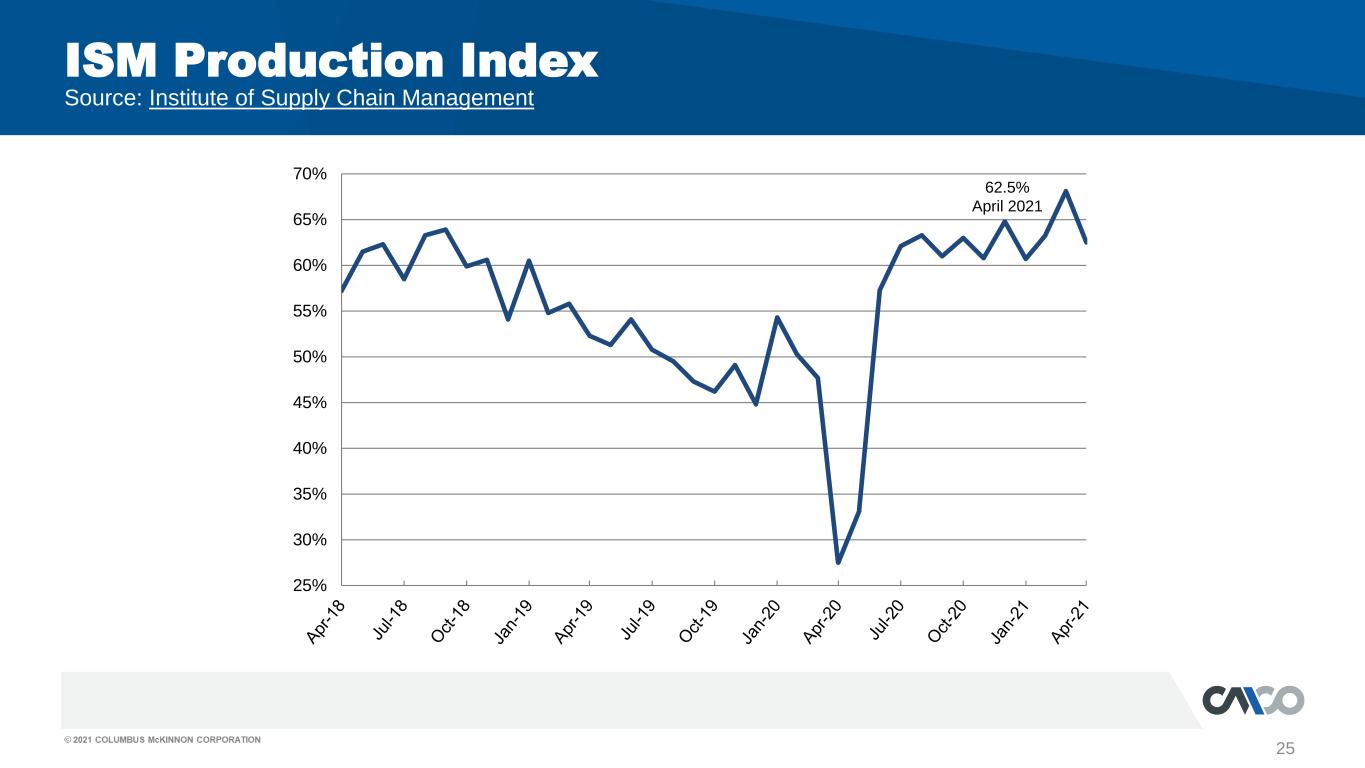
25 ISM Production Index Source: Institute of Supply Chain Management 25% 30% 35% 40% 45% 50% 55% 60% 65% 70% 62.5% April 2021
Q4 Fiscal Year 2021 Financial Results Conference Call May 26, 2021