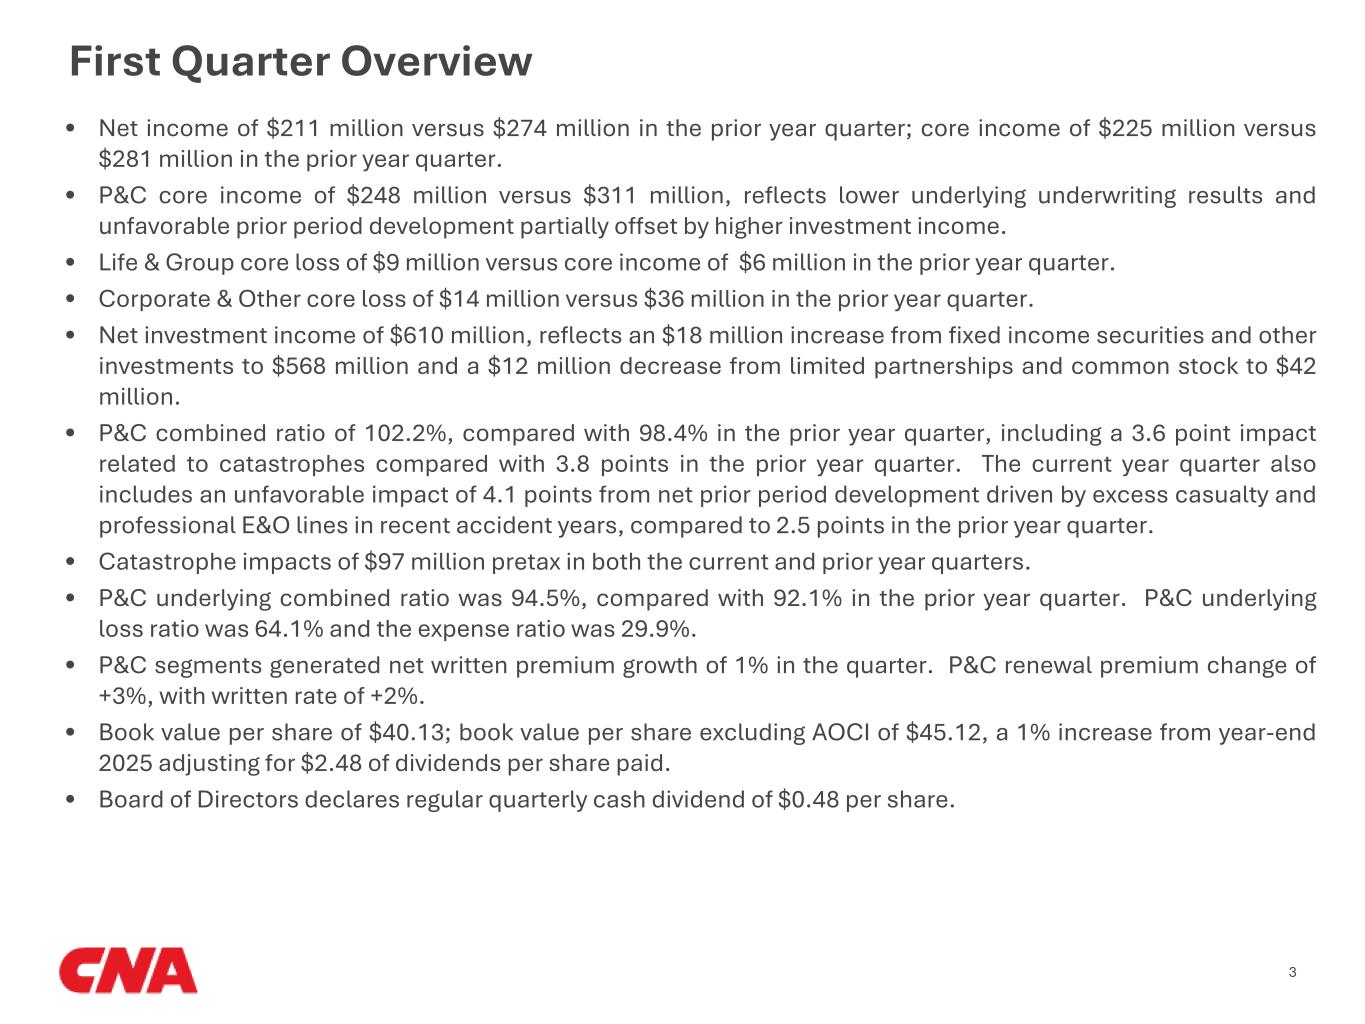
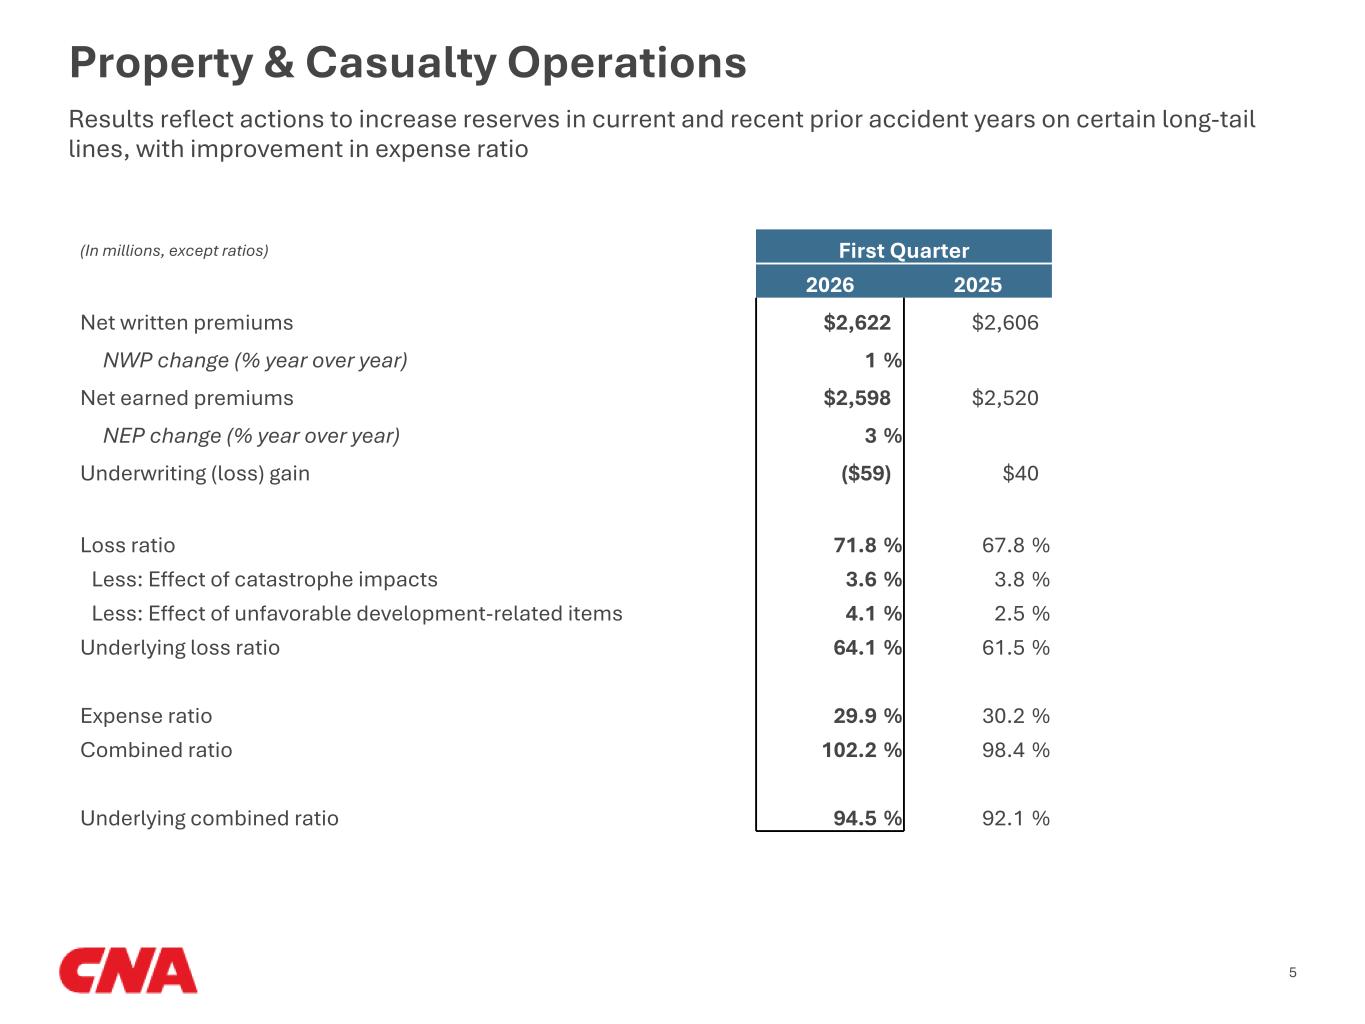
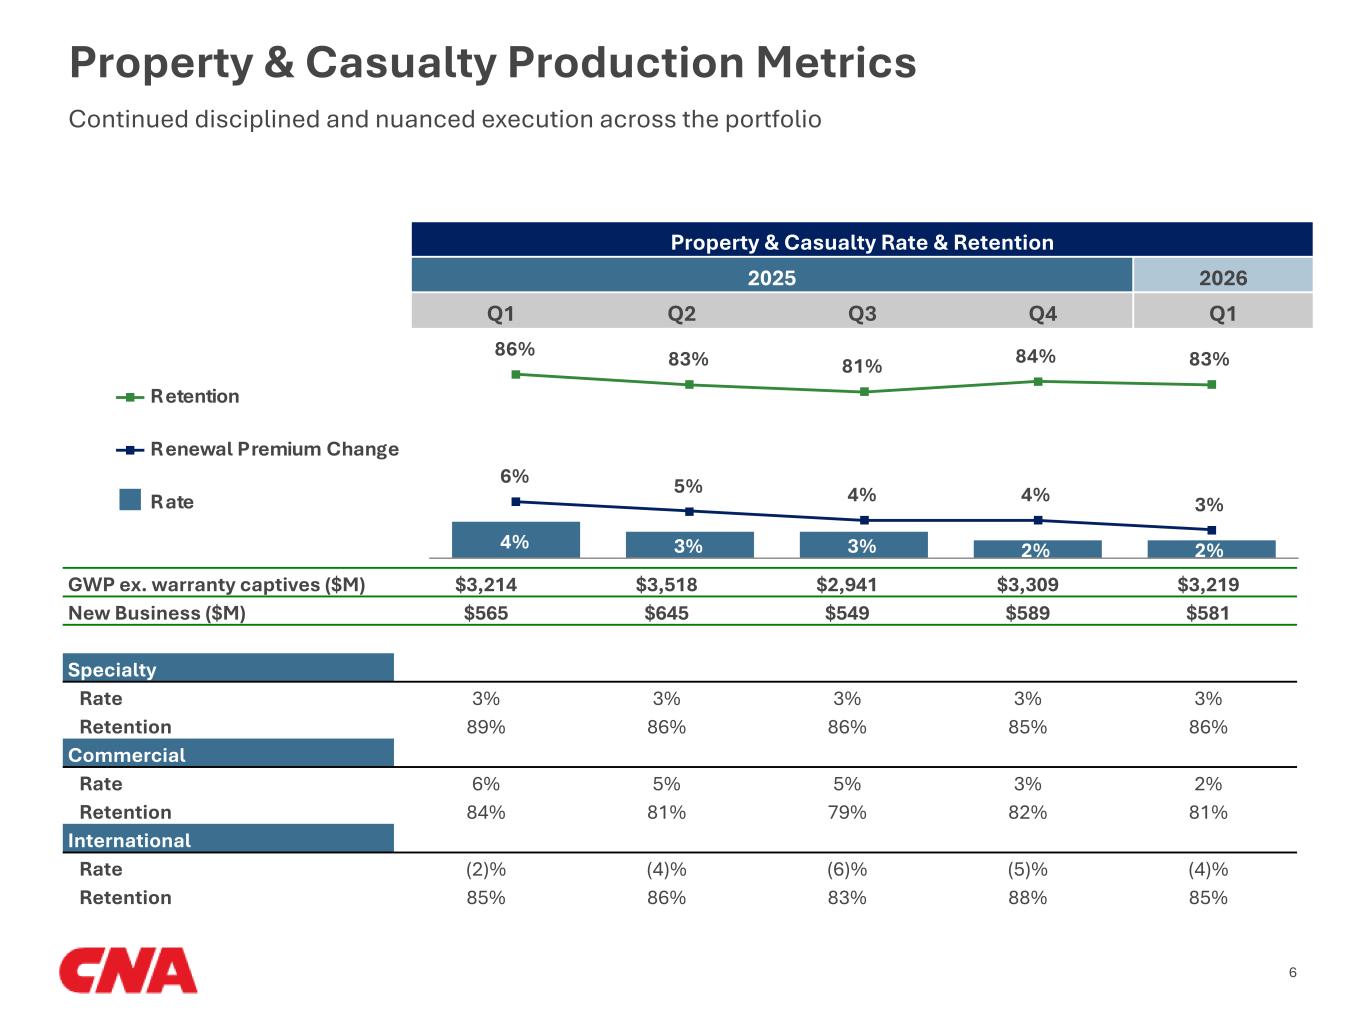
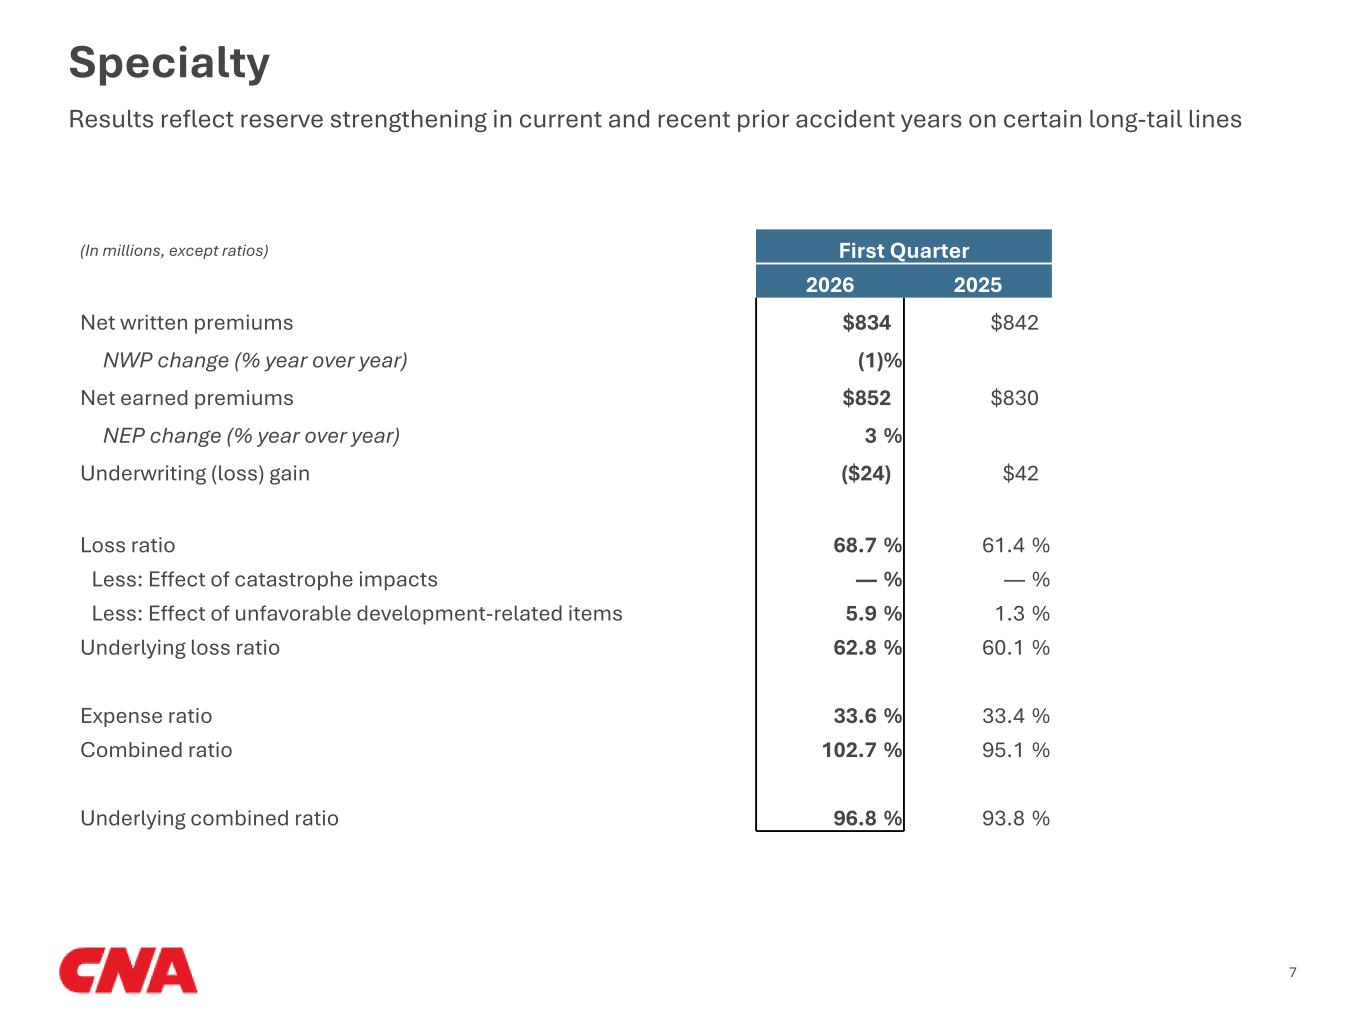
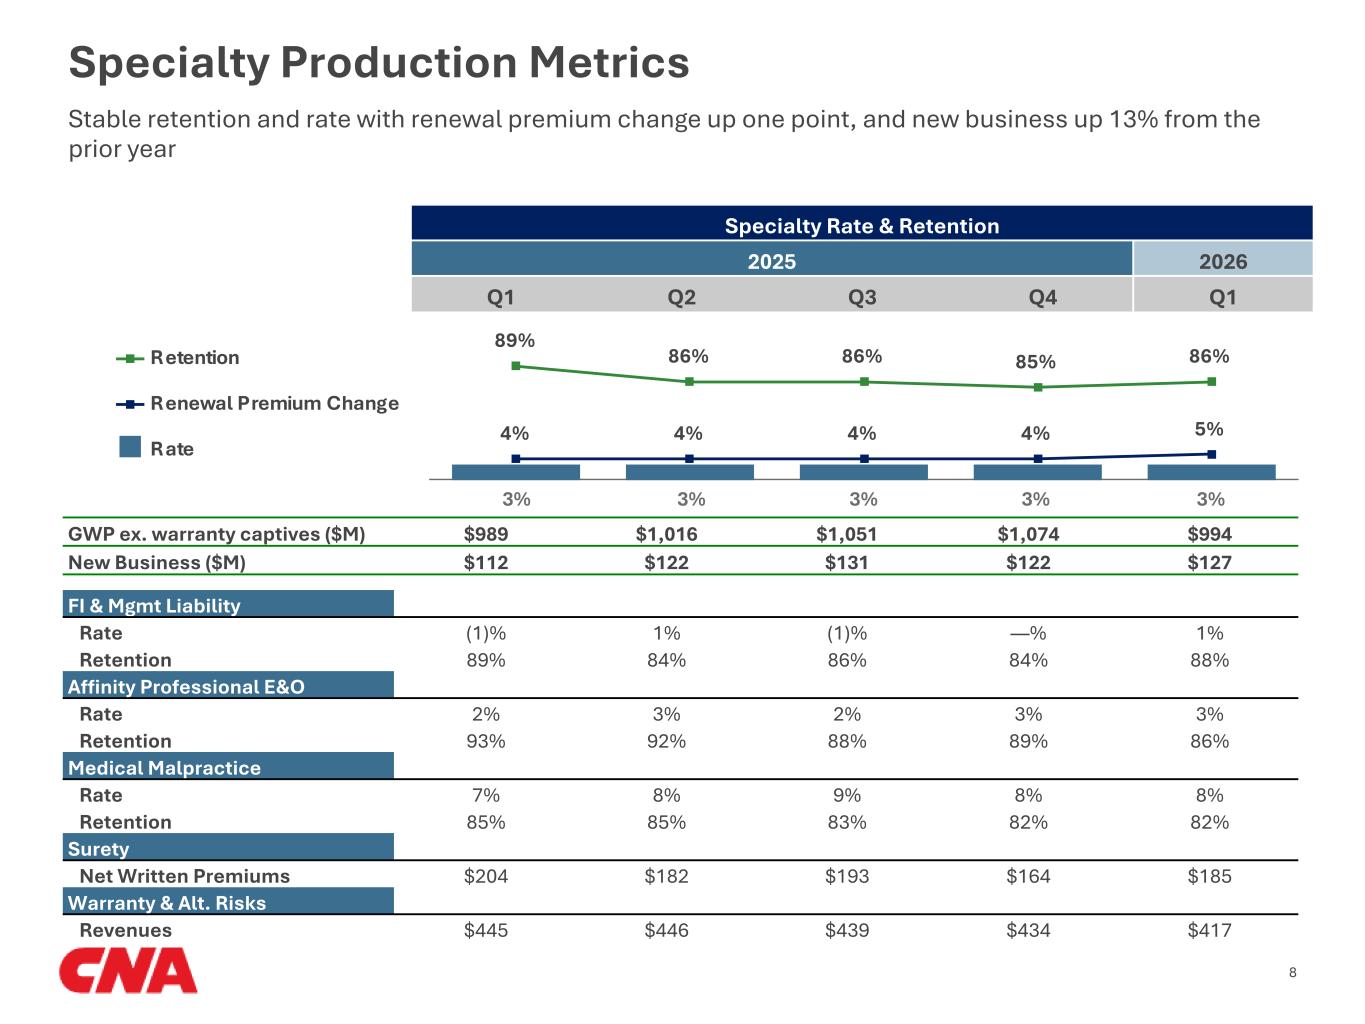
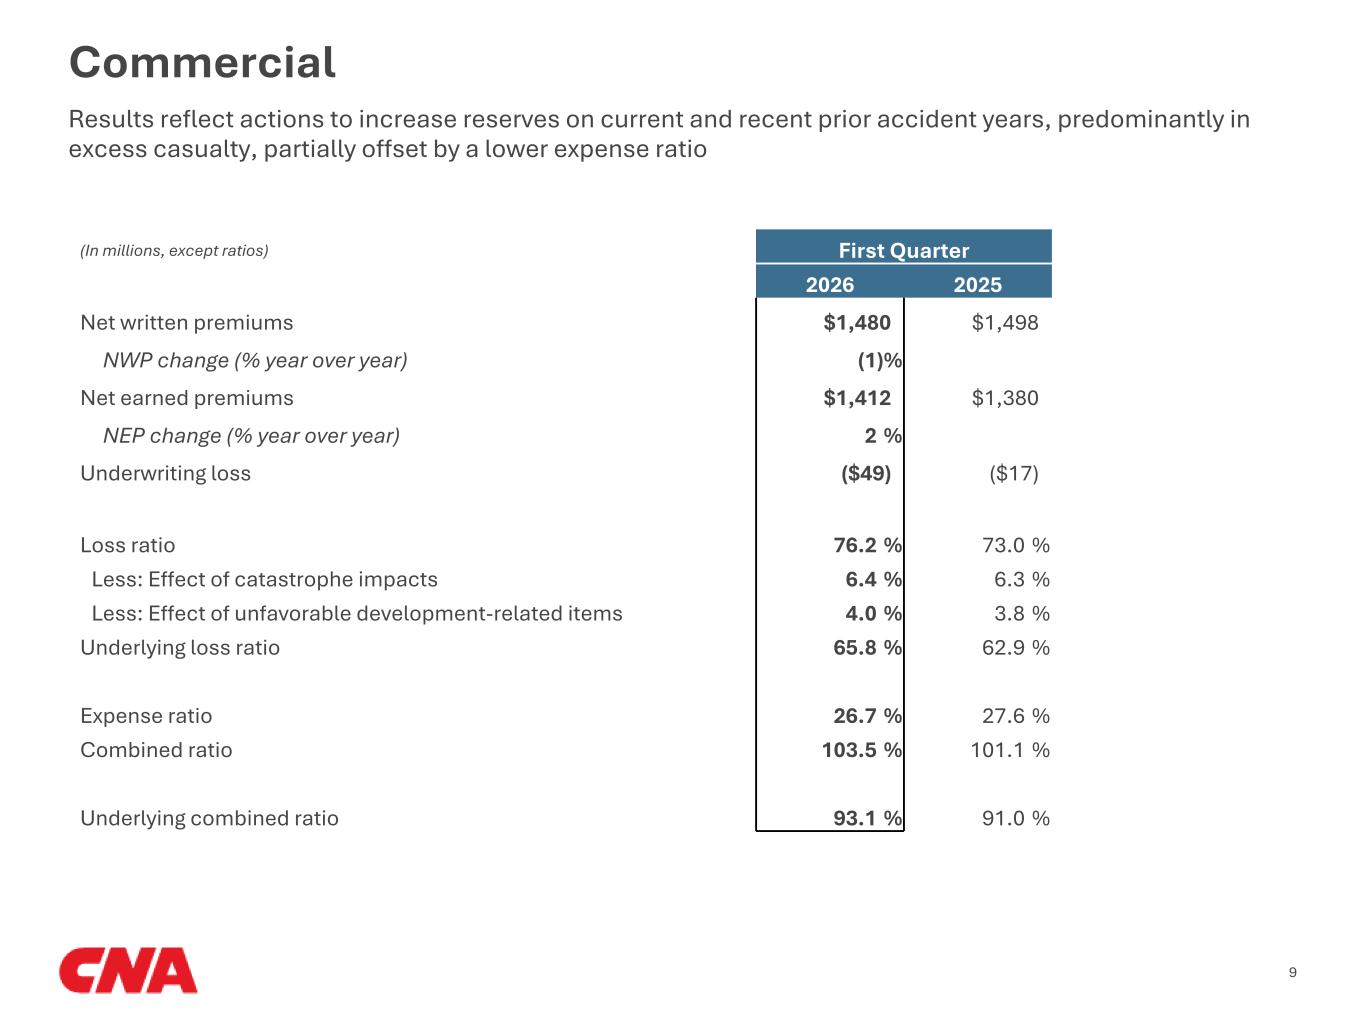
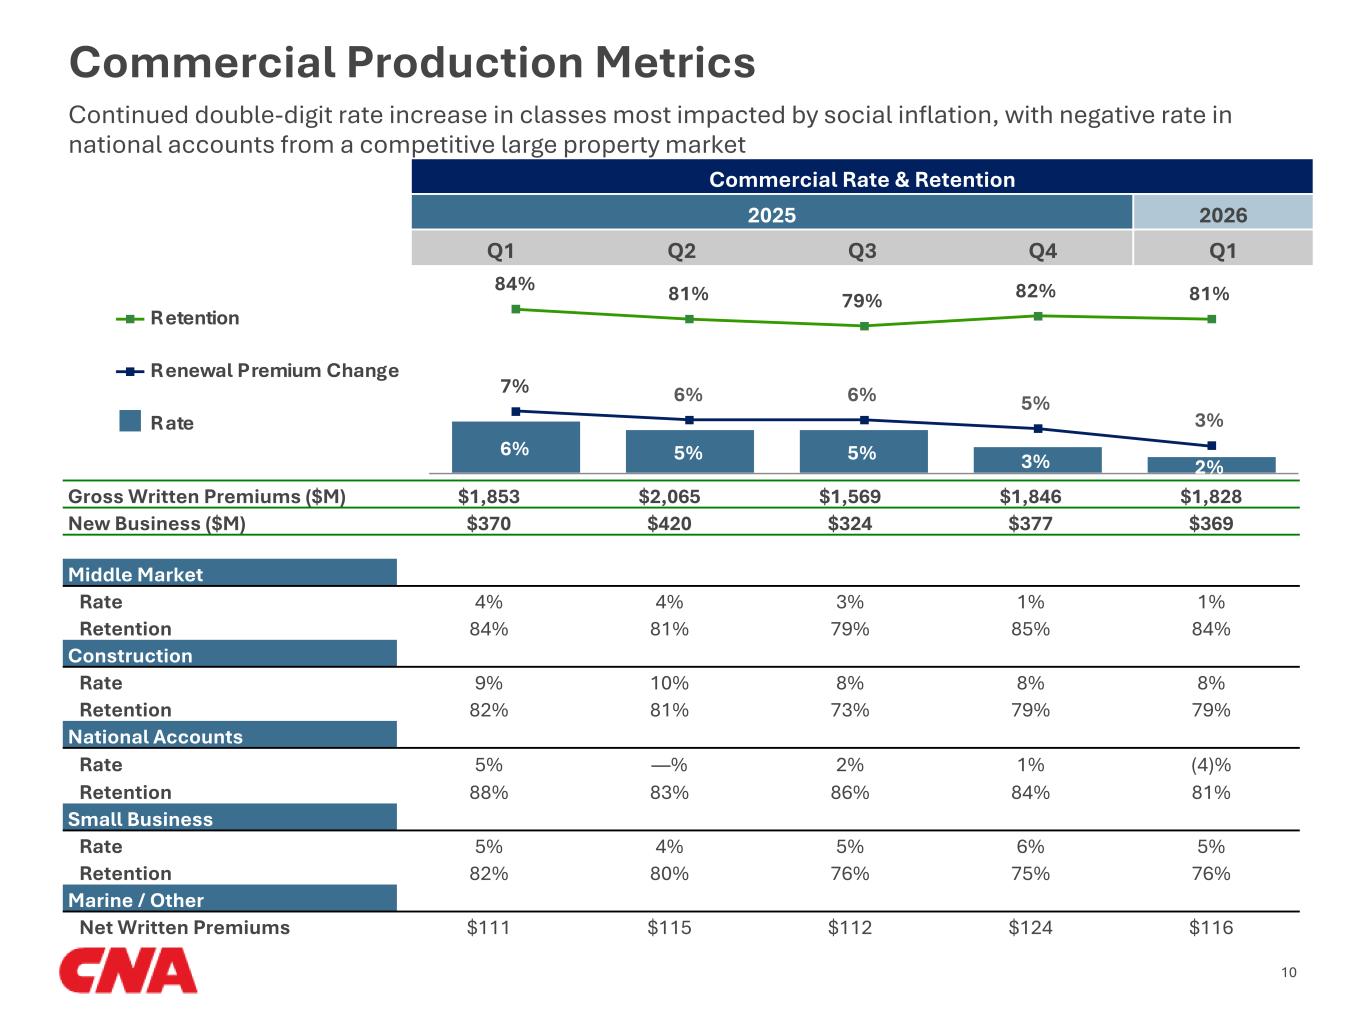
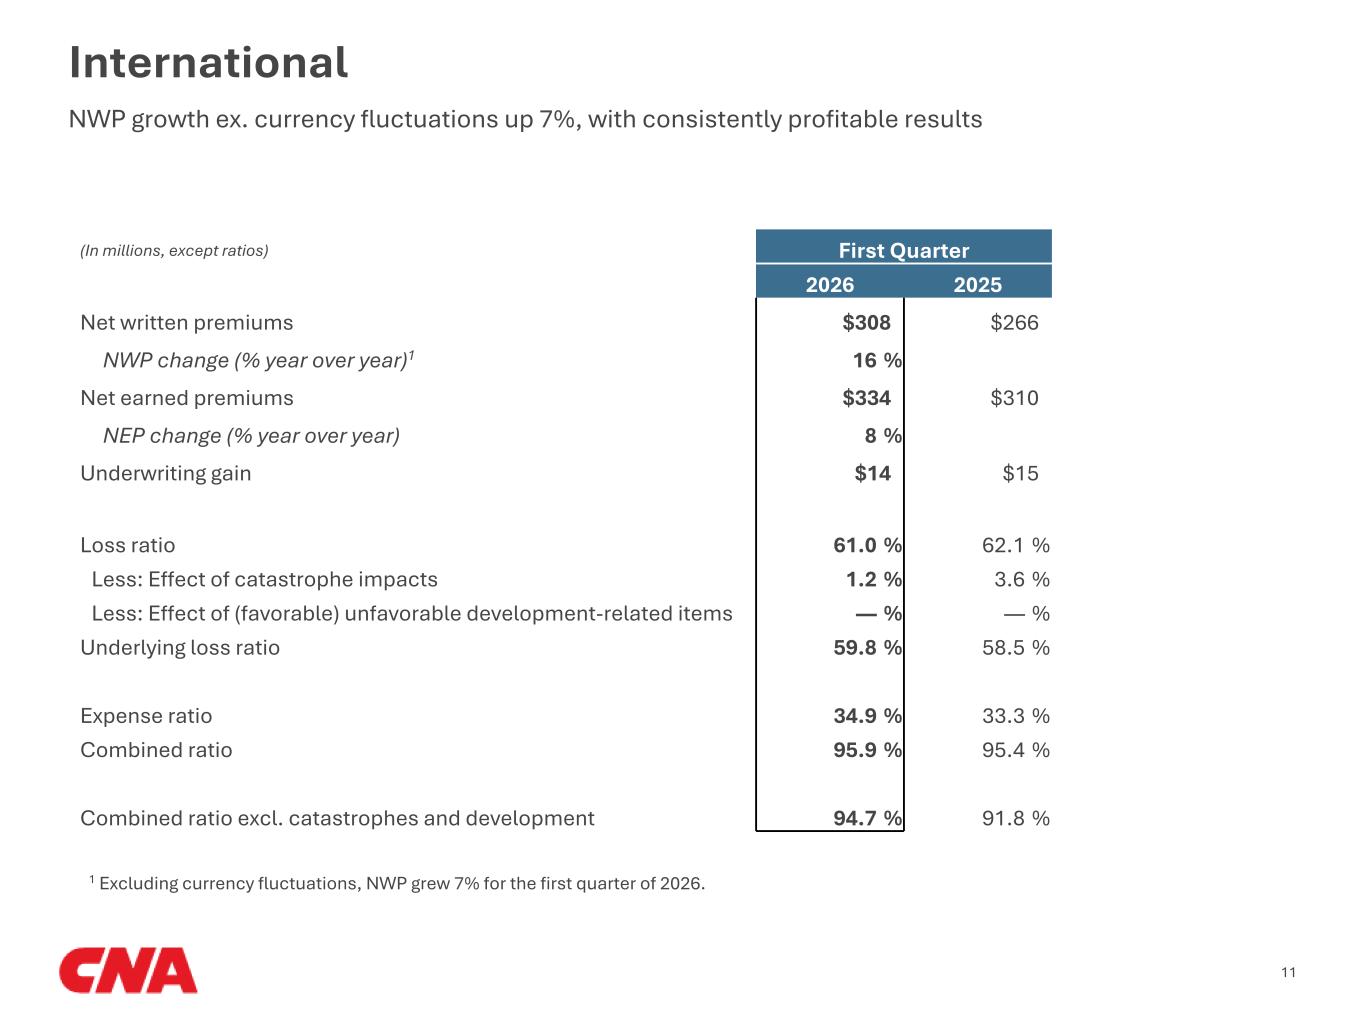
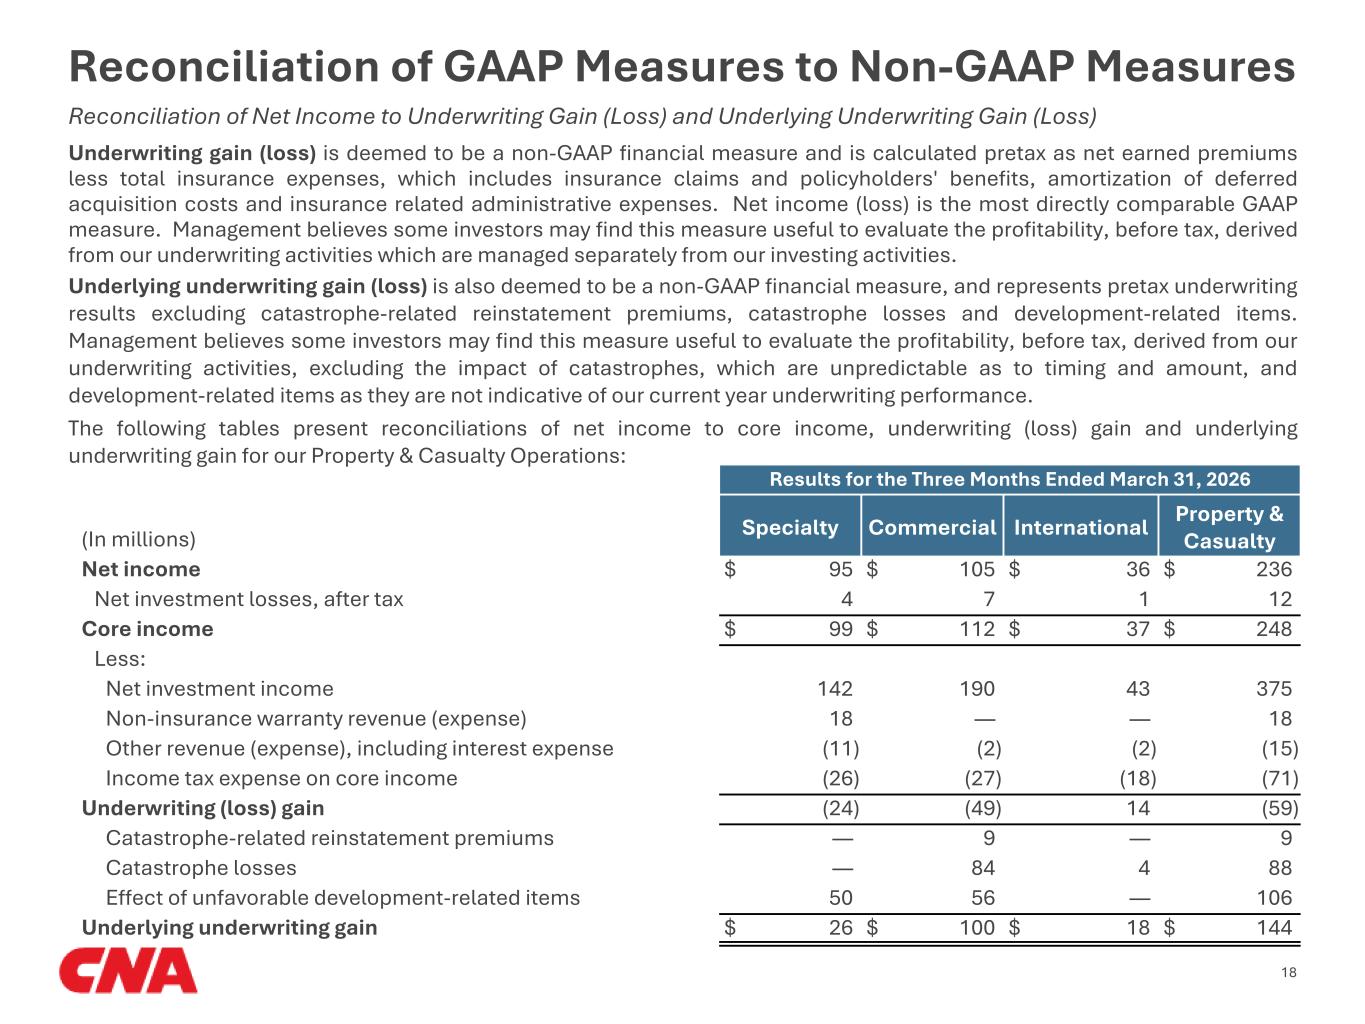
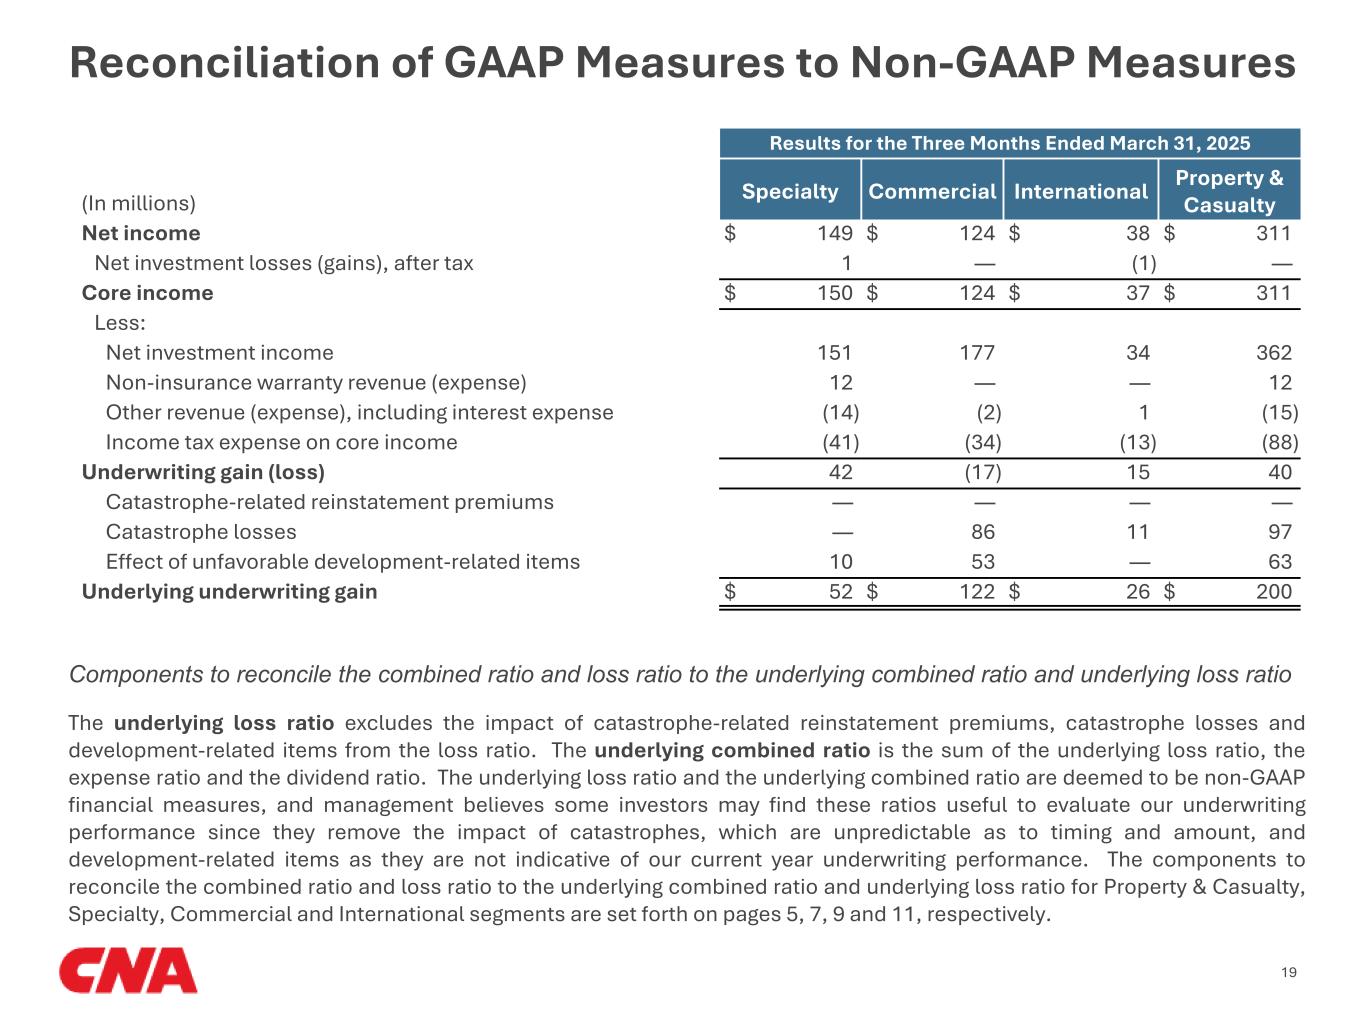
The transcript was presubmitted by CNA Financial Corporation. No live call was conducted for the first quarter earnings call. In the first quarter we continued to successfully drive our underwriting strategies to generate consistently profitable returns as we navigate this challenging market. The fundamentals of our business remain strong as we execute specialized and deliberate strategies to achieve profitable growth. We grew certain pockets of our portfolio that offer accretive returns and scaled back in other areas where the market can't earn an acceptable return. We took prudent actions this quarter to strengthen both our prior accident year reserves as well as our current accident year loss ratio. Catastrophe impacts in the quarter were consistent with our five-year average. Core income was $225 million in the first quarter, with net investment income of $610 million which was up slightly compared with the prior year quarter. Higher earnings from the fixed income portfolio were modestly offset by a market decline in common stocks. The P&C all-in combined ratio was 102.2% in the quarter, including 3.6 points or $97 million of catastrophe impacts, which was consistent with the prior year quarter. Catastrophe impacts were driven by severe convective storms, more than half of which were driven by a significant winter storm in January and a severe hail event in March. Prior period development for P&C overall was unfavorable by $106 million, or 4.1 points of the combined ratio, and was driven by reserve strengthening primarily in recent accident years in our excess casualty and affinity professional errors and omissions (E&O) classes. The P&C underlying combined ratio was 94.5%, up 2.4 points compared to the prior year quarter. The expense ratio was 29.9%, down 0.3 points from the prior year, while the P&C underlying loss ratio was 64.1%, up 2.6 points from the prior year quarter. The higher underlying loss ratio reflects our belief that a higher degree of conservatism in our loss pick is appropriate given the continuation of uncertainties around longer-tailed classes of business. Further, across the P&C portfolio in aggregate, earned rate has been trailing our estimate of loss cost trend. This dynamic puts upward pressure on the underlying loss ratio of a stable portfolio, all else equal. We have implemented targeted underwriting actions to address the underlying headwinds, but these actions will take time to translate into results. In light of the current rate and trend dynamics, we believe this conservative approach is appropriate, and we remain focused on sustainable performance. In addition, we increased our loss cost trends modestly, which are now slightly above 7% for the P&C portfolio overall. The increase in loss cost trend was minor and mostly driven by the two classes of business that drove our prior accident year reserve strengthening. We do not anticipate social inflation abating, and the continued impacts of increased attorney involvement and lengthening development patterns have been reflected in our prior accident year reserves and current accident year loss ratio. In the quarter, net written premium growth was 1% in the aggregate, but similar to last quarter there is significant variation by segment and class of business unique to the competitive environment in each area. New business of $581 million was up 3% with similar variation by segment and class. P&C rate change was 2%, consistent with the fourth quarter, and renewal premium change was 3%. In each of our segments, we are growing where we see quality opportunities and being disciplined where we do not, which is a result of the current competitive environment and is reflected in our retention levels. Turning to each of the three P&C operating segments, in Commercial, the all-in combined ratio was 103.5% compared to 101.1% in the prior year quarter. Catastrophe impacts were $93 million or 6.4 points on the combined ratio. Unfavorable prior period development of $56 million added 4.0 points to the combined ratio. The loss development in the quarter was wholly driven by excess casualty in the recent accident years where we continue to see the potential for higher claim frequency and severity from the ongoing impacts of social inflation. The underlying combined ratio was 93.1% compared to 91.0% in the prior year quarter. The underlying loss ratio increased to 65.8%, from 63.4% in the fourth quarter and 62.9% in the prior year quarter. This was driven by an increase in our excess casualty underlying loss ratio, reflecting both the trends the industry is experiencing, and substantial additional prudence on our part. Even with the higher excess casualty loss ratio, we continue to believe the margins and opportunities in this class are attractive. In addition to excess casualty, we also increased the workers' compensation loss ratio in the current accident year given the ongoing significant negative rate in that line coupled with our mid-single-digit long-run loss cost trend assumptions. The expense ratio improved by nearly a point to 26.7% and is now below 27% for the third consecutive quarter. In Commercial, net written premium declined 1% and new business growth was flat. Retention in the quarter was 81% with significant variation by business unit and class. The level of net written premium growth varies significantly based on how we are reacting to the current dynamics in the market. For example, net written premium growth was 13% in middle market with new business up 17% as we still see good opportunities there. Within middle market, workers' compensation net written premium was up 22%, as we still see pockets to grow profitably while being more selective in certain geographies and accounts. On the other hand, net written premium declined 14% in national accounts property where we are seeing a significant amount of undisciplined market behavior, and net written premium declined 9% in construction where certain classes and geographies continue to be substantively impacted by social inflation and, as a result, we are executing on underwriting actions in segments of that portfolio. We are cognizant of the fact that the underlying causes of social inflation have not abated and are not benign, and so we are being disciplined in how we transact the business. In areas like national accounts property, there are still pockets where we see rate adequacy and opportunity despite the higher level of competition, but we will not pursue growth at the expense of profit dollars. Rate change was 2% in the quarter, down about a point compared to the fourth quarter. Similar to the growth, rate was also bifurcated, with rates in commercial auto and excess casualty remaining in double-digits, whereas rate was down double-digits in national accounts property. Workers' compensation rates continue to be down low single-digit. Excluding workers' compensation and national accounts property where we see that heightened level of competition, rate was up 7%. For Specialty, the all-in combined ratio was 102.7% compared to 95.1% in the prior year quarter. Prior period development was unfavorable by $50 million or 5.9 points of the combined ratio. The prior period development was driven by reserve strengthening in recent accident years for our affinity professional E&O class where we are reacting to signs of slightly higher severity. The underlying combined ratio was 96.8% compared to 93.8% in the prior year quarter. The underlying loss ratio was 62.8%, up from 60.6% in the fourth quarter and 60.1% in the prior year quarter. Earned rate continues to lag overall long-run loss cost trends, and we have been prudent in reflecting the recent accident year reserve pressure in our underlying loss ratio. As further evidence of our prudent approach, we are not yet reflecting the potential beneficial impact of underwriting strategies and rather waiting to see how it bears out over time. The expense ratio was 33.6% compared to 33.4% in the prior year quarter. In Specialty, net written premium declined 1% in the quarter, heavily influenced by volatility in surety where premiums declined 9%. This is off of a large base that grew 12% in the prior year quarter and reflects fewer jumbo bond opportunities in the quarter. Our construction clients have plenty of backlogged projects but the timing of the start of those projects will result in quarterly premium volatility. Specialty growth excluding surety was up 2%. For Specialty overall, new business was up 13% in the quarter and retention was 86%, fairly consistent with recent quarters. Rate remained consistent this quarter at 3% with renewal premium change up a point to 5%. Rate change has been consistent at 3% for the past five quarters with some variation by class. Rate was up a point to 1% in financial and management liability lines in the aggregate, with the continuation of low to mid-single digit rates in public company directors and officers (D&O) and cyber. Rate remained strong in healthcare at 8% and stable in affinity business at 3%. For International, the all-in combined ratio was 95.9% with 1.2 points of catastrophe losses. The underlying combined ratio was 94.7%. The underlying loss ratio was 59.8% compared to 58.5% in the prior year quarter. The increase in the underlying loss ratio was due to the continued soft market conditions across the segment. The expense ratio was 34.9% compared to 33.3% in the prior year quarter. International net written premium grew 16% in the quarter, or 7% excluding currency fluctuation. New business grew 2% in the quarter and retention was 85%. Rates were down 4% in the quarter as the environment continues to be highly competitive. Despite this heightened level of competition, we continue to find excellent opportunities in Canada, Continental Europe and the U.K. regions that are still at strong levels of rate adequacy in specific lines and geographies.
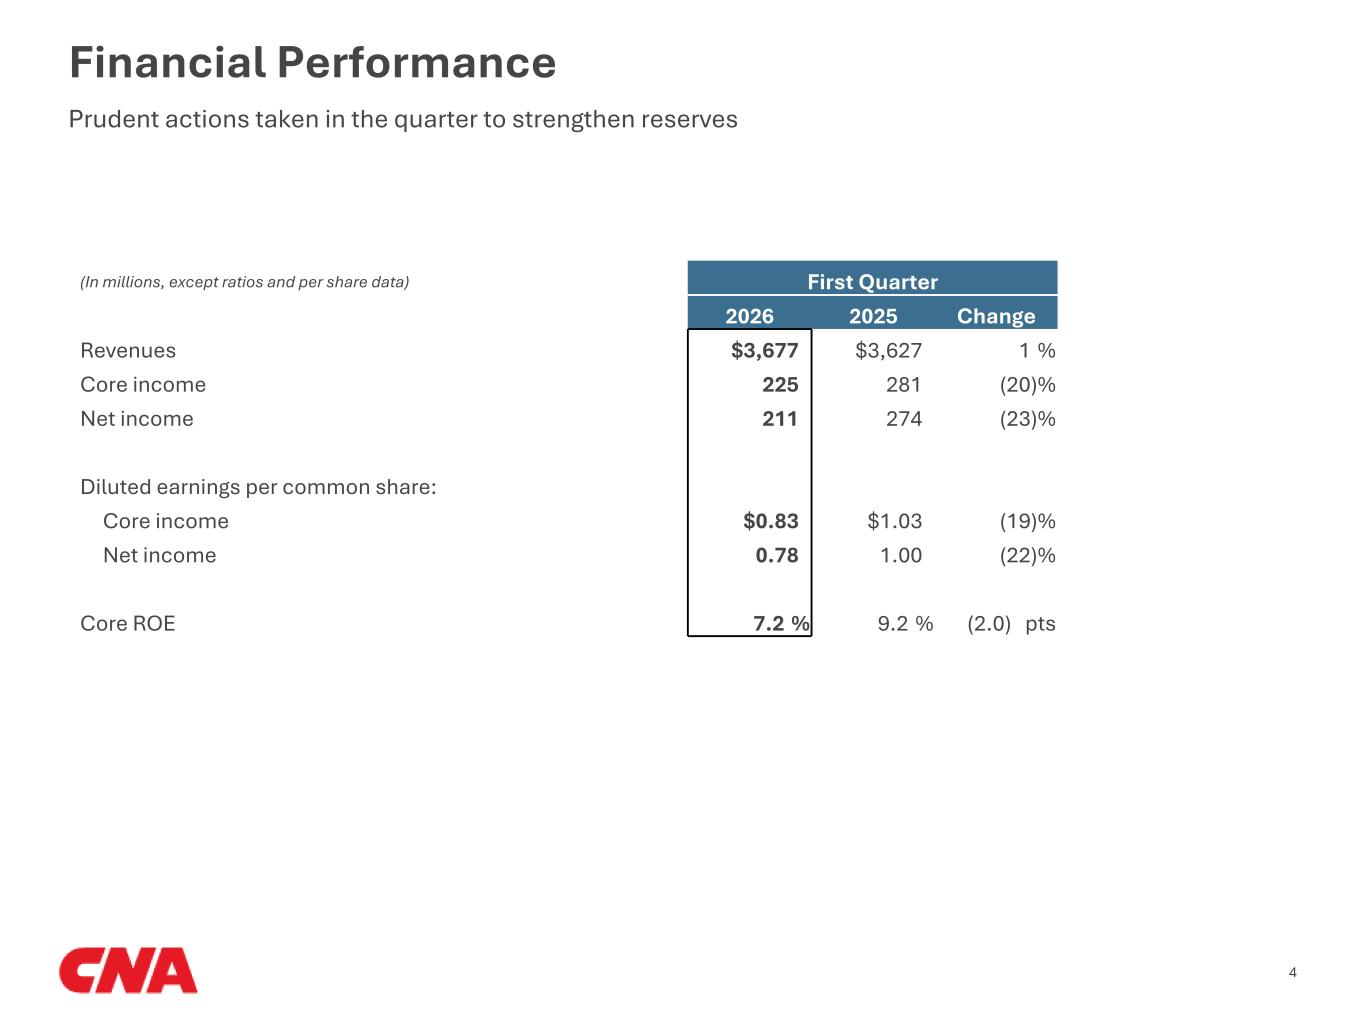
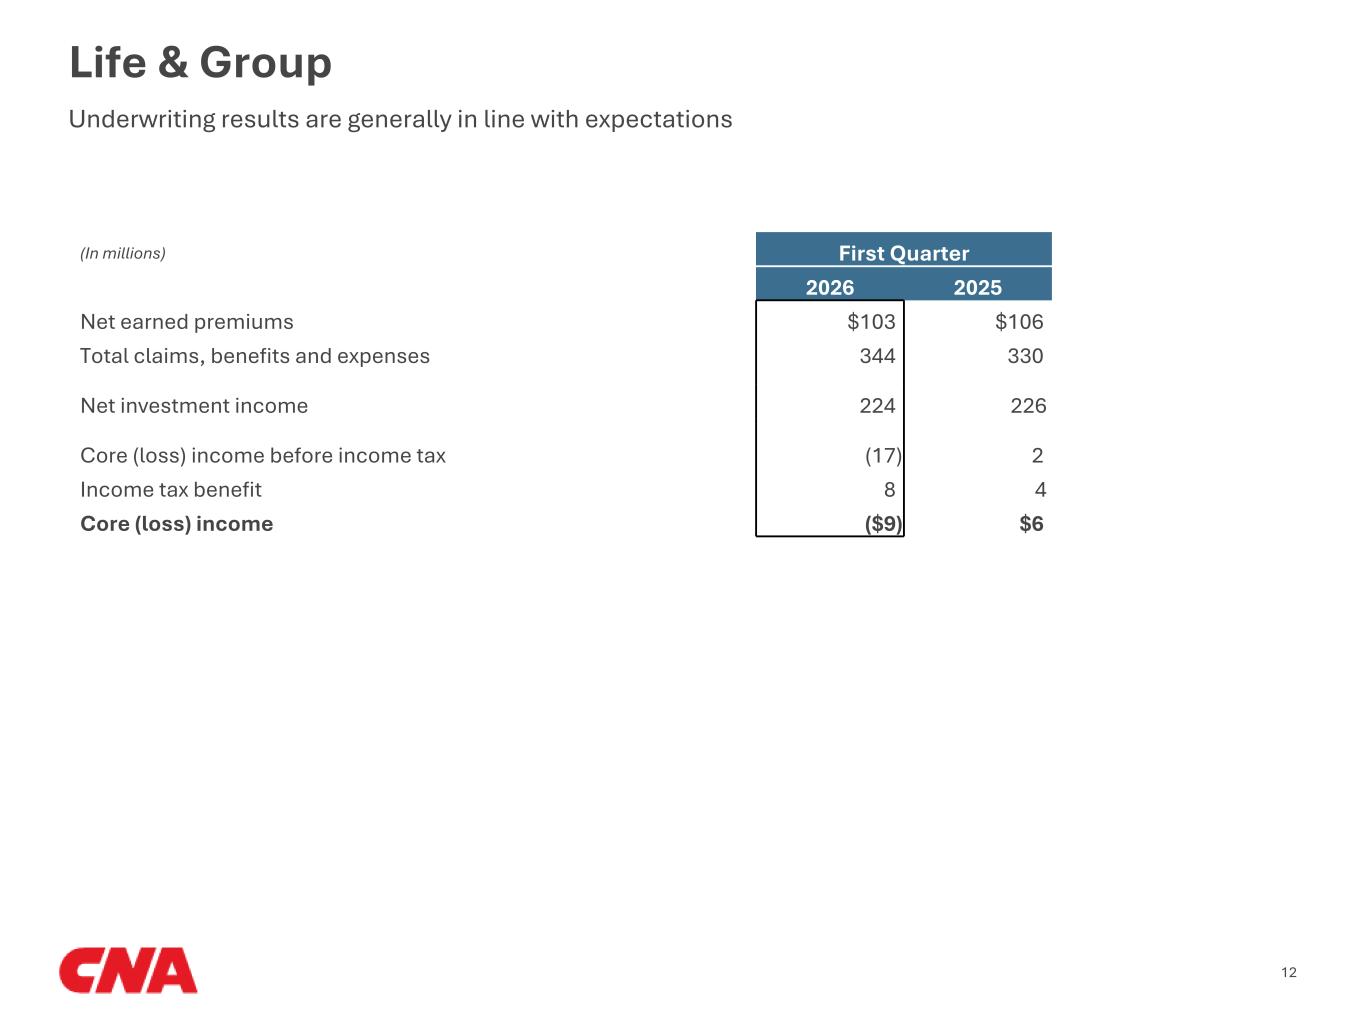
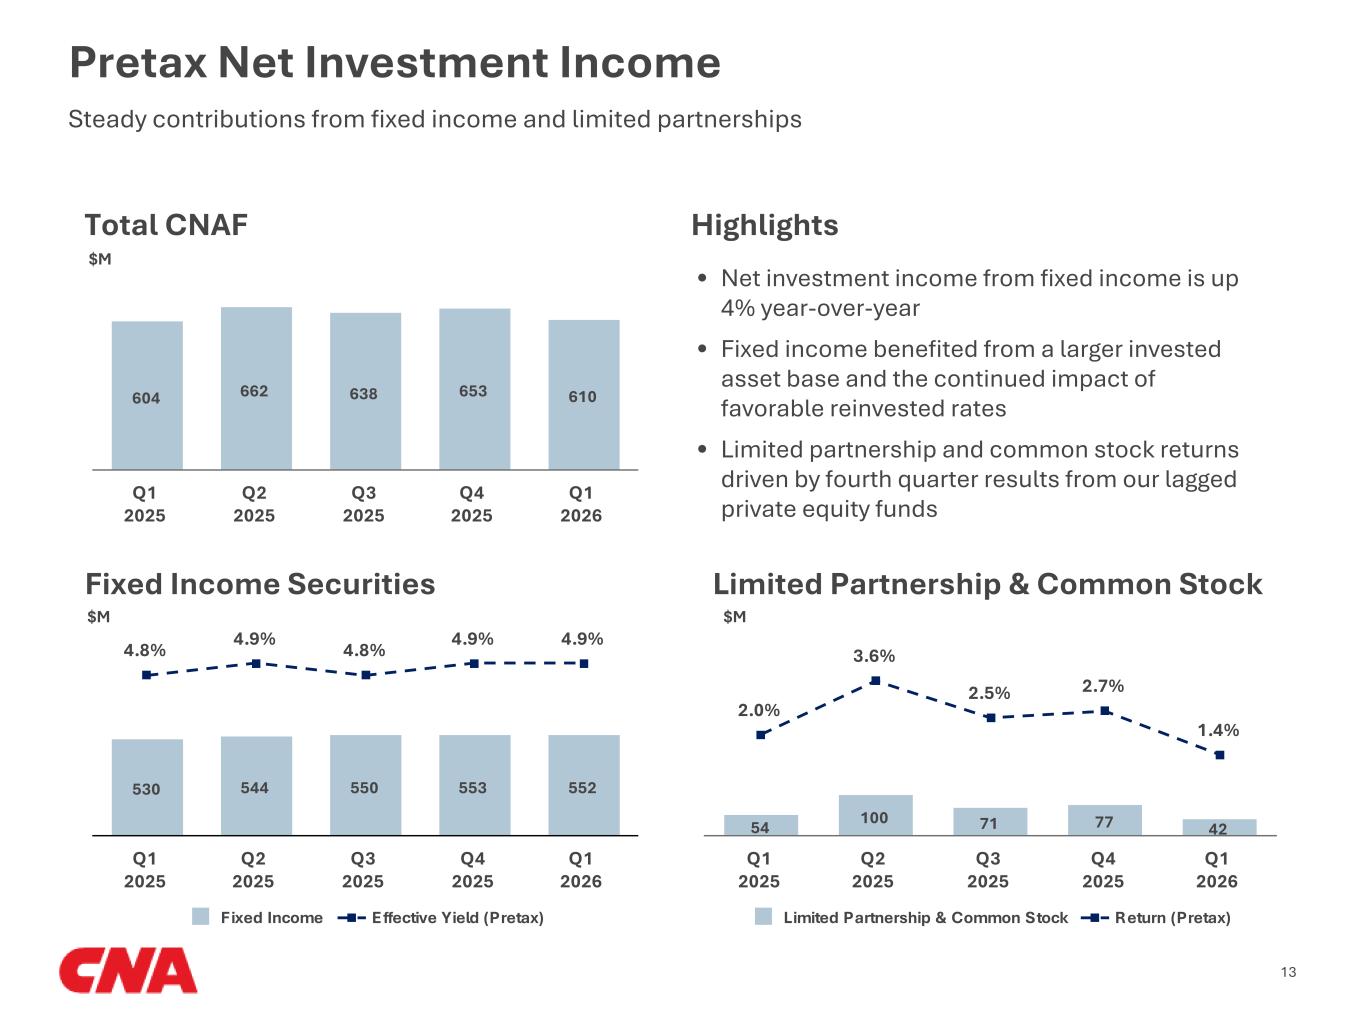
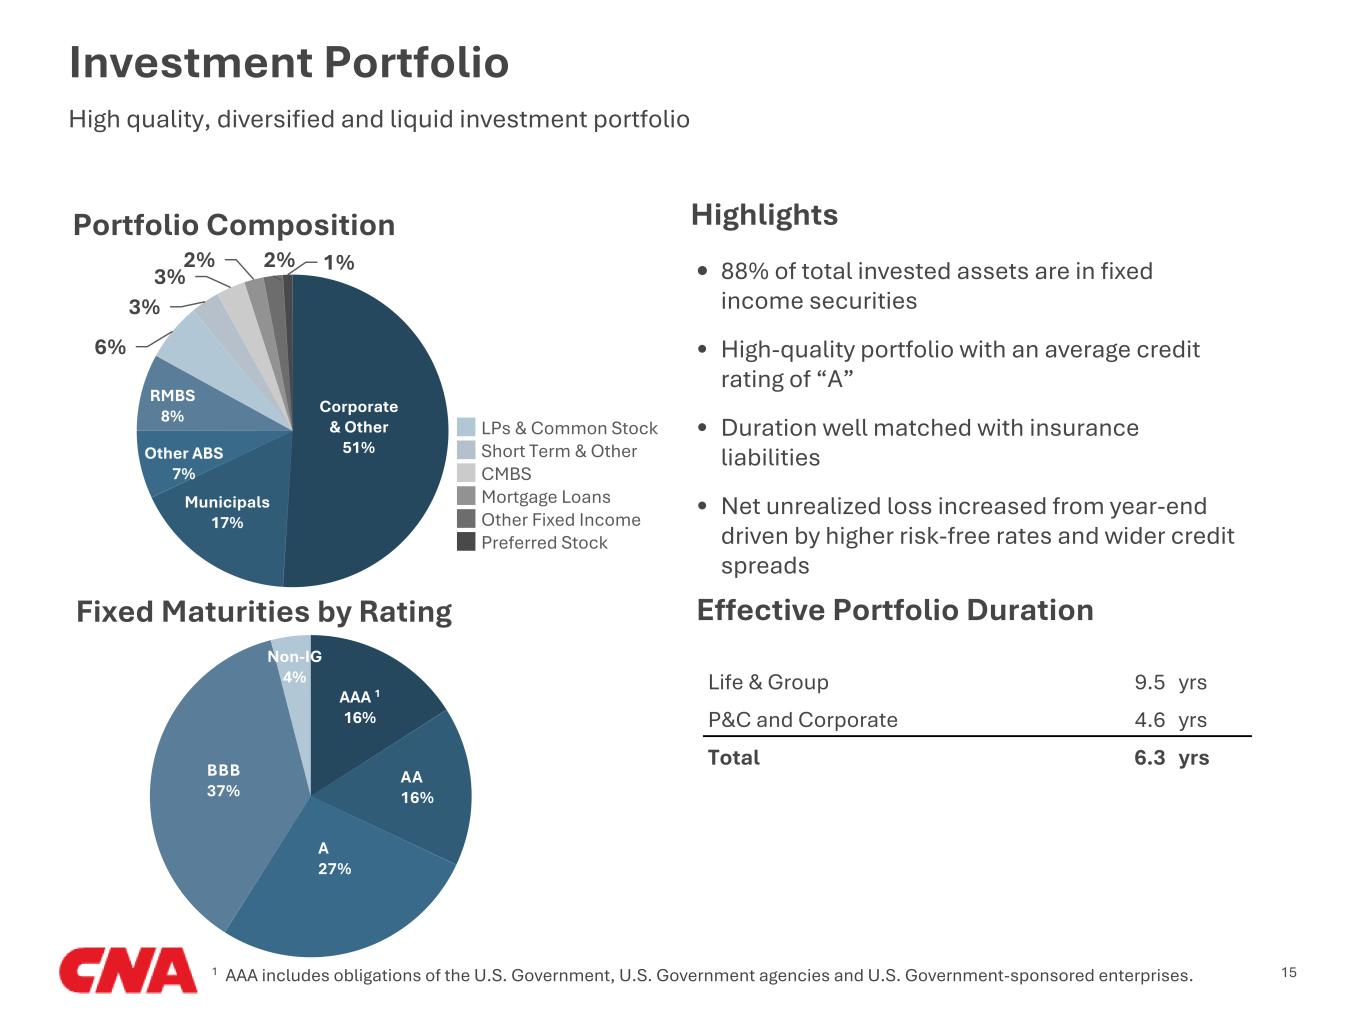
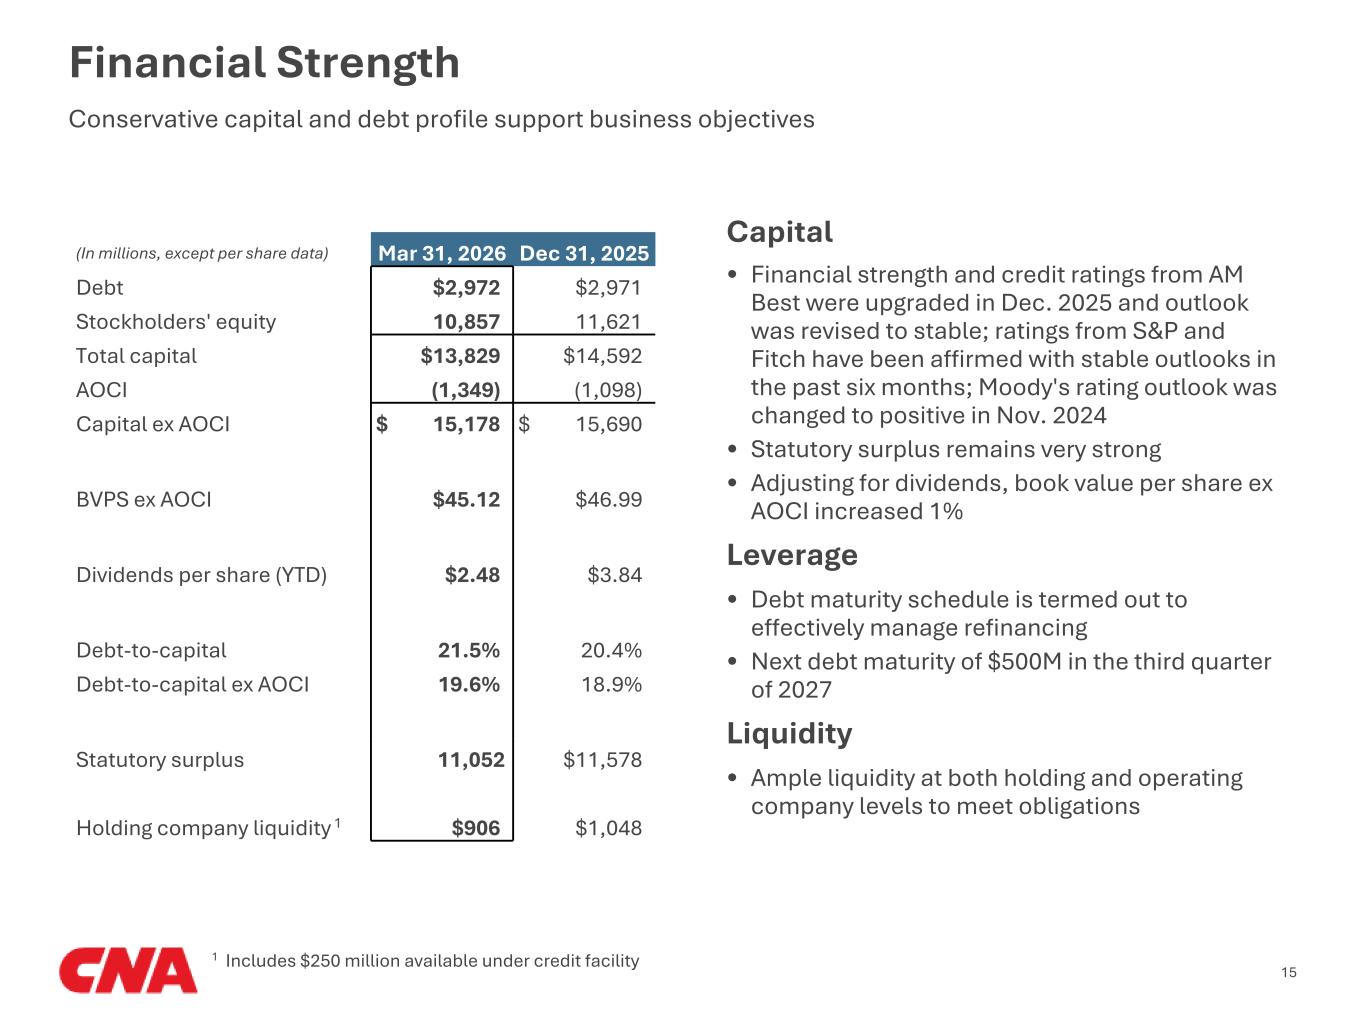
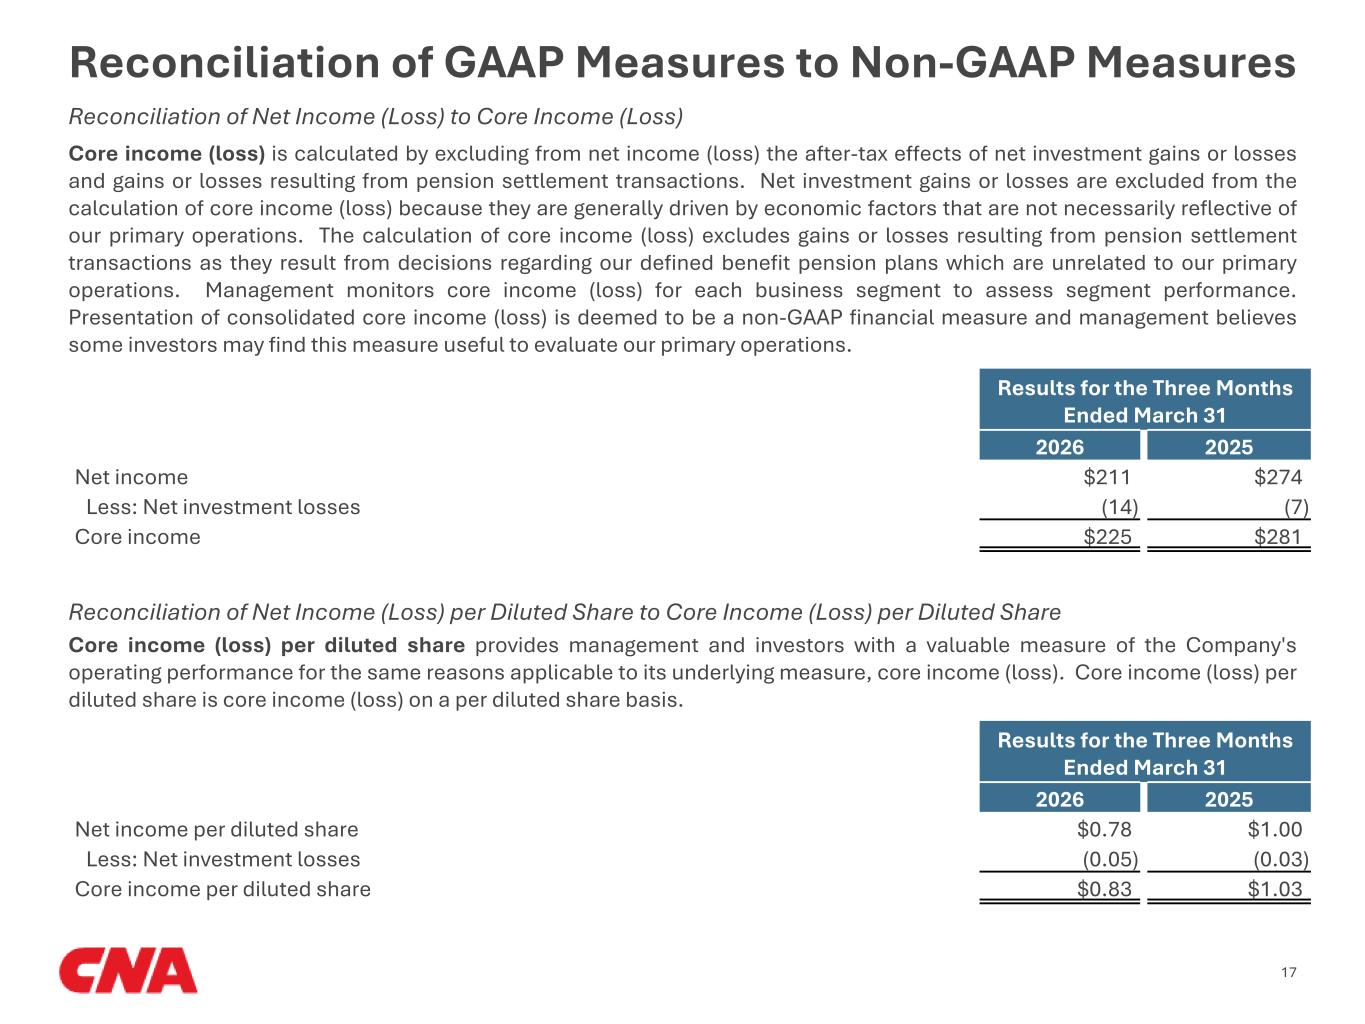
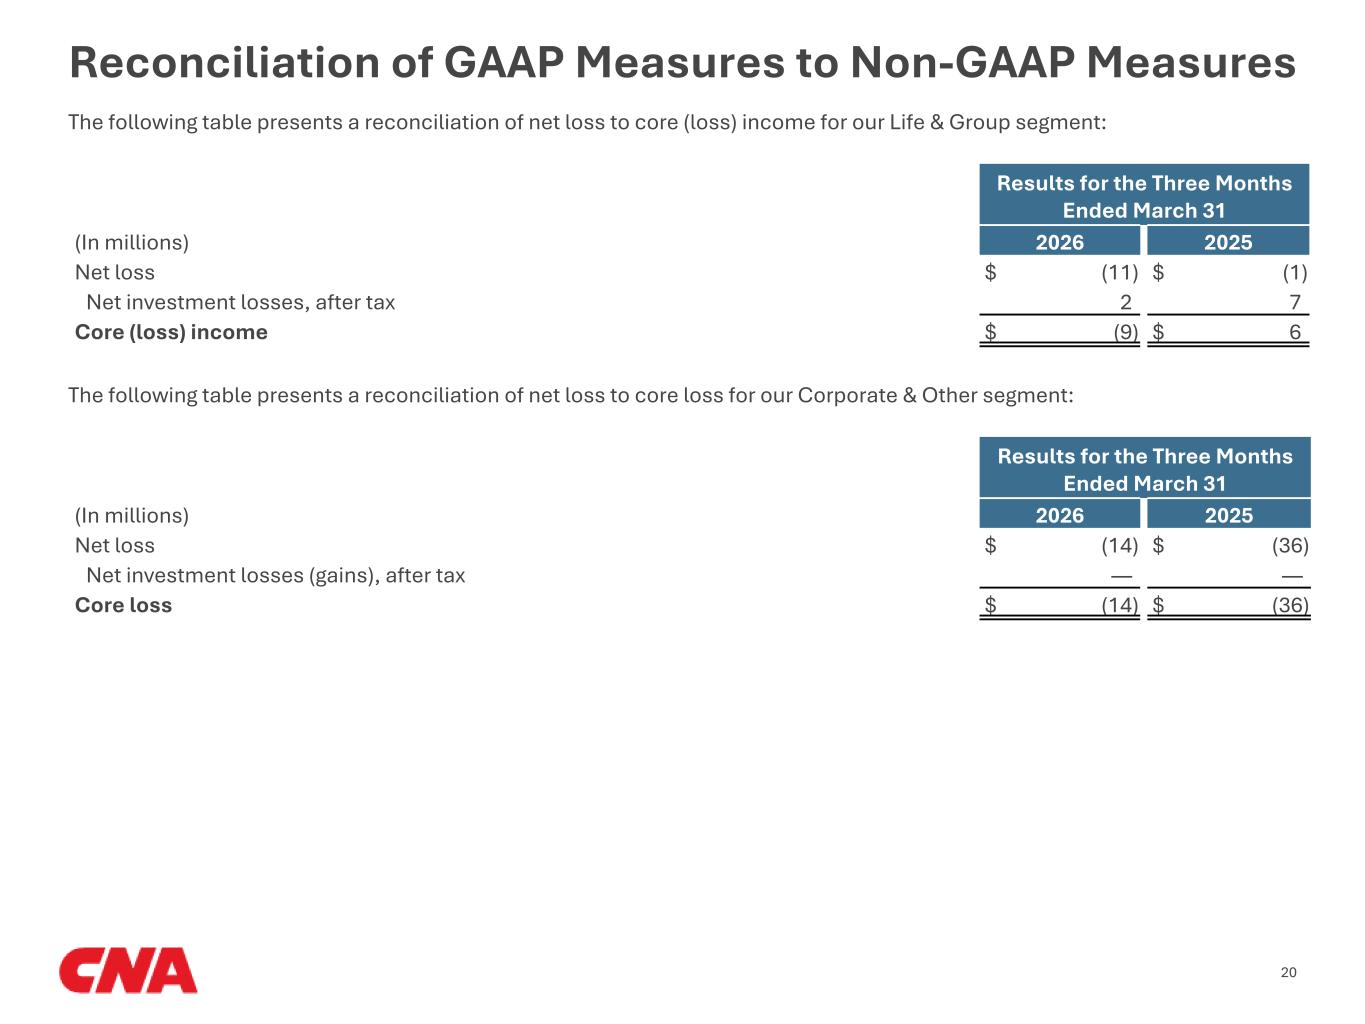
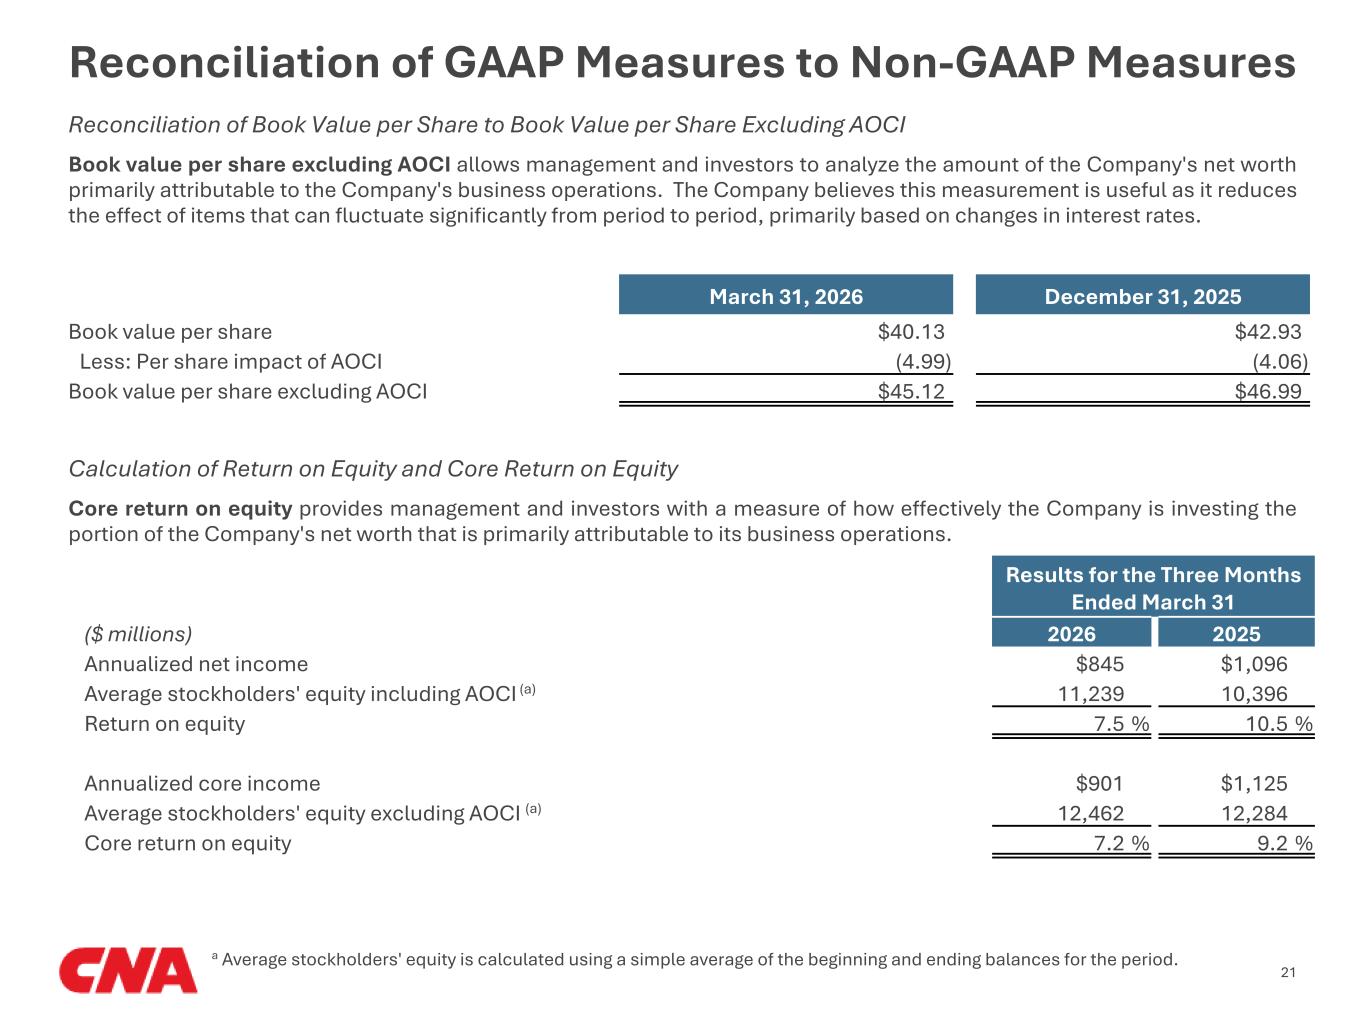
CNA's first quarter core income was $225 million compared to $281 million in the prior year quarter, resulting in a first quarter core return on equity of 7.2% and a trailing twelve-month core return on equity excluding accumulated other comprehensive income (AOCI) of 10.6%. The decrease in core income reflects prudent actions to strengthen prior year loss reserves in excess casualty and professional E&O lines for recent accident years as well as an increase in the current accident year loss ratios. Our P&C expense ratio for the first quarter was 29.9%, an improvement of 0.3 points compared with the prior year quarter. Our expense ratio improvement this quarter reflects favorable acquisition costs and continued operating discipline, even as we continue to increase investment in our technology, digital and artificial intelligence (AI) capabilities. While there is always a degree of quarter-to-quarter variability in this ratio, we continue to believe an expense ratio around 30% represents a reasonable run-rate for the full year 2026. The P&C net prior period development impact on the combined ratio was 4.1 points in the current quarter, compared with 2.5 points in the prior year quarter. In the Specialty segment, prior period development was $50 million unfavorable, primarily driven by professional E&O business in recent accident years. In the Commercial segment, prior period development was $56 million unfavorable driven by excess casualty in recent accident years. The P&C paid-to-incurred ratio was 77% this quarter, below the low-to-mid 80% average of the past four years, primarily reflecting the reserve strengthening taken during the quarter. P&C paid losses naturally vary from quarter-to-quarter, and while individual quarters may move up or down, the underlying trend in paid losses has increased over time, consistent with portfolio growth and higher loss costs. The Life & Group segment produced a core loss of $9 million for the quarter with underwriting results broadly in line with expectations, compared to a $6 million gain in the prior year quarter which reflected modestly favorable persistency experience. The Corporate segment produced a core loss of $14 million in the first quarter compared to a $36 million loss in the prior year quarter. The prior year quarter included a $17 million after-tax charge related to unfavorable prior period development largely associated with legacy mass tort abuse claim activity. As a reminder, we conduct our comprehensive review of legacy mass tort exposures in the second quarter of each year. Net investment income was $610 million in the first quarter compared with $604 million in the prior year quarter, an increase of 1%. The increase was driven by our fixed income and other investments, partially offset by lower returns in our limited partnership and common stock portfolios. Fixed income and other investments generated $568 million of income, up 3% compared to the prior year quarter. Our A-rated fixed income portfolio continues to provide consistent contributions to core income, which have been steadily increasing because of favorable reinvestment rates and a growing asset base. The effective income yield of our consolidated fixed income portfolio was 4.9% in the first quarter, up from 4.8% in the prior year quarter. Reinvestment rates continue to be above our P&C portfolio effective income yield of 4.4% and are fairly in line with our Life & Group portfolio effective income yield of 5.7%. Looking ahead, based on the current interest rate environment, we expect income from fixed income and other investments to be about $575 million in the second quarter. For the full year, we expect income from fixed income and other investments to be about $2,300 million, or a 2% increase as compared to the full year 2025. Our limited partnership and common stock portfolio returned a $42 million gain, or 1.4%, in the current quarter compared to a $54 million gain, or 2.0%, in the prior year quarter. The lower return was primarily due to our hedge fund and common stock portfolios, whose returns were in line with the broader public equity market performance. As a reminder, private equity funds, which represent about 90% of our limited partnership portfolio, generally report to us on a quarter lag, so results this quarter were primarily reflective of performance from the fourth quarter of 2025. Given the recent volatility in public equity markets, we believe we may see similar volatility in our limited partnership and common stock portfolio results in the near term. At quarter-end, our balance sheet remained very strong. Stockholders' equity excluding AOCI was $12.2 billion, or $45.12 per share. Including AOCI, stockholders' equity was $10.9 billion, or $40.13 per share. Statutory capital and surplus in the combined Continental Casualty Companies was $11.1 billion at quarter-end, reflecting the continued strength of our capital position. Operating cash flow for the quarter was $393 million as compared to $638 million in the prior year first quarter. The decrease includes approximately $100 million of payments related to specific reinsurance treaties, which occurred in the first quarter of this year but were paid in the second quarter of last year. Outside of this timing difference, operating cash flow reflects higher paid losses compared with the prior year first quarter, as a result of normal quarter-to-quarter paid loss variability and portfolio growth in prior years, while remaining well supported by strong investment results and steady premium collections. The effective tax rate on core income for the quarter was 21.1%, consistent with our expectations for the full year. Finally, we are pleased to announce our regular quarterly dividend of $0.48 per share, payable on June 4, 2026 to shareholders of record on May 18, 2026.
Overall, we produced $225 million of core income despite taking actions to continue to increase the prudence in our underlying loss ratio and long-tailed lines reserves for recent accident years. These long-tailed excess casualty and professional lines will play out over time; however, as we demonstrated last year on primary commercial auto, our philosophy is to respond quickly to any early adverse loss trend signals and market pricing pressure to address potential uncertainty. At the same time we continue to be measured on the anticipated benefits of our underwriting actions. This gives us what we believe to be an appropriately conservative position on our reserves and underlying loss ratio. In summary, we will not jeopardize our long term value creation by not recognizing market trends and adjusting underwriting strategies. We are executing our strategies with precision and nuance, growing substantially in some areas where we see opportunity while maintaining strong discipline in others that are subject to an irrational level of competition. Our expense ratio is down, and as we have gained efficiency we have continued to place investments in technology and AI, which have started to benefit us through a well-structured and evolving strategy. This includes over 100 separate AI initiatives executed across different areas of the organization, ranging from the use of AI to intake and triage submissions, to summarization of claims documents and generation of actionable insights. We are also using AI to analyze accounts within our risk control area, perform advanced analytics to gain insights on exposure to loss at a depth never before possible and support a variety of other initiatives covering virtually every functional area in our organization. Looking ahead to the rest of the year, we will continue to operate with strong discipline, and we remain committed to tightening our execution in the marketplace as we execute detailed underwriting strategies to optimize our portfolio in the current environment.