Operator
Hello, and welcome to the Core and Main Q4 and Full Year 2025 Benning's Core. My name is Alex, I'll be coordinating today's call. If you'd like to ask a question at the end of the presentation, you may press star, close by one on your telephone keypad. I'll now hand it over to Glenn Floyd, Director of Investor Relations, to begin. Please go ahead.
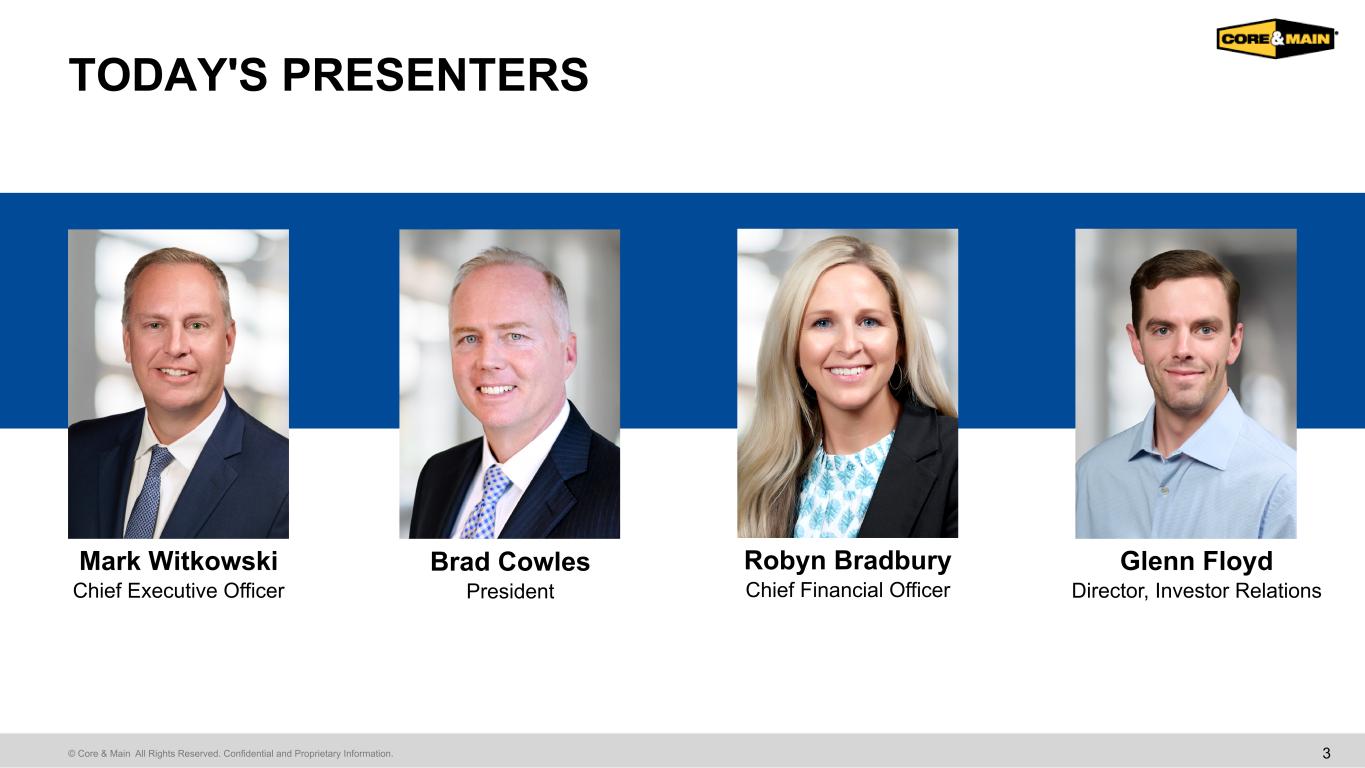
Good morning, and thank you for joining us. I'm Glenn Floyd, Director of Investor Relations at Core and Main. We appreciate you taking the time to be with us today for our Fiscal 2025 Fourth Quarter and Full Year Earnings Call. Joining me this morning are Mark Witkowski, our Chief Executive Officer, Robin Bradbury, our Chief Financial Officer, and Brad Coles, our President. Mark will start with a business update and review of our Fiscal 2025 performance. Brad will then discuss the investments we are making to drive market share gains and margin expansion over the long term. Robyn will follow with a review of our financial results in Outlook for Fiscal 2026. We will then open the line for questions, and Mark will wrap up with closing remarks. Our press release, presentation materials, and the statements made during today's call may include forward-looking statements. These are subject to various risks and uncertainties that could cause actual results to differ materially from our expectations. For more information, please refer to the cautionary statements included in our earnings release and in our filings with the sec we will also reference certain non-gap financial measures during today's discussion we believe these metrics provide useful insight into the underlying performance of our business reconciliations to the most comparable gap measure are available in both our press release and in the appendix of today's investor presentation thank you again for your interest in corn main i will now turn the call over to our chief executive officer mark Witkowski.
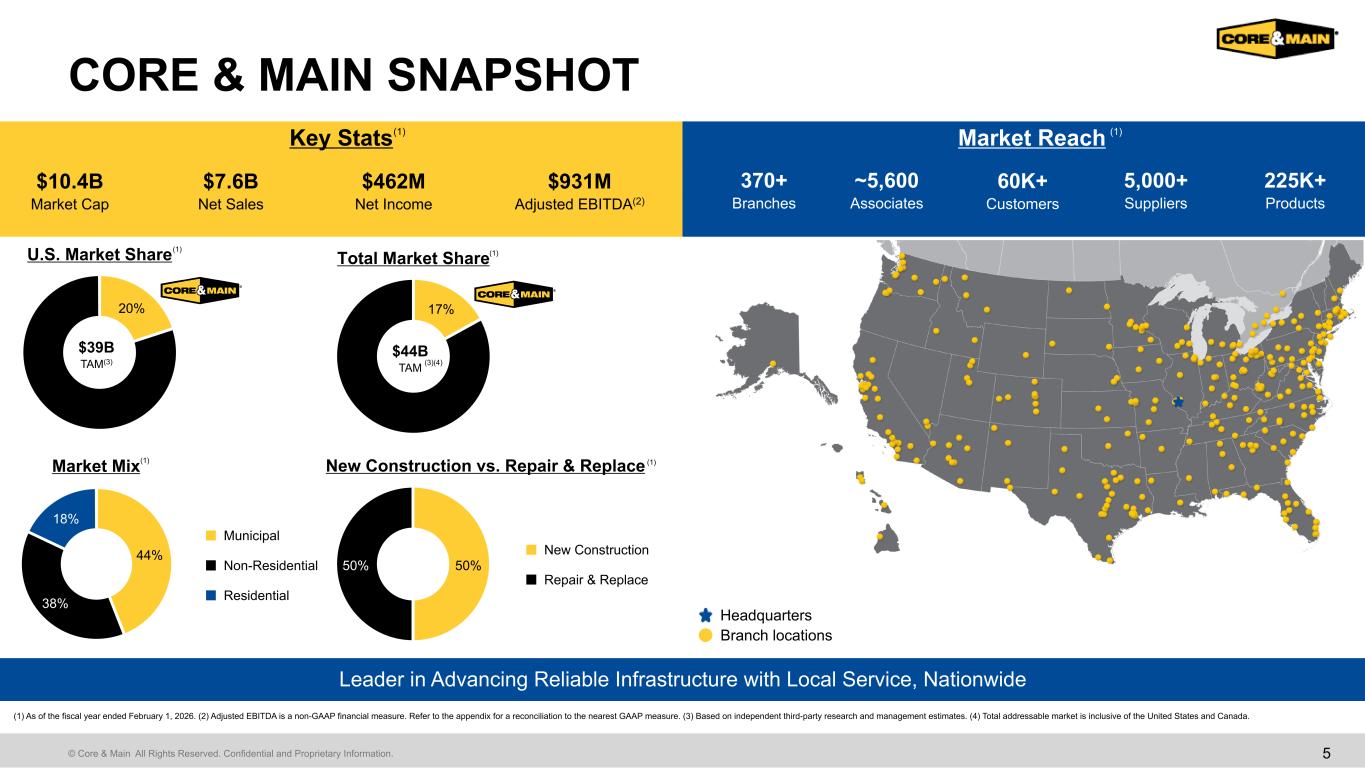
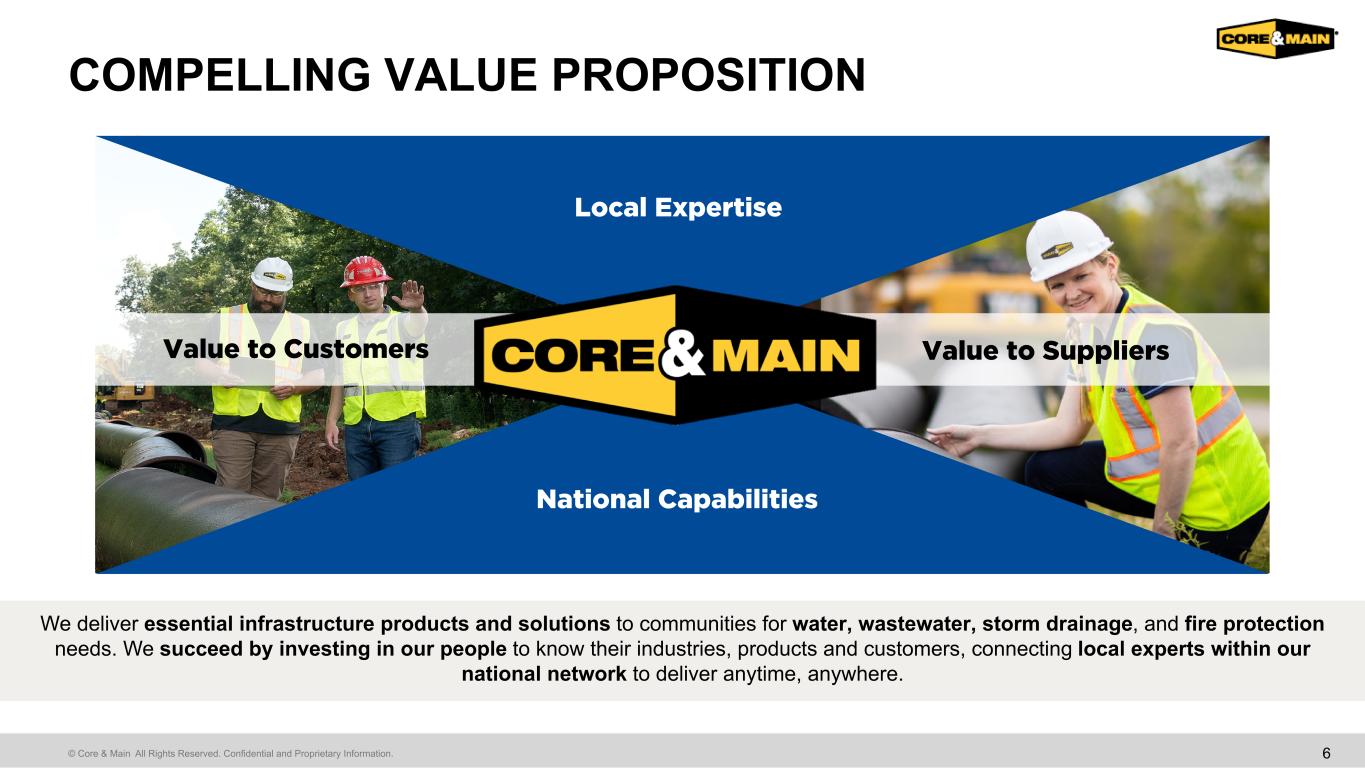
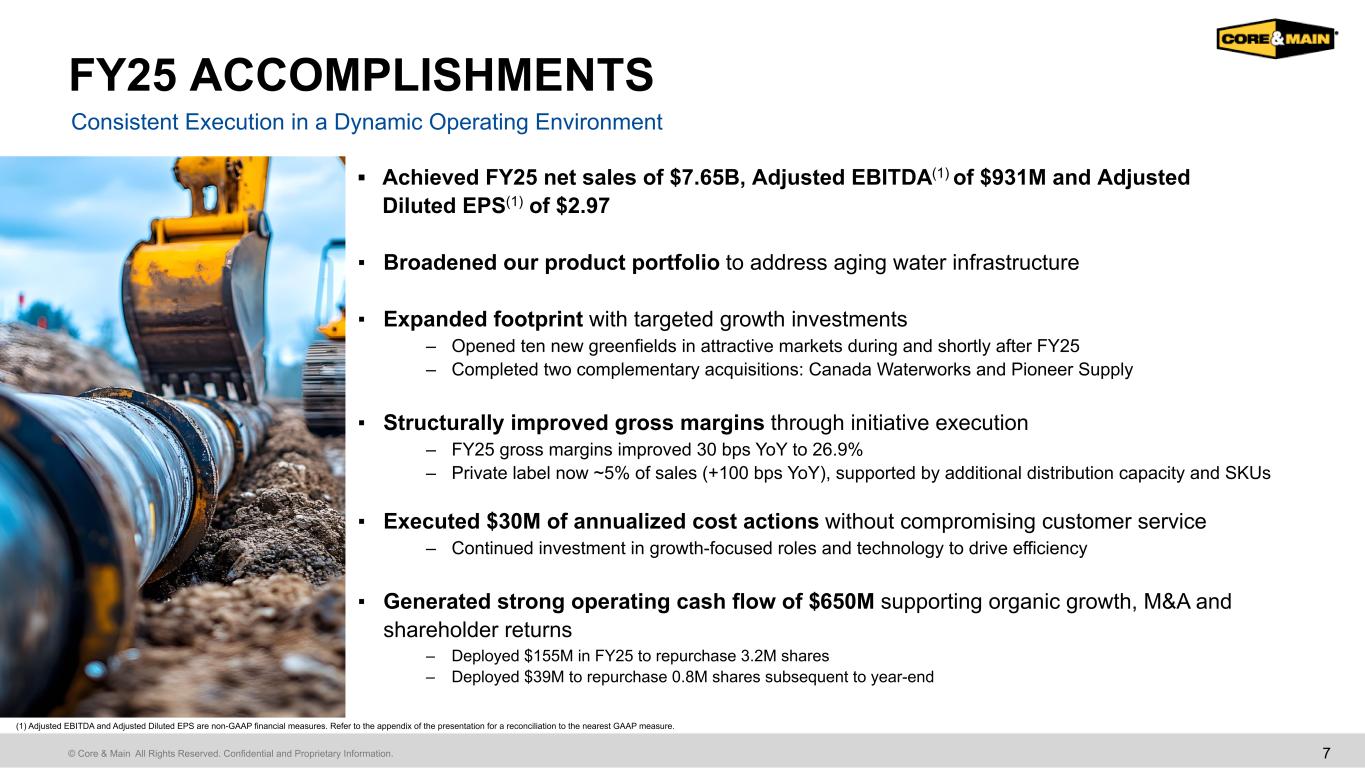
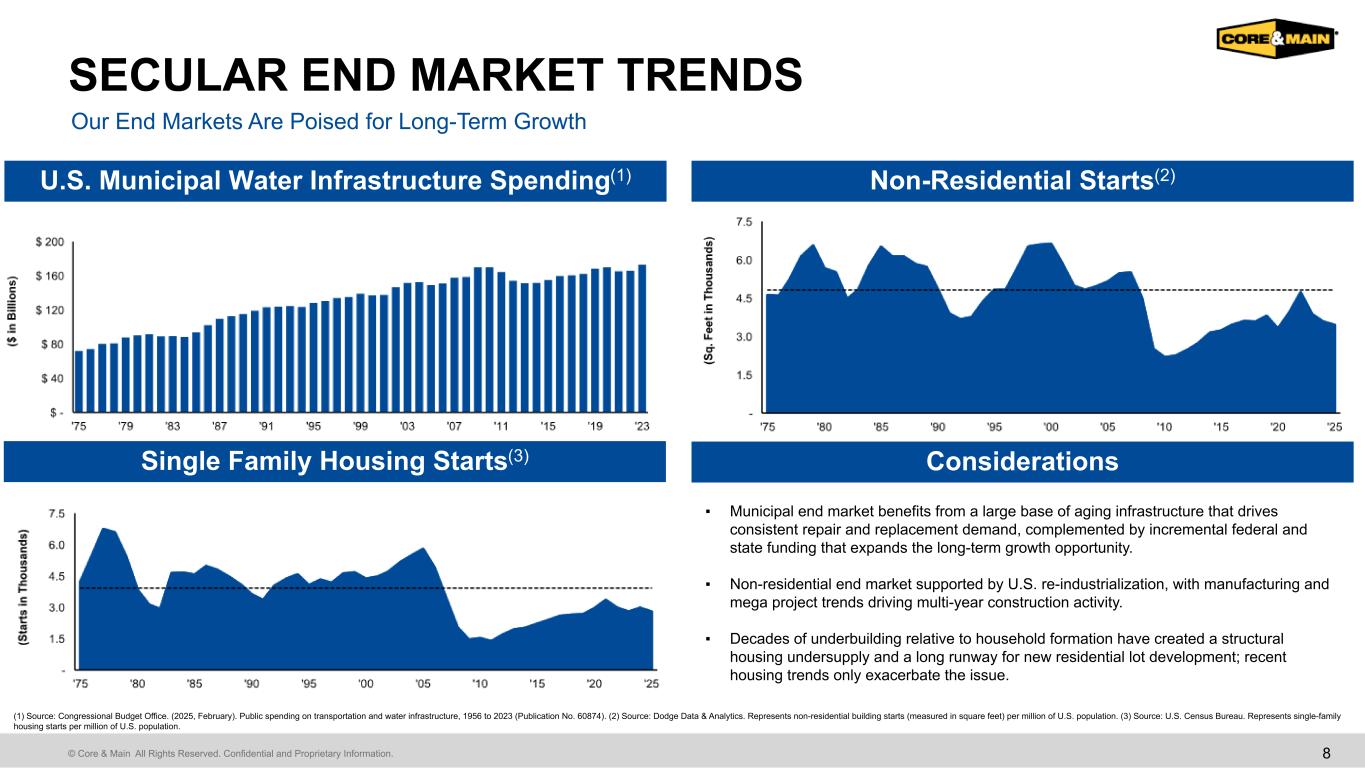
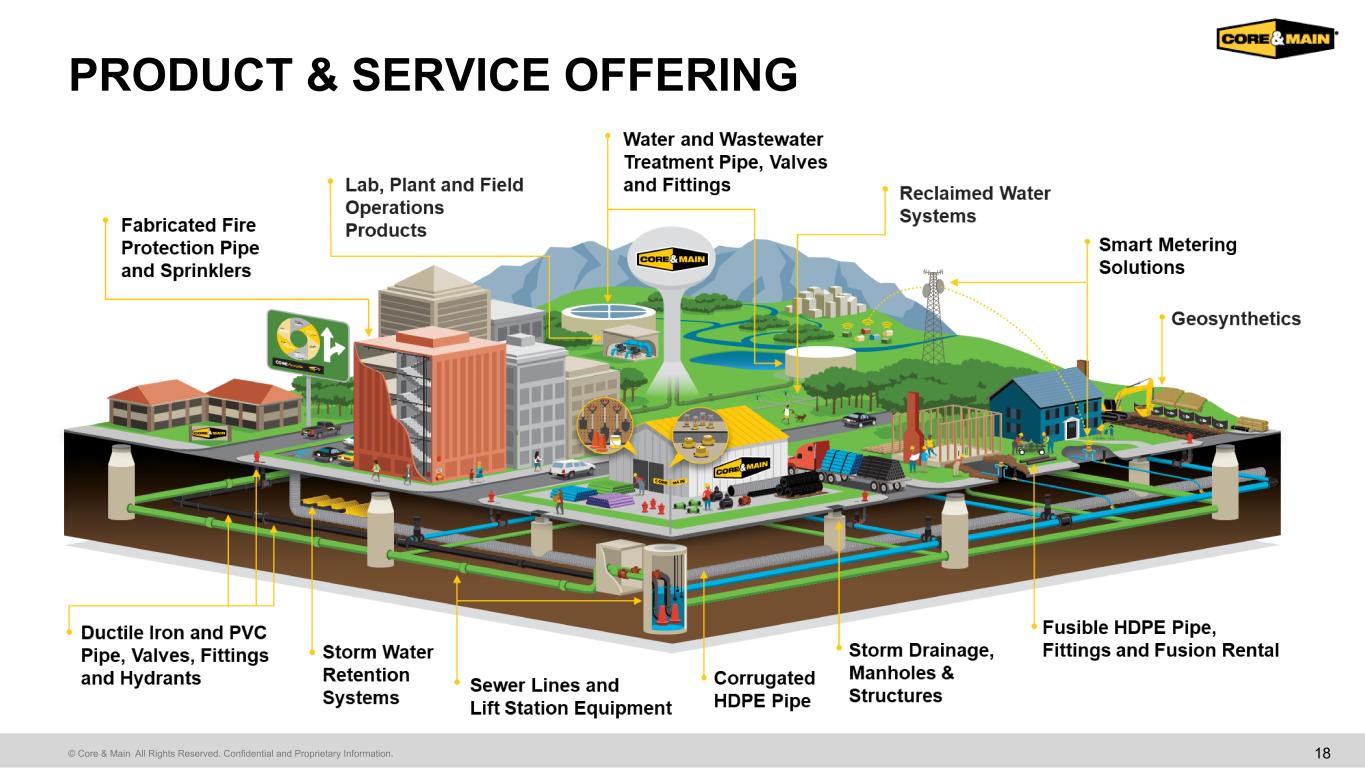
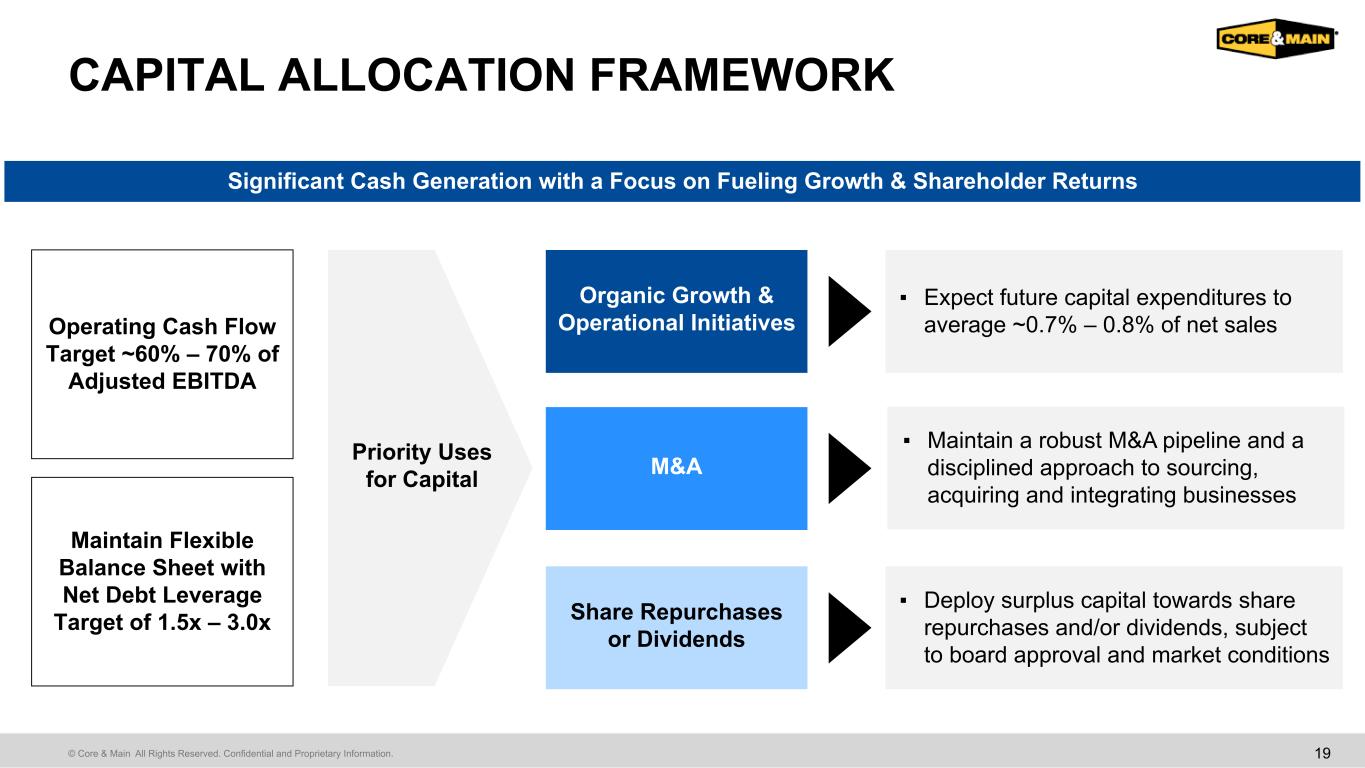
Thanks, Glenn, and good morning, everyone. I'll begin on page five with a brief overview of CornMain and its market position. CornMain is a leading specialty distributor of water infrastructure products and services in North America, supporting the repair, upgrade, and expansion of critical water systems. Having a portfolio of more than 225,000 products, many of which are exclusive to our industry with limited distribution rights we combine local expertise with national capabilities to provide water infrastructure solutions to municipalities private water companies and professional contractors across municipal non-residential and residential end markets our footprint consists of more than 370 branches across the u.s and canada which serves as a crucial link between 5 000 suppliers and a diverse base of more than 60 000 customers our end markets are balanced and stable providing resilience through varying demand environments municipal projects represent 44 percent of our sales generating steady demand from reliable funding sources our non-residential end market which represents roughly 38 percent of sales benefits from a diverse project mix across commercial industrial and infrastructure applications residential lot development represents approximately 18 percent of our sales and while near-term dynamics in this end market remain challenged we continue to view the long-term outlook as attractive supported by population growth and a structural under supply of housing This diversification, combined with emerging growth drivers like AI-related infrastructure needs and treatment plant modernization, provides a strong foundation for our business. Our competitive advantages, including local market expertise backed by our highly trained sales force, national capabilities, and industry-specific technology, position us to lead an attractive $44 billion addressable market across the US and Canada. up roughly $5 billion from last year with the addition of Canada. We estimate our U.S. market share at approximately 20% today with a small but growing share in Canada. This combination gives us significant runway to grow and capture additional share over time. Our ability to win in the market starts with the value we create for both our customers and our suppliers, which we've highlighted on slide six. It begins with our people-first culture, which empowers our associates to operate with an entrepreneurial mindset and build strong relationships in their local markets. For our customers, we provide a broad portfolio of highly specified products, deep technical expertise, and a consultative sales approach that helps them navigate complex infrastructure projects. Our local teams understand the specifications, regulations, and project requirements unique to each municipality and job site, allowing us to support customers through early project planning through delivery and installation. At the same time, we differentiate ourselves through our delivery capabilities and proprietary technology tools, which help simplify estimating, procurement, and job site logistics. combined with our national distribution network this enables us to deliver materials reliably and efficiently helping customers keep projects on schedule and within budget for our suppliers corn main serves as a critical channel to reach a highly fragmented customer base our expanded sales force and geographic footprint provide access to tens of thousands of contractors municipalities and utilities across the country We also help drive the adoption of new products and technologies by leveraging our local relationships, technical expertise, and market insights. Underlying all of this is our operating model, which combines local expertise with national capabilities and resources. Our local teams lead customer relationships and project execution, while our scale provides advantages in sourcing, distribution, technology, and product availability. This combination allows us to deliver a high level of service to customers while also creating meaningful value for our supplier partners. Together, these capabilities form a differentiated value proposition that positions core main to consistently gain market share and deliver strong, reliable execution. Turning to our recent accomplishments on page 7, Cisco 2025 was a year of disciplined execution for Quorum Maine. We delivered our 16th consecutive year of sales growth, a result that reflects the resilience of our business, the long-term strength of our end markets, and the consistent performance by our teams across the country. We generated net sales of $7.65 billion, adjusted EBITDA of $931 million, adjusted diluted EPS of $2.97, and operating cash flow of $650 million. As we talk through the year, I want to frame our performance against the annual value creation targets we use to measure the business, which include end market growth, organic above market growth, acquisitions, margin expansion, and cash flow. First is our end market growth. Our annual target assumes 2% to 4% market volume growth, and in fiscal 2025, our end markets were roughly flat overall. municipal volumes were up low to mid single digits and continued to be a source of strength supported by steady repair and replacement activity and a healthy funding environment while municipal demand remained resilient it was not enough to fully offset softness and other areas of our end markets non-residential volumes were relatively muted throughout the year growth from data centers street and highway projects and multifamily developments provided support but that strength was offset by softness and more traditional commercial development activity residential lab development declined low double digits as housing affordability and higher mortgage rates continue to weigh on demand we expect residential will eventually return to growth to satisfy the significant under supply of housing in the US while in market trends are outside of our control we have been proactive in repositioning the business to perform in this environment by strengthening our municipal business while remaining fully committed to the private construction markets we've had a couple years of softer than normal end markets and despite near-term softness we expect growth to resume in the medium term second is our organic above market growth our annual target calls for two to four percent and in fiscal 2025 we delivered squarely within that range a big driver of that performance was our sales initiatives which delivered robust results as we broaden our portfolio of solutions to address aging water infrastructure collectively average daily net sales grew double digits in fusible hdpe treatment plant solutions and geosynthetics average daily net sales for meter products grew 12% in the quarter and grew mid single digits for the year on top of a strong prior year growth comparison of 32% we also expanded our footprint during and subsequent to the year to make our products more accessible nationwide opening 10 new branches and attractive markets we have a pipeline of additional greenfield locations and expect to open additional locations as we progress throughout the year collectively these sales and geographic expansion initiatives drove three points of organic above market growth in fiscal 2025 reflecting continued share gains across our markets we are confident in our ability to continue driving above market growth through the sales geographic and key talent initiatives in fiscal 2026 and beyond third is our growth from acquisitions our annual target is two to four percent growth from acquisitions and in fiscal 2025 we delivered two percent that includes contributions from acquisitions completed in fiscal 2024 along with two complementary acquisitions we completed in fiscal 2025 five Canada Water Works and Pioneer Supply together these acquisitions added five branches to our footprint during the year Canada Water Works builds on the platform we established in Canada last year with the HM pipe acquisition but these additions we now operate seven branches in Ontario including two green fields opened earlier this year as we continue expanding our presence Pioneer Supply expands our presence in Texas and Oklahoma, further extending our reach in attractive growth markets. Both businesses bring a strong reputation for quality and service that align with Coramain's mission. Together, we're extending our reach and creating even greater opportunities for growth and value creation. More broadly, acquisitions and greenfields are complementary tools we use to expand our footprint and unlock new growth opportunities. In some markets, we establish a presence through green fields, while in others, like Canada, acquisitions provide an initial platform that we can then expand through additional investments over time. We are well positioned to continue driving growth through M&A. Fourth is margin expansion. In fiscal 2025, we delivered strong gross margin performance, expanding 30 basis points year-over-year, driven by higher private label penetration and disciplined purchasing and pricing execution. Our gross margin performance for the year reflects great execution by our local teams and challenging market conditions, coupled with the benefits of our national scale and initiatives. Flat end market volumes and flat pricing, coupled with higher than normal inflation on our operating costs, limited our ability to achieve SG&A leverage this year. Historically, we've offset these impacts with productivity and price increases and expect we will do that going forward. Our last value creation lever is cash generation. Every year, we target converting 60 to 70 percent of adjusted EBITDA into operating cash flow. We delivered $650 million of operating cash flow in fiscal 2025, which represents conversion at the high end of the range. Strong cash generation continues to be a differentiator for corn main, and it gives us flexibility to invest in the business, pursue strategic M&A, and return capital to shareholders. As we look ahead, our focus is straightforward, extend the advantages we've built, compound market share gains, and continue expanding the structural earnings power of the business. Beginning on page 8, we'll cover the fundamentals of our end markets and why they remain attractive over the long term. Brad will then walk through why we have confidence in our ability to grow and improve profitability. We benefit from a large base of aging municipal water infrastructure that drives consistent repair and replacement activity, and that backdrop is complemented by strong local funding and incremental federal and state funding that expands the addressable opportunity. We also continue to see an increasing need for modernization projects, including treatment plan upgrades and metering conversions, which reinforce the multiyear nature of municipal demand our non-residential end market is supported by a balanced mix between new development and repair and replacement activity ranging from commercial and industrial construction to less cyclical infrastructure projects like road and bridge rehabilitation activity as I mentioned earlier we're seeing mixed demand across project types in the near term but the long-term themes like on-shoring and broader infrastructure investment are expected to support a steady pipeline of work as large projects move from planning to execution. Lastly is residential. While near-term housing activity can move with interest rates and affordability, the long-term demand drivers are structural. The U.S. has built fewer homes than household formations over the past two decades, which has created an undersupply and a long runway for future lot development. important. Importantly, residential growth can also provide incremental support to our other two end markets. As communities expand into suburban and rural areas, commercial development follows. And all of that residential and nonresidential growth places a greater strain on local water systems, which drives municipal expansion, upgrades, and repairs. We believe a release of pent-up residential activity supports residential, non-residential, and municipal growth. Next, I would like to welcome Brad Coles, our president, who will walk through the investments we are making in our products, capabilities, footprint, and people, and how those initiatives are driving market share gains and supporting margin expansion. Go ahead, Brad.
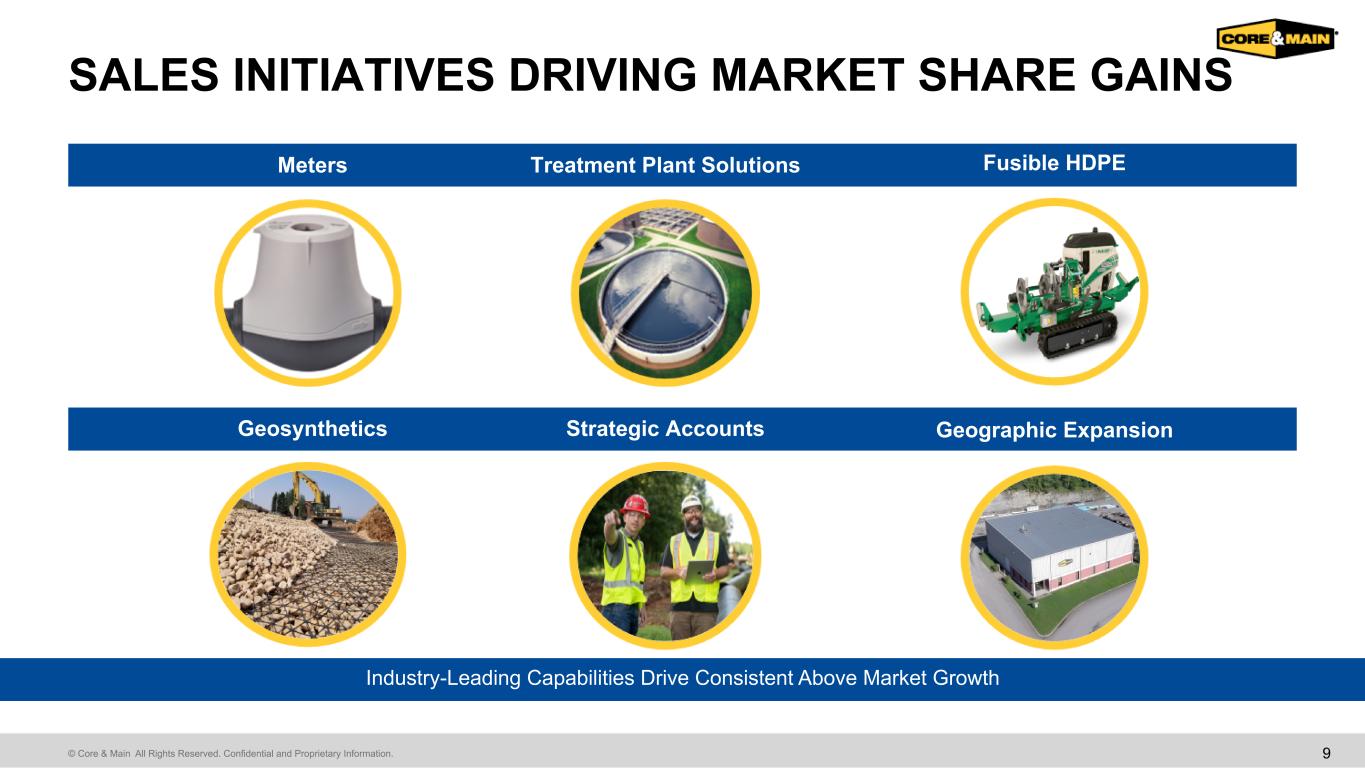
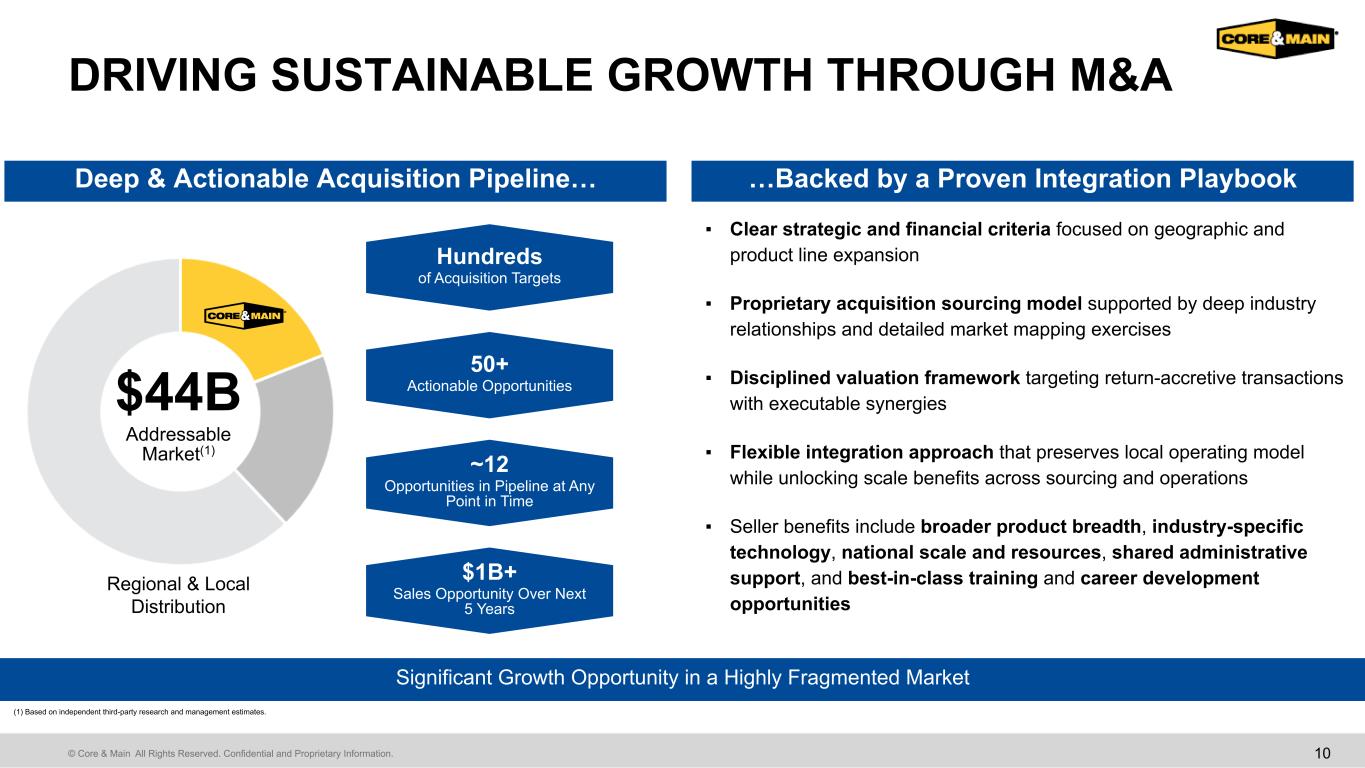
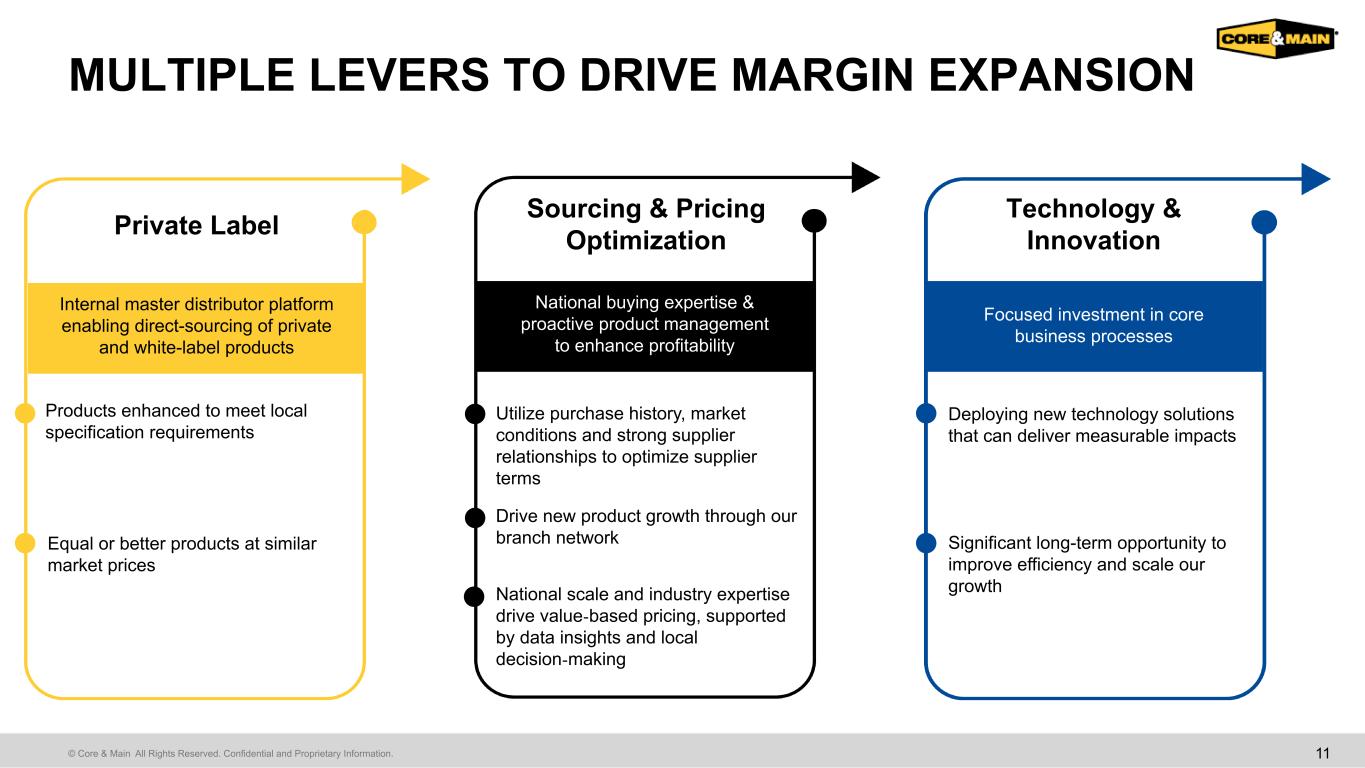
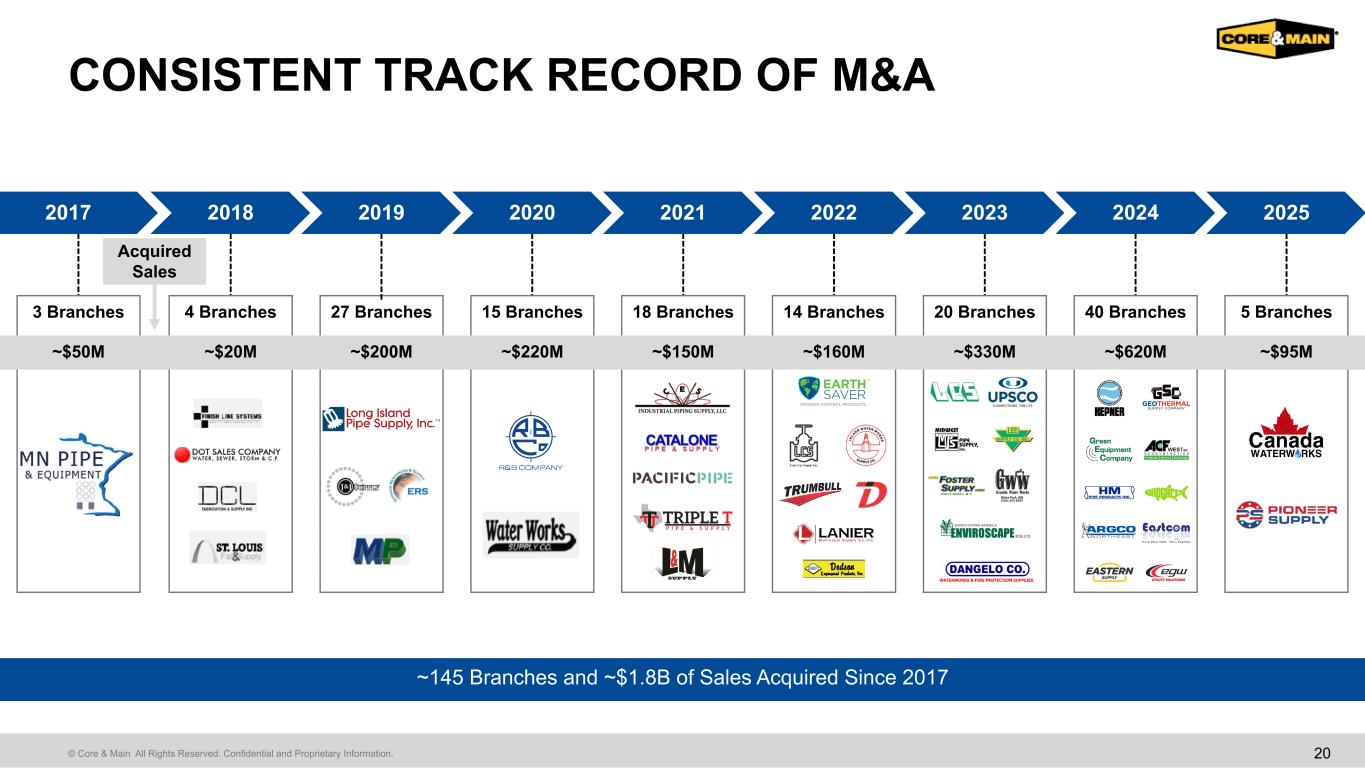
Thanks, Mark, and good morning, everyone. It's great to be here with you today. turning to page nine i want to share some insights on the sales initiatives and capabilities that are driving consistent above market growth and market share gains building on the foundation of our core business and extensive branch presence we're bringing additional value to our customers in two primary ways with a broader product offering to cover all of their project needs and by bringing complete solutions to their more complex challenges our key initiatives meters treatment plant, fusible HDPE, and geosynthetics have combined to grow at an average annual rate of approximately 14 percent over the past five years, significantly outpacing underlying market demand. Two of these initiatives are focused on expanding our product offering, fusible HDPE and geosynthetics. These product initiatives require new supplier partnerships, specialized equipment and technicians as well as unique storage and logistics solutions as we expand these capabilities across our branch network we can bring these products to our current customers and also pursue new customers who specialize in the installation of these unique products usable hdpe for example is used in water and sewer systems by our current municipal and contractor customers but the same products fusion equipment and technicians are also used in agriculture energy mining landfill and other applications often in the very same geography smart meters and treatment plant our sales initiatives focused on solving more complex problems and offering more comprehensive solutions to our customers we do this by investing in national teams with very specific expertise who complement the efforts of our local branches we help our customers understand the possible solutions and in doing so we often create additional demand smart metering is a great example of how our turnkey solutions are winning with the customers while bringing them solutions they had never imagined we were recently awarded what we believe is the largest metering contract in u.s history reflecting our leading position in the market we deliver solutions that help utilities improve building accuracy reduce water loss and enhance system visibility these solutions combine metering and other sensor hardware, software, installation, project management, and everyday maintenance for metering projects of any size. We are enjoying a high rate of success on large, complex projects, and we take that as a sign that we're taking a larger share of the market as municipal customers look for a single partner to deliver end-to-end solutions. As a result, our smart metering business has grown at an average annual rate of approximately 14% over the last five years. Our national critical infrastructure group specializes in complex water treatment and delivery projects consisting of pipes, valves, fittings, and fabricated assemblies. Large capital investments are being made in treatment plants and water transmission lines across the country as demand increases from onshoring, data center construction, and population shifts. And we are seeing above market growth across these project types. That momentum, coupled with our differentiated product and service offering, has helped drive this initiative to grow at an average annual rate of nearly 25% over the past five years. We also see opportunities to continue expanding our capabilities and product lines within water treatment, both organically and inorganically. As the projects get larger, the customer partnerships become more important, and the demands for timely and high-quality execution get stronger. Our focus on strategic customer accounts positions us to win business as these leading general contractors move across the country, performing work on the most significant capital projects. Geographic expansion is another important lever in our above-market sales growth. Our market mapping process helps us identify underpenetrated areas with attractive growth characteristics where our brand, product breadth, and service model can differentiate us. Greenfields yield strong returns and provide a complementary path when acquisition targets are not available to us in a market we wish to enter. We completed six Greenfield openings in fiscal 2025, and we expect to open a record seven to ten locations in the coming year. Even in markets where we already operate, we often have the opportunity to add and develop sales talent to strengthen our sales coverage. That includes building the right mix of outside sales, inside sales, and product expertise so we can support larger and more complex projects, increase share of wallet with existing customers, and capture more opportunities in the markets we already serve. With that as context, page 10 highlights how disciplined M&A complements these organic growth levers. Our highly fragmented market creates a long runway for disciplined acquisitions. Over time, we've built a reputation as the acquirer of choice in our industry, grounded by our entrepreneurial culture and the resources we bring to help acquired businesses grow. Since 2017, we've completed more than 40 acquisitions, adding nearly 150 branches and over $1.8 billion of annual sales. Our pipeline is deep and actionable. We evaluate, on average, more than 50 opportunities each year, with roughly a dozen opportunities in active evaluation at any time. When companies join CORE in Maine, they gain broader product breadth, industry-specific technology, and national capabilities and resources that help them serve customers more effectively. They also gain shared administrative support, which reduces the burden on local teams and allows them to spend more time with customers. and we invest in people through best-in-class training and career development opportunities that help retain and grow talent as we evaluate opportunities we prioritize businesses that expand our presence in new or underrepresented markets help us add products and service capabilities and bring in key industry talent looking ahead we see a clearer path for M&A to contribute two to four points of annual sales growth over time turning to page 11 one of the things we are most excited about is the runway we have to expand margins and this slide summarizes the levers that support that opportunity private label is a powerful driver of gross margin expansion it includes direct sourcing of comparable products and also building differentiated brands we've developed a meaningful private label capability that is supported by an internal master distribution network and our private label brands are respected because we invest in quality and enhanced features while ensuring we meet required specifications we also stay close to the field by soliciting feedback on quality pricing and packaging and by prioritizing service levels and availability as we service our own branches we've been investing in the infrastructure to scale private label adoption since the end of last year we've added distribution capacity and expanded the assortment by more than 6 000 skus private label represented about five percent of sales in fiscal 2025 and we see a clearer path to at least 10 over time sourcing and pricing optimization are another structural advantage our scale and buying expertise help us secure access to the most preferred products with favorable terms and improved net product costs we foster strong partnerships with key suppliers to drive shared growth at the same time we leverage centralized resources and transaction data to help guide optimal price points while empowering our local teams with final pricing authority together these capabilities allow us to capture the full value of our purchasing scale while maintaining the local responsiveness that our customers expect. Technology and innovation tie all these levers together, creating a meaningful opportunity to drive sales, margins, and efficiency. We are broadening our agenda to ensure that CoreMain remains the industry's technology leader with continuous investment in step-change productivity and a better customer experience with AI-enabled solutions that reduce administrative burden and free our teams to focus on customers. We believe this creates a durable, long-term advantage and supports Corn Mane's differentiated value proposition. To wrap up, these product and solution initiatives are reinforcing each other and strengthening our ability to gain share, expand margins, and scale the business with discipline. They help us accelerate greenfield contributions, and they maximize the synergies we can get from acquisitions. We are investing where we see the greatest opportunity, and we are confident in the path ahead. With that, I will turn it over to Robin to walk through our fourth quarter and full year financial results. Go ahead, Robin.
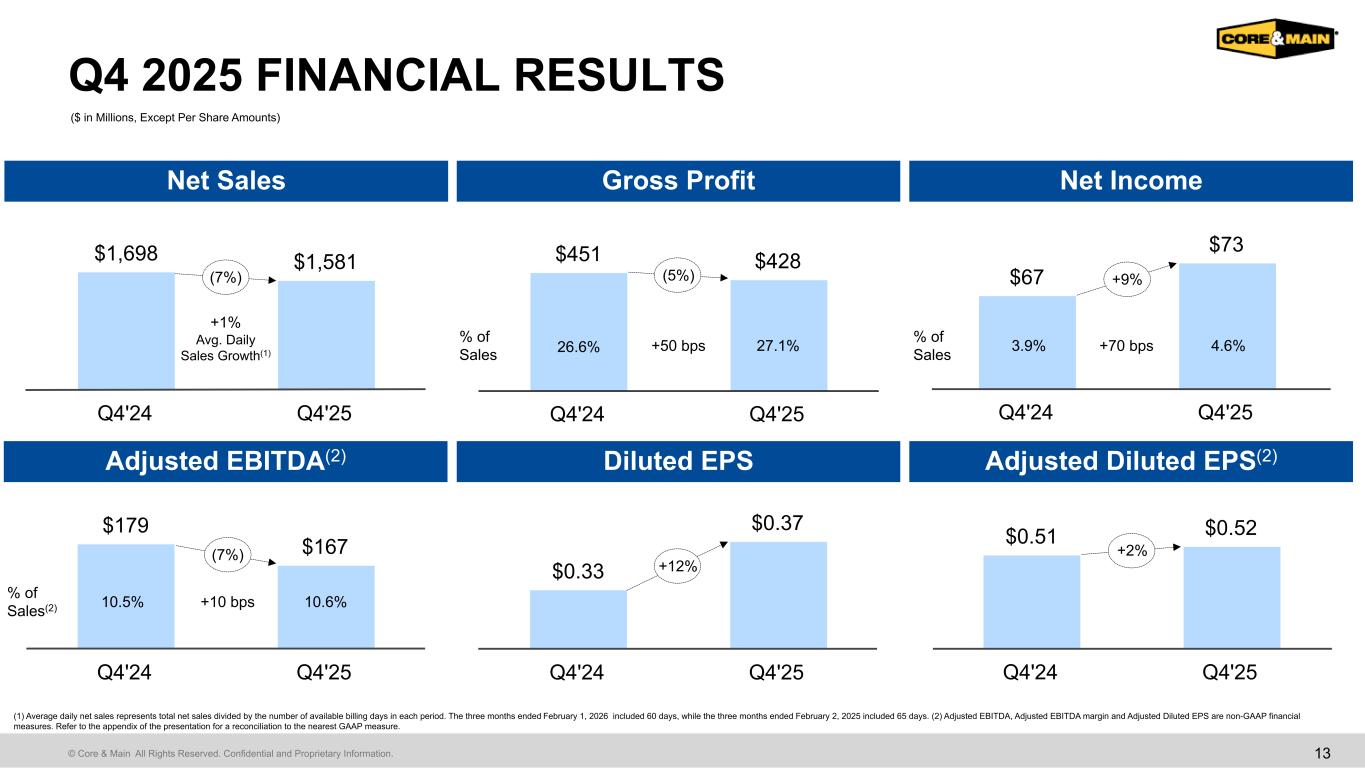
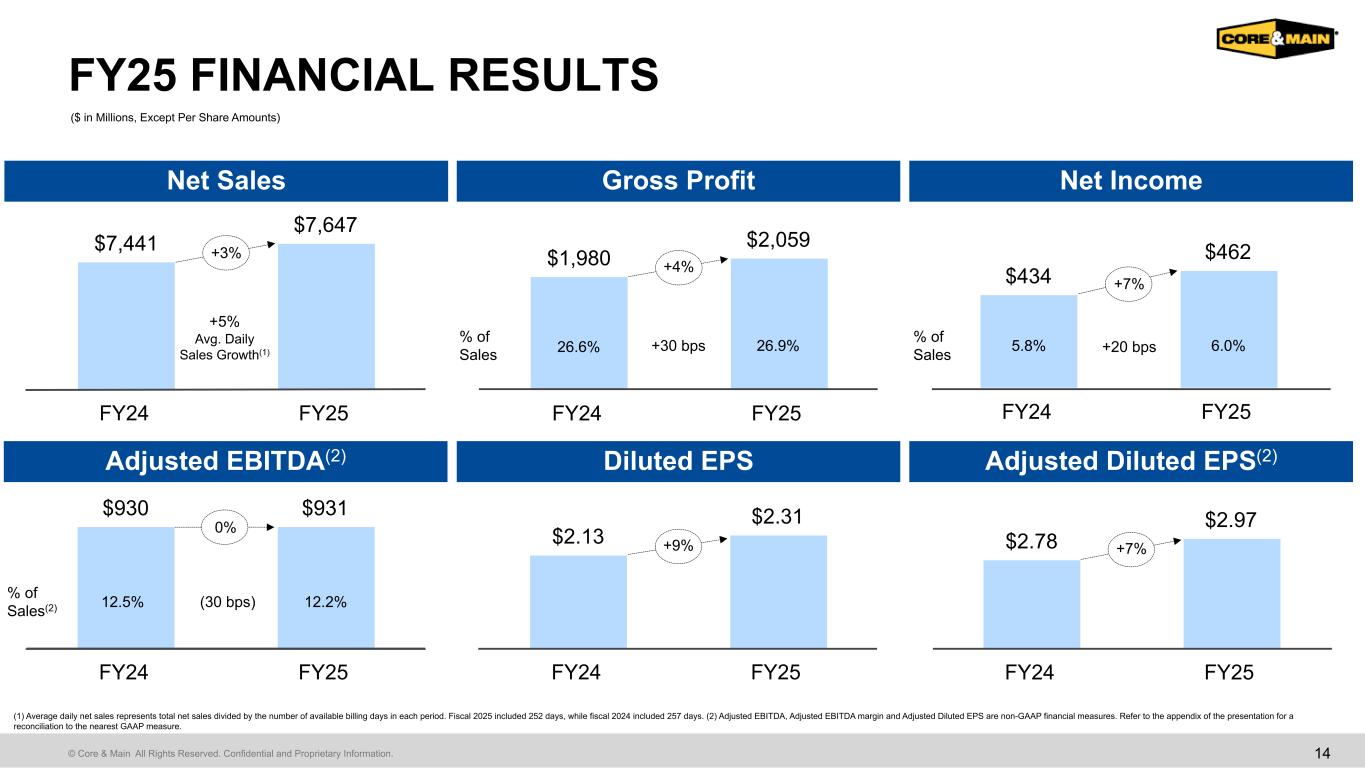
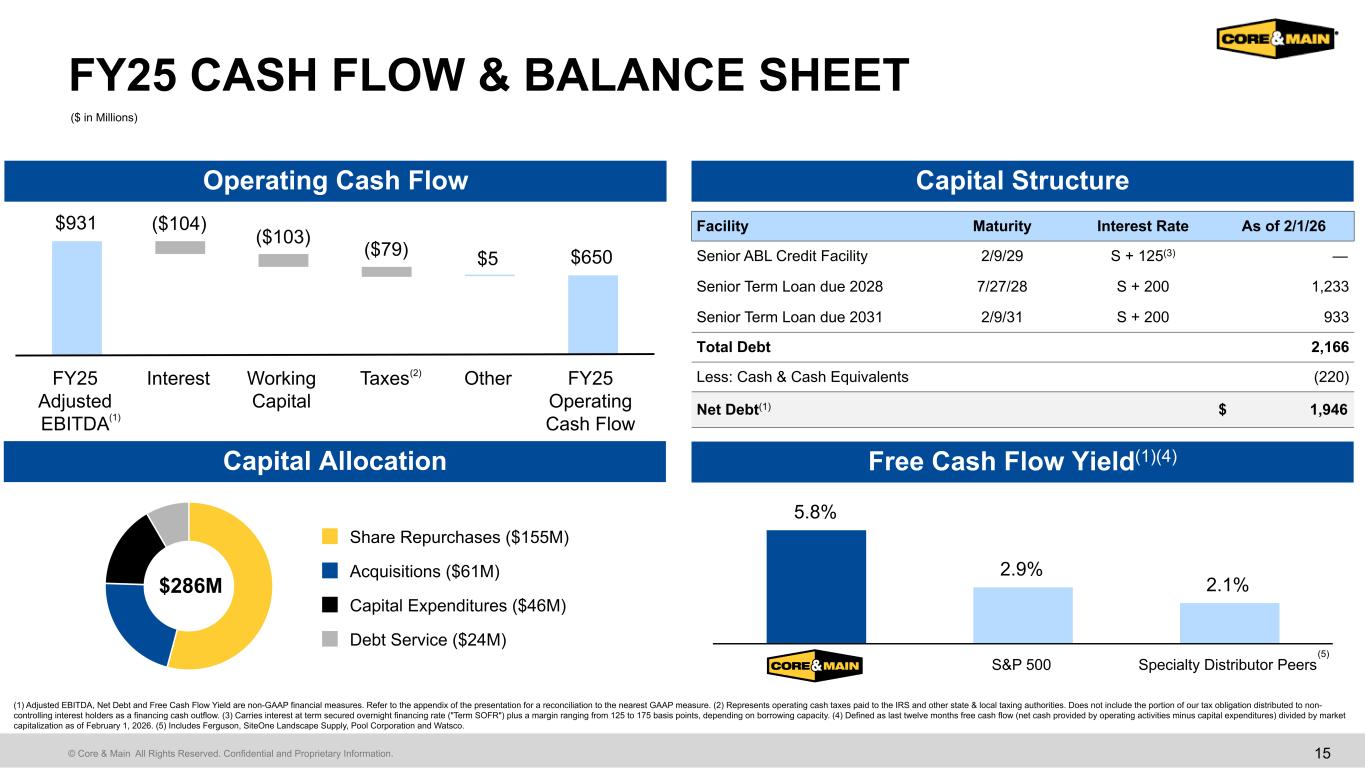
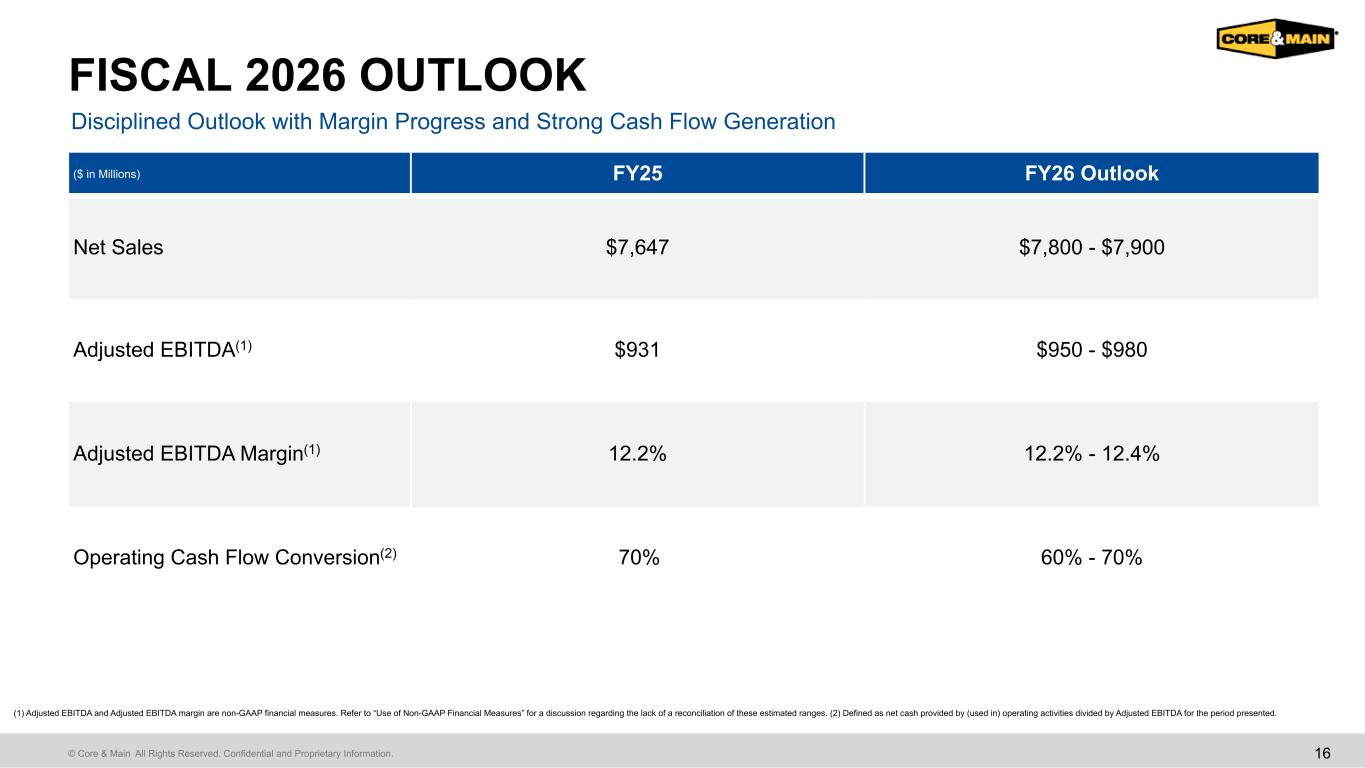
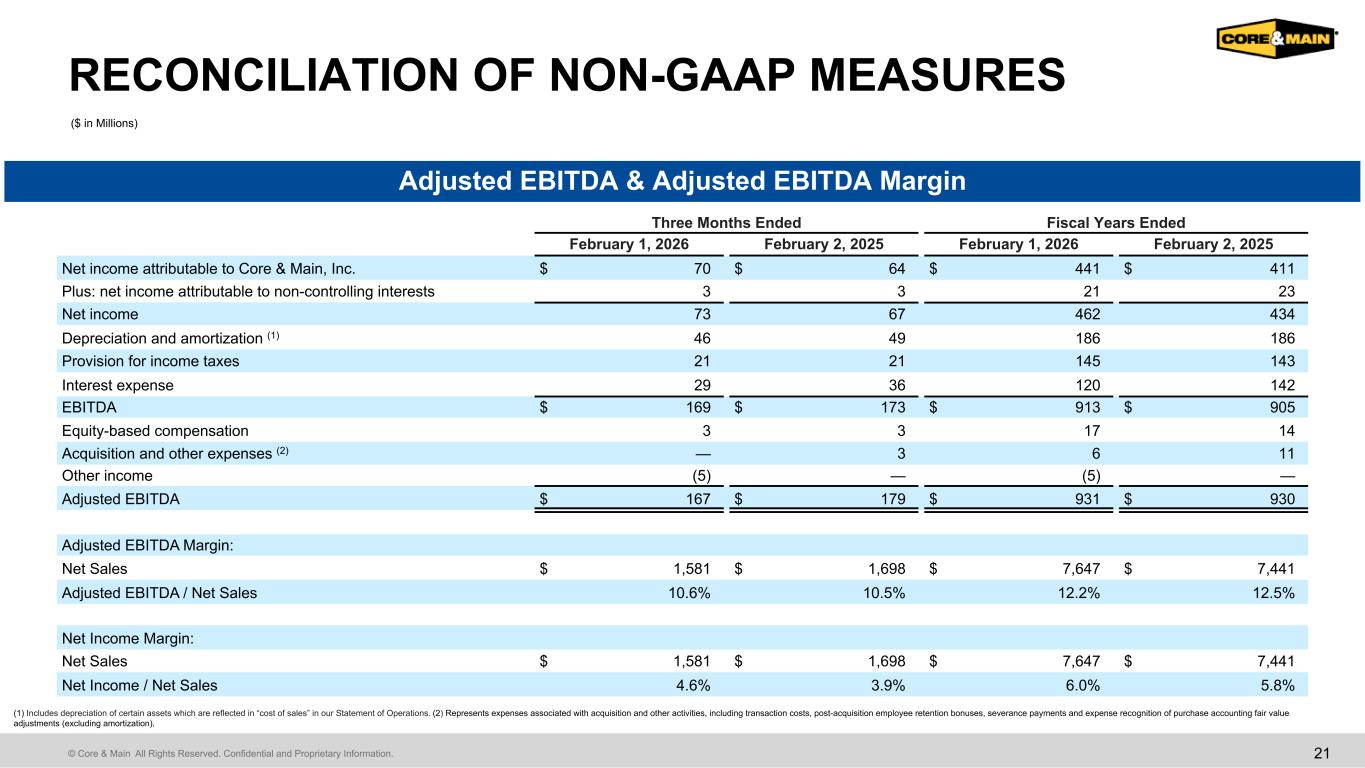
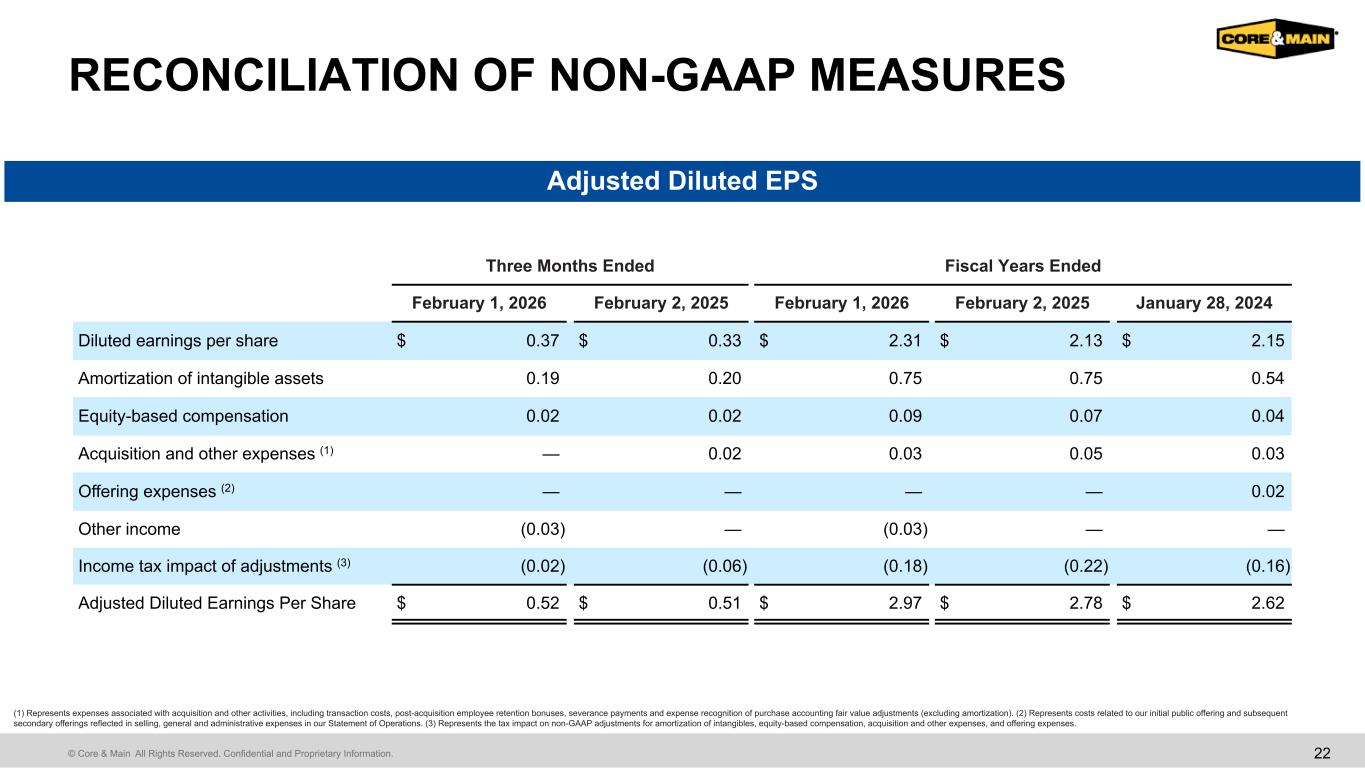
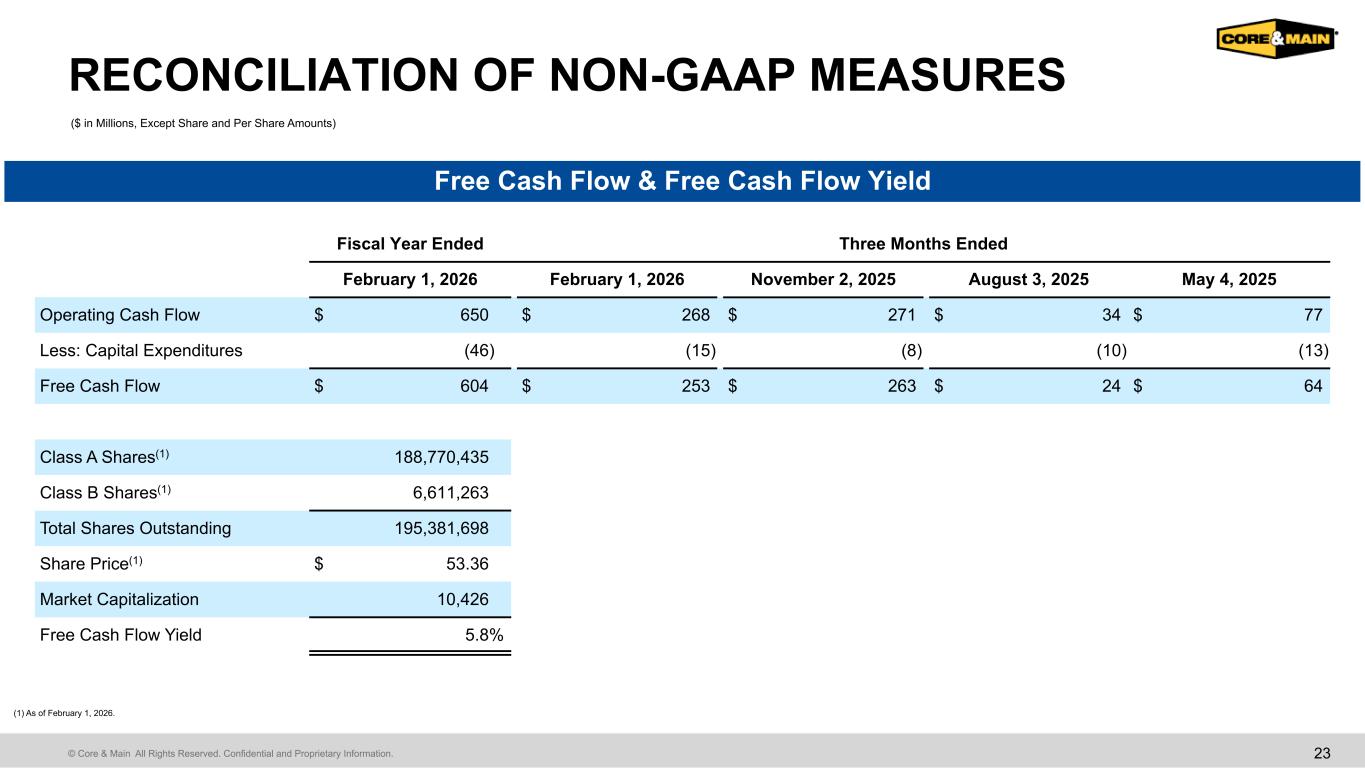
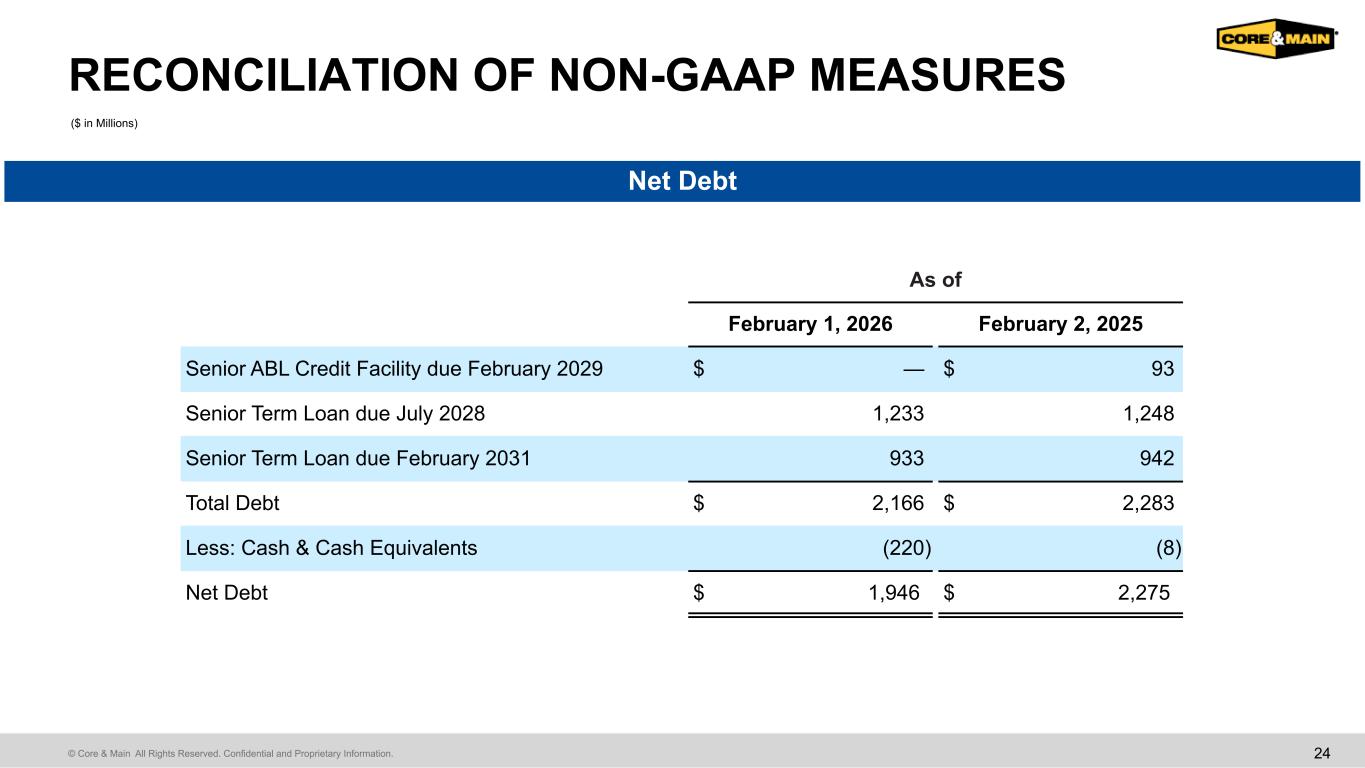
Thanks, Brad. Good morning, everyone. I'll start on page 13 with some highlights from our fourth quarter results. Net sales in the fourth quarter decreased 7% to $1.58 billion. As a reminder, we had one fewer selling week in the fourth quarter of this year compared to last year. On an average daily net sales basis, sales increased about 1%, driven by roughly one point of organic volumes. Pricing remained positive across nearly every product category with the exception of PVC pipe, resulting in roughly flat pricing overall. Sales in the final week of the quarter were also affected by severe winter weather that temporarily limited construction activity in several regions. Gross margin in the fourth quarter was 27.1%, an increase of 50 basis points year-over-year. The improvement reflects higher private label penetration and disciplined purchasing and pricing execution. Total SG&A for the quarter decreased 5% to $264 million. The year-over-year decline was driven primarily by lower variable costs from one less selling week, along with benefits from our previously announced cost actions. Sequentially, SG&A was $31 million lower than the third quarter, reflecting approximately $5 million of realized savings, with the remainder due to reductions in variable costs. Over the course of fiscal 2025, we implemented approximately $30 million of annualized cost actions, with roughly $6 million recognized this year, and the remainder expected to flow through our results during fiscal 2026. Our approach continues to be measured. We are improving our cost structure without compromising customer service or long-term growth. At the same time, we continue to invest in targeted roles to support product line and geographic expansion. We are highly focused on regaining operating leverage by offsetting SG&A investments with productivity gains while maintaining the service levels and capabilities that support our growth strategy. Adjusted EBITDA in the fourth quarter was $167 million, down 7% versus last year, primarily reflecting one fewer selling week. Adjusted EBITDA margin was 10 basis points higher than last year at 10.6%. Turning to our full year performance on page 14. For fiscal 2025, net sales grew approximately three percent to seven point six five billion dollars sales growth was five percent when adjusted for one less selling week we delivered roughly three points of organic market share gains while our end markets were roughly flat overall with municipal up low to mid single digits non-residential relatively flat and residential down low double digits our market outperformance was driven by our sales and geographic expansion initiatives including metering treatment plants, usable HDPE, and geosynthetics, and investments to expand our coverage and priority markets. We also achieved two points of sales growth from acquisitions, and prices were overall flat. Growth margin for the year was 26.9%, up 30 basis points from fiscal 2024, reflecting higher private label penetration and disciplined purchasing and pricing execution. Private label increased 100 basis points in fiscal 2025 to roughly 5% of sales. That mixed shift was a meaningful driver of the year-over-year improvement. Total SG&A for the year increased 7% to $1.15 billion. The increase in SG&A was driven by inflation, acquisitions, volume-related growth, and strategic investments to support sales growth, margin expansion, and future productivity. While these factors pressured SG&A leverage in the near term, we remain focused on driving both growth and profitability, and are confident the actions we have taken position us to return to EBITDA margin expansion over time. Adjusted EBITDA was $931 million, slightly ahead of the prior year, while adjusted EBITDA margin declined 30 basis points to 12.2%. The year-over-year margin decline reflects higher SG&As of percentage of net sales, partially offset by 30 basis points of gross margin expansion. Adjusted diluted EPS increased 7% to $2.97. Growth was driven by higher adjusted net income from lower interest expense and the benefit of a lower share count from share repurchases. We exclude intangible amortization from adjusted diluted EPS because a significant portion relates to the formation of CORE and MAIN following our 2017 leveraged buyout. Turning to the balance sheet, cash flow, and capital allocation, we ended the year with net debt of nearly $1.95 billion and net debt leverage of 2.1 times, well within our target range of 1.5 to 3 times. Liquidity was $1.45 billion, including $220 million of cash, with the remainder available under our ABL facility. We generated $650 million of operating cash flow during the year, reflecting approximately 70% conversion from adjusted EBITDA. Our free cash flow yield was 5.8%, a level that is nearly three times higher than our specialty distribution peers. We returned $155 million to shareholders through share repurchases during the year, reducing our share count by roughly $3.2 million. And subsequent to the fiscal year, we deployed an additional $39 million to repurchase 800,000 shares. Since our 2021 IPO, we have repurchased over 20% of our original shares outstanding, reflecting our commitment to return capital while continuing to invest in growth. Next, I will cover our outlook on page 16. For fiscal 2026, we expect net sales of $7.8 to $7.9 billion, adjusted EBITDA of $950 million to $980 million, and operating cash flow conversion of 60% to 70% of adjusted EBITDA. We are confident in the strength of the municipal market due to the stability of funding sources and the non-discretionary nature of demand. We remain cautious on the private construction market given the heightened geopolitical volatility, including the developing Middle East conflict and ongoing tariff uncertainties, along with continued uncertainty around the interest rate environment and overall builder confidence. Despite this, we still expect our overall end markets to be roughly flat for the year. We do expect to drive above market volume growth from our sales and geographic expansion initiatives. Drivers include continued strong performance across meters and treatment plant and opening a record 7 to 10 green fields in attractive markets. Despite softer end market conditions and a neutral pricing environment, we expect to grow adjusted EBITDA margins as we continue to execute our gross margin initiatives and realize the benefits of our previously announced cost actions. We expect another year of strong operating cash flow and our capital allocation priorities are unchanged. We will continue investing in the growth of the business both organically and through strategic M&A while returning capital to shareholders through share repurchases. We remain confident in the strength of our business and our ability to execute. We have delivered consistent results through varying market environments, maintained disciplined pricing, expanded gross margins, generated strong cash flow that enabled us to reinvest in the business and return capital to shareholders, and have continued to gain share across our markets. Our operating model is resilient, and our strategic priorities are clear. In the near term, our municipal end market provides stability. Over the medium term, we expect momentum to return in residential and non-residential markets along with a return to a more typical pricing environment as these dynamics improve the structural earnings power we've built positions core and main to unlock meaningful long-term profitable growth and value creation in the meantime we will continue to drive volume through strong execution and above market growth with that let's open up the call for questions thank you as a reminder if you would like to ask a question, you may press star followed by one on your telephone keypad.
Operator
And if you'd like to remove your question, that's star followed by two. Our first question for today comes from David Manthe of Baird. Your line is now open. Please go ahead.
Yeah, thank you. Good morning, everyone. My first question is the one that I get from investors most frequently, which is the growth disconnect of corn main versus the corresponding segment at your largest competitors and i know we've talked about this offline i just was hoping you could maybe just address some of the differences in in vertical and market influence and geographic and product mix and why you think there's a slight disconnect between your growth and your biggest competitor yeah Thanks, Dave.
Appreciate the question and good morning. You know, Dave, I would tell you from an end market, you know, perspective, you know, we feel really good about our presence and reach, you know, certainly across the municipal end market, non-residential and the residential end markets. You know, we clearly are, you know, I would say in every market that our other national competitor is in. You know, we've got, you know, obviously we both compete against a large volume of local distributors and regional competitors. So I think, you know, both us and other national distributor are doing a really good job of taking share across the industry with, you know, certainly us driving a lot of good share growth with our smart meter business. Treatment plant is an area, I would say, that we've grown pretty significantly. I would say that's an area that they've been, I would say, a little ahead of us over the years, but we're rapidly, I would say, gaining ground in that area. And then I think, you know, certainly as part of the data center construction that we've seen pop up, I would say they've been in a little better position in some of those markets, particularly ones that are kind of in their backyard and kind of northern Virginia area. In Texas, in particular, are areas that, you know, we're investing in, I'd say, rapidly to kind of catch that. But what I would tell you is that what I like, you know, in terms of our position there is we're seeing more and more of these data centers pop up across the U.S. And given our geographic reach and our strong relationships we have in these local markets, we've seen a lot of good gains here over the last couple of years on those data centers as we've seen those expand much more broadly across the U.S. And I think our exposure there is going to continue to be helpful as we pick up that business. So we view it as a positive. I think, you know, our large national competitors having good results, we're seeing good share gains. and good results on our side and feel that that's a good thing overall for the industry.
Thank you. I appreciate that, caller. The second question is on cost. So as we think about the cost-out program and the $30 million run rate, I think you said $5 million of the benefit hit in the fourth quarter. That would imply that, I guess, we don't lap that fully until we get to the first half of 2027. Can you just correct me on that if I'm wrong, that you'll continue to see year-on-year benefits from that cost-out program diminishing through the year but still positive through 2026? Is that correct?
Yeah, thanks, Dave. That's what we're expecting. We saw we completed all of the $30 million of cost out during FY25. We got about $1 million of that benefit in the third quarter. We got $5 million of that benefit in the fourth quarter. So that remainder of that $30 million, we'll see all of that really hit in the first, second, and third quarter of next year before we annualize those cost out efforts.
Got it. But if you're at $5 million in the fourth quarter, that implies a $20 million run rate. So there should still be positive, or I should say, you know, lower costs in the beginning of 27 as well. Okay, perfect. Thank you.
That's right. Yep. Thanks, Dave.
Operator
Thank you. Our next question comes from Matthew Booley of Barclays. Your line's now open. Please go ahead.
Hey, good morning, everyone. Thanks for taking the questions and all the detail on the call. So maybe just to address kind of the current market conditions around, you know, energy and commodity inflation, you know, following the Middle East conflict here. So maybe just kind of near term, you know, diesel surcharges, et cetera. How are you expecting to deal with that? How should we think about modeling all that? And then over these past few weeks, kind of what are you hearing from suppliers around, you know, price increases? and how does that play into your guide for flat pricing for the year?
Yeah, thanks, Matt. I'll go ahead and take that one. I would tell you we're obviously watching things very closely as they develop in the Middle East. We definitely have a direct impact as we see some of the increases in fuel with our delivery operating expenses and that sort of thing, but it's still relatively small And we've got a lot of that embedded in the guide that we've laid out. I would say more indirectly, you know, we're watching closely the effects on, you know, the oil and gas market. We have seen that start to, I would say, impact the global resin prices that are out there. So there is some indications that we're going to start seeing some increases coming through on certain product categories related to that. And frankly, you know, just all the operating, you know, if the fuel and those prices continue to increase, I think, you know, we'll see some of that increase flow through some other product categories more broadly. But specifically, as those resin prices increase globally, we're starting to hear signs that, you know, we'll start seeing some increases related to products like PVC, HDP pipe could definitely be impacted by that. and, you know, definitely things that we're starting to hear about right now. So those are, you know, those are things that we'll watch closely as this continues to develop, but I view those as, you know, kind of positive signs for us as we look to see some stability with pricing in some of those product lines. So overall, I'd say we kind of view it as neutral to positive, you know, if this kind of disruption continues in the market from that standpoint. but obviously any kind of uncertainty the rising fuel prices within you know the global economy you know we're definitely concerned that that that could create a little bit uncertainty in the macro just demand environment you know which is part of why you know I think you saw you know the the nature of the guidance that we put out there was just given a lot of that overall uncertainty that we could experience got it okay no that's that's great color Thanks for that, Mark.
And then secondly, kind of stepping back around some of the growth investments. I heard you saying you're, you know, you're focusing investments in areas like data center, maybe treatment plants as well, if I heard you correctly, sort of looking to close that gap versus your competition. I guess, number one, just any way to kind of quantify the investments you're putting in there, just obviously, we're trying to dial in the SG&A outlook. But again, kind of stepping back you know what what are some of the specifics uh you're looking to do uh here whether it's from you know in terms of your sales force etc you know what what kind of needs to be done and what would the kind of resulting impact be on on you know again these large projects out there thank you yeah hey this is brad coles i'll take that um you know the initiatives that i highlighted kind of the biggest movers for us with the most attractive kind of growth dynamics, I'd put smart utility in there, but also the treatment plant.
And the resources that we invest in to do treatment plant work adapt very well to all of the, what I just generally call higher capacity, more complex water delivery projects, which are on data centers or large plants, water transmission lines, and actual water treatment plants themselves. And that structure that we put in place, one of those national complementary team structures that we use to kind of enhance the capabilities of the local branch, we're going to be investing upwards of another 30 people in that initiative this year just to give you a sense of the scale. And those are resources that are kind of positioned both regionally and nationally to, they're a little bit more mobile and cover a little bit more geography than a branch, which is serving generally a kind of a fairly tight radius. And so they go where the work is. They follow these strategic national accounts. And, you know, they bring that level of expertise that really builds confidence and trust in us and accelerates the ability to win on those bigger projects.
Great. Thanks, Brad. Good luck, everyone.
Operator
Thank you. Our next question comes from Joe Ritchie of Goldman Sachs. Your line's now open. Please go ahead.
Thank you. Good morning, everybody. So, first question maybe for Mark. So, you take a look at the guidance of, you know, kind of 950 to 980 EBITDA guidance for the year implies 2% to 5% EBITDA growth. So I guess, how are you thinking about the kind of range of options here between the low end and the high end? And if we can maybe dig in a little bit on some of the main components, whether it's SG&A, gross margins, the investments that you're making, that would be helpful.
Hey, Joe, it's Robin. I'll take that one. Thinking about the guide and what we laid out here, obviously, it's an unusual time with a lot of uncertainty with what's going on in the macro environment. So, you know, we felt like we needed to be prudent with what's going on externally. So with the guide, we've got the market kind of flattish. We'll always deliver on that above market growth. And we do have a little bit of M&A in there that we completed last year. What we've got embedded in the guide is expecting pricing to be about flattish. For the year, it might look similar to what we saw in FY25. Now, obviously, with what Mark just mentioned on the price of resin increasing, we could see a little bit of lift there, and that's an opportunity for us. So, if you think about the guide and what we've laid out and the opportunities that we have to perform on the high end of that or even outside of that, it's things like, you know, if we get a little bit of price, that's going to be incredibly helpful for us on the top line. That will help us get more SG&A leverage. You know, we're expecting the residential market to continue to be, you know, at the levels that it's been performing lately. So that'll be a headwind in the first half of the year for us, given where that activity is sitting today. But if some of the uncertainty, you know, settles out and we do see a little bit improvement in the markets, then that could obviously help us as well. Any extra lift we get on the sales side will help us hit those SG&A targets and help us get better leverage there. We have a lot of confidence in gross margin. Our private label initiative has been performing really well. We expect that to continue and expect to continue to deliver on gross margin initiatives. And then I think you asked also on the low end of the guide, obviously, you know, if there's higher inflation than what we're expecting, we did see a lot of inflation in FY25. That was in the mid-single digits range. We typically expect to see that in the low single digits range, which is what we're expecting. But if any of that inflation comes in higher or if any of the markets are a little bit weaker, that would bring us in at the lower end of that guide.
That's super helpful, Robin. And then maybe my follow-on question uh you know either for either for um you know for brad or or for mark just on the m a uh discussion uh so you guys have had um just an incredible track record of compounding via m a over the last several years um we can go back to the to the hd supply days but like the when i look at this year this year was a little bit lighter or or the the most completed year was a little little bit lighter how are you guys thinking about getting back to maybe that cadence of you know maybe two to four points a year and then also is is that is it is that opportunity um you know likely to occur you know this year like how just just just just help us walk walk us through like kind of the 2027 expectations for mna and and your ability to to maybe kind of get back to to what the more normalized cadence was for the company yeah thanks joe i'll take that you know In terms of the M&A, I tell you I'm extremely confident in our capabilities there and the pipeline that we have.
Even though 2025 for us was a lighter year, we still delivered on the low end of the M&A growth target that we put out from 2% to 4%. There just has not been a lot trading in our industry, and we are incredibly well positioned with the relationships that we have, with the opportunities that are out there. It tends to be choppy. We've had some lighter years, you know, in our recent history as well. So, you know, we've had some years where it's come well beyond that range. You know, so I do expect that it will be choppier. I do think we've got a really good pipeline of opportunities right now that we're looking at. So expect 2026 will be a year for us where we're kind of right in that range with, you know, plenty of opportunities that we're keeping a close eye on that could extend us, you know, beyond that. So I feel really good about, you know, the M&A that we've got. And then, you know, as you've seen, in a lighter year, we're also opening up a record number of greenfields as well. So we've got both levers. We're well positioned to capture that, share one way or the other, and feel confident in our team's ability to go do that.
Operator
Thank you. Our next question comes from Matt Johnson of UBS. Your lines are open. Please go ahead.
Hey, good morning, guys. Appreciate the time here. I guess first off, if we could just talk about the meters business a little bit. that I think you guys have sounded pretty excited about this business for some time now. So I guess, can you guys just give a little more detail on what level of growth you're expecting for this segment in 2026, and also how much of a contribution you guys are expecting from the contract that you guys talked about this past quarter, and just any kind of more color you could give on the magnitude and the timing of that contract would be great.
Yeah, thanks, Matt. This is Brad, I'll take that. But this initiative is, you know, it's been an exciting area for us. We've just consistently delivered, you know, at least low double-digit growth year after year. We continue to invest, and I think we keep getting better. Those large projects that we win can represent in a given year between maybe a third or a little more than a third of kind of our volume. Keep in mind, we have a massive underlying base of municipal sales that drive kind of your more everyday repair and replace and upgrade meter projects. But those large ones have been quite interesting and more substantial as we've become kind of the preferred prime contractor, if you will, for that scale and complexity of project. In 2025, we had another incredible year. We were comping, I think, 32 percent growth from the prior year. So it was a bit of a stretch, but I think we're back on our stride. You heard Mark say we pushed a 12% growth in the quarter on the meter initiative. And I'd say early innings in 2026, we feel like we're back on stride, even having swallowed that pretty large step change in 24 to 2025. So I'm pretty excited about it. We're investing additional resources there, much like we are in treatment plant, to keep our coverage strong. I've got a good pipeline of additional large projects and expect to have that same kind of balance going forward in 26 where we still have a massive base of underlying municipal meter sales and then a nice third to slightly higher coming from those big projects.
That's great. Appreciate that. And then also if we could just, I guess, to get a little more detail on what you guys are expecting for the resi and market this year. I think Robin said expecting down in the first half before leveling off in the second half. So I guess any kind of color you can give on what level of declines you guys exited the year at and then how you're kind of expecting that to shape up through the year would be great.
I would tell you, you know, as we exited 2025, we felt that it was sequentially, you know, pretty stable but at low levels. And so we kind of work our way here into early 2026. we're definitely in a different position than we were last year at this time. You go back to the early part of 2025, and there was some optimism out there in the builder and development world. There were projects that we saw a lot of good bidding activity on, and we saw some good volume in the early part of 2025, which then definitely tapered off as we got into the second quarter and then into the back half. So I'd say sequentially, you know, it's been stable, but we're definitely in a different position than we were last year at this time, which is kind of what's leading us to believe, you know, Resi will be relatively soft year over year to start the year and should ease in terms of the comparisons as we get into the, you know, second half of 2026.
Operator
Our next question comes from Mike Dahl of RBC. Your line is now open. Please go ahead.
Good morning. Thanks for taking my questions. Can we just stick with the end market conversation? And Mark, let's just put a finer point on things. So if Resi was down low double digits for the year in 25 and clearly worse in the second half, is this commentary to suggest that given the tough comps, Resi is likely down something like mid-teens or worse in the first half of the year and still winds up down high single digits, 10 percent? And I think people are just trying to bridge to the, like, more specifically, you know, yes, the resi, but then also if we step back within the flat blended end markets, the quantitative build of what is resi, what is non-resi, what is muni. So if you could help dial that in and maybe also just as part of that quarter date trends, if you could enlighten us a little on how that's shaped up, obviously, a lot of weather dynamics, et cetera.
Yeah. Hey, Mike, I'll take that. So starting with RESI, the way that we're thinking about that is that we had a decent residential end market in the first quarter of last year. As Mark mentioned, there was some optimism for the second half of the year, and the home builders were still developing some lots during that time. So we saw some good activity in the first quarter. So we're going to be anniversary-ing that tougher comp in the first quarter. So expecting the first part of the year to be down in the low double digits to mid-teens range for residential, and then sequentially improving throughout the year. So the second quarter could look something like down high single digits, and then maybe it's flattish in the back half of the year. Really not expecting at this point that residential gets much better. There's nothing pointing to that yet. Obviously, there's some optimism there, and there's some pent-up demand at some point, but the timing of that is uncertain. So tougher comp in the first half of the year for RESI, and then that starts to improve, and maybe we get to about flattish by the end of the year because those comps get easier. On the non-residential side – sorry, on residential, so we're expecting that all works out to be about – down about mid-single digits for RESI for FY26. And then on the non-residential side, we're expecting it to perform somewhat similar to FY25, which is in the flattish range. There's a lot of project types within our non-residential, and there's some of those project types that are performing well, some of the data centers, some of the street and highway projects, multifamily. And then there's a lot of that lighter commercial type of work that's been softer this year, retail, office space, some of those areas. And we're not expecting a lot of change in what we've seen there, so expecting the non-residential market to be flattish. And then on the municipal side, this is an area that's very steady, stable, strong for us, had a really good year in FY25, expecting that to continue to perform well. In the guide, we've got embedded low single digits growth there on the municipal side. but this is an area that's got ample funding at the state level the federal level at the local level we feel like this is a really key and important market for us that we think is going to be strong and stable over the short medium and long term that's helpful thanks and makes a lot of sense um on the just as a follow-up just in light of the recent uncertainty and some of the early signals that you're seeing where certain categories could have to potentially take price.
How are you thinking about inventory management? Because a lot of these categories probably have some slack where if you wanted to lean in, maybe you could buy ahead of some of this. But just curious to get your thoughts on how you're thinking about that.
Yeah, I would tell you, you know, that's something that, you know, we do really well here at CornMain is managing kind of the ins and outs of those inventory investments, especially when there's some indications of price volatility. That's always been, I'd say, a really good driver of gross margin expansion for us and that ability to identify where and when we see those price increases and where and when to make those investments from an inventory standpoint. I think our teams do an extraordinary job of, you know, getting a lot of that product ahead of those increases and then working to get that, you know, into the market at the appropriate time. So I'd say that's been, you know, the standard part of our execution playbook and something that, you know, we generally do pretty well.
Operator
Thank you. Our next question comes from Nigel Coe of Wolf Research. The line is now open. Please go ahead.
Oh, thanks. Well, we cover a lot of ground here, but I'm just wondering if maybe you could comment on what you're seeing through the first quarter. Just given the comments from Robin on the residential market, it looks like we might be below that 2% to 3% in the first quarter. Just want to make sure that's the case. And then, you know, when it comes to the end market outlook, I think it's obviously keeping a conservative stance here. It makes a lot of sense given the backdrop. I think a lot of investors are surprised that pricing is flat given the acceleration we've seen in inflation before. this Iran shock. So just wondering, is it simply the PVC headwinds here or are there any other competitive impediments to getting price here?
Yeah, Nigel, I'll touch on what we're seeing so far in the first quarter and then hit on the pricing part. In the first quarter, we've got a January 31 year end, so we've been through February and not quite all the way through March yet but i would say what we're seeing is pretty well in line with our guide we are expecting the first quarter to be our toughest comp quarter so we are expecting uh you know sales and ebitda might be down a little bit slightly year over year and then improving as we go each quarter and that's in line with what we were expecting we did see about a 15 to 20 million dollar weather impact the last week of our fiscal year when there's a, you know, deep freeze and a lot of winter severe weather. We're getting a lot of that back in the first quarter, so we think all of that will just come back in the first quarter. Gross margins are performing strong. SG&A, we're seeing some of the cost-out impact favorability there, so feeling good about the first quarter, obviously on soft markets and, you know, probably be down slightly year over year on the quarter, but it's coming in really in line with guide and expect it to improve as we get throughout the year. And then on the pricing side, all of our product categories were basically up in FY25 except for PVC. PVC was down about 15% in the year. So, you know, there's a variety of different outcomes that we can see in FY26, but we're not counting on a full recovery of PVC. Some of the oil increase prices could help either stabilize that or increase it, but what we're seeing today is, you know, PVC will have a, you know, as it's gone down all throughout the year, we're going to have a headwind at least in the first half to three quarters of the year on PVC, even if it stabilizes where it's at today. So that would be the puts and takes we would expect price increases in all of our other product categories.
Thanks, Robin. That's really helpful. And then just a quick one on buybacks. I think from the K, it looks like you bought back about 7,000 shares in February, March. That's a decent chunk of shares compared to what you did in 2025. Just wondering if there's the intention to keep stepping on buybacks at these current share prices.
Yeah. Yeah, Nigel, we did about $155 million last year. almost $40 million in the first quarter. Given where the stock price is at, we've got ample cash flow. We've got tons of cash to be able to reinvest in the business M&A and do buybacks. So you can expect us to see continued buybacks. We've got about over $600 million still remaining on our authorization. So that'll be a big part of our capital allocation going forward.
Operator
That's great. Thank you. I'll now hand it back to Mark Witkowski for any further remarks.
Thanks for joining us today. As we wrap up, I want to leave you with a few key points. Fiscal 2025 was another year of disciplined execution. We delivered our 16th consecutive year of sales growth, drove three points of above market growth through share gains, and structurally expanded gross margins, all while generating strong cash flow. At the same time, we continue to invest in the product categories, footprint, and capabilities that position us to compound these gains over time. Looking ahead, we see a clear path to growth and improved operating leverage. Our initiatives are working, our actions to address cost pressures are in place, and our end markets remain attractive over the long term. Over the last 12 months, I've spent meaningful time with customers, suppliers, and associates across the country. Those conversations reinforce what differentiates this company, our people, our culture, and our consistent focus on execution. I'm grateful for our teams and confident in the opportunity in front of us. Thank you for your continued interest in Quarren, Maine. Operator, that concludes our call. Thank you all for joining today's call. You may now disconnect your lines.