Operator
Good day and thank you for standing by. Welcome to the Q1 2026 Emergent BioSolutions Earnings Conference Call. At this time, all participants are in a listen-only mode. After the speaker's presentation, there will be a question and answer session. To ask a question during the session, you'll need to press star 11 on your telephone. You'll then hear an automated message advising that your hand has raised. To withdraw your question, please press star 11 again. Please be advised that today's conference is being recorded. I would now like to hand the conference over to your first speaker today, Frank Vargo, Vice President, Treasurer. Please go ahead.
Operator
Good afternoon, everyone, and thank you for joining us as Emergent discusses its operational and financial results for the first quarter of 2026. As is customary, today's call is open to all participants is being recorded and is copyrighted by Emergent BIOS Solutions.
Operator
In addition to today's press release, a slide presentation accompanying this webcast is available to all webcast participants. Turning to slide two, during today's call, Emergent may make projections and other forward-looking statements related to its business, future events, prospects, or future performance. These forward-looking statements are based on our current intentions, beliefs, and expectations regarding future events.
Operator
Any forward-looking statement speaks only as of the date of this conference call and except as required by law, Emergent does not undertake to update any forward-looking statement to reflect new information, events, or circumstances. Investors should consider this cautionary statement as well as the risk factors identified in Emergent's periodic reports filed with the SEC when evaluating these forward-looking statements.
Operator
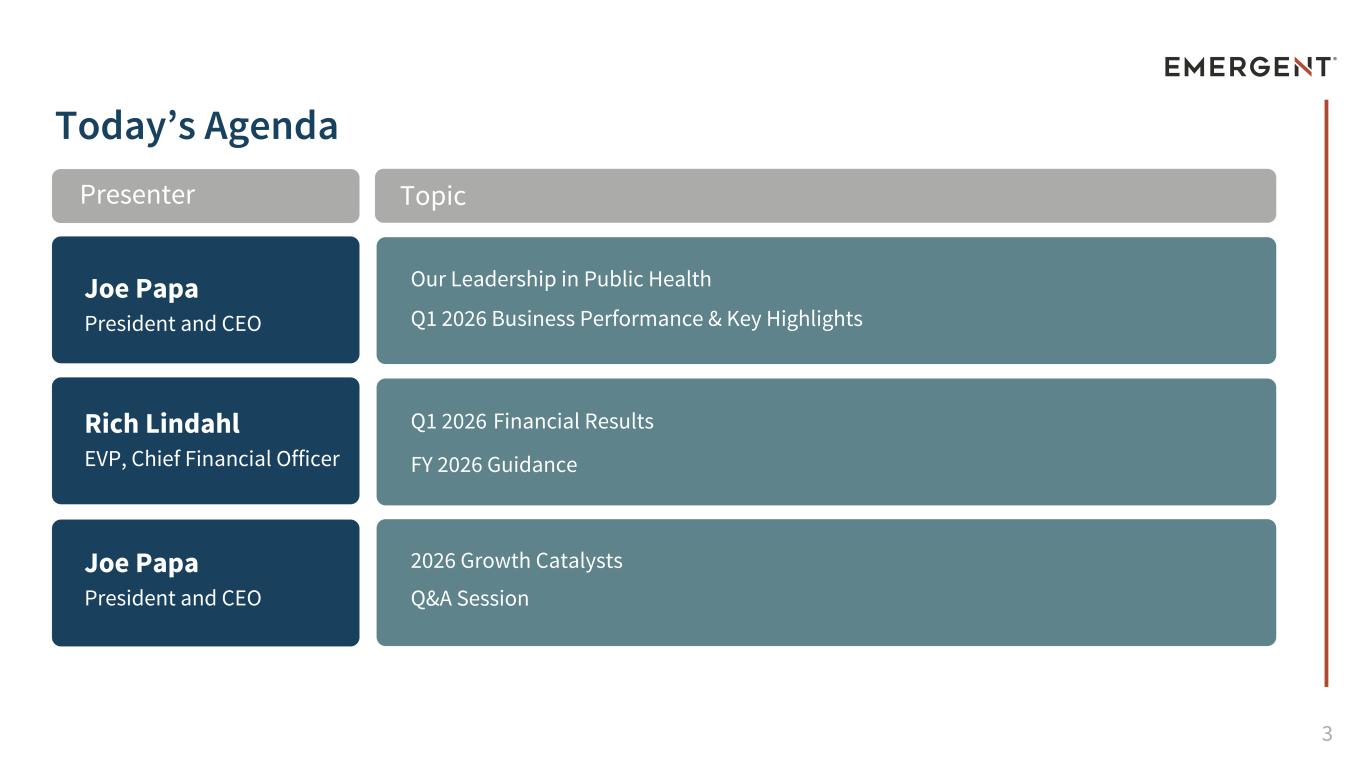
During today's call, Emergent may also discuss certain non-GAAP financial measures that include adjustments to gap figures to provide additional transparency regarding the company's operating performance. Please refer to the tables included in today's press release. Turning to slide three, the agenda for today's call includes remarks from Joe Papa, President and Chief Executive Officer, who will provide an update on the company's leadership in public health preparedness, business performance, and key highlights. Rich Lindahl, EVP and Chief Financial Officer, will then review the first quarter 2026 financial results and provide an update on the full year 2026 guidance. Joe will conclude with a discussion of the company's key catalysts for growth, followed by a question and answer session. Finally, for the benefit of those who may be listening to the replay of this webcast, this call was held and recorded on April 30th, 2026. Since that time, Emergent may have made announcements related to topics discussed during today's call. With that, I will now like to turn the call over to Joe Poppett.
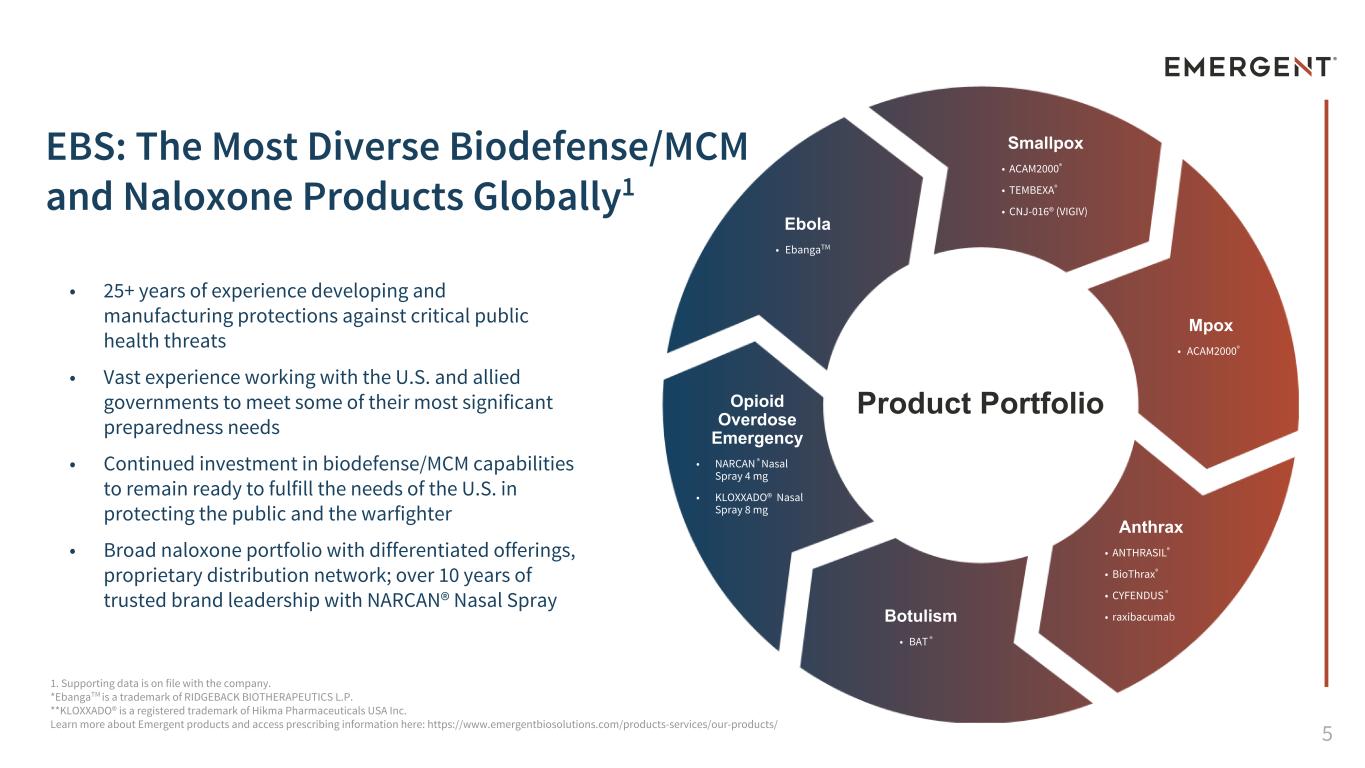
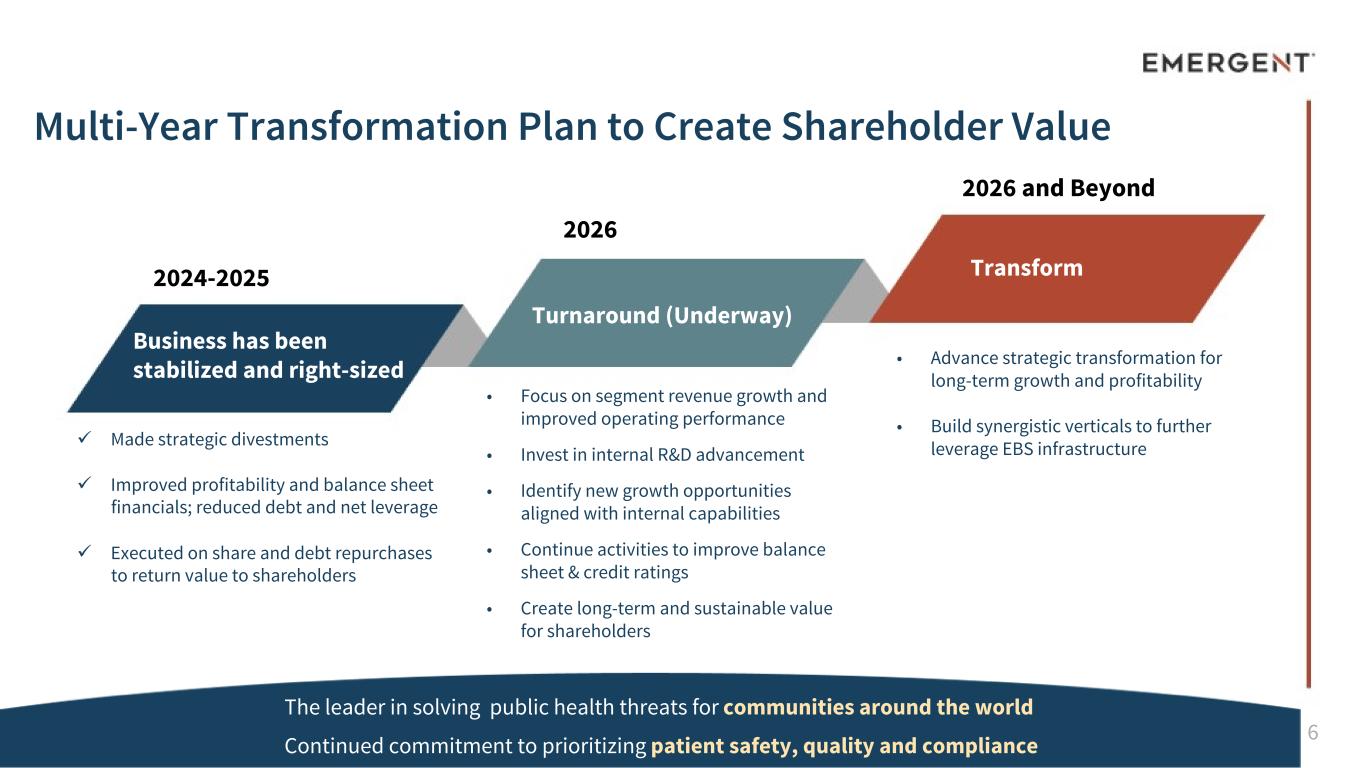
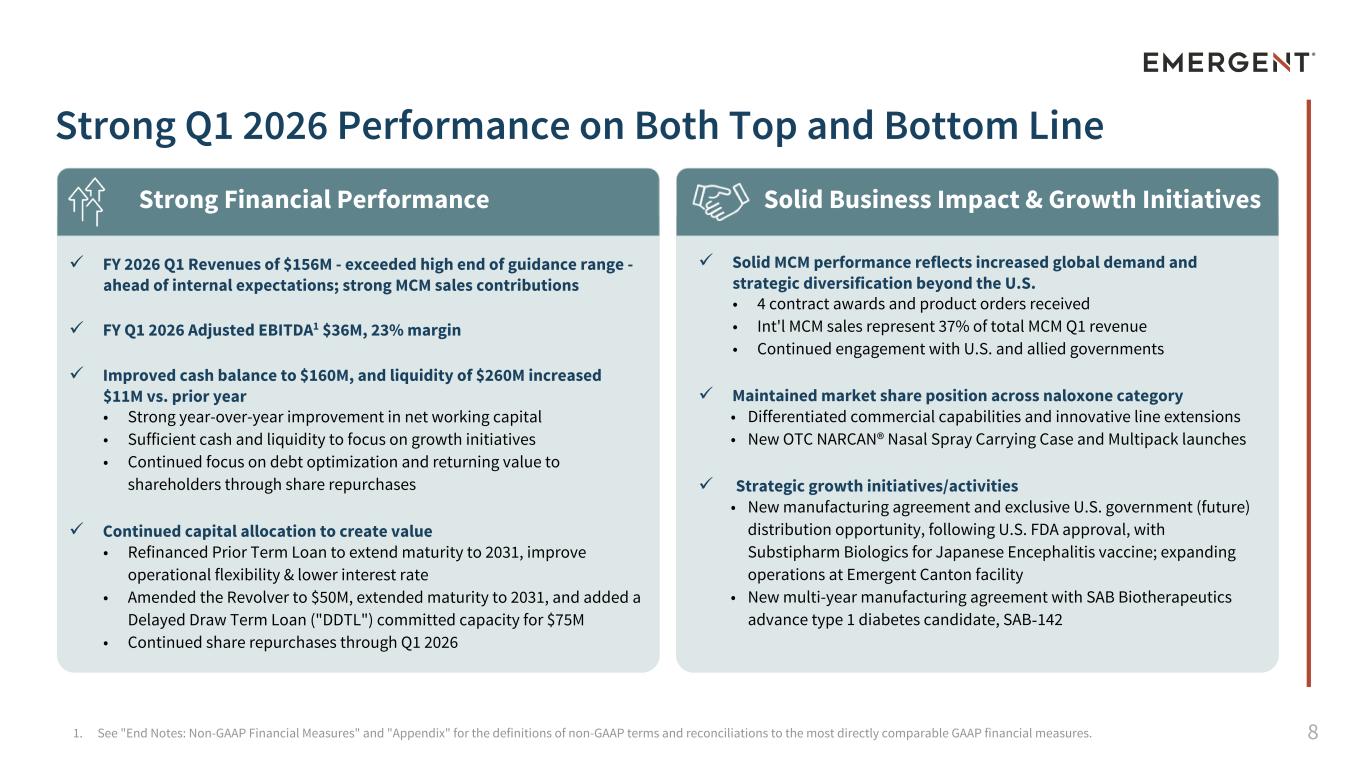
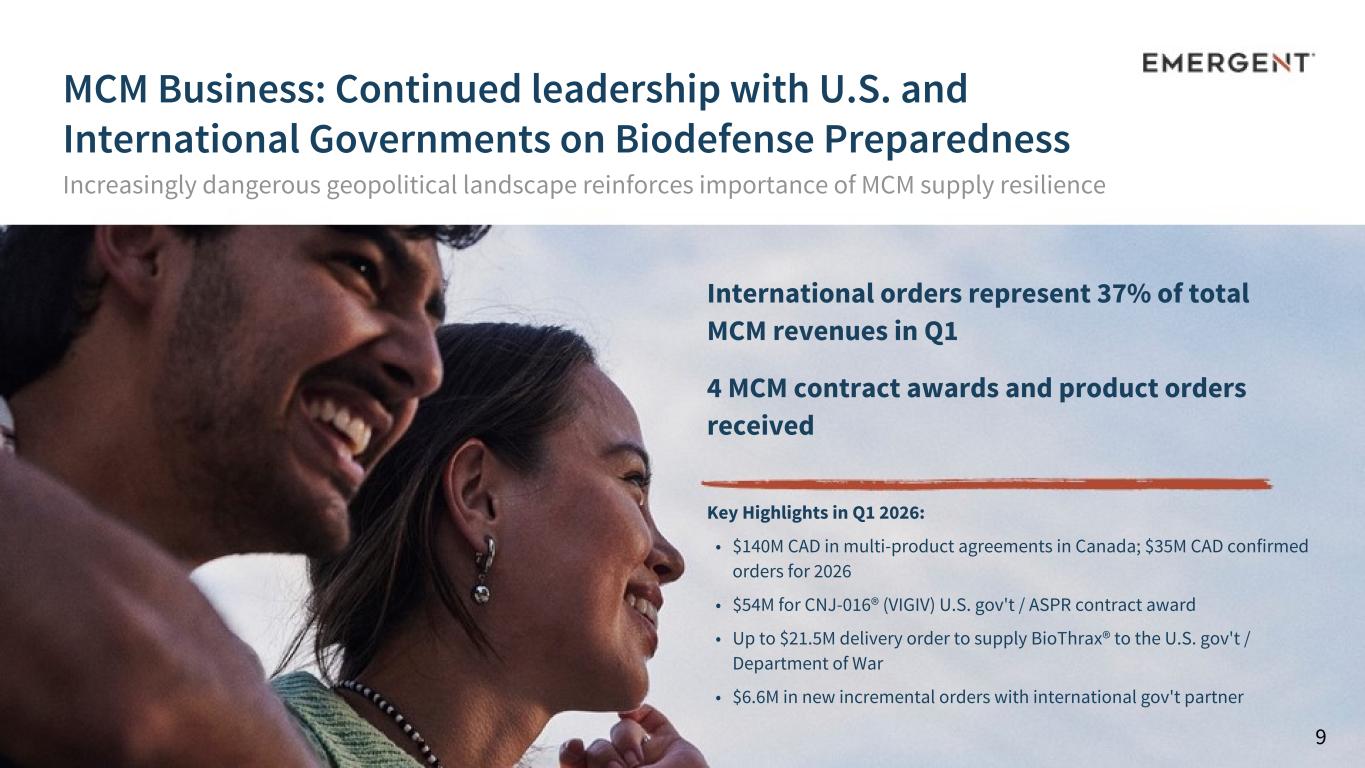
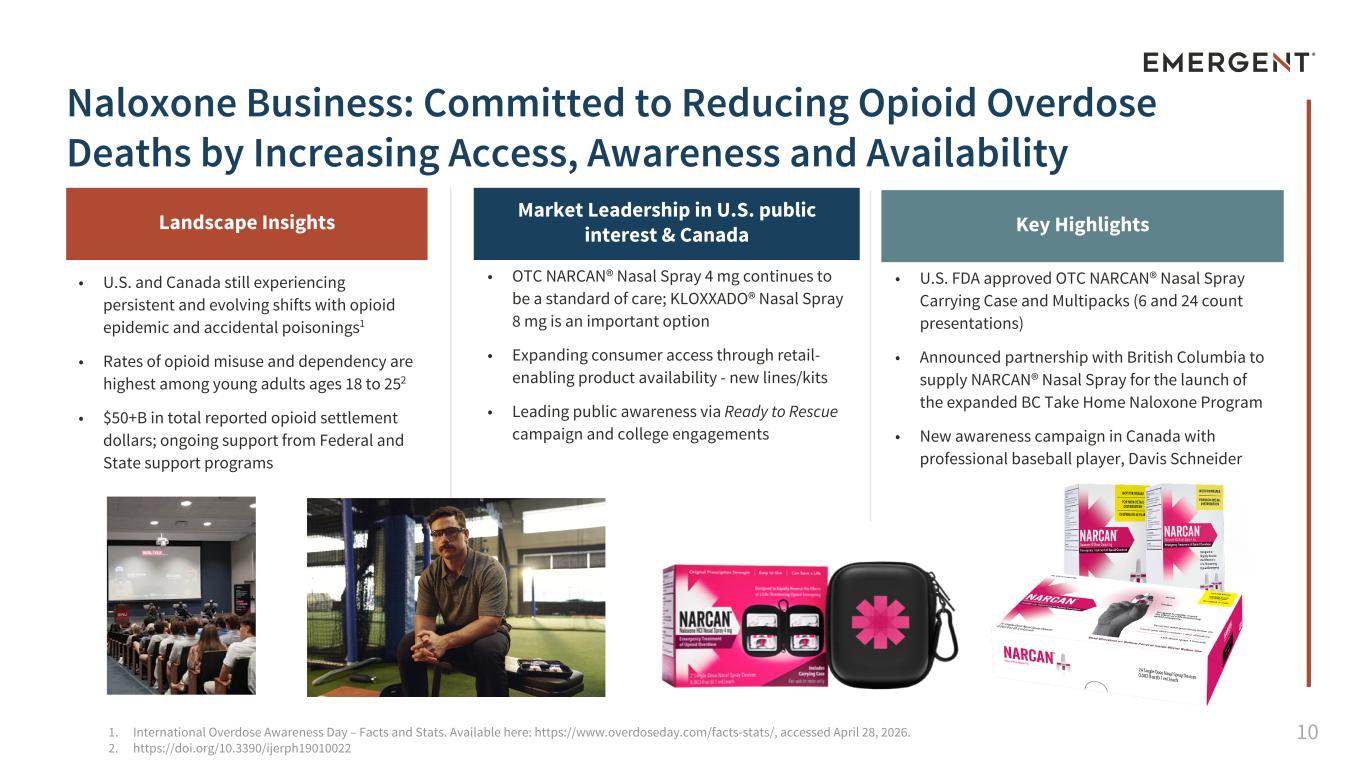
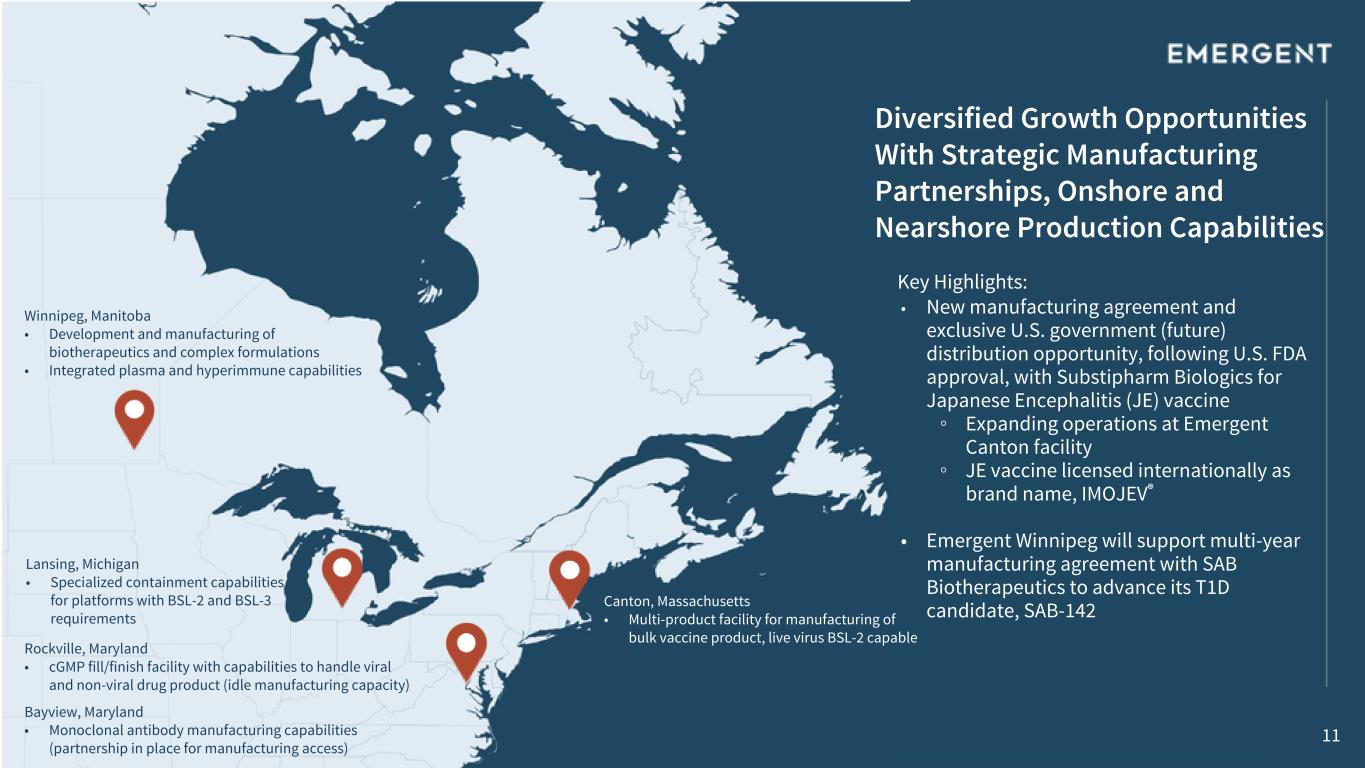
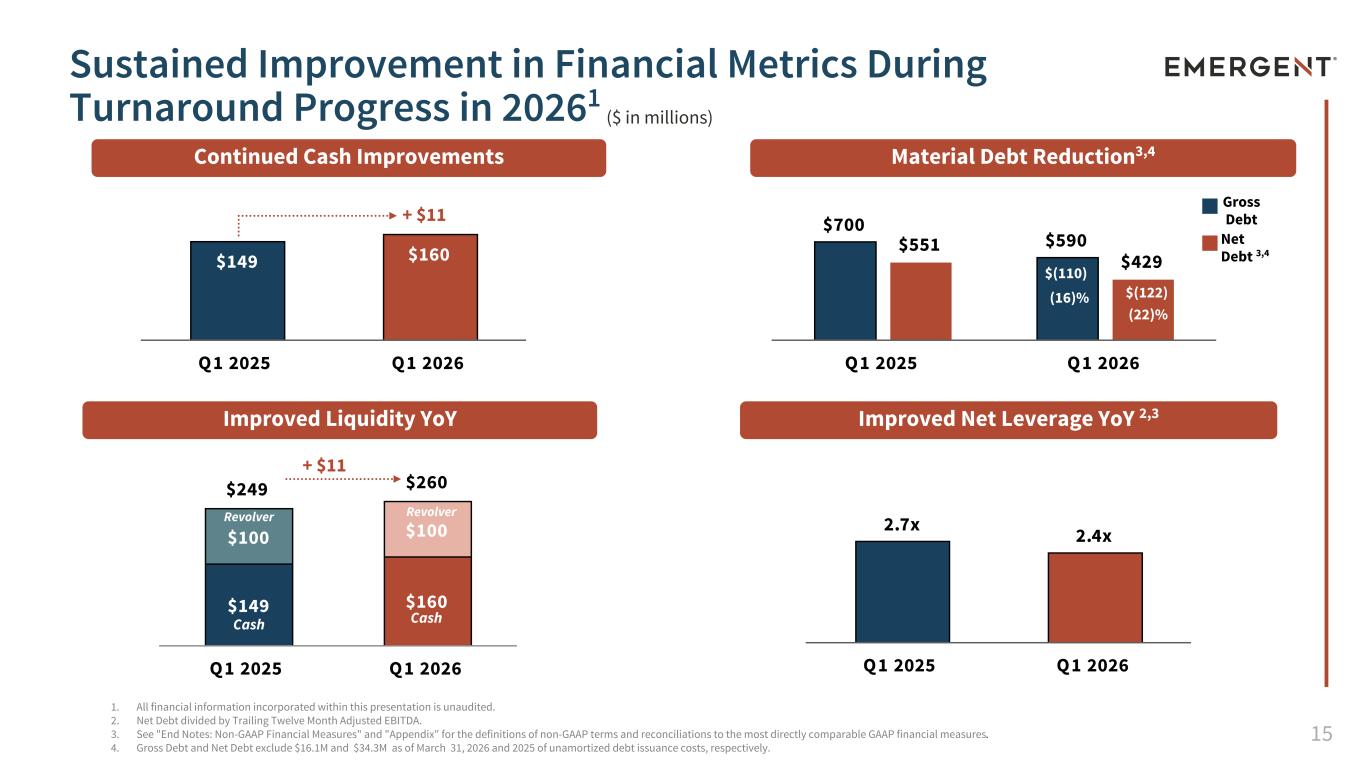
Thank you, Frank, and good afternoon, everyone. Welcome to our first quarter 2026 earnings call. This is Joe Poppett. I'm joined today by Rich Lindahl, our Chief Financial Officer. Let's turn to slide five. Our aspiration at Emergent is to be the leader in solving public health threats around the world. Over the last 25 years, we have built what we believe is the most diverse biodefense product portfolio in the world. Our medical countermeasures address anthrax, smallpox, mpox, Ebola, botulism, and complications from smallpox vaccination, alongside the leading branded Nalaxone franchise with our Narcan nasal spray, which has a decade of trusted brand leadership. We believe in our unique position within the industry to demonstrate just how public-private partnerships are critical for national security. Turning to slide six, since implementing our multi-year transformation plan in 2024, we have stabilized and right-sized the company in order to provide the merchant with a strong foundation for future growth. 2026 marks a pivotal year of our transformation as we invest in high-growth opportunities. I'm pleased to note that this process is now well underway. We are focusing on segment revenue growth and improved operating performance. We are generating strong cash flow for continued investment in internal R&D and quality capabilities. We have identified product acquisition opportunities that address unmet medical needs and have the potential for sustainable long-term revenue growth. Debt reduction will remain a priority for us. In 2025, we reduced our net debt levels by approximately 22 percent, and we have planned for further improvement on our balance sheet and credit ratings. Collectively, these activities are about putting in place the foundations for creating sustainable long-term value creation. To move to slide eight, we'll take a look at our first quarter highlights. Thanks to the great efforts of our Emergent team, our first quarter results are evident in both our top and bottom line performance. We reported first-order revenue of $156 million, which exceeded the high end of our guidance range and was ahead of internal expectations. Adjected EBITDA came at $136 million, also above our internal expectations, representing a 23% margin. It's driven by continued efforts to deliver a lean and operationally efficient customer-centric business model. For example, net working capital improved by over $100 million since Q1 2025. We improved our cash balance by $11 million versus the prior year to $160 million, and our total liquidity increased to $260 million. Our strong cash position enabled the repayment of $110 million in debt last year. On the capital allocation side, we continue to create value. In April, we announced the refinancing of our prior-term loan, which enabled us to secure a more favorable interest rate. We also amended our revolver to $50 million and established a new delayed-draw term loan facility for $75 million. We also continued our share repurchase program, buying back $9 million in shares in the first quarter. Since the start of the share repurchase program in 2025, Emergent has repurchased approximately $34 million of shares. Turning to our business performance, overall, MCM performed very well, expecting increased global demand and strategic diversification in our international market, which now represents 37% of our total MCM revenue. We received four contract and product orders in the quarter. With respect to the Naloxo business, we continued maintaining the shared leadership. We command a competitive pricing strategy and recently launched our newest product offering, the Narcaid Naval Spray carrying case and a multi-pack configuration, both of which are already performing very well in the first month of launch. We believe on slide nine, the world is an increasingly dangerous place, and public health preparedness in the face of potential threats is critical. We are proud of our long-standing partnership with the Government of Canada. And in Q1, we announced a $140 million multiproduct agreement. We also executed a $54 million big award with ASPR and approximately $21.5 million delivery order to supply BioFrax to the Department of War. Our MCM business represents an important driver of our future growth. And with the added flexibility from our recent financing, we see multiple opportunities to acquire high growth and complementary products to our MCM portfolio. Our mission on slide 10 to protect and save lives is answered every day with the work we do to drive access, awareness, and availability of life-saving naloxone. We are in lockstep with U.S. public interest customers, the Canadian health officials, retail customers, and all the communities in need. We're keeping a pulse on the staggering overdose death rates and ensuring our best efforts to help combat the thousands of lives lost each month. We believe over-the-counter access to Narcan should be more publicly accepted and normalized, just as other life-saving emergency tools are like defibrillators or fire extinguishers, for that matter. Just in the news this week, there's national attention on the opioid settlement funds of over $50 billion, which supports states, local municipalities, tribes, and other entities help turn the tide from the detrimental effects of the opioid crisis. The Purdue settlement alone released over $5 billion for the state for education and Nalaxone purchase. There's a tremendous amount of work left to be done to expand access and awareness to Nalaxone and to ultimately bring the number of overdose deaths down to zero. Federal and state programs also continue to support Nalaxone funding and services through the SOAR and Substance Use Block grants. We just announced a new awareness effort with Nalaxone Narcan for pro baseball player David Schneider. David Schneider shares his personal story in his late brother's honor. Our goal is to raise awareness of Narcan. They'll save lives from opioid poisoning so no more families feel the same heartbreak. Additionally, we recently announced a partnership with British Columbia to supply Narcan nasal spray for the province's take-home Nalaxone program. This order followed an additional investment of $18 million Canadian by the government of British Columbia. In the U.S., the U.S. Public Interest Channel performed in line with our expectations for The U.S. FDA approved our Narcan Nasal Spray Terrain case in multi-pop options, delivering on our promise to offer new line extensions to patients and customers. We will continue to engage the public across the country, especially in college campuses, with our Ready to Rescue campaign to help drive adoption where young adults made the efforts. Since 2016, Emergent has delivered more than 100 million doses of Narcan nasal spray to people, communities, and businesses across the U.S. and Canada to help save lives from opioid poisons. On slide 11, we are pleased to share that part of our durable and sustainable footprint, we are now expanding our Canton manufacturing site in Massachusetts. Our new strategic partnership with Substifarm Biologics enables us to restart the manufacturing at the Canton facility to support the Japanese encephalitis vaccine. Emergent entered into a U.S. distribution agreement with Substifarm to support the product opportunity with the U.S. government following U.S. FDA approval. This opportunity establishes our new approach to external manufacturing partnerships, going beyond a fee-for-service CDMO approach to one that allows us to share in the product's potential success. In addition, just yesterday, we announced the second strategic manufacturing partnership with SACB Biotherapeutics to advance their type 1 diabetes autoimmune candidate. This work we led by our Winnipeg team. We are excited for the ability to partner with such a dynamic company. Let's hear from Rich, who will run through our financial results. Rich?
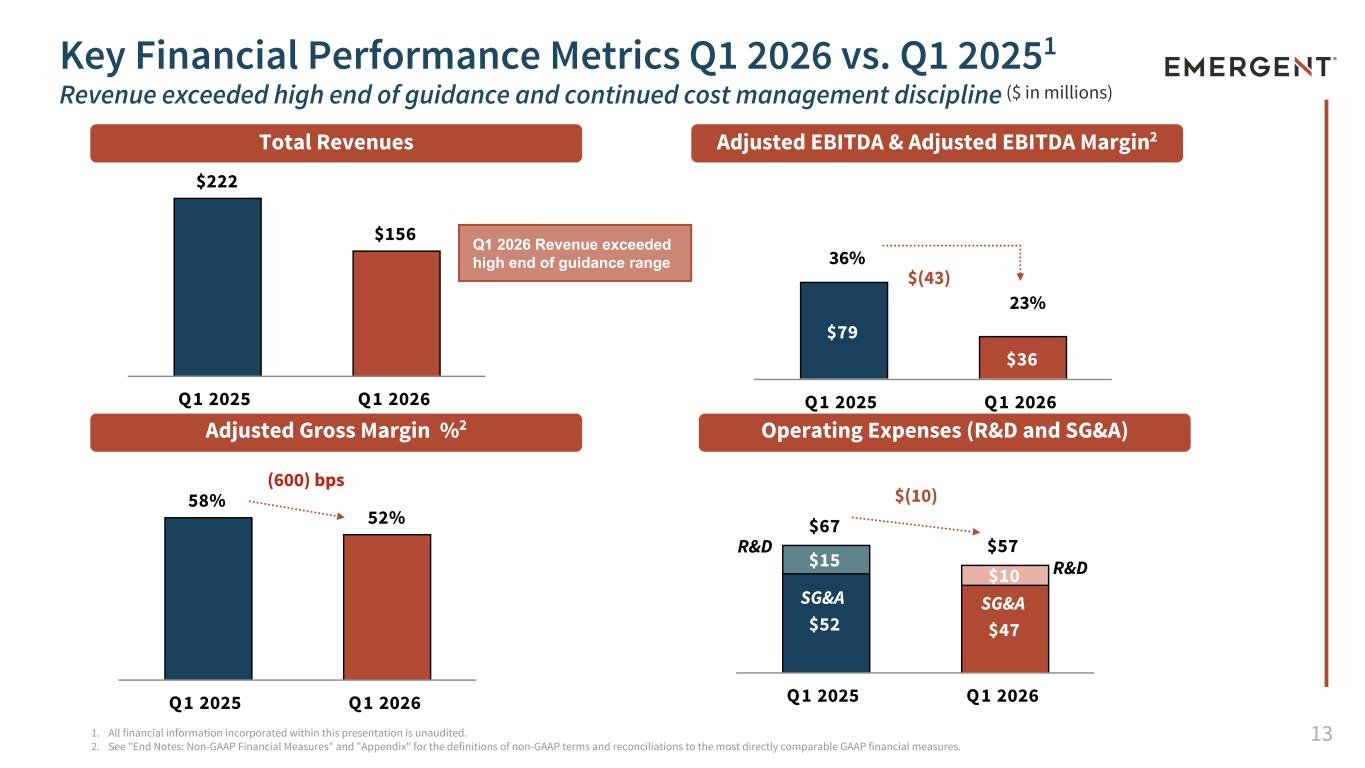
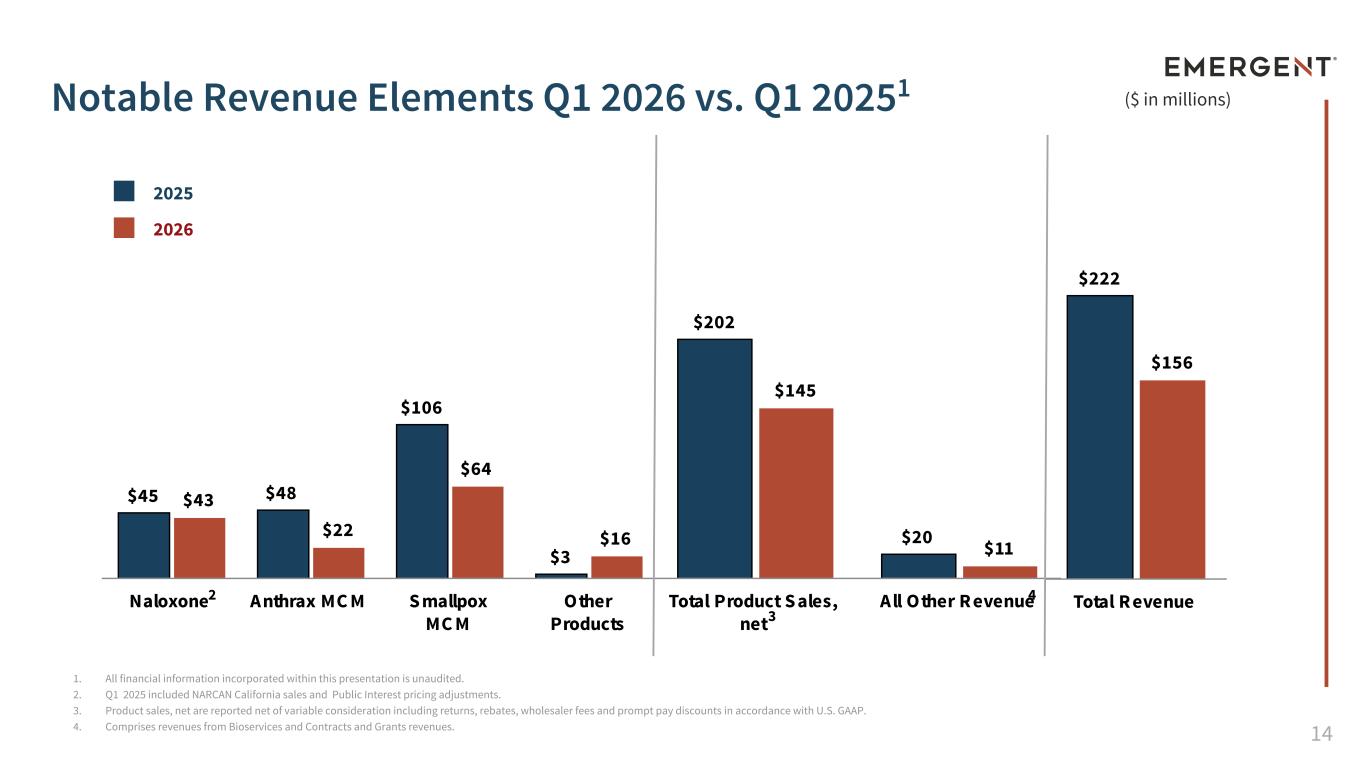
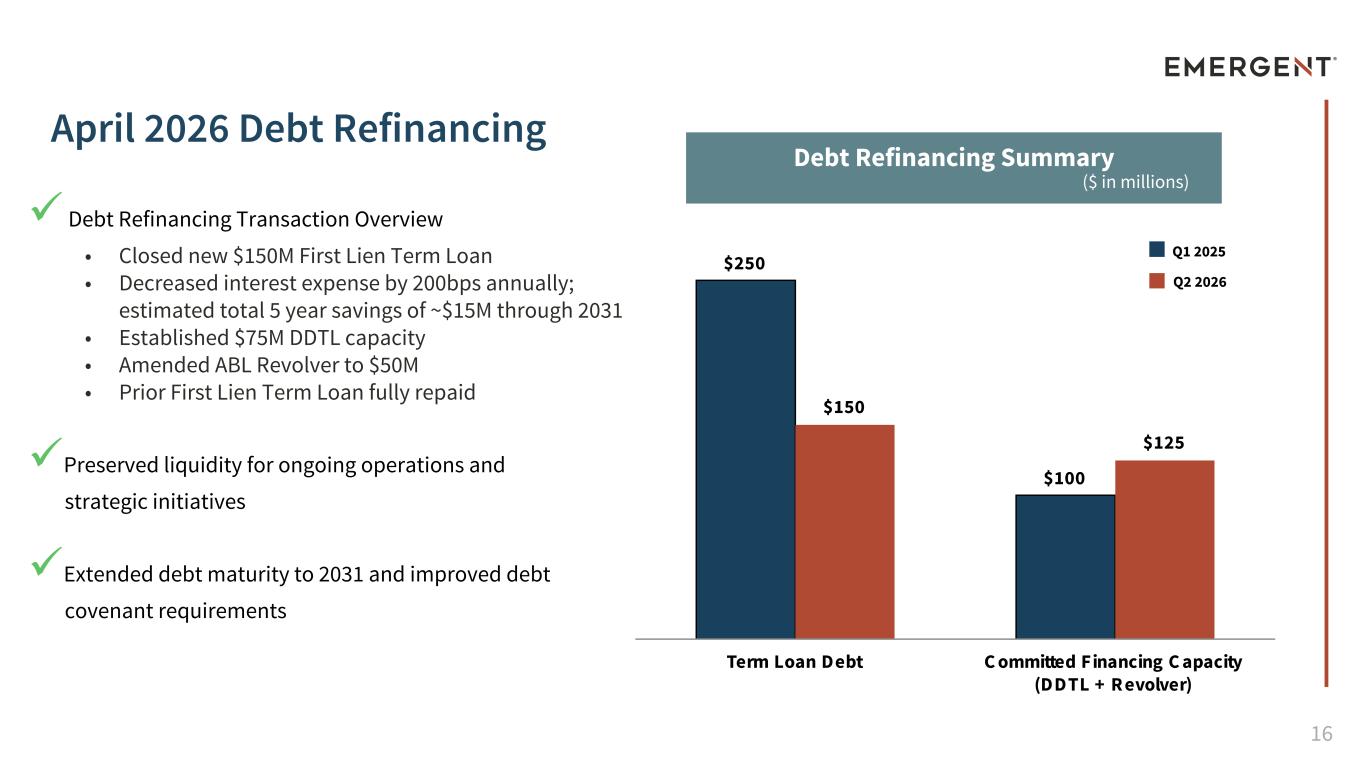
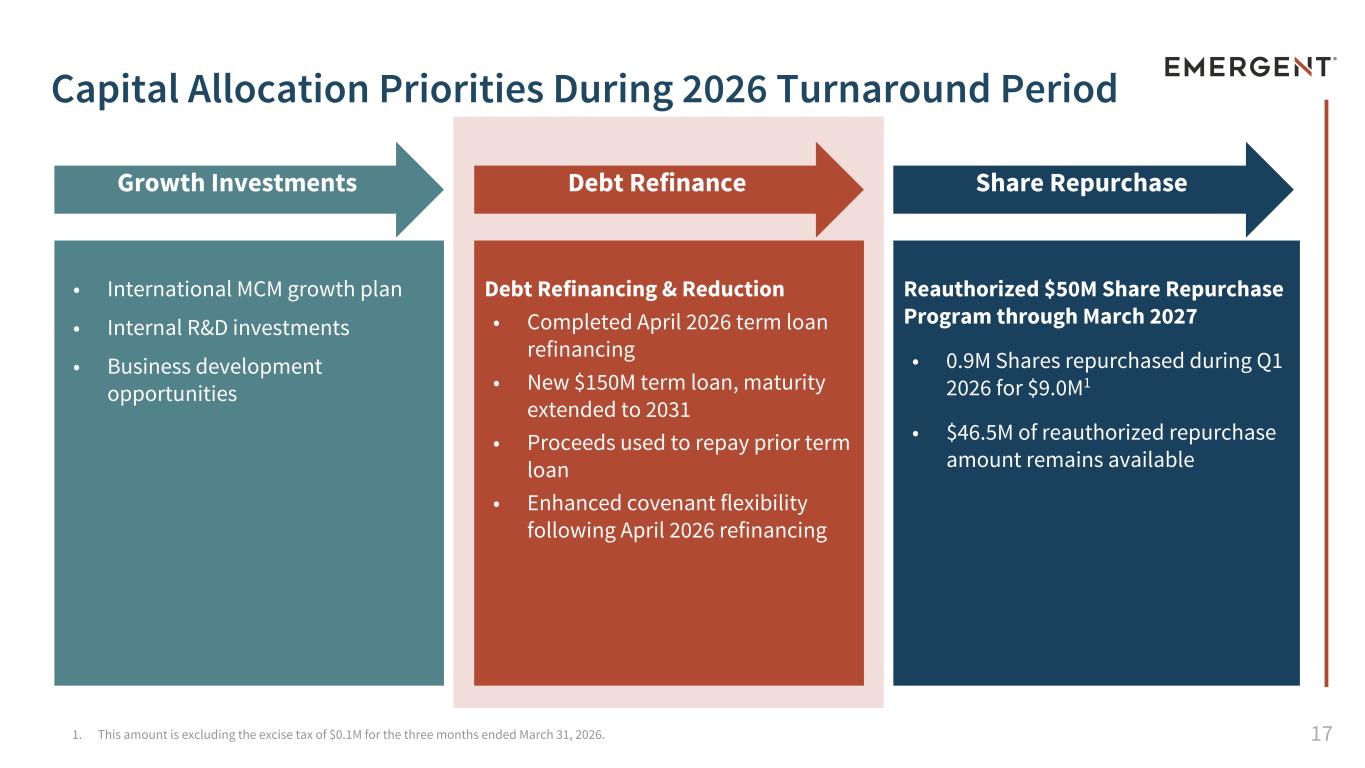
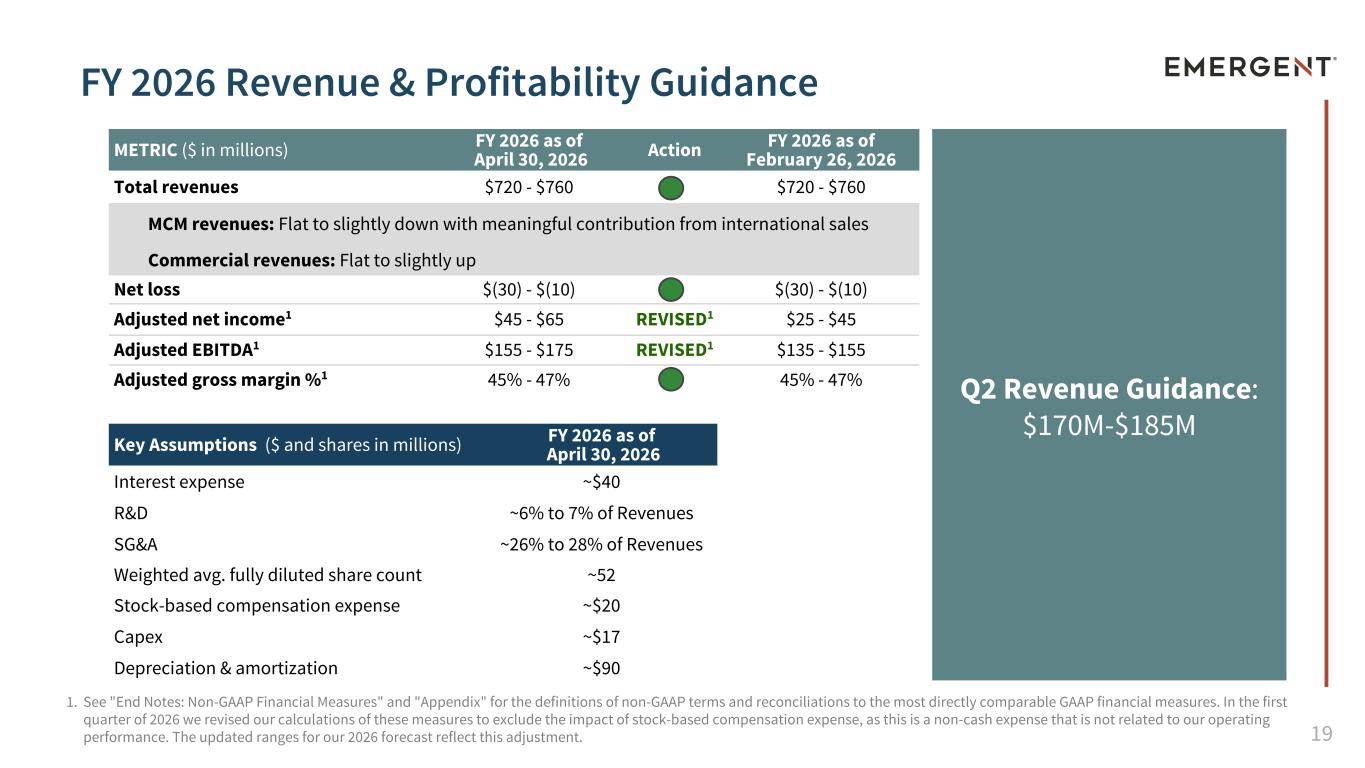
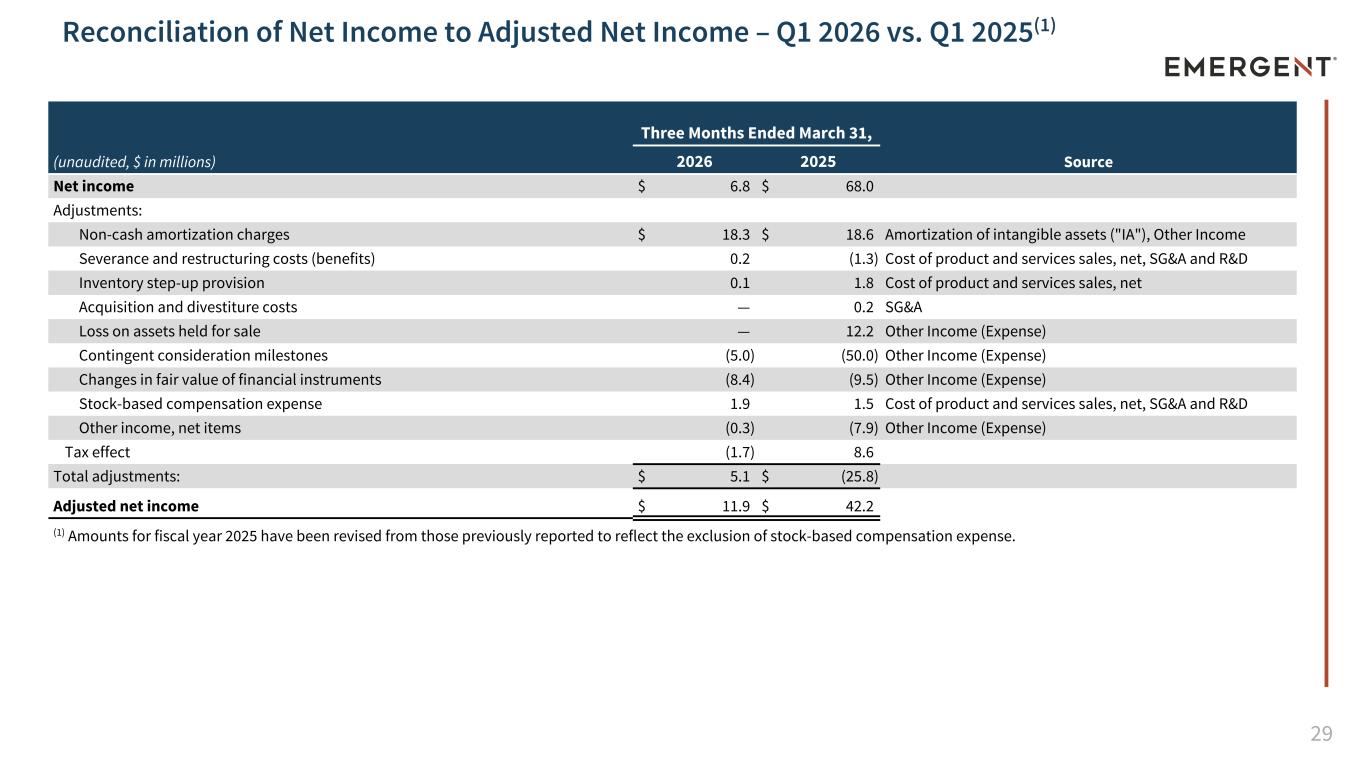
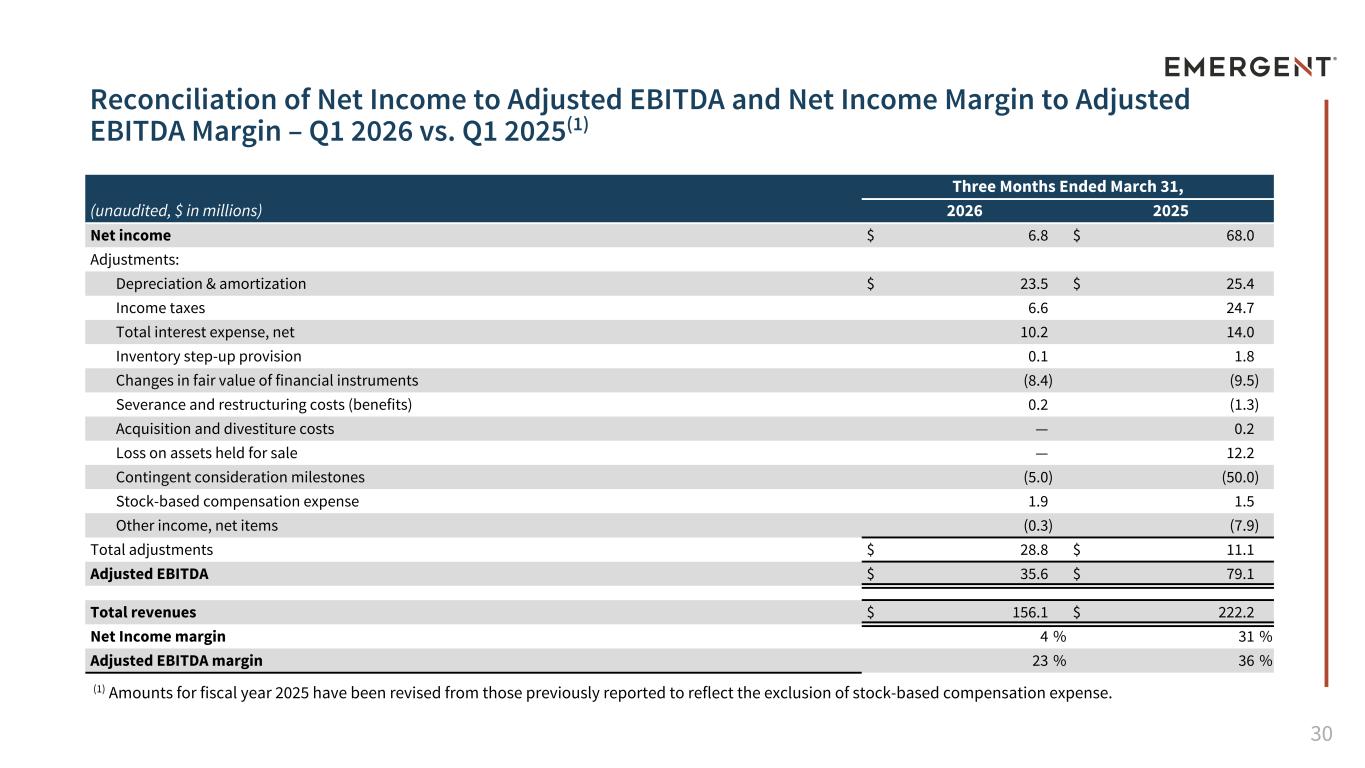
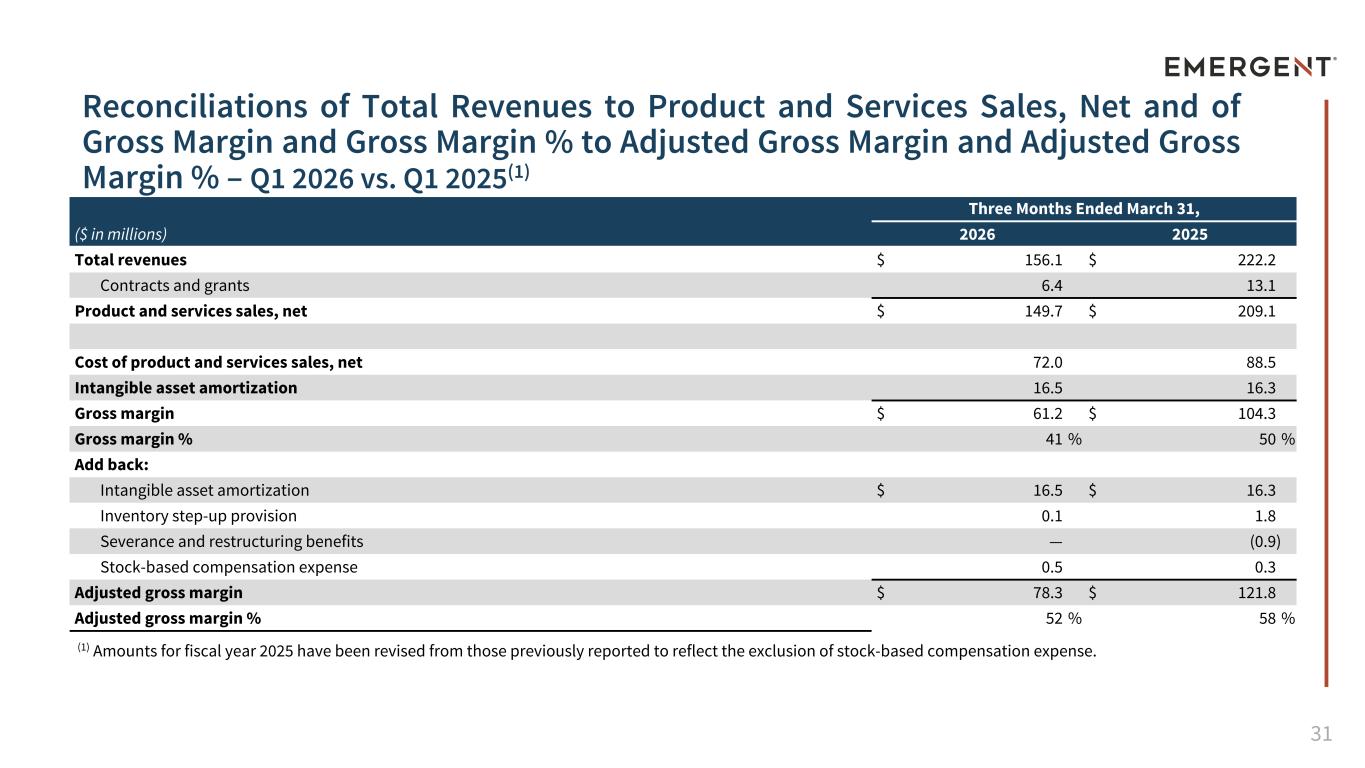
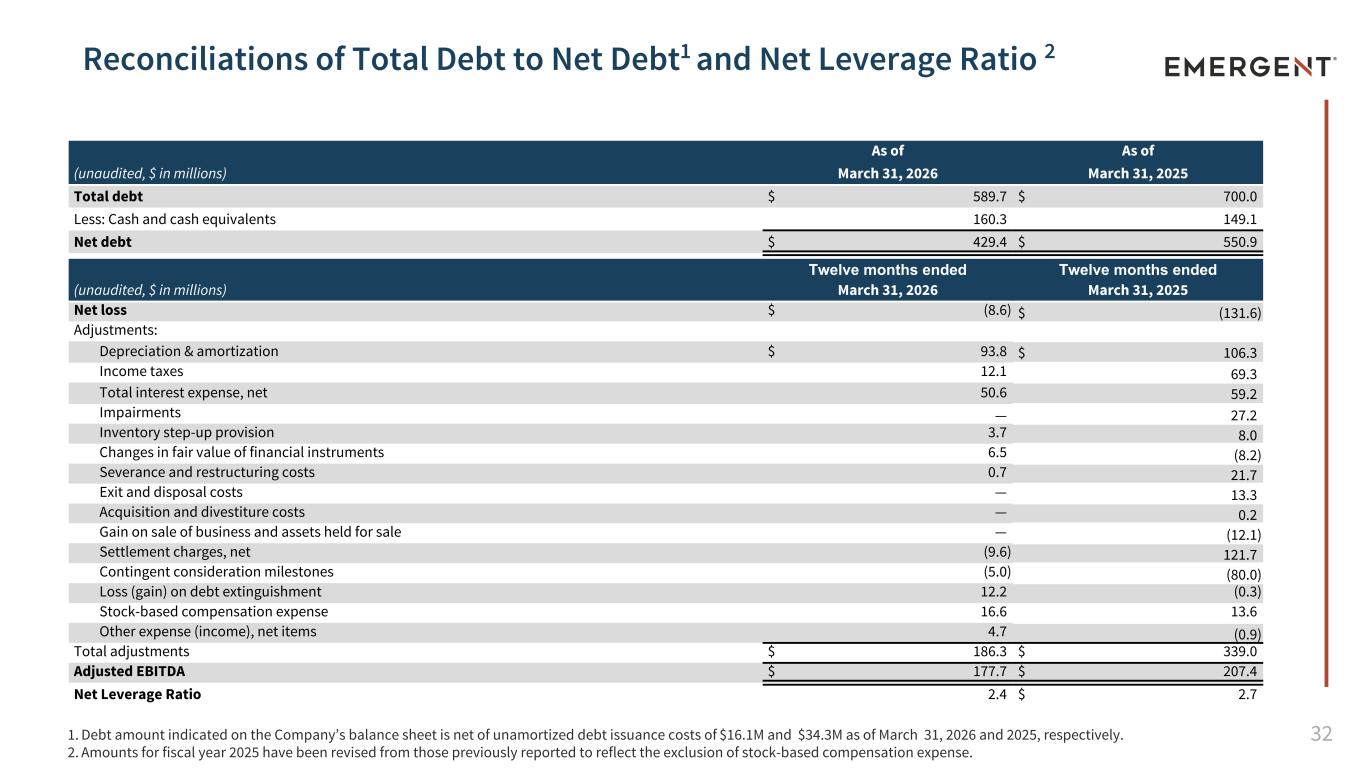
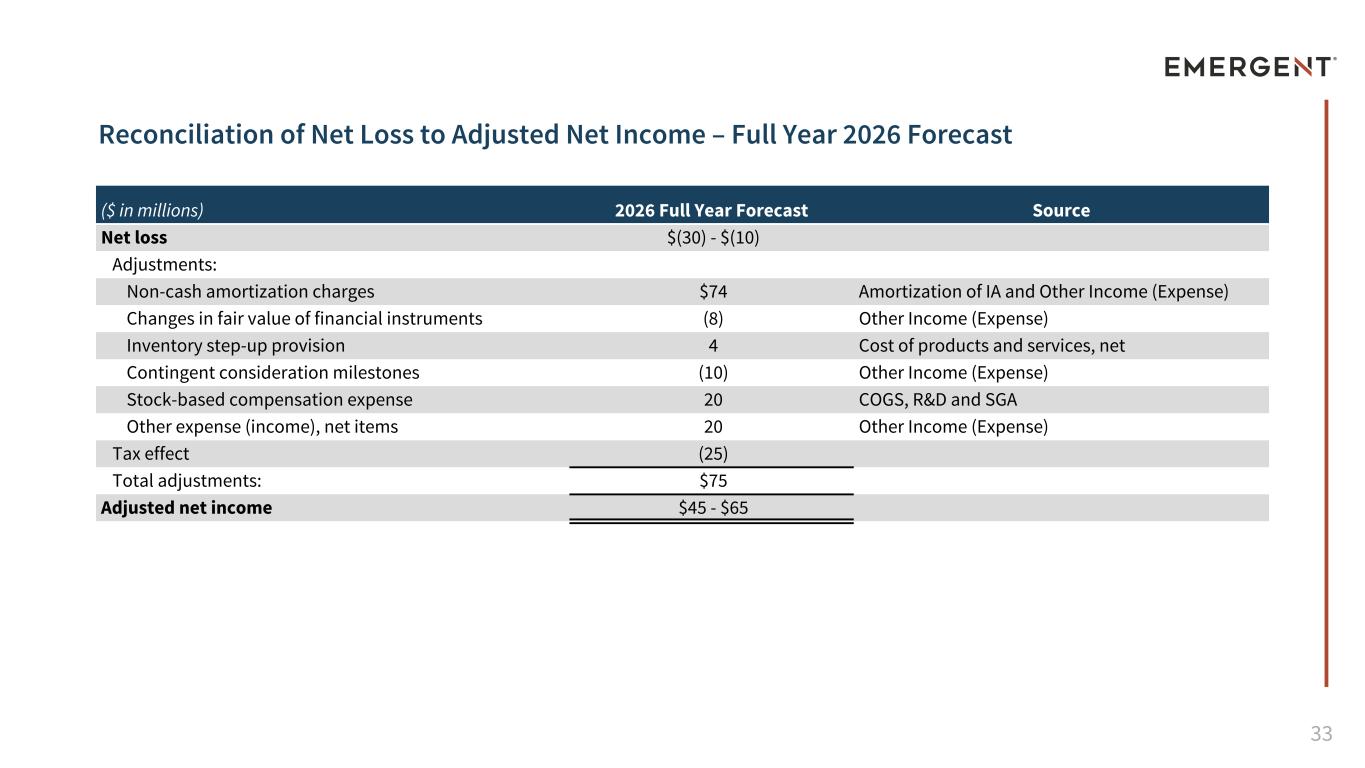
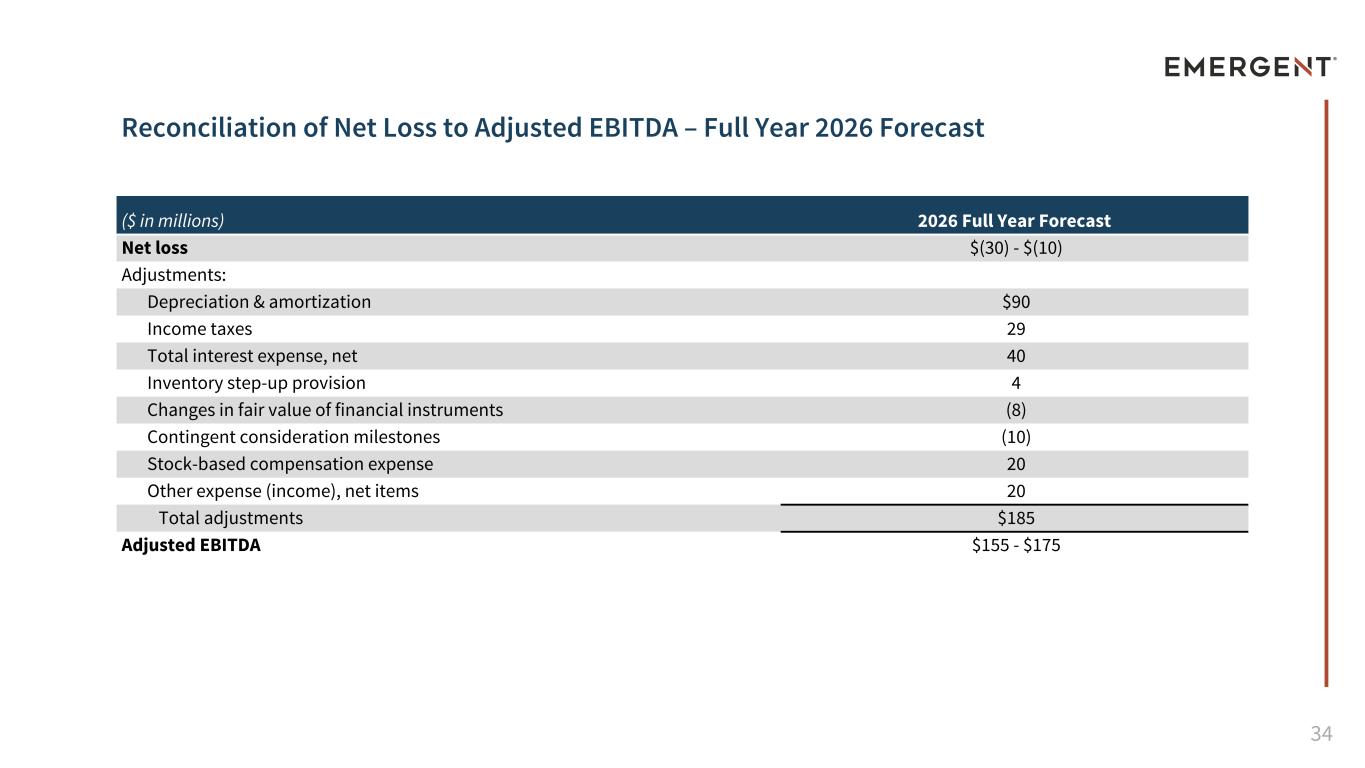
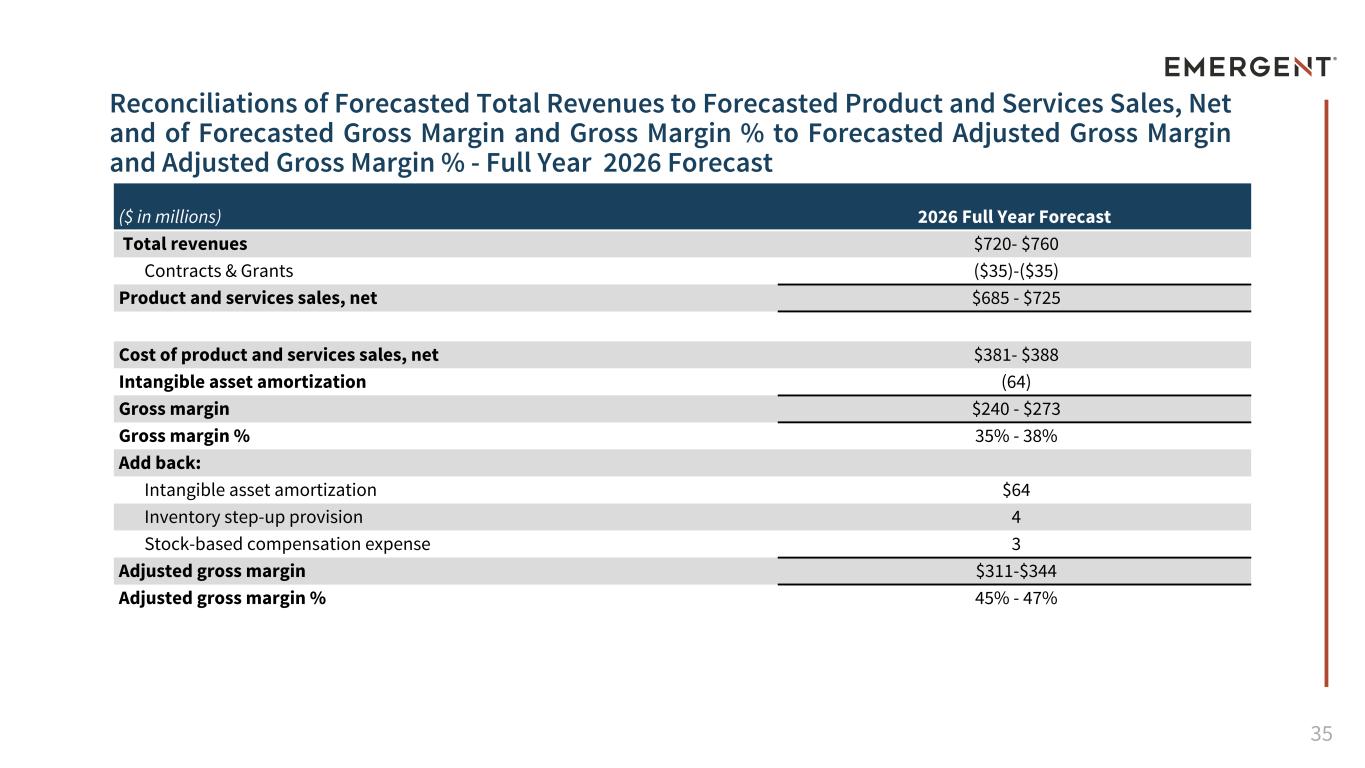
Thank you, Joe, and good afternoon, everyone. Thank you for joining our call today. We started fiscal year 2026 with a strong first quarter, with revenue exceeding the top end of our guidance. We've also advanced key strategic priorities and improved our cash and liquidity position versus the prior year. Execution of our 2026 turnaround plan is well underway as we work toward our near-term financial and operational goals, building on the stabilization and right-sizing actions completed over the last two years. We also expect the refinancing announced two weeks ago to provide strategically important balance sheet flexibility, lowering interest costs, extending maturities, and adding access to incremental capital to support both operational execution and our longer-term growth initiatives. Turning to slide 13, our first quarter results were in line with our expectations and reflect continued progress on execution. Total revenue for the first quarter of 2026 was $156 million, which came in above the high end of our prior Q1 revenue guidance of $135 to $155 million. As a reminder, on our last earnings call, we pointed out that our 2025 results benefited from a large international order that we do not currently expect to repeat in 2026. That order contributed approximately $60 million of revenue and $50 million of adjusted EBITDA to our first quarter 2025 results and significantly influences the year-over-year comparisons of these metrics. Beginning in 2026, we are adding back non-cash stock compensation to our adjusted EBITDA. This is consistent with our peers and provides a more comparable view of profitability on a cash basis. It also aligns with the Covenant calculations under our new debt agreement. In the first quarter, adjusted EBITDA and adjusted EBITDA margin were $36 million and 23% respectively, reflecting the quarterly revenue profile. Adjusted gross margin was 52%, reflecting the high fixed cost nature of our operations. We also maintain strong cost discipline. Operating expenses were $57 million in the first quarter of 2026, down $10 million year-over-year, and R&D spend declined by about a third compared to the first quarter of 2025. Total revenue was $156 million, supported by a solid contribution from Naloxone, as we continue to maintain a market leadership position. The MCM portfolio performed above our expectations, driven by U.S. government order timing and shipments. International NCM revenue was 37% of total NCM revenues in the quarter, representing continuous strong demand and diversification beyond the U.S. government. On slide 15, we highlight the sustained improvements across our quarterly financial metrics. Liquidity and cash both improved by $11 million year-over-year, and we reduced net debt by $122 million, or approximately 22%, versus the first quarter of 2025. As a result, we continue to see improvement in our net leverage ratio, which was 2.4 times adjusted EBITDA at 1Q26 versus 2.7 times at the first quarter of 25. This level gives us meaningful financial flexibility as we evaluate capital allocation priorities to further strengthen our long-term growth profile. This observation provides a good segue to our April 2026 debt refinancing transaction, which is highlighted on slide 16. Also noted there, we decreased our total term loan debt by $100 million versus the first quarter of 2025, and we increased finance capacity with the addition of a new, fully committed, delayed-draw term loan of $75 million. As Joe noted earlier, the April 2026 debt refinancing was an important milestone for Emergent. First, it strengthens our ability to preserve liquidity to support ongoing operations and advance long-term strategic initiatives. Second, it lowers our interest expense, freeing cash flow that can be redeployed into value-creating investments that support growth. Finally, it meaningfully extends our maturity profile and improves covenant terms. Taken together, these actions help establish a stronger financial foundation to support durable long-term growth. Turning to capital allocation, we have several strategic growth priorities in place for 2026, growing international MCM, internal R&D investments, and business development. Continued debt management will remain an important part of our turnaround in 2026. As noted, the April 2026 refinancing provides us with meaningfully greater financial flexibility and supports our long-term strategic growth planning. As a reminder, we have a $50 million share repurchase program through March 31, 2027, and we continue to utilize it, repurchasing 900,000 shares for $9 million during the first quarter of 2026. As of the end of the first quarter, $46.5 million of authorized repurchase capacity remains available under this program. At current valuation levels, we believe disciplined repurchases can be an attractive way to create shareholder value, and they reflect our confidence to emergence long-term cross-scenes. One final note on our March 31st balance sheet. We previously disclosed that $50.4 million of contingent consideration could be owed to Ridgeback Bio in the second quarter of this year, assuming continued progress under our contract with BARDA. As we now expect those conditions will be met, we have reported that amount as an accrued acquisition obligation under current liabilities. On slide 19, we highlight our revenue and profitability guidance. We are maintaining our full-year total revenue guidance of $720 million to $760 million. Commercial revenues are expected to be flat to slightly up, with volume offsetting anticipated price adjustments. And we expect Narcan to maintain its leading market share. MCM revenues are consistent with prior guidance of flat to slightly down, with a significant contribution from international sales. Adjusted gross margin is expected to be between 45% and 47%, reflecting product mix and expected pricing dynamics. We are updating our adjusted EBITDA guidance to account for the non-cash stock compensation ADVAC, and we therefore expect full-year adjusted EBITDA to be in a range of $155 to $175 million. And for the second quarter, we expect total revenue to be between $170 million and $185 million. In summary, we have fully commenced the turnaround phase for our multi-year plan, and we are executing with focus and urgency. We delivered solid revenue and profitability in the first quarter, in line with our internal expectations. Our term loan refinancing extended maturities out to 2031 and enhanced our financial and operational flexibility. We also returned capital of shareholders through share repurchases during the quarter, and $46.5 million in authorized repurchase capacity remains available through March of 2027. With that, I'd like to turn the call back over to Joe for a 2026 Business Outlook update and closing remarks before we go into Q&A.
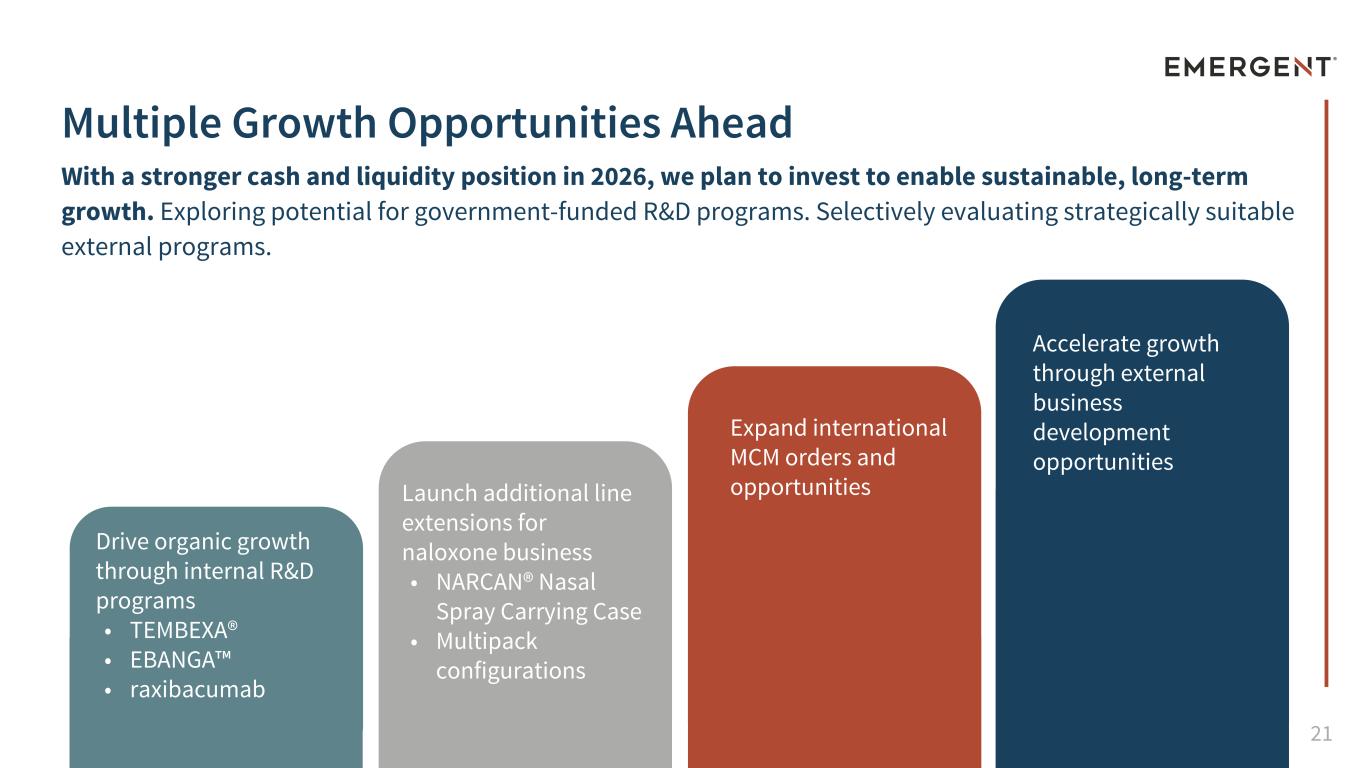
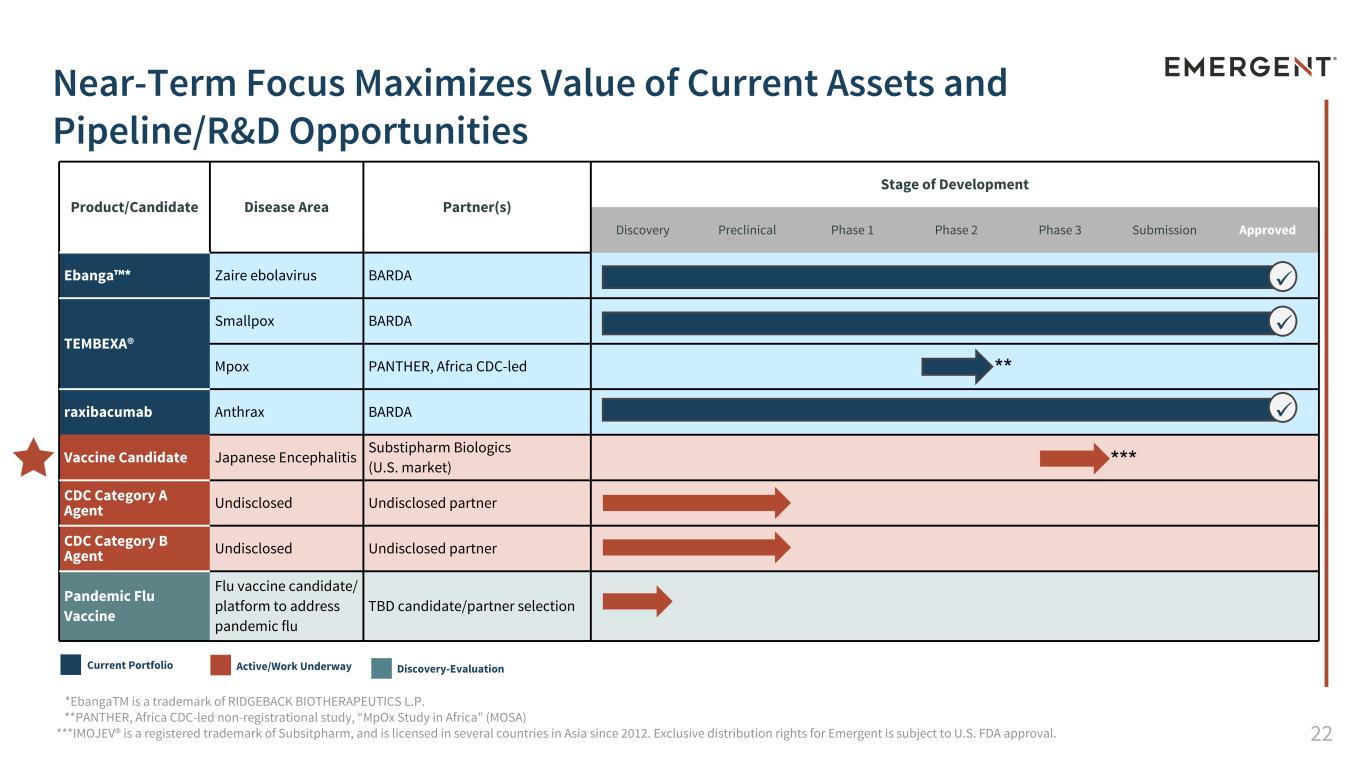
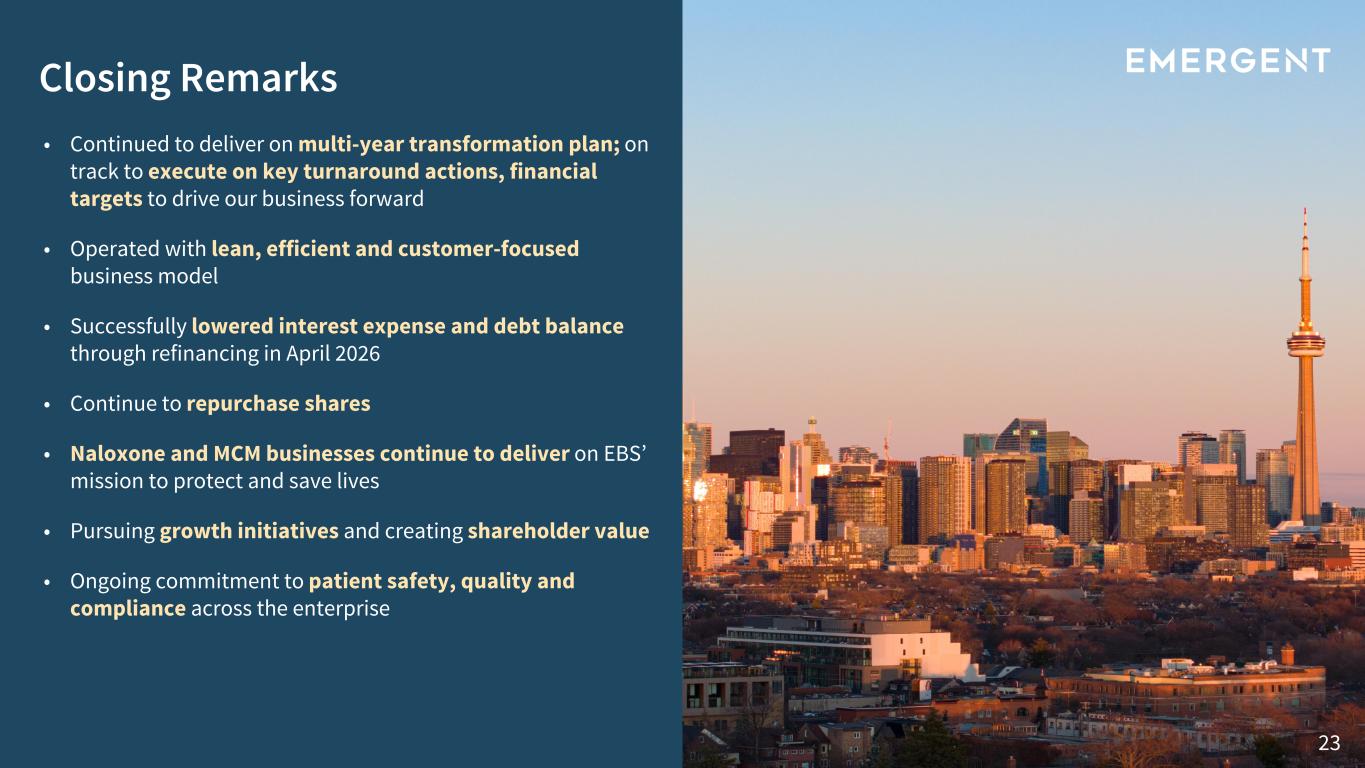
Thanks, Rich. Moving to slide 21, let me now walk through what we see as the key growth drivers ahead, both near-term and strategic. We entered 2026 with a stronger cash and liquidity position, further reinforced by the April refinancing. We are well-positioned to invest in sustainable, long-term growth via four levers. Organic growth through internal R&D investments in Tembexa, Ivanga, and Raximacomat. Number two, line extensions for Narcan. Number three, growing the MCM business internationally. And number four, accelerated for business development opportunities, like projects such as Collexado, like now we just announced the Japanese encephalitis vaccine, and more for Moving to our pipeline and assets on slide 22, Tabexa, Ivanga, and Rexabectum are all approved with incremental development programs underway. As I previously mentioned, look forward to serving as the distributor of the substitute foreign biology's Japanese encephalitis vaccine for the U.S. government opportunity following FDA regulatory approval. Finally, we're pleased to share that just this week, ACN 2000 received Singapore Health Sciences Authority expanded approval to include MLAB. On slide 23, to close, UN 2026 has been a steady and successful continuation of the turnaround efforts in these past two years. We believe we have made significant headway and now have the opportunity to produce growth both organically and inorganically. We have successfully stabilized the business. We have invested non-core assets. We have dramatically reduced our debt while returning capital to shareholders. Today, we are investing for segment revenue growth, investing in promising internal R&D pipeline, expanding our international MCM footprint, and pursuing accretive external opportunities, all from a position of improved financial strength. All the while, we are committed to patient safety, quality, and compliance across the operations. With that operated, please open the line for questions.
Operator
Thank you. As mentioned, at this time, we'll conduct the question and answer session. As a reminder, to ask the question, you'll need to press star 11 on your telephone and wait for your name to be announced. To withdraw your question, please press star 11 again. Please stand by while we compile our Q&A roster. Your first question comes from the line of Jessica Fye with J.P. Morgan. Your line is now open.
Hey, guys. Good afternoon. Thanks for taking my question. I had a question on your longer-term perspective on the naloxone franchise. I know you talked about that business being, like, flat to slightly up for 2026. How should we think about it taking, like, maybe, like, a several-year time horizon?
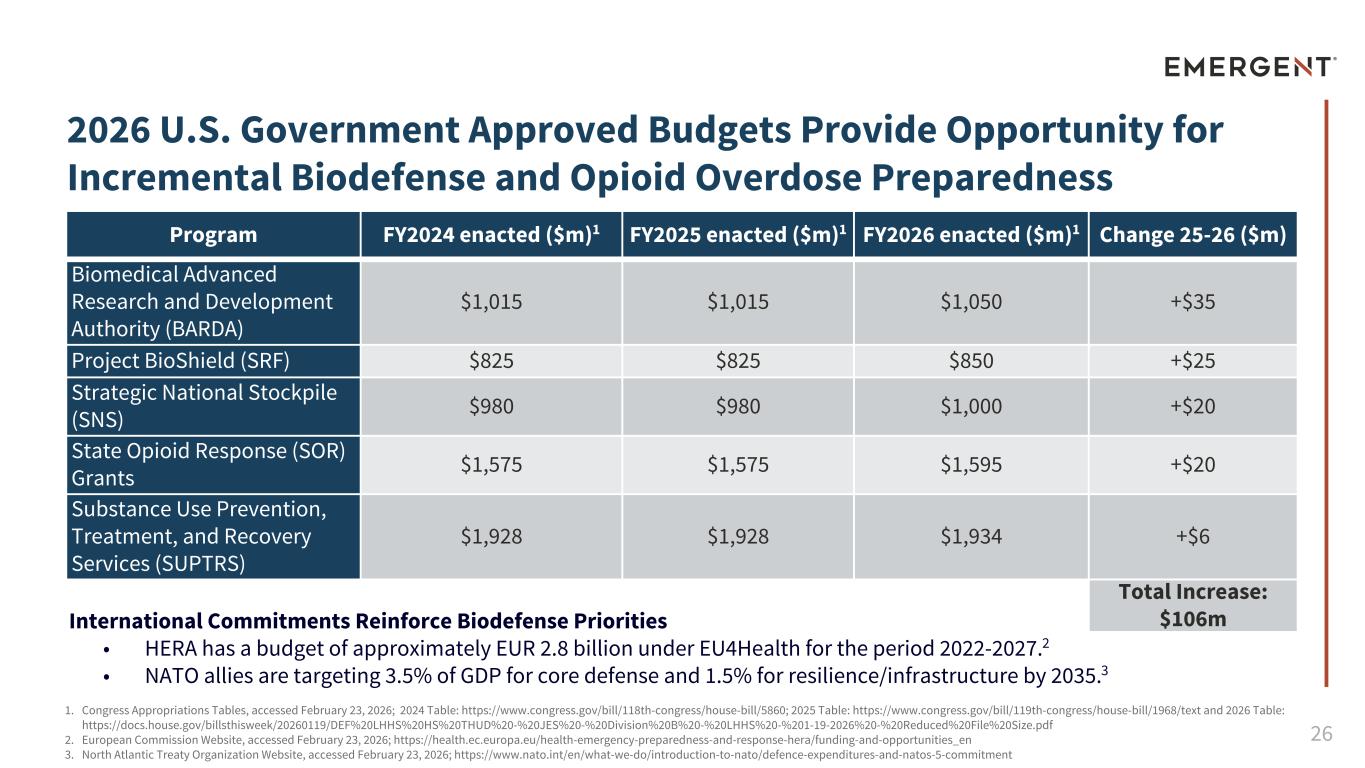
Sure. Thanks for the question. The way we're looking at Narcan is a couple things are happening. Number one, we're excited about our ability to launch new innovations with Narcan. We do have just the launch opportunity we have with the carrying case. We think that's perfect for college campuses. We also looked at the multi-pack. We think the multi-pack will be a more efficient way to deliver the Nalaxa and Narcan for especially high-volume users. We do think there's still some significant upside internationally, especially in Canada. And we're also looking at the Q2, Q3 as being an upside from where we are in Q1 simply because of the seasonality of our business. We know that, like, for example, Q2 is the fiscal year end for about 70 percent of the state, so we think there is some upside there in the near term. And so there's always going to be a little bit of seasonality. Beyond that, though, clearly getting to the longer-term part of your question, we do think the market's going to continue to grow because, unfortunately, there's still so many deaths that are occurring because of opioid overdoses. So we do expect to see continued dollars spent there by the federal government. We saw that in 2026 budget for the U.S. government, the SOAR grants and the other grants that are coming from the federal government have either increased or at least stayed stable. So there's continued bipartisan support for this area of overcoming opioid overdoses. So we do expect that. And on top of that, the other reason we expect the volume to go up is just simply the class action settlements by large pharma companies are about $50 billion. dollars, all that we think, especially now that Purdue just settled this week, I guess it was, with about five billion dollars of their settlement funds coming in. Those funds are to be directed towards things like educational programs of states and local municipalities and or the use or purchase of procurement of naloxone. So we think for those reasons, the market will grow. We expect to hold on to the leading market position. We're going to stay competitive on pricing, so we can't exactly see where pricing is going to go, but that's the reason why we said, you know, for the full year, flat to up slightly, and that's how we're looking at the future. Volume growth will continue to be market leader, and then obviously we'll have to be competitive on price, and that's really how we talked about the future. Volume growth, full level market share, and expect to be competitively priced, and that's what we're thinking. So, thanks for the question.
Yeah, and then maybe switching to of the MCM business as you kind of drive the international side there, can you just remind us how to think about the margin you keep on international MCM sales and kind of how that compares to the U.S. legacy MCM business?
Sure. Well, I'll start, Rich. You may want to add to it. I guess the first and foremost thing is that one of the things that we've agreed to, especially with the current administration is that we offer a most favored nation pricing type of arrangement in the U.S. government. So, our price has to be by agreement with the U.S. government. We have to give them the lowest price, which means by definition, our prices for other countries around the world will be slightly higher, depending on the product, of course. So, we think that obviously, as we develop more international business, will help us as well on the gross margin. As I said, this year for the first quarter, about 37% of our MCM revenue came from international. So, we think that's a big, powerful part of how we're thinking about what's happening on the margin side. But, Rich, anything you want to add?
Yeah, I think logically, Jess, the fact that we're offering the U.S. most favored nation pricing and therefore we have higher prices on the international MCM business, that drives higher margins. And so, you should assume that the international sales are above the average for the MCM segment in total. Thank you.
Operator, next question? Operator, is there any more questions?
Operator
Oh, excuse me. Your next question comes from Raghuram Salveraju with H.C. Wainwright. Your line is now open.
Thanks so much for taking my questions. Firstly, I wanted to ask about the tie-up with SAB and if we should be thinking about this as an indication of interest in the type 1 diabetes space strategically, or if this is really more of a contractual business arrangement and not indicative of a broader strategic shift. Secondly, I was wondering if you could comment on the evolving geopolitical situation generally and how you see that potentially driving international demand for MCM products under the Emergent banner. And lastly, I was wondering if at this juncture you could comment on the scope and footprint of the manufacturing operations at Emergent, and if you feel that those are optimally right size for the company going forward. Okay. I'm going to try to make sure I get all of them, but please remind me if I can miss it First, on SAB, we're July Department. They're a great company. They have a specific area of focus on the diabetes side. What we're focused on really is our technology and the technology that we have in Winnipeg that is perfectly situated to help them to advance their product. So we view it as pretty much an alignment of our capability and what we have in Winnipeg with what they're looking for. It wasn't as much disease category as it was in alignment around our technology, and what they are looking for and how we can quickly expedite their operations and their products. So it was really more of a technology than it was a therapeutic area approach. The second question, I think, is really about the international, what's happening out there and what we refer to as increasingly dangerous worlds. You know it. I've seen it in your reports. It is a more dangerous world that we live in. And I think the world has very appropriately worried about, you know, the risk of nuclear weapons, and we hear about it every day in the news. But one of the things that we believe, and I think you might also believe, is that while nuclear weapons are absolutely a terrible risk, the risk of bioterror is maybe as risky, if not worse, in the sense that nuclear weapons will be terrible, devastated to a location or whatever could happen. However, bioterrorism, once it gets started, it's very difficult to stop. So, and it's perhaps even easier to do a bioterrorist activity in terms of the speed at which you can do it and the cost at which you can do it than it is nuclear weapons. So, we believe it's a dangerous world. We believe bioterrorism, you know, once it gets started, can be devastating to society. And that's why we think it's really important to continue to work with the U.S. government and other governments around the world to make sure that everyone is prepared for these types of risks as we think about the future, because one bad actor gets their hands on anthrax stores or smallpox, and the results can be devastating. So that's really – we certainly think the world is more dangerous than what we have to be prepared for. The last question on the manufacturing footprint. We've streamlined our footprint to be clear. However, we still have the ability to source all of our products, our existing products, and our ability to ramp up our Canton facility we think is a great opportunity to bring some additional drug substance capabilities for very difficult products. We have the ability there to work with live virus and our 10-rated live viruses there, So, bring drug substance capability and bring that capability into the U.S. And we looked around the country to see who else has that kind of capability. There's not a lot of it. So, we think having some additional capabilities for the U.S. is important. It's important for this particular product, but it's also going to be important for other development candidates and or products that the U.S. government, BARDA, Strategic National Society are looking for. So, we do think expanding the footprint and bringing cancer back online with additional capacity and expansion is an absolutely worthwhile endeavor, and we're delighted to get started with that as we speak.
So, I think I got all three of you, but is that even the outcome? Okay, I'll take that as we got all of it.
Operator
Okay, thank you.
Robert, is there any other questions?
Operator
Yes, we do. Your next question comes on line of Rishi Parik with J.P. Morgan. Your line is now open.
Most of my questions have been asked, but just out of curiosity, as you think about all the international opportunities that you're working on, is there any way to quantify what the backlog of those opportunities look like as they try to or attempt to leverage fewer technology?
And how should we just think about that margin potential as you continue to ramp on that backlog?
So do we have ongoing discussions on international opportunities to bring additional products to the market on the MCF product, The answer is absolutely yes. Those are ongoing discussions. It's a little bit harder to answer the backlog question, but some of those projects, you know, some take six months, some take, you know, two years. I mean, there's a process that we get involved with, but there's no doubt there's incremental interest for some of our products. For example, in Europe, there used to be another manufacturer of an anthrax vaccine. Our knowledge is that that manufacturer is no longer operated, so anybody who's looking for an anthrax vaccine, in many ways, the merchant's the place to go for it. So we do think there are some developing opportunities. We're working on continuing to reinforce those, and we're doing it not just in Europe. We're doing it in the Middle East. We're doing it in Asia. We're really trying to make sure that wherever the demand is, wherever countries look at, You know, this risk of bioterrorism, biodefense, we're going to be there with our products. As I said earlier in the presentation, we have the leading portfolio of products, whether it's in smallpox, whether it's getting vaccine for smallpox, therapeutic for smallpox, whether you need a vaccine for anthrax or a therapeutic for anthrax, whether you need something for botulism, something for Ebola, we've got it. So we're looking to continue to work with all those governments around the world in terms of making sure we have products that we're working through and back on. As we answered before, anything that we sell outside of the U.S. by definition is going to have a higher price and therefore a higher margin since the relative cost will be the same. So we're excited what that means. And the fact that normally our business on international for MCM historically has been in the mid-teens as a percentage of business, the fact now that we're operating in the first quarter, at 37%. I think last year was about 34% by recollection. You can see that we're making good progress with this international expansion footprint that we put in place in 2024 and 2025.
Thank you for your question.
Operator
Yeah, thank you. Your next question comes to the line of Alex Kelsey with Wells Fargo. Your line is now open.
Hey, Joe, Rich, Frank. Good to hear from you guys. Rich, I think I missed it when you were talking about the accrued acquisition obligation. Can you just mention again what exactly that's related to? And then maybe more importantly, is that a cash outflow that we should expect in 2026? Yeah, thanks for the question, Alex. That relates to the IBANGA program. And so this is under our acquisition of the rights to IBANGA from Ridgeback Bio. Once we were awarded the BARDA contract back in 2023, three, we disclosed that part of that arrangement was ultimately a payment to RISBAC Bio, assuming that we continue to make progress under the contract, and that's going to be a cash outflow in the second quarter.
Thank you for the question. Operator, if you have any additional questions?
Operator
At this time, I'm showing no further questions and would now like to turn it back to Joe Papa for closing remarks.
Thank you, Operator. Thank you, everyone, for joining us on the call today. I'd like to thank all of our investors, customers, employees for your strong and continued support of our company, and we look forward to providing further updates throughout the year. Thank you, and have a great day, everyone. Thanks for joining us. Have a great day, Ellen.
Operator
Yes, thank you for your participation in today's conference. This does conclude the program, and you may now disconnect.