Operator
Good day, and thank you for standing by. Welcome to the Q2 2026 Emergent BioSolutions, Inc. earnings conference call. At this time, all participants are in a listen-only mode. After the speaker's presentation, there will be a question and answer session. To ask a question during the session, you will need to press star 11 on your telephone. You will then hear an automated message advising your hand is raised. To withdraw your question, please press star 1-1 again. Please be advised that today's conference is being recorded. I would now like to hand the conference over to your speaker today, Frank Fargo, Vice President and Treasurer. Please go ahead.
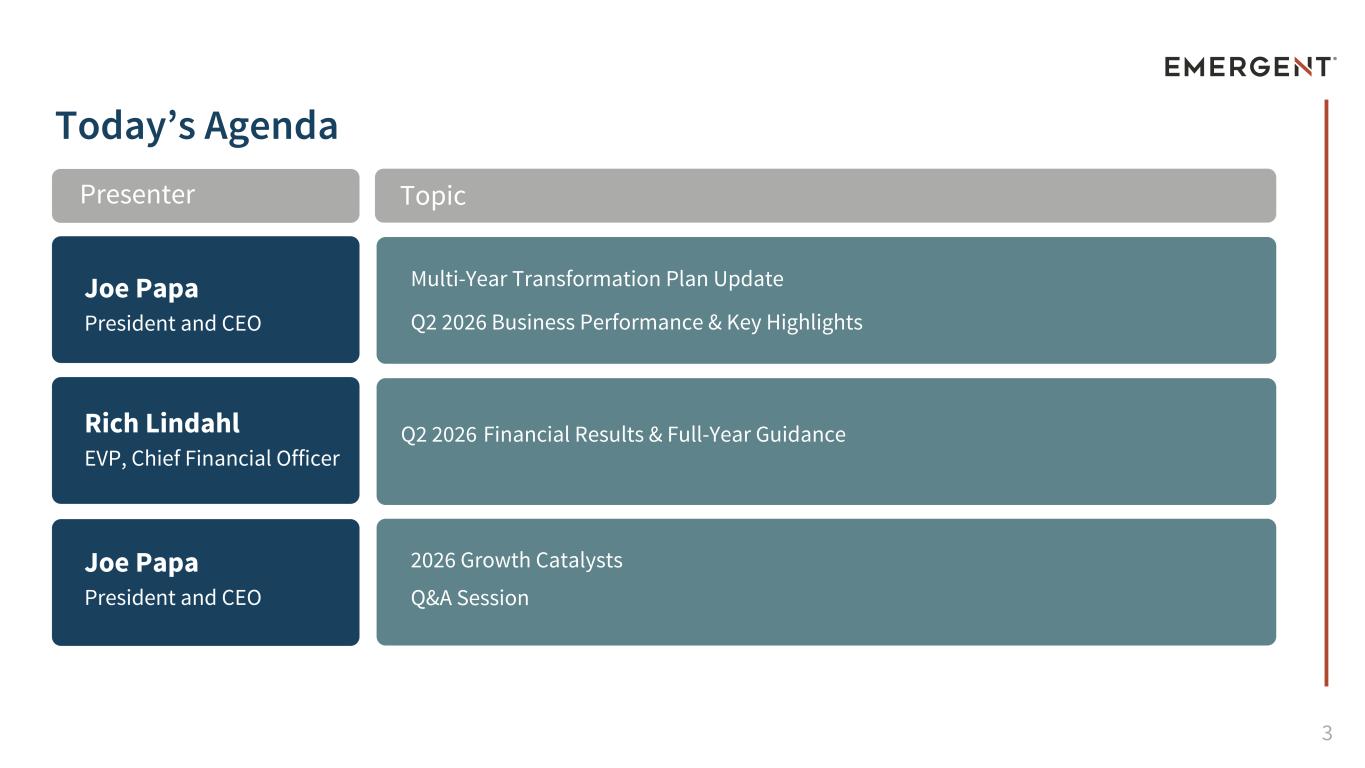
Good afternoon, everyone, and thank you for joining us as Emergent discusses its operational and financial results for the second quarter of 2026. As is customary, today's call is open to all participants, is being recorded, and is copyrighted by Emergent BioSolutions. In addition to today's press release, a slide presentation accompanying this webcast is available to all webcast participants. Turning to slide two, during today's call, Emergent may make projections and other forward-looking statements related to its business, future events, prospects, or future performance. These forward-looking statements are based on our current intentions, beliefs, and expectations regarding future events. Any forward-looking statement speaks only as of the date of this conference call, and except as required by law, Emergen does not undertake to update any forward- looking statement to reflect new information, events, or circumstances. Investors should consider this cautionary statement, as well as the risk factors identified in Emergen's periodic reports filed with the SEC when evaluating these forward-looking statements. During today's call, Emergent may also discuss certain non-GAAP financial measures that include adjustments to GAAP figures to provide additional transparency regarding the company's operating performance. Please refer to the tables included in today's press release. Turning to slide three, the agenda for today's call includes remarks from Joe Papa, President and Chief Executive Officer, who will provide an update on the company's transformation plan, business performance, and key highlights. Rich Lindahl, AVP and Chief Financial Officer, will then review the second quarter 2026 financial results and provide an update on full-year 2026 guidance. Joe Papa will conclude with a discussion of the company's key catalyst for growth, followed by a question-and-answer session. Finally, for the benefit of those who may be listening to the replay of this webcast, this call was held and recorded on August 5, 2026. Since that time, Emerging May have made announcements related to topics discussed during today's call. With that, I would now like to turn the call over to Joe Papa.
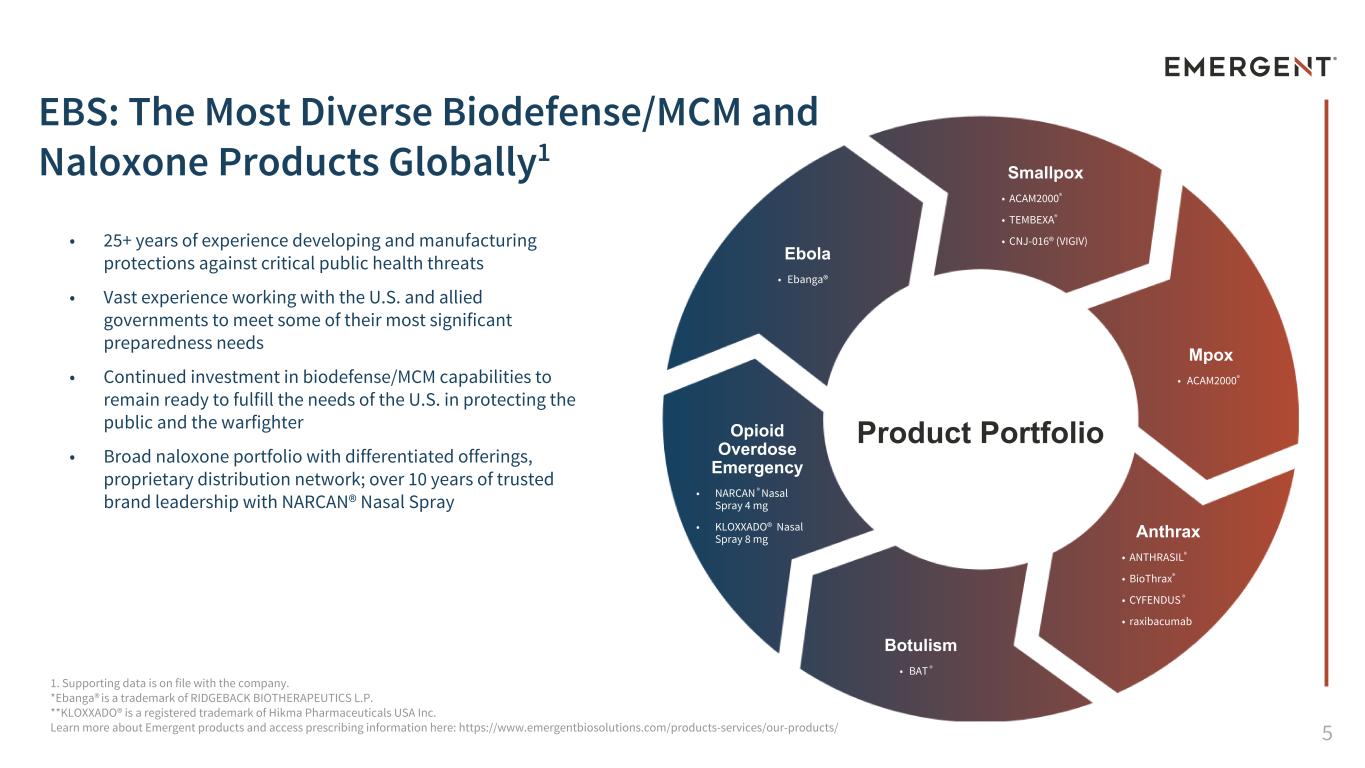
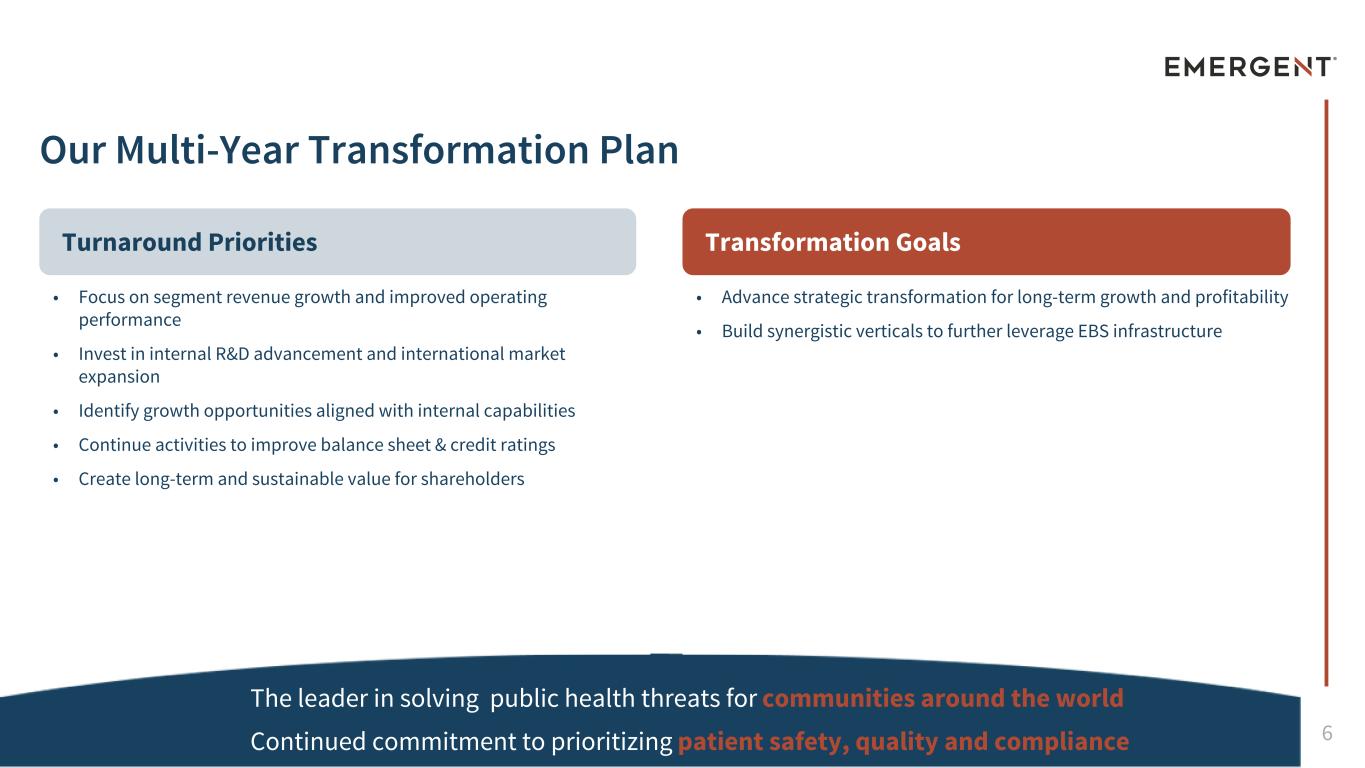
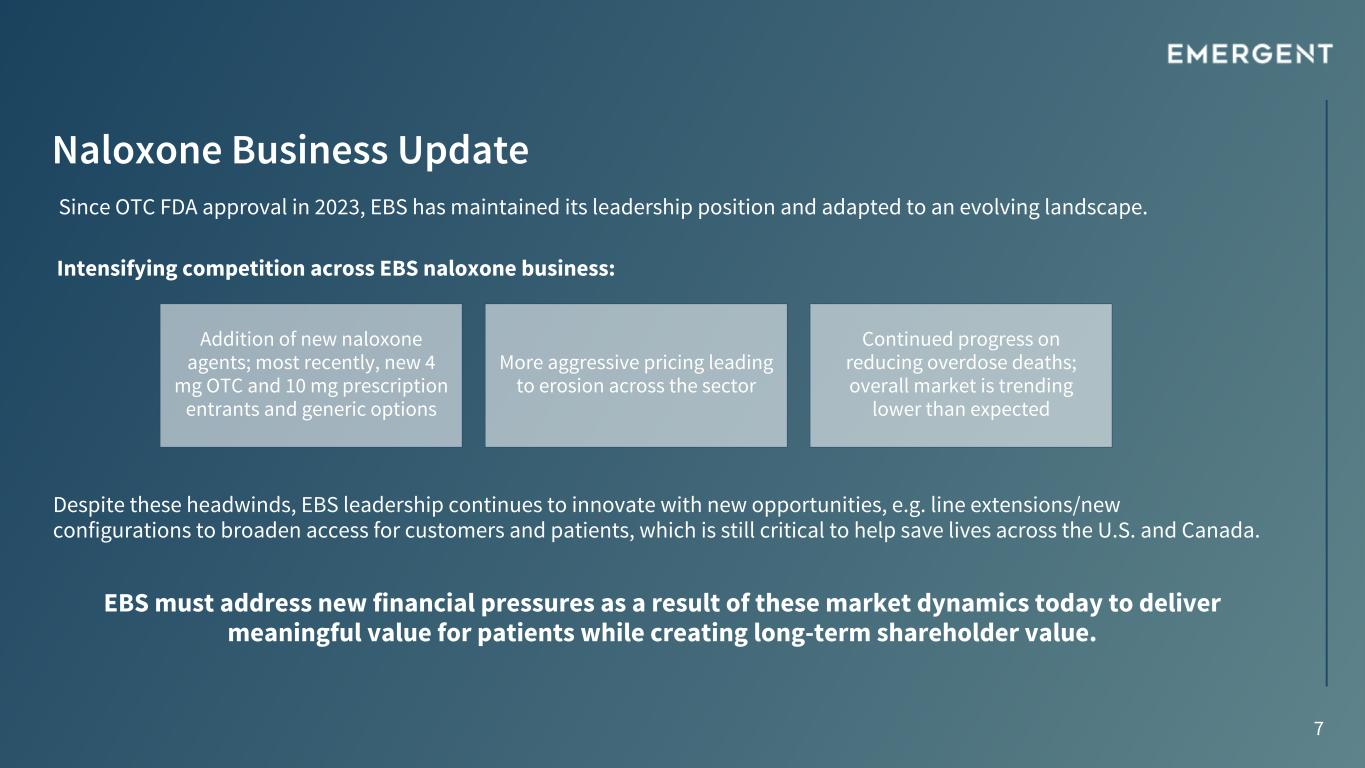
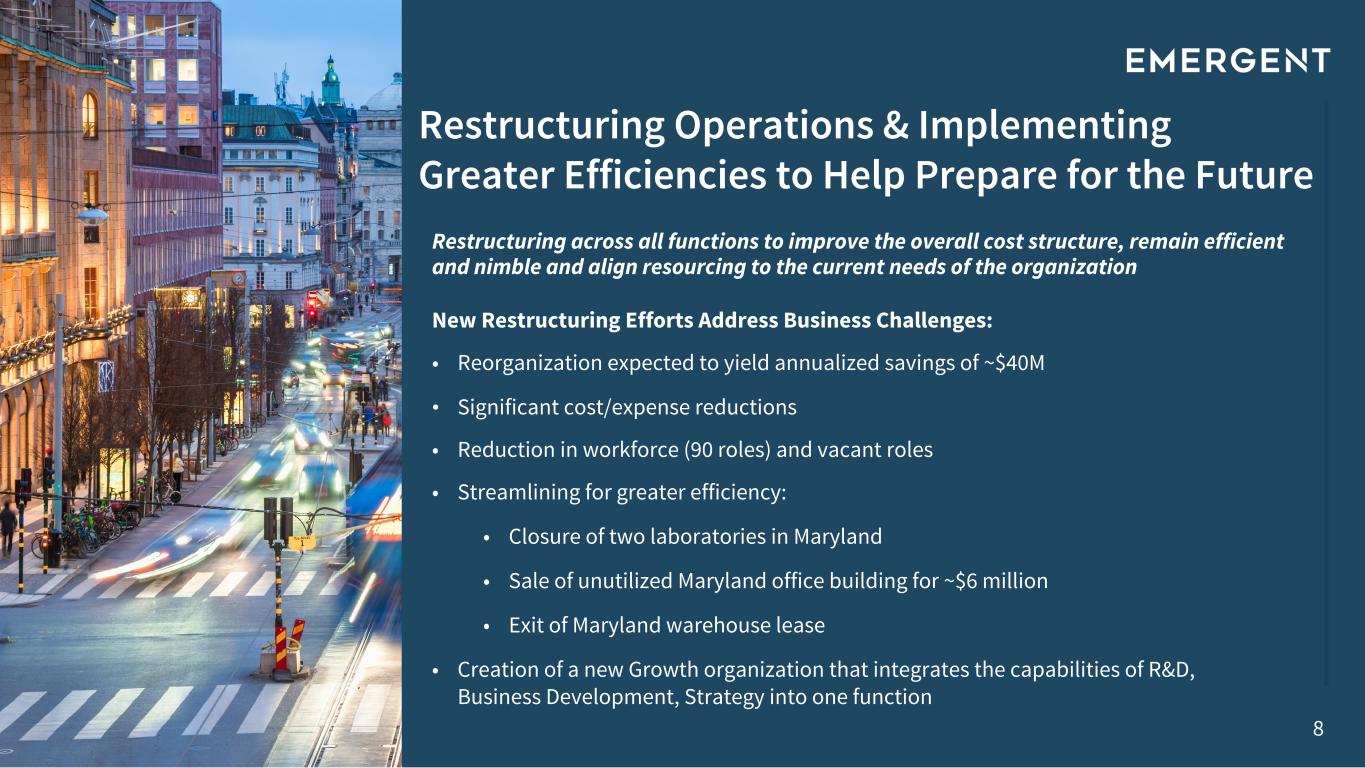
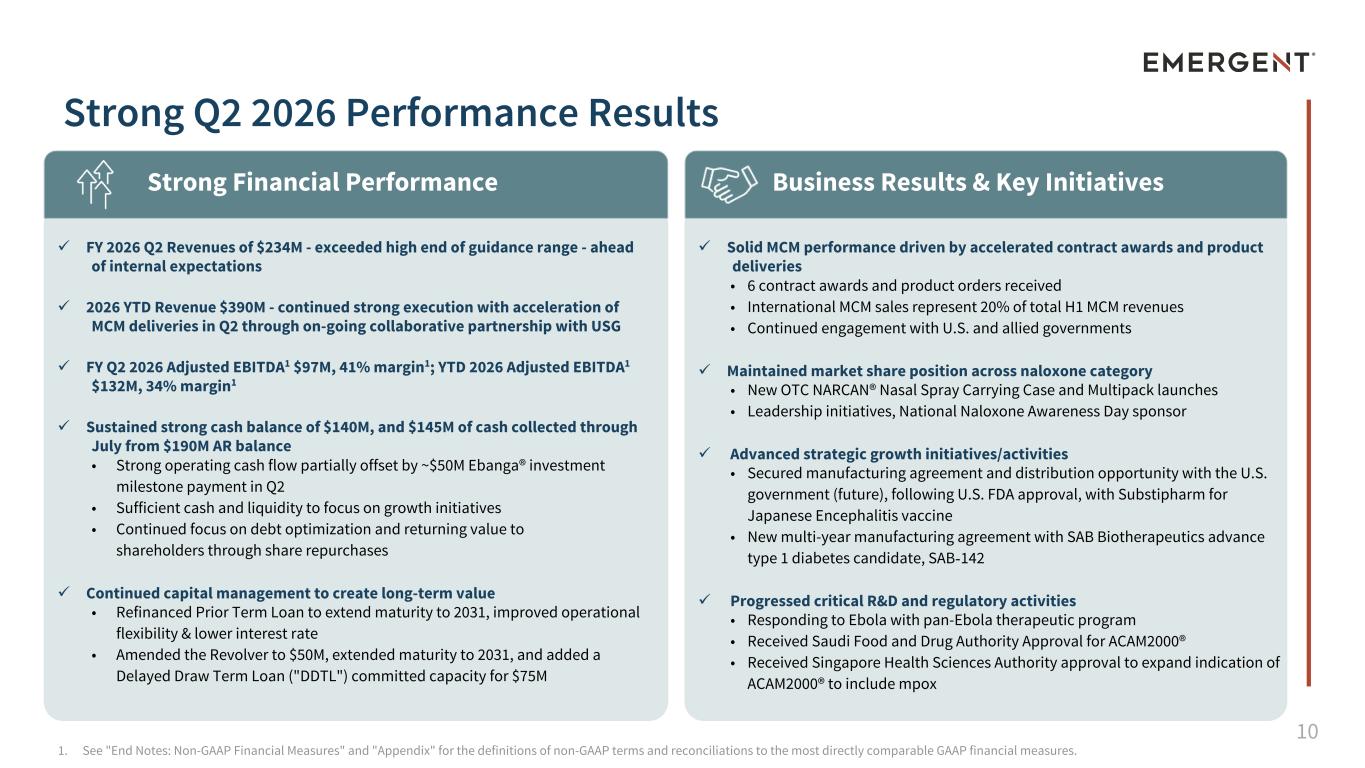
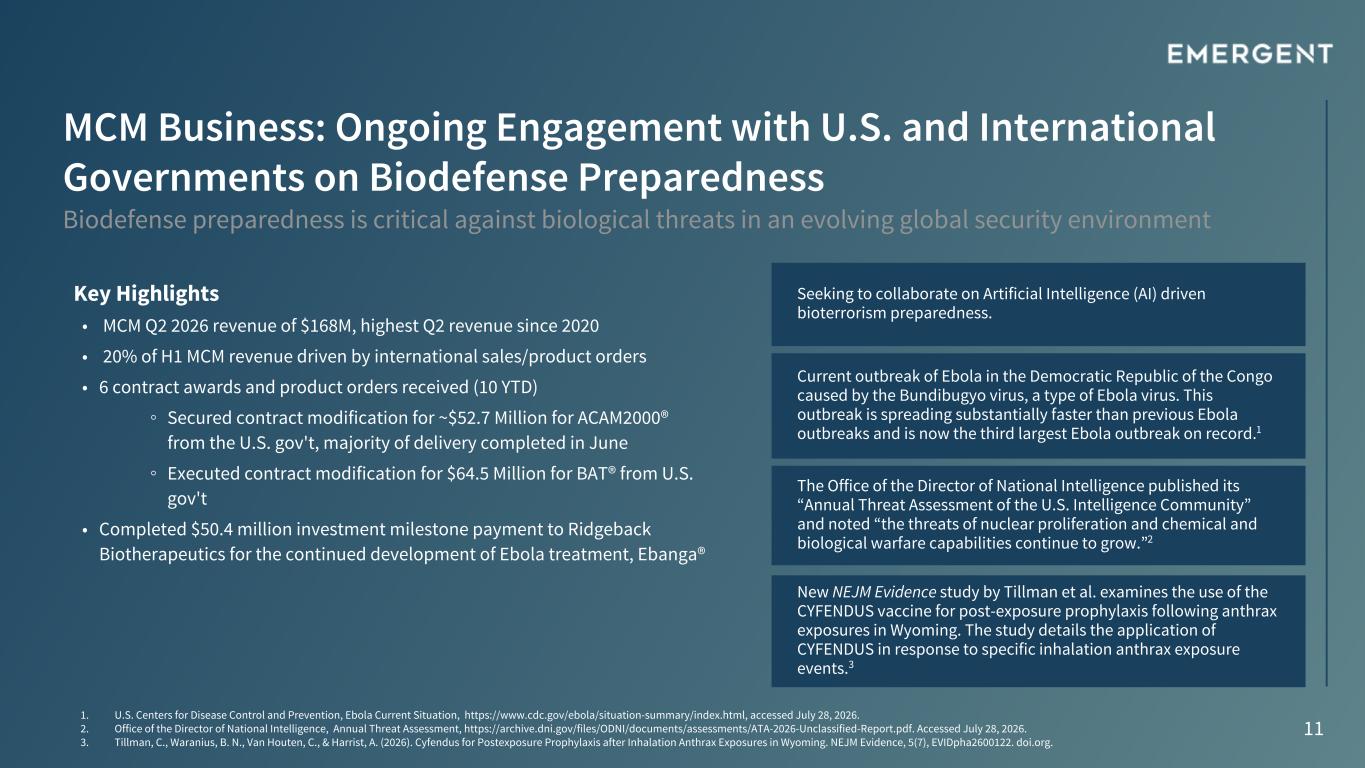
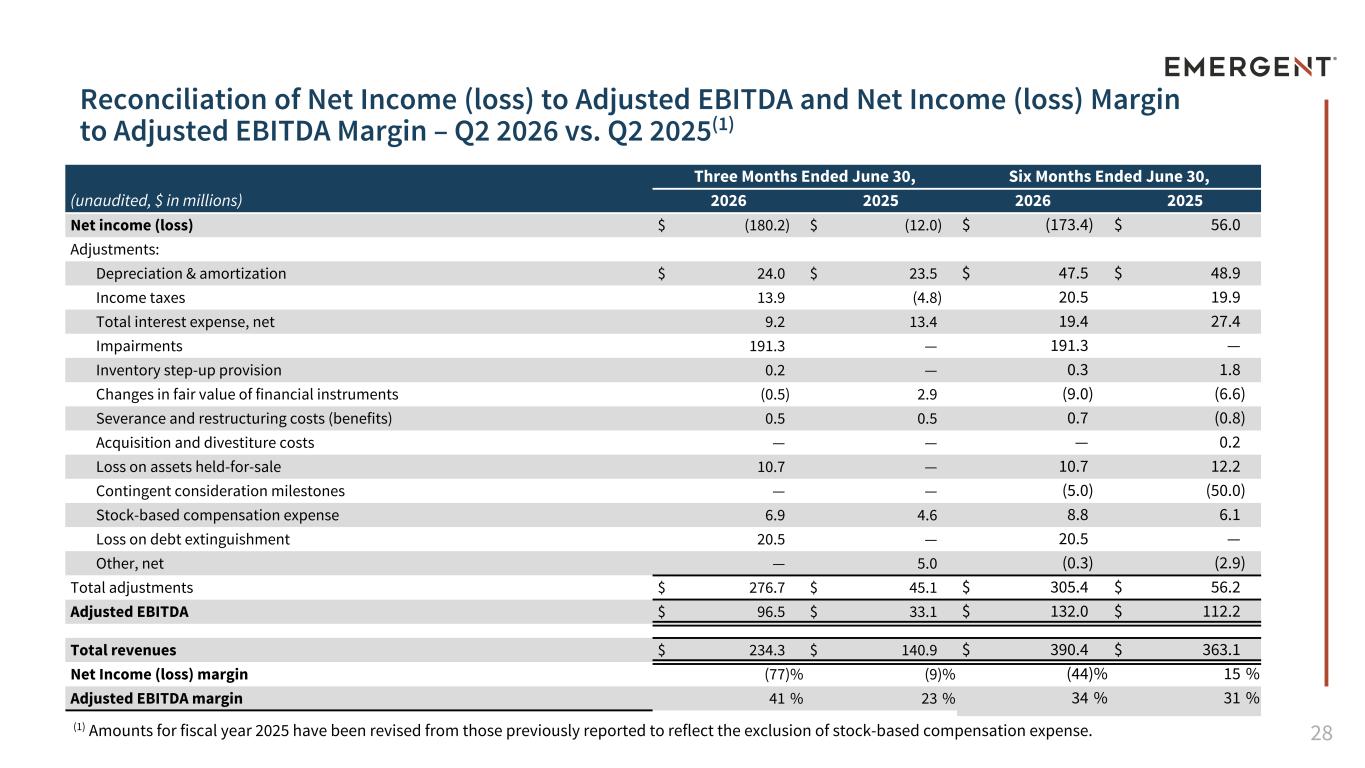
Thank you, Frank. Hello, everyone, and thank you for joining us to discuss Emergent's second quarter 2026 financial results. This is Joe Papa, president and CEO of Emergent, and I'm joined today by Rich Lindell, our chief financial officer. This afternoon, I will share updates on our multi-year transformation, our strong second quarter business performance, and our continued work to protect and save lives. Following my remarks, Rich will detail our quarter two, 2026 financial results and provide our updated 2026 guidance. I'll close the call with a discussion of our 2026 business outlook and the catalyst we believe will enable growth as we continue to execute on our turnaround priorities. Then we will open up the call for Q&A. I'll now begin on slide five. For more than 25 years, Emergent has responded to complex and urgent public health threats with preparedness solutions and active response capabilities. Today, we believe Emerge is the leader in biodefense preparedness and nalaxone, serving patients, customers, and government partners around the world. Our mission remains clear, to protect and save lives. That mission guides how we prioritize patient safety, quality, and compliance, and how we invest in the capabilities that matter most for our future. Our multi-year transformation plan continues to guide our business, remain focused on improving operating performance, advancing strategic transformation for long-term growth and profitability, identifying growth opportunities aligned with our internal capabilities, and continue to strengthen the balance sheet. As an example, through a great team effort, we achieved strong second-quarter results, significantly ahead of consensus, and exceeded our own internal expectations. However, we also experienced some changes in the Nalaxone market at the end of the second quarter. On slide seven, let me address the Nalaxone business directly. Since the Narcan launch in 2016 and the OTC FDA approval of Narcan in 2023, Emergent has maintained its leadership position and adapt to the evolving market landscape. However, recently, we saw two new nasal Nalaxone entrants, including a new 4-milligram over-the-counter approval on June the 16th of 2026 and a 10-milligram prescription agent that will launch in August of 2026. The more aggressive pricing across the Nalaxone segment. These are changes in the signals we must proactively address. That said, opioid overdose deaths remain unacceptably high, with 45,000 lives lost annually in the U.S., and our work as a trusted brand leader remains critical for communities across the U.S. and Canada. As market dynamics change, we need to proactively get ahead of these issues. Progressing to slide eight, as we navigate through our turnaround and broader transformation and also address the Nellaxom business market dynamics, we are taking action to align our resources with current business realities and prepare Emergent for 2027 and beyond. Beginning today, we are implementing several restructuring actions intended to improve our overall cost structure, keep Emergent efficient and nimble, and align resourcing to the current needs of the organization. Our restructuring efforts are expected to yield analyzed savings of approximately $40 million. These actions include a reduction of workforce of approximately 90 positions, the closure of two wet laboratories in Maryland, the sale of an unutilized office building for $6.4 million, and exiting a central warehouse lease. Also, we've integrated growth under one team leader in establishing a group where scientific discovery, portfolio strategy, clinical development, commercial insight, and external innovation will all be harmonized. The bottom line, we are taking the steps now that are needed to ensure the future of emergent as a strong and prosperous throughout our transformation journey. Before handing it over to Rich for a more detailed financial review, I'd like to highlight our strong second quarter performance on slide 10. Quarter 2 revenue was $234 million, significantly seeing the high end of our guidance range coming in ahead of our internal expectations. Year-to-date revenue was $390 million, reflecting strong execution and acceleration of our MCM deliveries in Q2 through our ongoing collaborative partnerships with the U.S. government. We delivered Q2 adjusted EBITDA of $97 million with a 41% margin, and year-to-date adjusted EBITDA was $132 million with a 34% margin. These results demonstrate the excellent focus and execution of our teams that have brought to the business. Finally, as we continue to focus on pursuing targeted business development, we are also responding to public health threats like Ebola by initiating our Pan-Ebola Therapeutic Program. We also advance important regulatory activities during the quarter, including the receival of Saudi FDA approval for the ACAM 2000 and Singapore Health Sciences Authority approval to expand ACAM 2000, including the MPOX indication. The MPOX study in Africa, or MOSA, is also evaluating convexa and has over 100 patients enrolled in the study-sponsored Panther with Africa CDC and other partners are opening additional sites. Turning to slide 11, our MCM business remains core to Emerge's mission and is a key growth driver. We continue to support the U.S. government and allied government partners with critical products and capabilities that help prepare for, respond to, and recover from serious public health threats. Today, we announced that we are seeking to collaborate with AI leaders and partners to address the potential risk of bioterrorism and improve biodefense response preparedness. In Q2, MCM revenue was $168 million, the highest second quarter revenue since 2020. We received multiple U.S. government contract awards and international product orders, including a contract modification of $52.7 million for AKM 2000 and a $64.5 million contract modification for botulism antitoxin. Year to date, we have secured over 10 contract awards. International momentum is also building, and we continue to see the realities of our world becoming increasingly dangerous when the Ebola virus is on the rise in Africa. International MCM sales represent approximately 20% of our total first half 2026 MCM revenues, reflecting continued engagement with the U.S. and allied governments and the importance of biodefense preparedness in an increasingly dangerous world. Let me now hand the call over to Rich. Following Rich's comments, I'll spend some time elaborating on a business outlook and growth catalyst.
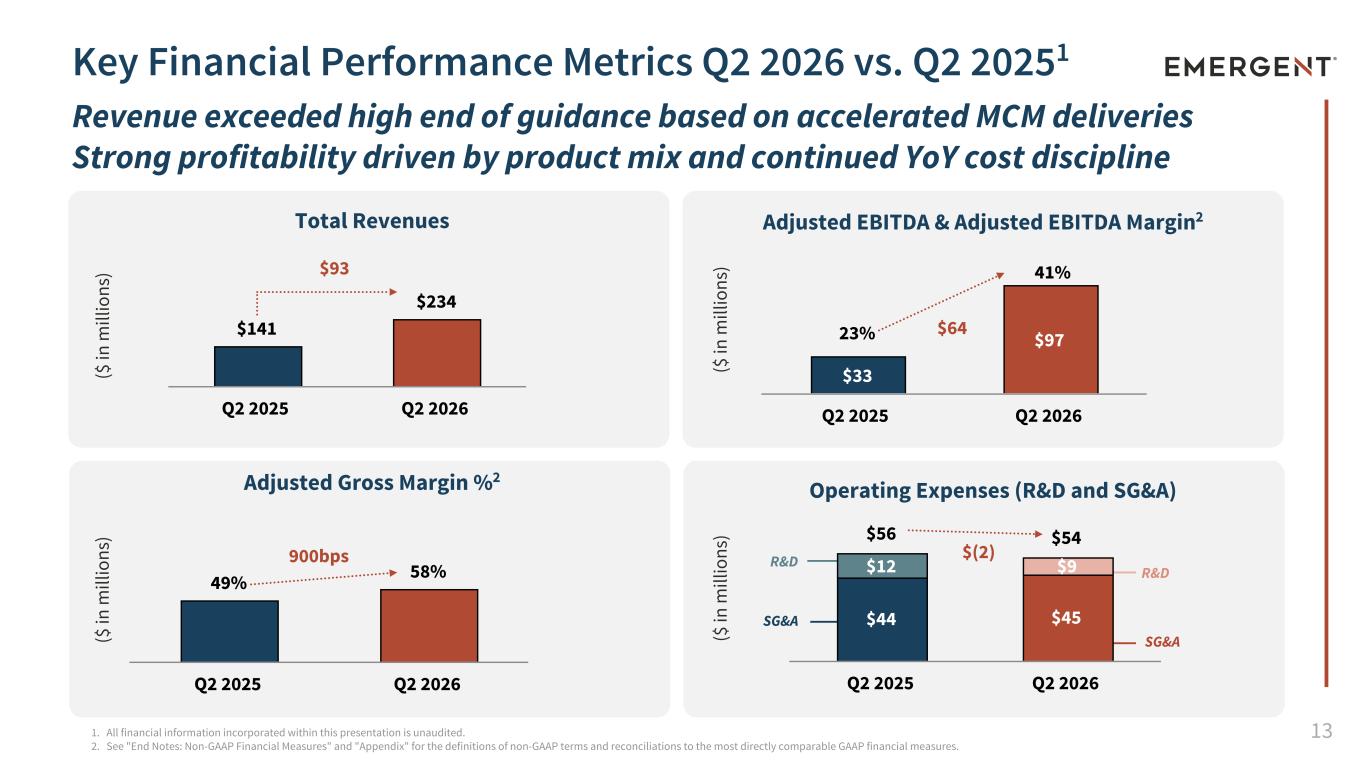
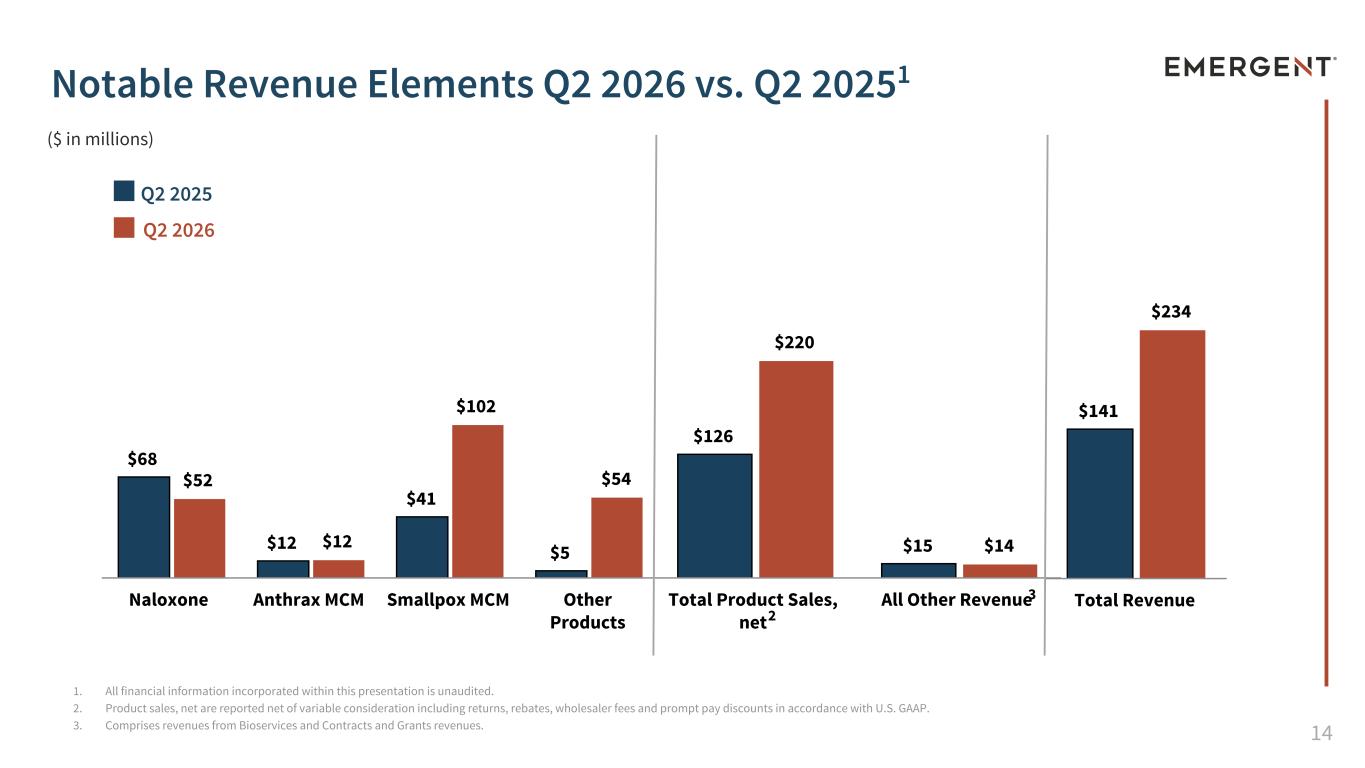
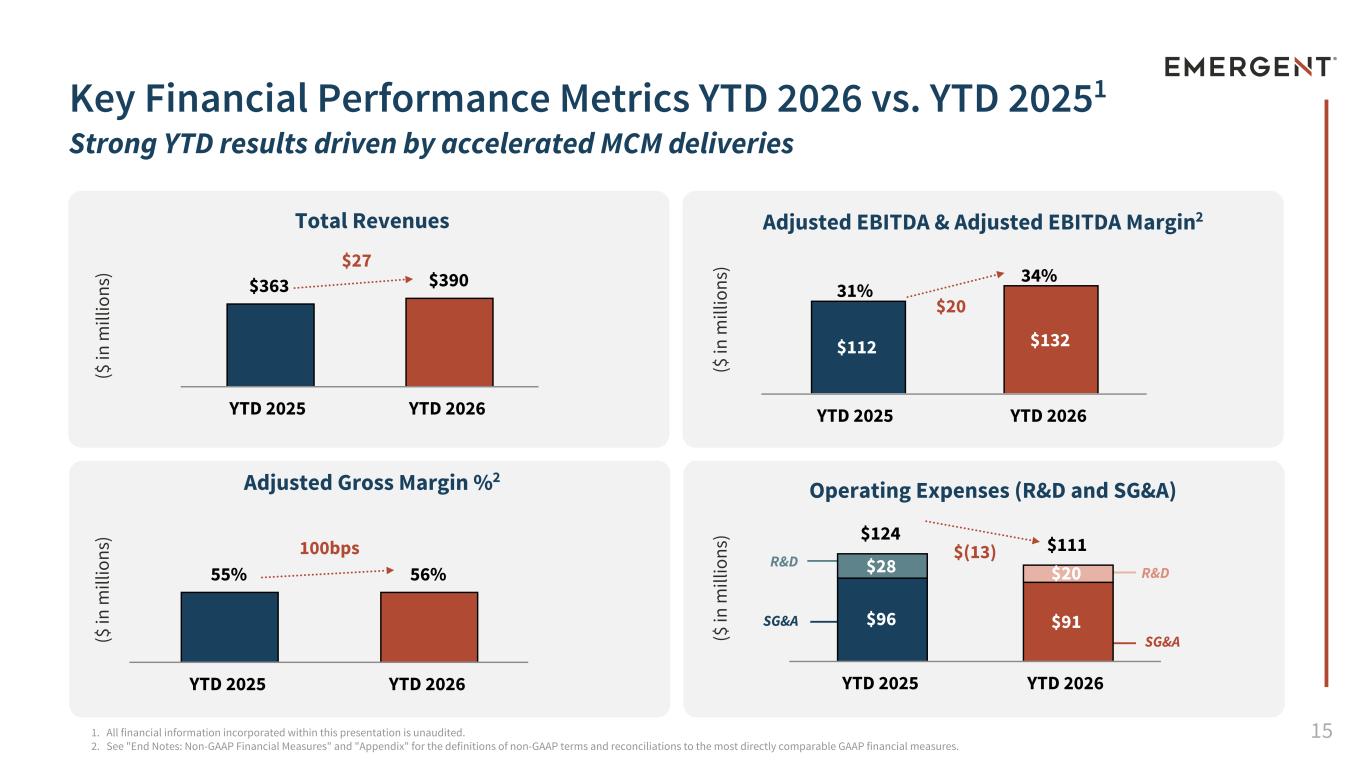
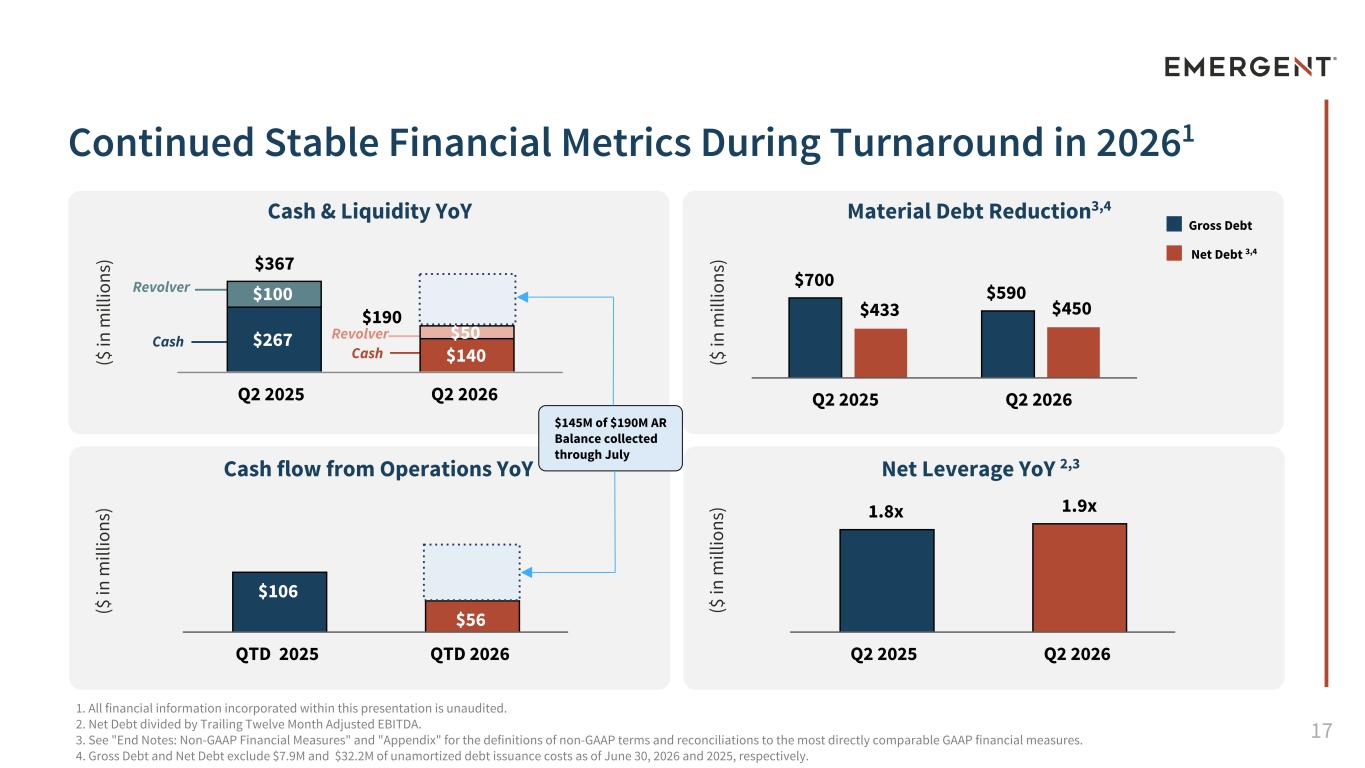
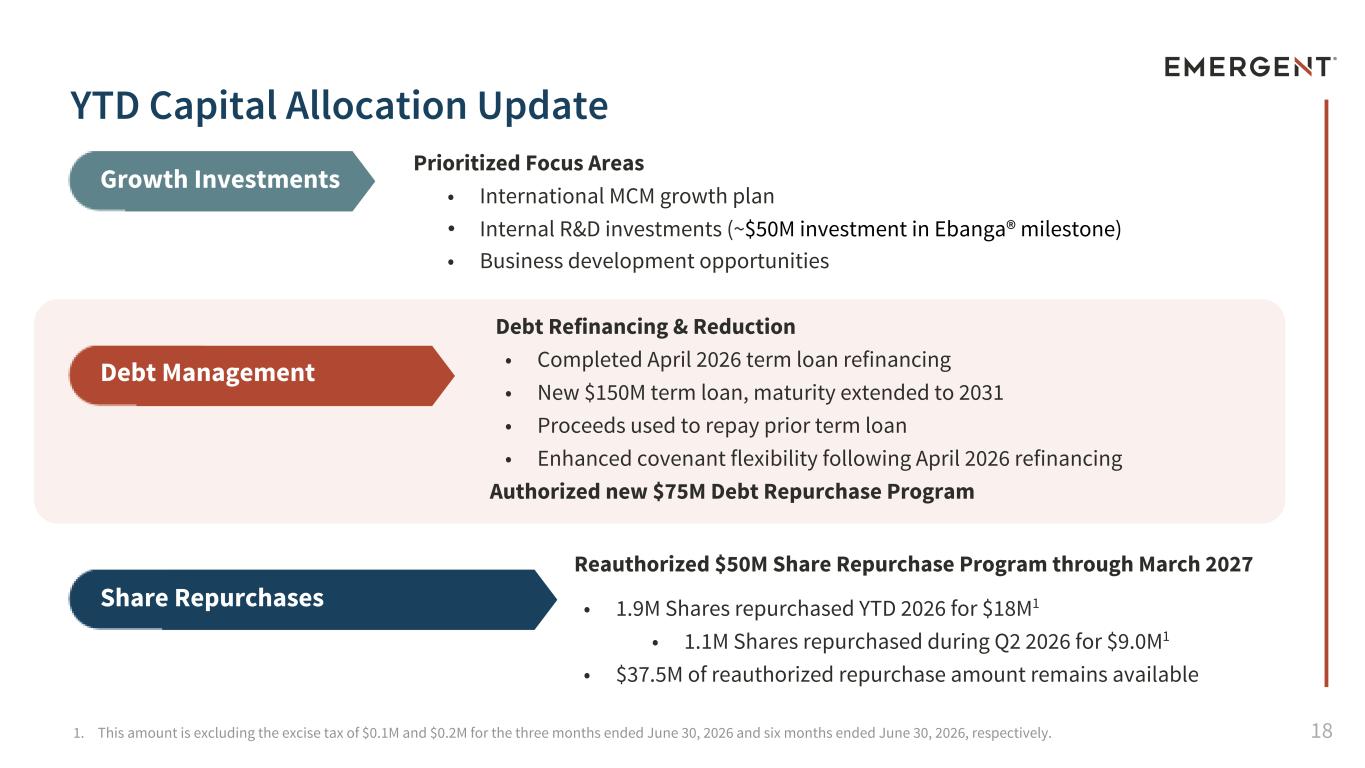
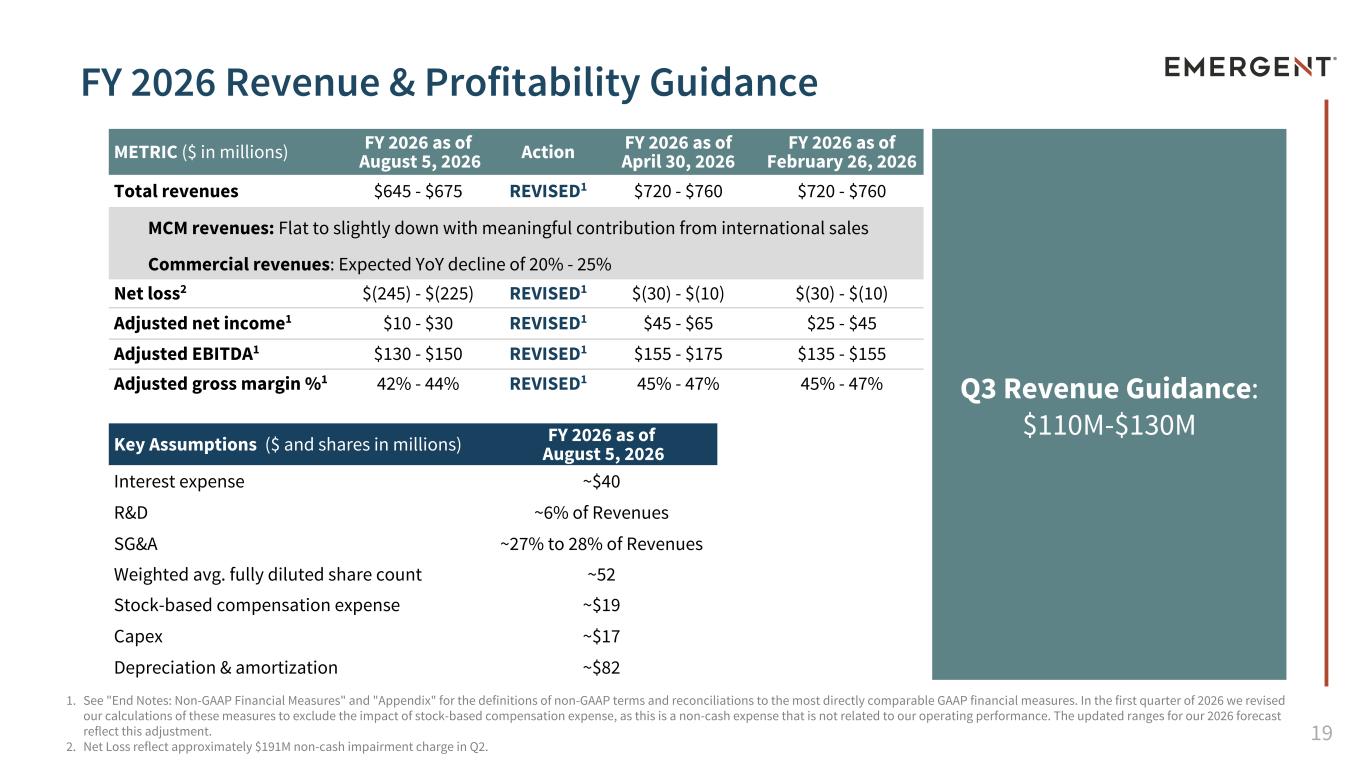
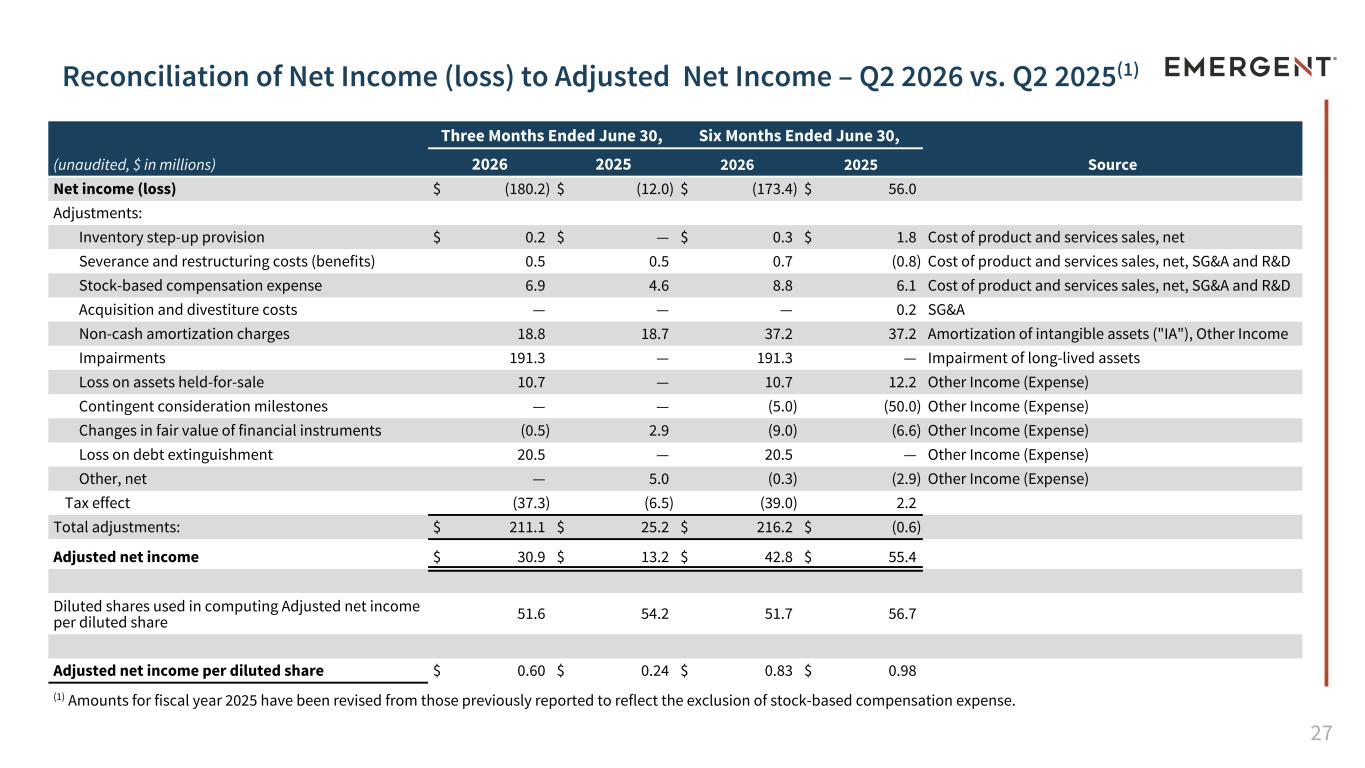
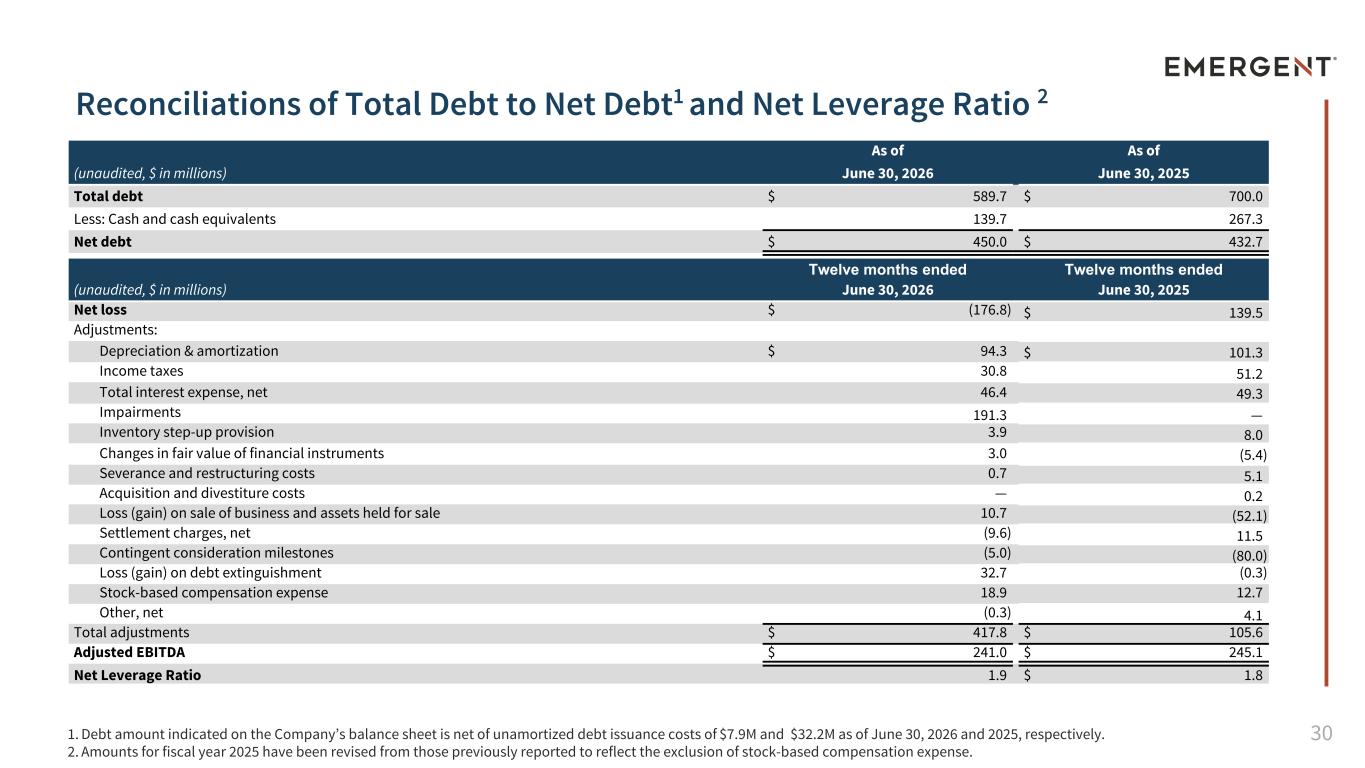
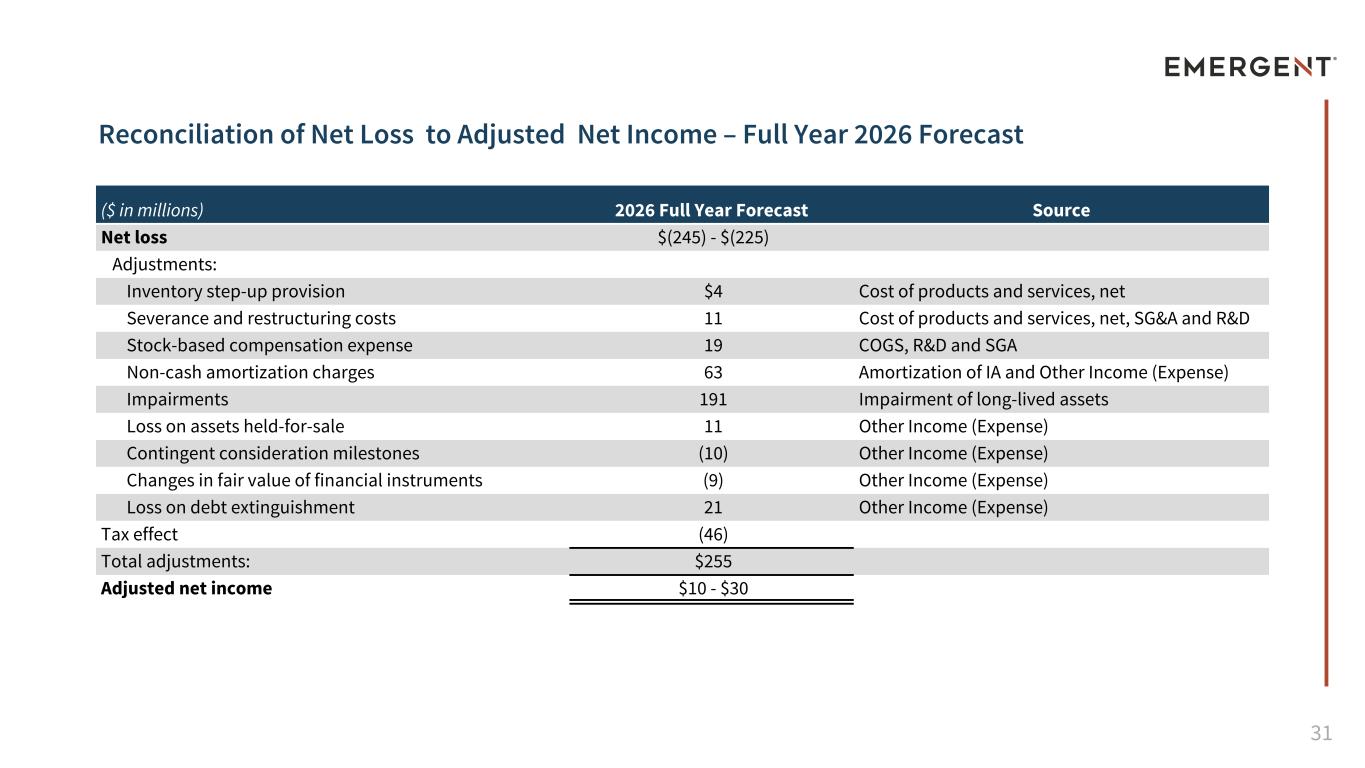
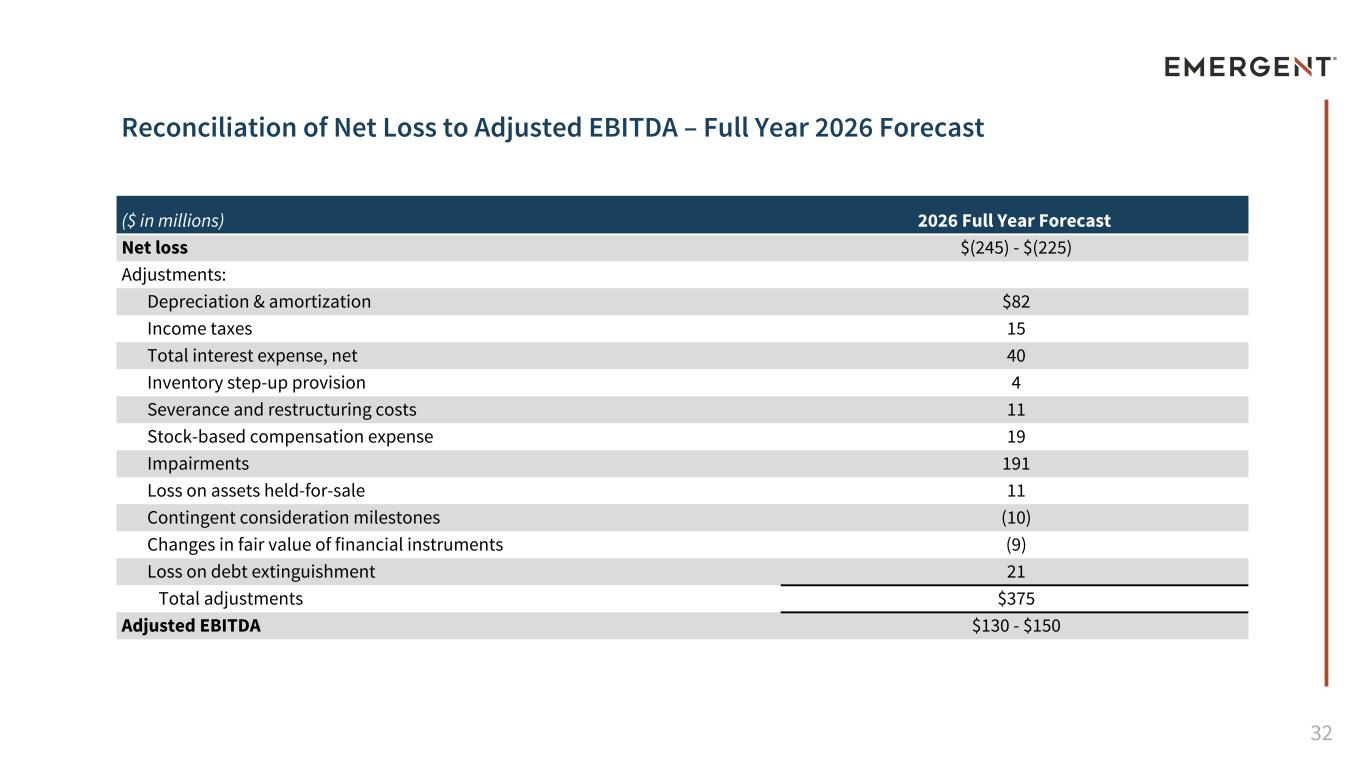
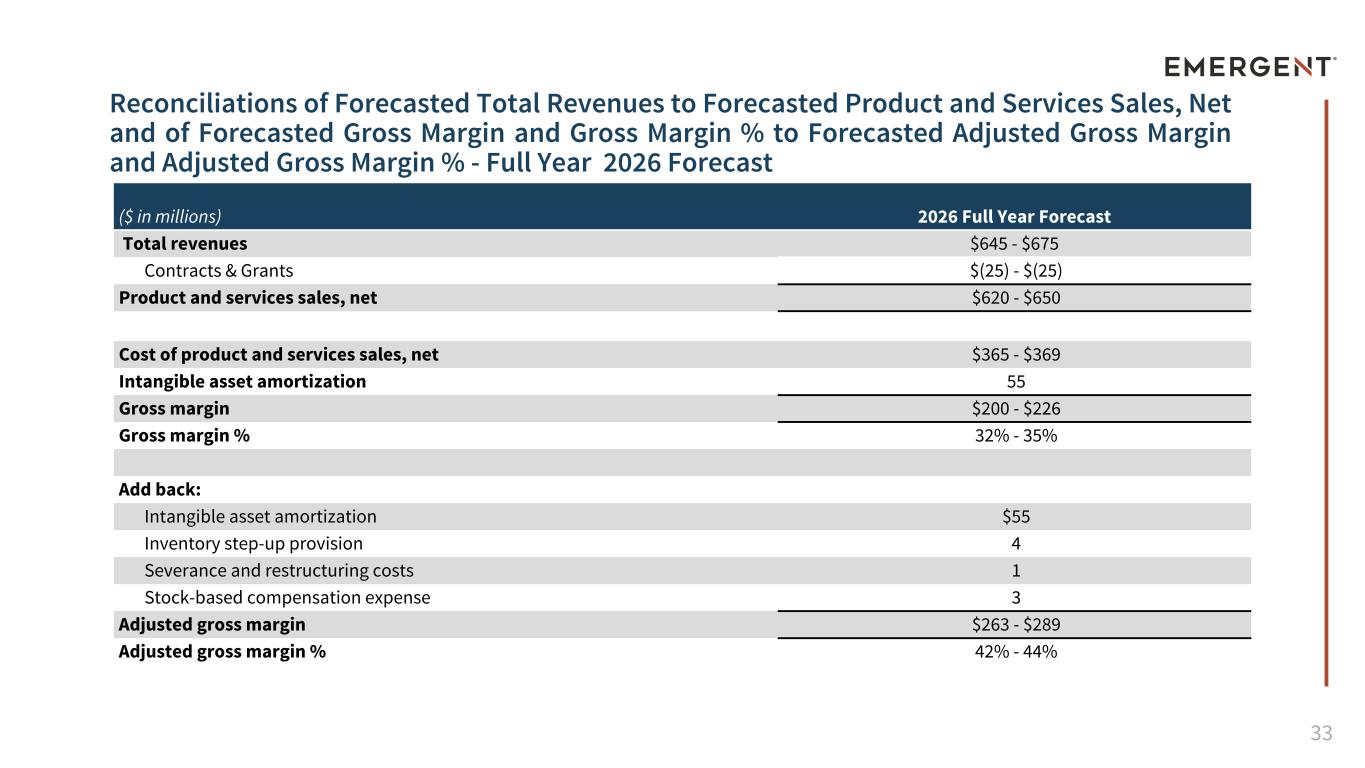
Thank you, Joe. Good afternoon, everyone, and thank you for joining our call today. We delivered a strong second quarter and first half of 2026, with revenue and adjusted EBITDA exceeding both our internal expectations and the analyst consensus. We continued to advance key strategic priorities, generated strong operating cash flow, and maintained a solid cash position while also making the $50 million eBonga investment milestone payment during the quarter. And we improved our capital structure with the April 2026 term loan refinancing, which lowered interest expense, extended maturities, and enhanced our financial flexibility. Performance in our medical countermeasures segment remained very solid and consistent with our full-year outlook, even as we accelerated some deliveries into the second quarter. In the commercial segment, recent developments in the naloxone market have led to increased competitive intensity with implications for our near-to-medium-term outlook and the book value of our Narcan Asset Group. As Joe highlighted, we have responded by implementing actions to drive greater efficiency and cost savings as we exit this year and prepare for 2027. We expect these restructuring actions to generate approximately $40 million in annualized net savings and other improvements, partially offset by approximately $11 million of cost to achieve. We also executed a transaction to sell our underutilized office building in Gaithersburg, Maryland for approximately $6 million. In light of the increasingly competitive landscape for Narcan, we recorded a non-cash impairment charge of approximately $191 million in the second quarter. This accounting adjustment reflects our updated assessment of the product's expected future cash flows in the context of current market dynamics, including pricing and competitive factors. Importantly, this charge is non-cash does not affect our cash position, liquidity, operating cash flow, or adjusted EBITDA. It does, however, reduce our GAAP net income for the quarter and is an important factor in understanding the year-over-year comparison. Turning to slide 13, our second quarter results exceeded expectations and reflect continued progress on execution. Total revenue for the second quarter of 2026 was $234 million, which came in above the $185 million high end of our prior Q2 revenue guidance. This outcome was primarily driven by our continued strong partnership with the U.S. government, which resulted in the acceleration of medical countermeasure deliveries into Q2. Adjusted EBITDA for the quarter was $97 million, representing a 41% adjusted EBITDA margin, compared with $33 million and a 23% margin in the prior year period. Adjusted gross margin was 58%, up from 49% in the second quarter of 2025, largely driven by product mix and overall volume. Operating expenses were $54 million in the quarter, down approximately $2 million year-over-year, demonstrating continued cost discipline across the business. Moving to slide 14, we highlight the notable revenue elements driving the second quarter comparison. MCM revenue was the primary contributor to the year-over-year increase, supported by accelerated deliveries and contract activity related to ACAM and BAT. Commercial revenue continues to reflect Narcan's market leadership position, while year-over-year performance was affected by new competitive pressure and continued pricing and volume dynamics. Turning to slide 15, year-to-date results were also quite strong. Total revenue was $390 million for the first six months of 2026, up from $363 million in the prior year period, driven primarily by accelerated MCM deliveries and strong execution with U.S. and international government customers. Adjusted EBITDA was $132 million year-to-date, representing a 34% margin, compared with $112 million and a 31% margin in the prior year period. Adjusted gross margin was 56%, up 100 basis points year-over-year, reflecting the benefit of product mix and disciplined operational execution. Moving to slide 16, the notable year-to-date revenue elements show the same dynamics we saw in the quarter. MCM revenue was the primary driver of the year-over-year increase, supported by the timing of product deliveries, accelerated contract awards, and meaningful international sales. Commercial revenue continues to reflect Narcan's strong leadership position, while year-to-date performance has been pressured by a more competitive naloxone market. Overall, the first half reflects strong MCM performance, offsetting pressure in the commercial portfolio. On slide 17, we highlight continued stability in our financial metrics. We ended the second quarter with $140 million of cash and $190 million of total liquidity. While cash declined versus the prior year period, the business continued to generate significant operating cash flow while also absorbing the $50 million Imbanga Investment Milestone Payment during the quarter. In addition, we've already received $145 million of cash through July from the $190 million accounts receivable balance at June 30, which further improves our operating cash flow and liquidity. Gross debt was $590 million as of June 30, 2026, compared with $700 million in the prior year. Net debt was $450 million, and our net leverage ratio remained stable year over year at 1.9 times trailing 12-month adjusted EBITDA. On slide 18, turning to capital allocation, our priorities remained focused on strengthening the business and creating long-term shareholder value. We completed the April 2026 term loan refinancing, establishing a new $150 million term loan with insurity extended to 2031, reduced interest rates, and enhanced operating and financial flexibility. In addition, our board authorized a new $75 million debt repurchase program, and as previously mentioned, we have a $50 million share repurchase program through March 2027. During the second quarter, we repurchased 1.1 million shares for approximately $9 million, bringing year-to-date repurchases to 1.9 million shares for $18 million. As of quarter end, $37.5 million remained available under the Authorized Share Repurchase Program. We continue to balance debt reduction, disciplined share repurchases, and investments in international MCM growth, internal R&D, including the Mbonga Program, and business development opportunities. turning to slide 19 we have updated our revenue and profitability guidance we're revising full year 2026 total revenue guidance to a range of 645 million to 675 million compared with our prior range of 720 to 760 million dollars the revision primarily reflects lower expected commercial revenue in the second half of the year driven by increased competitive pressure in narcan as well as continued pricing and volume pressure across the naloxone market. For MCM, we continue to expect contributions from U.S. government procurement and international sales, with the first-half benefit from accelerated deliveries already reflected in our year-to-date results. We are also revising our profitability outlook to reflect updated revenue expectations, the anticipated impact of restructuring actions, and the Narcan non-cash impairment charge. Our GAAP net loss guidance is now expected to be within a range of negative $245 million to negative $225 million, which includes the effect of non-cash items and restructuring-related expenses. Adjusted net income guidance is now expected to be $10 million to $30 million. We're revising adjusted EBITDA guidance to $130 to $150 million, compared with our prior range of $155 to $175 million. At the midpoint, the adjusted EBITDA reduction is substantially less than the revenue reduction because the lower revenue outlook is partially offset in 26 by the impact of the cost savings initiative announced today, along with continued operating expense discipline. We're also revising adjusted gross margin guidance to 42% to 44%, reflecting the expected mix impact from lower commercial revenue. For the third quarter, we expect total revenue to be between $110 and $130 million. Q3 outlook reflects an anticipated step-down following the accelerated MCM deliveries in the first half, as well as continued commercial pressure from the evolving naloxone marketplace. Even with the lower revenue outlook, we remain focused on cash generation, disciplined capital management, and execution of our cost savings program to support profitability and liquidity through the balance of 2026. In summary, Q2 was a strong quarter for emergent and capped a solid first half of the year. We exceeded the high end of our Q2 revenue guidance, delivered adjusted EBITDA of $97 million with a 41% margin, and generated strong operating cash flow. We ended the quarter with $140 million of cash, which increased significantly in early Q3 through accounts receivable collections. And during the quarter, we continued to execute our capital management priorities. Following the April 2026 term loan refinancing, we've enhanced financial flexibility through extended maturities, lower interest expense, and improved covenant flexibility. We'll continue to demonstrate financial discipline as we sustain our current business, pursue growth opportunities, and create shareholder value over time. And with that, I'd like to turn the call back over to Joe to discuss our business outlook and growth catalyst before we go into Q&A.
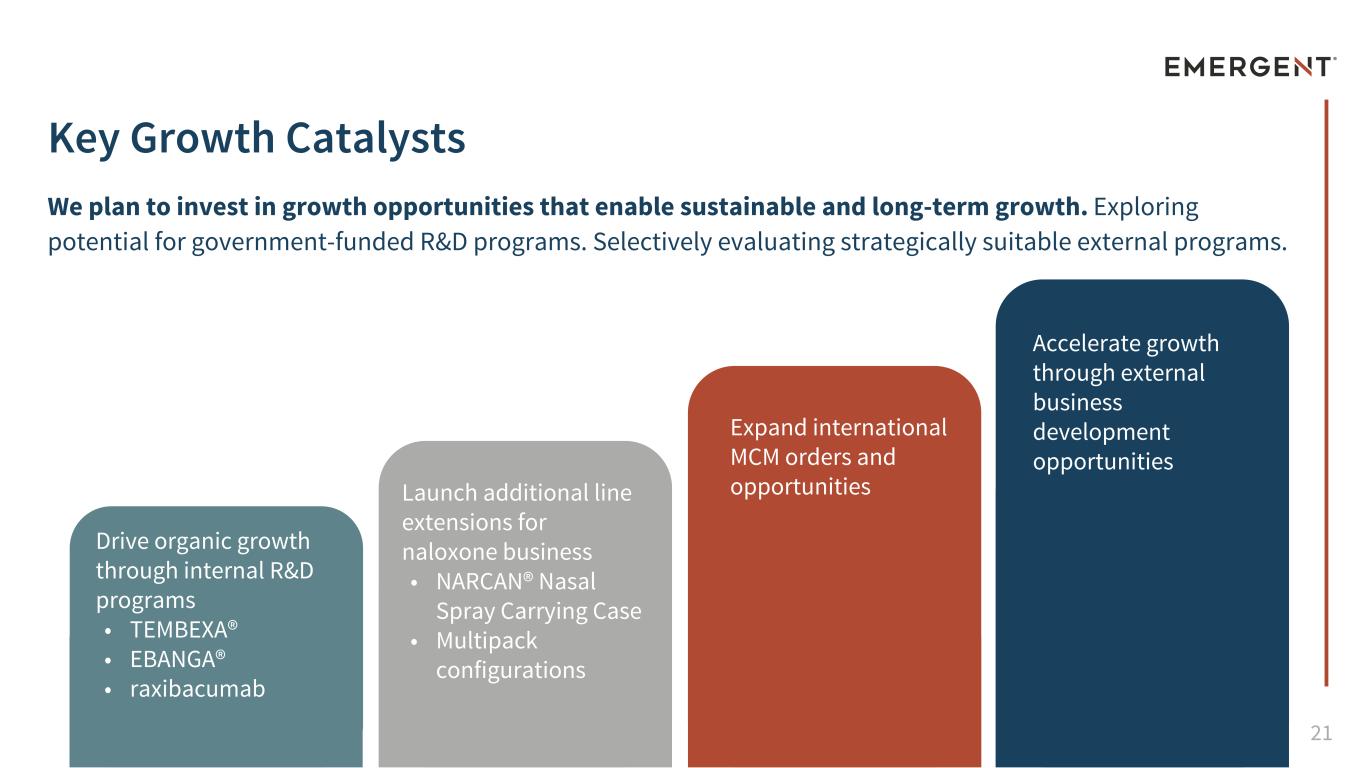
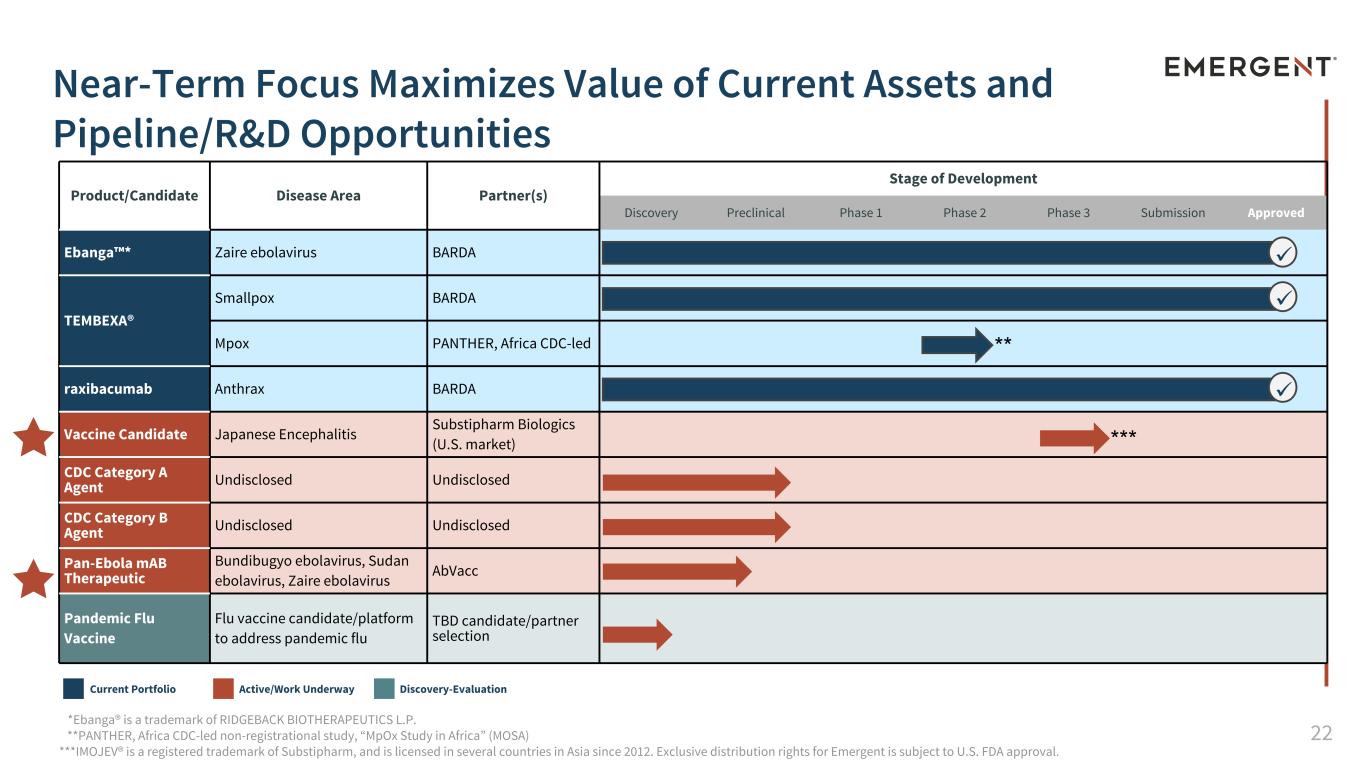
Thank you, Rich. Turning to slide 21, I'd like to provide context around our business outlook and the catalyst we believe can enable growth in 2026 and beyond. Our growth outlook is focused on four principal areas. First, expanding international MCM orders and opportunities. Second, launching additional line extensions for the Naloxone business, including the Narcan nasal spray carrying case, including the multi-pack configurations. Third, driving organic growth through internal R&D programs, including Tabexa, Ibonga, and Raxibacumab. And fourth, accelerating growth through selective external business development opportunities opportunities that are value-decreative. Additionally, as I previously mentioned, we are unifying R&D and business development into the growth organization, which we believe will help us make faster, more informed portfolio decisions and allocate capital with greater discipline. Turning to slide 22, our near-term pipeline and current asset strategy is focused on maximizing the value of programs where Emergent has differentiated experience, clear mission alignment, and the potential to support sustainable growth. The important note here is that our pipeline is about focusing our resources on assets and programs where Emergent can lead, or capabilities matter, and where we can continue to help protect and save lives against public health threats. Now moving to our summary on slide 23, while Emergent is continuing to execute on its multi-year transformation plan, we are taking decisive action now to address Narcan business realities, prepare the company for 2027 and beyond, and remain focused on our mission to protect and save lives. We are restructuring our business operation to improve overall cost structure, drive efficiencies, and align resourcing to the current needs of the organization. Our MCM business continues to support the U.S. in international preparedness, and our Nalaxim business continues to deliver an emergent mission to protect and save lives. Remain committed to patient safety, quality, and compliance across the enterprise while pursuing growth initiatives in creating long-term value for shareholders. With that, I look forward to your question. Operator, if we can please open the line for questions.
Operator
Thank you. At this time, we will conduct the question and answer session. As a reminder, to ask a question, you will need to press star 1-1 on your telephone and wait for your name to be announced. To withdraw your question, please press star 1-1 again. Please stand by while we compile the Q&A roster. First question comes from the line of Raghuram Selva Raju of H&C Wainwright & Co. Your line is now open.
Thanks very much for taking our questions. Firstly, with respect to the Narcan situation, I was wondering if you could provide us with some additional granularity on any potential initiatives that you think are likely to be particularly effective in A, slowing the pace at which Narcan sales might erode, and B, potentially leverage the brand recognition that you have in order to position the franchise more effectively and effectively as the key line of defense against next-gen fentanyl analogs, which, as I understand, are significantly more addictive and more likely to be fatal than fentanyl itself. Secondly, I was wondering if you could just give us some more insight into your strategic thinking behind the reorientation of the company away from what sounds like basic R&D and how you anticipate redeploying those resources, particularly with potentially a greater focus going forward on strategic in-licensing and asset acquisition. And then lastly, I was wondering if you could give us a sense of, given the fact, I think you said this multiple times in your prepared remarks, that we are increasingly living in a more and more dangerous world, whether you are seeing any emergent trends in MCM contract procurement demands outside of the United States? Thank you.
Sure. A lot of good questions there. I'll take them one at a time, make sure I answer all of them. On the Narcan initiatives, yes, absolutely we're looking to things to continue to keep the share we have today and potentially grow that share. We're looking at, obviously, number one, the brand Narcan itself is important. We have that brand name when you are looking at the opportunities that face the marketplace. Having the brand name Narcan is very important. We've had a chance to talk to consumers about that. They obviously recognize the importance of the Narcan brand name. Number two, as a market leader, we are continuing to bring out new innovation. That new innovation we bring out includes things like the carrying case that's perfect for those students or college students that clip it onto their backpack as an example. We are also looking at multi-packs where we're putting additional Narcan together to make it easier for the high-user first responders to have high-volume users have the Narcan available and packs beyond just the two nasal sprays in one kit. As an example, just bringing out new innovation, bringing out what we're doing not only with the carrying case, but also the multi-packs, but also the wall kits that we have that we're trying to get additional exposure for. So those are the innovation things that we're doing beyond the brand name. And then finally, to be clear, we are still the market leader. We still have, we believe, over a 50% market share of the Nalaxone market. Having said that, though, we recognize with additional competition, we expect there will be some additional price pressures on the product, and that's why we made some of the decisions we talked about today. But we clearly believe Narcan will continue to be the gold standard here, and we are prepared for that, but we want to make sure we are looking at realistically what we think the numbers and what the issues are for Narcan from a pricing pressure point of view with the knowledge that we have two new competitors coming into the space. On the second question, on the R&D side, I'd say, Ron, the answer to that is that we are looking at R&D still being pivotally important to us. We're continuing to still invest behind products like Tembexa, products like Ibanga, products like Rexibacumab. We're continuing to look, as I mentioned in my comments, what can we do in Africa to do the MOSA trials to get some additional data on Tembexa and its benefits in MPOC. So we're going to continue to invest in R&D, to be clear. We think, however, However, by putting the decisions into one group where we bring the external business development and the internal R&D projects together into one decision maker, we will have the ability to make faster decisions, better allocation of capital to the future pipeline opportunities, and that's where we think we'll get better return on investment for our shareholders going forward. But to be clear, there's still going to be all the efforts we need on the R&D side to ensure we're going to have the appropriate decision-making and just we think we can make faster, better decisions by putting together this one, let's call a chief growth officer for the company to help us to make those decisions quickly and focused on all the right return on investment metrics and trying to continue to advance our mission. On the question of the increasingly dangerous world, The answer to that is, are we seeing things? Absolutely, correctly, we are. We're hearing from governments around the world what some of the issues are. Some of you may have seen recent articles going back into June where some of the AI CEO leadership are specifically writing letters of concern that AI could be utilized by bad actors to create new pathogens, pathogens that could be very, very chaotic and cause additional problems. We intend, as we put out a release today, to collaborate with the AI leaderships to make sure that we are going to be front and center there on helping governments around the world to prepare for the potential activities that could happen through AI that could expedite bad actors creating pathogens that are problematic. So we are absolutely, as a leader in this area of medical countermeasures preparedness, want to be up right front and center coordinating all the activities based on our experience. So those are the things that we think are important. We're going to continue to move forward and make progress with those because it is an increasingly dangerous world out there. Operator, next question.
Operator
Thank you. One moment for our next question. Next question comes from the line of Jessica Fai of J.P. Morgan. Your line is now open.
Good afternoon. Thanks for taking our questions. First, just on the kind of financial picture, it seems like other revenue was a key driver of year-over-year revenue growth in the first half. Can you outline just what's in there and how sustainable that is? And then for Narcan, can you collaborate on what you're seeing in the Naloxone market a little more specifically and talk about what your latest price and volume expectations are for Narcan for the rest of this year and longer term? And then lastly, sorry, third question, as it relates to the revenue guidance update, should we take that as entirely Narcan related? Was there any, say, upside from other business lines that's being more than offset by the Narcan headwinds? Just want to kind of better understand what's below the surface there.
So on the – hi, Jess. Thanks for the question. On the other revenue, the biggest driver there is our BAT product, our botulism antitoxin. And we had a significant delivery that occurred in the third quarter that really drove that year-over-year increase.
The question of nalaxone and where we are with the market and pricing. So what's happening out there in the market? The market's still a strong market in terms of what we're seeing in terms of, unfortunately, 45,000 people still dying because of opioid overdoses. So we still think the market need is there. We still are preparing to be out there with our units, with Narcan out there. Having said that, though, we have seen competitive price pressures. We think the correlation of the new entrants and people preparing for new entrants to make sure that they can hold on to their share is, as with other generic companies, when they come in to compete with the brand, they will look at price as an option to try to get some incremental share. We just want to make sure that we are prepared. I mean, to be clear, Narcan is up versus the first quarter, so we are seeing – we did see it grow over in the first quarter. However, as we thought about the remainder of this year and going into next year, we wanted to be prepared knowing what we've seen with other markets when additional generic players show up into the market. So that was the logic and how we thought about it for the rest of this year and into next year. But we do expect to see additional price erosion, to be clear. We think the market should be flat, maybe in terms of total NALAC's own unit, should be relatively flat, somewhere around that area. And we will obviously continue to look to maintain a leadership position in terms of market share for our Narcan business. And the last question you asked was about the guidance, Rich. Thank you.
So the biggest driver of the change in our guidance is, in fact, that commercial segment or the view on naloxone revenue for the year. As we had previously guided for medical countermeasures, we thought it would be flat to slightly down on the year. Our view really hasn't changed for that segment. But for the factors that Joe highlighted just now and earlier on the call, we do see lower overall commercial revenue driven by naloxone for the balance of the year and for the full year.
Thank you for the question, Jessica. Operator, any additional questions?
Operator
Thank you. One moment for our final question.
Operator
Our next question comes from the line of Alex Kelsey of Wells Fargo.
Operator
Your line is now open.
Hey, guys. Appreciate taking the questions. I'll layer mine in sequential order as well. Just on the July comment about AR, was that through a securitization program or was that just collecting AR in normal course? And then regardless of the mechanism, pro forma, all else equal, am I correct to think that cash pro forma is closer to the 140 plus 145, so 285? That's number two. And then number three, the comments on the $75 million debt repurchase authorization. Am I safe to assume that that would be targeted at the senior unsecured notes, or is there any reason that you would look to address the new term loan before the bonds?
Thanks, Alex. Appreciate the questions. The collection of the $145 million is all from accounts receivable related to deliveries that occurred in the second quarter and that were in the balance as of the end of the second quarter. It is not related to a securitization or any other kind of financing facility. It's just pure, you know, working capital accounts receivable collection. As far as, you know, the impact on cash flow, yes, that certainly flows through to the cash balance. Obviously, there's, you know, there's some expenses as we come through the month, but, you know, safe to assume that a very meaningful portion of that, you know, flowed through to our cash balance as of the end of July. And then finally, the $75 million authorization is specifically to repurchase the senior unsecured notes. And so that there'll be a little more detail on that in the 10Q when we file that.
All right. And if I'm still online, with regard to the 40 million cost saves, any sense of timing as to when we should expect that to be realized and annualized in the numbers?
Sure. We're going to start now as I mentioned on the call in terms of that realization. Obviously, the full run rate of that would be in the full year of 2027, but we're starting now. We'll pick up some in 2026, but the full run rate of a 40 million would be in 2027 and beyond.
Great. Thank you very much.
Operator
Robert, any other questions? That was the final question. So this concludes the question and answer session. I would now like to turn it back over to Joseph Papa for closing remarks.
All right. Well, thank you everyone for joining us today. Please note an archived version of today's webcast as well as a PDF version of the slides used during today's call will be available later today and accessible through our investors landing page on the company website. Thank you again for joining us. We look forward to speaking to you all in the near future. Thank you, everyone. Goodbye.
Operator
Thank you for your participation in today's conference. This does conclude the program. You may not disconnect.