
Enterprise Financial Services Corp 8-K, filed Apr 21, 2020
Enterprise Financial Services Corp (EFSC)
8-K
2020-04-21
For: 2020-04-20
View Original
Added on
April 09, 2026
About this 8-K
Enterprise Financial Services Corp filed this 8-K on April 21, 2020, reporting on events of April 20, 2020.
Items reported
- Item 2.02: Financial results
- Item 9.01: Financial statements and exhibits
UNITED STATES
SECURITIES AND EXCHANGE COMMISSION
Washington, D.C. 20549
FORM 8-K
CURRENT REPORT
Pursuant to Section 13 or 15(d) of
The Securities Exchange Act of 1934
Date of Report (Date of earliest event reported)
(Exact name of registrant as specified in its charter)
(State or Other Jurisdiction of Incorporation) | (Commission File Number) | (IRS Employer Identification No.) |
(Address of principal executive offices) | (Zip Code) | |||
Registrant’s telephone number, including area code
(314 ) 725-5500
Not applicable |
(Former name or former address, if changed since last report) |
Check the appropriate box below if the Form 8-K filing is intended to simultaneously satisfy the filing obligation of the registrant under any of the following provisions:
Securities registered pursuant to Section 12(b) of the Act:
Title of each class | Trading Symbol(s) | Name of each exchange on which registered | ||
Indicate by check mark whether the registrant is an emerging growth company as defined in Rule 405 of the Securities Act of 1933 (§230.405 of this chapter) or Rule 12b-2 of the Securities Exchange Act of 1934 (§240.12b-2 of this chapter).
Emerging growth company ☐
If an emerging growth company, indicate by check mark if the registrant has elected not to use the extended transition period for complying with any new or revised financial accounting standards provided pursuant to Section 13(a) of the Exchange Act. ☐
Item 2.02 Results of Operations and Financial Condition.
On April 20, 2020, Enterprise Financial Services Corp (the "Company" or "EFSC") issued a press release announcing financial information for the quarter ended March 31, 2020. A copy of the press release is furnished as Exhibit 99.1 and is incorporated herein by reference.
On April 21, 2020, at 10:00 a.m. Central time, the Company intends to hold a webcast to present information on its results of operations for the quarter ended March 31, 2020. The slide presentation which will accompany the webcast is furnished as Exhibit 99.2 and is incorporated herein by reference.
The press release, slide presentation and information contained therein and in this Item 2.02 shall not be deemed “filed” with the Securities and Exchange Commission.
Item 9.01 Financial Statements and Exhibits.
(d) Exhibits.
Exhibit
Number Description
104 | The cover page of this Current Report on Form 8-K, formatted in Inline XBRL |
SIGNATURES
Pursuant to the requirements of the Securities Exchange Act of 1934, the registrant has duly caused this report to be signed on its behalf by the undersigned thereunto duly authorized.
ENTERPRISE FINANCIAL SERVICES CORP | ||||
Date: | April 20, 2020 | By: | /s/ Troy R. Dumlao | |
Troy R. Dumlao | ||||
Senior Vice President and Chief Accounting Officer | ||||
EXHIBIT 99.1

ENTERPRISE FINANCIAL REPORTS FIRST QUARTER 2020 RESULTS
First Quarter Results
• | Net income of $12.9 million, $0.48 per diluted share, including the impact of provision for credit losses of $0.63 per share |
• | Net interest margin (tax equivalent) of 3.79% |
• | Return on average assets of 0.70% |
• | Loans increased $143.2 million, or 11% annualized |
• | Deposits increased $218.9 million, or 15% annualized |
St. Louis, Mo. April 20, 2020 – Enterprise Financial Services Corp (Nasdaq: EFSC) (the “Company” or “EFSC”) reported net income of $12.9 million for the first quarter 2020, a decrease of $16.2 million compared to the linked fourth quarter (“linked quarter”) and a decrease of $3.3 million from the prior year quarter. Earnings per diluted share (“EPS”) was $0.48 for the first quarter 2020, compared to $1.09 and $0.67 for the linked and prior year quarters, respectively. Net income and EPS in the current quarter declined from the linked quarter and prior year quarter primarily due to an increase in provision for credit losses, described in more detail below. Merger-related expenses also impacted the results in the prior year quarter.
In the first quarter of 2020, the Company adopted the new accounting standard, commonly referred to as CECL, to estimate credit losses. Due to current economic conditions, the provision for credit losses was $22.3 million for the first quarter 2020, compared to $1.3 million for the linked quarter and $1.5 million for the first quarter 2019. CECL requires economic forecasts to be factored into determining estimated losses. As a result, CECL will typically require a higher level of provision at the start of an economic downturn.
Jim Lally, EFSC’s President and Chief Executive Officer, commented, “Currently, we are faced with unprecedented and rapidly evolving global challenges presented by the COVID-19 pandemic. Our sympathy goes out to everyone who has been impacted, and we are thankful for all the healthcare workers and other essential business employees who continue to keep us safe. The pandemic and resulting social distancing measures across the country have had a profound impact on how business has been conducted across all industries. Considering these challenges, it has been extremely encouraging to see how our associates have risen to the task of working remotely while continuing to serve our customers. We are actively working with our customers to provide support for all their financial needs. Our associates worked around the clock to put an operational framework in place for the rollout of the SBA’s Paycheck Protection Program. I am proud to say that we have processed over 1,500 applications and have received approval from the SBA to fund more than $680 million of loans to our customers, providing much needed relief to over 67,000 employees within our communities.”
Lally continued, “Despite the challenges of the COVID-19 pandemic and the substantial decrease in short-term interest rates, we had a strong first quarter. We had record operating revenue of $76.8 million, an expanded net interest margin and a stable efficiency ratio. While our provision for credit losses increased under CECL, we believe our asset quality is strong, and our loan portfolio continues to grow. Our focus on continuous improvement, which has been a cornerstone of our strategic plan, has served us well in this environment. We have taken proactive and disciplined steps to ensure the safety of our employees and customers as well as to manage our financial performance. We believe our liquidity, strong balance sheet and capital levels will aid us in navigating these uncertain times and position us to continue to serve our customers and communities.”
1
Highlights
The Company closed its acquisition of Trinity Capital Corporation (“Trinity”) on March 8, 2019. The results of operations of Trinity are included in our results from this date forward, which may affect certain comparisons to the first quarter of 2019.
• | Earnings - Net income in the first quarter 2020 was $12.9 million and EPS was $0.48. Pre-tax pre-provision income1 (“PTPP”) of $38.1 million in the first quarter 2020, increased $0.4 million and $16.4 million from the linked-quarter and first quarter 2019, respectively. |
• | Net interest income and net interest margin - Net interest income of $63.4 million for the first quarter 2020, increased $1.8 million and $11.0 million, from the linked quarter and first quarter 2019. The net interest margin (“NIM”) was 3.79% for the first quarter 2020, compared to 3.68% and 3.87% for the linked quarter and first quarter 2019, respectively. |
• | Loans - Total loans grew $143.2 million, or 10.8% annualized, to $5.5 billion as of March 31, 2020. Year-over-year, loans grew $440.4 million, or 8.8%, from $5.0 billion as of March 31, 2019. Growth in the loan portfolio was broad-based across most lending categories. |
• | Deposits - Total deposits grew $218.9 million, or 15.3% annualized, to $6.0 billion as of March 31, 2020. Year-over-year, deposits grew $452.8 million, or 8.2%, from $5.5 billion as of March 31, 2019. Noninterest deposit accounts represented 22.6% of total deposits at March 31, 2020, and the loan to deposit ratio was 91.1%. |
• | Asset quality - The allowance for loan losses to total loans increased to 1.69% at March 31, 2020 from 0.81% and 0.86% at December 31, and March 31, 2019, respectively. The adoption of the CECL accounting standard on January 1, 2020 increased the allowance by $28.4 million and the allowance coverage ratio by 0.53% of total loans. The provision for credit losses on loans for the first quarter 2020 increased the allowance by $21.7 million. |
• | Capital - Total shareholders’ equity was $846.4 million and the tangible common equity to tangible assets ratio was 8.42% at March 31, 2020. Regulatory capital ratios remain “well-capitalized”, with a common equity tier 1 ratio of 9.58% and a total risk-based capital ratio of 12.85%. |
In the first quarter 2020, the Company repurchased 456,251 shares at an average price of $33.64 prior to suspending its repurchase of shares through the share repurchase plan in March. There are 95,907 shares available for repurchase under the existing authorization.
The Company’s Board of Directors approved a quarterly dividend of $0.18 per common share, payable on June 30, 2020 to shareholders of record as of June 15, 2020.
• | Liquidity - The Company maintains a high level of both on-balance-sheet and off-balance-sheet liquidity. At March 31, 2020, on-balance-sheet liquidity consisted of cash and unpledged investment securities of $1.1 billion. Off-balance-sheet liquidity totaled $1.8 billion through the Federal Home Loan Bank, Federal Reserve and correspondent bank lines. The Company also has an unused $25 million revolving line of credit and maintains a shelf registration allowing for the issuance of various forms of equity and debt securities. |
1 PTPP is a non-GAAP measure. Refer to discussion and reconciliation of these measures in the accompanying financial tables.
2
Net Interest Income
Net interest income for the first quarter increased $1.8 million to $63.4 million from $61.6 million in the linked quarter, and increased $11.0 million from the prior year period. The increase from the linked quarter was primarily due to growth in the average loan portfolio while the increase from the prior year period was primarily due to the Trinity acquisition and organic growth. NIM, on a tax equivalent basis, was 3.79% for the first quarter, compared to 3.68% in the linked quarter, and 3.87% in the first quarter of 2019.
Core net interest income and core net interest margin noted in the table below exclude incremental accretion on non-core acquired loans.
Quarter ended | |||||||||||||||||||
($ in thousands) | March 31, 2020 | December 31, 2019 | September 30, 2019 | June 30, 2019 | March 31, 2019 | ||||||||||||||
Net interest income | $ | 63,368 | $ | 61,613 | $ | 63,046 | $ | 61,715 | $ | 52,343 | |||||||||
Less: Incremental accretion income2 | 1,273 | 576 | 2,140 | 910 | 1,157 | ||||||||||||||
Core net interest income3 | $ | 62,095 | $ | 61,037 | $ | 60,906 | $ | 60,805 | $ | 51,186 | |||||||||
Net interest margin (tax equivalent) | 3.79 | % | 3.68 | % | 3.81 | % | 3.86 | % | 3.87 | % | |||||||||
Core net interest margin3 (tax equivalent) | 3.71 | 3.64 | 3.69 | 3.80 | 3.79 | ||||||||||||||
2 Represents incremental accretion income on non-core acquired loans which were acquired from the FDIC and previously covered by shared-loss agreements.
3 Core net interest income and core net interest margin are non-GAAP measures. Refer to discussion and reconciliation of these measures in the accompanying financial tables.
3
Average Balance Sheets
The following table presents, for the periods indicated, certain information related to our average interest-earning assets and interest-bearing liabilities, as well as, the corresponding interest rates earned and paid, all on a tax-equivalent basis.
Quarter ended | ||||||||||||||||||||||||||||||||
March 31, 2020 | December 31, 2019 | March 31, 2019 | ||||||||||||||||||||||||||||||
($ in thousands) | Average Balance | Interest Income/ Expense | Average Yield/ Rate | Average Balance | Interest Income/ Expense | Average Yield/ Rate | Average Balance | Interest Income/ Expense | Average Yield/ Rate | |||||||||||||||||||||||
Assets | ||||||||||||||||||||||||||||||||
Interest-earning assets: | ||||||||||||||||||||||||||||||||
Loans, excluding incremental accretion* | $ | 5,352,243 | $ | 66,017 | 4.96 | % | $ | 5,279,500 | $ | 67,085 | 5.04 | % | $ | 4,511,387 | $ | 59,973 | 5.39 | % | ||||||||||||||
Debt and equity investments* | 1,346,968 | 9,708 | 2.90 | 1,322,017 | 9,699 | 2.92 | 896,936 | 6,292 | 2.84 | |||||||||||||||||||||||
Short-term investments | 92,248 | 300 | 1.31 | 102,989 | 406 | 1.56 | 102,166 | 447 | 1.77 | |||||||||||||||||||||||
Total earning assets | 6,791,459 | 76,025 | 4.50 | 6,704,506 | 77,190 | 4.57 | 5,510,489 | 66,712 | 4.91 | |||||||||||||||||||||||
Noninterest-earning assets | 572,146 | 617,990 | 445,597 | |||||||||||||||||||||||||||||
Total assets | $ | 7,363,605 | $ | 7,322,496 | $ | 5,956,086 | ||||||||||||||||||||||||||
Liabilities and Shareholders’ Equity | ||||||||||||||||||||||||||||||||
Interest-bearing liabilities: | ||||||||||||||||||||||||||||||||
Interest-bearing transaction accounts | $ | 1,375,154 | $ | 1,338 | 0.39 | % | $ | 1,325,363 | $ | 1,620 | 0.48 | % | $ | 1,077,289 | $ | 1,790 | 0.67 | % | ||||||||||||||
Money market accounts | 1,811,090 | 4,740 | 1.05 | 1,693,357 | 5,797 | 1.36 | 1,521,878 | 6,515 | 1.74 | |||||||||||||||||||||||
Savings | 542,993 | 143 | 0.11 | 543,571 | 195 | 0.14 | 299,731 | 183 | 0.25 | |||||||||||||||||||||||
Certificates of deposit | 793,213 | 3,667 | 1.86 | 846,253 | 4,096 | 1.92 | 712,269 | 3,332 | 1.90 | |||||||||||||||||||||||
Total interest-bearing deposits | 4,522,450 | 9,888 | 0.88 | 4,408,544 | 11,708 | 1.05 | 3,611,167 | 11,820 | 1.33 | |||||||||||||||||||||||
Subordinated debentures | 141,295 | 1,919 | 5.46 | 141,217 | 1,945 | 5.46 | 124,154 | 1,648 | 5.38 | |||||||||||||||||||||||
FHLB advances | 220,453 | 895 | 1.63 | 291,057 | 1,371 | 1.87 | 215,420 | 1,398 | 2.63 | |||||||||||||||||||||||
Securities sold under agreements to repurchase | 201,887 | 343 | 0.68 | 170,481 | 308 | 0.72 | 187,297 | 274 | 0.59 | |||||||||||||||||||||||
Other borrowings | 34,270 | 275 | 3.23 | 36,220 | 293 | 3.21 | 14,900 | 134 | 3.65 | |||||||||||||||||||||||
Total interest-bearing liabilities | 5,120,355 | 13,320 | 1.05 | 5,047,519 | 15,625 | 1.23 | 4,152,938 | 15,274 | 1.49 | |||||||||||||||||||||||
Noninterest-bearing liabilities: | ||||||||||||||||||||||||||||||||
Demand deposits | 1,315,267 | 1,347,748 | 1,088,323 | |||||||||||||||||||||||||||||
Other liabilities | 62,948 | 67,555 | 52,371 | |||||||||||||||||||||||||||||
Total liabilities | 6,498,570 | 6,462,822 | 5,293,632 | |||||||||||||||||||||||||||||
Shareholders' equity | 865,035 | 859,674 | 662,454 | |||||||||||||||||||||||||||||
Total liabilities and shareholders' equity | $ | 7,363,605 | $ | 7,322,496 | $ | 5,956,086 | ||||||||||||||||||||||||||
Core net interest income3 | 62,705 | 61,565 | 51,438 | |||||||||||||||||||||||||||||
Core net interest margin3 | 3.71 | % | 3.64 | % | 3.79 | % | ||||||||||||||||||||||||||
Incremental accretion on non-core acquired loans | 1,273 | 576 | 1,157 | |||||||||||||||||||||||||||||
Total net interest income | $ | 63,978 | $ | 62,141 | $ | 52,595 | ||||||||||||||||||||||||||
Net interest margin | 3.79 | % | 3.68 | % | 3.87 | % | ||||||||||||||||||||||||||
* Non-taxable income is presented on a tax-equivalent basis using a 24.7% tax rate. The tax-equivalent adjustments were $0.6 million for the three months ended March 31, 2020, $0.5 million for the three months ended December 31, 2019, and $0.3 million for the three months ended March 31, 2019. | ||||||||||||||||||||||||||||||||
3 Core net interest income and core net interest margin are non-GAAP measures. Refer to discussion and reconciliation of these measures in the accompanying financial tables.
4
NIM increased 11 basis points from the linked quarter to 3.79% during the current quarter primarily due to an 18 basis point decrease in the cost of funds partially offset by lower loan yields. Significant reductions in interest rates, including one-month LIBOR, continue to impact the Company’s variable-rate loans. The Company responded to interest rate trends by reducing the cost of certain managed money market and interest-bearing transaction accounts. This effort improved the cost of money market accounts by 31 basis points compared to the linked quarter. Additionally, the Company entered into interest rate swap transactions to hedge its exposure to variability on a portion of the Company’s floating-rate debt.
The Company manages its balance sheet to defend against pressures on core net interest margin, which could be negatively impacted by continued competition for deposits, current interest rate conditions, and downward movement in short-term rates.
Loans
The following table presents total loans for the most recent five quarters:
Quarter ended | |||||||||||||||||||
($ in thousands) | March 31, 2020 | December 31, 2019 | September 30, 2019 | June 30, 2019 | March 31, 2019 | ||||||||||||||
C&I - general | $ | 1,186,240 | $ | 1,186,667 | $ | 1,174,569 | $ | 1,103,908 | $ | 1,128,755 | |||||||||
CRE investor owned - general | 1,319,316 | 1,290,258 | 1,281,332 | 1,235,596 | 1,183,471 | ||||||||||||||
CRE owner occupied - general | 584,491 | 582,579 | 566,219 | 591,401 | 576,026 | ||||||||||||||
Enterprise value lendinga | 440,764 | 428,896 | 417,521 | 445,981 | 439,500 | ||||||||||||||
Life insurance premium financinga | 496,471 | 472,822 | 468,051 | 465,777 | 440,693 | ||||||||||||||
Residential real estate - general | 346,461 | 366,261 | 386,174 | 409,200 | 432,556 | ||||||||||||||
Construction and land development - general | 445,909 | 428,681 | 403,590 | 376,597 | 345,207 | ||||||||||||||
Tax creditsa | 354,046 | 294,210 | 265,626 | 268,405 | 235,454 | ||||||||||||||
Agriculture | 168,237 | 139,873 | 136,249 | 131,671 | 126,088 | ||||||||||||||
Consumer and other - general | 115,582 | 124,090 | 128,683 | 120,961 | 109,327 | ||||||||||||||
Total Loans | $ | 5,457,517 | $ | 5,314,337 | $ | 5,228,014 | $ | 5,149,497 | $ | 5,017,077 | |||||||||
Total loan yield | 5.06 | % | 5.08 | % | 5.47 | % | 5.49 | % | 5.50 | % | |||||||||
Total C&I loans to total loans | 45 | % | 44 | % | 44 | % | 44 | % | 44 | % | |||||||||
Variable interest rate loans to total loans | 60 | % | 59 | % | 60 | % | 60 | % | 60 | % | |||||||||
Certain prior period amounts have been reclassified among the categories to conform to the current period presentation | |||||||||||||||||||
a Specialized categories may include a mix of C&I, CRE, Construction and land development, or Consumer and other loans. | |||||||||||||||||||
Loans totaled $5.5 billion at March 31, 2020, increasing $143.2 million, or 10.8% annualized, compared to the linked quarter. Year-over-year, loans increased $440.4 million, or 8.8%.
In the first quarter 2020, the Company implemented several loan programs to assist its customers impacted by the COVID-19 pandemic. These programs include consumer and business deferral programs and expanded small business lines of credit. In April 2020, the Company began offering loans through the SBA’s Paycheck Protection Program that was part of the CARES Act passed by Congress.
5
Asset Quality
On January 1, 2020, the Company adopted the new accounting standard, commonly referred to as CECL, to estimate credit losses. Prior to the adoption of CECL, purchased credit impaired (PCI) loans were accounted for in performing pools of loans and were not individually identified as nonaccrual or classified. Under the CECL accounting model, the Company elected not to maintain PCI pools for certain loans which are now accounted for individually. Thus they are now included in nonperforming and classified loans. PCI loans are referred to as purchased credit deteriorated (PCD) under CECL.
The adoption of CECL impacted certain financial metrics as noted in the following table:
($ in thousands) | Allowance for Loan Losses | Reserve for Unfunded Commitments | Nonperforming Loans | Classified Assets | |||||||||||
Balance, 12/31/2019 | $ | 43,288 | $ | 430 | $ | 26,425 | $ | 85,897 | |||||||
CECL adoption4 | 28,387 | 2,413 | 8,462 | 25,819 | |||||||||||
PCD loans immediately charged-off5 | (1,680 | ) | — | (1,680 | ) | (1,680 | ) | ||||||||
Balance, 1/1/2020 | 69,995 | 2,843 | 33,207 | 110,036 | |||||||||||
Provision for credit losses | 21,695 | 849 | — | — | |||||||||||
Net recoveries | 497 | — | — | — | |||||||||||
Net increase (decrease) | — | — | 3,997 | (5,282 | ) | ||||||||||
Balance, 3/31/2020 | $ | 92,187 | $ | 3,692 | $ | 37,204 | $ | 104,754 | |||||||
4 Loan balances at March 31, 2020
5 Under the Company’s credit policy, nonaccrual loans less than $100,000 are immediately charged-off.
The following table presents the categories of nonperforming assets and related ratios for the most recent five quarters:
Quarter ended | |||||||||||||||||||
($ in thousands) | March 31, 2020 | December 31, 2019 | September 30, 2019 | June 30, 2019 | March 31, 2019 | ||||||||||||||
Nonperforming loans | $ | 37,204 | $ | 26,425 | $ | 15,569 | $ | 19,842 | $ | 9,607 | |||||||||
Other real estate | 5,072 | 6,344 | 8,498 | 10,531 | 6,804 | ||||||||||||||
Nonperforming assets | $ | 42,276 | $ | 32,769 | $ | 24,067 | $ | 30,373 | $ | 16,411 | |||||||||
Nonperforming loans to total loans | 0.68 | % | 0.50 | % | 0.30 | % | 0.39 | % | 0.19 | % | |||||||||
Nonperforming assets to total assets | 0.56 | 0.45 | 0.33 | 0.42 | 0.24 | ||||||||||||||
Allowance for loan losses to total loans | 1.69 | 0.81 | 0.85 | 0.85 | 0.86 | ||||||||||||||
Net charge-offs | $ | 1,183 | $ | 2,544 | $ | 1,070 | $ | 970 | $ | 1,826 | |||||||||
Nonperforming loans increased $10.8 million to $37.2 million at March 31, 2020 from $26.4 million at December 31, 2019 primarily due to the adoption of CECL that added $6.8 million in PCD loans that were previously accounted for in an accruing pool of loans. In the first quarter 2020, the Company had net charge-offs of $1.2 million, primarily due to the administrative charge-off of nonaccrual loans less than $100,000 under the Company’s credit policy. Other real estate decreased during the first quarter 2020 due to write-downs of $0.8 million and sales of $0.5 million.
The Company recorded a provision for credit losses of $22.3 million for the first quarter 2020 compared to $1.3 million for the linked quarter and $1.5 million for the first quarter 2019, respectively. The increase in the provision for credit losses in the first quarter 2020 was primarily due to a change in economic forecasts, which worsened significantly in March due to the COVID-19 pandemic, the resulting slow-down of business activity and rise in unemployment. To the extent that the Company does not recognize charge-offs and economic forecasts improve in future periods, the Company could recognize a reversal of provision for credit losses. Conversely, if economic conditions and the Company’s forecast continue to worsen, the Company could recognize elevated levels of provision for credit losses.
6
Deposits
The following table presents deposits broken out by type for the most recent five quarters:
Quarter ended | |||||||||||||||||||
($ in thousands) | March 31, 2020 | December 31, 2019 | September 30, 2019 | June 30, 2019 | March 31, 2019 | ||||||||||||||
Noninterest-bearing accounts | $ | 1,354,571 | $ | 1,327,348 | $ | 1,295,450 | $ | 1,181,577 | $ | 1,186,508 | |||||||||
Interest-bearing transaction accounts | 1,389,603 | 1,367,444 | 1,307,855 | 1,392,586 | 1,389,826 | ||||||||||||||
Money market and savings accounts | 2,479,828 | 2,249,784 | 2,201,052 | 2,162,605 | 2,156,031 | ||||||||||||||
Brokered certificates of deposit | 170,667 | 215,758 | 209,754 | 213,138 | 180,788 | ||||||||||||||
Other certificates of deposit | 595,237 | 610,689 | 610,269 | 609,432 | 623,960 | ||||||||||||||
Total deposit portfolio | $ | 5,989,906 | $ | 5,771,023 | $ | 5,624,380 | $ | 5,559,338 | $ | 5,537,113 | |||||||||
Noninterest-bearing deposits to total deposits | 22.6 | % | 23.0 | % | 23.0 | % | 21.3 | % | 21.4 | % | |||||||||
Total deposits at March 31, 2020 were $6.0 billion, an increase of $218.9 million from December 31, 2019, and an increase of $452.8 million from March 31, 2019.
Core deposits, defined as total deposits excluding certificates of deposits, were $5.2 billion at March 31, 2020, an increase of $279.4 million from the linked quarter. Noninterest-bearing deposits were $1.4 billion at March 31, 2020, an increase of $27.2 million compared to December 31, 2019, and an increase of $168.1 million compared to March 31, 2019. The total cost of deposits was 0.68% for the current quarter compared to 0.81% and 1.02% for the linked quarter and prior year quarter, respectively.
Noninterest Income
Total noninterest income for first quarter 2020 was $13.4 million, a decrease of $1.0 million from the linked quarter, and an increase of $4.2 million from the first quarter 2019. The decrease from the linked quarter is from lower tax credit income that typically peaks in the fourth quarter of the year. Income from the Company’s customer swap program continued to expand, totaling $1.1 million in the first quarter 2020, compared to $0.8 million in the linked quarter and $0.2 million in the first quarter 2019. The Company also recognized $0.7 million from a bank-owned life insurance claim in the first quarter 2020. The increase from the prior year quarter was driven by contributions from a full quarter of Trinity’s operations in 2020.
Noninterest Expenses
Noninterest expenses were $38.7 million for the first quarter 2020, compared to $38.4 million for the linked quarter, and $39.8 million for the first quarter 2019. The increase from the linked quarter is primarily due to merit increases and the reset of annual payroll tax limits, offset by a decrease in variable compensation. In the first quarter 2020, variable compensation accruals were decreased commensurate with the decrease in profitability. The decrease in noninterest expense from the first quarter 2019 was primarily due to a decline in merger-related expenses following the acquisition of Trinity, offset by a full quarter of Trinity’s operating expense in 2020.
The Company’s core efficiency ratio6 was 51.2% for the quarter ended March 31, 2020, compared to 50.7% for the linked quarter and 54.1% for the prior year period.
6 Core efficiency ratio is a non-GAAP measure. Refer to discussion and reconciliation of this measure in the accompanying financial tables.
Income Taxes
The Company’s effective tax rate was 19% for the quarter ended March 31, 2020 compared to 20% for the linked quarter and prior year quarter, respectively.
7
Capital
The following table presents various EFSC capital ratios:
Quarter ended | ||||||||||||||
Percent | March 31, 2020 | December 31, 2019 | September 30, 2019 | June 30, 2019 | March 31, 2019 | |||||||||
Total risk-based capital to risk-weighted assets | 12.85 | % | 12.90 | % | 12.72 | % | 12.62 | % | 12.86 | % | ||||
Tier 1 capital to risk weighted assets | 11.03 | 11.40 | 11.17 | 11.06 | 11.25 | |||||||||
Common equity tier 1 capital to risk-weighted assets | 9.58 | 9.90 | 9.64 | 9.51 | 9.64 | |||||||||
Tangible common equity to tangible assets7 | 8.42 | 8.89 | 8.54 | 8.43 | 8.35 | |||||||||
7 Tangible common equity to tangible assets is a non-GAAP measure. Refer to discussion and reconciliation of this measure in the accompanying financial tables. | ||||||||||||||
Capital ratios for the current quarter are subject to, among other things, completion and filing of the Company’s regulatory reports and ongoing regulatory review.
Use of Non-GAAP Financial Measures
The Company’s accounting and reporting policies conform to generally accepted accounting principles in the United States (“GAAP”) and the prevailing practices in the banking industry. However, the Company provides other financial measures, such as core net interest income, core net interest margin, tangible common equity, core efficiency ratios, ROATCE, PTPP, and the tangible common equity ratio, in this release that are considered “non-GAAP financial measures.” Generally, a non-GAAP financial measure is a numerical measure of a company’s financial performance, financial position, or cash flows that exclude (or include) amounts that are included in (or excluded from) the most directly comparable measure calculated and presented in accordance with GAAP.
The Company considers its core net interest income, core net interest margin, core efficiency ratio, ROATCE, PTPP, and the tangible common equity ratio, collectively “core performance measures,” presented in this earnings release and the included tables as important measures of financial performance, even though they are non-GAAP measures, as they provide supplemental information by which to evaluate the impact of non-core acquired loans, which were acquired from the FDIC and previously covered by shared-loss agreements, and the related income and expenses, the impact of certain non-comparable items, and the Company’s operating performance on an ongoing basis. Core performance measures include contractual interest on non-core acquired loans, but exclude incremental accretion on these loans. Core performance measures also exclude expenses directly related to non-core acquired loans. Core performance measures also exclude certain other income and expense items, such as merger related expenses, facilities charges, and the gain or loss on sale of investment securities, the Company believes to be not indicative of or useful to measure the Company’s operating performance on an ongoing basis. The attached tables contain a reconciliation of these core performance measures to the GAAP measures. The Company believes that the tangible common equity ratio provides useful information to investors about the Company’s capital strength even though it is considered to be a non-GAAP financial measure and is not part of the regulatory capital requirements to which the Company is subject.
The Company believes these non-GAAP measures and ratios, when taken together with the corresponding GAAP measures and ratios, provide meaningful supplemental information regarding the Company’s performance and capital strength. The Company’s management uses, and believes that investors benefit from referring to, these non-GAAP measures and ratios in assessing the Company’s operating results and related trends and when forecasting future periods. However, these non-GAAP measures and ratios should be considered in addition to, and not as a substitute for or preferable to, ratios prepared in accordance with GAAP. In the attached tables, the Company has provided a reconciliation of, where applicable, the most comparable GAAP financial measures and ratios to the non-GAAP financial measures and ratios, or a reconciliation of the non-GAAP calculation of the financial measures for the periods indicated.
8
Conference Call and Webcast Information
The Company will host a conference call and webcast at 10:00 a.m. Central Time on Tuesday, April 21, 2020. During the call, management will review the first quarter of 2020 results and related matters. This press release as well as a related slide presentation will be accessible on the Company’s website at www.enterprisebank.com under “Investor Relations” prior to the scheduled broadcast of the conference call. The call can be accessed via this same website page, or via telephone at 1-800-458-4148 (Conference ID #2361796). A recorded replay of the conference call will be available on the website two hours after the call’s completion. Visit http://bit.ly/EFSC1Q2020earnings and register to receive a dial in number, passcode, and pin number. The replay will be available for approximately two weeks following the conference call.
About Enterprise
Enterprise Financial Services Corp (Nasdaq: EFSC), with approximately $7 billion in assets, is a financial holding company headquartered in Clayton, Missouri. Enterprise Bank & Trust, a Missouri state-chartered trust company with banking powers and a wholly-owned subsidiary of EFSC, operates 34 branch offices in Arizona, Kansas, Missouri and New Mexico. Enterprise Bank & Trust offers a range of business and personal banking services and wealth management services. Enterprise Trust, a division of Enterprise Bank & Trust, provides financial planning, estate planning, investment management and trust services to businesses, individuals, institutions, retirement plans and non-profit organizations. Additional information is available at www.enterprisebank.com.
Enterprise Financial Services Corp’s common stock is traded on the Nasdaq Stock Market under the symbol “EFSC.” Please visit our website at www.enterprisebank.com to see our regularly posted material information.
Forward-looking Statements
Readers should note that, in addition to the historical information contained herein, this press release contains “forward-looking statements” within the meaning of, and intended to be covered by, the safe harbor provisions of the Private Securities Litigation Reform Act of 1995. Such forward-looking statements based on management’s current expectations and beliefs concerning future developments and their potential effects on the Company including, without limitation, plans, strategies and goals, and statements about the Company’s expectations regarding revenue and asset growth, financial performance and profitability, loan and deposit growth, yields and returns, loan diversification and credit management, shareholder value creation and the impact of acquisitions.
Forward-looking statements include, but are not limited to, statements about the Company’s plans, expectations, and projections of future financial and operating results, as well as statements regarding the Company’s plans, objectives, expectations or consequences of announced transactions. The Company uses words such as “may,” “might,” “will,” “should,” “expect,” “plan,” “anticipate,” “believe,” “estimate,” “predict,” “potential,” “could,” “continue,” and “intend”, and variations of such words and similar expressions, in this release to identify such forward-looking statements. Forward-looking statements are inherently subject to risks and uncertainties that could cause actual results to differ materially from those contemplated from such statements. The COVID-19 pandemic is adversely affecting us, our customers, counterparties, employees, and third-party service providers, and the ultimate extent of the impacts on our business, financial position, results of operations, liquidity, and prospects is uncertain. Continued deterioration in general business and economic conditions, including further increases in unemployment rates, or turbulence in domestic or global financial markets could adversely affect our revenues and the values of our assets and liabilities, reduce the availability of funding, lead to a tightening of credit, and further increase stock price volatility. In addition, changes to statutes, regulations, or regulatory policies or practices as a result of, or in response to COVID-19, could affect us in substantial and unpredictable ways. Other factors that could cause or contribute to such differences include, but are not limited to, the Company’s ability to efficiently integrate acquisitions into its operations, retain the customers of these businesses and grow the acquired operations, as well as credit risk, changes in the appraised valuation of real estate securing impaired loans, outcomes of litigation and other contingencies, exposure to general and local economic conditions, risks associated with rapid increases or decreases in prevailing interest rates, consolidation in the banking industry, competition from banks and other financial institutions, the Company’s ability to attract and retain relationship officers and other key personnel, burdens imposed by federal and state regulation, changes in regulatory requirements, changes in accounting policies and practices or accounting standards, including ASU 2016-13 (Topic 326), “Measurement of Credit Losses on Financial Instruments,” commonly referenced as the Current Expected Credit
9
Loss (“CECL”) model, which changed how we estimate credit losses and may increase the required level of our allowance for credit losses after adoption on January 1, 2020, uncertainty regarding the future of LIBOR, natural disasters, war or terrorist activities, or pandemics, or the outbreak of COVID-19 or similar outbreaks, and their effects on economic and business environments in which we operate, as well as other risk factors described in the Company’s 2019 Annual Report on Form 10-K and other reports filed with the Securities and Exchange Commission (the “SEC”). Forward-looking statements speak only as of the date they are made, and the Company undertakes no obligation to update them in light of new information or future events unless required under the federal securities laws.
For more information contact
Investor Relations: Keene Turner, Executive Vice President and CFO (314) 512-7233
Media: Karen Loiterstein, Senior Vice President (314) 512-7141
10
ENTERPRISE FINANCIAL SERVICES CORP
CONSOLIDATED FINANCIAL SUMMARY (unaudited)
Quarter ended | |||||||||||||||||||
(in thousands, except per share data) | Mar 31, 2020 | Dec 31, 2019 | Sep 30, 2019 | Jun 30, 2019 | Mar 31, 2019 | ||||||||||||||
EARNINGS SUMMARY | |||||||||||||||||||
Net interest income | $ | 63,368 | $ | 61,613 | $ | 63,046 | $ | 61,715 | $ | 52,343 | |||||||||
Provision for credit losses | 22,264 | 1,341 | 1,833 | 1,722 | 1,476 | ||||||||||||||
Noninterest income | 13,408 | 14,418 | 13,564 | 11,964 | 9,230 | ||||||||||||||
Noninterest expense | 38,673 | 38,354 | 38,239 | 49,054 | 39,838 | ||||||||||||||
Income before income tax expense | 15,839 | 36,336 | 36,538 | 22,903 | 20,259 | ||||||||||||||
Income tax expense | 2,971 | 7,246 | 7,469 | 4,479 | 4,103 | ||||||||||||||
Net income | $ | 12,868 | $ | 29,090 | $ | 29,069 | $ | 18,424 | $ | 16,156 | |||||||||
Diluted earnings per share | $ | 0.48 | $ | 1.09 | $ | 1.08 | $ | 0.68 | $ | 0.67 | |||||||||
Return on average assets | 0.70 | % | 1.58 | % | 1.60 | % | 1.05 | % | 1.10 | % | |||||||||
Return on average common equity | 5.98 | 13.43 | 13.66 | 9.09 | 9.89 | ||||||||||||||
Return on average tangible common equity | 8.22 | 18.54 | 19.08 | 12.92 | 12.93 | ||||||||||||||
Net interest margin (tax equivalent) | 3.79 | 3.68 | 3.81 | 3.86 | 3.87 | ||||||||||||||
Core net interest margin (tax equivalent)1 | 3.71 | 3.64 | 3.69 | 3.80 | 3.79 | ||||||||||||||
Efficiency ratio | 50.37 | 50.45 | 49.91 | 66.58 | 64.70 | ||||||||||||||
Core efficiency ratio1 | 51.21 | 50.73 | 51.73 | 53.30 | 54.06 | ||||||||||||||
Total assets | $ | 7,500,643 | $ | 7,333,791 | $ | 7,346,791 | $ | 7,181,855 | $ | 6,932,757 | |||||||||
Total average assets | 7,363,605 | 7,322,496 | 7,222,357 | 7,057,605 | 5,956,086 | ||||||||||||||
Total deposits | 5,989,906 | 5,771,023 | 5,624,380 | 5,559,338 | 5,537,113 | ||||||||||||||
Total average deposits | 5,837,717 | 5,756,292 | 5,597,343 | 5,582,072 | 4,699,490 | ||||||||||||||
Period end common shares outstanding | 26,161 | 26,543 | 26,613 | 26,906 | 26,878 | ||||||||||||||
Dividends per common share | $ | 0.18 | $ | 0.17 | $ | 0.16 | $ | 0.15 | $ | 0.14 | |||||||||
Tangible book value per common share | $ | 23.38 | $ | 23.76 | $ | 22.82 | $ | 21.74 | $ | 20.80 | |||||||||
Tangible common equity to tangible assets1 | 8.42 | % | 8.89 | % | 8.54 | % | 8.43 | % | 8.35 | % | |||||||||
Total risk-based capital to risk-weighted assets | 12.85 | 12.90 | 12.72 | 12.62 | 12.86 | ||||||||||||||
1Refer to Reconciliations of Non-GAAP Financial Measures table for a reconciliation of these measures to GAAP. | |||||||||||||||||||
11
ENTERPRISE FINANCIAL SERVICES CORP
CONSOLIDATED FINANCIAL SUMMARY (unaudited) (continued)
Quarter ended | |||||||||||||||||||
($ in thousands, except per share data) | Mar 31, 2020 | Dec 31, 2019 | Sep 30, 2019 | Jun 30, 2019 | Mar 31, 2019 | ||||||||||||||
INCOME STATEMENTS | |||||||||||||||||||
NET INTEREST INCOME | |||||||||||||||||||
Total interest income | $ | 76,688 | $ | 77,238 | $ | 81,078 | $ | 79,201 | $ | 67,617 | |||||||||
Total interest expense | 13,320 | 15,625 | 18,032 | 17,486 | 15,274 | ||||||||||||||
Net interest income | 63,368 | 61,613 | 63,046 | 61,715 | 52,343 | ||||||||||||||
Provision for credit losses | 22,264 | 1,341 | 1,833 | 1,722 | 1,476 | ||||||||||||||
Net interest income after provision for credit losses | 41,104 | 60,272 | 61,213 | 59,993 | 50,867 | ||||||||||||||
NONINTEREST INCOME | |||||||||||||||||||
Deposit service charges | 3,143 | 3,254 | 3,246 | 3,366 | 2,935 | ||||||||||||||
Wealth management revenue | 2,501 | 2,618 | 2,661 | 2,661 | 1,992 | ||||||||||||||
Card services revenue | 2,247 | 2,409 | 2,494 | 2,461 | 1,790 | ||||||||||||||
Tax credit income | 2,036 | 3,425 | 1,238 | 572 | 158 | ||||||||||||||
Gain (loss) on sale of investment securities | 4 | (94 | ) | 337 | — | — | |||||||||||||
Other income | 3,477 | 2,806 | 3,588 | 2,904 | 2,355 | ||||||||||||||
Total noninterest income | 13,408 | 14,418 | 13,564 | 11,964 | 9,230 | ||||||||||||||
NONINTEREST EXPENSE | |||||||||||||||||||
Employee compensation and benefits | 21,685 | 20,411 | 20,845 | 20,687 | 19,352 | ||||||||||||||
Occupancy | 3,347 | 3,461 | 3,179 | 3,188 | 2,637 | ||||||||||||||
Merger-related expenses | — | — | 393 | 10,306 | 7,270 | ||||||||||||||
Other | 13,641 | 14,482 | 13,822 | 14,873 | 10,579 | ||||||||||||||
Total noninterest expense | 38,673 | 38,354 | 38,239 | 49,054 | 39,838 | ||||||||||||||
Income before income tax expense | 15,839 | 36,336 | 36,538 | 22,903 | 20,259 | ||||||||||||||
Income tax expense | 2,971 | 7,246 | 7,469 | 4,479 | 4,103 | ||||||||||||||
Net income | $ | 12,868 | $ | 29,090 | $ | 29,069 | $ | 18,424 | $ | 16,156 | |||||||||
Basic earnings per share | $ | 0.49 | $ | 1.10 | $ | 1.09 | $ | 0.69 | $ | 0.68 | |||||||||
Diluted earnings per share | 0.48 | 1.09 | 1.08 | 0.68 | 0.67 | ||||||||||||||
12
ENTERPRISE FINANCIAL SERVICES CORP
CONSOLIDATED FINANCIAL SUMMARY (unaudited) (continued)
Quarter ended | |||||||||||||||||||
($ in thousands) | Mar 31, 2020 | Dec 31, 2019 | Sep 30, 2019 | Jun 30, 2019 | Mar 31, 2019 | ||||||||||||||
BALANCE SHEETS | |||||||||||||||||||
ASSETS | |||||||||||||||||||
Cash and due from banks | $ | 98,619 | $ | 74,769 | $ | 153,730 | $ | 106,835 | $ | 85,578 | |||||||||
Interest-earning deposits | 88,794 | 96,217 | 106,747 | 85,315 | 139,389 | ||||||||||||||
Debt and equity investments | 1,382,149 | 1,354,527 | 1,354,986 | 1,328,767 | 1,198,413 | ||||||||||||||
Loans held for sale | 8,430 | 5,570 | 6,281 | 1,437 | 654 | ||||||||||||||
Loans | 5,457,517 | 5,314,337 | 5,228,014 | 5,149,497 | 5,017,077 | ||||||||||||||
Less: Allowance for loan losses | 92,187 | 43,288 | 44,555 | 43,822 | 43,095 | ||||||||||||||
Total loans, net | 5,365,330 | 5,271,049 | 5,183,459 | 5,105,675 | 4,973,982 | ||||||||||||||
Fixed assets, net | 59,358 | 60,013 | 59,216 | 58,888 | 60,301 | ||||||||||||||
Goodwill | 210,344 | 210,344 | 211,251 | 211,251 | 207,632 | ||||||||||||||
Intangible assets, net | 24,585 | 26,076 | 27,626 | 29,201 | 31,048 | ||||||||||||||
Other assets | 263,034 | 235,226 | 243,495 | 254,486 | 235,760 | ||||||||||||||
Total assets | $ | 7,500,643 | $ | 7,333,791 | $ | 7,346,791 | $ | 7,181,855 | $ | 6,932,757 | |||||||||
LIABILITIES AND SHAREHOLDERS’ EQUITY | |||||||||||||||||||
Noninterest-bearing deposits | $ | 1,354,571 | $ | 1,327,348 | $ | 1,295,450 | $ | 1,181,577 | $ | 1,186,508 | |||||||||
Interest-bearing deposits | 4,635,335 | 4,443,675 | 4,328,930 | 4,377,761 | 4,350,605 | ||||||||||||||
Total deposits | 5,989,906 | 5,771,023 | 5,624,380 | 5,559,338 | 5,537,113 | ||||||||||||||
Subordinated debentures | 141,336 | 141,258 | 141,179 | 141,100 | 140,668 | ||||||||||||||
FHLB advances | 222,000 | 222,406 | 461,426 | 389,446 | 180,466 | ||||||||||||||
Other borrowings | 205,918 | 265,172 | 199,634 | 198,104 | 212,171 | ||||||||||||||
Other liabilities | 95,047 | 66,747 | 74,077 | 68,366 | 64,504 | ||||||||||||||
Total liabilities | 6,654,207 | 6,466,606 | 6,500,696 | 6,356,354 | 6,134,922 | ||||||||||||||
Shareholders’ equity | 846,436 | 867,185 | 846,095 | 825,501 | 797,835 | ||||||||||||||
Total liabilities and shareholders’ equity | $ | 7,500,643 | $ | 7,333,791 | $ | 7,346,791 | $ | 7,181,855 | $ | 6,932,757 | |||||||||
13
ENTERPRISE FINANCIAL SERVICES CORP
CONSOLIDATED FINANCIAL SUMMARY (unaudited) (continued)
Quarter ended | |||||||||||||||||||
($ in thousands) | Mar 31, 2020 | Dec 31, 2019 | Sep 30, 2019 | Jun 30, 2019 | Mar 31, 2019 | ||||||||||||||
LOAN PORTFOLIO | |||||||||||||||||||
Commercial and industrial | $ | 2,469,013 | $ | 2,361,157 | $ | 2,303,495 | $ | 2,265,480 | $ | 2,227,050 | |||||||||
Commercial real estate | 2,048,357 | 1,997,321 | 1,967,888 | 1,940,958 | 1,870,040 | ||||||||||||||
Construction real estate | 469,627 | 457,273 | 433,486 | 404,557 | 369,365 | ||||||||||||||
Residential real estate | 346,758 | 366,261 | 386,173 | 409,200 | 432,902 | ||||||||||||||
Consumer and other | 123,762 | 132,325 | 136,972 | 129,302 | 117,720 | ||||||||||||||
Total loans | $ | 5,457,517 | $ | 5,314,337 | $ | 5,228,014 | $ | 5,149,497 | $ | 5,017,077 | |||||||||
DEPOSIT PORTFOLIO | |||||||||||||||||||
Noninterest-bearing accounts | $ | 1,354,571 | $ | 1,327,348 | $ | 1,295,450 | $ | 1,181,577 | $ | 1,186,508 | |||||||||
Interest-bearing transaction accounts | 1,389,603 | 1,367,444 | 1,307,855 | 1,392,586 | 1,389,826 | ||||||||||||||
Money market and savings accounts | 2,479,828 | 2,249,784 | 2,201,052 | 2,162,605 | 2,156,031 | ||||||||||||||
Brokered certificates of deposit | 170,667 | 215,758 | 209,754 | 213,138 | 180,788 | ||||||||||||||
Other certificates of deposit | 595,237 | 610,689 | 610,269 | 609,432 | 623,960 | ||||||||||||||
Total deposit portfolio | $ | 5,989,906 | $ | 5,771,023 | $ | 5,624,380 | $ | 5,559,338 | $ | 5,537,113 | |||||||||
AVERAGE BALANCES | |||||||||||||||||||
Total loans | $ | 5,352,243 | $ | 5,279,500 | $ | 5,178,009 | $ | 5,095,181 | $ | 4,511,387 | |||||||||
Debt and equity investments | 1,346,968 | 1,322,017 | 1,312,860 | 1,246,529 | 896,936 | ||||||||||||||
Interest-earning assets | 6,791,459 | 6,704,506 | 6,604,083 | 6,453,001 | 5,510,489 | ||||||||||||||
Total assets | 7,363,605 | 7,322,496 | 7,222,357 | 7,057,605 | 5,956,086 | ||||||||||||||
Deposits | 5,837,717 | 5,756,292 | 5,597,343 | 5,582,072 | 4,699,490 | ||||||||||||||
Shareholders’ equity | 865,035 | 859,674 | 843,974 | 813,106 | 662,454 | ||||||||||||||
Tangible common equity1 | 629,390 | 622,502 | 604,331 | 571,890 | 506,560 | ||||||||||||||
YIELDS (tax equivalent) | |||||||||||||||||||
Total loans | 5.06 | % | 5.08 | % | 5.47 | % | 5.49 | % | 5.50 | % | |||||||||
Debt and equity investments | 2.90 | 2.91 | 2.90 | 2.95 | 2.84 | ||||||||||||||
Interest-earning assets | 4.58 | 4.60 | 4.90 | 4.95 | 4.99 | ||||||||||||||
Interest-bearing deposits | 0.88 | 1.05 | 1.20 | 1.21 | 1.33 | ||||||||||||||
Total deposits | 0.68 | 0.81 | 0.94 | 0.94 | 1.02 | ||||||||||||||
Subordinated debentures | 5.46 | 5.46 | 5.50 | 5.57 | 5.38 | ||||||||||||||
FHLB advances and other borrowed funds | 1.33 | 1.57 | 1.99 | 2.07 | 1.75 | ||||||||||||||
Interest-bearing liabilities | 1.05 | 1.23 | 1.41 | 1.42 | 1.49 | ||||||||||||||
Net interest margin | 3.79 | 3.68 | 3.81 | 3.86 | 3.87 | ||||||||||||||
1Refer to Reconciliations of Non-GAAP Financial Measures table for a reconciliation of these measures to GAAP.
14
ENTERPRISE FINANCIAL SERVICES CORP
CONSOLIDATED FINANCIAL SUMMARY (unaudited) (continued)
Quarter ended | |||||||||||||||||||
(in thousands, except per share data) | Mar 31, 2020 | Dec 31, 2019 | Sep 30, 2019 | Jun 30, 2019 | Mar 31, 2019 | ||||||||||||||
ASSET QUALITY | |||||||||||||||||||
Net charge-offs | $ | 1,183 | $ | 2,544 | $ | 1,070 | $ | 970 | $ | 1,826 | |||||||||
Nonperforming loans | 37,204 | 26,425 | 15,569 | 19,842 | 9,607 | ||||||||||||||
Classified assets | 104,754 | 85,897 | 93,984 | 91,715 | 79,750 | ||||||||||||||
Nonperforming loans to total loans | 0.68 | % | 0.50 | % | 0.30 | % | 0.39 | % | 0.19 | % | |||||||||
Nonperforming assets to total assets | 0.56 | 0.45 | 0.33 | 0.42 | 0.24 | ||||||||||||||
Allowance for loan losses to total loans | 1.69 | 0.81 | 0.85 | 0.85 | 0.86 | ||||||||||||||
Allowance for loan losses to nonperforming loans | 247.8 | 163.8 | 286.2 | 220.9 | 448.6 | ||||||||||||||
Net charge-offs to average loans (annualized) | 0.09 | 0.19 | 0.08 | 0.08 | 0.16 | ||||||||||||||
WEALTH MANAGEMENT | |||||||||||||||||||
Trust assets under management | $ | 1,445,521 | $ | 1,671,082 | $ | 1,583,260 | $ | 1,627,050 | $ | 1,587,627 | |||||||||
Trust assets under administration | 2,139,673 | 2,524,478 | 2,404,950 | 2,428,551 | 2,405,673 | ||||||||||||||
MARKET DATA | |||||||||||||||||||
Book value per common share | $ | 32.36 | $ | 32.67 | $ | 31.79 | $ | 30.68 | $ | 29.68 | |||||||||
Tangible book value per common share1 | 23.38 | 23.76 | 22.82 | 21.74 | 20.80 | ||||||||||||||
Market value per share | 27.91 | 48.21 | 40.75 | 41.60 | 40.77 | ||||||||||||||
Period end common shares outstanding | 26,161 | 26,543 | 26,613 | 26,906 | 26,878 | ||||||||||||||
Average basic common shares | 26,473 | 26,540 | 26,778 | 26,887 | 23,927 | ||||||||||||||
Average diluted common shares | 26,539 | 26,668 | 26,868 | 26,940 | 24,083 | ||||||||||||||
CAPITAL | |||||||||||||||||||
Total risk-based capital to risk-weighted assets | 12.85 | % | 12.90 | % | 12.72 | % | 12.62 | % | 12.86 | % | |||||||||
Tier 1 capital to risk-weighted assets | 11.03 | 11.40 | 11.17 | 11.06 | 11.25 | ||||||||||||||
Common equity tier 1 capital to risk-weighted assets | 9.58 | 9.90 | 9.64 | 9.51 | 9.64 | ||||||||||||||
Tangible common equity to tangible assets1 | 8.42 | 8.89 | 8.54 | 8.43 | 8.35 | ||||||||||||||
1Refer to Reconciliations of Non-GAAP Financial Measures table for a reconciliation of these measures to GAAP. | |||||||||||||||||||
15
ENTERPRISE FINANCIAL SERVICES CORP
RECONCILIATION OF NON-GAAP FINANCIAL MEASURES
Quarter ended | |||||||||||||||||||
($ in thousands) | Mar 31, 2020 | Dec 31, 2019 | Sep 30, 2019 | Jun 30, 2019 | Mar 31, 2019 | ||||||||||||||
CORE PERFORMANCE MEASURES | |||||||||||||||||||
Net interest income | $ | 63,368 | $ | 61,613 | $ | 63,046 | $ | 61,715 | $ | 52,343 | |||||||||
Less: Incremental accretion income | 1,273 | 576 | 2,140 | 910 | 1,157 | ||||||||||||||
Core net interest income | 62,095 | 61,037 | 60,906 | 60,805 | 51,186 | ||||||||||||||
Total noninterest income | 13,408 | 14,418 | 13,564 | 11,964 | 9,230 | ||||||||||||||
Less: Other income from non-core acquired assets | — | 4 | 1,001 | 2 | 365 | ||||||||||||||
Less: Gain on sale of investment securities | 4 | (94 | ) | 337 | — | — | |||||||||||||
Less: Other non-core income | — | — | — | 266 | — | ||||||||||||||
Core noninterest income | 13,404 | 14,508 | 12,226 | 11,696 | 8,865 | ||||||||||||||
Total core revenue | 75,499 | 75,545 | 73,132 | 72,501 | 60,051 | ||||||||||||||
Total noninterest expense | 38,673 | 38,354 | 38,239 | 49,054 | 39,838 | ||||||||||||||
Less: Other expenses related to non-core acquired loans | 12 | 33 | 18 | 103 | 103 | ||||||||||||||
Less: Merger-related expenses | — | — | 393 | 10,306 | 7,270 | ||||||||||||||
Core noninterest expense | 38,661 | 38,321 | 37,828 | 38,645 | 32,465 | ||||||||||||||
Core efficiency ratio | 51.21 | % | 50.73 | % | 51.73 | % | 53.30 | % | 54.06 | % | |||||||||
NET INTEREST MARGIN TO CORE NET INTEREST MARGIN (TAX EQUIVALENT) | |||||||||||||||||||
Net interest income | $ | 63,978 | $ | 62,141 | $ | 63,483 | $ | 62,109 | $ | 52,595 | |||||||||
Less: Incremental accretion income | 1,273 | 576 | 2,140 | 910 | 1,157 | ||||||||||||||
Core net interest income | $ | 62,705 | $ | 61,565 | $ | 61,343 | $ | 61,199 | $ | 51,438 | |||||||||
Average earning assets | $ | 6,791,459 | $ | 6,704,506 | $ | 6,604,083 | $ | 6,453,005 | $ | 5,510,489 | |||||||||
Reported net interest margin | 3.79 | % | 3.68 | % | 3.81 | % | 3.86 | % | 3.87 | % | |||||||||
Core net interest margin | 3.71 | 3.64 | 3.69 | 3.80 | 3.79 | ||||||||||||||
Quarter ended | |||||||||||||||||||
($ in thousands) | Mar 31, 2020 | Dec 31, 2019 | Sep 30, 2019 | Jun 30, 2019 | Mar 31, 2019 | ||||||||||||||
SHAREHOLDERS’ EQUITY TO TANGIBLE COMMON EQUITY AND TOTAL ASSETS TO TANGIBLE ASSETS | |||||||||||||||||||
Shareholders’ equity | $ | 846,436 | $ | 867,185 | $ | 846,095 | $ | 825,501 | $ | 797,835 | |||||||||
Less: Goodwill | 210,344 | 210,344 | 211,251 | 211,251 | 207,632 | ||||||||||||||
Less: Intangible assets | 24,585 | 26,076 | 27,626 | 29,201 | 31,048 | ||||||||||||||
Tangible common equity | $ | 611,507 | $ | 630,765 | $ | 607,218 | $ | 585,049 | $ | 559,155 | |||||||||
Total assets | $ | 7,500,643 | $ | 7,333,791 | $ | 7,346,791 | $ | 7,181,855 | $ | 6,932,757 | |||||||||
Less: Goodwill | 210,344 | 210,344 | 211,251 | 211,251 | 207,632 | ||||||||||||||
Less: Intangible assets | 24,585 | 26,076 | 27,626 | 29,201 | 31,048 | ||||||||||||||
Tangible assets | $ | 7,265,714 | $ | 7,097,371 | $ | 7,107,914 | $ | 6,941,403 | $ | 6,694,077 | |||||||||
Tangible common equity to tangible assets | 8.42 | % | 8.89 | % | 8.54 | % | 8.43 | % | 8.35 | % | |||||||||
16
Quarter ended | |||||||||||
($ in thousands) | Mar 31, 2020 | Dec 31, 2019 | Mar 31, 2019 | ||||||||
AVERAGE SHAREHOLDERS’ EQUITY AND AVERAGE TANGIBLE COMMON EQUITY | |||||||||||
Average shareholder’s equity | $ | 865,035 | $ | 859,674 | $ | 662,454 | |||||
Less average goodwill | 210,344 | 210,344 | 141,422 | ||||||||
Less average intangible assets | 25,301 | 26,828 | 14,472 | ||||||||
Average tangible common equity | $ | 629,390 | $ | 622,502 | $ | 506,560 | |||||
Quarter Ended | |||||||||||||||||||
($ in thousands) | March 31, 2020 | December 31, 2019 | September 30, 2019 | June 30, 2019 | March 31, 2019 | ||||||||||||||
CALCULATION OF PRE-TAX, PRE-PROVISION INCOME | |||||||||||||||||||
Net interest income | $ | 63,368 | $ | 61,613 | $ | 63,046 | $ | 61,715 | $ | 52,343 | |||||||||
Noninterest income | 13,408 | 14,418 | 13,564 | 11,964 | 9,230 | ||||||||||||||
Noninterest expense | 38,673 | 38,354 | 38,239 | 49,054 | 39,838 | ||||||||||||||
PTPP income | 38,103 | 37,677 | 38,371 | 24,625 | 21,735 | ||||||||||||||
Provision for credit losses | 22,264 | 1,341 | 1,833 | 1,722 | 1,476 | ||||||||||||||
Income before income tax expense | 15,839 | 36,336 | 36,538 | 22,903 | 20,259 | ||||||||||||||
Income tax expense | 2,971 | 7,246 | 7,469 | 4,479 | 4,103 | ||||||||||||||
Net income | $ | 12,868 | $ | 29,090 | $ | 29,069 | $ | 18,424 | $ | 16,156 | |||||||||
17
Exhibit 99.2 Enterprise Financial Services Corp 2020 First Quarter Earnings Webcast

Forward-Looking Statements Some of the information in this report may contain “forward-looking statements” within the meaning of and intended to be covered by the safe harbor provisions of the Private Securities Litigation Reform Act of 1995. Such forward-looking statements may include projections based on management’s current expectations and beliefs concerning future developments and their potential effects on the Company including, without limitation, plans, strategies and goals, and statements about the Company’s expectations regarding revenue and asset growth, financial performance and profitability, loan and deposit growth, yields and returns, loan diversification and credit management, shareholder value creation and the impact of acquisitions. Forward-looking statements include, but are not limited to, statements about the Company’s plans, expectations, and projections of future financial and operating results, as well as statements regarding the Company’s plans, objectives, expectations or consequences of announced transactions. The Company uses words such as “may,” “might,” “will,” “should,” “expect,” “plan,” “anticipate,” “believe,” “estimate,” “predict,” “potential,” “could,” “continue,” and “intend”, and variations of such words and similar expressions, in this release to identify such forward-looking statements. Forward-looking statements are inherently subject to risks and uncertainties that could cause actual results to differ materially from those contemplated from such statements. The COVID-19 pandemic is adversely affecting us, our customers, counterparties, employees, and third-party service providers, and the ultimate extent of the impacts on our business, financial position, results of operations, liquidity, and prospects is uncertain. Continued deterioration in general business and economic conditions, including further increases in unemployment rates, or turbulence in domestic or global financial markets could adversely affect our revenues and the values of our assets and liabilities, reduce the availability of funding, lead to a tightening of credit, and further increase stock price volatility. In addition, changes to statutes, regulations, or regulatory policies or practices as a result of, or in response to COVID-19, could affect us in substantial and unpredictable ways. Other factors that could cause or contribute to such differences include, but are not limited to, the Company’s ability to efficiently integrate acquisitions, including the Trinity acquisition, into its operations, retain the customers of these businesses and grow the acquired operations, as well as credit risk, changes in the appraised valuation of real estate securing impaired loans, outcomes of litigation and other contingencies, exposure to general and local economic conditions, risks associated with rapid increases or decreases in prevailing interest rates, consolidation in the banking industry, competition from banks and other financial institutions, the Company’s ability to attract and retain relationship officers and other key personnel, burdens imposed by federal and state regulation, changes in regulatory requirements, changes in accounting policies and practices or accounting standards, including ASU 2016-13 (Topic 326), “Measurement of Credit Losses on Financial Instruments,” commonly referenced as the Current Expected Credit Loss (“CECL”) model, which changed how we estimate credit losses and may increase the required level of our allowance for credit losses after adoption on January 1, 2020, uncertainty regarding the future of LIBOR, natural disasters, war or terrorist activities, or pandemics, or the outbreak of COVID-19 or similar outbreaks, and their effects on economic and business environments in which we operate, as well as other risk factors described in the Company’s 2019 Annual Report on Form 10-K and other reports filed with the Securities and Exchange Commission (the “SEC”). Forward-looking statements speak only as of the date they are made, and the Company undertakes no obligation to update them in light of new information or future events unless required under the federal securities laws. 2
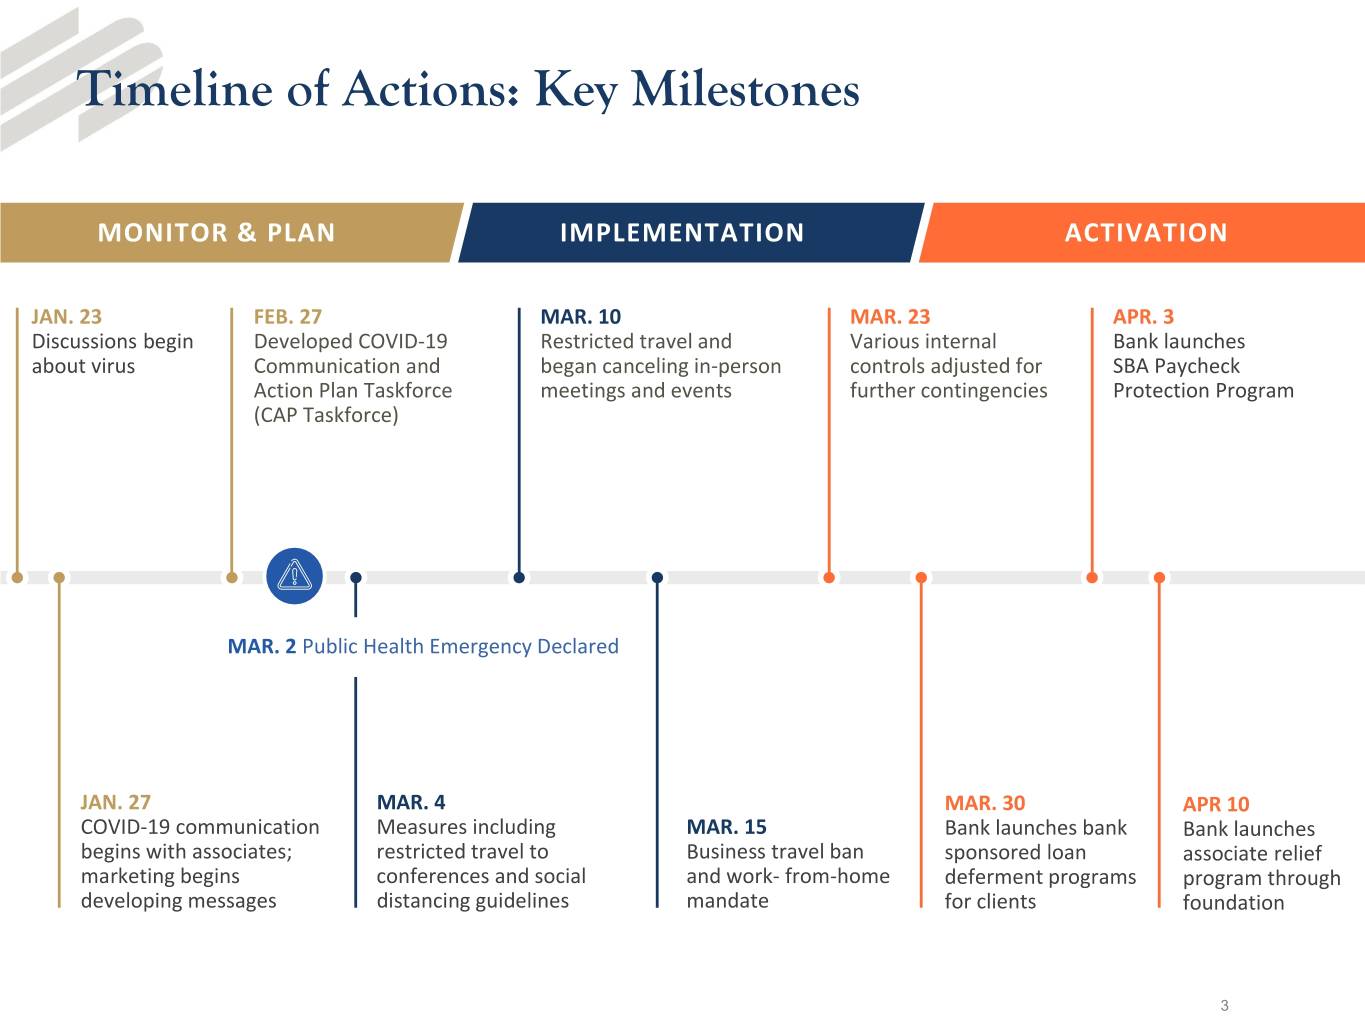
Timeline of Actions: Key Milestones MONITOR & PLANIMPLEMENTATION ACTIVATION JAN. 23 FEB. 27 MAR. 10 MAR. 23 APR. 3 Discussions begin Developed COVID‐19 Restricted travel and Various internal Bank launches about virus Communication and began canceling in‐person controls adjusted for SBA Paycheck Action Plan Taskforce meetings and events further contingencies Protection Program (CAP Taskforce) MAR. 2 Public Health Emergency Declared JAN. 27 MAR. 4 MAR. 30 APR 10 COVID‐19 communication Measures including MAR. 15 Bank launches bank Bank launches begins with associates; restricted travel to Business travel ban sponsored loan associate relief marketing begins conferences and social and work‐ from‐home deferment programs program through developing messages distancing guidelines mandate for clients foundation 3
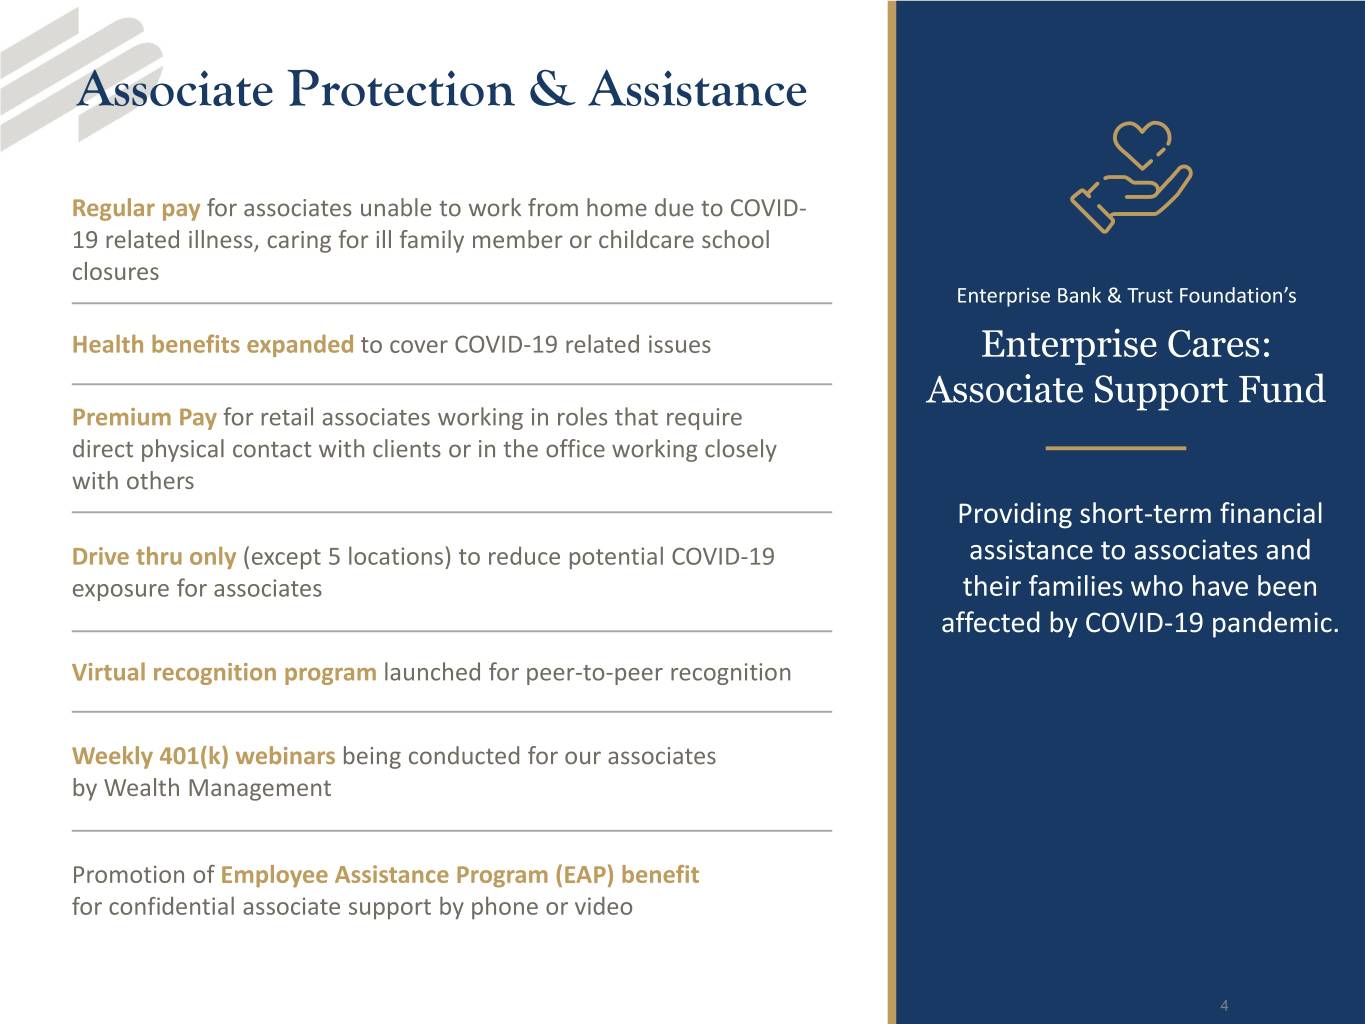
Associate Protection & Assistance Regular pay for associates unable to work from home due to COVID‐ 19 related illness, caring for ill family member or childcare school closures Enterprise Bank & Trust Foundation’s Health benefits expanded to cover COVID‐19 related issues Enterprise Cares: Associate Support Fund Premium Pay for retail associates working in roles that require direct physical contact with clients or in the office working closely with others Providing short‐term financial Drive thru only (except 5 locations) to reduce potential COVID‐19 assistance to associates and exposure for associates their families who have been affected by COVID‐19 pandemic. Virtual recognition program launched for peer‐to‐peer recognition Weekly 401(k) webinars being conducted for our associates by Wealth Management Promotion of Employee Assistance Program (EAP) benefit for confidential associate support by phone or video 4
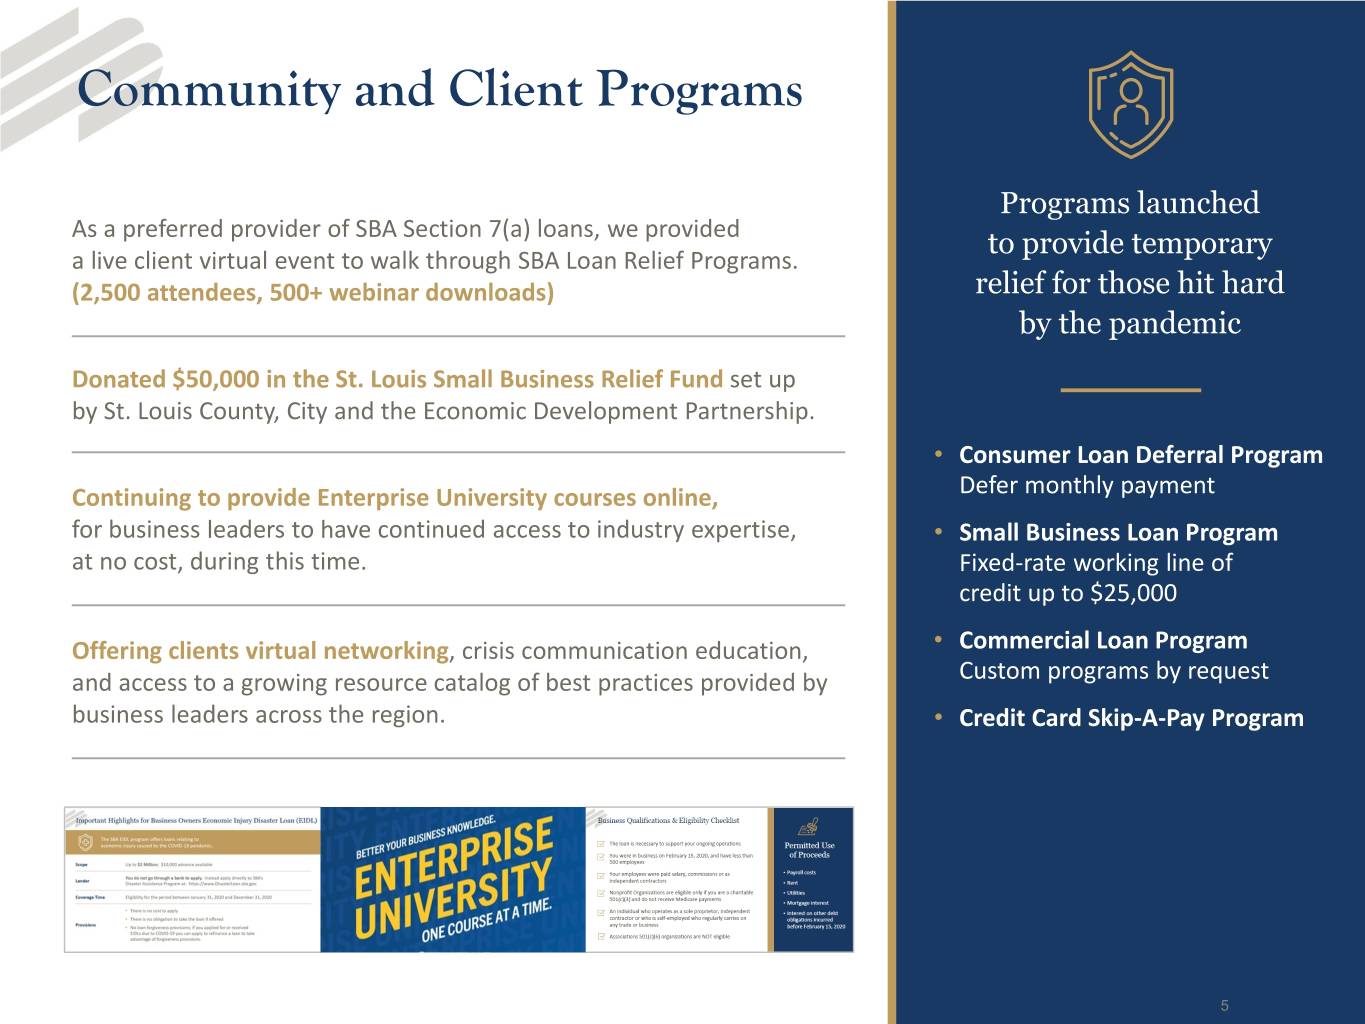
Community and Client Programs Programs launched As a preferred provider of SBA Section 7(a) loans, we provided to provide temporary a live client virtual event to walk through SBA Loan Relief Programs. (2,500 attendees, 500+ webinar downloads) relief for those hit hard by the pandemic Donated $50,000 in the St. Louis Small Business Relief Fund set up by St. Louis County, City and the Economic Development Partnership. • Consumer Loan Deferral Program Continuing to provide Enterprise University courses online, Defer monthly payment for business leaders to have continued access to industry expertise, • Small Business Loan Program at no cost, during this time. Fixed‐rate working line of credit up to $25,000 Offering clients virtual networking, crisis communication education, • Commercial Loan Program and access to a growing resource catalog of best practices provided by Custom programs by request business leaders across the region. • Credit Card Skip‐A‐Pay Program 5
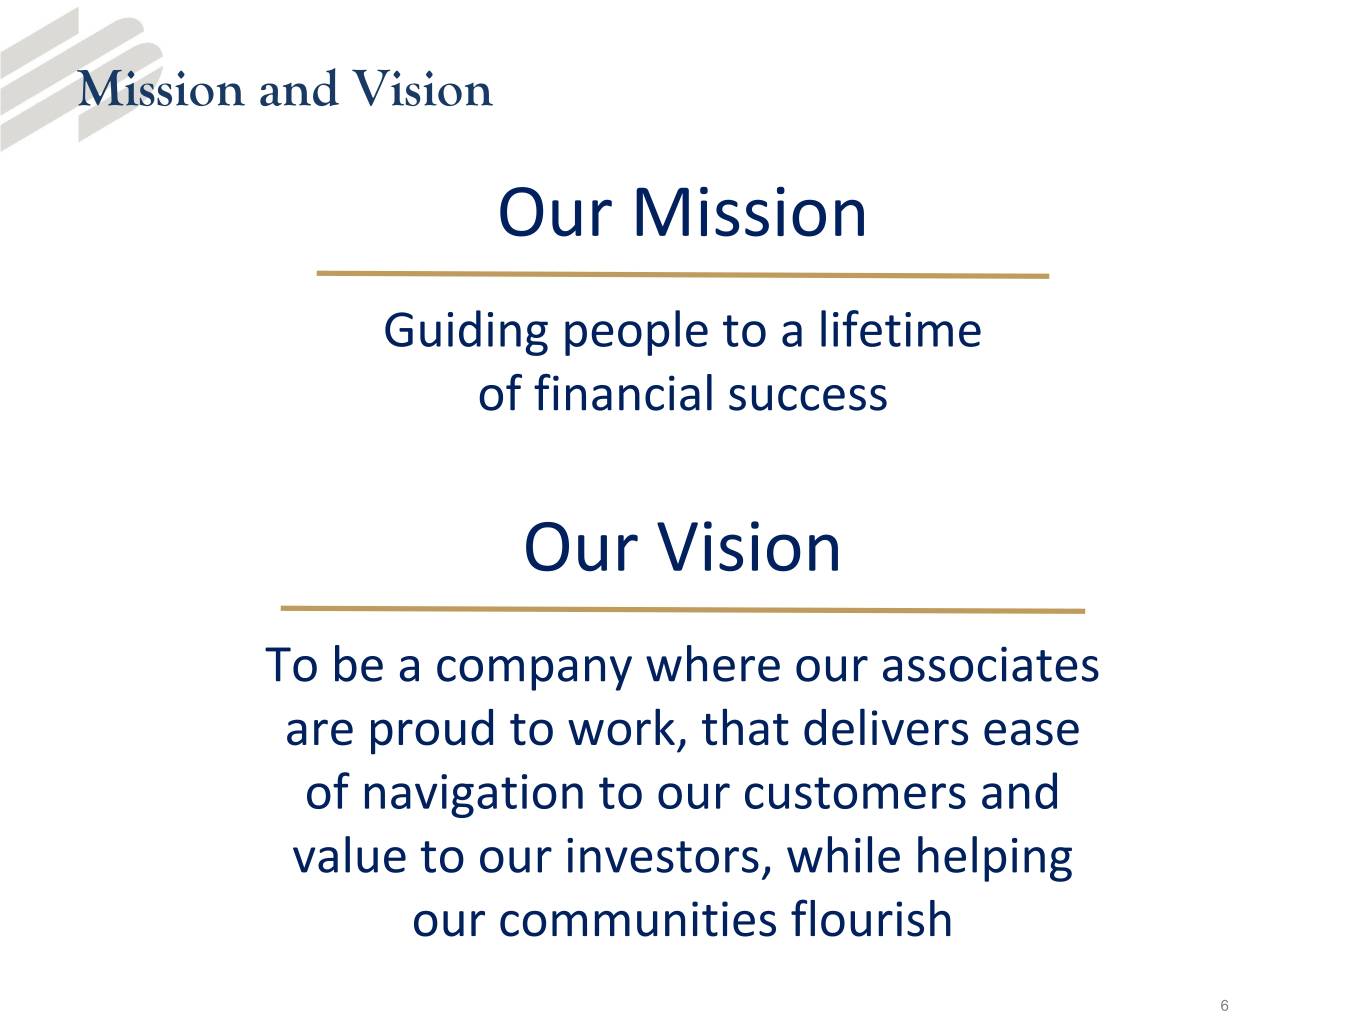
Mission and Vision Our Mission Guiding people to a lifetime of financial success Our Vision To be a company where our associates are proud to work, that delivers ease of navigation to our customers and value to our investors, while helping our communities flourish 6
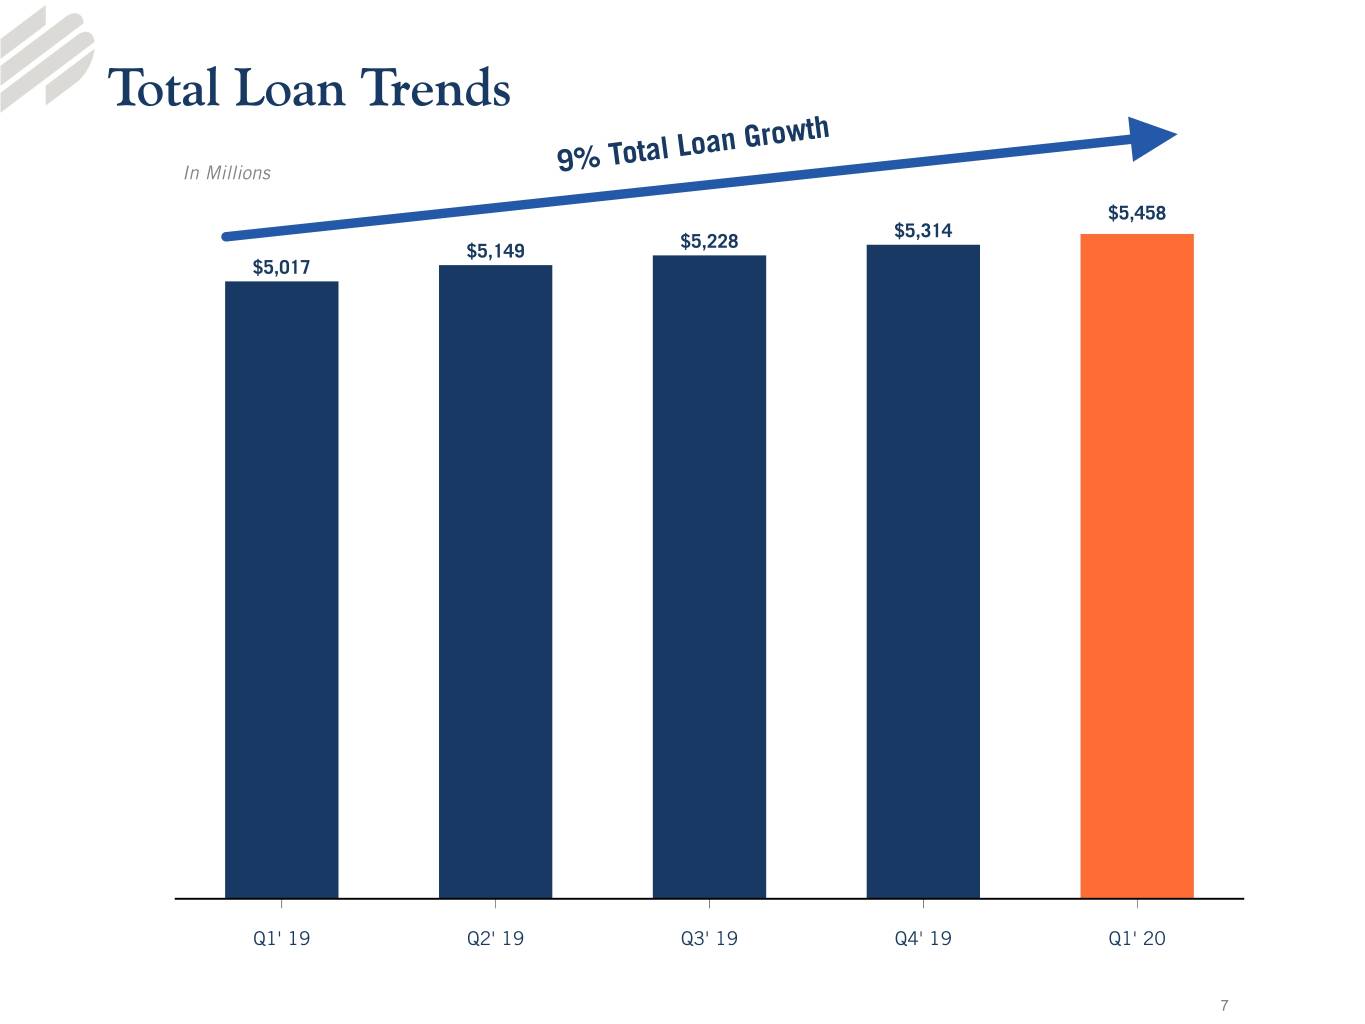
Total Loan Trends In Millions 9% Total Loan Growth $5,458 $5,314 $5,228 $5,149 $5,017 Q1' 19 Q2' 19 Q3' 19 Q4' 19 Q1' 20 7
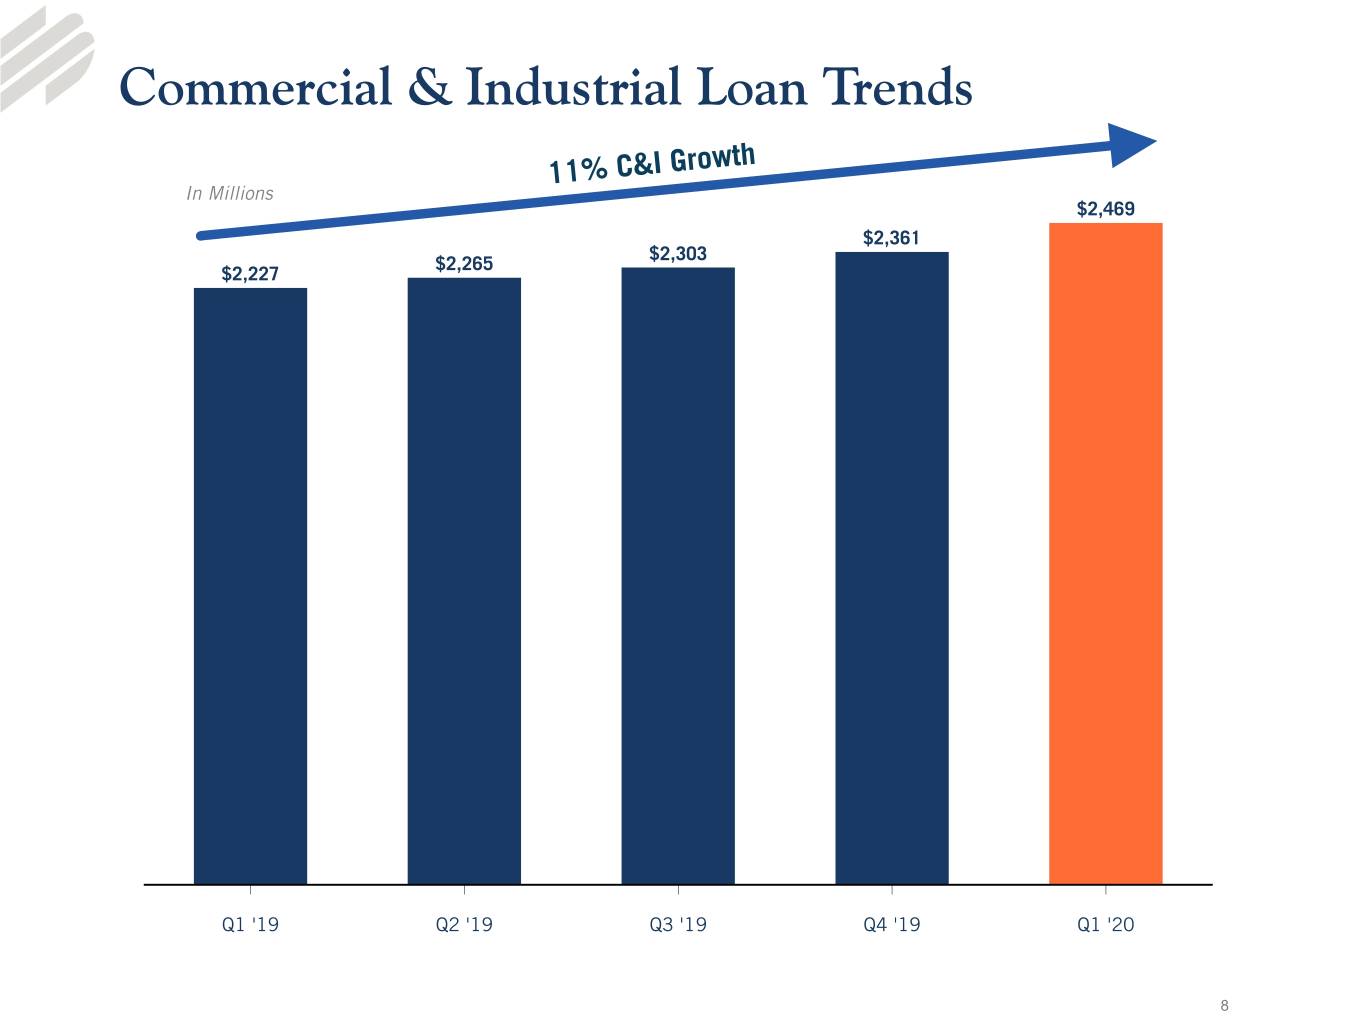
Commercial & Industrial Loan Trends 11% C&I Growth In Millions $2,469 $2,361 $2,303 $2,265 $2,227 Q1 '19 Q2 '19 Q3 '19 Q4 '19 Q1 '20 8
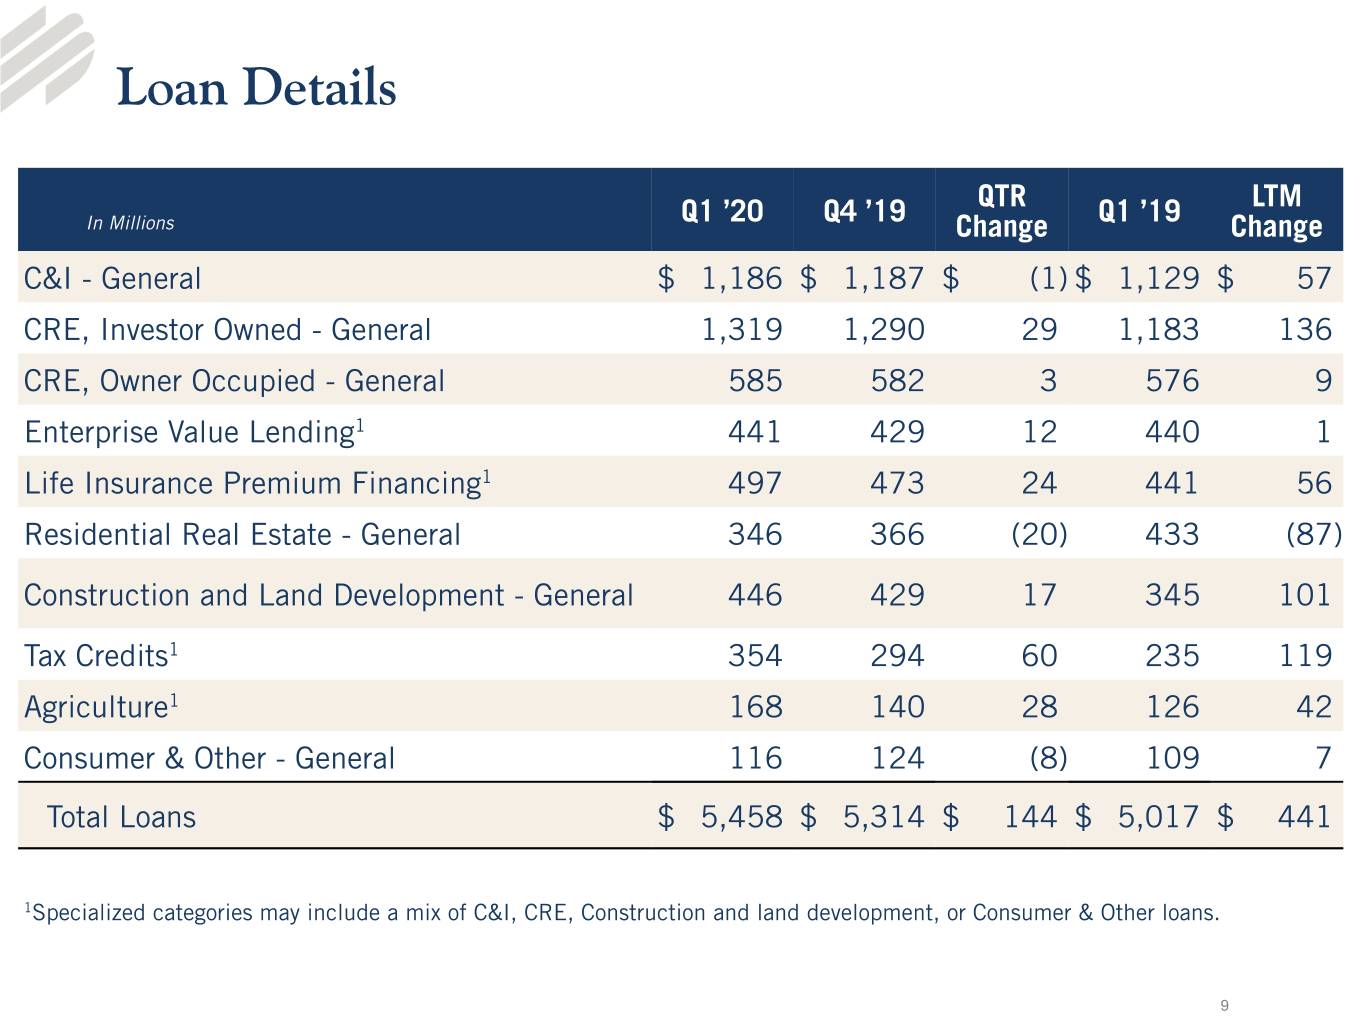
Loan Details Q1 ’20 Q4 ’19 QTR Q1 ’19 LTM In Millions Change Change C&I - General $ 1,186 $ 1,187 $ (1) $ 1,129 $ 57 CRE, Investor Owned - General 1,319 1,290 29 1,183 136 CRE, Owner Occupied - General 585 582 3 576 9 Enterprise Value Lending1 441 429 12 440 1 Life Insurance Premium Financing1 497 473 24 441 56 Residential Real Estate - General 346 366 (20) 433 (87) Construction and Land Development - General 446 429 17 345 101 Tax Credits1 354 294 60 235 119 Agriculture1 168 140 28 126 42 Consumer & Other - General 116 124 (8) 109 7 Total Loans $ 5,458 $ 5,314 $ 144 $ 5,017 $ 441 1Specialized categories may include a mix of C&I, CRE, Construction and land development, or Consumer & Other loans. 9
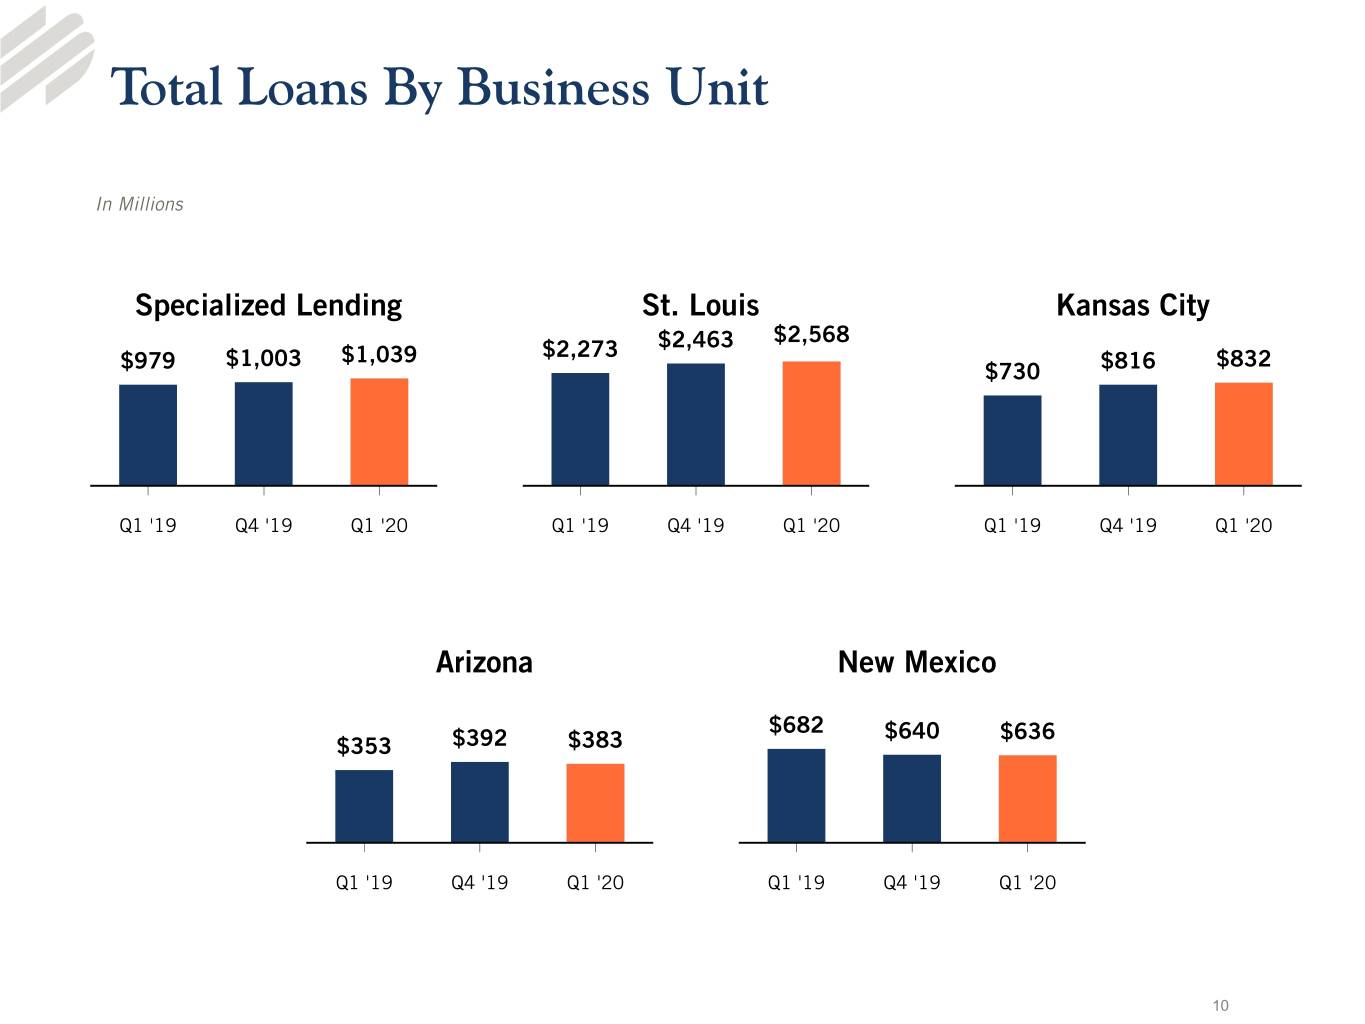
Total Loans By Business Unit In Millions Specialized Lending St.Louis Kansas City $2,463 $2,568 $1,003 $1,039 $2,273 $832 $979 $730 $816 Q1 '19 Q4 '19 Q1 '20 Q1 '19 Q4 '19 Q1 '20 Q1 '19 Q4 '19 Q1 '20 Arizona New Mexico $682 $640 $636 $353 $392 $383 Q1 '19 Q4 '19 Q1 '20 Q1 '19 Q4 '19 Q1 '20 10
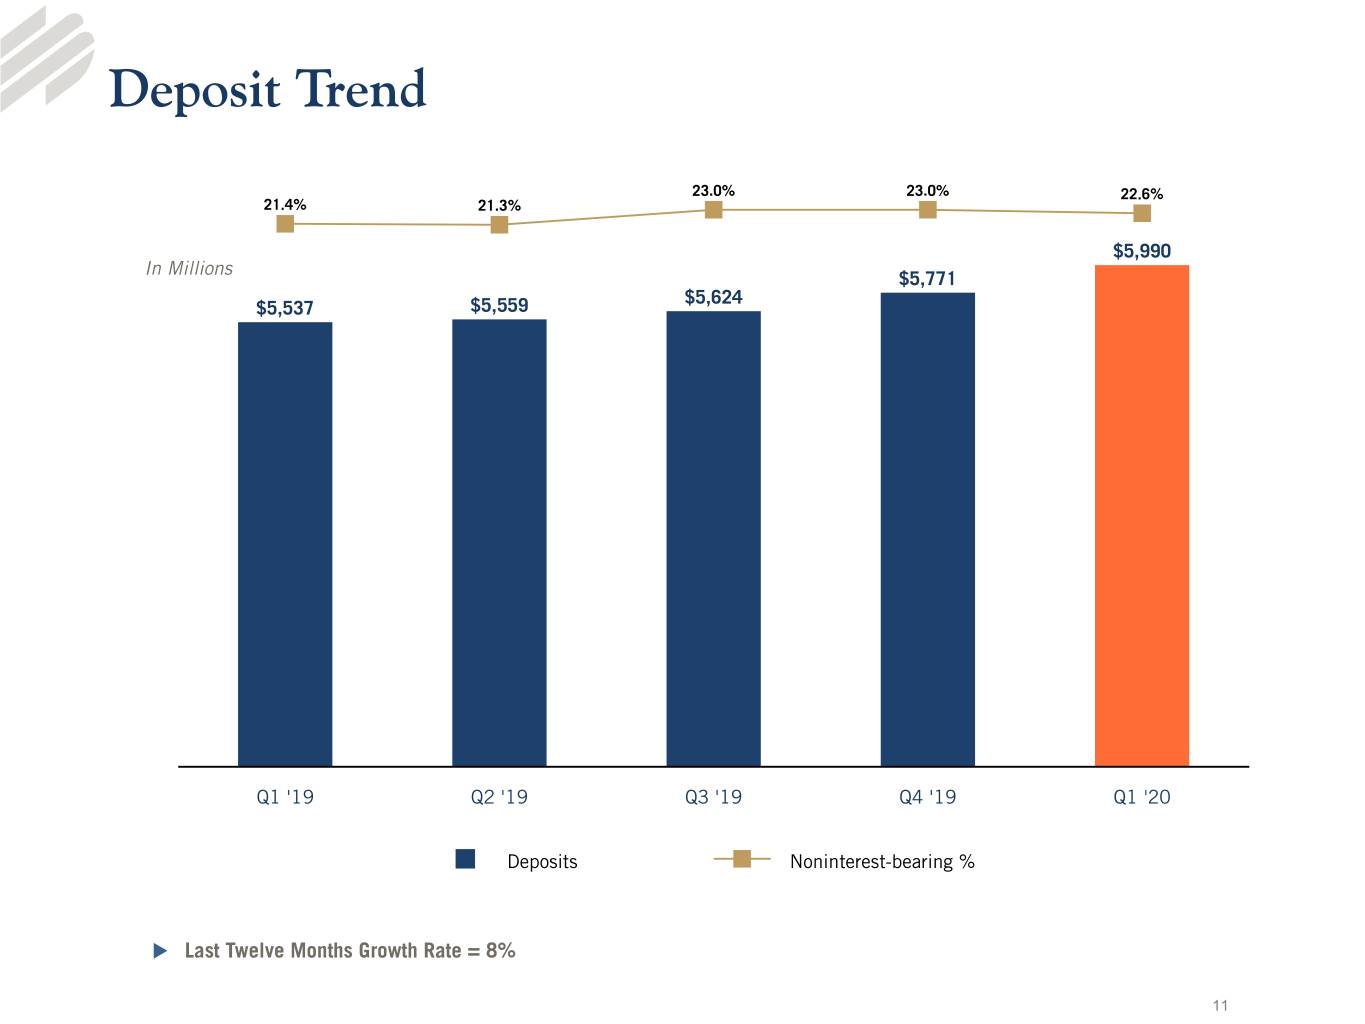
Deposit Trend 23.0% 23.0% 22.6% 21.4% 21.3% $5,990 In Millions $5,771 $5,624 $5,537 $5,559 Q1 '19 Q2 '19 Q3 '19 Q4 '19 Q1 '20 Deposits Noninterest-bearing % u Last Twelve Months Growth Rate = 8% 11
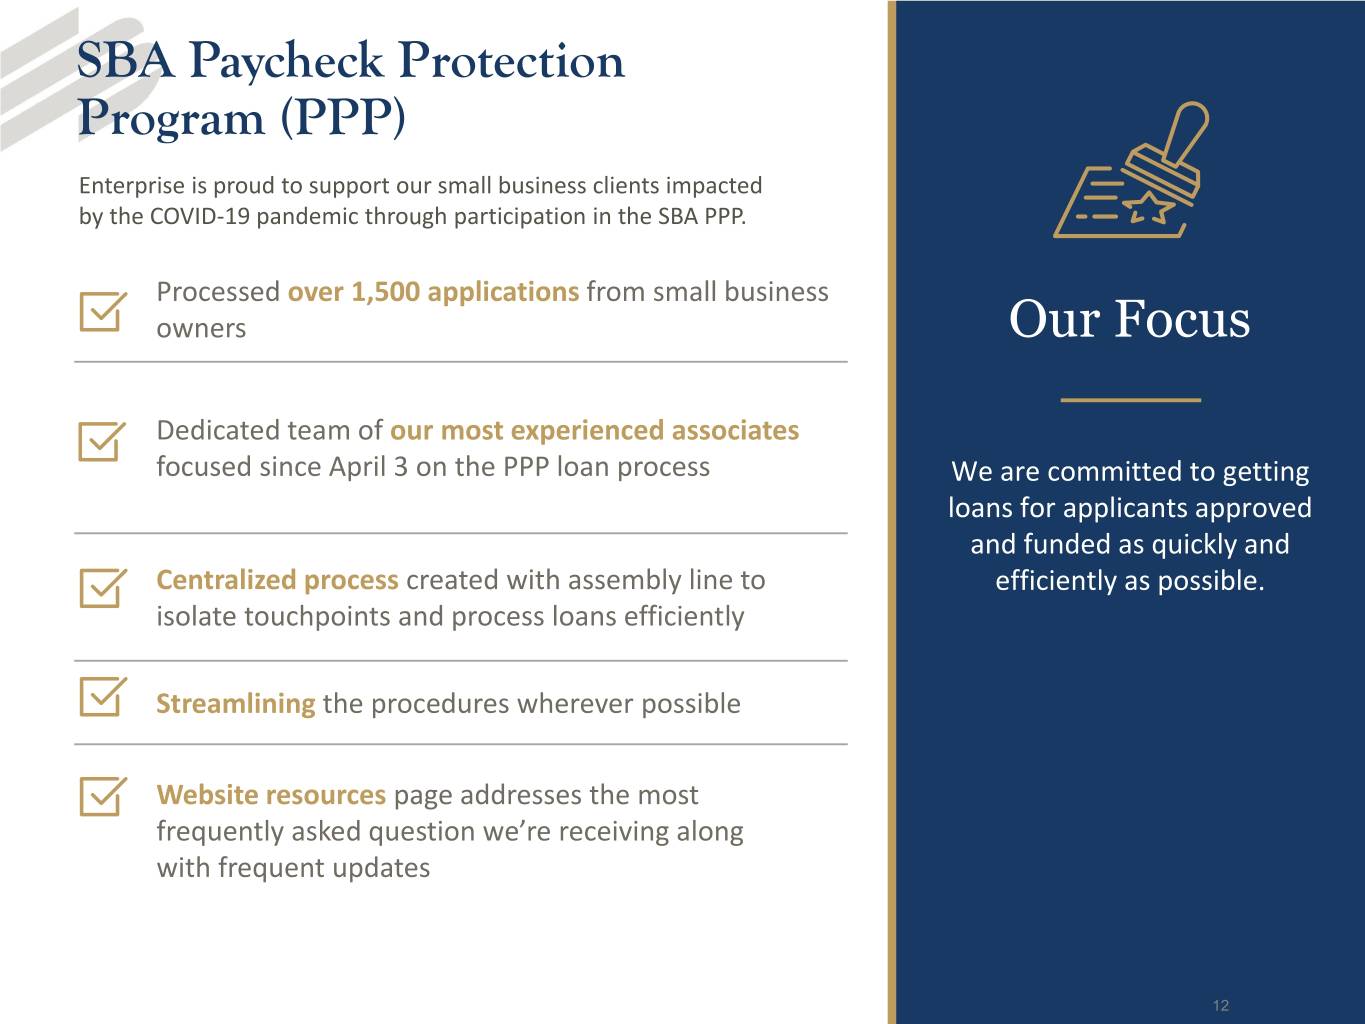
SBA Paycheck Protection Program (PPP) Enterprise is proud to support our small business clients impacted by the COVID‐19 pandemic through participation in the SBA PPP. Processed over 1,500 applications from small business owners Our Focus Dedicated team of our most experienced associates focused since April 3 on the PPP loan process We are committed to getting loans for applicants approved and funded as quickly and Centralized process created with assembly line to efficiently as possible. isolate touchpoints and process loans efficiently Streamlining the procedures wherever possible Website resources page addresses the most frequently asked question we’re receiving along with frequent updates 12 5
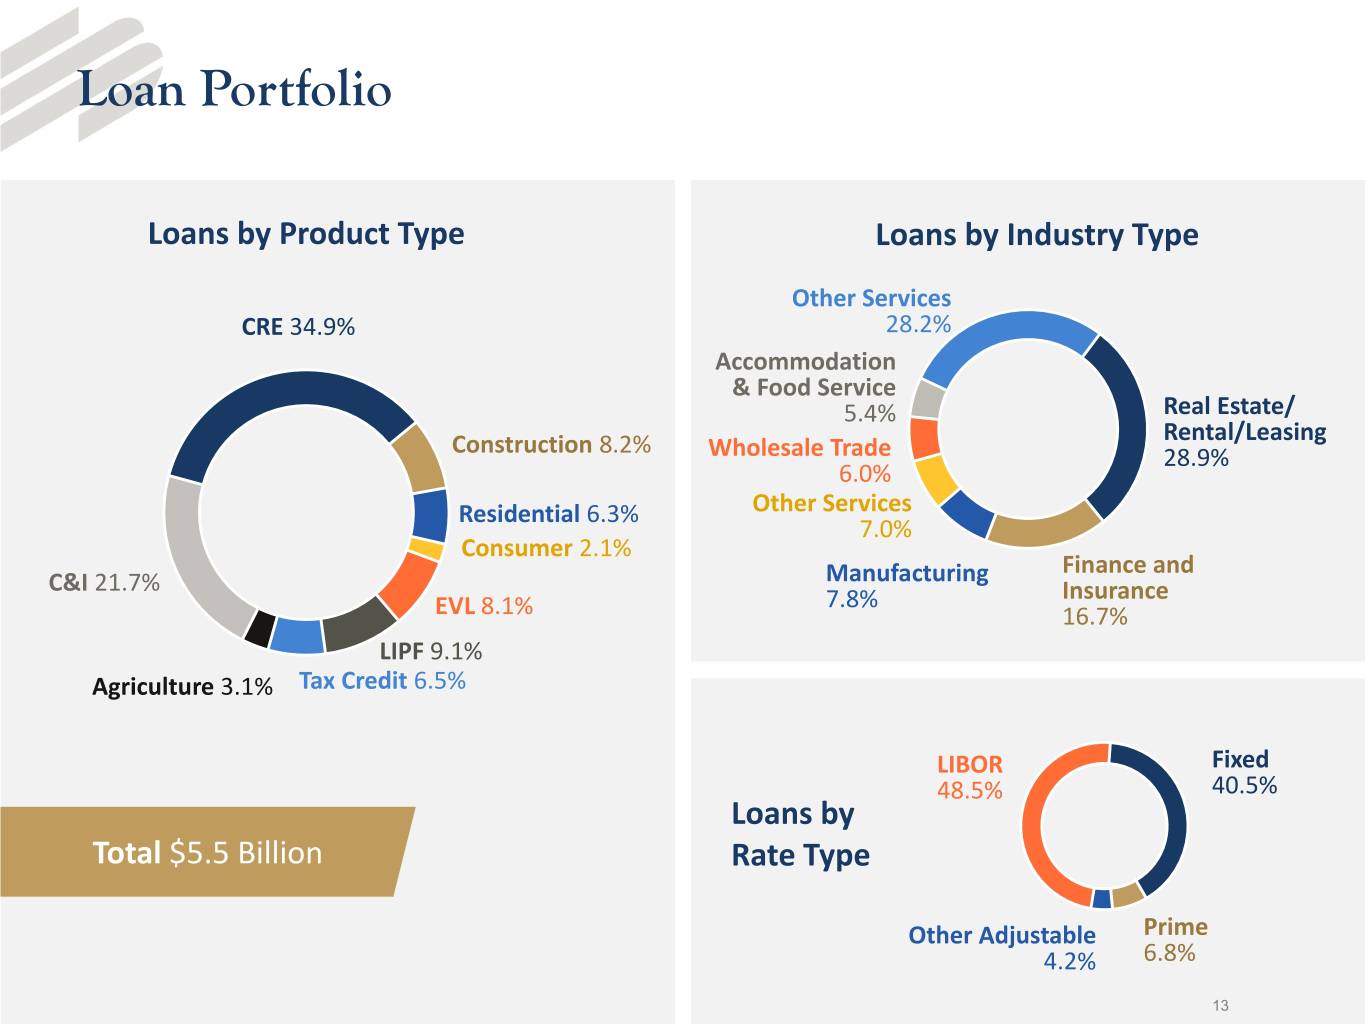
Loan Portfolio Loans by Product Type Loans by Industry Type Other Services CRE 34.9% 28.2% Accommodation & Food Service 5.4% Real Estate/ Construction 8.2% Rental/Leasing Wholesale Trade 28.9% 6.0% Residential 6.3% Other Services 7.0% Consumer 2.1% Finance and C&I 21.7% Manufacturing 7.8% Insurance EVL 8.1% 16.7% LIPF 9.1% Agriculture 3.1% Tax Credit 6.5% LIBOR Fixed 48.5% 40.5% Loans by Total $5.5 Billion Rate Type Other Adjustable Prime 4.2% 6.8% 13
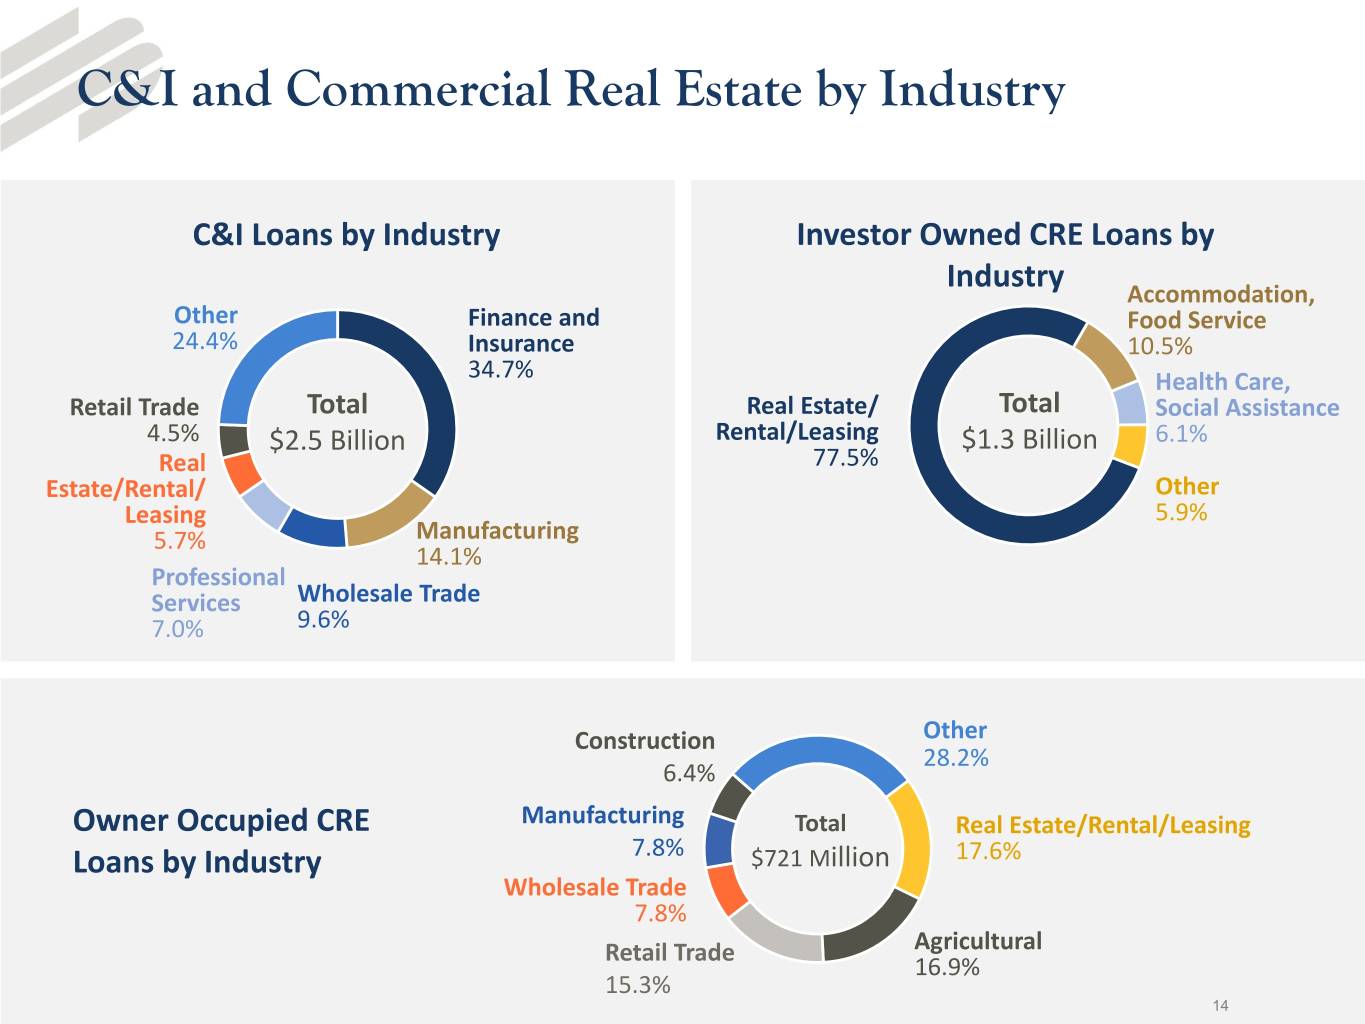
C&I and Commercial Real Estate by Industry C&I Loans by Industry Investor Owned CRE Loans by Industry Accommodation, Other Finance and Food Service 24.4% Insurance 10.5% 34.7% Health Care, Retail Trade Total Real Estate/ Total Social Assistance 4.5% $2.5 Billion Rental/Leasing $1.3 Billion 6.1% Real 77.5% Estate/Rental/ Other Leasing 5.9% 5.7% Manufacturing 14.1% Professional Services Wholesale Trade 7.0% 9.6% Construction Other 28.2% 6.4% Owner Occupied CRE Manufacturing Total Real Estate/Rental/Leasing Loans by Industry 7.8% $721 Million 17.6% Wholesale Trade 7.8% Retail Trade Agricultural 16.9% 15.3% 14
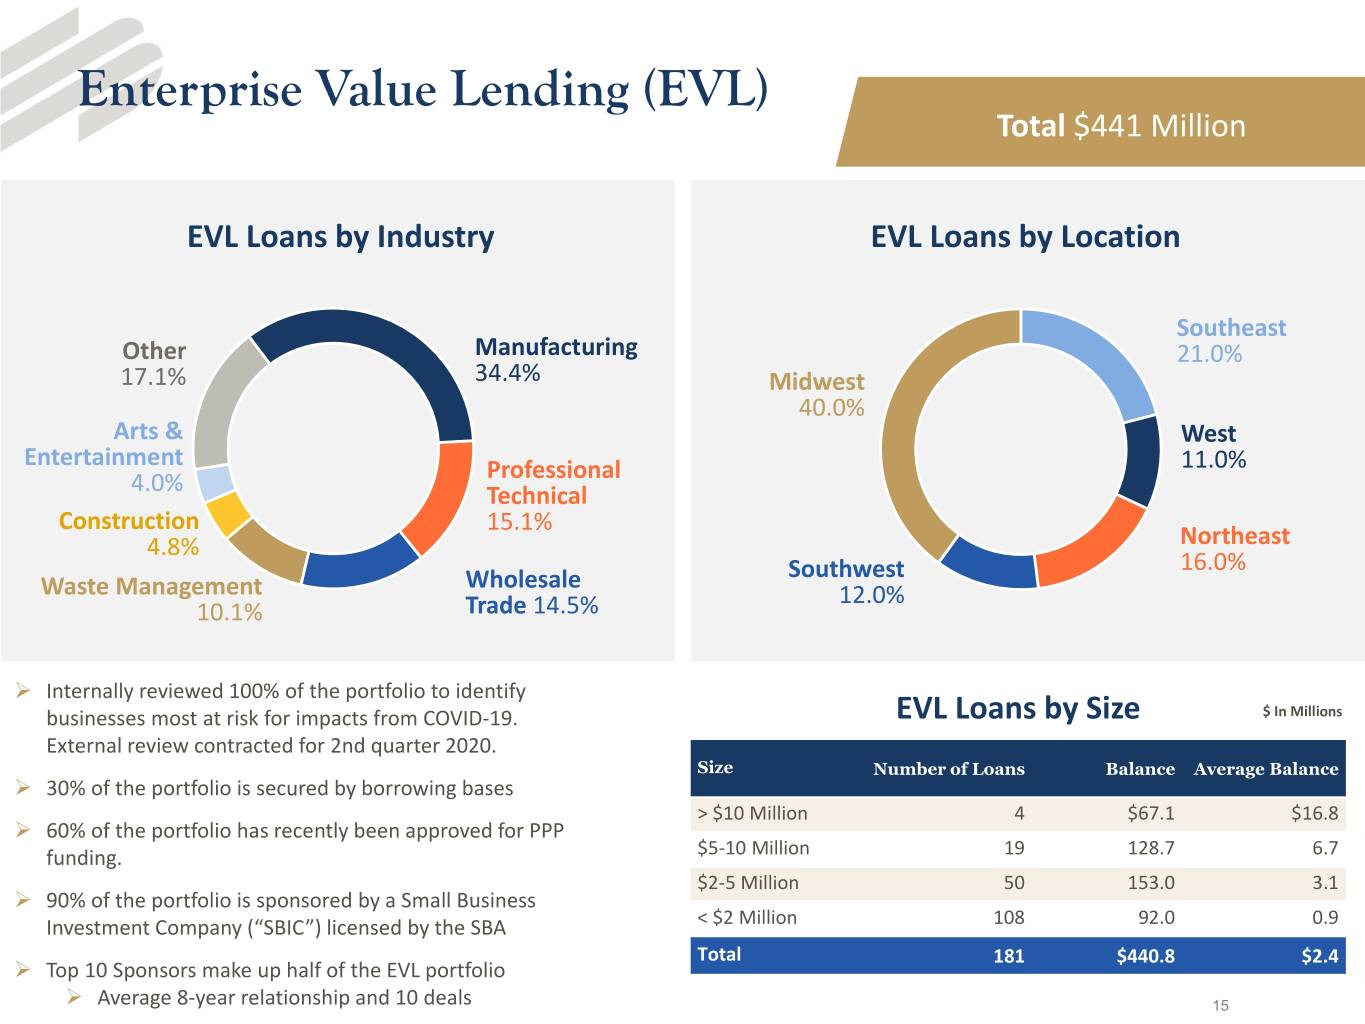
Enterprise Value Lending (EVL) Total $441 Million EVL Loans by Industry EVL Loans by Location Southeast Other Manufacturing 21.0% 17.1% 34.4% Midwest 40.0% Arts & West Entertainment Professional 11.0% 4.0% Technical Construction 15.1% 4.8% Northeast 16.0% Wholesale Southwest Waste Management 12.0% 10.1% Trade 14.5% Internally reviewed 100% of the portfolio to identify businesses most at risk for impacts from COVID‐19. EVL Loans by Size $ In Millions External review contracted for 2nd quarter 2020. Size Number of Loans Balance Average Balance 30% of the portfolio is secured by borrowing bases > $10 Million 4 $67.1 $16.8 60% of the portfolio has recently been approved for PPP funding. $5‐10 Million 19 128.7 6.7 $2‐5 Million 50 153.0 3.1 90% of the portfolio is sponsored by a Small Business Investment Company (“SBIC”) licensed by the SBA < $2 Million 108 92.0 0.9 Total 181 $440.8 $2.4 Top 10 Sponsors make up half of the EVL portfolio Average 8‐year relationship and 10 deals 15
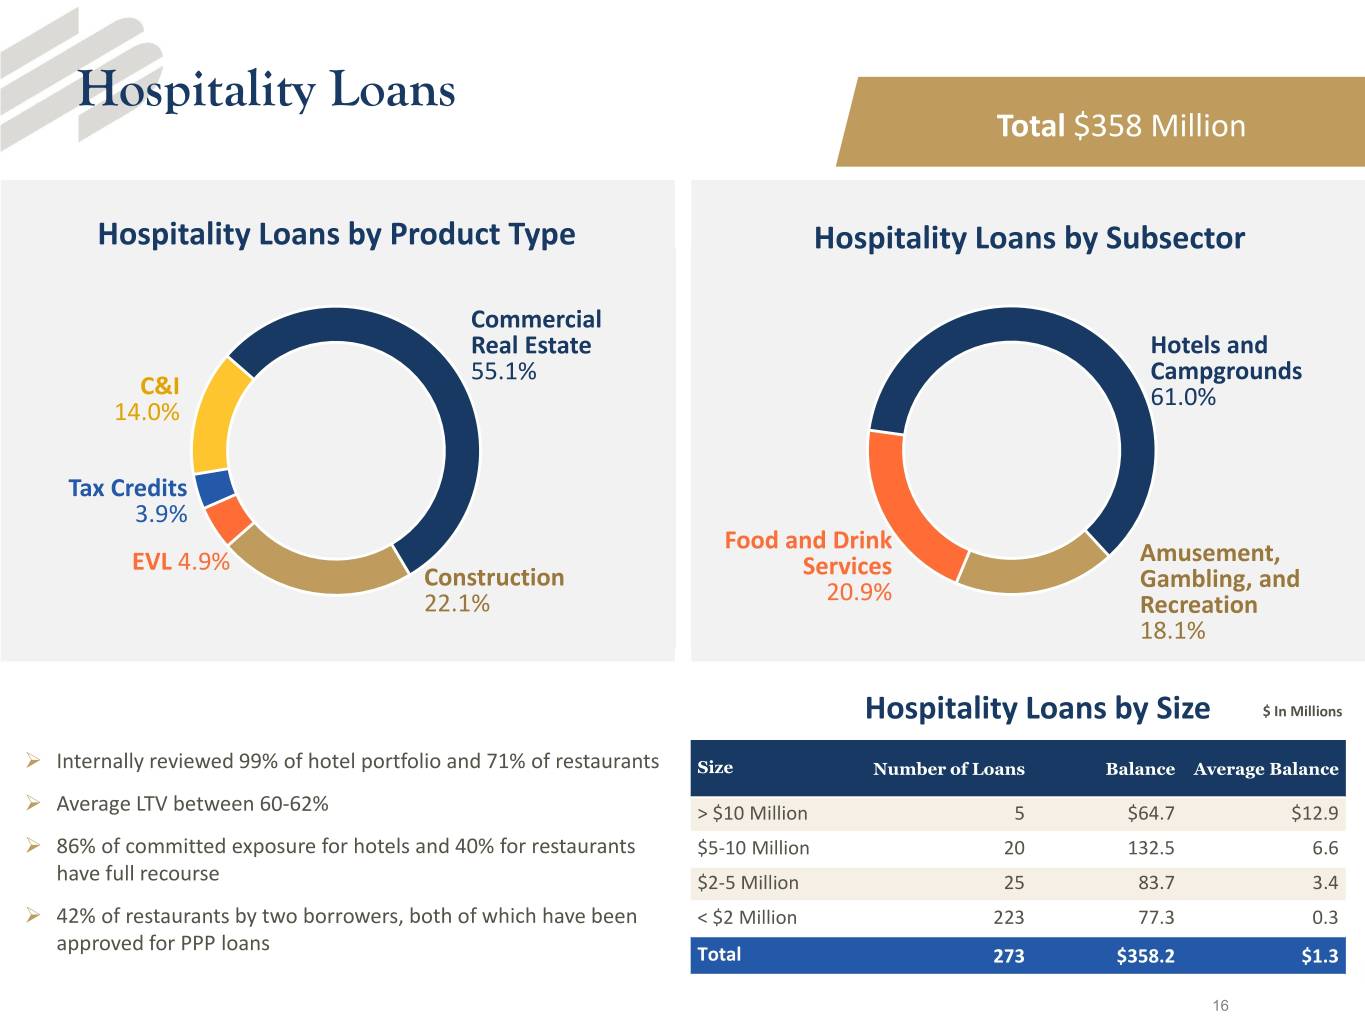
Hospitality Loans Total $358 Million Hospitality Loans by Product Type Hospitality Loans by Subsector Commercial Real Estate Hotels and 55.1% Campgrounds C&I 61.0% 14.0% Tax Credits 3.9% Food and Drink EVL 4.9% Amusement, Construction Services Gambling, and 22.1% 20.9% Recreation 18.1% Hospitality Loans by Size $ In Millions Internally reviewed 99% of hotel portfolio and 71% of restaurants Size Number of Loans Balance Average Balance Average LTV between 60‐62% > $10 Million 5 $64.7 $12.9 86% of committed exposure for hotels and 40% for restaurants $5‐10 Million 20 132.5 6.6 have full recourse $2‐5 Million 25 83.7 3.4 42% of restaurants by two borrowers, both of which have been < $2 Million 223 77.3 0.3 approved for PPP loans Total 273 $358.2 $1.3 16
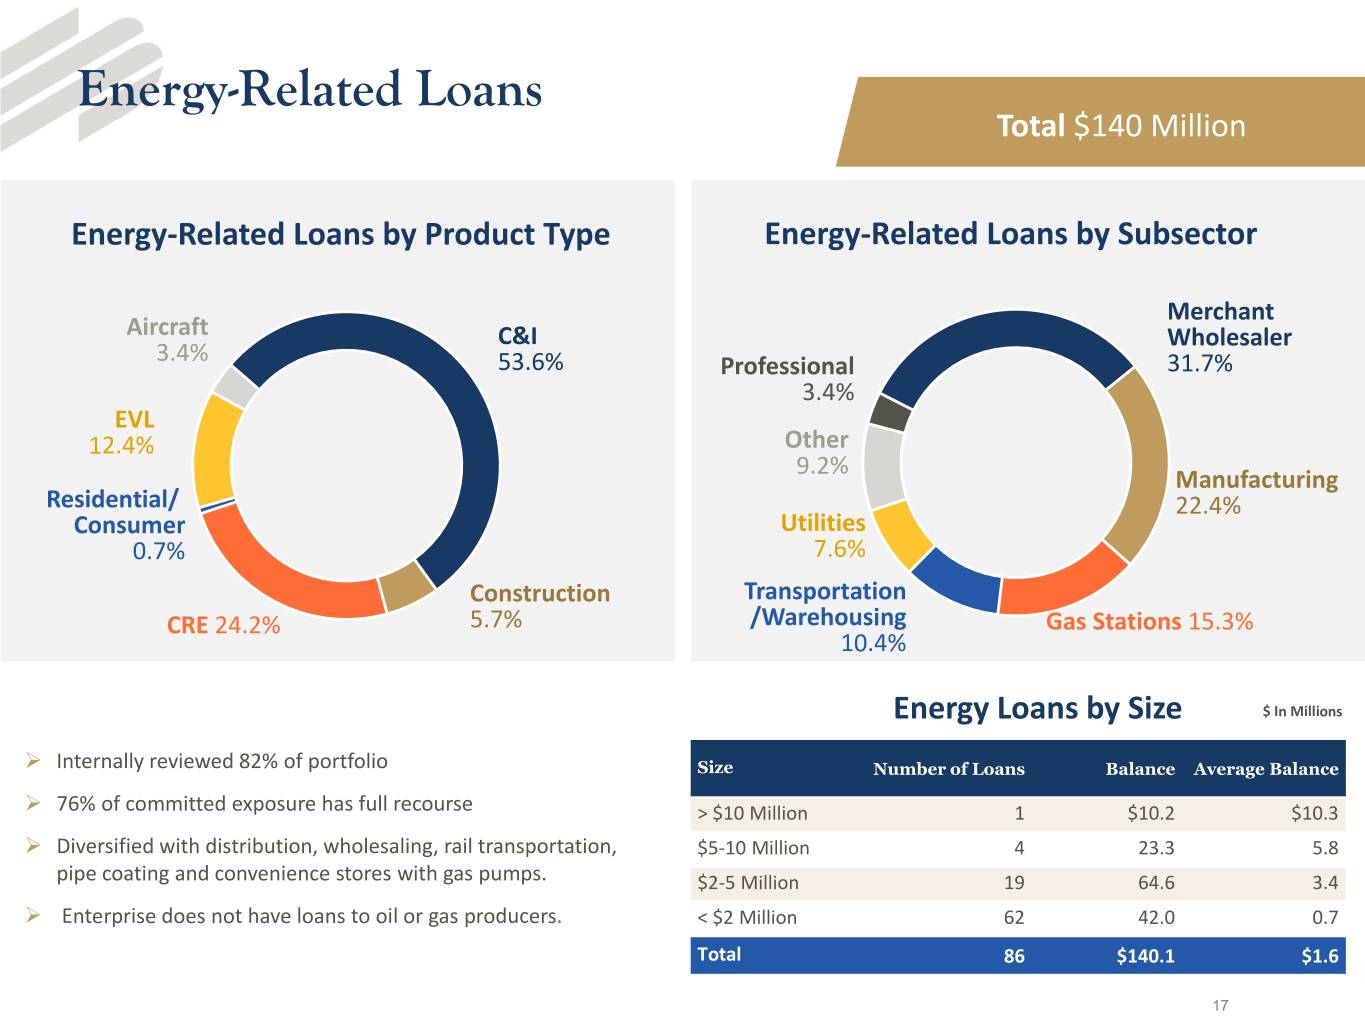
Energy-Related Loans Total $140 Million Energy‐Related Loans by Product Type Energy‐Related Loans by Subsector Merchant Aircraft C&I Wholesaler 3.4% 53.6% Professional 31.7% 3.4% EVL 12.4% Other 9.2% Manufacturing Residential/ 22.4% Consumer Utilities 0.7% 7.6% Construction Transportation CRE 24.2% 5.7% /Warehousing Gas Stations 15.3% 10.4% Energy Loans by Size $ In Millions Internally reviewed 82% of portfolio Size Number of Loans Balance Average Balance 76% of committed exposure has full recourse > $10 Million 1 $10.2 $10.3 Diversified with distribution, wholesaling, rail transportation, $5‐10 Million 4 23.3 5.8 pipe coating and convenience stores with gas pumps. $2‐5 Million 19 64.6 3.4 Enterprise does not have loans to oil or gas producers. < $2 Million 62 42.0 0.7 Total 86 $140.1 $1.6 17
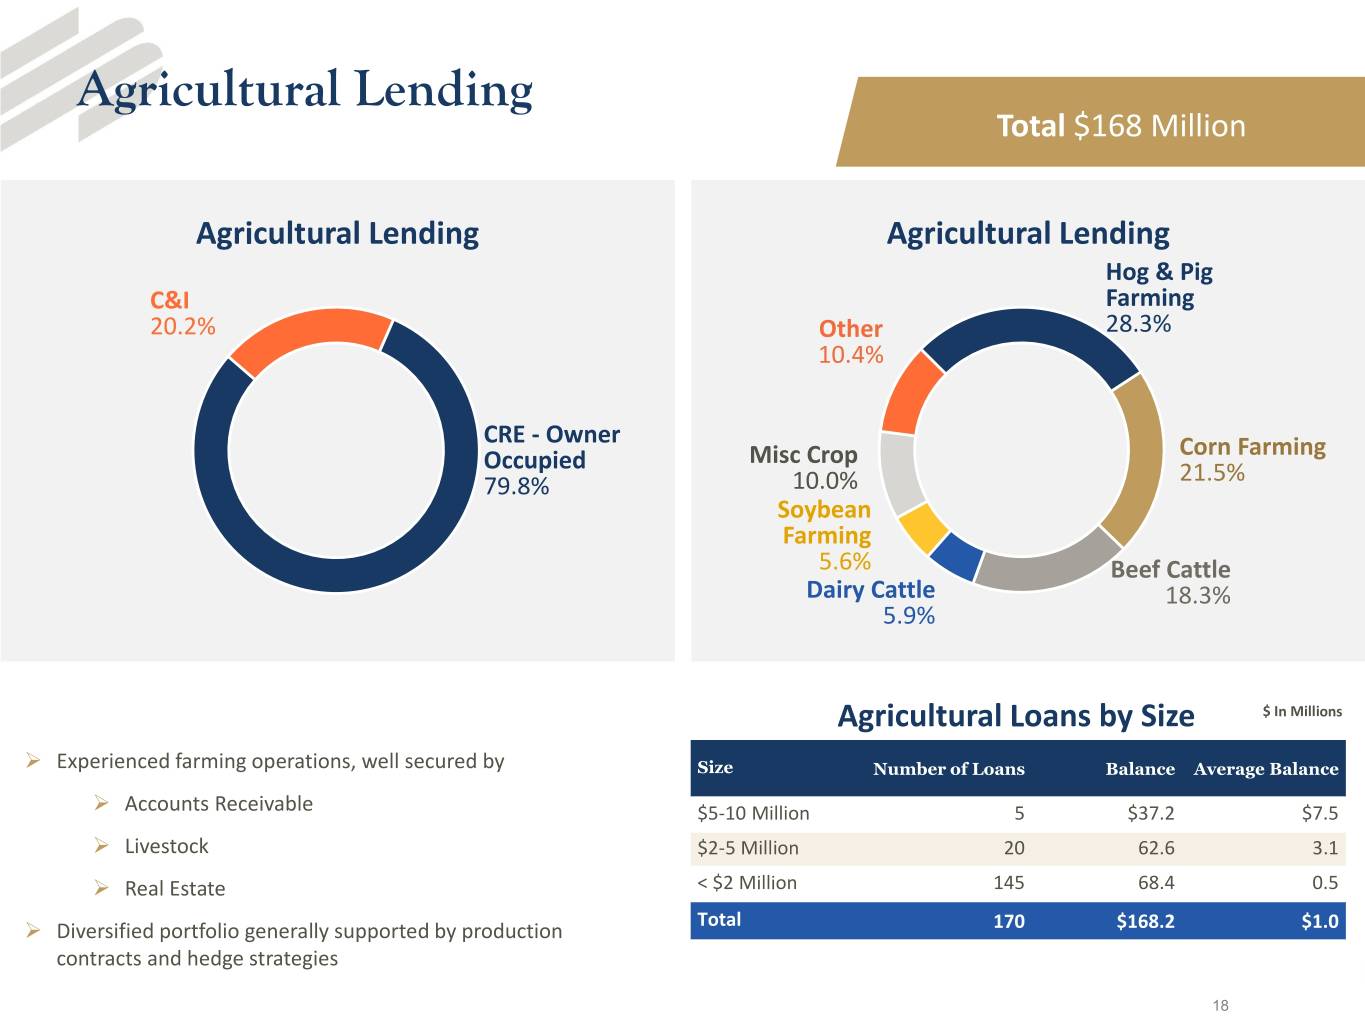
Agricultural Lending Total $168 Million Agricultural Lending Agricultural Lending Hog & Pig C&I Farming 20.2% Other 28.3% 10.4% CRE ‐ Owner Misc Crop Corn Farming Occupied 21.5% 79.8% 10.0% Soybean Farming 5.6% Beef Cattle Dairy Cattle 18.3% 5.9% Agricultural Loans by Size $ In Millions Experienced farming operations, well secured by Size Number of Loans Balance Average Balance Accounts Receivable $5‐10 Million 5 $37.2 $7.5 Livestock $2‐5 Million 20 62.6 3.1 Real Estate < $2 Million 145 68.4 0.5 Total Diversified portfolio generally supported by production 170 $168.2 $1.0 contracts and hedge strategies 18
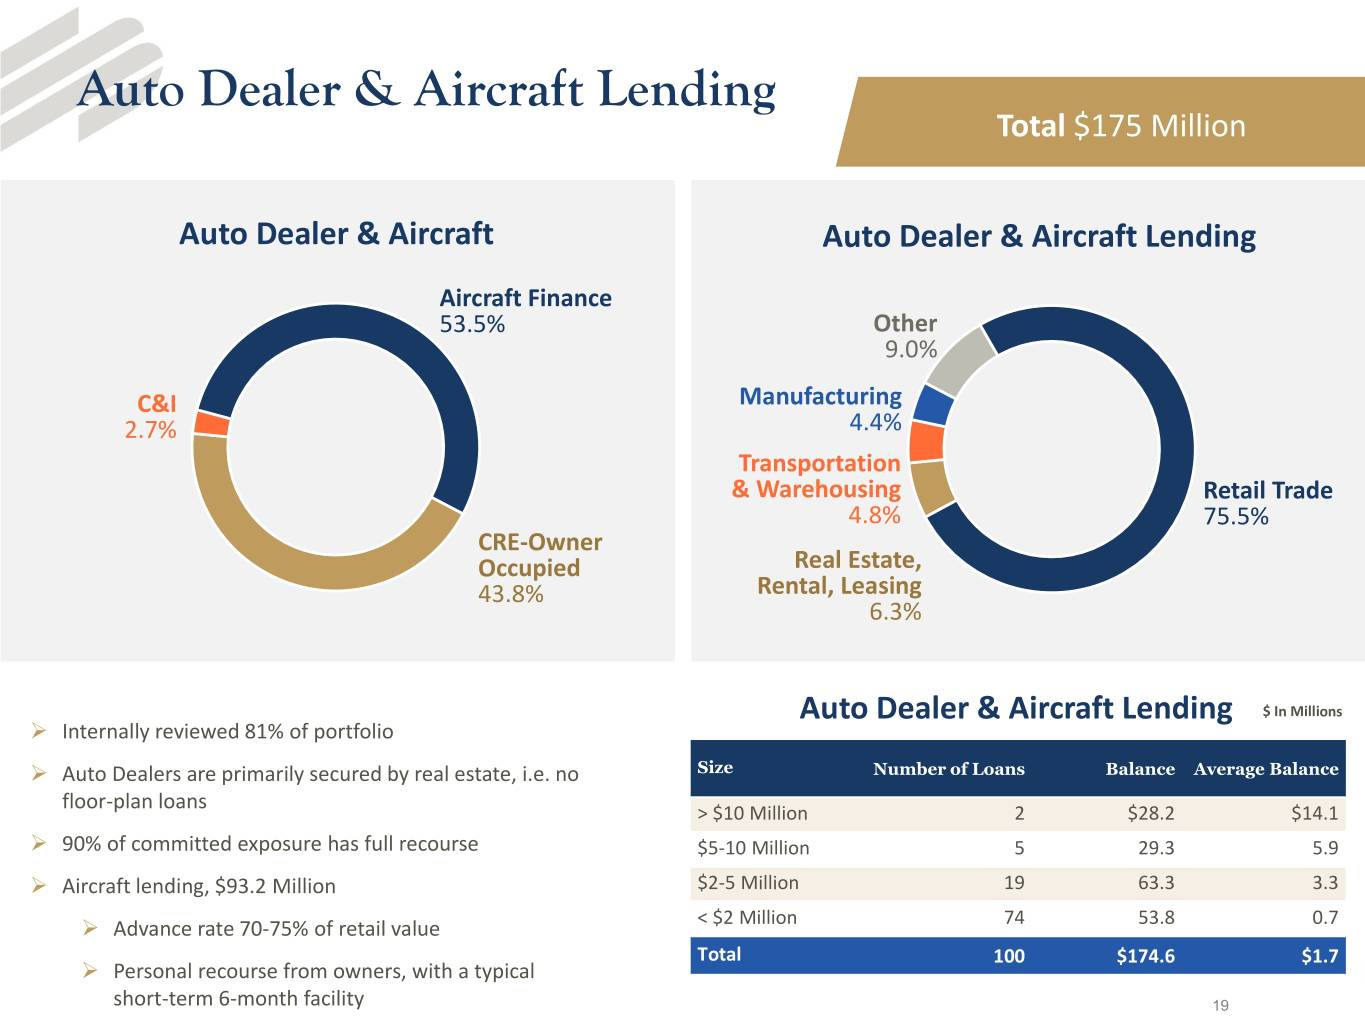
Auto Dealer & Aircraft Lending Total $175 Million Auto Dealer & Aircraft Auto Dealer & Aircraft Lending Aircraft Finance 53.5% Other 9.0% C&I Manufacturing 2.7% 4.4% Transportation & Warehousing Retail Trade 4.8% 75.5% CRE‐Owner Occupied Real Estate, 43.8% Rental, Leasing 6.3% Auto Dealer & Aircraft Lending $ In Millions Internally reviewed 81% of portfolio Auto Dealers are primarily secured by real estate, i.e. no Size Number of Loans Balance Average Balance floor‐plan loans > $10 Million 2 $28.2 $14.1 90% of committed exposure has full recourse $5‐10 Million 5 29.3 5.9 Aircraft lending, $93.2 Million $2‐5 Million 19 63.3 3.3 Advance rate 70‐75% of retail value < $2 Million 74 53.8 0.7 Total 100 $174.6 $1.7 Personal recourse from owners, with a typical short‐term 6‐month facility 19
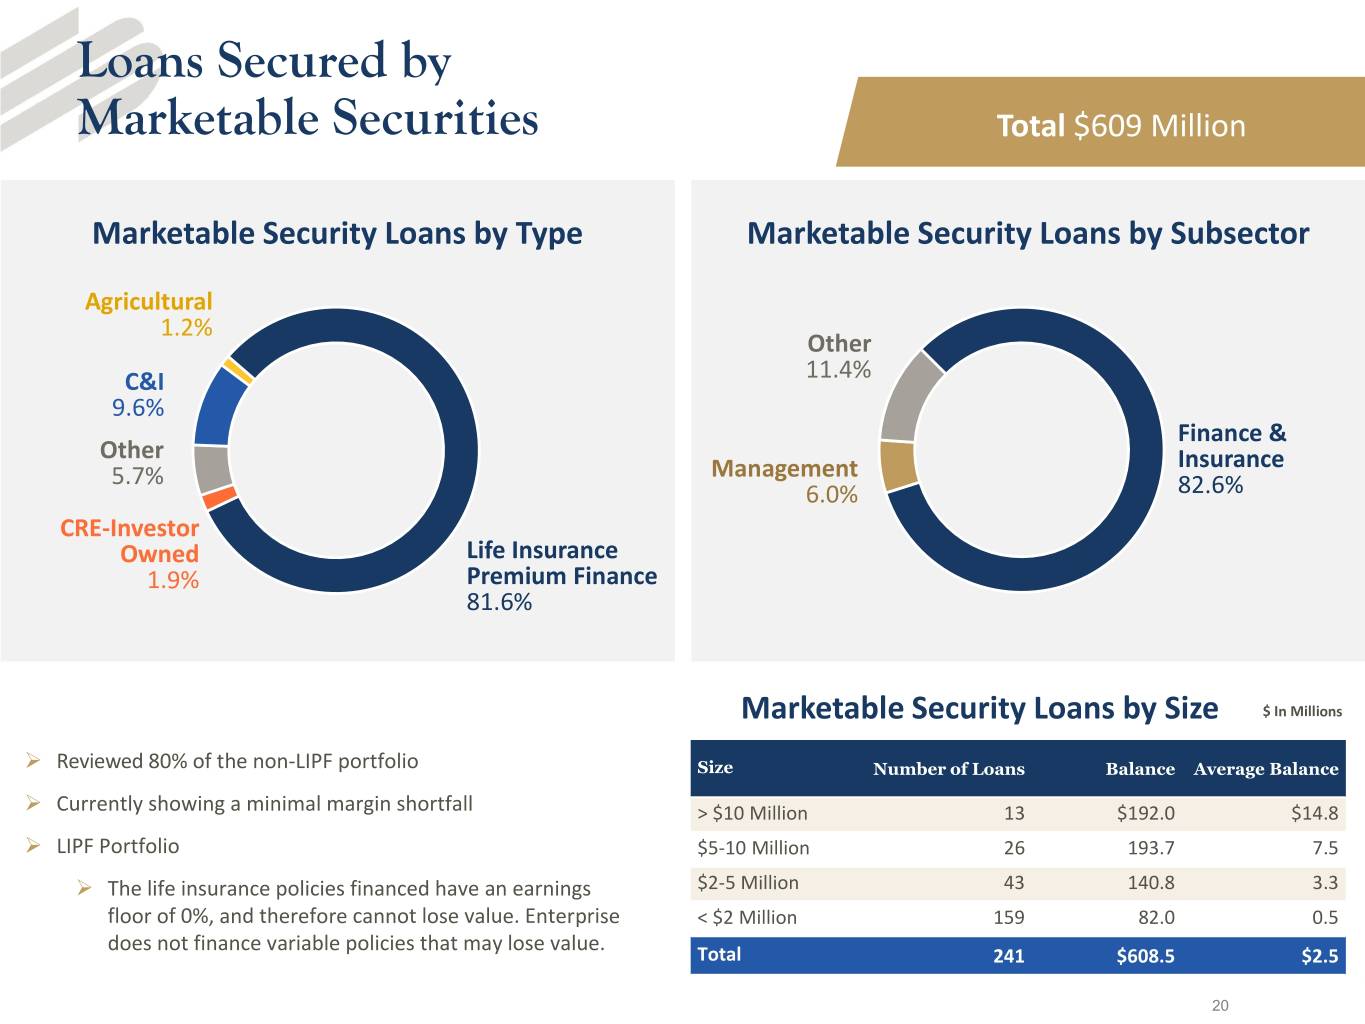
Loans Secured by Marketable Securities Total $609 Million Marketable Security Loans by Type Marketable Security Loans by Subsector Agricultural 1.2% Other C&I 11.4% 9.6% Finance & Other Insurance 5.7% Management 6.0% 82.6% CRE‐Investor Owned Life Insurance 1.9% Premium Finance 81.6% Marketable Security Loans by Size $ In Millions Reviewed 80% of the non‐LIPF portfolio Size Number of Loans Balance Average Balance Currently showing a minimal margin shortfall > $10 Million 13 $192.0 $14.8 LIPF Portfolio $5‐10 Million 26 193.7 7.5 The life insurance policies financed have an earnings $2‐5 Million 43 140.8 3.3 floor of 0%, and therefore cannot lose value. Enterprise < $2 Million 159 82.0 0.5 does not finance variable policies that may lose value. Total 241 $608.5 $2.5 20
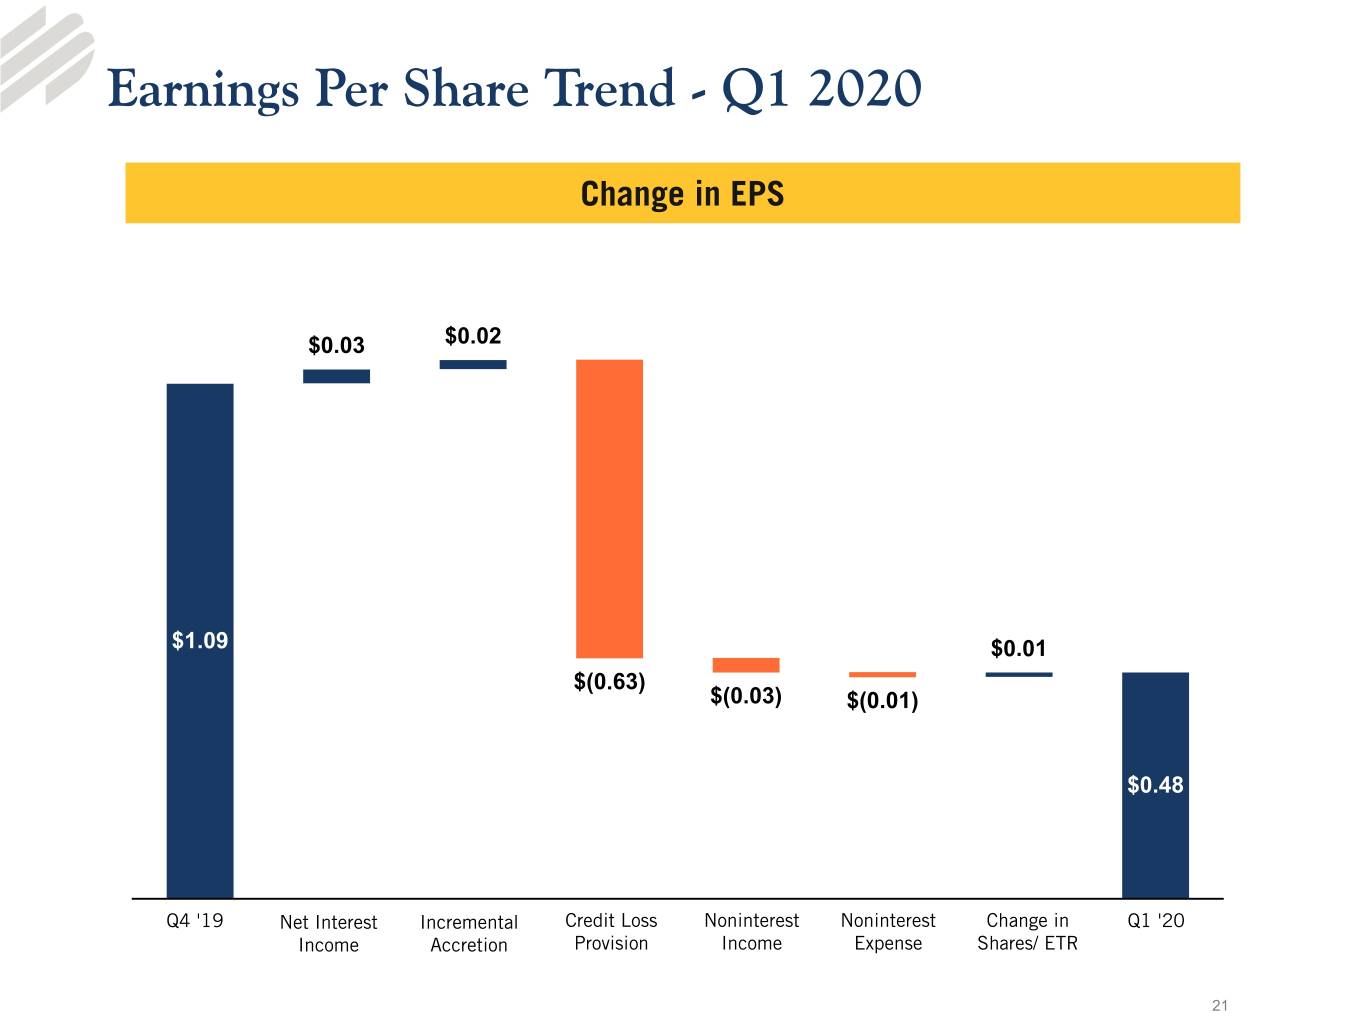
Earnings Per Share Trend - Q1 2020 Change in EPS $0.03 $0.02 $1.09 $0.01 $(0.63) $(0.03) $(0.01) $0.48 Q4 '19 Net Interest Incremental Credit Loss Noninterest Noninterest Change in Q1 '20 Income Accretion Provision Income Expense Shares/ ETR 21
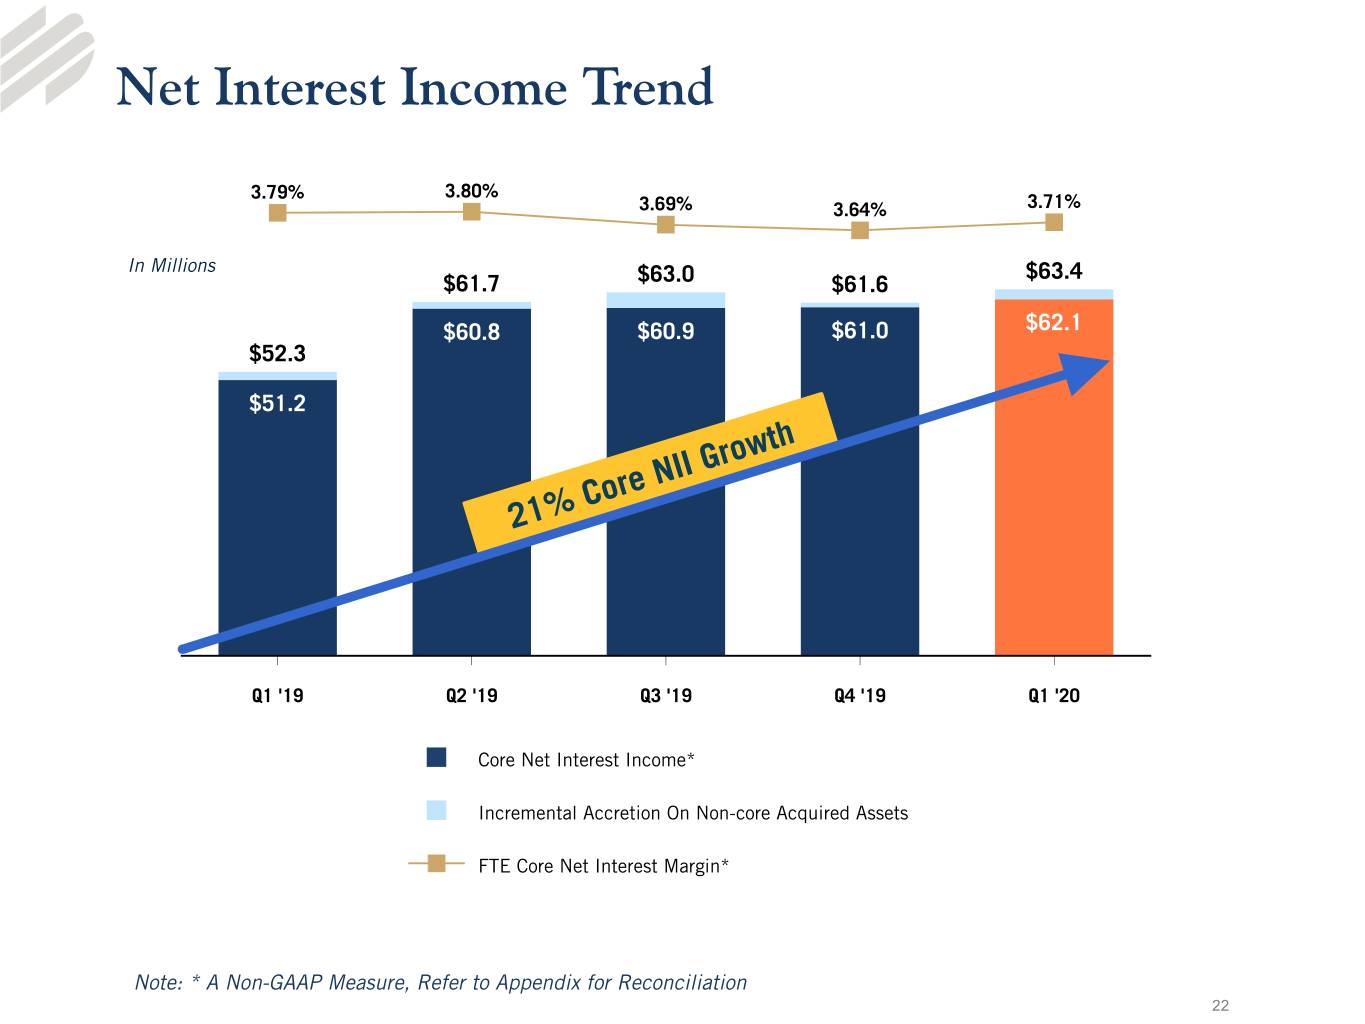
Net Interest Income Trend 3.79% 3.80% 3.69% 3.64% 3.71% In Millions $63.4 $61.7 $63.0 $61.6 $60.8 $60.9 $61.0 $62.1 $52.3 $51.2 21% Core NII Growth Q1 '19 Q2 '19 Q3 '19 Q4 '19 Q1 '20 Core Net Interest Income* Incremental Accretion On Non-core Acquired Assets FTECore Net Interest Margin* Note: * A Non-GAAP Measure, Refer to Appendix for Reconciliation 22
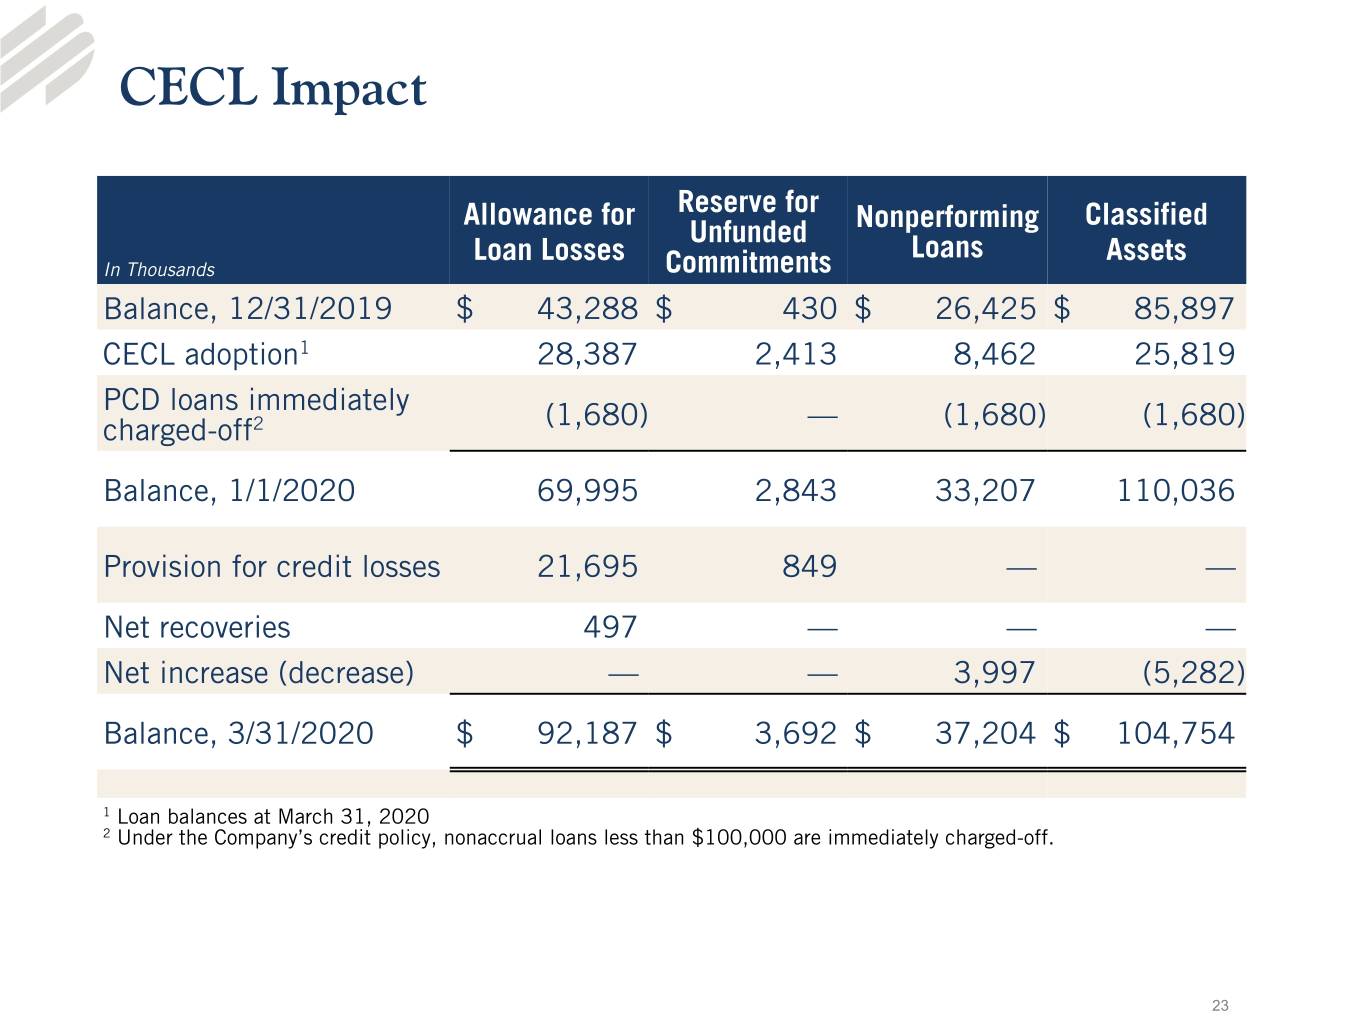
CECL Impact Allowance for Reserve for Classified Unfunded Nonperforming Loan Losses Loans Assets In Thousands Commitments Balance, 12/31/2019 $ 43,288 $ 430 $ 26,425 $ 85,897 CECL adoption1 28,387 2,413 8,462 25,819 PCD loans immediately ) ) ) charged-off2 (1,680 — (1,680 (1,680 Balance, 1/1/2020 69,995 2,843 33,207 110,036 Provision for credit losses 21,695 849 — — Net recoveries 497 — — — Net increase (decrease) — — 3,997 (5,282) Balance, 3/31/2020 $ 92,187 $ 3,692 $ 37,204 $ 104,754 1 Loan balances at March 31, 2020 2 Under the Company’s credit policy, nonaccrual loans less than $100,000 are immediately charged-off. 23
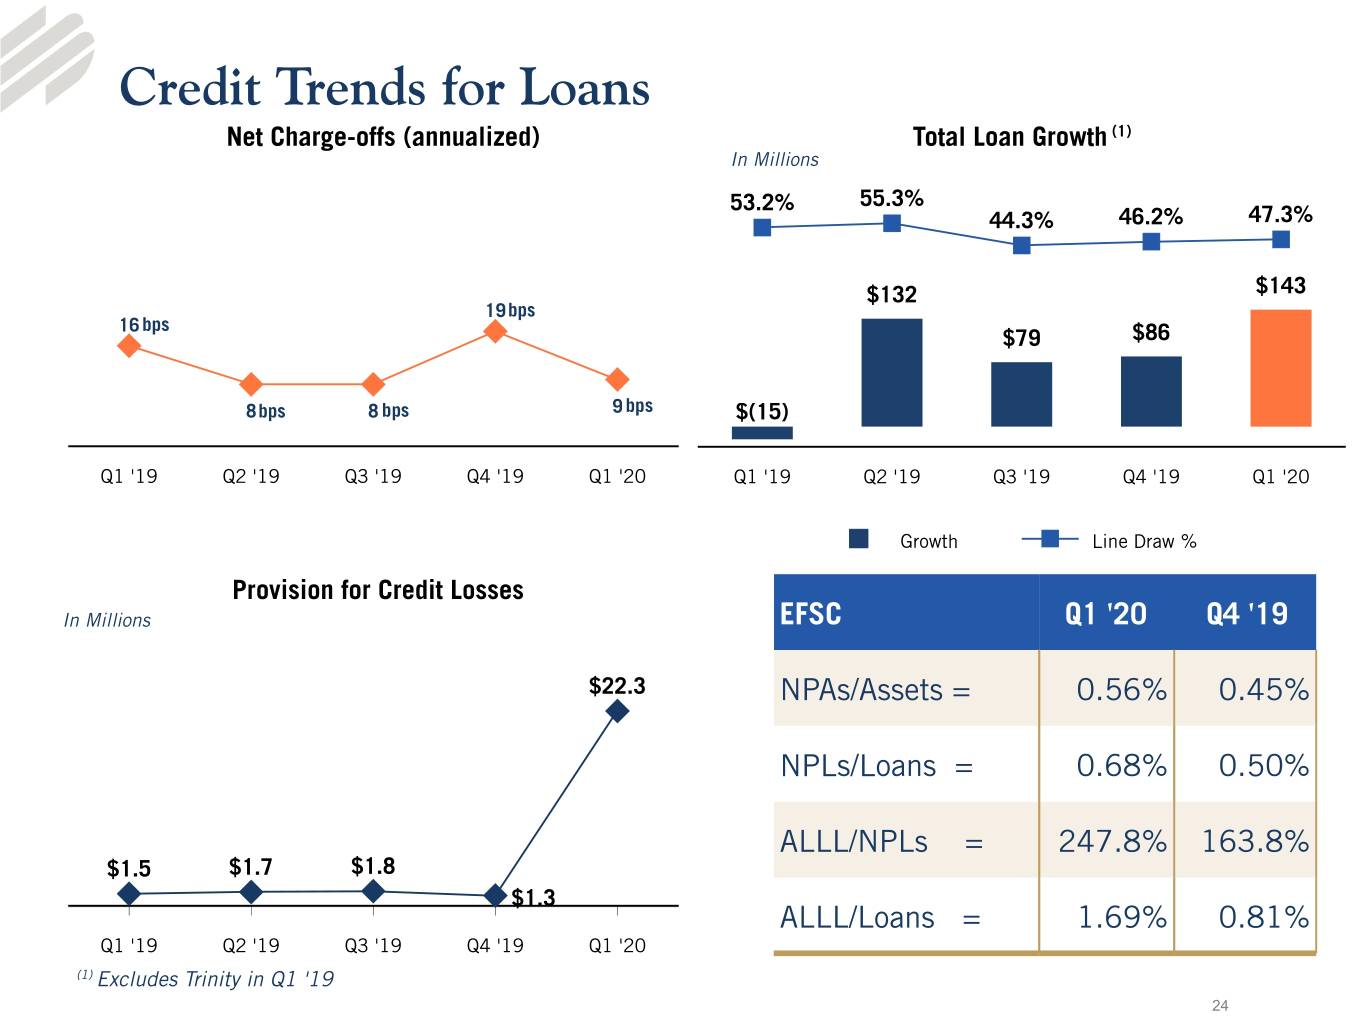
Credit Trends for Loans Net Charge-offs (annualized) Total Loan Growth (1) In Millions 53.2% 55.3% 44.3% 46.2% 47.3% $132 $143 19bps 16 bps $79 $86 8bps 8 bps 9 bps $(15) Q1 '19 Q2 '19 Q3 '19 Q4 '19 Q1 '20 Q1 '19 Q2 '19 Q3 '19 Q4 '19 Q1 '20 Growth Line Draw % Provision for Credit Losses In Millions EFSC Q1 '20 Q4 '19 $22.3 NPAs/Assets = 0.56% 0.45% NPLs/Loans = 0.68% 0.50% ALLL/NPLs = 247.8% 163.8% $1.5 $1.7 $1.8 $1.3 ALLL/Loans = 1.69% 0.81% Q1 '19 Q2 '19 Q3 '19 Q4 '19 Q1 '20 (1) Excludes Trinity in Q1 '19 24
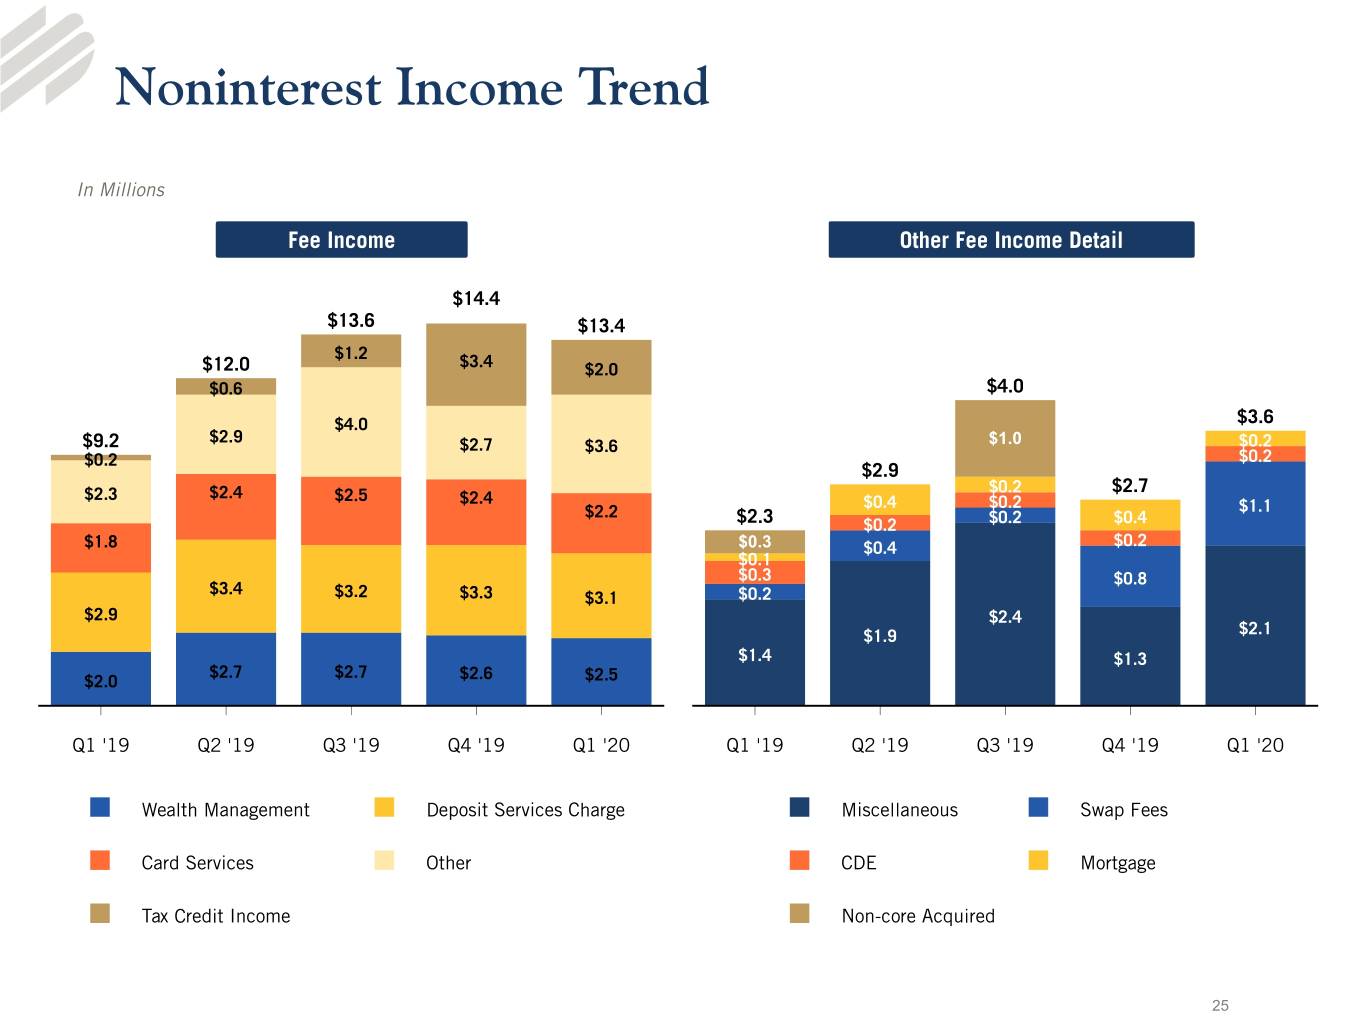
Noninterest Income Trend In Millions Fee Income Other Fee Income Detail $14.4 $13.6 $13.4 $1.2 $12.0 $3.4 $2.0 $0.6 $4.0 $4.0 $3.6 $2.9 $9.2 $2.7 $3.6 $1.0 $0.2 $0.2 $0.2 $2.9 $2.4 $0.2 $2.7 $2.3 $2.5 $2.4 $0.4 $0.2 $2.2 $1.1 $2.3 $0.2 $0.2 $0.4 $1.8 $0.3 $0.4 $0.2 $0.1 $0.3 $0.8 $3.4 $3.2 $3.3 $3.1 $0.2 $2.9 $2.4 $1.9 $2.1 $1.4 $1.3 $2.7 $2.7 $2.0 $2.6 $2.5 Q1 '19 Q2 '19 Q3 '19 Q4 '19 Q1 '20 Q1 '19 Q2 '19 Q3 '19 Q4 '19 Q1 '20 Wealth Management Deposit Services Charge Miscellaneous Swap Fees Card Services Other CDE Mortgage Tax Credit Income Non-core Acquired 25
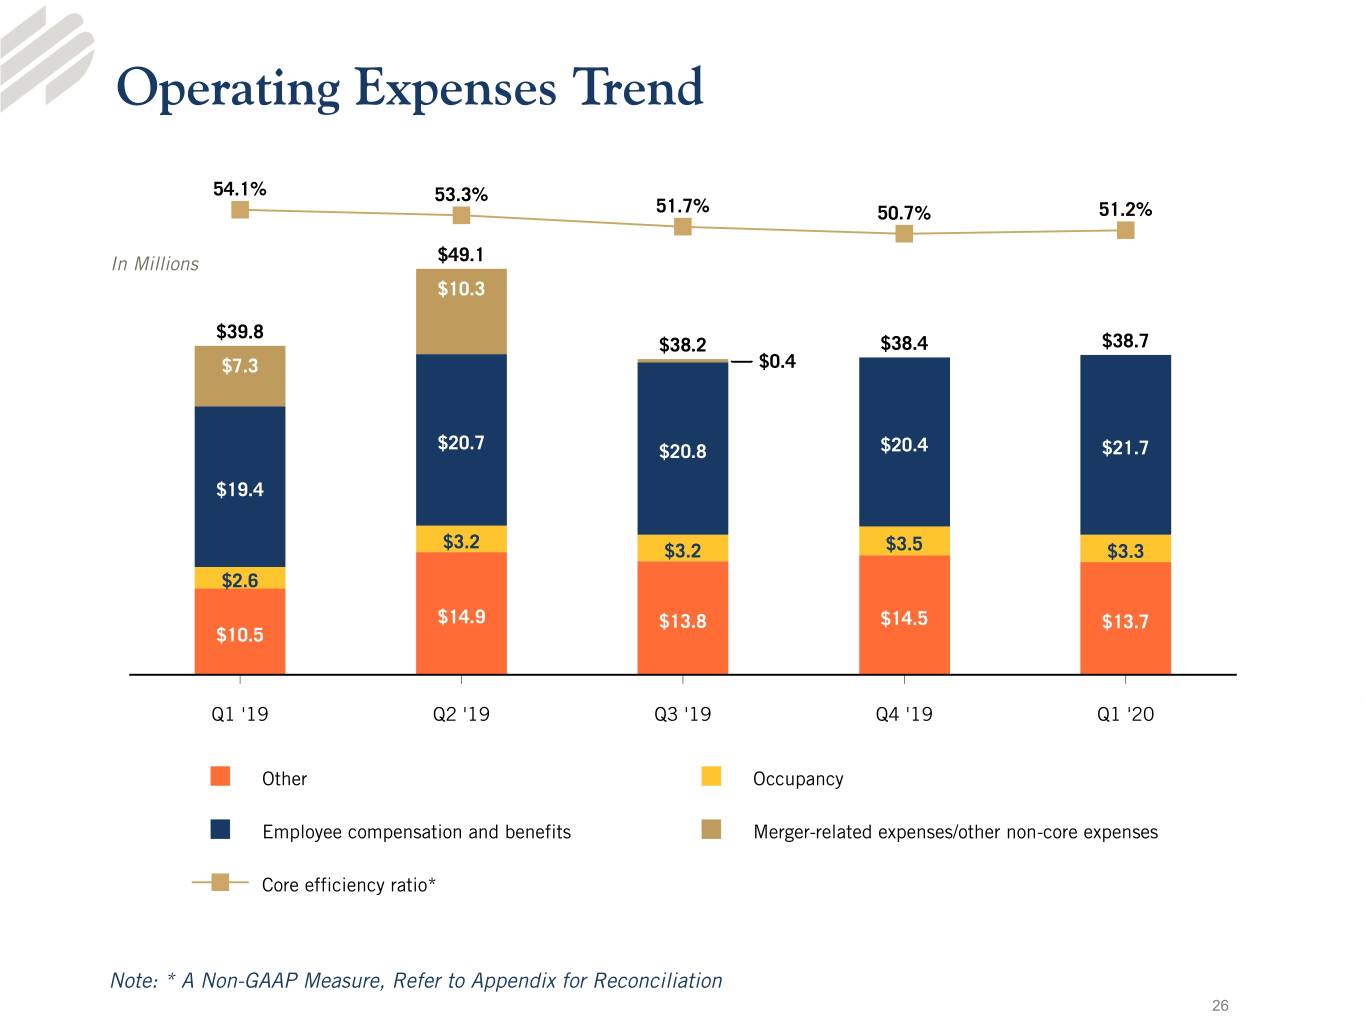
Operating Expenses Trend 54.1% 53.3% 51.7% 50.7% 51.2% In Millions $49.1 $10.3 $39.8 $38.2 $38.4 $38.7 $7.3 $0.4 $20.7 $20.8 $20.4 $21.7 $19.4 $3.2 $3.2 $3.5 $3.3 $2.6 $14.9 $13.8 $14.5 $13.7 $10.5 Q1 '19 Q2 '19 Q3 '19 Q4 '19 Q1 '20 Other Occupancy Employee compensation and benefits Merger-related expenses/other non-core expenses Core efficiency ratio* Note: * A Non-GAAP Measure, Refer to Appendix for Reconciliation 26
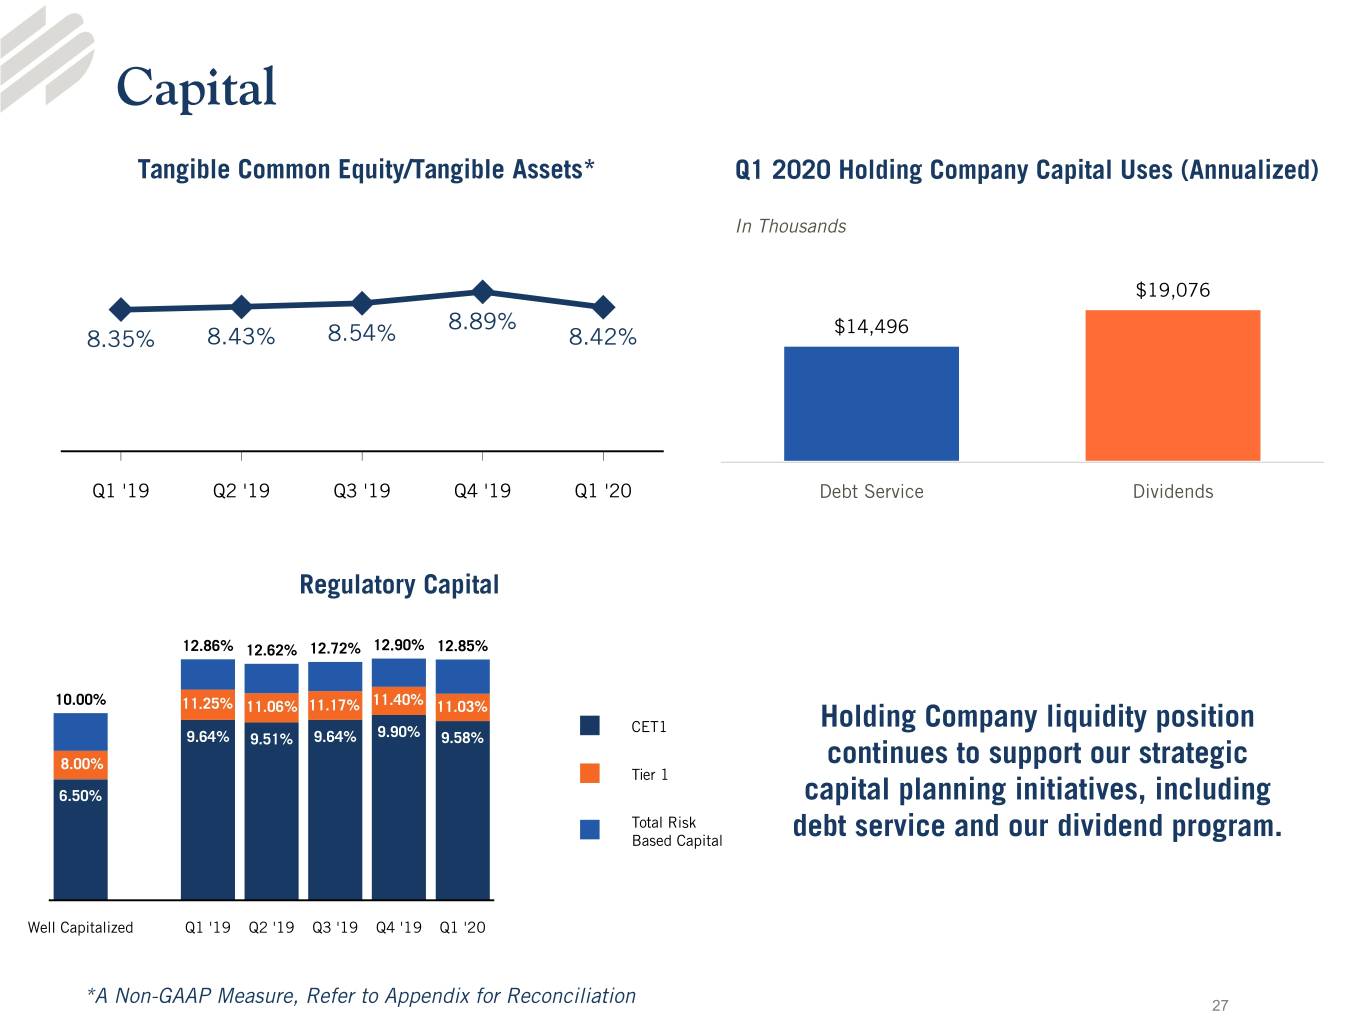
Capital Tangible Common Equity/Tangible Assets* Q1 2020 Holding Company Capital Uses (Annualized) In Thousands $19,076 8.89% $14,496 8.35% 8.43% 8.54% 8.42% Q1 '19 Q2 '19 Q3 '19 Q4 '19 Q1 '20 Debt Service Dividends Regulatory Capital 12.86% 12.62% 12.72% 12.90% 12.85% 10.00% 11.25% 11.06% 11.17% 11.40% 11.03% CET1 Holding Company liquidity position 9.64% 9.51% 9.64% 9.90% 9.58% 8.00% continues to support our strategic Tier 1 6.50% capital planning initiatives, including Total Risk Based Capital debt service and our dividend program. Well Capitalized ' Q1 '19 Q2 '19 Q3 '19 Q4 '19 Q1 '20 *A Non-GAAP Measure, Refer to Appendix for Reconciliation 27
First Quarter 2020 Earnings Webcast Appendix
Use of Non-GAAP Financial Measures The Company’s accounting and reporting policies conform to generally accepted accounting principles in the United States (“GAAP”) and the prevailing practices in the banking industry. However, the Company provides other financial measures, such as adjusted EPS, core net interest income, core net interest margin, tangible common equity, core efficiency ratios, ROATCE, adjusted ROAA, adjusted ROAE, and adjusted ROATCE, and the tangible common equity ratio, in this release that are considered “non-GAAP financial measures.” Generally, a non-GAAP financial measure is a numerical measure of a company’s financial performance, financial position, or cash flows that exclude (or include) amounts that are included in (or excluded from) the most directly comparable measure calculated and presented in accordance with GAAP. The Company considers its adjusted EPS, core net interest income, core net interest margin, core efficiency ratio, adjusted ROAA, adjusted ROAE, ROATCE, adjusted ROATCE, and the tangible common equity ratio, collectively “core performance measures,” presented in this earnings release and the included tables as important measures of financial performance, even though they are non-GAAP measures, as they provide supplemental information by which to evaluate the impact of non-core acquired loans, which were acquired from the FDIC and previously covered by loss share agreements, and the related income and expenses, the impact of certain non-comparable items, and the Company’s operating performance on an ongoing basis. Core performance measures include contractual interest on non-core acquired loans, but exclude incremental accretion on these loans. Core performance measures also exclude expenses directly related to non-core acquired loans. Core performance measures also exclude certain other income and expense items, such as merger related expenses, facilities charges, and the gain or loss on sale of investment securities, the Company believes to be not indicative of or useful to measure the Company’s operating performance on an ongoing basis. The attached tables contain a reconciliation of these core performance measures to the GAAP measures. The Company believes that the tangible common equity ratio provides useful information to investors about the Company’s capital strength even though it is considered to be a non-GAAP financial measure and is not part of the regulatory capital requirements to which the Company is subject. The Company believes these non-GAAP measures and ratios, when taken together with the corresponding GAAP measures and ratios, provide meaningful supplemental information regarding the Company’s performance and capital strength. The Company’s management uses, and believes that investors benefit from referring to, these non-GAAP measures and ratios in assessing the Company’s operating results and related trends and when forecasting future periods. However, these non-GAAP measures and ratios should be considered in addition to, and not as a substitute for or preferable to, ratios prepared in accordance with GAAP. In the attached tables, the Company has provided a reconciliation of, where applicable, the most comparable GAAP financial measures and ratios to the non-GAAP financial measures and ratios, or a reconciliation of the non-GAAP calculation of the financial measures for the periods indicated. Peer group data consists of the median of publicly traded banks with total assets from $2-$10 billion with commercial loans greater than 20% and consumer loans less than 10%. 29
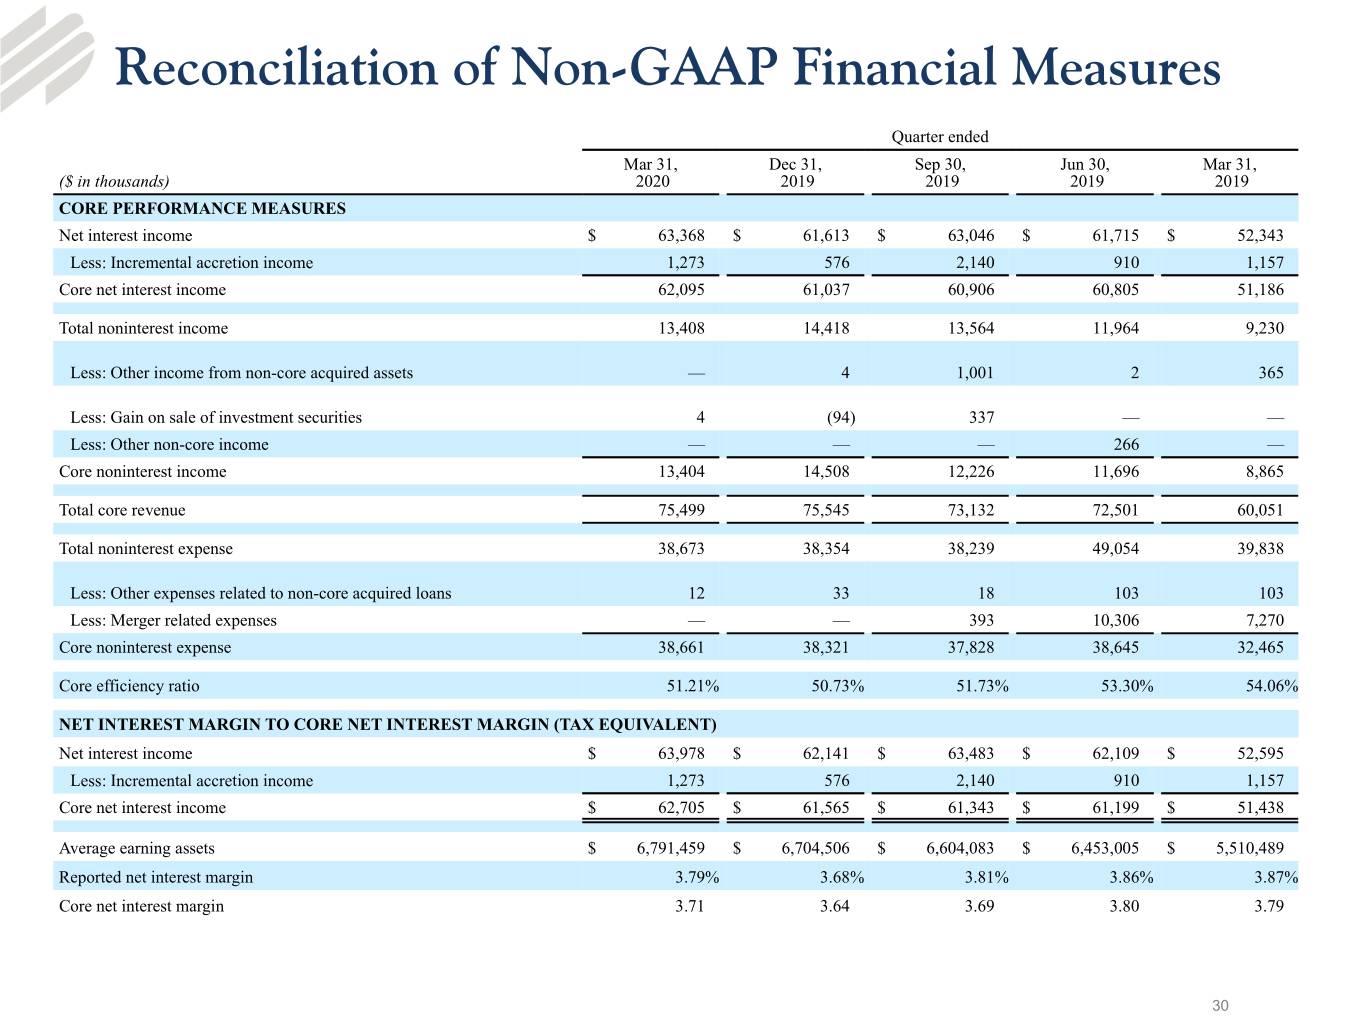
Reconciliation of Non-GAAP Financial Measures Quarter ended Mar 31, Dec 31, Sep 30, Jun 30, Mar 31, ($ in thousands) 2020 2019 2019 2019 2019 CORE PERFORMANCE MEASURES Net interest income $ 63,368 $ 61,613 $ 63,046 $ 61,715 $ 52,343 Less: Incremental accretion income 1,273 576 2,140 910 1,157 Core net interest income 62,095 61,037 60,906 60,805 51,186 Total noninterest income 13,408 14,418 13,564 11,964 9,230 Less: Other income from non-core acquired assets — 4 1,001 2 365 Less: Gain on sale of investment securities 4 (94) 337 — — Less: Other non-core income — — — 266 — Core noninterest income 13,404 14,508 12,226 11,696 8,865 Total core revenue 75,499 75,545 73,132 72,501 60,051 Total noninterest expense 38,673 38,354 38,239 49,054 39,838 Less: Other expenses related to non-core acquired loans 12 33 18 103 103 Less: Merger related expenses — — 393 10,306 7,270 Core noninterest expense 38,661 38,321 37,828 38,645 32,465 Core efficiency ratio 51.21% 50.73% 51.73% 53.30% 54.06% NET INTEREST MARGIN TO CORE NET INTEREST MARGIN (TAX EQUIVALENT) Net interest income $ 63,978 $ 62,141 $ 63,483 $ 62,109 $ 52,595 Less: Incremental accretion income 1,273 576 2,140 910 1,157 Core net interest income $ 62,705 $ 61,565 $ 61,343 $ 61,199 $ 51,438 Average earning assets $ 6,791,459 $ 6,704,506 $ 6,604,083 $ 6,453,005 $ 5,510,489 Reported net interest margin 3.79% 3.68% 3.81% 3.86% 3.87% Core net interest margin 3.71 3.64 3.69 3.80 3.79 30
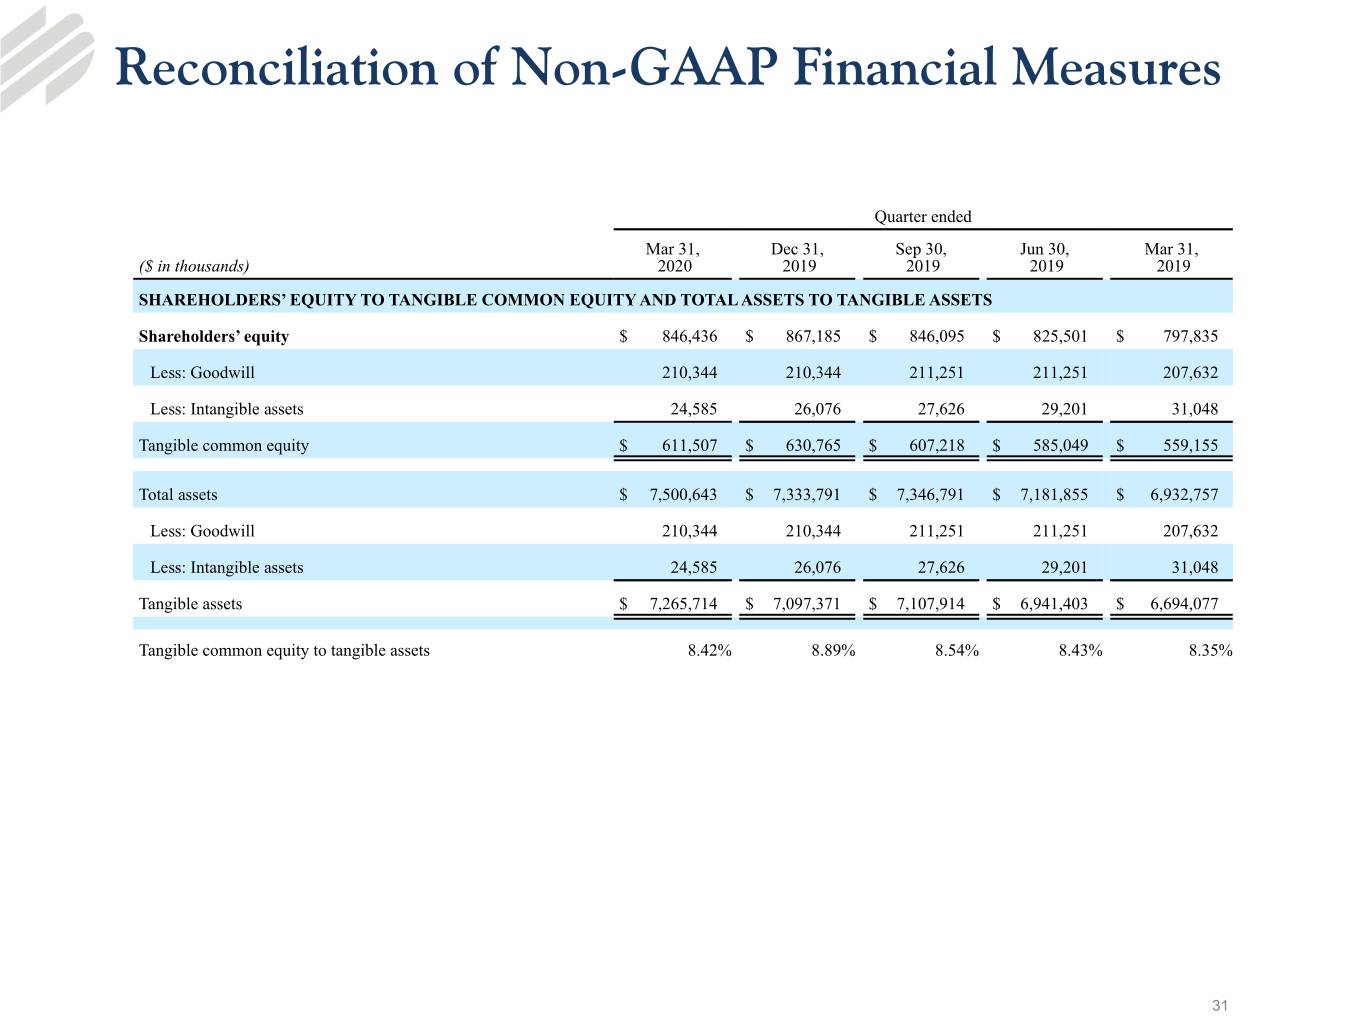
Reconciliation of Non-GAAP Financial Measures Quarter ended Mar 31, Dec 31, Sep 30, Jun 30, Mar 31, ($ in thousands) 2020 2019 2019 2019 2019 SHAREHOLDERS’ EQUITY TO TANGIBLE COMMON EQUITY AND TOTAL ASSETS TO TANGIBLE ASSETS Shareholders’ equity $ 846,436 $ 867,185 $ 846,095 $ 825,501 $ 797,835 Less: Goodwill 210,344 210,344 211,251 211,251 207,632 Less: Intangible assets 24,585 26,076 27,626 29,201 31,048 Tangible common equity $ 611,507 $ 630,765 $ 607,218 $ 585,049 $ 559,155 Total assets $ 7,500,643 $ 7,333,791 $ 7,346,791 $ 7,181,855 $ 6,932,757 Less: Goodwill 210,344 210,344 211,251 211,251 207,632 Less: Intangible assets 24,585 26,076 27,626 29,201 31,048 Tangible assets $ 7,265,714 $ 7,097,371 $ 7,107,914 $ 6,941,403 $ 6,694,077 Tangible common equity to tangible assets 8.42% 8.89% 8.54% 8.43% 8.35% 31
First Quarter 2020 Earnings Webcast Q & A