Operator
Good morning, everyone, and welcome to the FB Financial First Quarter 2026 Earnings Call. Please note this event is being recorded. At this time, I'd like to turn the conference call over to Rachel Doreski with FB Financial. Please go ahead.
Good morning, and welcome to FB Financial Corporation's First Quarter 2026 Earnings Conference Call. Hosting the call today from FB Financial are Chris Holmes, President and Chief Executive Officer, and Michael Mati, Chief Operating and Financial Officer. Please note, FB Financial's earnings release, supplemental financial information, and this morning's presentation are available on the Investor Relations page of the company's website at www.firstbankonline.com and on the Securities and Exchange Commission's website at www.sec.gov. Today's call is being recorded and will be available for replay on FB Financial's website approximately an hour after the conclusion of the call. At this time, all participants have been placed in a listen-only mode. The call will open for questions after the presentation. During the presentation, FB Financial may make comments which constitute forward-looking statements under the Federal Securities Laws. Forward-looking statements are based on management's current expectations and assumptions and are subject to risks, uncertainties, and other factors that may cause actual results in performance or achievements of FB Financial to differ materially from any results expressed or implied by such forward-looking statements. Many of such factors are beyond FB Financial's ability to control or predict, and listeners are cautioned not to put undue reliance on such forward-looking statements. A more detailed description of these and other risks that may cause actual results to materially differ from expectations is contained in FB Financial's periodic and current reports filed with the SEC, including FB Financial's most recent form, 10K. Except, as required by law, FB Financial disclaims any obligation to update or revise any forward-looking statements contained in this presentation, whether as a result of new information, future events, or otherwise. In addition, these remarks may include certain non-GAAP financial measures as defined by SEC Regulation G. A presentation of the most directly comparable GAAP financial measures and a reconciliation of the non-GAAP measures to comparable GAAP measures is available in FB Financial's Earnings Release Supplemental Financial Information in this morning's presentation, which are all available on the Investor Relations page of the company's website at www.firstbankonline.com and on the SEC's website at www.sec.gov. I would now like to turn the presentation over to Mr. Chris Holmes, FB Financial's President and CEO.
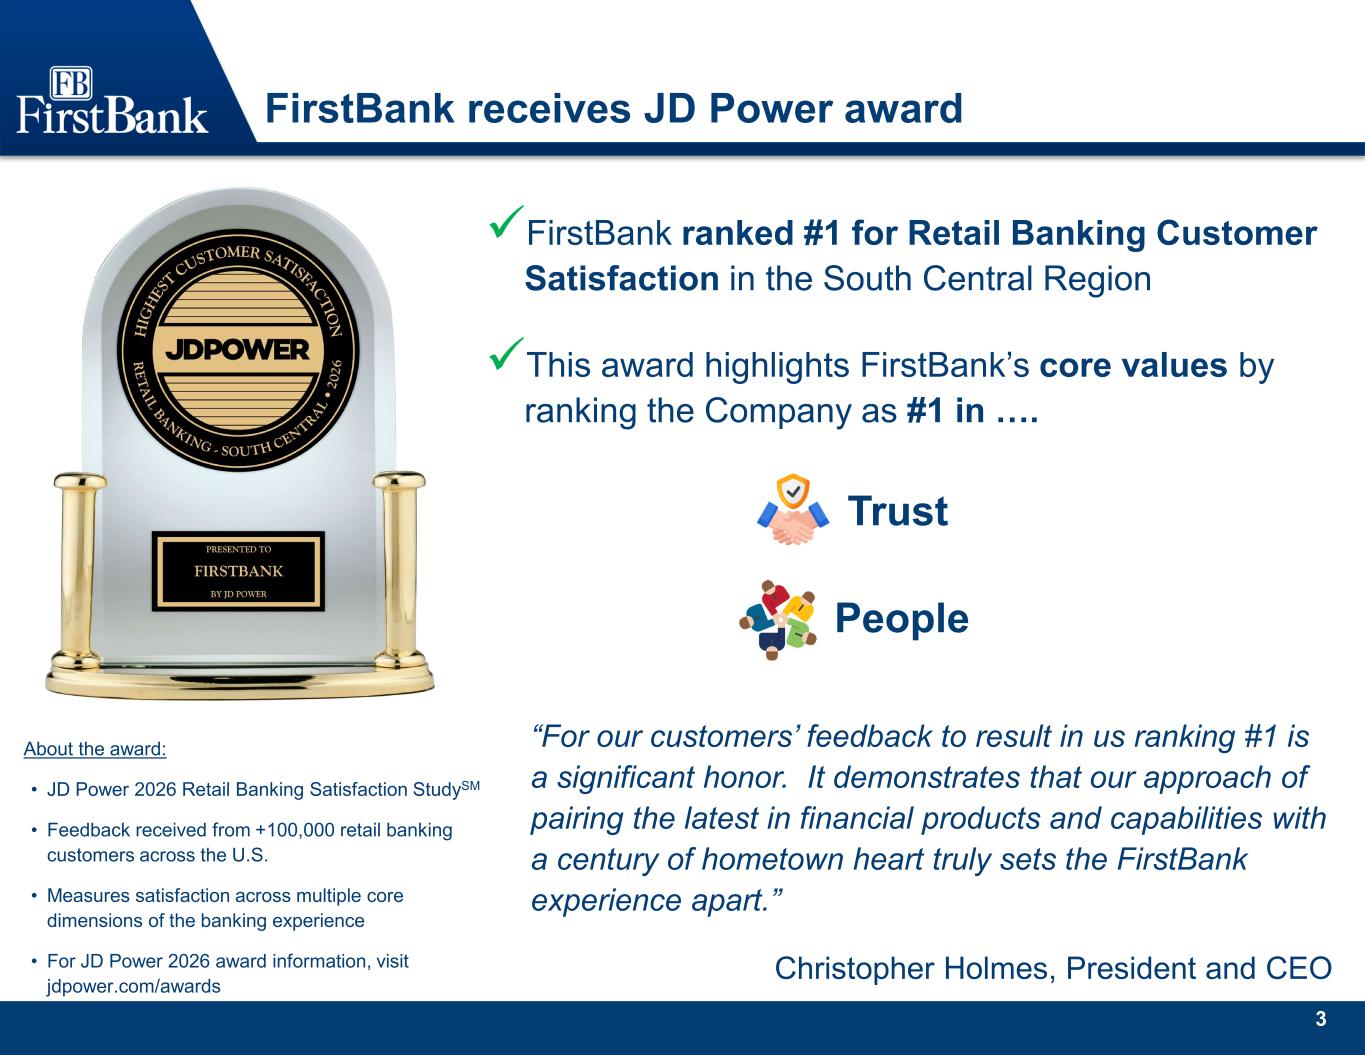
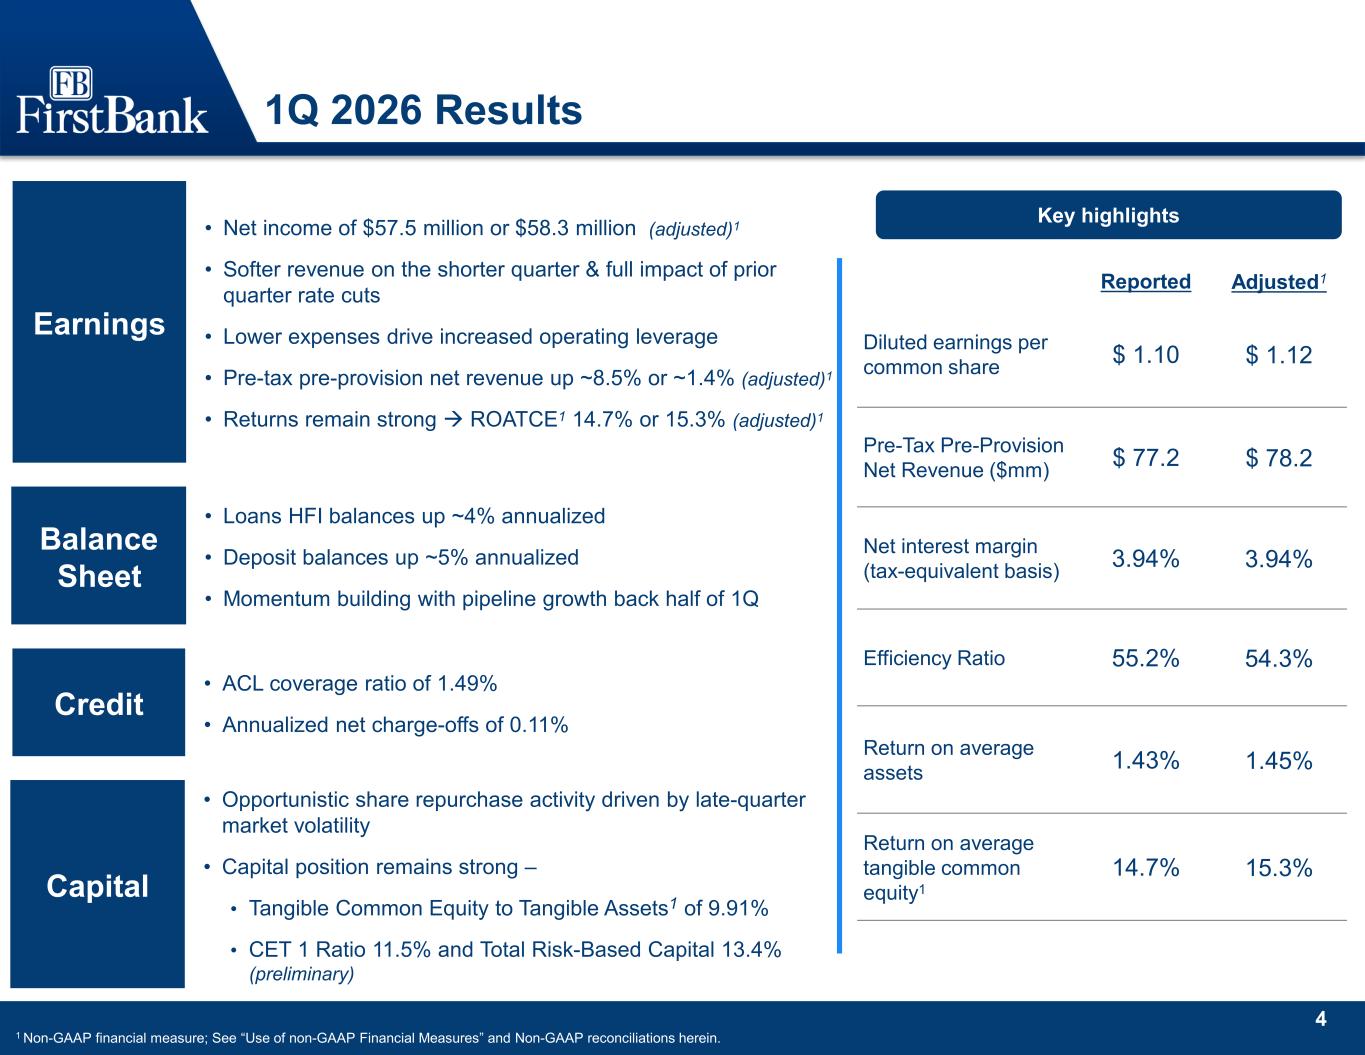
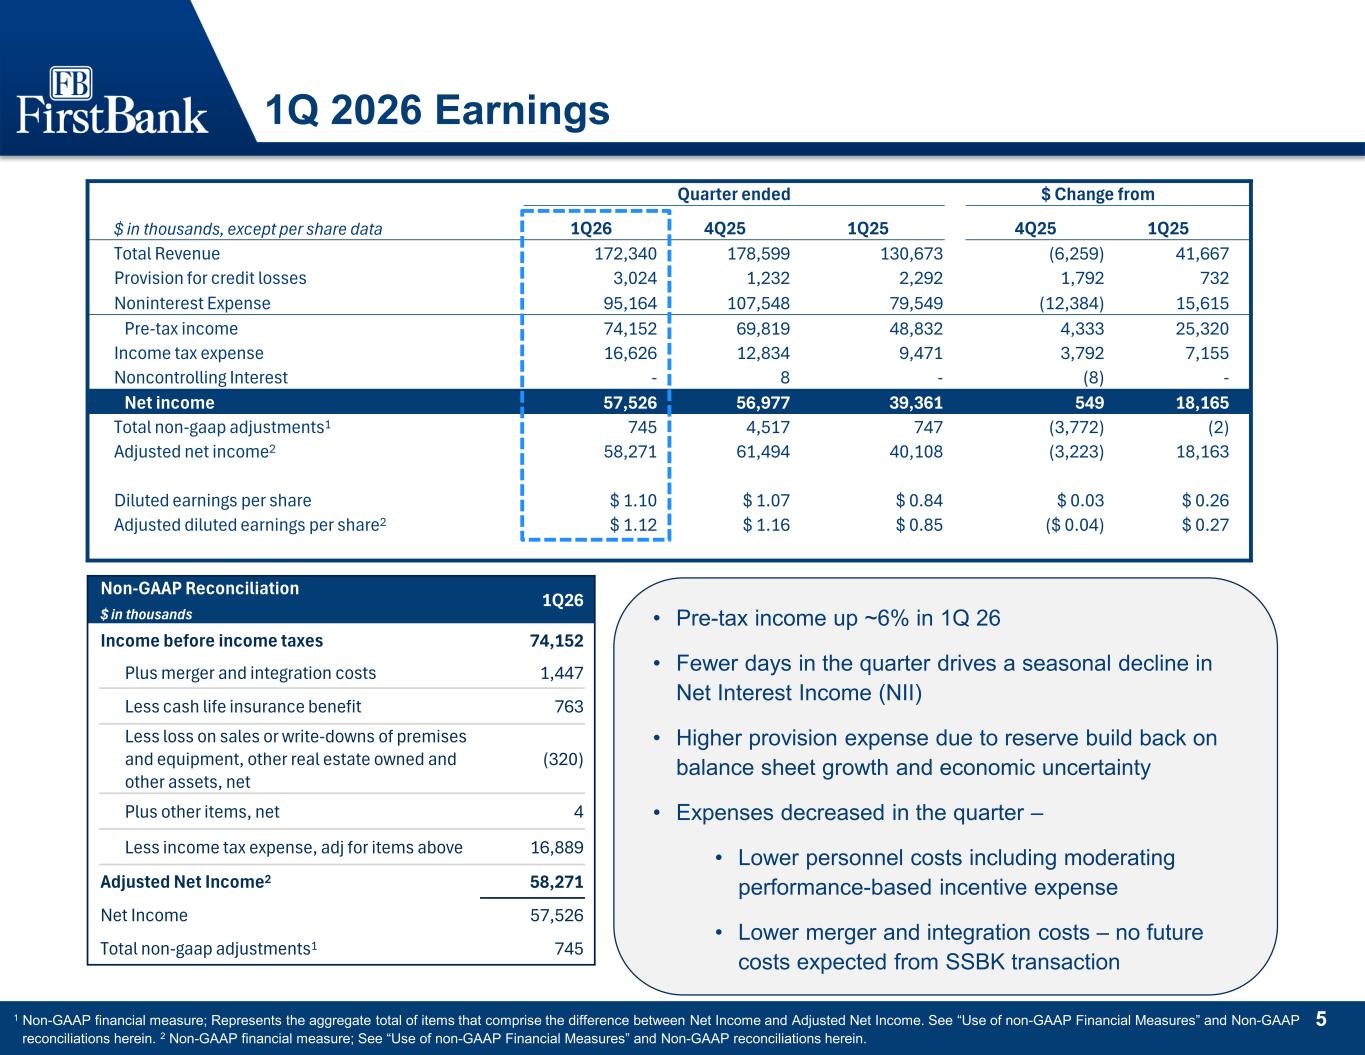
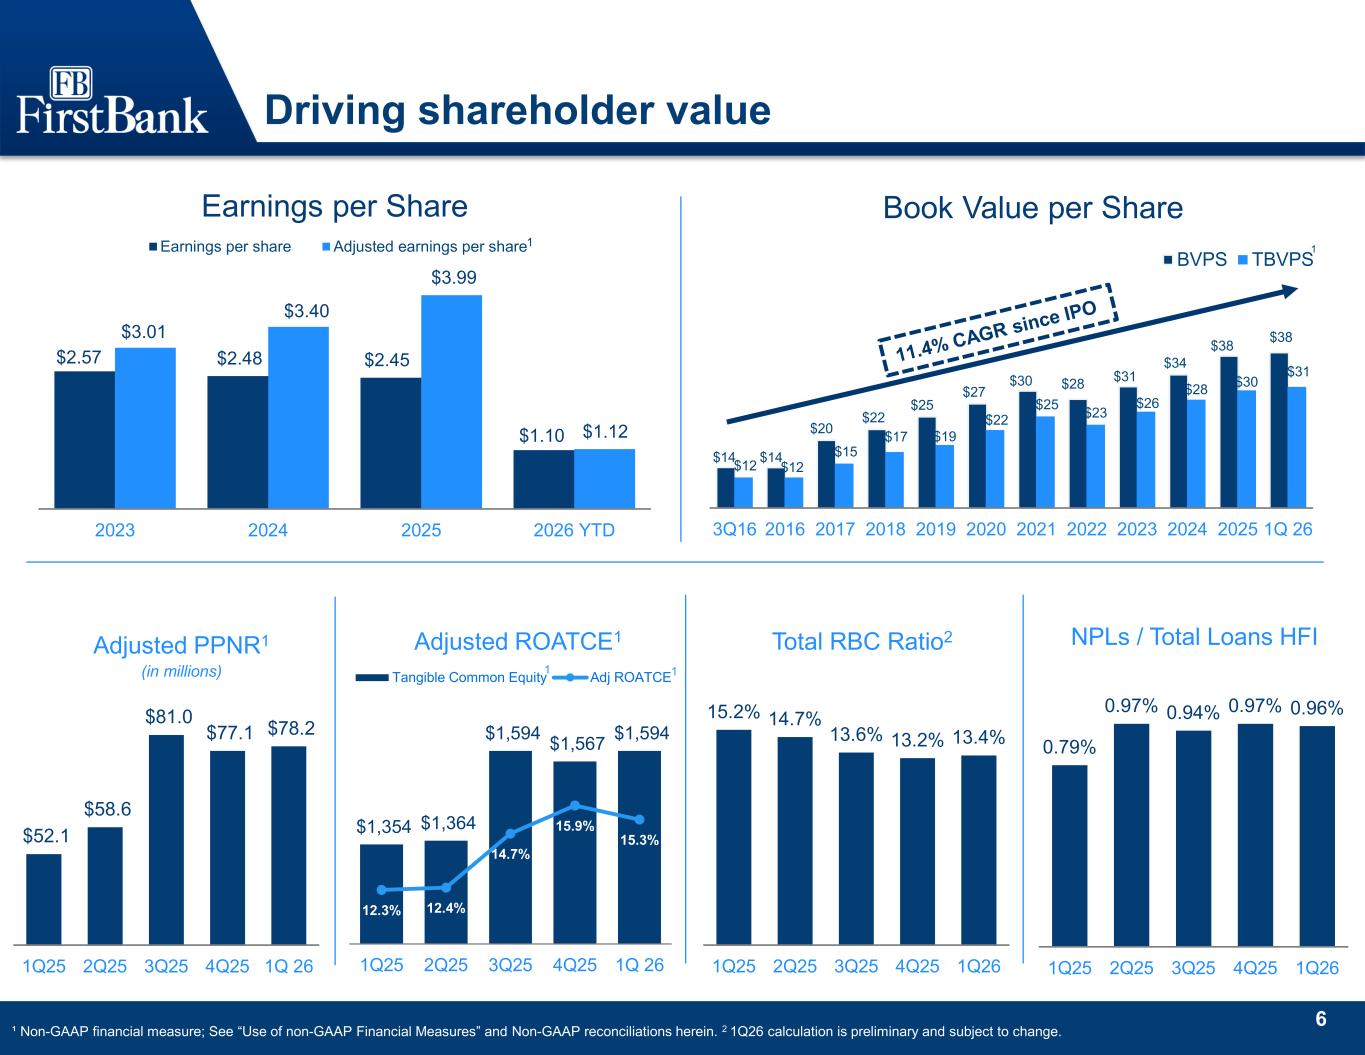
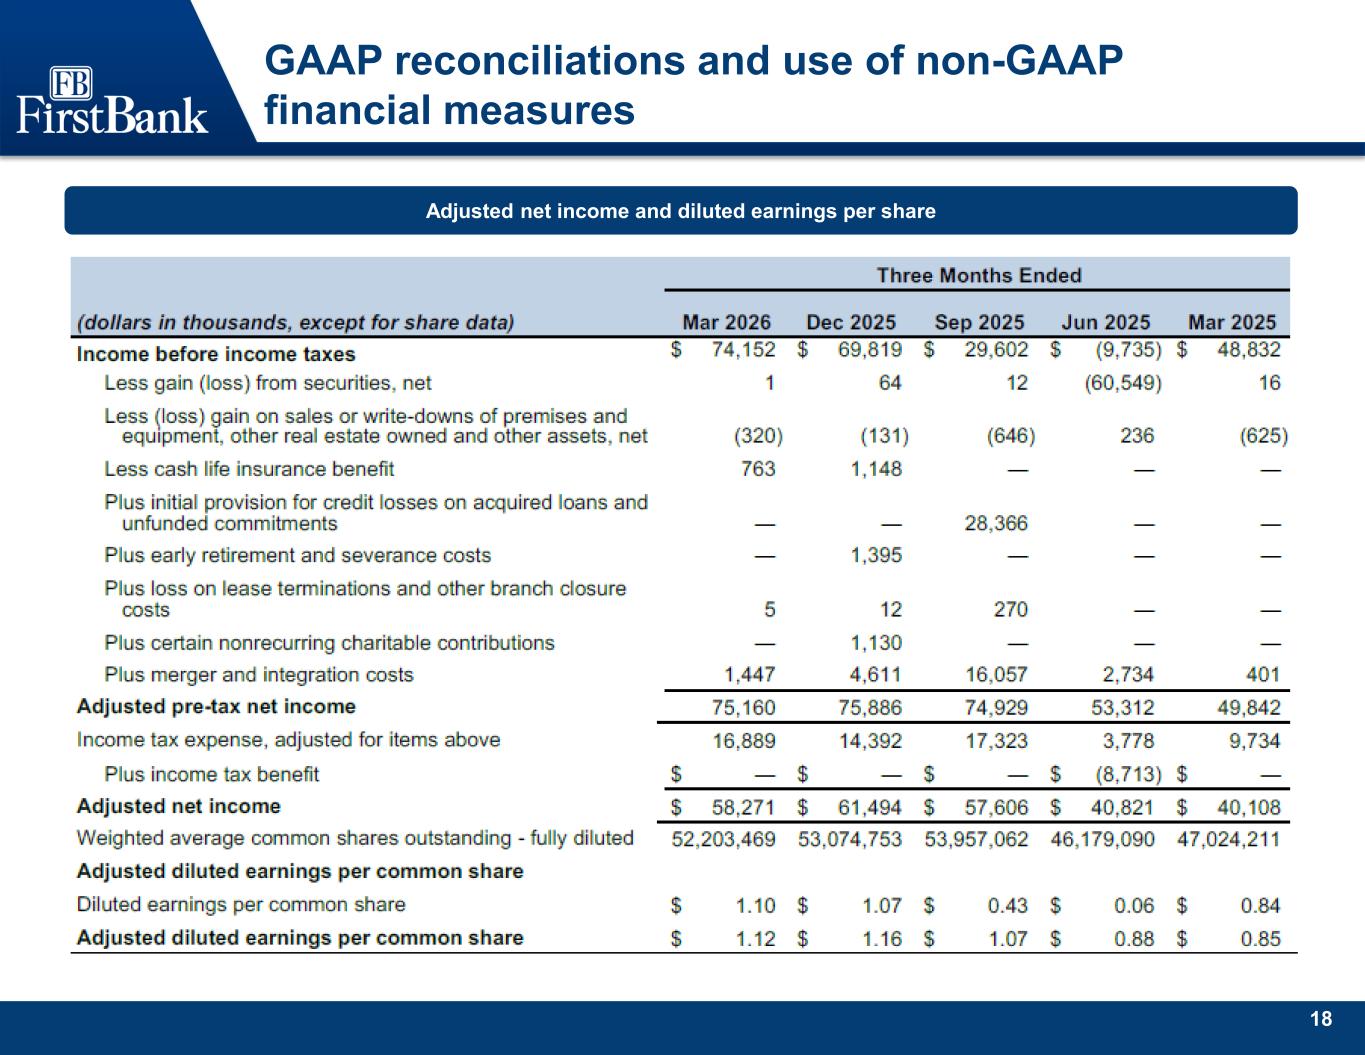
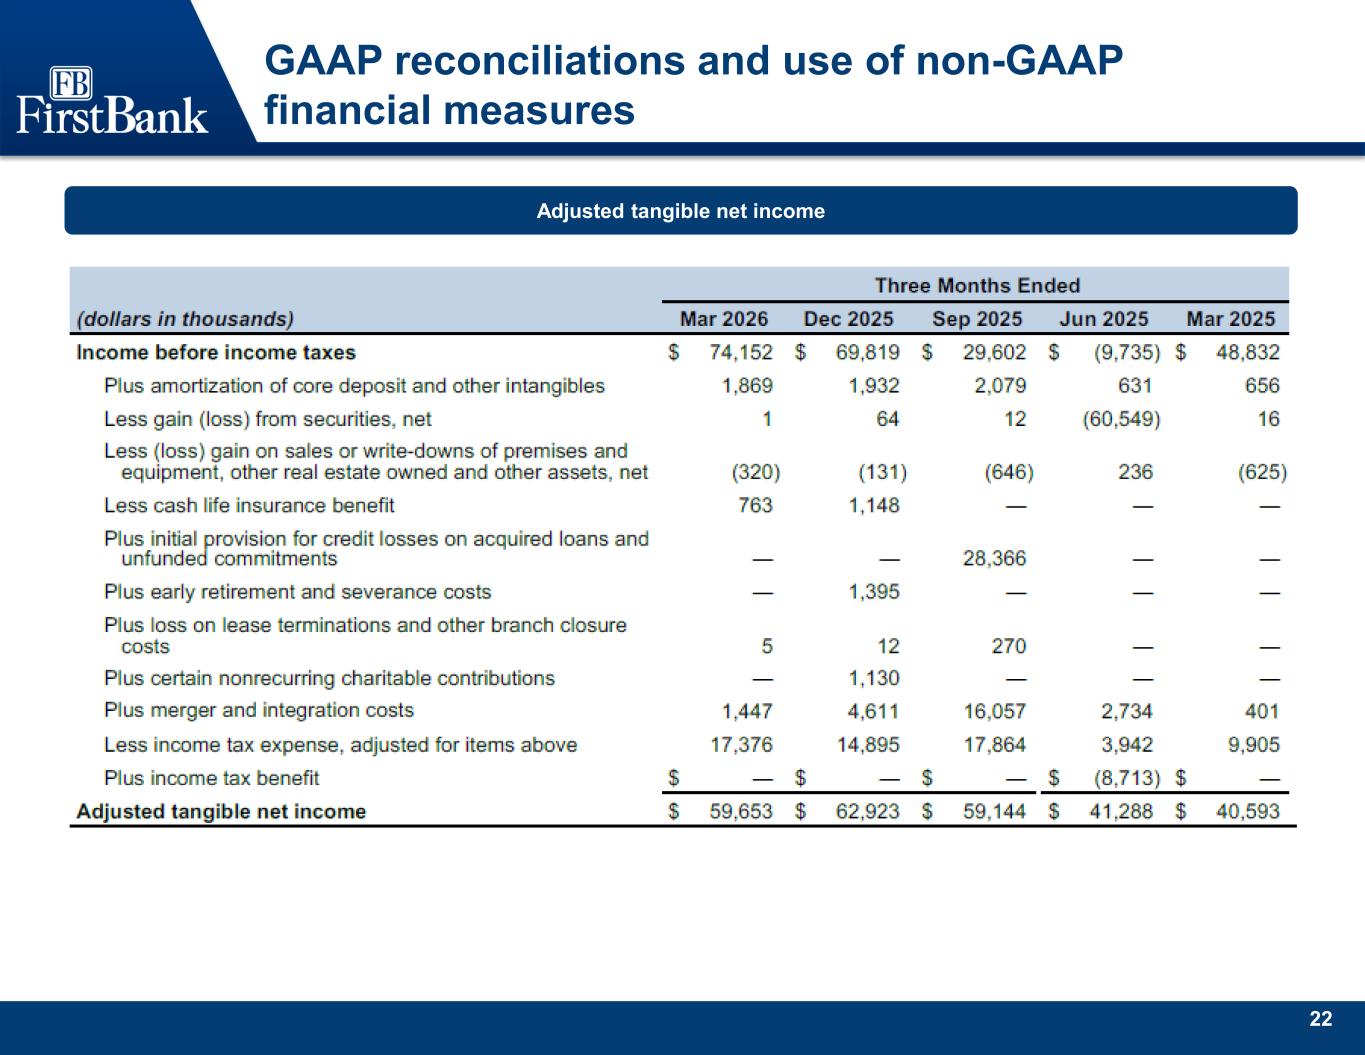
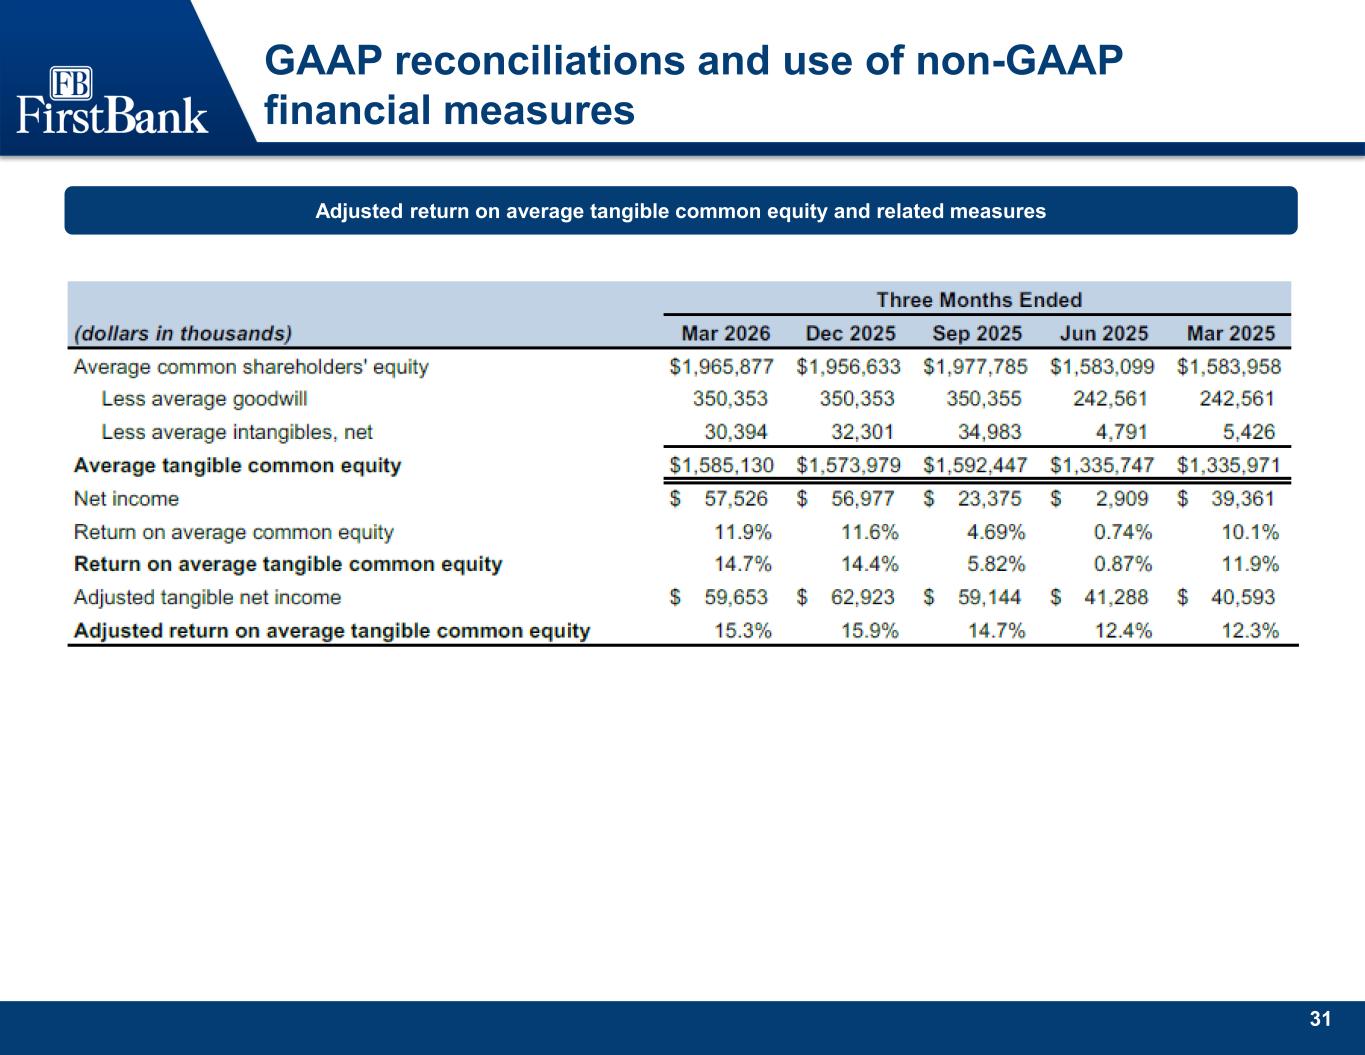
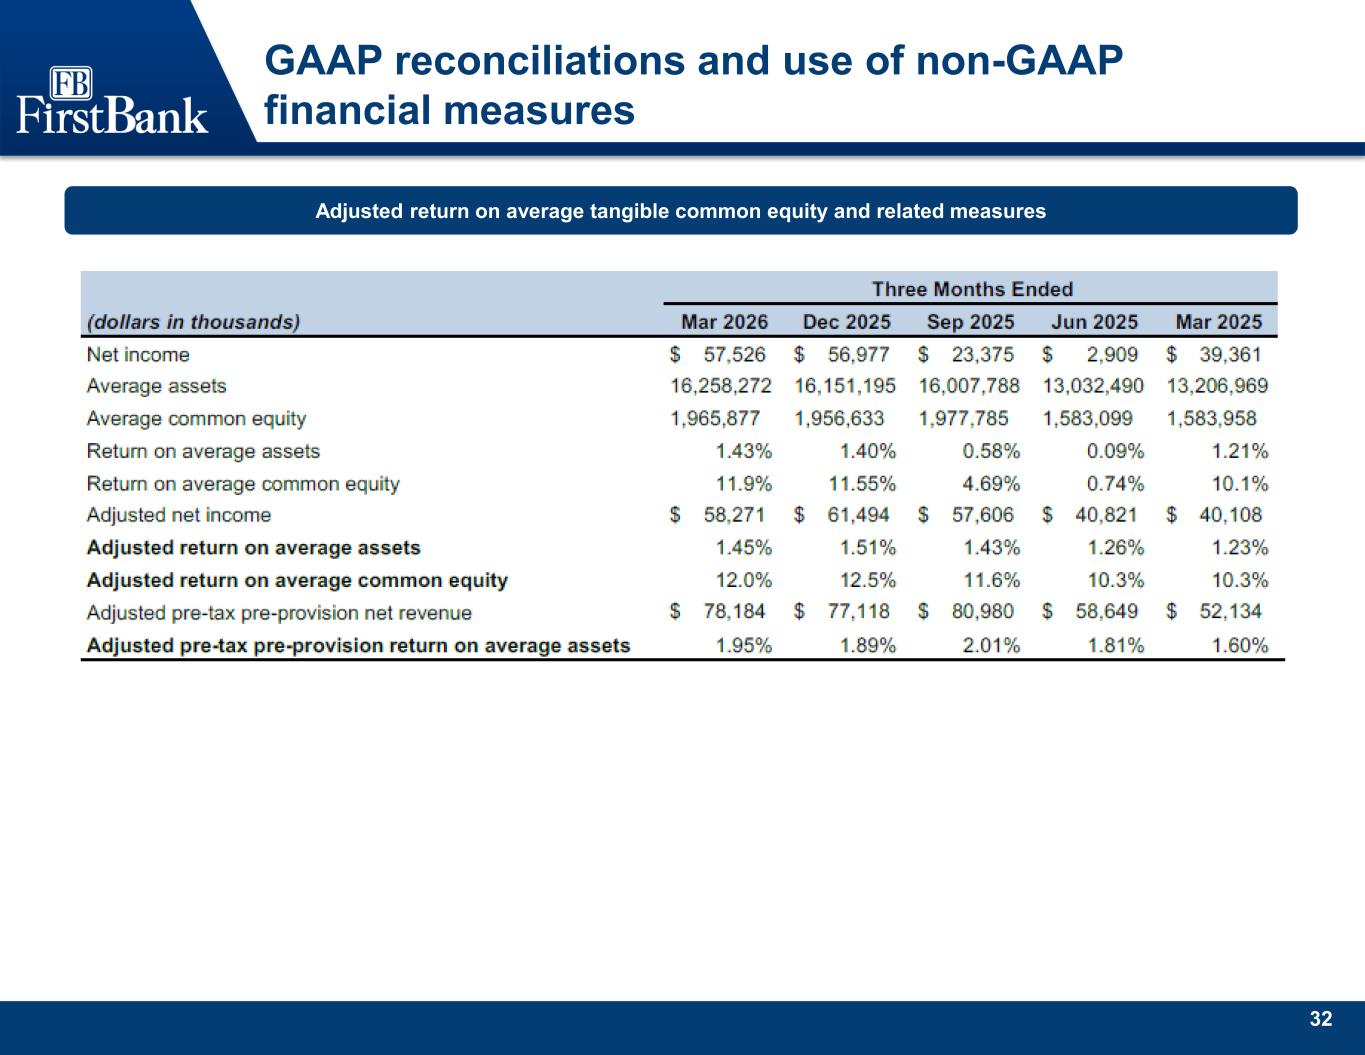
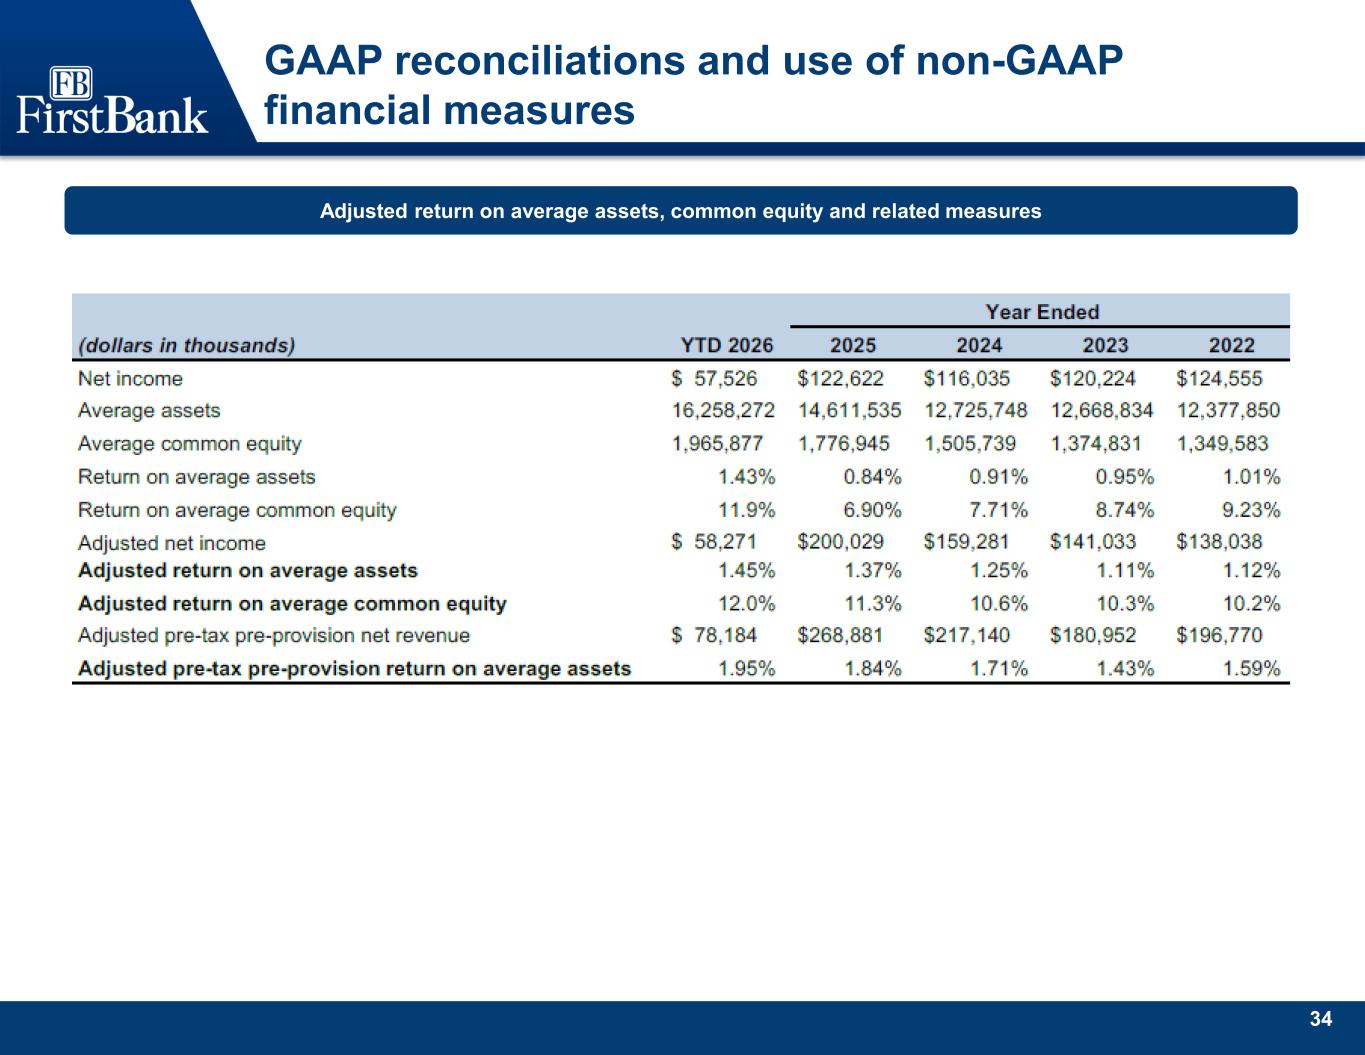
All right. Good morning. Thank you, Rachel. Thanks to everybody for joining the call this morning. And I'll always thank you for your interest in FB Financial. I want to start today's call by calling attention to a distinguished award the company received recently and what it means to First Bank. The bank received J.D. Power's Retail Banking Award in the South Central Region for placing number one among the banks in the region for customer satisfaction. J.D. Power surveyed over 100,000 banking customers across our region, surveying them about their satisfaction with their primary bank. And when the results were tabulated, First Bank ranked number one on the list for overall customer satisfaction. First Bank also ranked number one in the subcategories of client trust and quality of our people. What made this award even more gratifying was that we weren't even aware that our customers were being surveyed. So the ranking is a result of our natural service behavior and not something that resulted from any special preparation. As bank investors, we watch every basis point of margin, efficiency, return, et cetera, and every penny of EPS. But we can struggle to find effective relative measures of the actual driver of superior sustainable bank performance, which is our ability to attract, satisfy, and retain bank clients. This award is independent, tangible verification of what I've known about our team. that's when stacked against the competition, we win. I want to thank our clients who participated in the process and our associates who are the first bank story and who take such outstanding care of our clients. You are literally the best at what you do, and I'm proud to be on the team with you. So with that, now let me get into the quarter. We reported EPS of $1.10 and adjusted EPS of $1.12 and have grown our tangible book value per share, excluding the impact of AOCI, at a compounded annual growth rate of 11.6% since our IPO back in 2016. Our net income was $57.5 million or $58.3 million on an adjusted basis, and our pre-tax, pre-provision net revenue, or we may refer to as PPNR during the call, was $77.2 million or $78.2 million on an adjusted basis. So even with two fewer days in the quarter, we were able to grow our pre-tax pre-provision net revenue versus the prior quarter. Revenue declined slightly during the quarter, but expenses had an even greater decrease to keep our net income and profitability metrics in line with our expectations. We kept our PPNR return on average assets near a benchmark range of 2%, coming in at 1.93% or 1.95% adjusted. We're pleased with our returns, and as Michael will cover in his comments, our growth gained momentum during the quarter, giving us optimism about the remainder of the year. We're now a quarter of the way through 2026. We continue to believe it's a great time to be at First Bank. Our strategic pillars of award-winning client experience, high associate engagement, operational efficiency, and elite financial performance are all working together to grow our franchise and position us for continued success. When you add that our geography is one of the best in the country and our size is optimal to allow for both capacity and agility, we're optimistic about our path to creating shareholder value, both short-term and long-term. So, before I turn the call over to Michael, I do want to acknowledge that, like all of you, we're following the macro events of our times closely. But most of these things, like geopolitical conflicts, technology disruptions, economic shocks and interest rate volatility are things that we have to react to versus exercise control over. What we do control is our position and preparation for a range of circumstances and risk scenarios with active improvement management of our robust capital, robust liquidity, and our high reserve levels.
Speaker 4
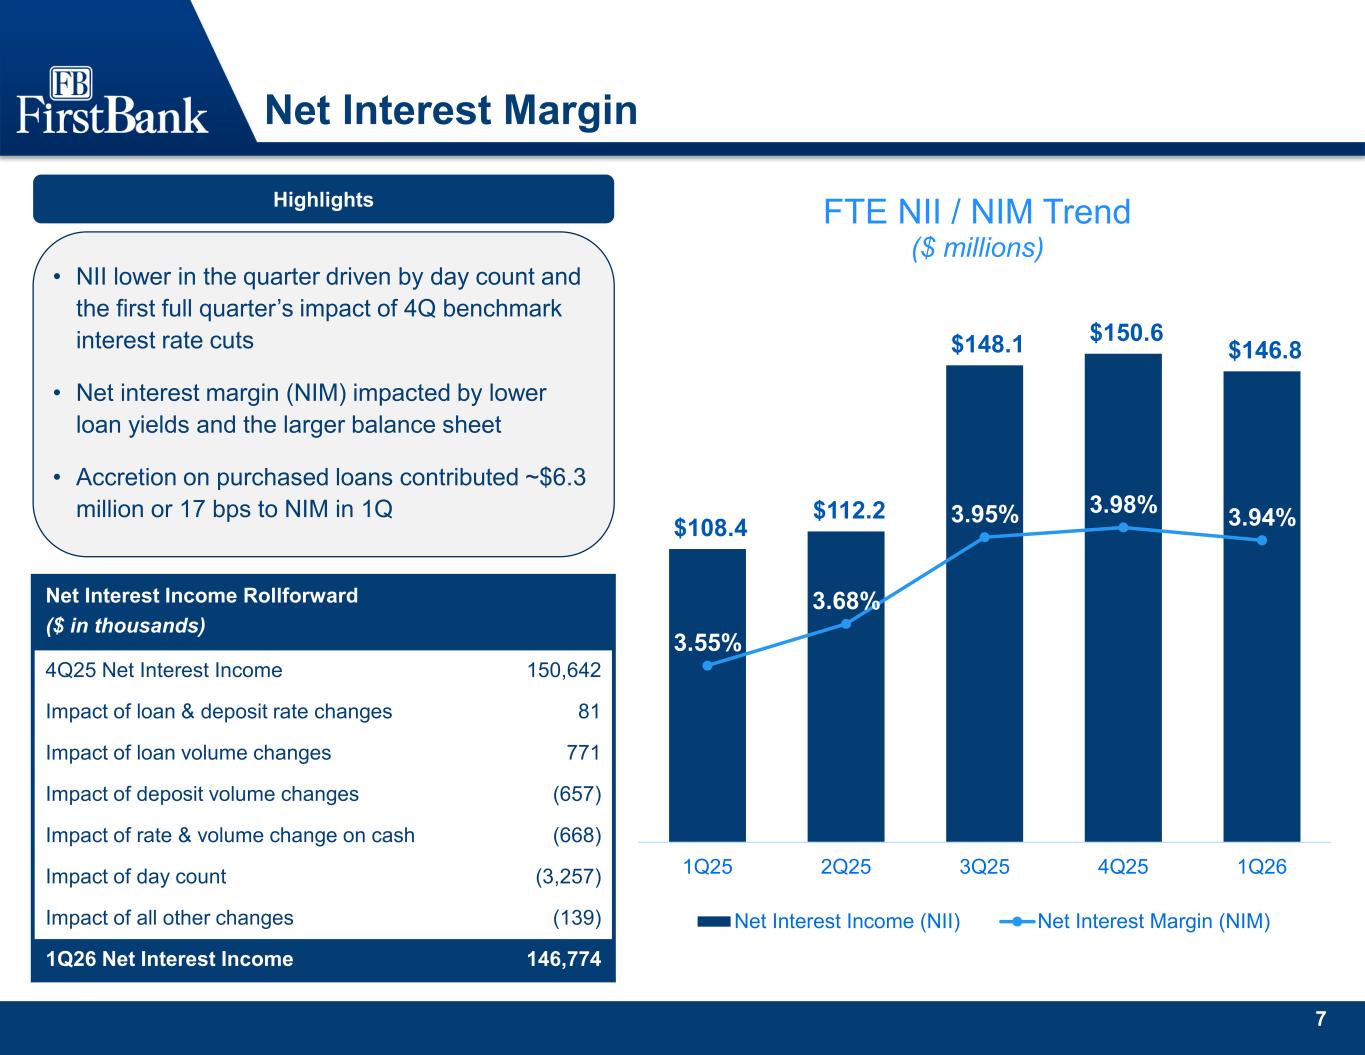
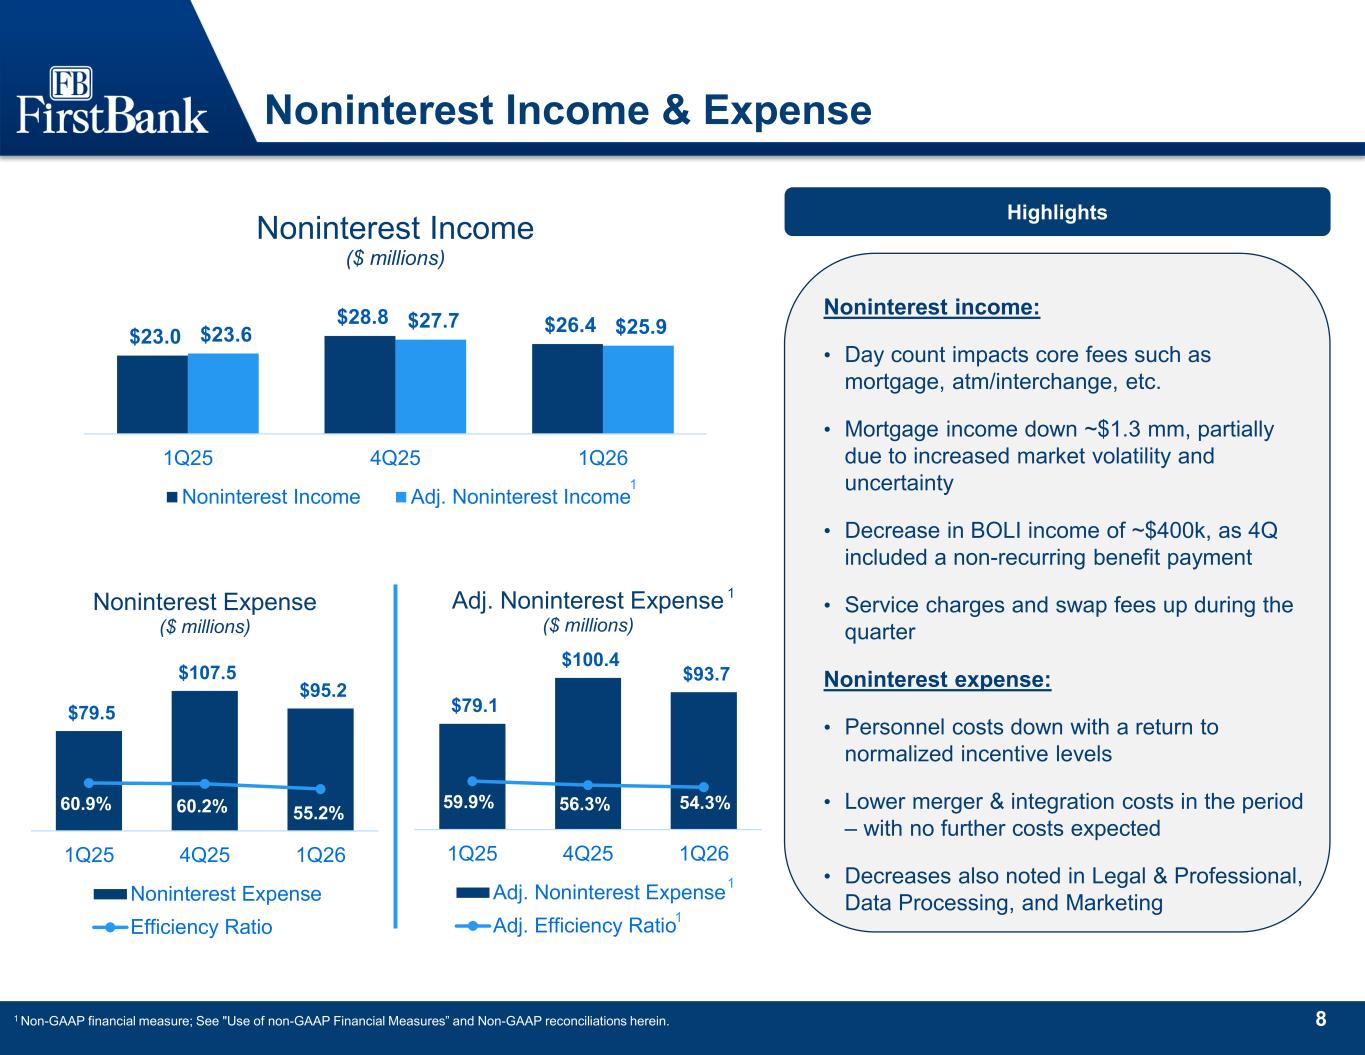
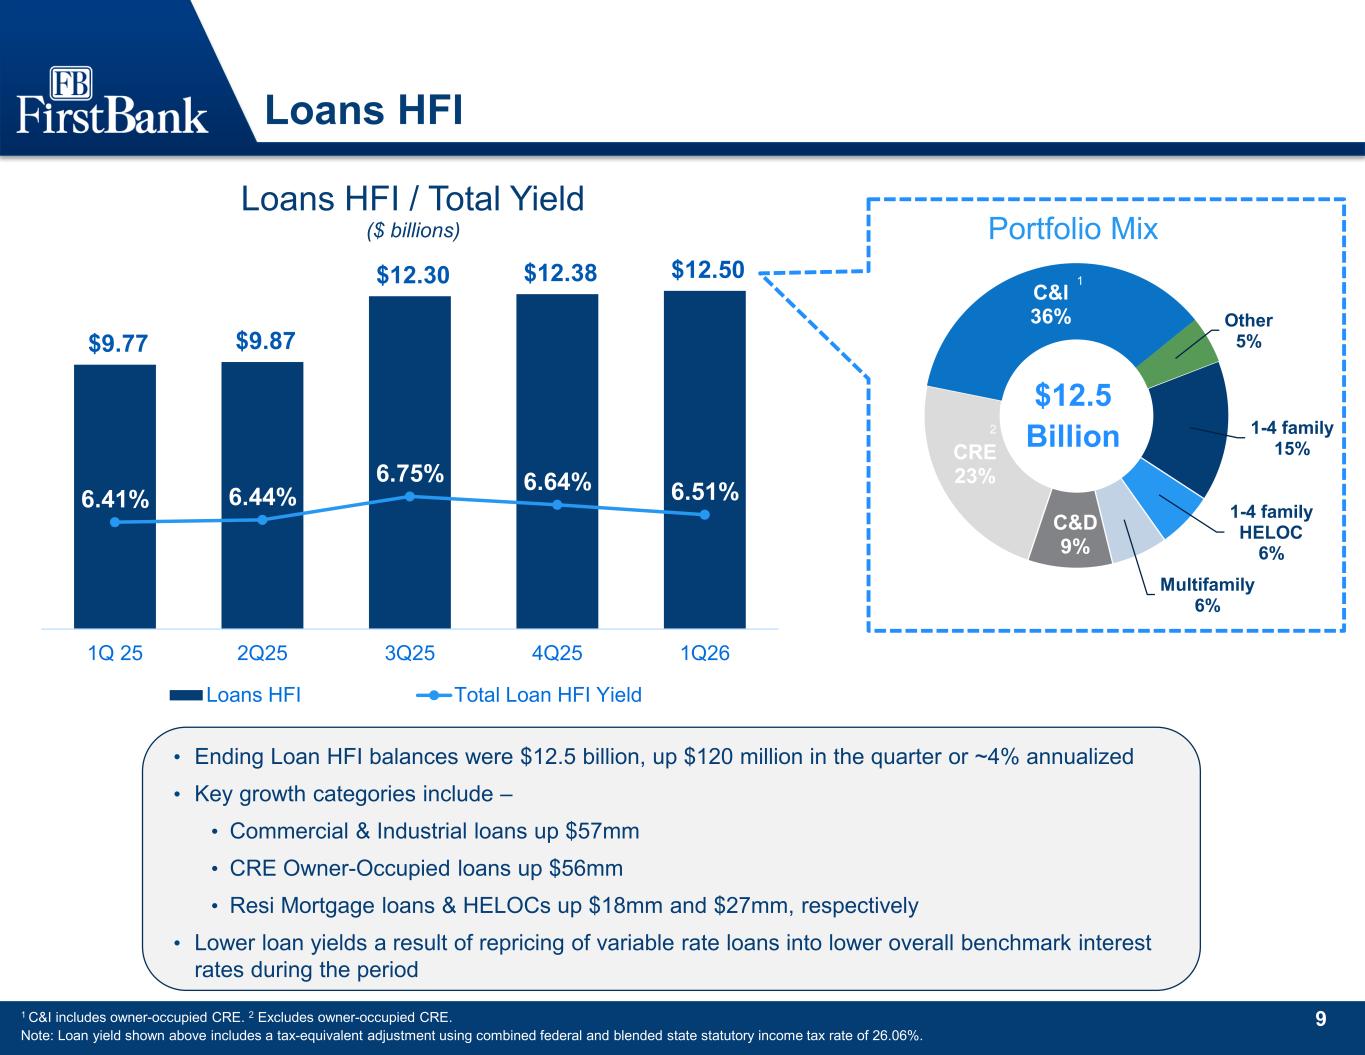
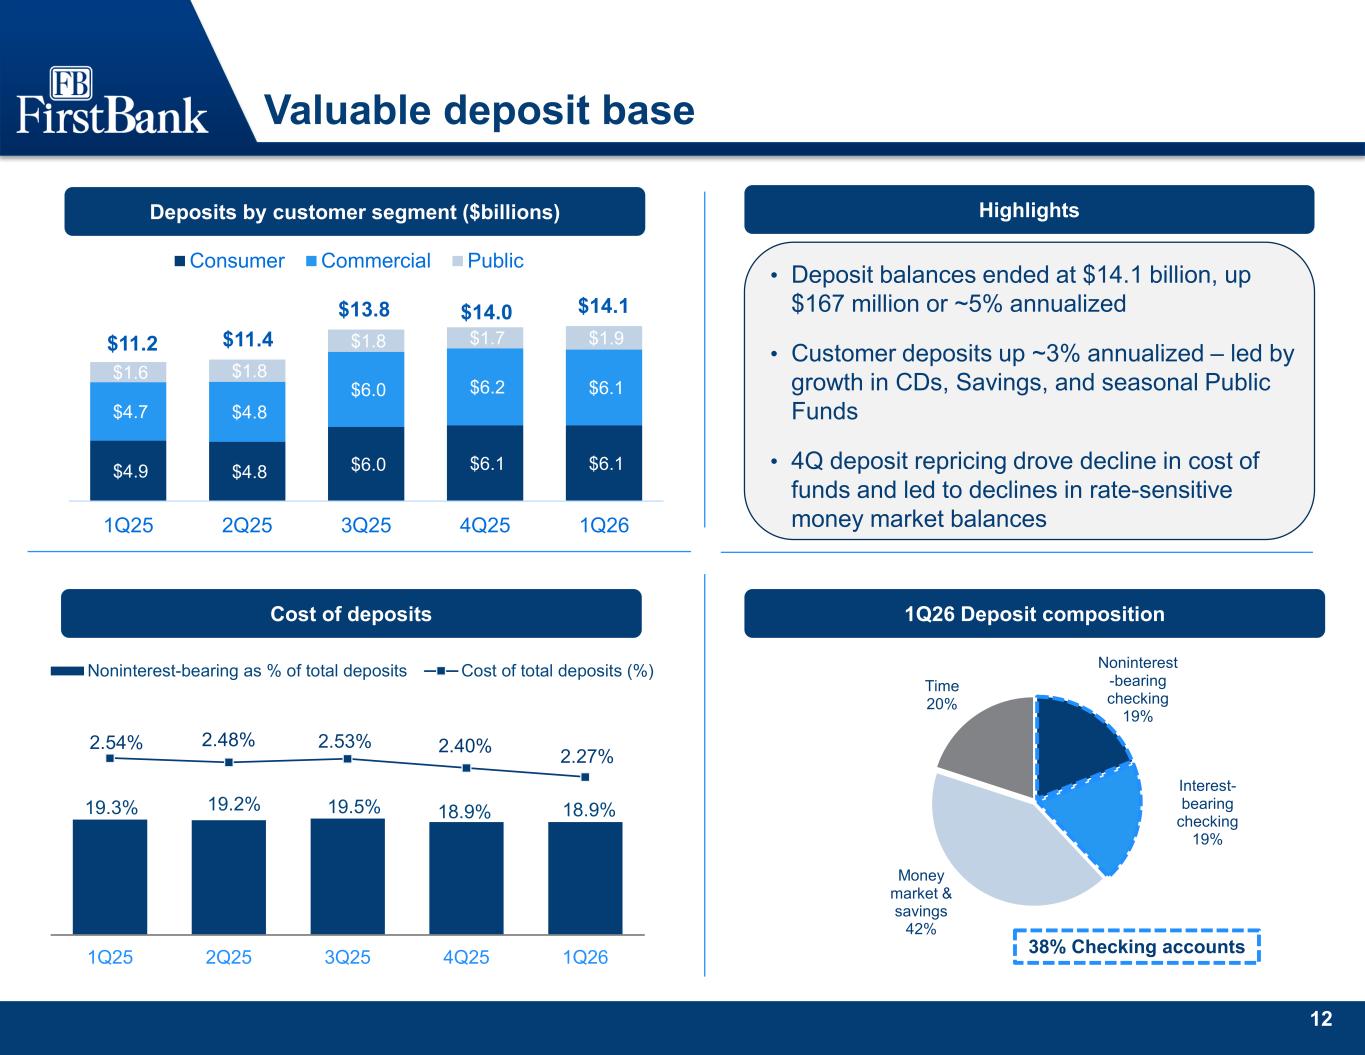
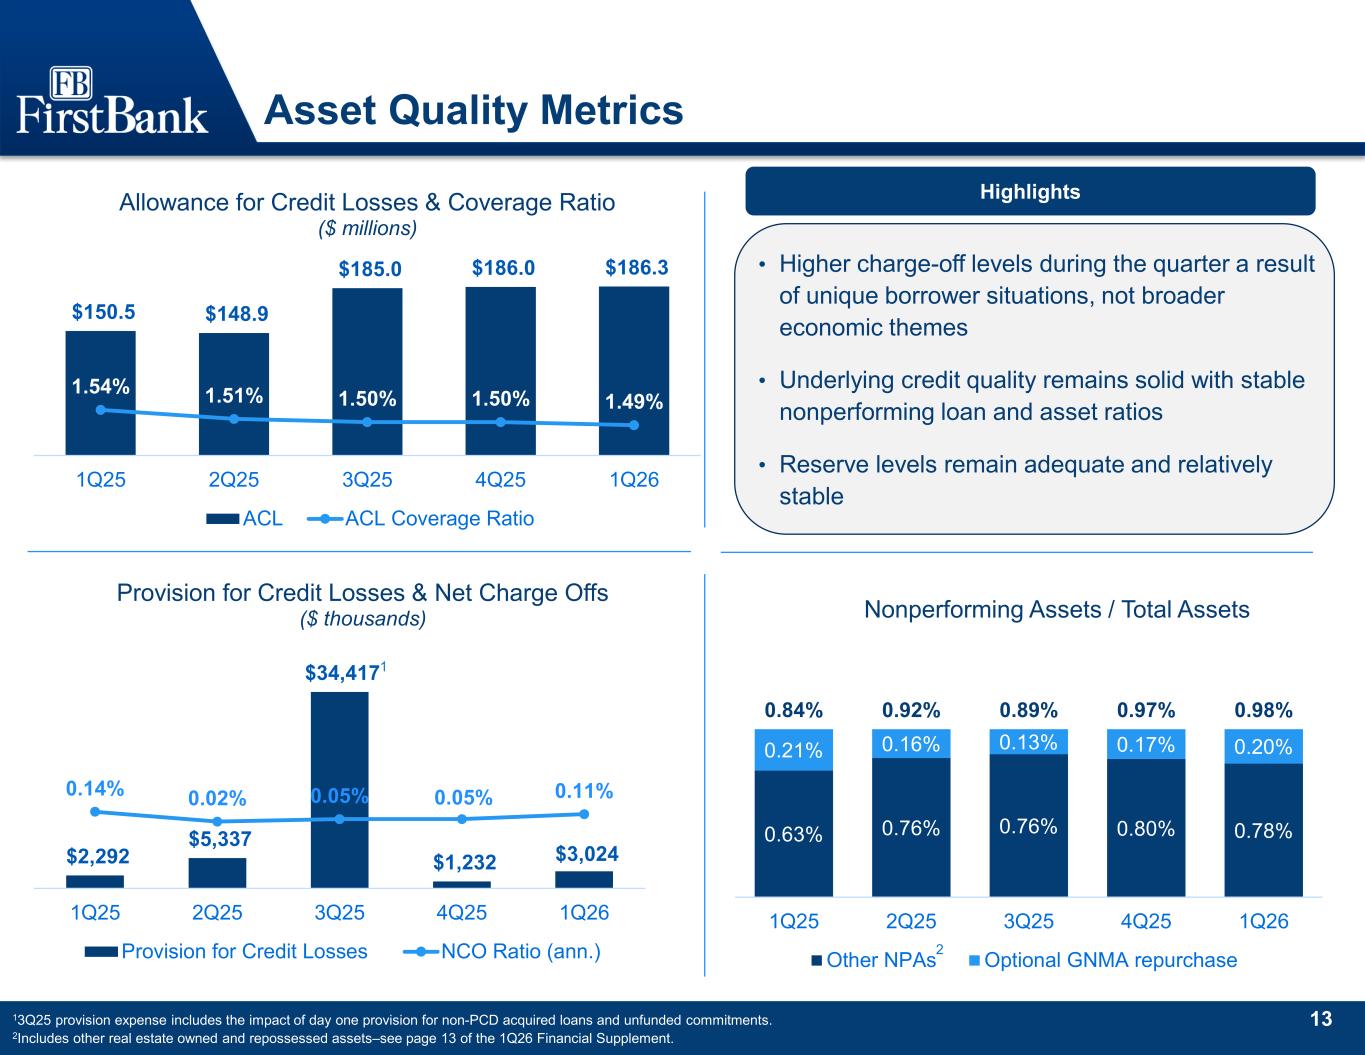
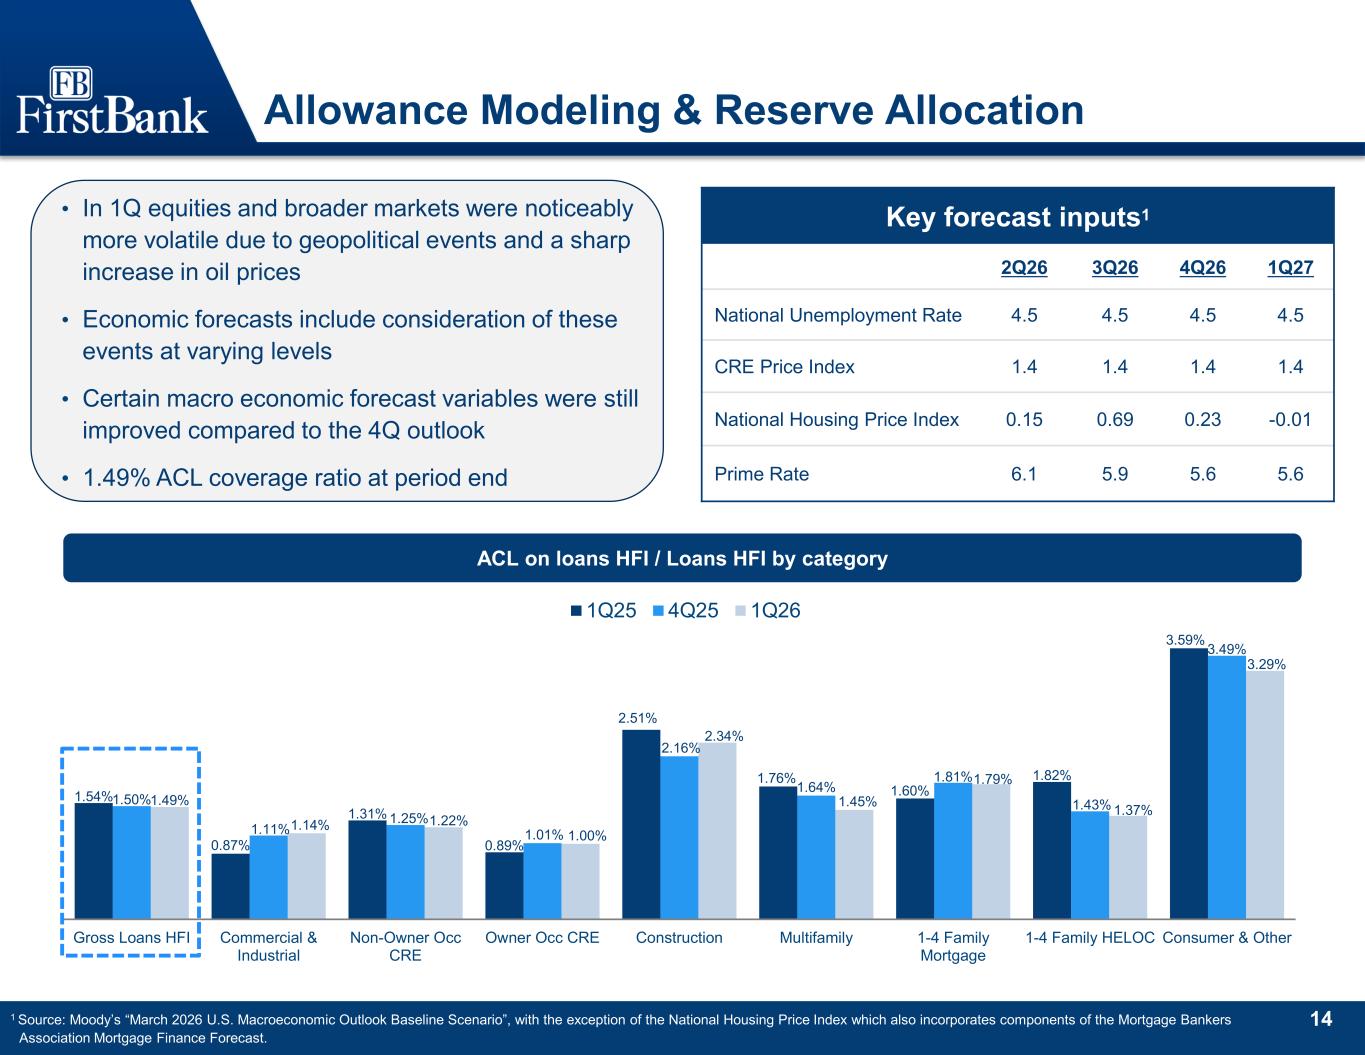
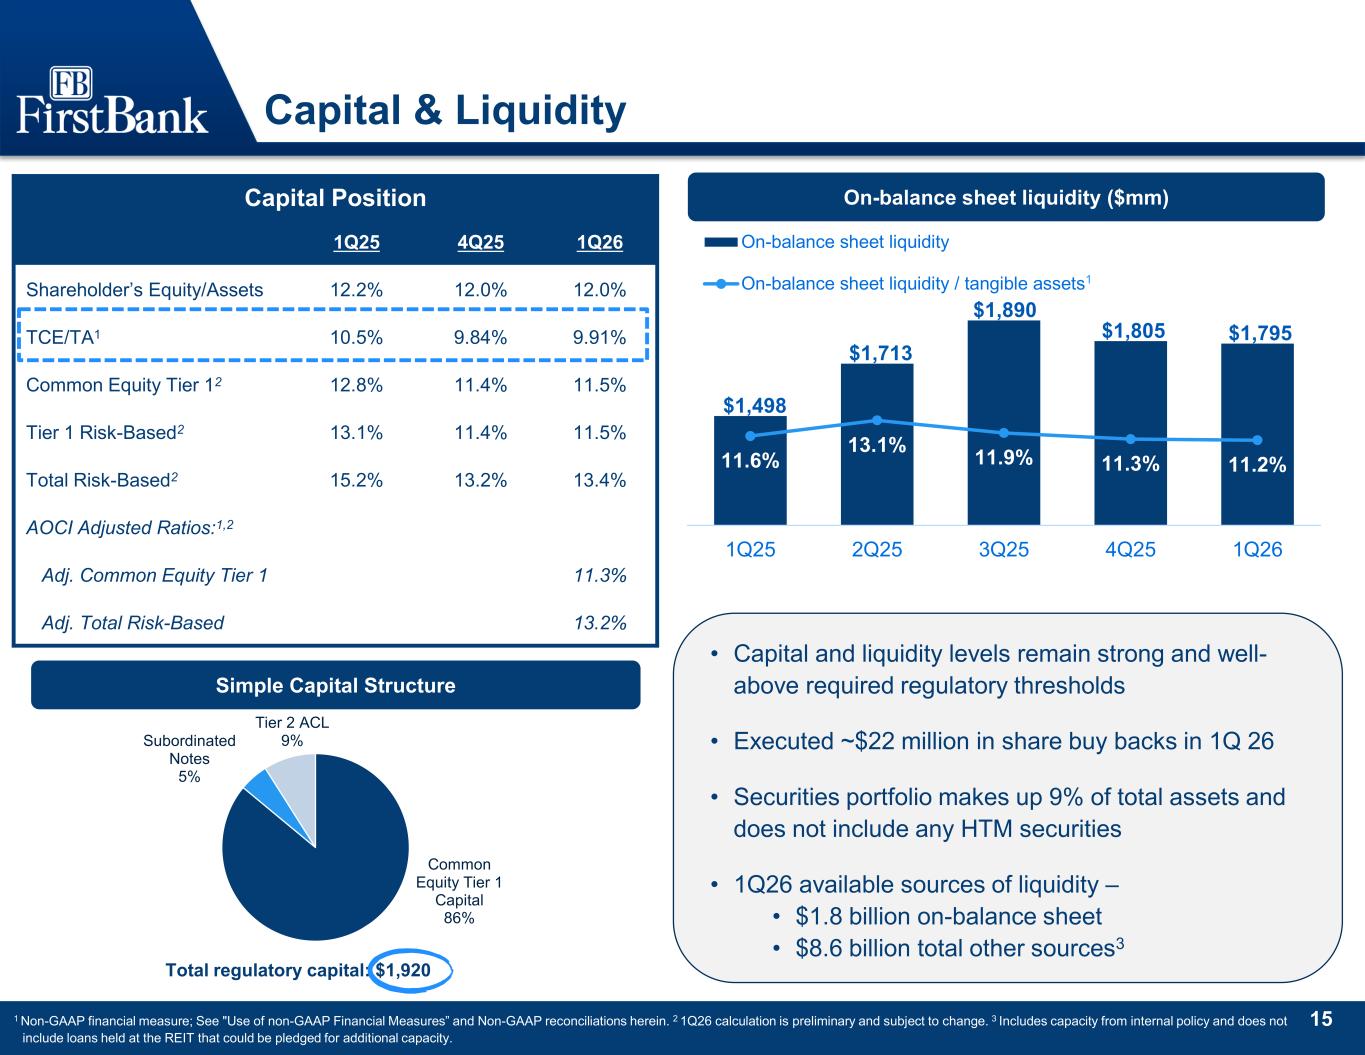
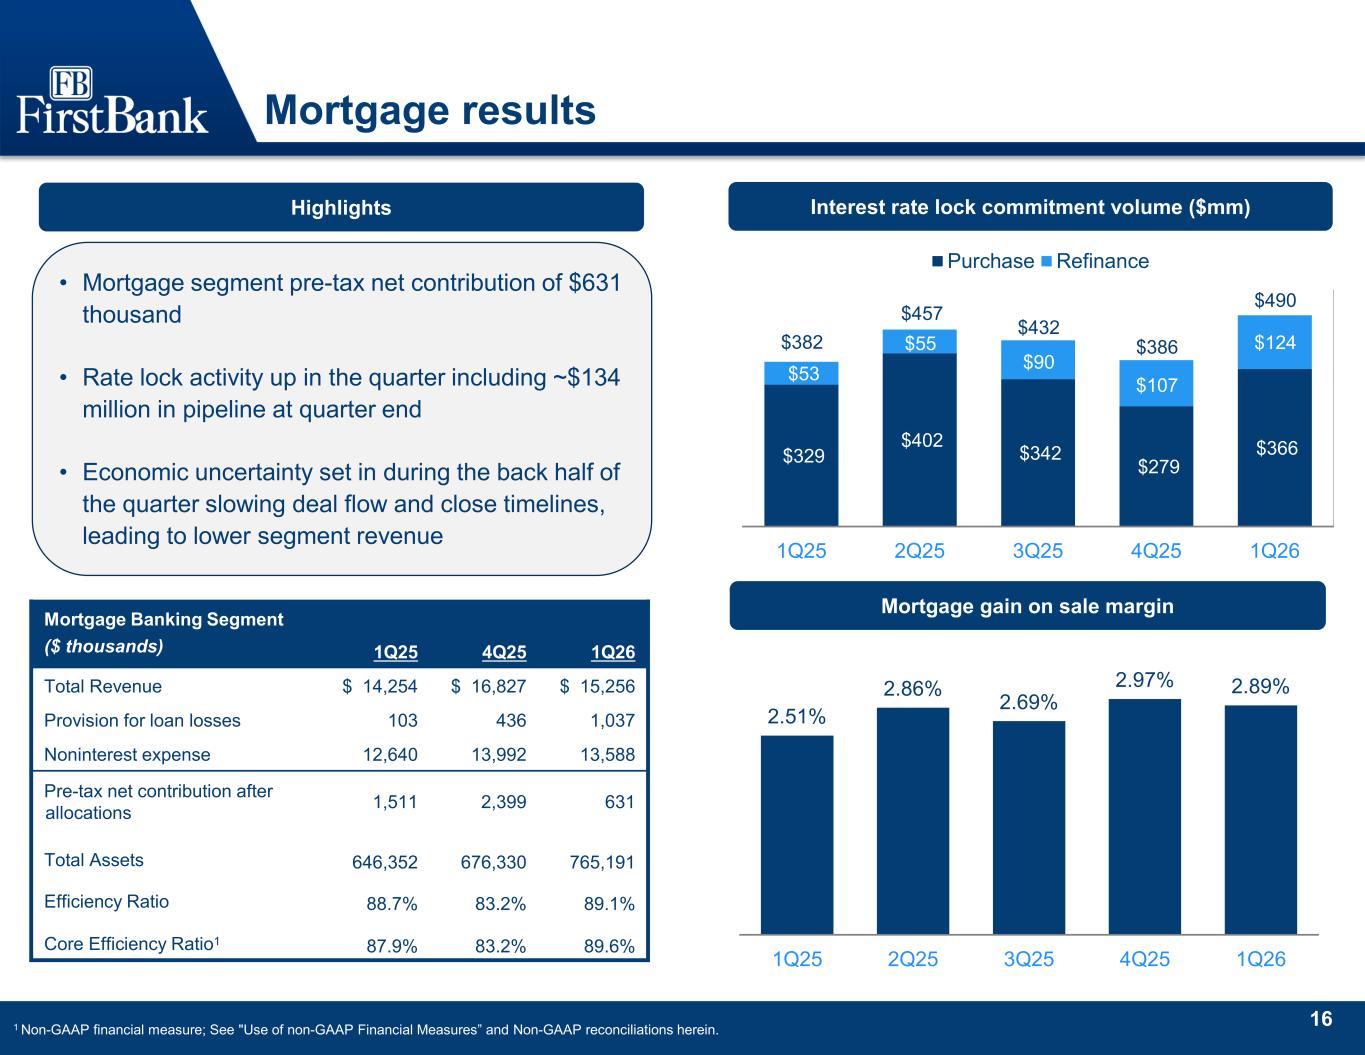
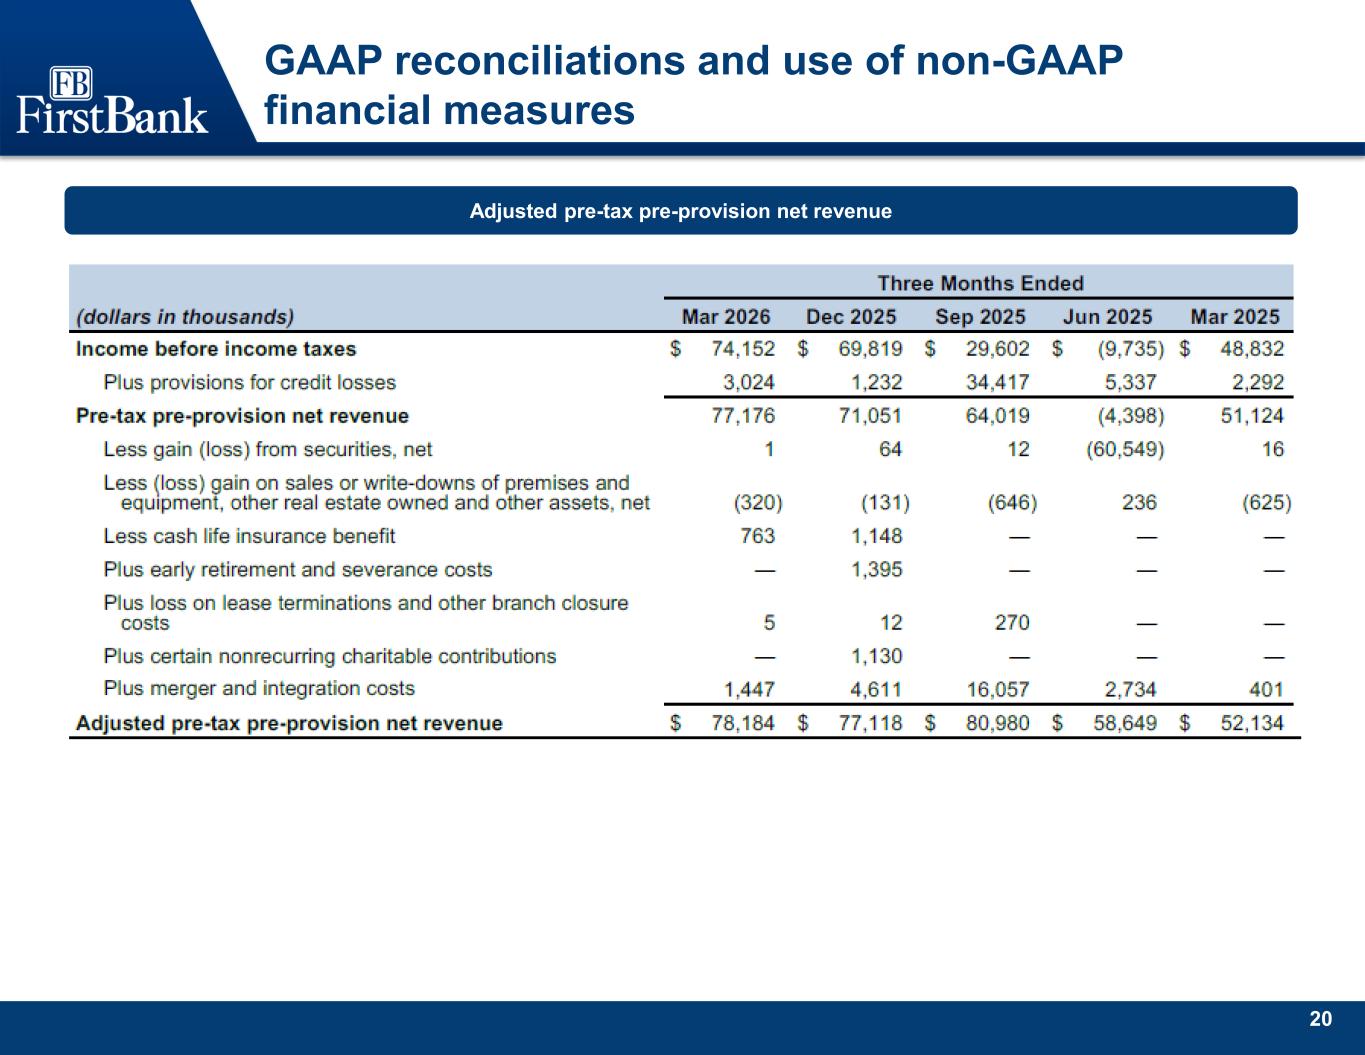
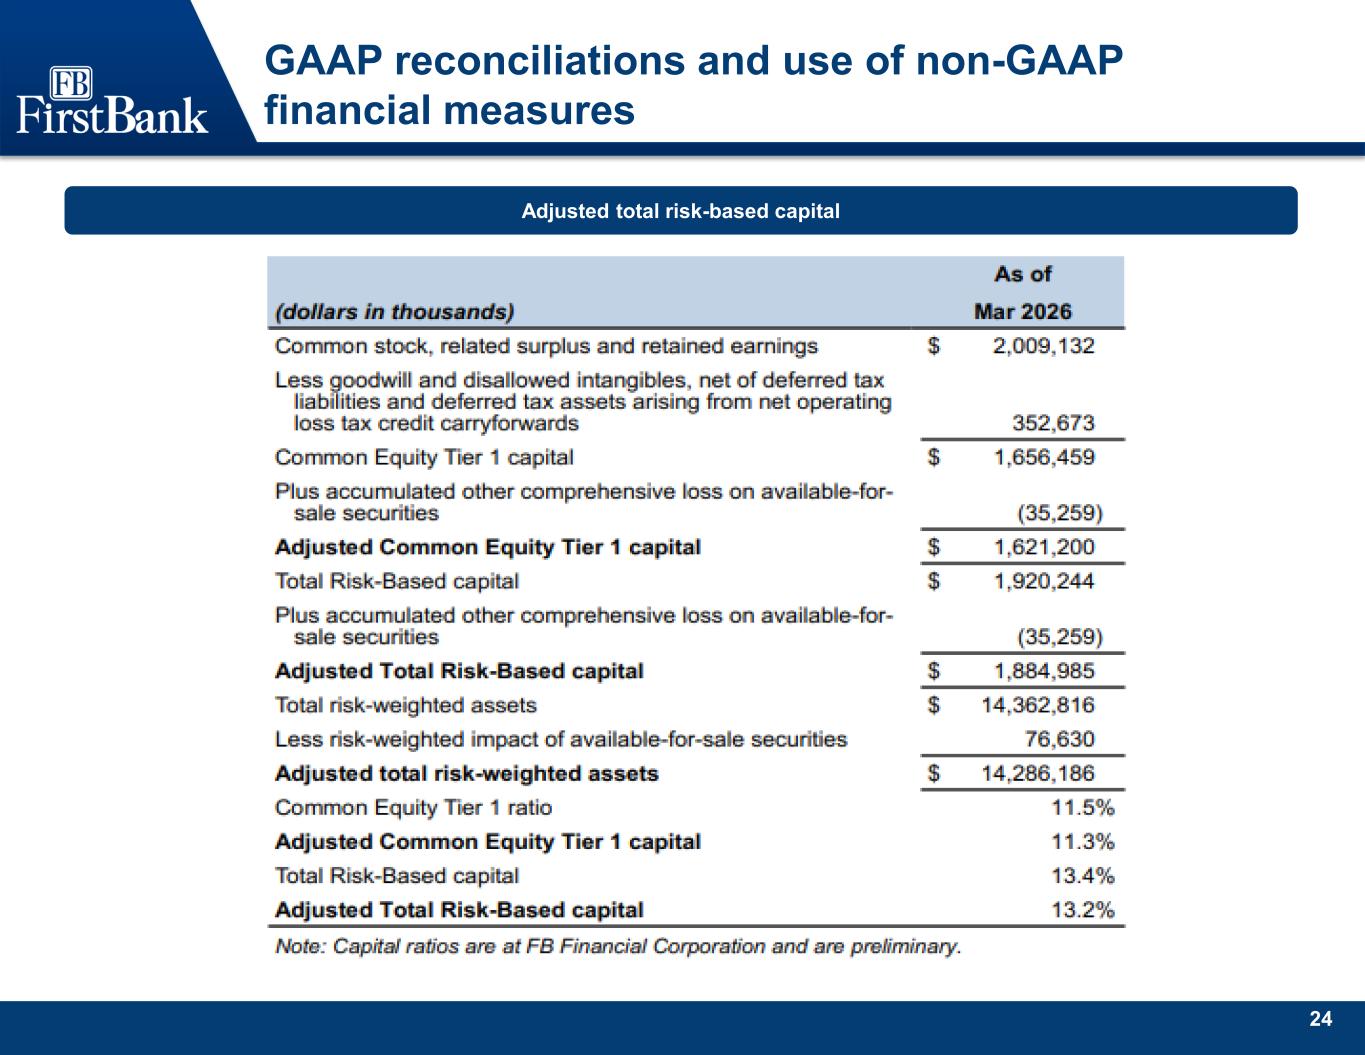
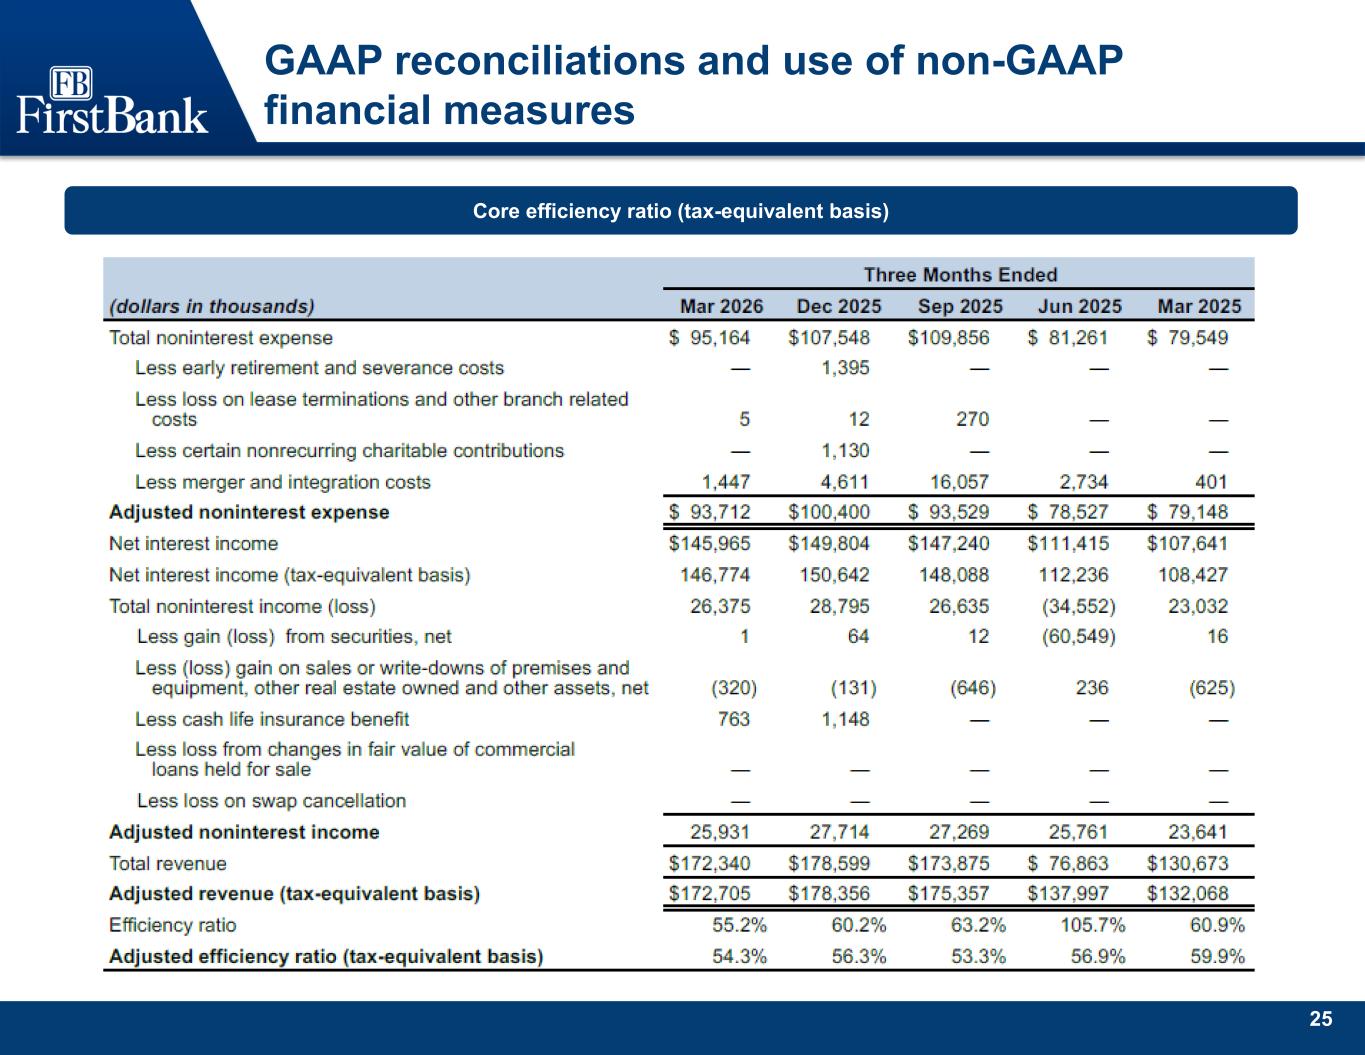
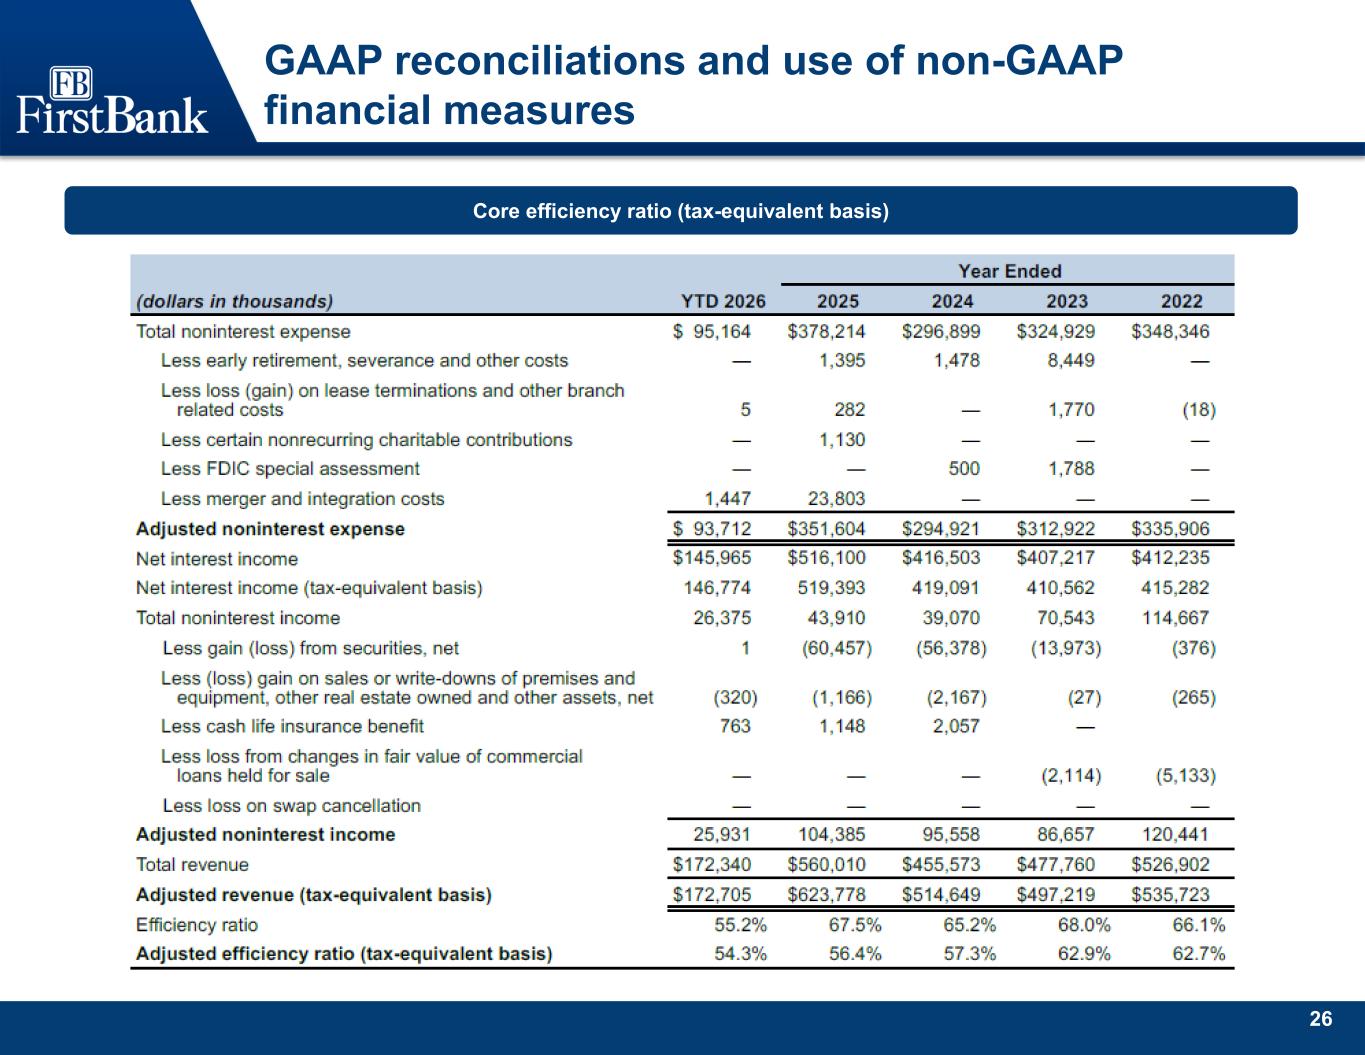
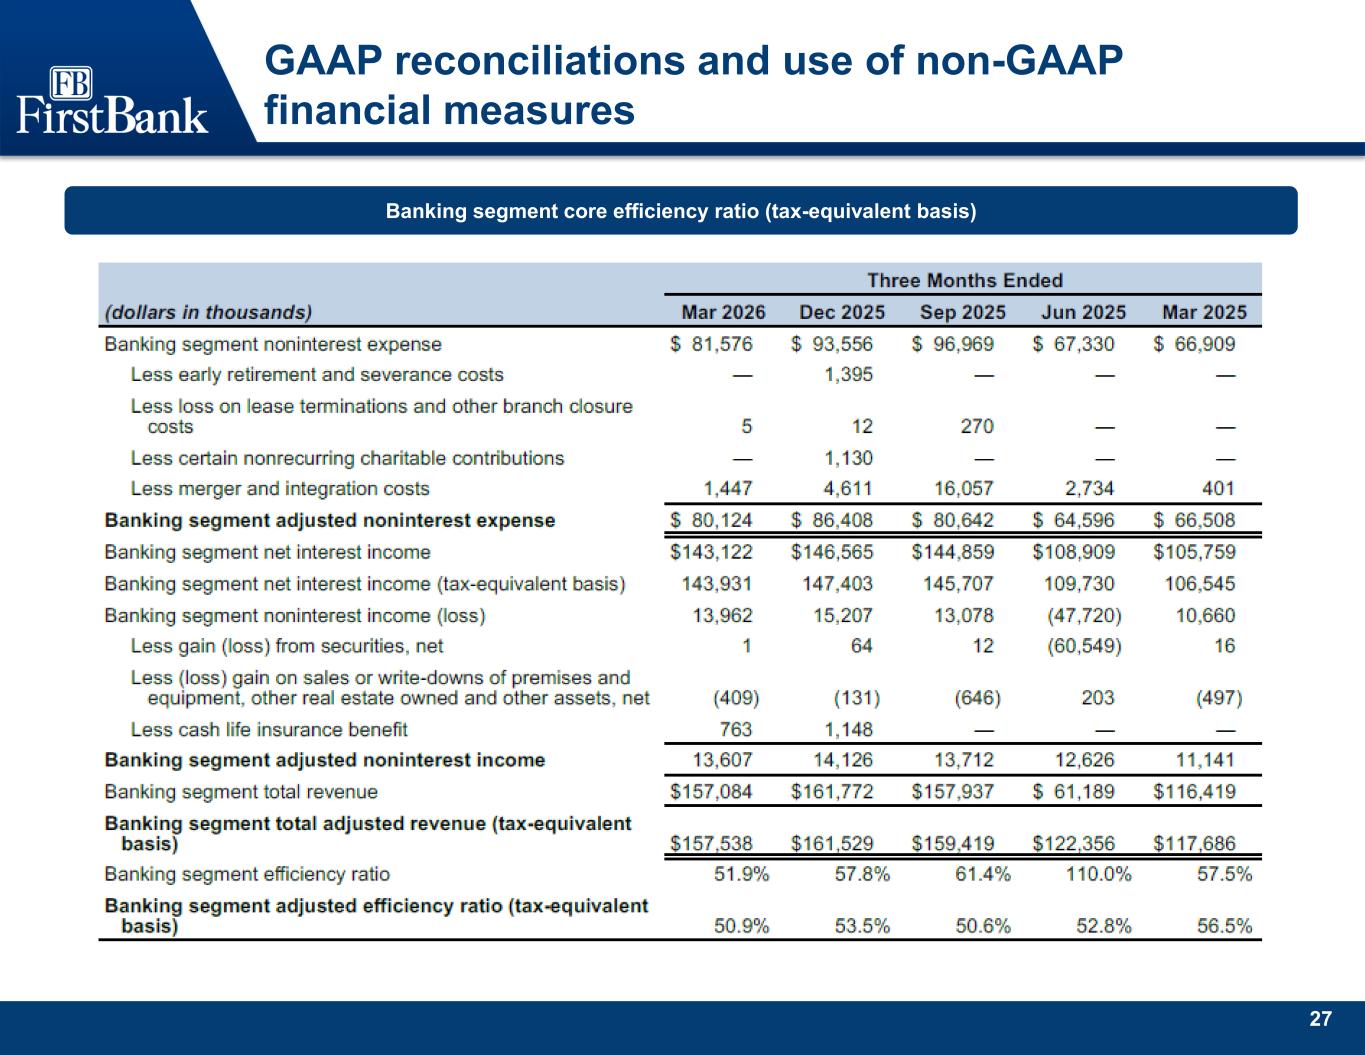
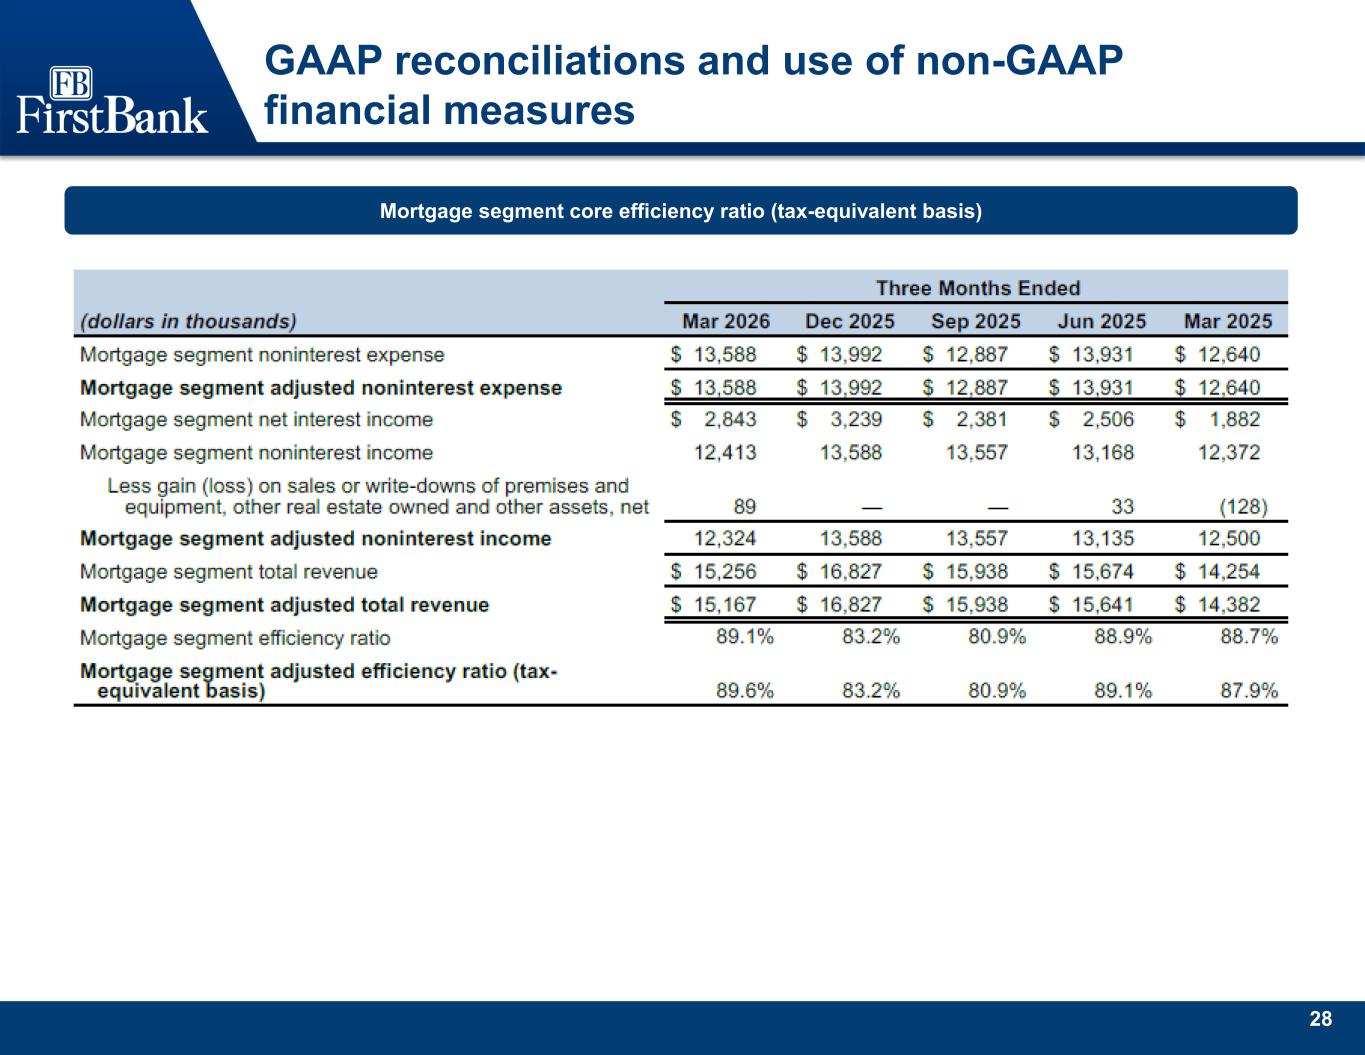
We remain in a position of strength and believe that we have the ability to perform through the various economic cycles as they come so that i'll now turn the call over to our chief financial and operating officer michael matey for some more color on the quarter thank you chris and good morning everyone i'll begin my comments this quarter with the balance sheet while we started the year at a slower pace than we originally anticipated with annualized loan growth of approximately 4%, deposit growth around 5%, we are seeing momentum build across the business in the right areas. Although these growth levels fell at the lower end of our internal expectations, the underlying activity and pipeline trends give us confidence that we are positioned to execute on the core fundamentals Chris outlined and drive improved results as the year progresses. During the first quarter, we began to see a more intense wave of competitive pressure, particularly around pricing. While profitability will always remain central to our decision-making, we're focused on striking the appropriate balance between disciplined returns and sustainable growth. Our strategy remains centered on building deep, long-term customer relationships that create enduring value for our shareholders. We will continue to be disciplined in acquiring new relationships and remain committed to protecting and strengthening our existing ones, always with a focus on delivering value to both our clients and shareholders. The company has the size and scale to compete effectively and win attractive deals when it makes sense to do so, and do not hesitate to act aggressively in competitive situations when warranted. Ultimately, our value proposition is not about being the low-priced provider. It's about delivering peer-leading customer satisfaction through strong financial advice and trusted services. By keeping the client at the center of everything we do, we believe we will continue to drive improved profitability over time and create the same long-term value for our shareholders. On that front, March was our strongest month of the quarter with upper single-digit loan growth and meaningful expansion in our loan pipeline. As we move through the second quarter, we're seeing the momentum continue with a portion of that activity beginning to translate into on-balance sheet growth. We expect second quarter balances to reflect continued improvement, with additional pipeline conversion extending into the third quarter and larger volumes building into the back half of the year. On a full-year basis, we continue to expect both loan and deposit growth in the mid- to high single-digit range, with growth increasingly weighted towards the second half as momentum Turning to earnings for the quarter, pre-provisioned net revenue totaled $77.2 million, or $78.2 million on an adjusted basis compared to $71.1 million in the prior quarter and $77.1 million on an adjusted basis. Net income also improved quarter over quarter, despite the shorter reporting period, coming in at $57.5 million or $58.3 million on an adjusted basis. Our net interest margin for the quarter was 3.94%, representing a modest decline driven driven primarily by balance sheet mix and the full-quarter impact of rate cuts implemented late in the fourth quarter. Total loan yields for the quarter were 6.51%, with yields on new production toward the end of the quarter running a bit closer to 6.6%. On the deposit side, total costs declined to 2.27%, while rates on new production were approximately 2.7% around quarter end. Both loan and deposit yields were modestly lower than the prior quarter, reflecting benchmark rate cuts across the variable rate portions of our balance sheet. As we move deeper into 2026, we expect some additional pressure on margin as competitive dynamics remain elevated, and we continue to pursue targeted growth opportunities in our market. Based on current conditions, we would expect full year net interest margin, excluding loan accretion, to be in a range of 3.76% to 3.8%, representing a modest decline from our prior guidance. We would expect second quarter margin to trend towards the lower end of that range before stabilizing as the year progresses. Finally, we would note that the interest rate environment remains uncertain, particularly around the timing and magnitude of future benchmark rate movements, as a slightly asset-sensitive balance sheet changes in rates can be both favorable and unfavorable depending on the direction and speed of those moves while our margin outlook assumes a continuation of current conditions modest rate actions either higher or lower than current levels will impact some of the competitive and growth related margin pressure we've outlined we'll continue to actively manage the balance sheet and pricing strategy to position the company as effectively as possible across a range of potential scenarios. Non-interest income declined $2.4 million during the quarter, primarily driven by lower secondary mortgage volume, as well as absence of several non-recurring items recognized in the prior quarter, including a higher BOLI benefit payout. In addition, the quarter reflected fewer calendar days relative to the prior period, which modestly impacted overall fee generation, particularly within mortgage-related activity. With mortgage, we saw a really strong start to the quarter and that slowed as the quarter progressed due to the increased interest rate volatility and heightened uncertainty in the housing market and really the world economy. Shifting rate expectations and broader market dynamics impacted borrow sentiment and transaction activity which weighed on production as rates moved throughout the quarter. Mortgage revenue also tends to exhibit some seasonality with activity typically building as we move further into the year. On the expense side, first quarter non-interest expense totaled $95.2 million, representing an approximate 11% decline from the prior quarter, or roughly 7% on an adjusted basis. Personnel costs moderated as compensation-related accruals returned to a more normalized run rate, and merger and integration expenses declined as we completed the majority of costs associated with the southern states accommodation we also saw quarter-over-quarter reductions across several other expense categories as the year reset and teams maintained strong expense discipline as a result our efficiency ratio for the quarter was 55.2 percent or 54.3 on an adjusted basis driven in part by our banking segment which delivered and adjusted the efficiency ratio of 50.9%. Looking ahead, we remain focused on discipline expense management with banking segment non-interest expense expected to range between $325 million and $335 million for the year and a total company efficiency ratio anticipated to remain in the low 50% range. Turning to credit, our provision expense for the quarter totaled approximately $3 million with their allowance coverage ratio ending the period at 1.49% of loans held for investment. Net charge-offs were modest at an annualized rate of 11 basis points, which was a slight uptick for us, but were driven by a small number of isolated bar-specific situations rather than any deterioration tied to broader economic stress. In evaluating the allowance for the quarter, we gave additional consideration to potential macroeconomic events stemming from the conflict in the Middle East. We reviewed the most relevant economic forecast, assessed our portfolio for direct exposure to the recent increase in energy prices. While it remains early to fully understand the broader downstream impact of operating companies, our analysis focused on a limited set of industries most sensitive to near-term energy price shocks. Our exposure to those sectors remains minimal, and we believe our reserve levels are appropriate given the current risk profile of the portfolio. With respect to capital, we continue to be in a very strong position, supported by solid capital ratios and a robust liquidity profile that provide meaningful flexibility. During the quarter, we were optimistic in repurchasing shares amid periods of market volatility, and we remain well-positioned to deploy capital thoughtfully as opportunities present themselves. Our capital ratios continue to reflect that strength, with a common equity Tier 1 ratio of 11.5%, a Tier 1 leverage ratio of 10.4%, and total risk-based capital of 13.4%. This strong capital foundation allows us to remain flexible in supporting organic growth, pursuing strategic opportunities, and returning capital to shareholders where appropriate. In closing, I want to echo Chris's congratulations to our team on earning the J.D. Power recognition. This award is a direct reflection of our associates' commitment to our core values and the strength of our franchise, and it reinforces our focus on delivering consistent value to our customers, shareholders, and communities. With that, I'll turn the call back over to Chris. All right. Thanks for the call, Michael.
Thanks again to everyone joining the call this morning for your interest in FB Financial. And Operator, at this time, we'd like to open the line for questions.
Operator
We will now begin the question and answer session. To ask a question, you may press star, then 1 on your touchtone phone. If you are using a speakerphone, please pick up your handset before pressing the keys. If at any time your question has been addressed and you would like to withdraw your question, please press star, then 2. At this time, we will pause momentarily to assemble our roster. The first question today comes from Dave Rochester with Cantor. Please go ahead.
Hey, good morning, guys, and congrats on the award. That sounded very impressive.
All right, good morning, Dave. Thanks very much.
Hey, and Michael, just your comments on the March momentum on loan growth and then the guide for the year sounded positive, but it sounds like you're also expecting those competitive pressures to continue. I was wondering where you're seeing the bulk of those pressures coming from. Is it larger banks, smaller banks? Is there any variance by market that's noticeable? And are you assuming more elevated paydown activity to continue as well? And I guess you'll just originate more to offset that, to get to that mid-to-high single-digit range. Any thoughts there would be great.
Speaker 4
Yeah. Good morning, Dave. So some of the optimism, right, is the pipeline continues to build, and you can see kind of the closing dates in sight for a lot of those deals. I would say on the loan side, competitive pressure is generally larger institutions. We're seeing it really across the board. You know, Nashville is obviously pretty competitive, but we're seeing it, you know, a lot of our large metro markets. So whether that's Birmingham, Huntsville, Knoxville, Memphis, we saw some large payoffs in Memphis where competition took us out on some deals this quarter. So, it really is across the board. On the deposit side, I would actually say it's both large and smaller. We see community banks that have gotten really aggressive, specifically in the kind of 12-month CD space, but even, you know, interest checking rates that will make you blush a little bit. But and then, you know, for the larger institutions, we're seeing money market rates well, well above four from regional banks that actually we haven't seen advertised and market in quite a while. So I'd say it's coming from both sides. The optimism is the team has put in the work, you know, has been working with our clients, both our existing clients and new prospects. There's a lot of kind of economic excitement. You know, even with everything going on in the world, people are pretty positive about the economic environment. And so deal flow is happening.
And I would say that's across the company, whether that's in our communities of 7,000 people or our metros of, you know, 4 million people. yeah and david you mentioned paydowns and we've seen some of those both second half of last year and and end of this year and do we think that'll continue we do uh there will be some of that michael mentioned a couple of couple of payoffs we'll continue to see some of those and uh but you know it's okay when we know about them it's the unexpected ones that get you and so So we do expect to continue to see those, but as you heard kind of where the pipeline is and what things look like, we're considering that in our – as we're talking about net growth, we're talking about net growth.
Okay, great. That's a great call, guys. Appreciate that. And maybe just one more. Just on the talent pipeline, you know, obviously a lot of disruption in the market. You guys have talked about this before. It seems like a good opportunity, but, of course, everybody's, you know, trying to retain their people. Can you just give us an update on what you're seeing there, you know, the dynamics with conversations that are going on right now, and how confident are you guys that you might be able to pick up some value add there over the rest of the year?
Speaker 4
Yeah, it's a daily topic here, Dave, right, is kind of offense and defense. with regard to talent. And so I'd say conversations have heated up. I mean, we added, let's say, 15 revenue producers in the first quarter. You know, we also lost a couple. And, you know, some of that is people going to other institutions and some of it's retirements, things like that. But, you know, these are really waterfall events. You know, it's not necessarily who you think is acquiring your talent, but when one person moves, it opens up a door for someone else. And so you're constantly trying to keep your key players in your key markets, and that's both large and small, too. I think a lot of it people equate to I'll call Nashville or like a Huntsville, but it's happening across the board, you know, in places like Jackson, Tennessee, Birmingham, Atlanta. So feel good about the conversations. We're hot and heavy on a lot of recruiting. It's more important to me that we have the right people that fit our culture and our business opportunities versus putting numbers on a page. Even though I just quoted 15, it's much more important that those are the right people. And so that's where we continue to be focused, and we think we'll get more than our fair share of those right people as we move forward.
On a net basis, that sounds really positive in terms of the ads that you just brought in in the first quarter. Just curious, what areas are they in? Are they primarily loan producers, deposit guys? Is it commercial? Where are you seeing those ads?
Speaker 4
Yeah, so one point of clarity when I'm recruiting is I expect all our bankers to be bankers, loans and deposits. So generally not bringing in just loan people. Sometimes bring in just deposit people. But even those are equipped to take care of their clients. It's eight or so relationship managers, a couple mortgage people, and a couple people that are focused really on consumer and small business relationship development. And we do have a couple, I guess, loan-heavy businesses, right? So, yeah, it's positive, and we think we can continue the momentum.
Yeah, David, and I think it's always, I think, a topic, and it's a little like the customer service topic I talked about. It's important. One thing I would say about this one, you know, it's kind of hard to get relative measures on talent because folks look at it differently. And for us, it's become something that we know that folks want to try to get their arms around, but it's not really a key performance metric for us in terms of we don't have a goal where we say we're going to hire this many this quarter, this many the next quarter. We're looking for the right people at the right time, and there is a lot of movement. The one thing I would say is there's probably more movement and more recruiting going on, particularly in our metropolitan markets, but Michael said it, even in some of our smaller markets than we've seen across the board. And typically, you see people going from smaller banks to larger banks, but we're seeing some larger banks, some much larger than we are that are coming in and recruiting talent from banks even smaller than we are. And so it's just, I think it's an interesting time, but, again, Michael said it. You have to play offense and defense all the time, and defense is best played by making sure you've got a great place to work, making sure you've got engaged folks, and making sure that you're taking good care of them, and that's as important as anything. So that's how we view it.
All right. Appreciate all the color.
Operator
The next question comes from Russell Gunther with Stevens. Please go ahead.
Hey, good morning, guys. Good morning, Russell. Morning, Chris. Morning, Michael. I wanted to ask on the expense side of things, so really strong first quarter results, but you guys have reiterated the banking segment expense guide for the year. So it would just be helpful to get some color in terms of what's driving that sort of pickup over the course of the year.
Speaker 4
Yeah, I mean, there's a dose of expectation around performance picking up, which, you know, obviously impacts – we're a performance-based company when it comes to compensation. And so, you know, we want to expect peer-leading returns, and so that drives that number a little bit higher as we look out over the year. And some of that will come with growth there, Russell. um there's not any uh expectations of the of huge you know like technology investments or anything like that so it's it's it's more just maintaining our our run rate expectations and you know performance-based comp type stuff moving higher throughout the year okay uh thanks michael and then uh just an adjacent follow-up so curious deal synergies were fully realized this quarter In aggregate, did they come in in line with what you were expecting or maybe better than modeled?
And then bigger picture, what's a good kind of core expense growth rate or range to think about for FDK?
Speaker 4
Yeah. Actually, I would say from a combination perspective, we landed pretty much right on top of our deal expense number, maybe plus or minus $100,000 or $200,000 or so.
It was really close except I thought it was just a shade. As Michael said, the difference is really immaterial because it's like in the on a fairly large number, it's down less than a million bucks and I actually think it may be just a hair under but it's right on the number.
Speaker 4
And I'd say for we haven't done a real merger in you know five years so it's good to kind of set off and resharpen the knife a little bit um so yeah we we're around expectations i think the proof right russell is getting to that kind of 50 range by year end uh as we continue to efficiency ratio to year end as we get to the combined company you know make sure the revenue engine's still going which is is really important When you say synergy, I think about revenue as well and maintaining our ability to grow in our legacy southern states markets. So, yeah, I think we're in a good spot there. And then I'd say, you know, 4% to 5% kind of, you know, core expense growth as you look forward. You know, if I think about 27, which is a long ways away. But that would not include, back to Dave's question, you know, talent acquisition and opportunities to really add teams and scale. But we'll maintain our expense discipline, you know, as we kind of look forward.
And then just last question for me would be circling back to the loan growth side of things, the mid versus high single digits. What are the largest drivers that would get you, you know, to the high end versus the low end?
Speaker 4
Yeah, I mean, time. Some of it's just the time of the quarter, I guess. But if you think about the year, we have, you know, it is a competitive environment. And so people step in, other companies step in, and sometimes, you know, we'll get really aggressive. And some customers are more price sensitive than others. and so you can see large deals move one way or the other but our our pipeline when I look at look at it on confidence interval and so we're pretty confident about where we are but but you could see some payoffs come in like Chris said the unexpected ones which you hope doesn't happen you know if you're really servicing your clients you should know but but sometimes we're all surprised Yeah.
The other thing I would say, Russell, it goes a little bit like we talked about on the people side in that, you know, as as as people as bankers move, that also makes customers more vulnerable to to moving to changing banks. And so, as I think about one of the drives, generally, you know, we're looking at, as we're rolling forward, we're looking at what we have, customers that we have, and things that we know are in a pipeline. So, part of the optimism is we also are having more and more conversations with really, really solid customers that have big balances, both in loans and deposits, that are in play. And so you certainly don't bat 1,000 on those by a long shot. But the more at-bats you get, the more hits you get. And so we're getting more and more at-bats. And so there's some optimism around that as we get into it. Because we're having a lot of those conversations now. And you think some of those are going to hit as you get later into the year and as you get into next year. That seems to be picking up momentum. Okay. That's great, guys.
Thank you very much for taking my question.
Operator
The next question comes from Stephen Scouten with Piper Sandler. Please go ahead.
Hey, good morning, guys. Appreciate the time. I guess one other kind of maybe point of clarification on loan growth. Could you give us a feel for kind of maybe the cadence of growth? I mean, obviously, you said the pipelines and growth picked up in the back of the quarter, but still a little bit below your expectations. So was the cadence just that things started off a little slower? Did you see any sort of demand pullback with all the macro and geopolitical events? And then you talked about payoffs, but kind of do you have any sort of numbers there in terms of quarter-over-quarter payoffs or year-over-year that, you know, if that was part of the driver for the slightly slower-than-expected growth maybe?
Yeah, on cadence, you know, I don't know that I would – I think I'd describe things as fairly steady and normal, with the exception of a few big balance things. We did have at least a couple of payoffs that were, you know, just big balance things, but we've talked about that before, and we anticipated some of that. But other things, you know, you do see a little bit of push down the calendar, if you will, or push forward some, maybe that's related to just some uncertainty. But I wouldn't say that's a material event. I would just say that, you know, as we have continued to do what we do, make, you know, make changes here, make changes there. Remember, we had the disruption second half of last year of integrating First Bank and southern states. And that does create a little bit of distraction. And so, as you really get back on a good cadence, use your word there, you just begin to see the momentum pick up. And so, I wouldn't say there's anything unusual about it. Rather than you can see things bump a little bit, maybe related to, I call it economic uncertainty. But, again, I wouldn't read too much into that. Those tend to be small bumps, not big bumps, like I said. But if it bumps, it could bump 30 days, but that could move it between quarters. And so, you know, we do see that, but we see that every quarter.
Speaker 4
Yeah, and I'd say for past, we did, you know, timing-wise, if you're sitting here in January, as you're saying, well, it's a really tough start to the year here coming off.
Yeah, at the end of January, you'd look at it and go, But, wow, it's something that's over.
Speaker 4
I mean, especially coming off what I'd say were elevated payoffs in December. I mean, you know, we're running, you know, $600 million or so in payoffs and amortization a quarter, Steve. And so then you got, you know, you also have people paying down lines. And then you got, you know, new lines being extended and paying up. So it's a little bit of a moving target. But that kind of that $500 to $600 range is where I expect payoffs and paydowns to occur kind of on a quarterly basis, which means, you know, you've got to be growing at $600, $700 million to get to that mid to high single digit, plus increases in lines and things of that nature. So it was – I mean, the first quarter was a bit elevated, but not so much over the fourth quarter because the fourth quarter was also elevated.
Okay, really helpful call. I appreciate that. And then on the updated NIM guidance, only a couple basis points below kind of where you were previously, just kind of wondering what, if any, rate cuts do you have built into that guidance? and kind of, I know you said maybe not an overly material change one way or the other, but would expect if we didn't get cuts, maybe that could lead you to the higher end of the range. And then the reason kind of for the decline, would that be just increasing deposit pricing pressure? Is that the biggest delta, maybe quarter of a quarter?
Speaker 4
Yeah, you nailed it. So we have a rate cut in our NIM guidance, and that's what we had. And when we talked about the full year in January. So, yeah, and like you said, I mean, it's basically a basis point or two lower. So I would call that pretty stable. So the reality is rates are, you know, if you look at the forward curve, you know, most most would say it's probably market would say it's probably rates up at this point. Right. we're slightly asset sensitive you know it's probably worth kind of three to four basis points in margin but then if I think about what you just said deposit pressure and thinner loans you kind of get back to the same place so there's probably a little bit of upside in flat to up rate scenario You know, I would say any what I'll call stair-step rate movement, either direction, you know, is manageable. It's the elevators up and down, which really create a lot of volatility in your margin. So, you know, the team will be able to manage through either way, but we certainly prefer that stair-step. And Chris says to our team all the time, you know, it'll never get easier than today to get deposits. And so we expect that that to continue to be challenging in the right environment. Now you've got, you know, treasuries are attractive, again, with where rates are. And so that's a competitive pressure outside of the banking system, as well as, you know, customers need to or companies need to fund, you know, loan growth and economic expansion. So it's a competitive market. You know, it always is, but it's been a little bit more fierce as we turn the calendar. got it makes sense and maybe just one housekeeping question just on the tax rate anything to note there it looks maybe slightly elevated relative to the past this quarter yeah i think it's probably in this kind of 20 to 22 range is there a normal uh operating environment we had uh some franchise tax that uh an excess tax that's kind of local state related that picked up this quarter And so that drove the higher number. And so, you know, there's community opportunities where we can invest in our communities that can move that number around a bit. And so we, you know, we do those when the deals make sense. And so you can see that move around. And that's what you saw late last year. But we're pretty normal range here, maybe slightly lower on a go-forward basis. Got it.
Appreciate it. Thanks so much for the time, guys.
Operator
The next question comes from Brett Rabbitohm with StoneX. Please go ahead.
I wanted to start off with just a strategy question, and you guys are now $16.5 billion in assets, headed to $20, I would guess, over the next couple years organically. And I know, you know, when you think about First Bank, it's very community bank oriented. And so I wanted just to get an idea, one, you know, from a philosophy perspective, would you guys start to think about specialized lines of business, equipment finance, you know, those kinds of things that, you know, might further drive the loan pipeline? And then just secondly, you know, you guys didn't talk about the First Bank way, you know, Wanted to see where you guys were in your evolution of that and just if there's anything left that you guys were trying to do in terms of the franchise and how you do business.
Yeah, Brett. So, man, you may have been – I'm afraid maybe one of our conference rooms is bugged. You're hitting on some topics that have been heavy topics over the last two months. And so let me see if I can just kind of run down and talk about some of those. We are – you label us as community bank-oriented, which I would give a strong indication that that continues – yeah, a strong message that that continues, and that will continue. We think – you heard us start off by talking about what our customers think about that, and that was J.D. Power. But if you look at Greenwich information, that's very strong as well. And so we think we have a formula there and sort of a special sauce and how we run, you know, and our community orientation is really a key ingredient there. It's not the only ingredient, but it's a key ingredient. So we'll continue that as we scale. And so we spend a lot of time, I talked about, I spent a lot of time strategizing in the last 60 days. But part of that strategy is how do we maintain that as we scale the company? And so that's really important to us, and you're going to continue to see that. You also mentioned specialized lines of business. So part of what we're working through is how do we add some specialized lines of business? We have some today, MH, Manufactured Housing being one, for instance, that we excel at. How do we continue to add some other lines of business like that and continue that community bank orientation? Okay, and so that's an important part of the strategy. And then what you labeled as FBA, sometimes we'll talk about our, internally, We'll talk about our customer-centric business model, and those two overlap and can even be used interchangeably sometimes. But, again, heavy focus on that very thing, and we will continue to do that because that's just making us better. And again, we looked, literally yesterday, we sat around the conference room, we're talking about where we ranked in customer service, and one of our goals for our executive team, for our executive team to hit our objectives for the year, we have to increase that score. Even though we're number one, we have to increase that score by a certain percentage, and so that is a continuous process for us on how we basically keep that community bank orientation and continue to scale the company, so that's critical to us. And I'll give you another line of business that we've added in the last 90 days is the SBA line, okay? We haven't had that as a line in the company. We've got just a few small SBA things out there that we had before this, but that's now a line where we have an all-star that heads that, Lane Rhodes, who joined us. And so we are. And so that's that's another example. So you're going to see you're going to see exactly what you described, where we continue that orientation. But we can we do continue to grow certain lines and some certain verticals.
OK, that's helpful. And then the other question I want to ask was just around, you know, there's an obvious expectation that there's going to be some market disruption, you know, in the southeast with some of the recent transactions. questions um would you guys view chris would you view mna is too distracting from here i've had i've had some some call from some banks saying that they're just they think focusing organically and looking to take advantage of maybe some of the other acquisitions that have happened here recently you know is a bigger opportunity just wanted to see if your philosophy had changed much if any around mna and potential opportunities particularly in maybe newer markets like north Carolina, et cetera.
Yeah. Again, man, I'm afraid you have us bug here because it's a frequent topic of conversation is exactly that. With the organic opportunity, do we need to or is it too distracting to do M&A? The answer for us is no, it's not. But we are very conscious of distractions ourselves. And so that does cause us to look at it strategically a little differently than we traditionally looked at it and probably causes us to be even more careful and picky, choosy about what we do because it needs to be both strategically compelling and financially compelling for us. And you have to be careful about markets, okay? We can generally keep distractions away from markets that don't have any involvement through overlap in a transaction. We can limit the distraction. And so, those are all the things we consider, but we will still keep that arrow in our quiver uh and may you know we could exercise that on a on a transaction uh at any point okay um great appreciate all the work guys all right thanks brett the next question comes from steve moss with raymond james please go ahead good morning guys good morning steve want to start here morning what want to start here just following up on the loan pipeline here that you guys spoke is stronger.
Just kind of curious where you're seeing the pickup in demand by loan type, if you will.
Speaker 4
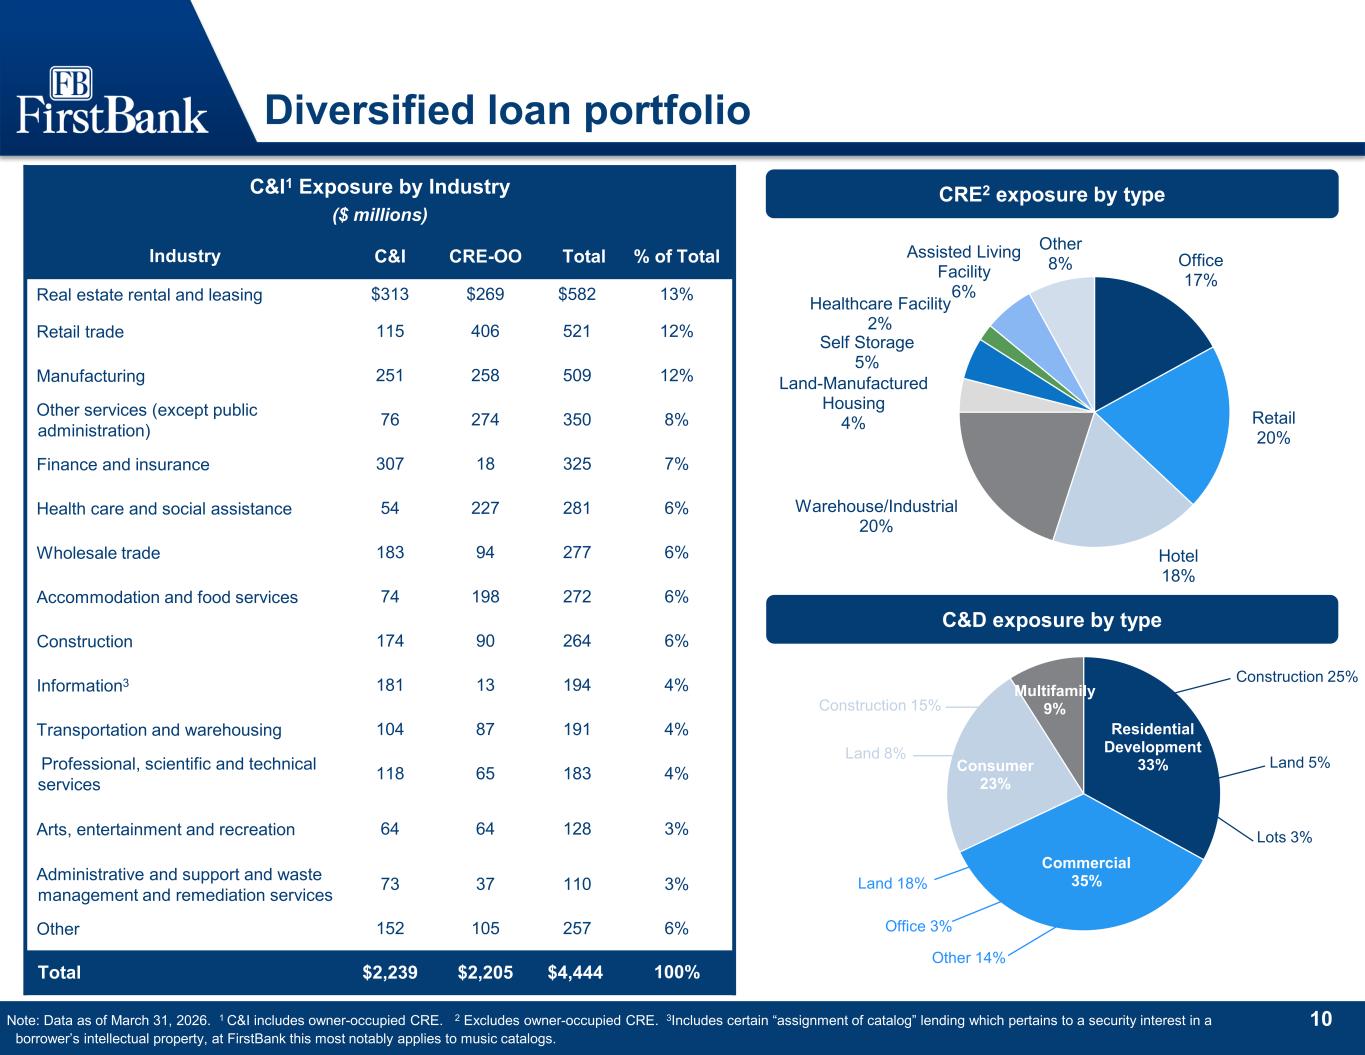
Yeah. I would say it's across the board, but I would say I'll caveat that or a little bit more clear. It's more in operating businesses. That's really where we've been focused is developing out that that strength um from a cni perspective if you look at the where we where we've gotten smaller a lot of that is kind of non-owner occupied cria or uh construction over the last couple years and so some of the pressure that we faced in payoffs uh this this quarter and late last quarter was if you think back that 2021 time frame A lot of growth out of the company, a lot of it was in that construction and non-owner-occupied CRE space. So you're seeing that kind of roll off, and we're replacing it. We're still in those businesses and taking care of clients, and we still like those asset classes, but it's not growing at the same velocity. So it's much more about operating businesses and some owner-occupied real estate type of transactions.
Okay, great. Appreciate that color there. And then second question for me here, just on the margin, you know, you talked about the core margin, just kind of curious as to where you're thinking, any updated thoughts I should say on purchase accounting accretion here for different quarters?
Speaker 4
Yeah, I think it's going to be in that same kind of 15 to 17, 18 basis point range. I don't think you'll see it go up unless we get even faster payoffs, but I think it's going to be pretty consistent here. Okay, excellent.
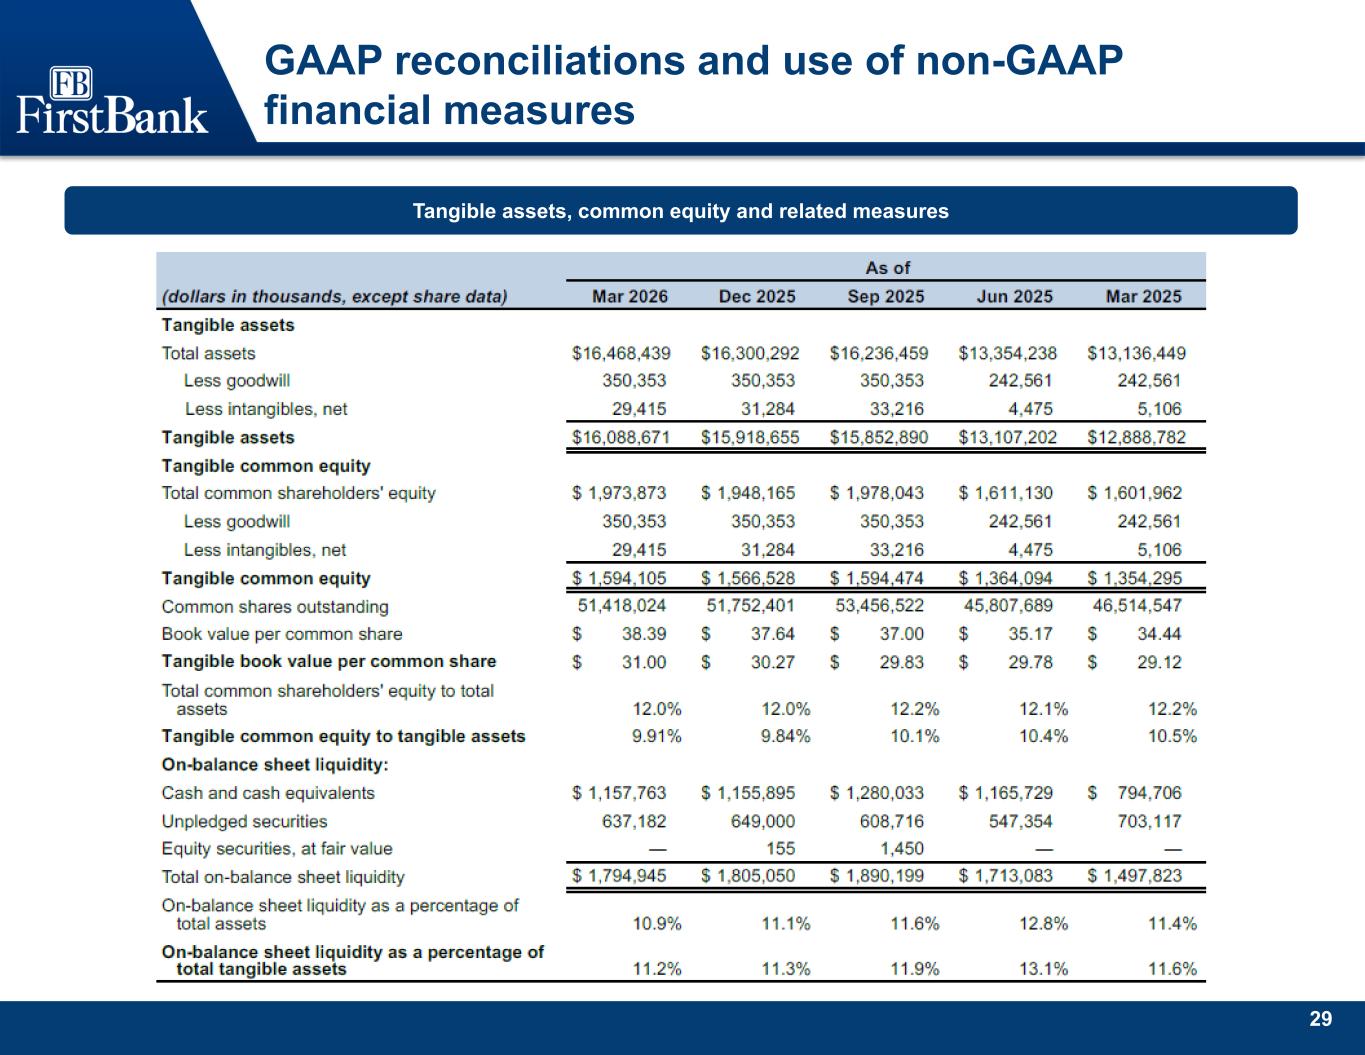
All the rest of my questions, and one more question, just on capital here. You guys fought back late in the quarter with the pullback. Just kind of, you know, should we expect you guys to continue to be opportunistic or, you know, sitting at 9.9 TCE, more favorable regulatory environment, do you guys press the gas on that a little bit more?
Yeah, we'll continue to be opportunistic when it comes to buybacks. You know, we're watching the volatility there, but we usually regard that as opportunistic, and we really haven't changed that stance.
Well, great. I appreciate all the call here, and that's all my questions. Thanks very much, guys.
Operator
The next question comes from Catherine Mueller with KBW. Please go ahead.
Thanks. I've got one more on the margin. I've got one more on the margin. Just on deposit costs, do you have the spot rate of where deposit costs ended the quarter? And let's just say we are in a position where we don't have any more rate cuts until maybe the very end of the year, so basically no more for 26.
Speaker 4
Do you think that your deposit costs increase from this kind of 280 interest-bearing level, or are you just more stable? yeah that at 280 level so we you know our think about total uh new originations or 270 that's probably on the low end honestly uh like said of interest bearing 283 i think i think you probably see those increase a little bit uh given where you have to acquire new customers catherine so So, you know, market rate is significantly higher to acquire new customers. The goal there is to translate that into relationships over time in full operating business, and then you get back to more of an equilibrium. There's a bit of a disconnect, reality-wise, of where you can fund the company either through borrowing or broker and wholesale versus kind of where I'll call the consumer retail commercial market is. it's actually significantly, I would say significantly higher to go out and acquire new customers versus funding the bank. So, it's a balance. If rates are up or flat, you know, Fed funds, I think you see competitive pressure pushing deposit costs modestly higher. But our goal is always to get the full relationship.
Got it. And that new deposit cost of 270, does that include non-interest pairing or that's just on new interest bearing that's inclusive okay so that's all all so that's relative to your kind of 227 so your your cost of new is still higher than you know where you are today that's right yeah okay yeah okay and and i will say this too catherine just to clarify you know the days i think of loading up on non-interest bearing deposits and not paying your customers a lot of interest or interest is, you know, we don't really see that as a long-term thing.
Speaker 4
We obviously want all the operating accounts we can, but we also want a fair value proposition. And with all these fintechs and, you know, competitive market, we don't expect our customers to be asleep at the wheel, and we're not going to try to nickel and dime them to zero.
Yeah, that's right. As a matter of fact, sometimes we'll even wake them up intentionally and say, hey, we'll give you a better deal. And so the days of really cheap back books, we view that as quickly coming to an end, which changes a lot of competitive dynamics. And so just, yeah, view into our window strategically on how we're thinking about it.
And then by product type, where do you think you see the biggest growth in deposits that just interest-bearing demand?
Speaker 4
Yeah, so that's a – you've obviously been sitting in our treasury meetings and our pricing committee. So, we saw money market decrease this quarter because, well, we're talking about the aggressive nature of other rate offerings. So, yeah, there's probably some work to do there just to get back to equilibrium on money market. CDs, we continue to see CD renewals and new production CDs as a growth opportunity. We saw that in the back half of the year and through the quarter. We've been more in the short and long kind of a barbell approach. We're seeing a lot of competition in that middle ground, which I'll call 12 to 15 months. So CDs are an opportunity. But getting some of our money market business back is probably the biggest lever.
Operator
Red A. As a reminder, if you would like to ask a question, please press star, then 1, to join the question queue. The next question comes from Christopher Maranick with Breen Capital Research. Please go ahead.
Hey, good morning. Chris and Michael, can you talk about the growth of securities as another tool to grow NII? I know it's not the focus of loans and deposits, as we're all talking about, I'm just curious if securities are a component of how you continue to grow revenue.
Speaker 4
Good morning, Chris. I mean, you know, the investment portfolio is about 9% of the balance sheet total assets. And so we've been as high in the past, that kind of 14% range. But that really comes down to funding, you know, in a lot of cases. And so there's not a whole lot of times where I sit around and say, hey, we have excess deposits. So to go and invest in the investment portfolio, we'd much rather deploy through organic growth opportunities. But that certainly is a lever to do that. We've been mainly in kind of floating rate, government-backed stuff from an investment portfolio perspective. It's been a higher yielding asset than fixed rate mortgages and things of that nature. So we'll continue to do that. It's not top of the list. Yeah, we want to be organic in nature. And if we stick at 9% to 10%, you know, or even if it went down a bit and liquidity levels remained in that 11% on balance sheet liquidity range, I'd be a happy person. I mean, we're deploying through loan growth.
Yeah, Chris, I'll just add this. When we're looking at banks, we're valuing banks, and we see, you know, wholesale funding and sometimes then wholesale assets on the balance sheet, we quickly discount that to zero. And so when we're thinking about our own company, we don't do that as a matter of practice. We think, hey, to be successful and to continue to be creating value, we've got to be adding what we call customer, and that can take a lot of different forms, but I'll broadly call it customer assets and customer deposits. We think that's what we do, and if we don't continue to do that well, we won't continue to be able to sit at this table. And so that doesn't mean that there are times where we might leverage up for some specific reason or if we know something's coming or something's leaving, you know, we will use that leverage. But we keep a lot of dry powder there to use. We just don't typically use it for revenue growth purposes. And when we think about our portfolio, we don't keep a very large investment portfolio, and it's basically simply a liquidity vehicle for us. So if you also look at it in there, it's very vanilla and liquid in terms of its marketability because, again, that fits that same philosophy of we're really trying to plow it into the assets that we think really grow our shareholder value.
Understood. Thank you both for that. And then just a quick follow-up on new accounts that you're opening as you look at it internally. Do you see net new account growth, and is there sort of a general pace that you're looking for as the next several quarters and years play out?
Speaker 4
Yeah. We actually have been quite successful in growing consumer accounts over the past year. um it's it's interesting you know as we're going through some of this generational shift uh you know adding i don't know what the youngest generation is now because i'm getting older uh but i'm gonna say adding millennials uh is a different structure and you gotta add a lot of those accounts for one baby boomer that may uh may be uh passing away or what have you so that evolution of your accounts. You've got to add a lot of smaller ones. We like that, actually. We like granular deposits and granular loans, so we're all for it. It just takes a little bit more time to grow your balances. So, the number of accounts has been quite good, but the balance growth comes over a significantly longer period of time than adding, you know, $400,000, $500,000 deposit accounts when they're coming in $2,000 to $3,000 chunks. It's been positive. I'll also say, back to Catherine's question, we've seen some success in savings in our savings account product, which is probably an odd thing for people externally to hear, but it helps add that younger generation. You've got a savings account, it's got a companion checking account, and it's of interest to people that are not quite yet adults, but it's worked well for families as people move into the stages of life.
Hey, Chris, I want to just add one thing. We have had good success at growing accounts, and we are, you know, we still, about half our deposits are retail, and so we have a lot of small balance accounts, which Michael said. We love that construction on our balance sheet and the granularity that gives us and all the things, all the positive things that go with One of the other things we have done, which is not easy to do, and I won't say we're perfect at it, but we feel like it gives us a leg up is, you know, traditionally in banking, we've counted accounts, you know, even some banks have gotten in trouble for that in terms of how they did that and how they motivated folks to do that. We're very aware of that. And so we actually go through and define a relationship, and so we actually count relationships, because you can add accounts, but frankly, some of them aren't very valuable, and they're not really a relationship. And so we have moved into relationship counting, and it's paying some dividends, but we think it's going to pay big dividends as we roll forward.
No, that's great stuff. Thank you both for getting into that detail, and we appreciate you hosting us all this morning.
Operator
This concludes our question and answer session. I would like to turn the conference back over to Chris Holmes for any closing remarks.
All right. Thank you all for joining us. We always appreciate your participation and your interest. And any further questions from either anybody in the investment community or analyst community, you can reach out to us directly. everybody have a great day thanks the conference is now concluded thank you for attending today's presentation you may now disconnect