
First Citizens Bancshares Inc 8-K, filed Jan 26, 2022
First Citizens Bancshares Inc (FCNCA)
8-K
2022-01-26
For: 2022-01-25
View Original
Added on
April 10, 2026
About this 8-K
First Citizens Bancshares Inc filed this 8-K on January 26, 2022, reporting on events of January 25, 2022.
Items reported
- Item 2.02: Financial results
- Item 5.02: Director or officer change, or executive pay
- Item 5.03: Charter or bylaw amendment, or fiscal year change
- Item 7.01: Regulation FD disclosure
- Item 9.01: Financial statements and exhibits
UNITED STATES
SECURITIES AND EXCHANGE COMMISSION
Washington, D.C. 20549
FORM 8-K
CURRENT REPORT
Pursuant to Section 13 or 15(d) of
The Securities Exchange Act of 1934
Date of Report (Date of earliest event reported): January 25, 2022
(Exact name of registrant as specified in its charter)
|
|
|
|
|
(State or other jurisdiction of incorporation)
|
(Commission File Number)
|
(IRS Employer Identification No.)
|
|
|
|
|
|
|
(Address of principal executive offices)
|
(Zip Code)
|
||
Registrant’s telephone number, including area code: (919 )
716-7000
(Former name or former address, if changed since last report)
Check the appropriate box below if the Form 8-K filing is intended to simultaneously satisfy the filing obligation of the registrant under any of the
following provisions:
|
Written communications pursuant to Rule 425 under the Securities Act (17 CFR 230.425)
|
|
Soliciting material pursuant to Rule 14a-12 under the Exchange Act (17 CFR 240.14a-12)
|
|
Pre-commencement communications pursuant to Rule 14d-2(b) under the Exchange Act (17 CFR 240.14d-2(b))
|
|
Pre-commencement communications pursuant to Rule 13e-4(c) under the Exchange Act (17 CFR 240.13e-4(c))
|
Securities Registered Pursuant to Section 12(b) of the Securities Exchange Act of 1934:
|
Title of each class
|
Trading Symbol
|
Name of each exchange on which registered
|
|
|
|
|
|
|
|
|
|
|
|
|
Indicate by check mark whether the registrant is an emerging growth company as defined in Rule 405 of the Securities Act of 1933 (§230.405 of this chapter) or Rule 12b-2
of the Securities Exchange Act of 1934 (§240.12b-2 of this chapter).
Emerging growth company ☐
If an emerging growth company, indicate by check mark if the registrant has elected not to use the extended transition period for complying with any new or revised
financial accounting standards provided pursuant to Section 13(a) of the Exchange Act. ☐
| Item 2.02. |
Results of Operations and Financial Condition.
|
On January 26, 2022, First Citizens BancShares, Inc. (“BancShares”) announced its results of operations for the quarter ended
December 31, 2021. A copy of BancShares’ press release containing this information is attached as Exhibit 99.1 to this Current Report on Form 8-K (this “Report”) and is incorporated herein by reference.
| Item 5.02. |
Departure of Directors or Certain Officers; Election of Directors; Appointment of Certain Officers; Compensatory Arrangements of Certain Officers
|
(e)
On January 25, 2022, the Board of Directors of BancShares (the “Board”) adopted, effective January 1, 2022, an amended and
restated First-Citizens Bank & Trust Company Long-Term Incentive Plan (the “Amended LTIP”). The Amended LTIP amends and restates in its entirety the prior Amended and Restated Long-Term Incentive Plan, as approved by the Board on October 29,
2019 (the “Prior Plan”).
The Amended LTIP amends the Prior Plan to:
| • |
redefine the population of employees eligible to be participants under the Amended LTIP to include employees of First-Citizens Bank & Trust Company (“FCB”), BancShares’ wholly owned subsidiary, and its
affiliates in roles that are deemed to be at the “Executive” Career Level, as that term is defined in FCB’s Career Framework; and
|
| • |
increase the maximum amount of awards that may be paid under the Amended LTIP to any one participant in any one fiscal year to $10,000,000.
|
The foregoing description of the Amended LTIP and its changes does not purport to be complete and is qualified in its entirety
by the full text of the Amended LTIP, a copy of which is attached hereto as Exhibit 10.1 and is incorporated herein by reference.
| Item 5.03 |
Amendments to Articles of Incorporation or Bylaws; Change in Fiscal Year.
|
On January 25, 2022, the Company filed Certificates of Correction to its Certificates of Designation filed with the Secretary
of State of the State of Delaware on January 3, 2022 (the “Certificates of Designation”). The Certificates of Correction list the correct initial dividend commencement date of December 15, 2022, rather than the original issue date as stated in the
Certificates of Designation.
The foregoing descriptions of the Certificates of Correction are qualified in their entirety by the full text of the
Certificates of Correction for the Series B Preferred Stock and Series C Preferred Stock, copies of which are attached hereto as Exhibit 3.1 and Exhibit 3.2, respectively, and are incorporated herein by reference.
| Item 7.01. |
Regulation FD Disclosure.
|
On January 26, 2022 at 9:00 a.m. Eastern Time, BancShares intends to hold a conference call to discuss its financial results
for the quarter ended December 31, 2021. Additional investor presentation materials related to such call are furnished hereto as Exhibit 99.2 and are, along with the press release, incorporated herein by reference.
In accordance with the General Instruction B.2 of Form 8-K, the information presented herein pursuant to Item 2.02, “Results
of Operations and Financial Condition,” and Item 7.01, “Regulation FD Disclosure,” including Exhibits 99.1 and 99.2, shall not be deemed “filed” for purposes of Section 18 of the Securities Exchange Act of 1934, as amended (the “Exchange Act”),
or otherwise subject to the liabilities of that section. Such information shall not be deemed incorporated by reference in any filing under the Exchange Act or the Securities Act of 1933, as amended, except as expressly set forth by specific
reference in such filing.
| Item 9.01. |
Financial Statements and Exhibits
|
(d) Exhibits. The following exhibit accompanies this Report.
|
Exhibit No.
|
Description
|
|
|
Certificate of Correction to Certificate of Designation of Fixed-to-Floating Rate Non-Cumulative Perpetual Preferred Stock, Series B, filed January 25, 2022
|
||
|
Certificate of Correction to Certificate of Designation of 5.625% Non-Cumulative Perpetual Preferred Stock, Series C, filed January 25, 2022
|
||
|
Long-Term Incentive Plan, as amended and restated by the Board of Directors on January 25, 2022
|
||
|
Press Release, dated January 26, 2022
|
||
|
Investor Presentation dated January 26, 2022
|
||
|
104
|
Cover Page Interactive Data File (embedded within the Inline XBRL document)
|
Disclosures About Forward-Looking Statements
This Report may contain “forward-looking statements” within the meaning of the Private Securities Litigation Reform Act of 1995 regarding the
financial condition, results of operations, business plans and future performance of BancShares. Words such as “anticipates,” “believes,” “estimates,” “expects,” “forecasts,” “intends,” “plans,” “projects,” “targets,” “designed,” “could,” “may,”
“should,” “will” or other similar words and expressions are intended to identify these forward-looking statements. These forward-looking statements are based on BancShares’ current expectations and assumptions regarding BancShares’ business, the
economy, and other future conditions.
Because forward-looking statements relate to future results and occurrences, they are subject to inherent risks, uncertainties, changes in
circumstances and other factors that are difficult to predict. Many possible events or factors could affect BancShares’ future financial results and performance and could cause the actual results, performance or achievements of BancShares to differ
materially from any anticipated results expressed or implied by such forward-looking statements. Such risks and uncertainties include, among others, general competitive, economic, political, and market conditions, the impacts of the global COVID-19
pandemic on BancShares’ business, and customers, the financial success or changing conditions or strategies of BancShares’ customers or vendors, fluctuations in interest rates, actions of government regulators, the availability of capital and
personnel, the failure to realize the anticipated benefits of BancShares’ previously announced acquisition transaction(s), including the recently-completed transaction with CIT, which acquisition risks include (1) disruption from the transaction,
or recently completed mergers, with customer, supplier or employee relationships, (2) the possibility that the amount of the costs, fees, expenses and charges related to the transaction may be greater than anticipated, including as a result of
unexpected or unknown factors, events or liabilities, (3) reputational risk and the reaction of the parties’ customers to the transaction, (4) the risk that the cost savings and any revenue synergies from the transaction may not be realized or take
longer than anticipated to be realized, and (5) difficulties experienced in the integration of the businesses. Except to the extent required by applicable law or regulation, BancShares disclaims any obligation to update such factors or to publicly
announce the results of any revisions to any of the forward-looking statements included herein to reflect future events or developments. Additional factors which could affect the forward-looking statements can be found in BancShares’ Annual Report
on Form 10-K for the fiscal year ended December 31, 2020, its Quarterly Reports on Form 10-Q for the periods ended March 31, 2021, June 30, 2021 and September 30, 2021, and its other filings with the Securities and Exchange Commission (the “SEC”),
and in CIT’s Annual Report on Form 10-K for the fiscal year ended December 31, 2020, as amended on Form 10-K/A, its Quarterly Reports on Form 10-Q for the periods ended March 31, 2021, June 30, 2021 and September 30, 2021, and its other filings
with the SEC.
SIGNATURE
Pursuant to the requirements of the Securities Exchange Act of 1934, as amended, the Registrant has duly caused this report to be signed on its behalf by the undersigned
hereunto duly authorized.
|
First Citizens BancShares, Inc.
|
|||
|
(Registrant)
|
|||
|
Date:
|
January 26, 2022
|
By: /s/ Craig L. Nix
|
|
|
Craig L. Nix
|
|||
|
Chief Financial Officer
|
Exhibit 3.1
CERTIFICATE OF CORRECTION TO THE
CERTIFICATE OF DESIGNATION OF FIXED-TO-FLOATING RATE NON-CUMULATIVE PERPETUAL PREFERRED STOCK, SERIES B
OF FIRST CITIZENS BANCSHARES, INC.
First Citizens BancShares, Inc. (the “Company”), a corporation organized and existing under and by virtue of the General Corporation Law
of the State of Delaware, does hereby certify:
| 1. |
The name of the corporation is First Citizens BancShares, Inc.
|
| 2. |
That a Certificate of Designations (the “Certificate”) was filed with the Secretary of State of Delaware on January 3, 2022 and that said Certificate requires correction as permitted by Section 103 of the General Corporation Law of
Delaware.
|
| 3. |
The inaccuracy or defect of said Certificate is:
|
Due to a scrivener’s error, Section 4(d) of the Certificate erroneously provided that the initial Series B Dividend Period would commence on
and include the original issue date of the Series B Preferred Stock. However, the initial Series B Dividend Period should instead commence on December 15, 2022.
| 4. |
The first sentence of Section 4(d) of the Certificate is corrected to read as follows:
|
(d) A “Series B Dividend Period” is the period from and including a Series B Dividend Payment Date to, but excluding,
the next succeeding Series B Dividend Payment Date, except that the initial Series B Dividend Period will commence on and include December 15, 2022 and continue to, but exclude, June 15, 2022. Dividends payable on Series B Preferred Stock for the
Fixed Rate Period will be computed on the basis of a 360-day year consisting of twelve 30-day months.
| 5. |
All other provisions of the Certificate remain unchanged.
|
[Signature Page Immediately Follows]
IN WITNESS WHEREOF, the undersigned has executed this Certificate of Correction to the Certificate of Designation this 25th day of January 2022.
|
First Citizens BancShares, Inc.
|
||
|
By:
|
/s/ Matthew G. T. Martin
|
|
|
Name: Matthew G. T. Martin
|
||
|
Title: Chief Counsel and Corporate Secretary
|
||
Exhibit 3.2
CERTIFICATE OF CORRECTION TO THE
CERTIFICATE OF DESIGNATION OF 5.625% NON-CUMULATIVE
PERPETUAL PREFERRED STOCK, SERIES C
OF FIRST CITIZENS BANCSHARES, INC.
First Citizens BancShares, Inc. (the “Company”), a corporation organized and existing under and by virtue of the General Corporation Law
of the State of Delaware, does hereby certify:
| 1. |
The name of the corporation is First Citizens BancShares, Inc.
|
| 2. |
That a Certificate of Designations (the “Certificate”) was filed with the Secretary of State of Delaware on January 3, 2022 and that said Certificate requires correction as permitted by Section 103 of the General Corporation Law of
Delaware.
|
| 3. |
The inaccuracy or defect of said Certificate is:
|
Due to a scrivener’s error, Section 4(d) of the Certificate erroneously provided that the initial Series C Dividend Period would commence on
and include the original issue date of the Series C Preferred Stock. However, the initial Series C Dividend Period should instead commence on December 15, 2022.
| 4. |
The first sentence of Section 4(d) of the Certificate is corrected to read as follows:
|
(d) A “Series C Dividend Period” is the period from and including a Series C Dividend Payment Date to, but excluding,
the next succeeding Series C Dividend Payment Date, except that the initial Series C Dividend Period will commence on and include December 15, 2022 and continue to, but exclude, March 15, 2022.
| 5. |
All other provisions of the Certificate remain unchanged.
|
[Signature Page Immediately Follows]
IN WITNESS WHEREOF, the undersigned has executed this Certificate of Correction to the Certificate of Designation this 25th day of January 2022.
|
First Citizens BancShares, Inc.
|
||
|
By:
|
/s/ Matthew G. T. Martin
|
|
|
Name: Matthew G. T. Martin
|
||
|
Title: Chief Counsel and Corporate Secretary
|
||
Exhibit 10.1
FIRST-CITIZENS BANK & TRUST COMPANY
LONG-TERM INCENTIVE PLAN
(As amended and restated by the Board of Directors on January 25, 2022)
| 1. |
Purpose
|
The purpose of the First-Citizens Bank & Trust Company Long-Term Incentive Plan (the “Plan”), is to
provide selected salaried employees of First-Citizens Bank & Trust Company or an affiliate thereof (collectively, the “Company” unless the context otherwise requires) with the opportunity to earn awards (“awards”) in the form of cash bonuses
based upon attainment of preestablished, objective performance goals, thereby promoting a closer identification of the participating employees’ interests with the interests of the Company and its shareholders, and further stimulating such
employees’ efforts to enhance the efficiency, profitability, growth and value of the Company.
| 2. |
Plan Administration
|
The Plan shall be administered by the Compensation, Nominations and Governance Committee (the “Committee”), or a subcommittee of
the Committee, of the Board of Directors (the “Board”) of First Citizens BancShares, Inc. (“BancShares”) and First-Citizens Bank & Trust Company. In addition to action by meeting in accordance with applicable laws, any action of the Committee
with respect to the Plan may be taken by a written instrument signed by all of the members of the Committee, and any such action so taken by written consent shall be as fully effective as if it had been taken by a majority of the members at a
meeting duly held and called. Subject to the terms of the Plan, the Committee shall have full authority in its discretion to take any action with respect to the Plan, including, but not limited to, the authority to (i) determine all matters
relating to awards, including selection of individuals to be granted awards and all terms, conditions, restrictions and limitations of an award; and (ii) construe and interpret the Plan and any instruments evidencing awards granted under the Plan,
to establish and interpret rules and regulations for administering the Plan and to make all other determinations deemed necessary or advisable for administering the Plan. The Committee’s authority to grant awards and authorize payments under the
Plan shall not in any way restrict the authority of the Committee to grant compensation to employees under any other compensation plan or program of the Company. The Committee also shall have the authority and discretion to establish terms and
conditions of awards (including but not limited to the establishment of subplans) as the Committee determines to be necessary or appropriate to conform to the applicable requirements or practices of jurisdictions outside of the United States. Any
decision made, or action taken, by the Committee in connection with the administration of the Plan shall be final, binding and conclusive. Notwithstanding the foregoing, the Committee may delegate the administration of the Plan to one or more of
its designees (subject to any conditions imposed by the Committee), but only as may otherwise be permitted under applicable laws, rules or regulations. In the case of any such delegation, references to the “Committee” herein shall include such
designee or designees, unless the context otherwise requires. No member of the Board or the Committee shall be liable for any action, determination or decision made in good faith with respect to the Plan or any award paid under it. The members of
the Board and the Committee shall be entitled to indemnification and reimbursement in the manner and to the fullest extent provided in the Company’s articles of incorporation or by law.
| 3. |
Eligibility
|
The participants in the Plan (individually, a “participant,” and collectively, the “participants”) shall be those employees of
the Company and its affiliates who are in an eligible role during the performance period and are designated from time to time as participants by the Committee. Eligible roles are those roles that are deemed to be at the “Executive” Career Level,
as that term is defined in the Company’s Career Framework. Eligible participants shall be selected to participate on an annual or other periodic basis as determined by the Committee. Participation in the Plan for any one performance period does
not guarantee that an employee will be selected to participate in any other performance period. For the purposes of the Plan, “performance period” shall mean a period established by the Committee during which performance shall be measured to
determine if any payment will be made under the Plan. A performance period may be coincident with one or more fiscal years of the Company, or any portion thereof, and performance periods may be overlapping. An “affiliate” of the Company shall mean
any company (or other entity) controlled by, controlling or under common control with the Company, including BancShares.
| 4. |
Nature of Awards
|
Awards granted under the Plan shall be in the form of cash bonuses.
| 5. |
Awards
|
(a) Grant of Awards: At the time performance objectives are established for a performance period as provided in Section 5(b) herein, the Committee also shall
assign to each participant a target cash bonus award applicable for the particular performance period (each, a “target bonus”). A participant’s award, if any, shall be earned based on the attainment of written performance objectives approved by
the Committee for a specified performance period, as provided in Section 5(b) herein. Such performance objectives shall be established by the Committee no more than 90 days after the commencement of the performance period to which the
performance objective relates and before 25% of the relevant performance period has elapsed. During any fiscal year of the Company, no participant may be paid more than the maximum award limitation stated in Section 5(d) herein. The Committee
may adjust awards as appropriate for partial achievement of goals, exemplary effort on the part of a participant and/or other external, extraordinary or mitigating circumstances and may also interpret and make necessary and appropriate
adjustments to performance goals and the manner in which such performance goals are evaluated.
(b) Performance Objectives: For each performance period, the Committee shall establish one or more specific performance measures and specific goals for each
participant and/or for each group of participants. The performance objectives established by the Committee shall be based on one or more performance measures that apply to the individual participant (“individual performance”), business
unit/function performance (“business unit/function performance”), the Company as a whole (“corporate performance”), or any combination of individual performance, business unit/function performance or corporate performance. Without limiting the
foregoing, performance goals for business unit/function performance may be set for an identifiable business group, segment, unit, affiliate, facility, product line, product or function. If a participant’s performance goals are based on a
combination of individual performance, business unit/function performance and/or corporate performance, the Committee may weight the importance of each type of performance that applies to such participant by assigning a percentage to it. The
Committee may approve performance objectives that are objective and based upon one or more of the following criteria, as determined by the Committee: (i) revenues or sales; (ii) gross margins; (iii) earnings per share; (iv) consolidated
earnings before or after taxes (including earnings before interest, taxes, depreciation and amortization); (v) net income; (vi) operating income; (vii) book value per share, including tangible book value per share; (viii) dividends per share;
(ix) return on shareholders’ equity; (x) return on investment; (xi) return on capital; (xii) improvements in capital structure; (xiii) expense management; (xiv) operating margins; (xv) maintenance or improvement of gross margins or operating
margins; (xvi) stock price or total shareholder return; (xvii) market share; (xviii) profitability; (xix) costs; (xx) cash flow or free cash flow; (xxi) working capital; (xxii) return on assets; (xxiii) economic wealth created, and/or (xxiv)
strategic business criteria, based on meeting specified goals or objectives related to market penetration, geographic business expansion, cost targets, customer satisfaction, employee satisfaction, management of employment practices and
employee benefits, management of litigation, management of information technology, goals relating to acquisitions or divestitures of product lines, subsidiaries, affiliates or joint ventures, quality matrices, customer service matrices and/or
execution of pre-approved corporate strategy. In addition, the Committee may approve performance objectives based on other criteria, which may or may not be objective. The foregoing criteria may relate to the Company, one or more of its
affiliates or one or more of its divisions, units, partnerships, joint venturers or minority investments, facilities, product lines or products or any combination of the foregoing. The targeted level or levels of performance with respect to
such business criteria may be established at such levels and on such terms as the Committee may determine, in its discretion, including but not limited to on an absolute basis, in relation to performance in a prior performance period, and/or
relative to one or more peer group companies or indices, or any combination thereof. In addition, the performance objectives may be calculated without regard to extraordinary items.
(c)
Earning of Awards: As soon as practicable after the end of the performance period, the Committee shall determine whether the performance
goals for the performance period were achieved and, if so, at what level of achievement under specific formulae established for the performance period. If the performance goals were met for the performance period, the Committee shall determine
the percentage, if any, of the award (which may exceed 100%) earned by each participant and such award shall be paid in accordance with Section 5(e) herein (subject, however, to the limitation on awards stated in Section 5(d) herein).
(d)
Maximum Award Payable to Any One Participant: Other provisions of the Plan notwithstanding, the maximum amount of cash bonus awards that may be
paid under the Plan to any one participant in any one fiscal year shall not exceed $10,000,000.
(e)
Payment of Awards: An award earned by a participant with respect to a performance period shall be paid to him following the determination of
the amount, if any, of the award. Without limiting the foregoing, awards payable under the Plan shall be paid no later than 90 days following the last day of the performance period with respect to the award. The Committee shall have the
unilateral discretion to reduce or eliminate the amount of an award granted to any participant, including an award otherwise earned and payable pursuant to the terms of the Plan.
(f)
Forfeiture and Clawback Provisions: Awards paid to participants shall be subject to the provisions of any clawback policy implemented by the
Company, including, without limitation, the Company’s Incentive Compensation Policy.
| 6. |
Termination of Employment and Other Events; Covenants
|
The Committee shall specify the circumstances in which awards shall be paid or forfeited in the event of termination of
employment by the participant or other event prior to the end of a performance period or prior to payment of such awards. Unless otherwise determined by the Committee, if a participant dies, retires, becomes disabled, is assigned to a different
position, is granted a leave of absence, or if the participant’s employment is otherwise terminated (except for cause) by the Company during a performance period, a pro rata share of the participant’s award based on the period of actual
participation may, at the Committee’s discretion, be paid to the participant after the end of the performance period if and to the extent that it would have become earned and payable had the participant’s employment status not changed. The
Committee may require a participant, as a condition to the grant or payment of an award, to enter or have entered into agreements or covenants with the Company obligating the participant to not compete, to not interfere with the relationships of
the Company with customers, suppliers or employees in any way, to refrain from disclosing or misusing confidential or proprietary information of the Company, and to take or refrain from taking such other actions adverse to the Company as the
Committee may specify. The form of such agreements or covenants shall be specified by the Committee, which may vary such form from time to time and require renewal of the agreements or covenants, as then specified by the Committee, in connection
with the allocation or payout of any award.
| 7. |
No Right to Employment
|
Nothing contained in this Plan or any action taken pursuant to the Plan shall be construed as conferring
upon any participant the right or imposing upon him the obligation to continue in the employment of or service to the Company, nor shall it be construed as imposing upon the Company the obligation to continue the employment or service of a
participant. Except as may be otherwise provided in the Plan or determined by the Committee, all rights of a participant with respect to an award and distribution of any cash payment subject to an award shall terminate and be forfeited upon a
participant’s termination of employment or service with the Company.
| 8. |
Amendment and Termination
|
The Board may amend, discontinue or terminate the Plan in whole or in part at any time, provided that (a) approval of an
amendment to the Plan by the shareholders of the Company shall be required to the extent, if any, that shareholder approval of such amendment is required by applicable laws, rules or regulations; and (b) except as otherwise provided in Section
5(e), no such amendment, discontinuance or termination of the Plan shall adversely affect any award earned and payable under the Plan as of the date of such amendment or termination without the participant’s consent. However, notwithstanding the
foregoing, the Committee shall have unilateral authority to amend the Plan and any award (without participant consent) to the extent necessary to comply with applicable laws, rules or regulations or changes to applicable laws, rules or regulations
(including Code Section 409A, related regulations and other guidance), and to reduce or eliminate the amount of an award, as provided in Section 5(e).
| 9. |
Effective Date
|
The Plan, which was first effective as of January 1, 2014, was amended and restated by the Board on October
29, 2019, effective as of January 1, 2019, and was most recently amended and restated by the Board on January 25, 2022, effective as of January 1, 2022.
| 10. |
Miscellaneous
|
(a)
Taxes; Offset: Any tax required to be withheld by any government authority shall be deducted from each award. The Company has no responsibility
to take or refrain from taking any actions in order to achieve a certain tax result for the participant or any other person. Participants are solely responsible and liable for the satisfaction of all taxes and penalties that may arise in
connection with awards (including any taxes arising under Code Section 409A), and the Company shall not have any obligation to indemnify or otherwise hold any participant harmless from any or all of such taxes. The Committee, in its sole
discretion (but subject to applicable law), may apply any amounts payable to any participant hereunder as a setoff to satisfy any liabilities owed to the Company by the participant.
(b)
Nonassignability: Unless the Committee determines otherwise, awards and any other rights under the Plan shall not be subject to anticipation,
alienation, pledge, transfer or assignment by any person entitled thereto, except by designation of a beneficiary or by will or the laws of intestate succession.
(c) No Trust; Unfunded Plan: The obligation of the Company to make payments hereunder shall constitute a liability of the Company to the participants. Such
payments shall be made from the general funds of the Company, and the Company shall not be required to establish or maintain any special or separate fund, or otherwise to segregate assets to assure that such payments shall be made, and neither
the participants nor their beneficiaries shall have any interest in any particular assets of the Company by reason of its obligations hereunder. Nothing contained in this Plan shall create or be construed as creating a trust of any kind or any
other fiduciary relationship between the Company and the participants or any other person or constitute a guarantee that the assets of the Company shall be sufficient to pay any benefits to any person. To the extent that any person acquires a
right to receive payments from the Company hereunder, such right shall be no greater than the right of an unsecured creditor of the Company.
(d) Impact of Plan Award on other Plans: Awards granted pursuant to the Plan shall not be treated as compensation for purposes of any other compensation or
benefit plan, program or arrangement of the Company, unless either (i) such other plan, program or arrangement provides that compensation in the form of awards payable under the Plan are to be considered as compensation thereunder, or (ii) the
Committee so determines. The adoption of the Plan shall not affect any other incentive or other compensation plans or programs in effect for the Company, nor shall the Plan preclude the Company from establishing any other forms of incentive or
other compensation for employees of the Company.
(e)
Facility of Payments: If a participant or any other person entitled to receive an award under this Plan (the “recipient”) shall, at the time
payment of any such amount is due, be incapacitated so that such recipient cannot legally receive or acknowledge receipt of the payment, then the Committee, in its sole and absolute discretion, may direct that the payment be made to the legal
guardian, attorney-in-fact or person with whom such recipient is residing, and such payment shall be in full satisfaction of the Company’s obligation under the Plan with respect to such amount.
(f)
Beneficiary Designation: The Committee may permit a participant to designate in writing a person or persons as beneficiary, which beneficiary
shall be entitled to receive settlement of awards, if any, to which the participant is otherwise entitled in the event of death. In the absence of such designation by a participant, and in the event of the participant’s death, the estate of the
participant shall be treated as beneficiary for purposes of the Plan, unless the Committee determines otherwise. The Committee shall have sole discretion to approve and interpret the form or forms of such beneficiary designation.
(g) Governing Law: The Plan shall be construed and its provisions enforced and administered in accordance with the laws of the State of
North Carolina, without regard to the principles of conflicts of laws, and in accordance with applicable federal laws.
(h) Adjustments: The Committee is authorized at any time during or after the completion of a performance period, in its sole discretion,
to adjust or modify the terms of awards or performance objectives, or specify new awards, (i) in the event of any large, special and non-recurring dividend or distribution, recapitalization, reorganization, merger, consolidation, spin-off,
combination, repurchase, share exchange, forward or reverse split, stock dividend, liquidation, dissolution or other similar corporate transaction, (ii) in recognition of any other unusual or nonrecurring event affecting the Company or the
financial statements of the Company (including events described in (i) above as well as acquisitions and dispositions of businesses and assets and extraordinary items determined under U.S. Generally Accepted Accounting Principles (“GAAP”), or
(iii) in response to changes in applicable laws and regulations, accounting principles, and tax rates (and interpretations thereof) or changes in business conditions or the Committee’s assessment of the business strategy of the Company.
(i) Compliance with Code Section 409A: Notwithstanding any other provision in the Plan or an award to the contrary, if and to the
extent that Code Section 409A is deemed to apply to the Plan or any award granted under the Plan, it is the general intention of the Company that the Plan and any such award shall, to the extent practicable, be construed in accordance
therewith. Deferrals pursuant to an award otherwise exempt from Code Section 409A in a manner that would cause Code Section 409A to apply shall not be permitted unless such deferrals are in compliance with or exempt from Code Section 409A.
Without in any way limiting the effect of the foregoing, (i) in the event that Code Section 409A requires that any special terms, provision or conditions be included in the Plan or any award, then such terms, provisions and conditions shall, to
the extent practicable, be deemed to be made a part of the Plan and/or award, as applicable, and (ii) terms used in the Plan or an award shall be construed in accordance with Code Section 409A if and to the extent required. Further, in the
event that the Plan or any award shall be deemed not to comply with Code Section 409A, then neither the Company, the Board, the Committee nor its or their designees or agents shall be liable to any participant or other persons for actions,
decisions or determinations made in good faith. In addition:
(i) To the extent required by Section 409A of the Code, and notwithstanding any other provision of this Plan to the contrary, no payment of Non-Qualified Deferred Compensation (as such term is defined under Section 409A
of the Code and the regulations promulgated thereunder) will be provided to, or with respect to, the participant on account of his separation from service until the first to occur of (i) the date of the participant’s death or (ii) the date
which is one day after the six (6) month anniversary of his separation from service, but in either case only if he is a “specified employee” (as defined under Section 409A(a)(2)(B)(i) of the Code and the regulations promulgated thereunder) in
the year of his separation from service. Any payment that is delayed pursuant to the provisions of the immediately preceding sentence shall instead be paid in a lump sum promptly following the first to occur of the two dates specified in such
immediately preceding sentence.
(ii)
Any payment of Non-Qualified Deferred Compensation made pursuant to a voluntary or involuntary termination of the Participant’s employment with the Corporation shall be withheld until the Participant incurs both
(i) a termination of his employment relationship with the Corporation and all of the Affiliates and (ii) a “separation from service” with the Corporation and all of the Affiliates, as such term is defined in Treas. Reg. Section 1.409A-1(h).
(iii) To the extent the Plan provides that Non-Qualified Deferred Compensation can be paid, at the discretion of the Committee, during a certain period following a permissible payment event or trigger, and if the payment
period spans two taxable years of a participant, then such Non-Qualified Deferred Compensation shall be paid during the second of such taxable years (but not later than the 15th day of the third calendar month of such year).
(j) Restrictions on Awards: Notwithstanding any other Plan provision to the contrary, the Company shall not be obligated to make any
distribution of benefits under the Plan or take any other action, unless such distribution or action is in compliance with applicable laws, rules and regulations (including but not limited to applicable requirements of the Code).
(k) Gender and Number: Where the context admits, words in any gender shall include any other gender, words in the singular shall include
the plural and words in the plural shall include the singular.
(l) Severability: If any provision of the Plan shall be held illegal or invalid for any reason, such illegality or invalidity shall not
affect the remaining parts of the Plan, and the Plan shall be construed and enforced as if the illegal or invalid provision had not been included.
(m) Binding Effect: The Plan shall be binding upon the Company, its successors and assigns, and participants, their legal representatives,
executors, administrators and beneficiaries.
This First-Citizens Bank & Trust Company Long-Term Incentive Plan, as amended and restated effective as
of January 1, 2022, has been executed on behalf of the Company on the 25th day of January, 2022.
|
FIRST-CITIZENS BANK & TRUST COMPANY
|
|
By:
|
/s/ Frank B. Holding, Jr.
|
||
|
Frank B. Holding, Jr.
|
|||
|
Chief Executive Officer
|
|||
|
ATTEST:
|
||
|
/s/ Matthew G. Martin
|
||
|
|
Matthew G. Martin, Corporate Secretary
|
|
|
[Corporate Seal]
|
||
Exhibit 99.1
 |
|
For Immediate Release
|
Contact:
|
Barbara Thompson
|
Deanna Hart
|
|
January 26, 2022
|
Corporate Communications
|
Investor Relations
|
|
|
919-716-2716
|
919-716-2137
|
FIRST CITIZENS BANCSHARES REPORTS EARNINGS FOR FOURTH QUARTER AND FULL YEAR 2021
RALEIGH, N.C. -- First Citizens BancShares, Inc. (“BancShares”) (Nasdaq: FCNCA) reported earnings for the fourth quarter and year ended December 31, 2021. Key results
are presented below:
|
FOURTH QUARTER
RESULTS
|
|||||||||||||
|
Q4 2021
|
Q4 2020
|
Q4 2021
|
Q4 2020
|
Q4 2021
|
Q4 2020
|
Q4 2021
|
Q4 2020
|
Q4 2021
|
Q4 2020
|
||||
| Net income (in millions) |
Net income per share |
Net interest margin |
Return on average assets |
Return on average equity |
|||||||||
|
$123.3
|
$138.1
|
$12.09
|
$13.59
|
2.58%
|
3.02%
|
0.84%
|
1.11%
|
10.96%
|
14.02%
|
||||
|
YEAR-TO-DATE
(“YTD”) RESULTS
|
|||||||||||||
|
2021
|
2020
|
2021
|
2020
|
2021
|
2020
|
2021
|
2020
|
2021
|
2020
|
||||
|
Net income (in millions)
|
Net income per share |
Net interest margin |
Return on average assets |
Return on average equity |
|||||||||
|
$547.5
|
$491.7
|
$53.88
|
$47.50
|
2.66%
|
3.17%
|
1.00%
|
1.07%
|
12.84%
|
12.96%
|
||||
|
FOURTH QUARTER
HIGHLIGHTS
|
|
Net income
|
Net income was $123.3 million for the fourth quarter of 2021, a decrease of $14.8 million or 10.7%, compared to the same quarter in 2020. Net income per common share was $12.09 for the fourth quarter of 2021,
compared to $13.59 per share for the same quarter in 2020.
|
|
|
Return on
average assets
and equity
|
Return on average assets for the fourth quarter of 2021 was 0.84%, down from 1.11% for the comparable quarter in 2020. Return on average equity for the fourth quarter of 2021 was 10.96%, down from 14.02% for
the comparable quarter in 2020.
|
|
|
Net interest
income and
net interest
margin |
Net interest income was $357.4 million for the fourth quarter of 2021, a decrease of $1.3 million or 0.4%, compared to the same quarter in 2020 but was up $10.5 million or 3.0% compared to the third quarter
of 2021. The taxable-equivalent net interest margin (“NIM”) was 2.58% for the fourth quarter of 2021, down 44 basis points from 3.02% for the comparable quarter in 2020 and down 3 basis points from 2.61% in the third quarter of 2021.
|
|
|
Provision for
credit losses
|
The provision for credit losses was a net benefit of $5.1 million during the fourth quarter of 2021, compared to a $5.4 million expense during the same quarter in 2020. The allowance for credit losses (“ACL”)
was $178.5 million at December 31, 2021, compared to $224.3 million at December 31, 2020, representing 0.55% and 0.68% of loans, respectively.
|
|
|
Operating
performance
|
Noninterest income was $114.3 million for the fourth quarter of 2021, a decrease of $12.5 million or 9.9%, compared to the same quarter in 2020. Noninterest expense was $323.2 million for the fourth quarter
of 2021, an increase of $17.8 million or 5.8%, compared to the same quarter in 2020.
|
|
|
Loans and
credit quality
|
Total loans were $32.4 billion, a decrease of $420.5 million or 1.3%, since December 31, 2020. Excluding loans originated under the Small Business Administration Paycheck Protection Program (“SBA-PPP”), total
loans increased $1.5 billion, or by 4.9%, since December 31, 2020. Total loans decreased $144.7 million, or by 1.8% on an annualized basis, compared to September 30, 2021. Excluding SBA-PPP loans, total loans increased $448.4 million, or by
5.7% annualized in the fourth quarter of 2021. The net charge-off ratio was -0.01% for the fourth quarter of 2021 compared to 0.06% for the same quarter in 2020.
|
|
|
Deposits
|
Total deposits grew to $51.4 billion, an increase of $8.0 billion or 18.4%, since December 31, 2020, driven by organic growth. Deposits increased $1.3 billion, or by 10.6% on an annualized basis, compared to
September 30, 2021.
|
|
|
Capital
|
BancShares remained well-capitalized with a total risk-based capital ratio of 14.35%, a Tier 1 risk-based capital ratio of 12.47%, a Common Equity Tier 1 ratio of 11.50% and a Tier 1
leverage ratio of 7.59%.
|
MERGER WITH CIT GROUP, INC.
On January 3, 2022, BancShares completed its previously announced merger with CIT Group, Inc. (“CIT”) creating a top 20 U.S. financial institution (based on assets)
and the largest family-controlled bank in the nation.
“The close of the First Citizens and CIT merger marked a transformational milestone in our company’s history and the true start of our integration efforts,” said Frank
B. Holding Jr., First Citizens chairman and chief executive officer. “We’re officially one stronger and better team, with complementary strengths positioned to give our customers greater access to a broader range of products and services. We’re
creating a bank with more ways to fulfill our Forever First promise to customers and prospects — one that helps more people and supports our communities across the nation.”
CIT, CIT Bank and OneWest Bank are currently operating as divisions of First Citizens Bank, and these customers are able to continue to bank as they normally do. For
now, these customers are being served through their current branches, websites, mobile apps, bankers and advisors. Over the coming months, a series of conversions to First Citizens’ systems and operations will take place.
The fourth quarter and full year results included in this earnings release do not include financial results of CIT. Limited financial information on CIT’s results for
the quarter and year ended December 31, 2021 will be included in our fourth quarter 2021 earnings presentation.
NET INTEREST INCOME & NET INTEREST MARGIN
Net interest income was $357.4 million for the fourth quarter of 2021, a decrease of $1.3 million or 0.4% compared to the same quarter in 2020. This was primarily due
to a decline in the yield on loans and a decrease in interest and fee income on SBA-PPP loans, largely offset by organic loan growth, higher investment and overnight balances and yields, as well as lower rates on interest-bearing deposits. SBA-PPP
loans contributed $26.5 million in interest and fee income for the fourth quarter of 2021 compared to $42.2 million for the same quarter in 2020. Net interest income increased $10.5 million compared to the linked quarter due primarily to higher
SBA-PPP interest and fee income and increased loan (excluding SBA-PPP loans) and investment balances. This increase was partially offset by declines in loan and investment yields. SBA-PPP loans contributed $20.0 million in interest and fee income
during the third quarter of 2021.
The taxable-equivalent NIM was 2.58% during the fourth quarter of 2021, a decrease of 44 basis points from 3.02% for the comparable quarter in 2020. The margin decline
was primarily due to changes in earning asset mix driven by excess liquidity and higher balances in overnight investments, a decline in the yield on loans and lower income on SBA-PPP loans. These declines were partially offset by lower rates paid
on interest-bearing deposits and higher investment yields. The taxable-equivalent NIM declined 3 basis points from 2.61% for the linked quarter primarily due to changes in earning asset mix and lower investment yields, partially offset by an
increase in SBA-PPP income.
Net interest income was $1.39 billion for the twelve months ended December 31, 2021, an increase of $2.2 million or 0.2% compared to the same period in 2020. While
total net interest income in both periods was materially unchanged, there were components that varied period over period. The items positively impacting net interest income included increased loan, investment and overnight balances, as well as
lower deposit rates and an increase in SBA-PPP income. These increases were largely offset by a decline in the yield on interest-earning assets. SBA-PPP loans contributed $104.6 million in interest and fee income for the twelve months ended
December 31, 2021, compared to $90.1 million for the same period in 2020.
The taxable-equivalent NIM was 2.66% for the twelve months ended December 31, 2021, a decrease of 51 basis points from 3.17% for the comparable period in 2020. The
margin decline was primarily due to changes in earning asset mix and a decline in the yield on interest-earning assets, partially offset by lower rates paid on interest-bearing deposits and increased income from SBA-PPP loans.
PROVISION FOR CREDIT LOSSES
Provision for credit losses was a net benefit of $5.1 million for the fourth quarter of 2021 compared to $5.4 million in expense for the same quarter in 2020. The
fourth quarter of 2021 was favorably impacted by a $4.7 million reserve release driven primarily by continued strong credit performance, low net charge-offs and improvement in macroeconomic factors. Total net recoveries for the fourth quarter of
2021 were $0.4 million compared to net charge-offs of $5.0 million for the comparable quarter in 2020. The net charge-off ratio was (0.01%) for the fourth quarter of 2021 compared to 0.06% for the same quarter in 2020.
Provision for credit losses was a benefit of $36.8 million for the twelve months ended December 31, 2021, compared to $58.4 million in expense for the same period in
2020. Provision for credit losses for the twelve months ended December 31, 2021, was favorably impacted by a $45.8 million reserve release driven primarily by improvement in macroeconomic factors, continued strong credit performance and low net
charge-offs. The comparable period in 2020 included a $35.9 million reserve build related to uncertainties surrounding COVID-19. Net charge-offs for the twelve months ended December 31, 2021, were $9.0 million, a decrease from $22.4 million for the
comparable period in 2020 due to a lower volume of charge-offs and higher recoveries. The net charge-off ratio was 0.03% for the twelve months ended December 31, 2021, compared to 0.07% for the same period in 2020.
NONINTEREST INCOME
Noninterest income was $114.3 million for the fourth quarter of 2021, a decrease of $12.5 million or 9.9%, compared to $126.8 million for the same quarter in 2020.
Contributing to the decline was a $15.9 million reduction in fair market value adjustments on marketable equity securities, a $6.0 million decrease in mortgage income due to reductions in gain on sale and production volume driven by higher mortgage
rates and increased competition and a $5.3 million decline in realized gains on available for sale securities. These declines were partially offset by a $5.3 million increase in wealth management services due to growth in assets under management
resulting in higher advisory and transaction fees, a $3.6 million increase in service charges on deposit accounts, a $2.6 million increase in cardholder services, net, and a $1.2 million increase in both merchant services, net and other service
charges and fees. Excluding fair market value adjustments on marketable equity securities and realized gains on available for sale securities, noninterest income was $111.2 million for the fourth quarter of 2021, an increase of $8.6 million or 8.4%
compared to $102.6 million for the same quarter in 2020.
Noninterest income was $508.0 million for the twelve months ended December 31, 2021, an increase of $31.3 million or 6.6% compared to $476.8 million for the same
period in 2020. The primary drivers of the increase were a $26.0 million increase in wealth management services due to growth in assets under management resulting in higher advisory and transaction fees, a $12.4 million increase in cardholder
services, net, a $9.0 million increase in merchant services, net, a $7.1 million increase in service charges on deposit accounts, a $5.0 million increase in other service charges and fees and a $4.7 million favorable change in fair market value
adjustments on marketable equity securities. These increases were partially offset by a $27.1 million decrease in realized gains on available for sale securities due to lower sales volume and a $9.1 million decline in mortgage income due to
reductions in gain on sale and production volume driven by higher mortgage rates and increased competition. Excluding fair market value adjustments on marketable equity securities and realized gains on available for sale securities, noninterest
income was $440.8 million for the twelve months ended December 31, 2021, an increase of $53.7 million or 13.9%, compared to $387.1 million for the same period in 2020.
NONINTEREST EXPENSE
Noninterest expense was $323.2 million for the fourth quarter of 2021, an increase of $17.8 million or 5.8%, compared to the same quarter in 2020. The primary driver
of the increase was a $9.9 million increase in salaries and wages driven by annual merit increases, increases in revenue-driven incentives, and an increase in temporary personnel cost. Additionally contributing to the increase was a $4.5 million
increase in merger-related expenses related to the merger with CIT and a $3.7 million increase in processing fees paid to third parties driven by our continued investments in digital and technology to support revenue-generating businesses and
improve internal processes.
Noninterest expense was $1.2 billion for the twelve months ended December 31, 2021, an increase of $44.8 million or 3.8% compared to the same period in 2020. The most
significant driver of the increase was a $33.2 million increase in salaries and wages due primarily to annual merit increases, increases in revenue-driven incentives, and an increase in temporary personnel costs. Also contributing to the higher
expense was an $15.0 million increase in processing fees paid to third parties driven by our continued investments in digital and technology to support revenue-generating businesses and improve internal processes, and a $12.0 million increase in
merger-related expense associated with the CIT merger. These increases were partially offset by a $15.6 million decrease in other expense due largely attributable to a decline in pension expense and amortization of core deposit intangibles, as well
as an $8.2 million decrease in collection and foreclosure-related expenses.
INCOME TAXES
Income tax expense totaled $30.3 million and $36.6 million for the fourth quarter of 2021 and 2020, respectively, representing effective tax rates of 19.7% and 21.0%
for the respective periods. Income tax expense totaled $154.2 million and $126.2 million for the year ended 2021 and 2020, respectively, representing effective tax rates of 22.0% and 20.4% for the respective periods.
In 2021 and 2020 BancShares’ utilized an allowable alternative for computing its federal income tax liability. The allowable alternative provides BancShares the
ability to use the federal income tax rate for certain current year deductible amounts related to prior year FDIC-assisted acquisitions that was applicable when these amounts were originally subjected to tax. Without this alternative, the effective
tax rates for 2021 would be materially unchanged and the annual effective tax rate for the fourth quarter and year ended 2020 would have been approximately 23.0% and 22.7% respectively.
LOANS AND DEPOSITS
At December 31, 2021, loans totaled $32.4 billion, a decrease of $420.5 million or 1.3% since December 31, 2020. SBA-PPP loans totaled $493.8 million as of December
31, 2021, compared to $2.4 billion as of December 31, 2020. Excluding SBA-PPP loans, total loans increased $1.5 billion, or by 4.9% since December 31, 2020. Total loans decreased $144.7 million, or by 1.8% on an annualized basis compared to
September 30, 2021. Excluding SBA-PPP loans, total loans increased $448.4 million, or by 5.7% on an annualized basis during the fourth quarter of 2021.
At December 31, 2021, deposits totaled $51.4 billion, an increase of $8.0 billion or 18.4%, since December 31, 2020, driven by organic growth. Deposits increased $1.3
billion, or by 10.6% on an annualized basis since September 30, 2021.
ALLOWANCE FOR CREDIT LOSSES (ACL)
The ACL was $178.5 million at December 31, 2021, compared to $224.3 million at December 31, 2020, a decrease of $45.8 million. The ACL as a percentage of total loans
and leases was 0.55% at December 31, 2021, compared to 0.68% at December 31, 2020. The reduction was primarily due to a $45.8 million reserve release for the twelve months ended December 31, 2021, driven primarily by continued strong credit
performance, low net charge-offs and improvement in macroeconomic factors.
NONPERFORMING ASSETS
Nonperforming assets, including nonaccrual loans and other real estate owned, were $159.6 million or 0.49% of total loans and other real estate owned at December 31,
2021, compared to $242.4 million or 0.74% at December 31, 2020.
CAPITAL TRANSACTIONS
During the fourth quarter of 2021 and in the fourth quarter of 2020, BancShares did not repurchase any shares of Class A common stock. For the twelve months ended
December 31, 2021, BancShares did not repurchase any shares of Class A common stock compared to repurchases of 813,090 shares of Class A common stock for $333.8 million at an average cost per share of $410.48 for the comparable period in 2020. All
Class A common stock repurchases completed in 2020 were consummated under previously approved authorizations. Following the expiration of our latest share repurchase authorization on July 31, 2020, share repurchase activity was suspended.
EARNINGS CALL DETAILS
BancShares will host a conference call to discuss the company's financial results on Wednesday. January 26, 2022, at 9 a.m. Eastern time.
To access this call, dial:
Domestic: 833-654-8257
International: 602-585-9869
Conference ID: 1049136
The fourth quarter 2021 earnings presentation and this news release are available on the company’s website at www.firstcitizens.com/investor-relations.
After the conference call, you may access a replay of the call through February 10, 2022, by dialing 855-859-2056 (domestic) or 404-537-3406 (international) with
conference ID 1049136.
ABOUT FIRST CITIZENS BANCSHARES
BancShares is the financial holding company for First-Citizens Bank & Trust Company (“First Citizens Bank”) which helps personal, business, commercial and wealth
clients build financial strength that lasts. As the largest family-controlled bank in the United States, First Citizens is continuing a unique legacy of strength, stability and long-term thinking that has spanned generations. Founded in 1898 and
headquartered in Raleigh, N.C., First Citizens also operates a nationwide direct bank and a network of more than 600 branches in 22 states. Industry specialists bring a depth of expertise that helps businesses and individuals meet their specific
goals at every stage of their financial journey. First Citizens Bank brings together personal service and powerful tools to help customers do more with their money – and make more of their future. Visit First Citizens’ website at firstcitizens.com.
First Citizens Bank. Forever First®
FORWARD-LOOKING STATEMENTS
This communication contains “forward-looking statements” within the meaning of the Private Securities Litigation Reform Act of 1995 regarding the financial condition,
results of operations, business plans and future performance of BancShares. Words such as “anticipates,” “believes,” “estimates,” “expects,” “predicts,” “forecasts,” “intends,” “plans,” “projects,” “targets,” “designed,” “could,” “may,” “should,”
“will,” “potential,” “continue” or other similar words and expressions are intended to identify these forward-looking statements. These forward-looking statements are based on BancShares’ current expectations and assumptions regarding BancShares’
business, the economy, and other future conditions.
Because forward-looking statements relate to future results and occurrences, they are subject to inherent risks, uncertainties, changes in circumstances and other risk
factors that are difficult to predict. Many possible events or factors could affect BancShares’ future financial results and performance and could cause the actual results, performance or achievements of BancShares to differ materially from any
anticipated results expressed or implied by such forward-looking statements. Such risks and uncertainties include, among others, general competitive, economic, political, and market conditions, the impacts of the global COVID-19 pandemic on
BancShares’ business and customers, the financial success or changing conditions or strategies of BancShares’ customers or vendors, fluctuations in interest rates, actions of government regulators, the availability of capital and personnel, and the
failure to realize the anticipated benefits of BancShares’ previous acquisition transaction(s), including the recently completed transaction with CIT, which acquisition risks include (1) disruption from the transaction, or recently completed
mergers, with customer, supplier or employee relationships, (2) the possibility that the amount of the costs, fees, expenses and charges related to the transaction may be greater than anticipated, including as a result of unexpected or unknown
factors, events or liabilities, (3) reputational risk and the reaction of the parties’ customers to the transaction, (4) the risk that the cost savings and any revenue synergies from the transaction may not be realized or take longer than
anticipated to be realized, and (5) difficulties experienced in the integration of the businesses.
Except to the extent required by applicable laws or regulations, BancShares disclaims any obligation to update forward-looking statements or to publicly announce the
results of any revisions to any of the forward-looking statements included herein to reflect future events or developments. Additional factors which could affect the forward-looking statements can be found in BancShares’ Annual Report on Form 10-K
for the fiscal year ended December 31, 2020, its Quarterly Reports on Form 10-Q for the periods ended March 31, 2021, June 30, 2021 and September 30, 2021, and its other filings with the Securities and Exchange Commission (the “SEC”), and in CIT’s
Annual Report on Form 10-K for the fiscal year ended December 31, 2020, as amended on Form 10-K/A, its Quarterly Reports on Form 10-Q for the periods ended March 31, 2021, June 30, 2021 and September 30, 2021, and its other filings with the SEC.
###
CONSOLIDATED BALANCE SHEETS (UNAUDITED)
|
(Dollars in thousands, unaudited)
|
December 31, 2021
|
December 31, 2020
|
||||||
|
Assets
|
||||||||
|
Cash and due from banks
|
$
|
337,814
|
$
|
362,048
|
||||
|
Overnight investments
|
9,114,660
|
4,347,336
|
||||||
|
Investment in marketable equity securities (cost of $72,894 at December 31, 2021 and $84,837 at December 31, 2020)
|
97,528
|
91,680
|
||||||
|
Investment securities available for sale (cost of $9,215,219 at December 31, 2021 and $6,911,965 at December 31, 2020)
|
9,203,427
|
7,014,243
|
||||||
|
Investment securities held to maturity (fair value of $3,759,650 at December 31, 2021 and $2,838,499 at December 31, 2020)
|
3,809,453
|
2,816,982
|
||||||
|
Loans held for sale
|
98,741
|
124,837
|
||||||
|
Loans and leases
|
32,371,522
|
32,791,975
|
||||||
|
Allowance for credit losses
|
(178,493
|
)
|
(224,314
|
)
|
||||
|
Net loans and leases
|
32,193,029
|
32,567,661
|
||||||
|
Premises and equipment
|
1,233,418
|
1,251,283
|
||||||
|
Other real estate owned
|
39,328
|
50,890
|
||||||
|
Income earned not collected
|
134,237
|
145,694
|
||||||
|
Goodwill
|
346,064
|
350,298
|
||||||
|
Other intangible assets
|
43,085
|
50,775
|
||||||
|
Other assets
|
1,657,356
|
783,953
|
||||||
|
Total assets
|
$
|
58,308,140
|
$
|
49,957,680
|
||||
|
Liabilities
|
||||||||
|
Deposits:
|
||||||||
|
Noninterest-bearing
|
$
|
21,404,808
|
$
|
18,014,029
|
||||
|
Interest-bearing
|
30,001,286
|
25,417,580
|
||||||
|
Total deposits
|
51,406,094
|
43,431,609
|
||||||
|
Securities sold under customer repurchase agreements
|
589,101
|
641,487
|
||||||
|
Federal Home Loan Bank borrowings
|
644,659
|
655,175
|
||||||
|
Subordinated debt
|
477,564
|
504,518
|
||||||
|
Other borrowings
|
72,155
|
88,470
|
||||||
|
FDIC shared-loss payable
|
—
|
15,601
|
||||||
|
Other liabilities
|
381,326
|
391,552
|
||||||
|
Total liabilities
|
53,570,899
|
45,728,412
|
||||||
|
Shareholders’ equity
|
||||||||
|
Common stock:
|
||||||||
|
Class A - $1 par value (16,000,000 shares authorized; 8,811,220 shares issued and outstanding at December 31, 2021 and December 31, 2020)
|
8,811
|
8,811
|
||||||
|
Class B - $1 par value (2,000,000 shares authorized; 1,005,185 shares issued and outstanding at December 31, 2021 and December 31, 2020)
|
1,005
|
1,005
|
||||||
|
Preferred stock - $0.01 par value (10,000,000 shares authorized; 345,000 shares issued and outstanding at December 31, 2021 and December 31, 2020;
$1,000 per share liquidity preference)
|
339,937
|
339,937
|
||||||
|
Retained earnings
|
4,377,712
|
3,867,252
|
||||||
|
Accumulated other comprehensive income
|
9,776
|
12,263
|
||||||
|
Total shareholders’ equity
|
4,737,241
|
4,229,268
|
||||||
|
Total liabilities and shareholders’ equity
|
$
|
58,308,140
|
$
|
49,957,680
|
||||
CONSOLIDATED STATEMENTS OF INCOME (UNAUDITED)
|
Three months ended
|
Twelve months ended
|
|||||||||||||||||||
|
(Dollars in thousands, except per share data, unaudited)
|
December 31,
2021
|
September 30,
2021
|
December 31,
2020
|
December 31,
2021
|
December 31,
2020
|
|||||||||||||||
|
Interest income
|
||||||||||||||||||||
|
Loans and leases
|
$
|
328,288
|
$
|
319,214
|
$
|
344,691
|
$
|
1,294,813
|
$
|
1,332,720
|
||||||||||
|
Investment securities interest and dividend income
|
39,670
|
39,246
|
31,166
|
145,200
|
144,459
|
|||||||||||||||
|
Overnight investments
|
4,049
|
3,395
|
1,019
|
10,997
|
6,847
|
|||||||||||||||
|
Total interest income
|
372,007
|
361,855
|
376,876
|
1,451,010
|
1,484,026
|
|||||||||||||||
|
Interest expense
|
||||||||||||||||||||
|
Deposits
|
7,832
|
8,073
|
11,057
|
33,240
|
66,635
|
|||||||||||||||
|
Securities sold under customer repurchase agreements
|
260
|
358
|
374
|
1,312
|
1,610
|
|||||||||||||||
|
Federal Home Loan Bank borrowings
|
2,110
|
2,114
|
2,151
|
8,410
|
9,763
|
|||||||||||||||
|
Subordinated debt
|
4,166
|
4,174
|
4,291
|
16,709
|
16,074
|
|||||||||||||||
|
Other borrowings
|
237
|
249
|
287
|
1,005
|
1,775
|
|||||||||||||||
|
Total interest expense
|
14,605
|
14,968
|
18,160
|
60,676
|
95,857
|
|||||||||||||||
|
Net interest income
|
357,402
|
346,887
|
358,716
|
1,390,334
|
1,388,169
|
|||||||||||||||
|
Provision (credit) for credit losses
|
(5,138
|
)
|
(1,120
|
)
|
5,403
|
(36,835
|
)
|
58,352
|
||||||||||||
|
Net interest income after provision for credit losses
|
362,540
|
348,007
|
353,313
|
1,427,169
|
1,329,817
|
|||||||||||||||
|
Noninterest income
|
||||||||||||||||||||
|
Wealth management services
|
32,902
|
31,935
|
27,624
|
128,788
|
102,776
|
|||||||||||||||
|
Service charges on deposit accounts
|
26,479
|
24,858
|
22,886
|
94,756
|
87,662
|
|||||||||||||||
|
Cardholder services, net
|
21,374
|
22,879
|
18,788
|
86,684
|
74,291
|
|||||||||||||||
|
Other service charges and fees
|
9,270
|
9,205
|
8,082
|
35,923
|
30,911
|
|||||||||||||||
|
Merchant services, net
|
7,282
|
8,409
|
6,108
|
33,140
|
24,122
|
|||||||||||||||
|
Mortgage income
|
5,482
|
6,106
|
11,451
|
30,508
|
39,592
|
|||||||||||||||
|
Insurance commissions
|
3,854
|
4,000
|
4,091
|
15,556
|
14,544
|
|||||||||||||||
|
ATM income
|
1,468
|
1,481
|
1,404
|
6,002
|
5,758
|
|||||||||||||||
|
Marketable equity securities gains, net
|
3,066
|
8,082
|
18,934
|
34,081
|
29,395
|
|||||||||||||||
|
Realized gains on investment securities available for sale, net
|
—
|
3,350
|
5,281
|
33,119
|
60,253
|
|||||||||||||||
|
Other
|
3,082
|
2,639
|
2,116
|
9,445
|
7,446
|
|||||||||||||||
|
Total noninterest income
|
114,259
|
122,944
|
126,765
|
508,002
|
476,750
|
|||||||||||||||
|
Noninterest expense
|
||||||||||||||||||||
|
Salaries and wages
|
160,774
|
160,947
|
150,835
|
623,194
|
590,020
|
|||||||||||||||
|
Employee benefits
|
32,490
|
32,146
|
31,581
|
135,659
|
132,244
|
|||||||||||||||
|
Occupancy expense
|
29,897
|
29,101
|
32,143
|
117,180
|
117,169
|
|||||||||||||||
|
Equipment expense
|
30,237
|
30,229
|
29,481
|
119,171
|
115,535
|
|||||||||||||||
|
Processing fees paid to third parties
|
16,041
|
15,602
|
12,306
|
59,743
|
44,791
|
|||||||||||||||
|
FDIC insurance expense
|
3,871
|
3,661
|
3,337
|
14,132
|
12,701
|
|||||||||||||||
|
Collection and foreclosure-related expenses
|
2,235
|
836
|
3,487
|
5,442
|
13,658
|
|||||||||||||||
|
Merger-related expenses
|
9,862
|
7,013
|
5,342
|
29,463
|
17,450
|
|||||||||||||||
|
Other
|
37,781
|
33,283
|
36,861
|
129,526
|
145,117
|
|||||||||||||||
|
Total noninterest expense
|
323,188
|
312,818
|
305,373
|
1,233,510
|
1,188,685
|
|||||||||||||||
|
Income before income taxes
|
153,611
|
158,133
|
174,705
|
701,661
|
617,882
|
|||||||||||||||
|
Income taxes
|
30,329
|
34,060
|
36,621
|
154,202
|
126,159
|
|||||||||||||||
|
Net income
|
$
|
123,282
|
$
|
124,073
|
$
|
138,084
|
$
|
547,459
|
$
|
491,723
|
||||||||||
|
Preferred stock dividends
|
4,636
|
4,636
|
4,636
|
18,544
|
14,062
|
|||||||||||||||
|
Net income available to common shareholders
|
$
|
118,646
|
$
|
119,437
|
$
|
133,448
|
$
|
528,915
|
$
|
477,661
|
||||||||||
|
Weighted average common shares outstanding
|
9,816,405
|
9,816,405
|
9,816,405
|
9,816,405
|
10,056,654
|
|||||||||||||||
|
Earnings per common share
|
$
|
12.09
|
$
|
12.17
|
$
|
13.59
|
$
|
53.88
|
$
|
47.50
|
||||||||||
|
Dividends declared per common share
|
0.47
|
0.47
|
0.47
|
1.88
|
1.67
|
|||||||||||||||
SELECTED QUARTERLY RATIOS
|
Three months ended
|
||||||||||||
|
December 31, 2021
|
September 30, 2021
|
December 31, 2020
|
||||||||||
|
SELECTED RATIOS (1)
|
||||||||||||
|
Book value per share at period-end
|
$
|
447.95
|
$
|
432.07
|
$
|
396.21
|
||||||
|
Annualized return on average assets
|
0.84
|
%
|
0.88
|
%
|
1.11
|
%
|
||||||
|
Annualized return on average equity
|
10.96
|
11.29
|
14.02
|
|||||||||
|
Total risk-based capital ratio
|
14.35
|
14.30
|
13.81
|
|||||||||
|
Tier 1 risk-based capital ratio
|
12.47
|
12.32
|
11.63
|
|||||||||
|
Common equity Tier 1 ratio
|
11.50
|
11.34
|
10.61
|
|||||||||
|
Tier 1 leverage capital ratio
|
7.59
|
7.68
|
7.86
|
|||||||||
(1) Capital ratios are preliminary
ALLOWANCE FOR CREDIT LOSSES AND ASSET QUALITY DISCLOSURES
|
Three months ended
|
||||||||||||
|
(Dollars in thousands, unaudited)
|
December 31, 2021
|
September 30, 2021
|
December 31, 2020
|
|||||||||
|
ALLOWANCE FOR CREDIT LOSSES (1)
|
||||||||||||
|
ACL at beginning of period
|
$
|
183,194
|
$
|
189,094
|
$
|
223,936
|
||||||
|
Provision for credit losses
|
(5,138
|
)
|
(1,120
|
)
|
5,403
|
|||||||
|
Net charge-offs of loans and leases:
|
||||||||||||
|
Charge-offs
|
(8,258
|
)
|
(11,074
|
)
|
(9,848
|
)
|
||||||
|
Recoveries
|
8,695
|
6,293
|
4,823
|
|||||||||
|
Net charge-offs of loans and leases
|
437
|
(4,781
|
)
|
(5,025
|
)
|
|||||||
|
ACL at end of period
|
$
|
178,493
|
$
|
183,193
|
$
|
224,314
|
||||||
|
ACL at end of period allocated to:
|
||||||||||||
|
PCD
|
$
|
14,802
|
$
|
18,438
|
$
|
23,987
|
||||||
|
Non-PCD
|
163,691
|
164,756
|
200,327
|
|||||||||
|
ACL at end of period
|
$
|
178,493
|
$
|
183,194
|
$
|
224,314
|
||||||
|
Reserve for unfunded commitments
|
$
|
11,815
|
$
|
11,472
|
$
|
12,814
|
||||||
|
SELECTED LOAN DATA
|
||||||||||||
|
Average loans and leases:
|
||||||||||||
|
PCD
|
$
|
356,997
|
$
|
384,673
|
$
|
479,302
|
||||||
|
Non-PCD
|
32,030,717
|
32,222,960
|
32,374,204
|
|||||||||
|
Loans and leases at period-end:
|
||||||||||||
|
PCD
|
337,624
|
373,255
|
462,882
|
|||||||||
|
Non-PCD
|
32,033,898
|
32,142,934
|
32,329,093
|
|||||||||
|
RISK ELEMENTS
|
||||||||||||
|
Nonaccrual loans and leases
|
$
|
120,306
|
$
|
163,775
|
$
|
191,483
|
||||||
|
Other real estate owned
|
39,328
|
40,649
|
50,890
|
|||||||||
|
Total nonperforming assets
|
$
|
159,634
|
$
|
204,424
|
$
|
242,373
|
||||||
|
Accruing loans and leases 90 days or more past due
|
$
|
6,925
|
$
|
5,614
|
$
|
5,862
|
||||||
|
RATIOS
|
||||||||||||
|
Net charge-offs (annualized) to average loans and leases
|
(0.01
|
)%
|
0.06
|
%
|
0.06
|
%
|
||||||
|
ACL to total loans and leases(2):
|
||||||||||||
|
PCD
|
4.38
|
4.94
|
5.18
|
|||||||||
|
Non-PCD
|
0.51
|
0.51
|
0.62
|
|||||||||
|
Total
|
0.55
|
0.56
|
0.68
|
|||||||||
|
Ratio of total nonperforming assets to total loans, leases and other real estate owned
|
0.49
|
0.63
|
0.74
|
|||||||||
(1) BancShares recorded no ACL on investment securities as of December 31, 2021, September 30, 2021, or December
31, 2020.
(2) Loans originated in relation to the SBA-PPP do not have a recorded ACL. As of December 31, 2021, the ratio of ACL to total Non-PCD loans excluding
SBA-PPP loans was 0.52% while the ratio of ACL to total loans excluding SBA-PPP loans was 0.56%. As of December 31, 2020, the ratio of ACL to total Non-PCD loans excluding SBA-PPP loans was 0.67% while the ratio of ACL to total loans excluding
SBA-PPP loans was 0.74%.
AVERAGE BALANCE SHEETS AND NET INTEREST MARGIN
|
Three months ended
|
||||||||||||||||||||||||||||||||||||
|
December 31, 2021
|
September 30, 2021
|
December 31, 2020
|
||||||||||||||||||||||||||||||||||
|
(Dollars in thousands, unaudited)
|
Average
Balance
|
Interest
|
Yield/
Rate (2)
|
Average
Balance
|
Interest
|
Yield/
Rate (2)
|
Average
Balance
|
Interest
|
Yield/
Rate (2)
|
|||||||||||||||||||||||||||
|
INTEREST-EARNING ASSETS
|
||||||||||||||||||||||||||||||||||||
|
Loans and leases (1)
|
$
|
32,488,033
|
$
|
328,781
|
3.98
|
%
|
$
|
32,707,591
|
$
|
319,738
|
3.85
|
%
|
$
|
32,964,390
|
$
|
345,300
|
4.12
|
%
|
||||||||||||||||||
|
Investment securities:
|
||||||||||||||||||||||||||||||||||||
|
U.S. Treasury
|
560,737
|
1,401
|
0.99
|
—
|
—
|
—
|
526,072
|
250
|
0.19
|
|||||||||||||||||||||||||||
|
Government agency
|
832,821
|
1,381
|
0.66
|
824,499
|
2,076
|
1.01
|
695,757
|
1,574
|
0.90
|
|||||||||||||||||||||||||||
|
Mortgage-backed securities
|
9,300,971
|
28,597
|
1.23
|
9,164,180
|
29,056
|
1.27
|
7,981,834
|
21,130
|
1.06
|
|||||||||||||||||||||||||||
|
Corporate bonds
|
620,341
|
7,782
|
5.02
|
597,386
|
7,610
|
5.10
|
591,780
|
7,657
|
5.18
|
|||||||||||||||||||||||||||
|
Other investments
|
109,233
|
563
|
2.04
|
121,454
|
544
|
1.78
|
93,681
|
600
|
2.55
|
|||||||||||||||||||||||||||
|
Total investment securities
|
11,424,103
|
39,724
|
1.39
|
10,707,519
|
39,286
|
1.47
|
9,889,124
|
31,211
|
1.26
|
|||||||||||||||||||||||||||
|
Overnight investments
|
10,689,674
|
4,050
|
0.15
|
8,956,055
|
3,395
|
0.15
|
4,069,309
|
1,019
|
0.10
|
|||||||||||||||||||||||||||
|
Total interest-earning assets
|
$
|
54,601,810
|
$
|
372,555
|
2.69
|
$
|
52,371,165
|
$
|
362,419
|
2.73
|
$
|
46,922,823
|
$
|
377,530
|
3.17
|
|||||||||||||||||||||
|
Cash and due from banks
|
336,715
|
364,593
|
325,890
|
|||||||||||||||||||||||||||||||||
|
Premises and equipment
|
1,239,037
|
1,239,111
|
1,262,831
|
|||||||||||||||||||||||||||||||||
|
Allowance for credit losses
|
(183,810
|
)
|
(189,885
|
)
|
(225,339
|
)
|
||||||||||||||||||||||||||||||
|
Other real estate owned
|
41,673
|
40,786
|
50,949
|
|||||||||||||||||||||||||||||||||
|
Other assets
|
2,080,518
|
2,096,588
|
1,220,649
|
|||||||||||||||||||||||||||||||||
|
Total assets
|
$
|
58,115,943
|
$
|
55,922,358
|
$
|
49,557,803
|
||||||||||||||||||||||||||||||
|
INTEREST-BEARING LIABILITIES
|
||||||||||||||||||||||||||||||||||||
|
Interest-bearing deposits:
|
||||||||||||||||||||||||||||||||||||
|
Checking with interest
|
$
|
11,993,935
|
$
|
1,382
|
0.05
|
%
|
$
|
11,323,503
|
$
|
1,350
|
0.05
|
%
|
$
|
9,688,744
|
$
|
1,533
|
0.06
|
%
|
||||||||||||||||||
|
Savings
|
4,140,161
|
324
|
0.03
|
3,979,389
|
342
|
0.03
|
3,230,625
|
306
|
0.04
|
|||||||||||||||||||||||||||
|
Money market accounts
|
10,357,923
|
2,223
|
0.09
|
9,866,327
|
2,357
|
0.09
|
8,529,816
|
3,242
|
0.15
|
|||||||||||||||||||||||||||
|
Time deposits
|
2,517,265
|
3,903
|
0.62
|
2,599,006
|
4,024
|
0.61
|
3,017,044
|
5,976
|
0.79
|
|||||||||||||||||||||||||||
|
Total interest-bearing deposits
|
29,009,284
|
7,832
|
0.11
|
27,768,225
|
8,073
|
0.12
|
24,466,229
|
11,057
|
0.18
|
|||||||||||||||||||||||||||
|
Securities sold under customer repurchase agreements
|
650,123
|
260
|
0.16
|
672,114
|
358
|
0.21
|
684,311
|
374
|
0.22
|
|||||||||||||||||||||||||||
|
Other short-term borrowings
|
—
|
—
|
—
|
—
|
—
|
—
|
—
|
—
|
—
|
|||||||||||||||||||||||||||
|
Long-term borrowings
|
1,217,099
|
6,513
|
2.12
|
1,222,452
|
6,537
|
2.12
|
1,250,682
|
6,729
|
2.13
|
|||||||||||||||||||||||||||
|
Total interest-bearing liabilities
|
30,876,506
|
$
|
14,605
|
0.19
|
29,662,791
|
$
|
14,968
|
0.20
|
26,401,222
|
$
|
18,160
|
0.27
|
||||||||||||||||||||||||
|
Demand deposits
|
22,229,233
|
21,338,862
|
18,657,083
|
|||||||||||||||||||||||||||||||||
|
Other liabilities
|
377,286
|
384,113
|
373,403
|
|||||||||||||||||||||||||||||||||
|
Shareholders' equity
|
4,632,918
|
4,536,592
|
4,126,095
|
|||||||||||||||||||||||||||||||||
|
Total liabilities and shareholders' equity
|
$
|
58,115,943
|
$
|
55,922,358
|
$
|
49,557,803
|
||||||||||||||||||||||||||||||
|
Interest rate spread
|
2.50
|
%
|
2.53
|
%
|
2.90
|
%
|
||||||||||||||||||||||||||||||
|
Net interest income and net yield on interest-earning assets
|
$
|
357,950
|
2.58
|
%
|
$
|
347,451
|
2.61
|
%
|
$
|
359,370
|
3.02
|
%
|
||||||||||||||||||||||||
(1) Loans and leases include PCD and non-PCD loans, nonaccrual loans and loans held for sale.
(2) Yields related to loans, leases and securities exempt from both federal and state income taxes, federal income taxes only, or state income taxes only
are stated on a taxable-equivalent basis assuming statutory federal income tax rates of 21.0% for all periods presented, as well as state income tax rates of 3.3% for the three months ended December 31, 2021 and September 30, 2021, and 3.4% for the
three months ended December 31, 2020. The taxable-equivalent adjustment was $548 thousand, $564 thousand, and $654 thousand for the three months ended December 31, 2021, September 30, 2021, and December 31, 2020, respectively.
First Citizens BancShares Fourth Quarter 2021 Earnings Conference CallJanuary 26,
2022 Exhibit 99.2
2 Important Notices Forward Looking StatementsThis communication contains “forward-looking
statements” within the meaning of the Private Securities Litigation Reform Act of 1995 regarding the financial condition, results of operations, business plans and future performance of First Citizens BancShares, Inc. ("BancShares"). Words
such as “anticipates,” “believes,” “estimates,” “expects,” “predicts,” “forecasts,” “intends,” “plans,” “projects,” “targets,” “designed,” “could,” “may,” “should,” “will,” “potential,” “continue” or other similar words and expressions are
intended to identify these forward-looking statements. These forward-looking statements are based on BancShares’ current expectations and assumptions regarding BancShares’ business, the economy, and other future conditions.Because
forward-looking statements relate to future results and occurrences, they are subject to inherent risks, uncertainties, changes in circumstances and other risk factors that are difficult to predict. Many possible events or factors could
affect BancShares’ future financial results and performance and could cause the actual results, performance or achievements of BancShares to differ materially from any anticipated results expressed or implied by such forward-looking
statements. Such risks and uncertainties include, among others, general competitive, economic, political, and market conditions, the impacts of the global COVID-19 pandemic on BancShares’ business and customers, the financial success or
changing conditions or strategies of BancShares’ customers or vendors, fluctuations in interest rates, actions of government regulators, the availability of capital and personnel, and the failure to realize the anticipated benefits of
BancShares’ previous acquisition transaction(s), including the recently completed transaction with CIT, which acquisition risks include (1) disruption from the transaction, or recently completed mergers, with customer, supplier or employee
relationships, (2) the possibility that the amount of the costs, fees, expenses and charges related to the transaction may be greater than anticipated, including as a result of unexpected or unknown factors, events or liabilities, (3)
reputational risk and the reaction of the parties’ customers to the transaction, (4) the risk that the cost savings and any revenue synergies from the transaction may not be realized or take longer than anticipated to be realized, and (5)
difficulties experienced in the integration of the businesses.Except to the extent required by applicable laws or regulations, BancShares disclaims any obligation to update forward-looking statements or to publicly announce the results of any
revisions to any of the forward-looking statements included herein to reflect future events or developments. Additional factors which could affect the forward-looking statements can be found in BancShares’ Annual Report on Form 10-K for the
fiscal year ended December 31, 2020, its Quarterly Reports on Form 10-Q for the periods ended March 31, 2021, June 30, 2021 and September 30, 2021, and its other filings with the Securities and Exchange Commission (the “SEC”), and in CIT’s
Annual Report on Form 10-K for the fiscal year ended December 31, 2020, as amended on Form 10-K/A, its Quarterly Reports on Form 10-Q for the periods ended March 31, 2021, June 30, 2021 and September 30, 2021, and its other filings with the
SEC.Non-GAAP MeasuresCertain measures included in this presentation are "Non-GAAP," meaning they are not presented in accordance with generally accepted accounting principles in the U.S. and also are not codified in U.S. banking regulations
currently applicable to BancShares. BancShares believes that Non-GAAP financial measures, when reviewed in conjunction with GAAP financial information, can provide transparency about or an alternative means of assessing its operating results
and financial position to its investors, analysts and management. The Non-GAAP measures presented in this presentation are listed, and are reconciled to the most comparable GAAP measure, in the Non-GAAP reconciliation table(s) appearing in
the Appendix.
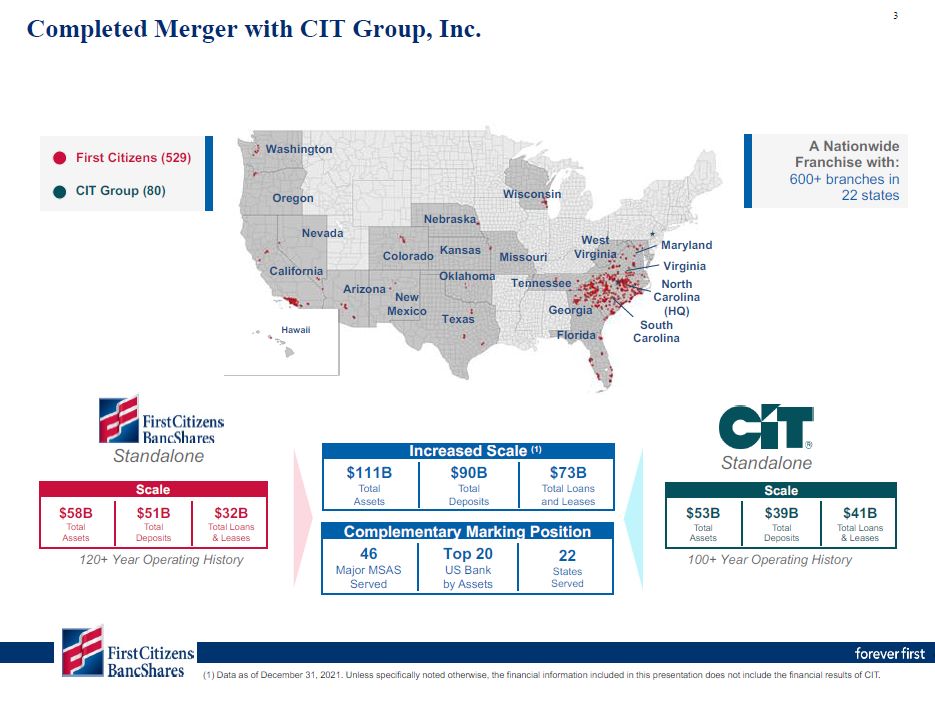
3 Completed Merger with CIT Group, Inc. (1) Data as of December 31, 2021. Unless specifically noted
otherwise, the financial information included in this presentation does not include the financial results of CIT. California Arizona New Mexico Texas Oregon Washington Wisconsin Missouri Florida Georgia Tennessee West
Virginia MarylandVirginia NorthCarolina (HQ)South Carolina Colorado KansasOklahoma Nebraska Nevada Hawaii A Nationwide Franchise with: 600+ branches in22 states First Citizens (529)CIT Group
(80) Standalone Standalone Scale $58BTotal Assets $51BTotal Deposits $32BTotal Loans & Leases Scale $53BTotal Assets $39BTotal Deposits $41BTotal Loans & Leases 120+ Year Operating History 100+ Year
Operating History Complementary Marking Position 46Major MSAS Served Top 20US Bank by Assets 22States Served Increased Scale (1) $111BTotal Assets $90BTotal Deposits $73BTotal Loans and Leases
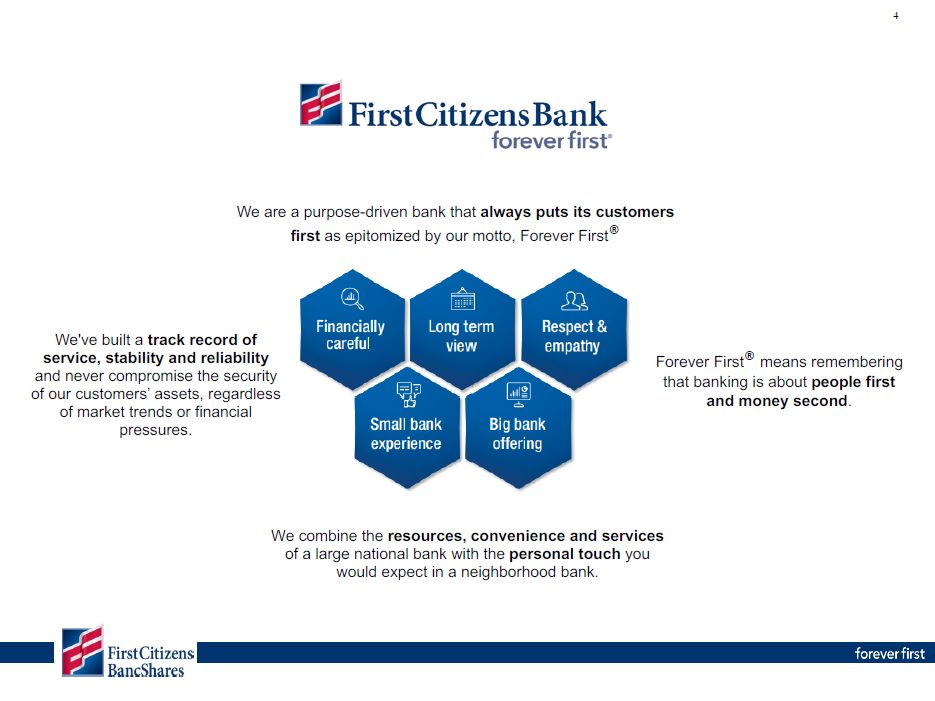
4 Forever First® means remembering that banking is about people first and money second. We are a
purpose-driven bank that always puts its customers first as epitomized by our motto, Forever First® We combine the resources, convenience and services of a large national bank with the personal touch you would expect in a neighborhood
bank. We've built a track record of service, stability and reliability and never compromise the security of our customers’ assets, regardless of market trends or financial pressures.
5 5
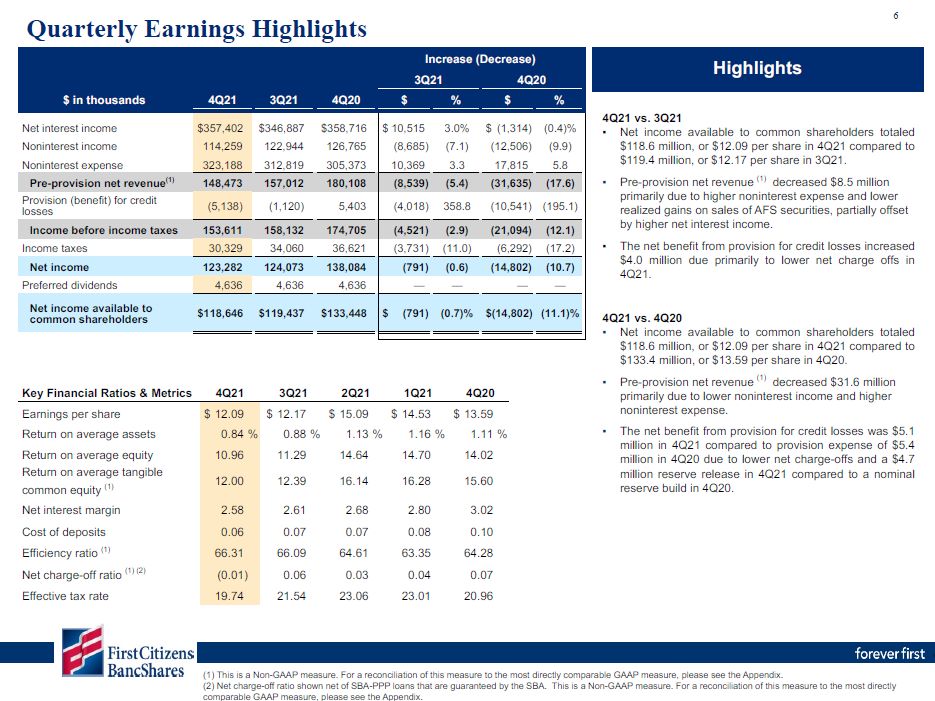
4Q21 vs. 3Q21 Net income available to common shareholders totaled$118.6 million, or $12.09 per share
in 4Q21 compared to$119.4 million, or $12.17 per share in 3Q21.Pre-provision net revenue (1) decreased $8.5 million primarily due to higher noninterest expense and lower realized gains on sales of AFS securities, partially offset by higher
net interest income.The net benefit from provision for credit losses increased$4.0 million due primarily to lower net charge offs in 4Q21. 4Q21 vs. 4Q20 Net income available to common shareholders totaled$118.6 million, or $12.09 per share
in 4Q21 compared to$133.4 million, or $13.59 per share in 4Q20.Pre-provision net revenue (1) decreased $31.6 million primarily due to lower noninterest income and higher noninterest expense.The net benefit from provision for credit losses was
$5.1 million in 4Q21 compared to provision expense of $5.4 million in 4Q20 due to lower net charge-offs and a $4.7 million reserve release in 4Q21 compared to a nominal reserve build in 4Q20. Increase
(Decrease) 3Q21 4Q20 $ in thousands 4Q21 3Q21 4Q20 $ % $ % Net interest income Noninterest income Noninterest expense $357,402 114,259323,188 $ 10,515 3.0% $ (1,314) (0.4)%(8,685) (7.1) (12,506) (9.9)10,369 3.3 17,815
5.8 Pre-provision net revenue(1) 148,473 Provision (benefit) for credit losses (5,138) $346,887 $358,716 122,944 126,765312,819 305,373157,012 180,108(1,120) 5,403 (8,539) (5.4) (31,635) (17.6)(4,018) 358.8 (10,541) (195.1) Income
before income taxes 153,611 158,132 174,705 Income taxes 30,329 34,060 36,621 (4,521) (2.9) (21,094) (12.1)(3,731) (11.0) (6,292) (17.2) Net income 123,282 124,073 138,084 Preferred dividends 4,636 (791) (0.6) (14,802) (10.7)— — —
— Net income available to common shareholders $118,646 4,636 4,636$119,437 $133,448 $ (791) (0.7)% $(14,802)
(11.1)% 6 Highlights Quarterly Earnings Highlights Earnings per share $ 12.09 $ 12.17 $ 15.09 $ 14.53 $ 13.59 Return on
average assets 0.84 % 0.88 % 1.13 % 1.16 % 1.11 % Return on average equity 10.96 11.29 14.64 14.70 14.02 Return on average tangiblecommon equity (1) 12.00 12.39 16.14 16.28 15.60 Net interest
margin 2.58 2.61 2.68 2.80 3.02 Cost of deposits 0.06 0.07 0.07 0.08 0.10 Efficiency ratio (1) 66.31 66.09 64.61 63.35 64.28 Net charge-off ratio (1) (2) (0.01) 0.06 0.03 0.04 0.07 Effective tax
rate 19.74 21.54 23.06 23.01 20.96 Key Financial Ratios & Metrics 4Q21 3Q21 2Q21 1Q21 4Q20 This is a Non-GAAP measure. For a reconciliation of this measure to the most directly comparable GAAP measure, please see the
Appendix.Net charge-off ratio shown net of SBA-PPP loans that are guaranteed by the SBA. This is a Non-GAAP measure. For a reconciliation of this measure to the most directly comparable GAAP measure, please see the Appendix.
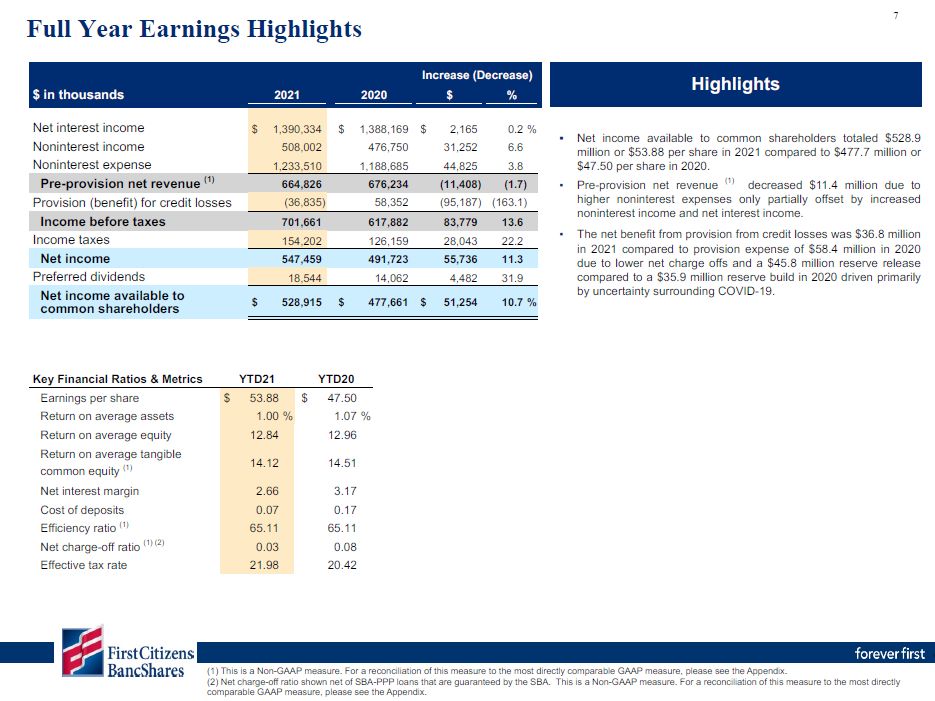
Income taxes 154,202 126,159 28,043 22.2 Net income 547,459 491,723 55,736 11.3 Preferred
dividends 18,544 14,062 4,482 31.9 Net income available to common shareholders $ 528,915 $ 477,661 $ 51,254 10.7 % 7 Highlights Increase (Decrease) $ in thousands 2021 2020 $ % Net interest income $
1,390,334 $ 1,388,169 $ 2,165 0.2 % Noninterest income 508,002 476,750 31,252 6.6 ▪ Noninterest expense 1,233,510 1,188,685 44,825 3.8 Pre-provision net revenue (1) 664,826 676,234 (11,408) (1.7) ▪ Provision
(benefit) for credit losses (36,835) 58,352 (95,187) (163.1) Income before taxes 701,661 617,882 83,779 13.6 Full Year Earnings Highlights This is a Non-GAAP measure. For a reconciliation of this measure to the most
directly comparable GAAP measure, please see the Appendix.Net charge-off ratio shown net of SBA-PPP loans that are guaranteed by the SBA. This is a Non-GAAP measure. For a reconciliation of this measure to the most directly comparable GAAP
measure, please see the Appendix. Key Financial Ratios & Metrics YTD21 YTD20 Earnings per share $ 53.88 $ 47.50 Return on average assets 1.00 % 1.07 % Return on average equity 12.84 12.96 Return on average tangible common
equity (1) 14.12 14.51 Net interest margin 2.66 3.17 Cost of deposits 0.07 0.17 Efficiency ratio (1) 65.11 65.11 Net charge-off ratio (1) (2) 0.03 0.08 Effective tax rate 21.98 20.42 Net income available to common
shareholders totaled $528.9 million or $53.88 per share in 2021 compared to $477.7 million or$47.50 per share in 2020.Pre-provision net revenue (1) decreased $11.4 million due to higher noninterest expenses only partially offset by increased
noninterest income and net interest income.The net benefit from provision from credit losses was $36.8 million in 2021 compared to provision expense of $58.4 million in 2020 due to lower net charge offs and a $45.8 million reserve release
compared to a $35.9 million reserve build in 2020 driven primarily by uncertainty surrounding COVID-19.
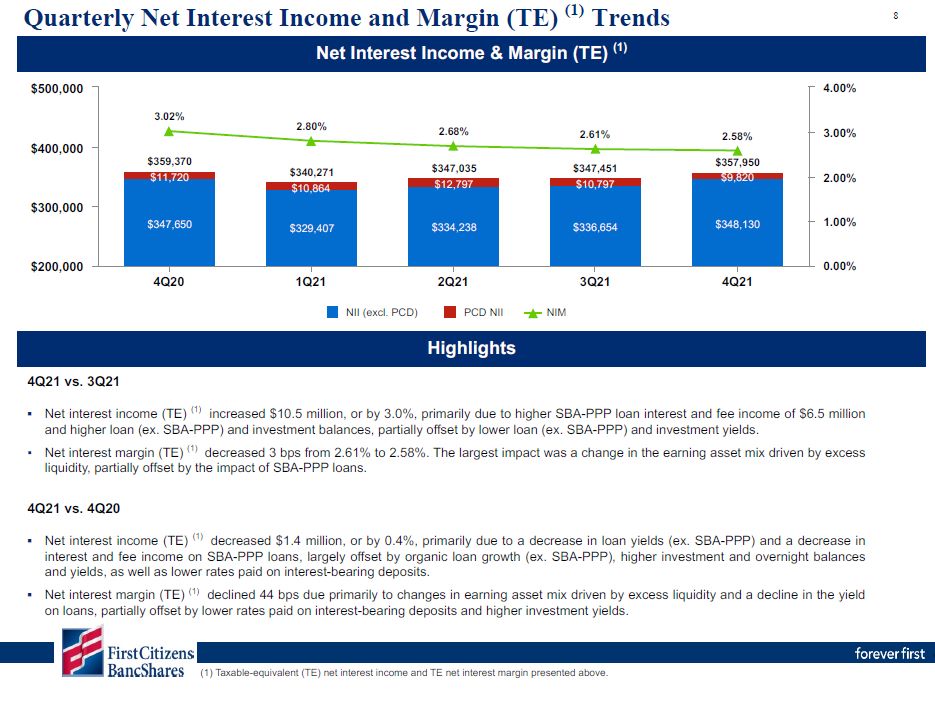
4Q21 vs. 3Q21Net interest income (TE) (1) increased $10.5 million, or by 3.0%, primarily due to higher
SBA-PPP loan interest and fee income of $6.5 million and higher loan (ex. SBA-PPP) and investment balances, partially offset by lower loan (ex. SBA-PPP) and investment yields.Net interest margin (TE) (1) decreased 3 bps from 2.61% to 2.58%.
The largest impact was a change in the earning asset mix driven by excess liquidity, partially offset by the impact of SBA-PPP loans.4Q21 vs. 4Q20Net interest income (TE) (1) decreased $1.4 million, or by 0.4%, primarily due to a decrease in
loan yields (ex. SBA-PPP) and a decrease in interest and fee income on SBA-PPP loans, largely offset by organic loan growth (ex. SBA-PPP), higher investment and overnight balances and yields, as well as lower rates paid on interest-bearing
deposits.Net interest margin (TE) (1) declined 44 bps due primarily to changes in earning asset mix driven by excess liquidity and a decline in the yield on loans, partially offset by lower rates paid on interest-bearing deposits and higher
investment yields. Quarterly Net Interest Income and Margin (TE) (1)
Trends 8 $359,370 $347,650 $329,407 $334,238 $336,654 $348,130 $11,720 $340,271$10,864 $347,035$12,797 $347,451$10,797 $357,950$9,820 3.02% 2.80% 2.68% 2.61% 2.58% NII (excl. PCD) PCD
NII NIM 4Q20 1Q21 2Q21 3Q21 4Q21 $200,000 $300,000 $400,000 $500,000 0.00% 1.00% 2.00% 3.00% 4.00% Net Interest Income & Margin (TE) (1) (1) Taxable-equivalent (TE) net interest income and TE net interest margin
presented above. Highlights
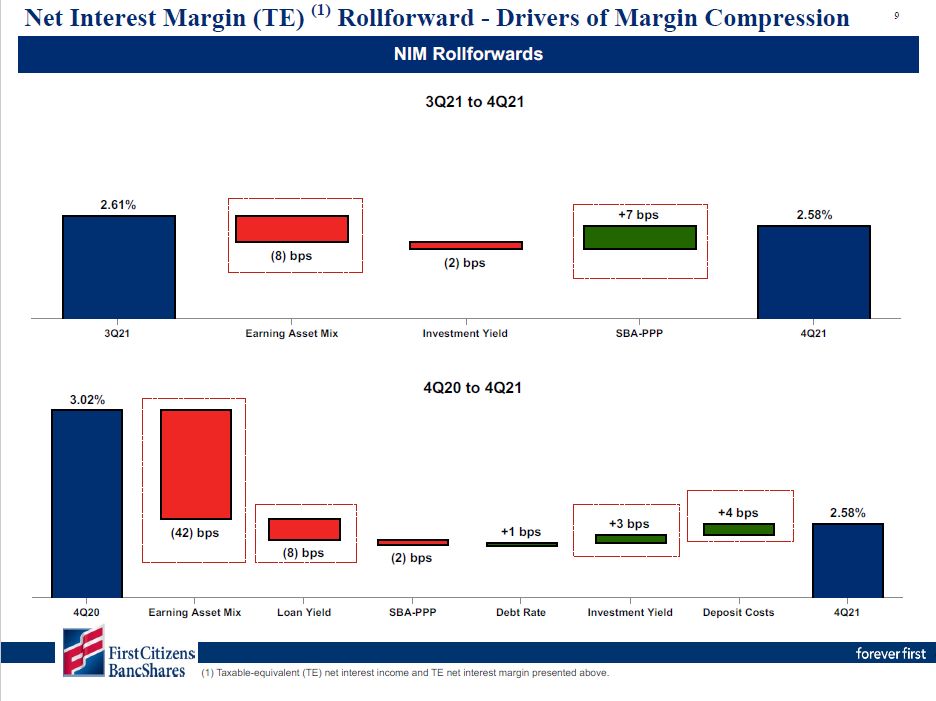
Net Interest Margin (TE) (1) Rollforward - Drivers of Margin
Compression 9 2.61% (8) bps (2) bps +7 bps 2.58% 3Q21 Earning Asset Mix Investment Yield SBA-PPP 4Q21 3.02% (42) bps (8) bps (2) bps +1 bps +3 bps +4
bps 2.58% 4Q20 Earning Asset Mix Loan Yield SBA-PPP Debt Rate Investment Yield Deposit Costs 4Q21 NIM Rollforwards 3Q21 to 4Q21 4Q20 to 4Q21 (1) Taxable-equivalent (TE) net interest income and TE net interest margin
presented above.
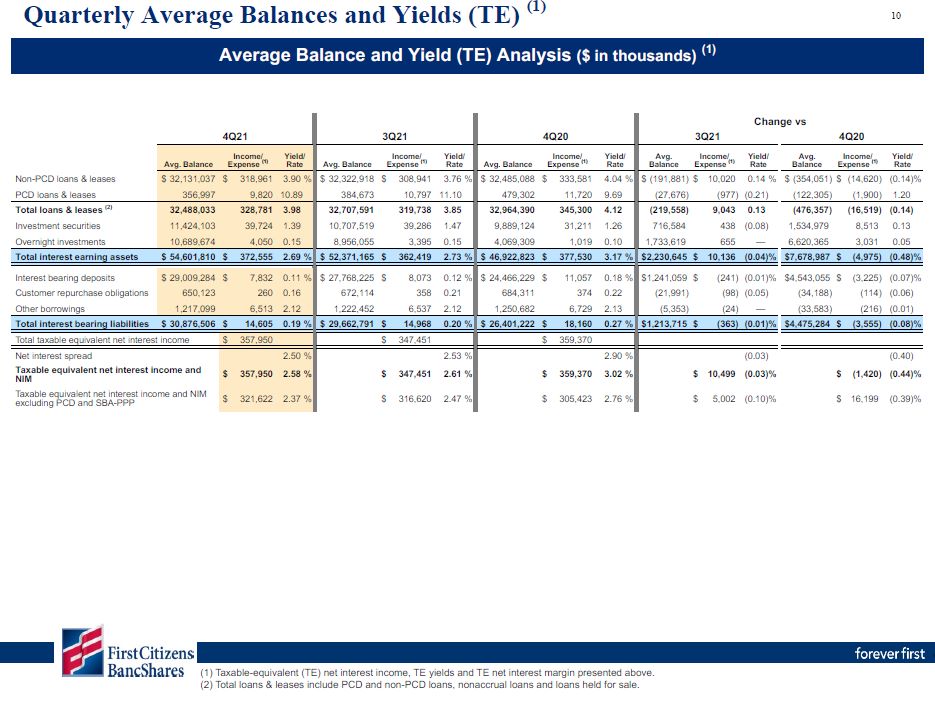
Quarterly Average Balances and Yields (TE) (1) 10 Taxable-equivalent (TE) net interest income, TE
yields and TE net interest margin presented above.Total loans & leases include PCD and non-PCD loans, nonaccrual loans and loans held for sale. Average Balance and Yield (TE) Analysis ($ in thousands)
(1) 4Q21 3Q21 4Q20 3Q21 Change vs 4Q20 Income/ Avg. Balance Expense (1) Yield/ Rate Avg. Balance Income/ Expense (1) Yield/ Rate Avg. Balance Income/ Expense (1) Yield/ Rate Avg. Balance Income/ Expense
(1) Yield/ Rate Avg. Balance Income/ Expense (1) Yield/ Rate Non-PCD loans & leases $ 32,131,037 $ 318,961 3.90 % $ 32,322,918 $ 308,941 3.76 % $ 32,485,088 $ 333,581 4.04 % $ (191,881) $ 10,020 0.14 % $ (354,051) $
(14,620) (0.14)% PCD loans & leases 356,997 9,820 10.89 384,673 10,797 11.10 479,302 11,720 9.69 (27,676) (977) (0.21) (122,305) (1,900) 1.20 Total loans & leases (2) 32,488,033
328,781 3.98 32,707,591 319,738 3.85 32,964,390 345,300 4.12 (219,558) 9,043 0.13 (476,357) (16,519) (0.14) Investment securities 11,424,103
39,724 1.39 10,707,519 39,286 1.47 9,889,124 31,211 1.26 716,584 438 (0.08) 1,534,979 8,513 0.13 Overnight investments 10,689,674
4,050 0.15 8,956,055 3,395 0.15 4,069,309 1,019 0.10 1,733,619 655 — 6,620,365 3,031 0.05 Total interest earning assets $ 54,601,810 $ 372,555 2.69 % $ 52,371,165 $ 362,419 2.73 % $ 46,922,823 $ 377,530 3.17
% $2,230,645 $ 10,136 (0.04)% $7,678,987 $ (4,975) (0.48)% Interest bearing deposits $ 29,009,284 $ 7,832 0.11 % $ 27,768,225 $ 8,073 0.12 % $ 24,466,229 $ 11,057 0.18 % $1,241,059 $ (241) (0.01)% $4,543,055 $
(3,225) (0.07)% Customer repurchase obligations 650,123 260 0.16 672,114 358 0.21 684,311 374 0.22 (21,991) (98) (0.05) (34,188) (114) (0.06) Other borrowings 1,217,099
6,513 2.12 1,222,452 6,537 2.12 1,250,682 6,729 2.13 (5,353) (24) — (33,583) (216) (0.01) Total interest bearing liabilities $ 30,876,506 $ 14,605 0.19 % $ 29,662,791 $ 14,968 0.20 % $ 26,401,222 $ 18,160 0.27
% $1,213,715 $ (363) (0.01)% $4,475,284 $ (3,555) (0.08)% Total taxable equivalent net interest income $ 357,950 $ 347,451 $ 359,370 Net interest spread 2.50 % 2.53 % 2.90
% (0.03) (0.40) Taxable equivalent net interest income and NIM $ 357,950 2.58 % $ 347,451 2.61 % $ 359,370 3.02 % $ 10,499 (0.03)% $ (1,420) (0.44)% Taxable equivalent net
interest income and NIM excluding PCD and SBA-PPP $ 321,622 2.37 % $ 316,620 2.47 % $ 305,423 2.76 % $ 5,002 (0.10)% $ 16,199 (0.39)%
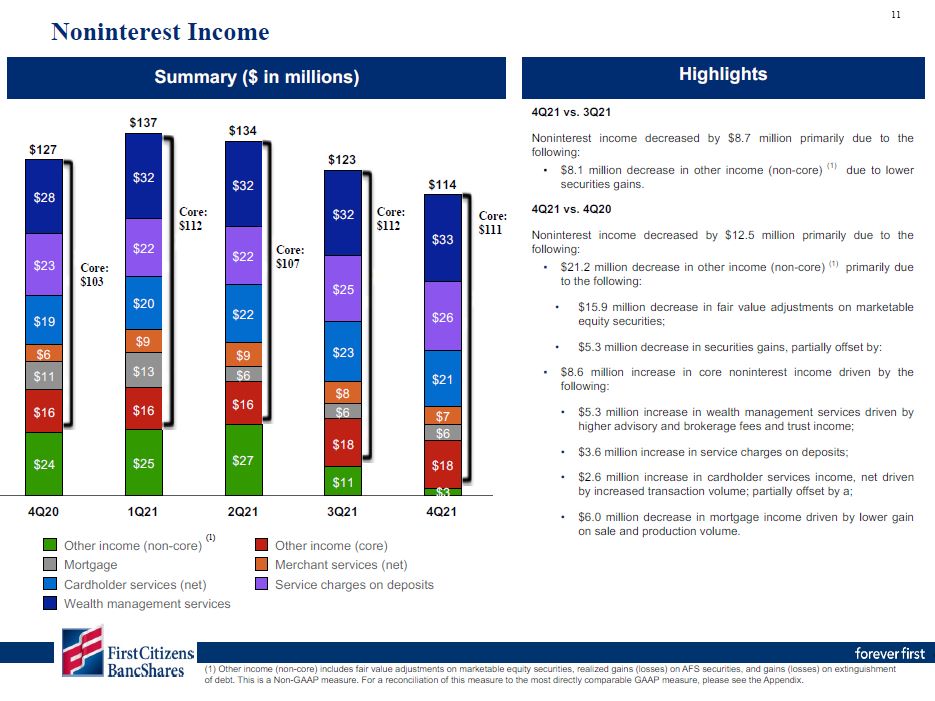
4Q21 vs. 3Q21 Noninterest income decreased by $8.7 million primarily due to the following:$8.1 million
decrease in other income (non-core) (1) due to lower securities gains. 4Q21 vs. 4Q20 Noninterest income decreased by $12.5 million primarily due to the following:$21.2 million decrease in other income (non-core) (1) primarily due to the
following: $15.9 million decrease in fair value adjustments on marketable equity securities; $5.3 million decrease in securities gains, partially offset by: $8.6 million increase in core noninterest income driven by the following:$5.3
million increase in wealth management services driven by higher advisory and brokerage fees and trust income;$3.6 million increase in service charges on deposits;$2.6 million increase in cardholder services income, net driven by increased
transaction volume; partially offset by a;$6.0 million decrease in mortgage income driven by lower gain on sale and production volume. Noninterest Income Summary ($ in
millions) Highlights 11 $127 $137 $134 $123 $114 $24 $25 $27 $11 $16 $16 $16 $18 $18$3 $11 $13 $6 $6 $6 $6 $9 $9 $8 $7 $19 $20 $22 $23 $21 $23 $22 $22 $25 $26 $28 $32 $32 $32 $33 3Q21
4Q21Other income (core) Merchant services (net) Service charges on deposits 1Q21 2Q21(1)Other income (non-core)MortgageCardholder services (net) Wealth management
services 4Q20 Core:$103 Core:$112 Core:$107 Core:$112 Core:$111 (1) Other income (non-core) includes fair value adjustments on marketable equity securities, realized gains (losses) on AFS securities, and gains (losses) on
extinguishment of debt. This is a Non-GAAP measure. For a reconciliation of this measure to the most directly comparable GAAP measure, please see the Appendix.
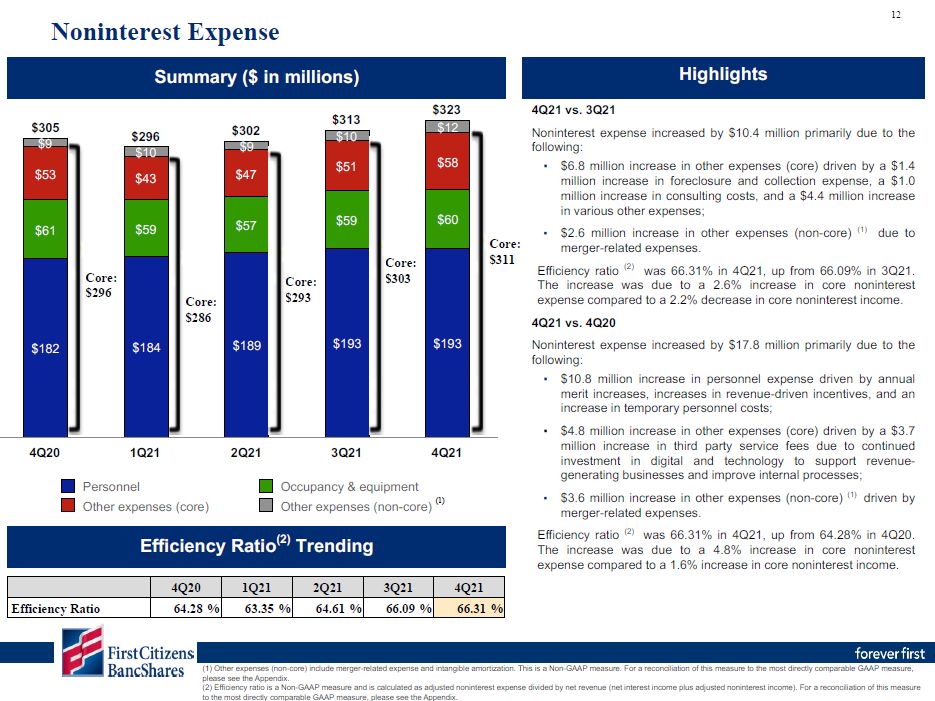
Noninterest Expense Summary ($ in
millions) Highlights 12 $305 $296 $302 $313 $323 $182 $184 $189 $193 $193 $61 $59 $57 $59 $60 $53 $43 $47 $51 $58 $9 $10 $9 $10 $12 PersonnelOther expenses (core) Occupancy & equipment Other
expenses (non-core) 4Q20 1Q21 2Q21 3Q21 4Q21 Core:$296 Core:$286 Core:$293 Core:$303 Core:$311 4Q20 1Q21 2Q21 3Q21 4Q21 Efficiency Ratio 64.28 % 63.35 % 64.61 % 66.09 % 66.31 % Efficiency Ratio(2)
Trending (1) 4Q21 vs. 3Q21Noninterest expense increased by $10.4 million primarily due to the following:$6.8 million increase in other expenses (core) driven by a $1.4 million increase in foreclosure and collection expense, a $1.0 million
increase in consulting costs, and a $4.4 million increase in various other expenses;$2.6 million increase in other expenses (non-core) (1) due to merger-related expenses.Efficiency ratio (2) was 66.31% in 4Q21, up from 66.09% in 3Q21. The
increase was due to a 2.6% increase in core noninterest expense compared to a 2.2% decrease in core noninterest income.4Q21 vs. 4Q20Noninterest expense increased by $17.8 million primarily due to the following: $10.8 million increase in
personnel expense driven by annual merit increases, increases in revenue-driven incentives, and an increase in temporary personnel costs;$4.8 million increase in other expenses (core) driven by a $3.7 million increase in third party service
fees due to continued investment in digital and technology to support revenue- generating businesses and improve internal processes;$3.6 million increase in other expenses (non-core) (1) driven by merger-related expenses. Efficiency ratio
(2) was 66.31% in 4Q21, up from 64.28% in 4Q20. The increase was due to a 4.8% increase in core noninterest expense compared to a 1.6% increase in core noninterest income. Other expenses (non-core) include merger-related expense and
intangible amortization. This is a Non-GAAP measure. For a reconciliation of this measure to the most directly comparable GAAP measure, please see the Appendix.Efficiency ratio is a Non-GAAP measure and is calculated as adjusted noninterest
expense divided by net revenue (net interest income plus adjusted noninterest income). For a reconciliation of this measure to the most directly comparable GAAP measure, please see the Appendix.
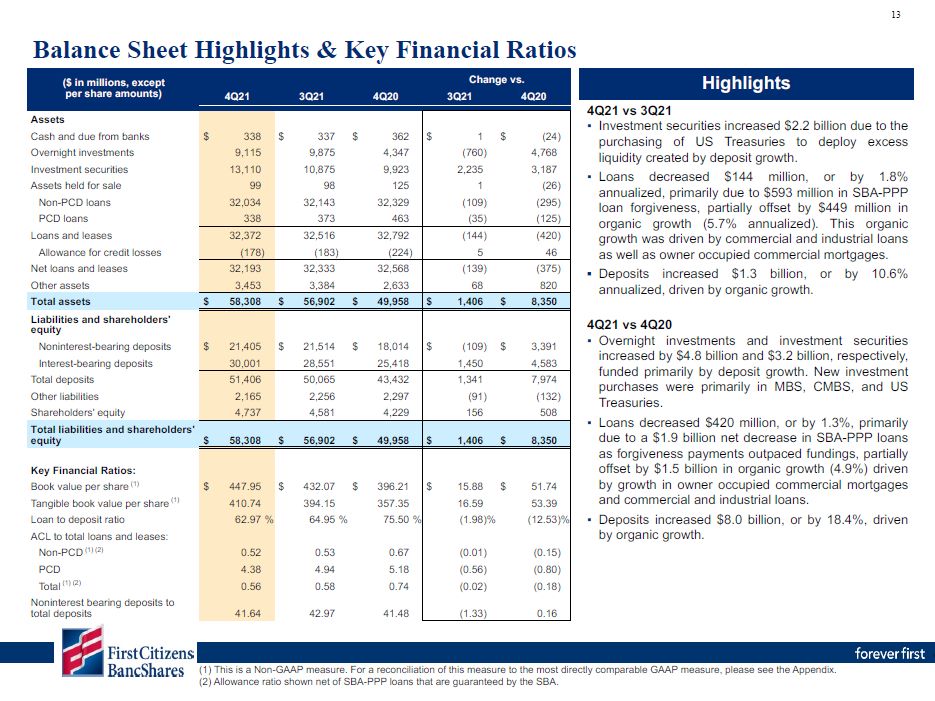
Highlights 13 Balance Sheet Highlights & Key Financial Ratios ($ in millions, except per
share amounts) Change vs. 4Q21 3Q21 4Q20 3Q21 4Q20 Assets Cash and due from banks $ 338 $ 337 $ 362 $ 1 $ (24) Overnight investments 9,115 9,875 4,347 (760) 4,768 Investment
securities 13,110 10,875 9,923 2,235 3,187 Assets held for sale 99 98 125 1 (26) Non-PCD loans 32,034 32,143 32,329 (109) (295) PCD loans 338 373 463 (35) (125) Loans and
leases 32,372 32,516 32,792 (144) (420) Allowance for credit losses (178) (183) (224) 5 46 Net loans and leases 32,193 32,333 32,568 (139) (375) Other assets 3,453 3,384 2,633 68 820 Total assets $ 58,308 $ 56,902 $
49,958 $ 1,406 $ 8,350 Liabilities and shareholders' equity Noninterest-bearing deposits $ 21,405 $ 21,514 $ 18,014 $ (109) $ 3,391 Interest-bearing deposits 30,001 28,551 25,418 1,450 4,583 Total
deposits 51,406 50,065 43,432 1,341 7,974 Other liabilities 2,165 2,256 2,297 (91) (132) Shareholders' equity 4,737 4,581 4,229 156 508 Total liabilities and shareholders' equity $ 58,308 $ 56,902 $ 49,958 $ 1,406 $
8,350 Key Financial Ratios: Book value per share (1) $ 447.95 $ 432.07 $ 396.21 $ 15.88 $ 51.74 Tangible book value per share (1) 410.74 394.15 357.35 16.59 53.39 Loan to deposit ratio 62.97 % 64.95 % 75.50
% (1.98)% (12.53)% ACL to total loans and leases: Non-PCD (1) (2) 0.52 0.53 0.67 (0.01) (0.15) PCD 4.38 4.94 5.18 (0.56) (0.80) Total (1) (2) 0.56 0.58 0.74 (0.02) (0.18) Noninterest bearing deposits
to total deposits 41.64 42.97 41.48 (1.33) 0.16 4Q21 vs 3Q21Investment securities increased $2.2 billion due to the purchasing of US Treasuries to deploy excess liquidity created by deposit growth.Loans decreased $144
million, or by 1.8% annualized, primarily due to $593 million in SBA-PPP loan forgiveness, partially offset by $449 million in organic growth (5.7% annualized). This organic growth was driven by commercial and industrial loans as well as
owner occupied commercial mortgages.Deposits increased $1.3 billion, or by 10.6% annualized, driven by organic growth.4Q21 vs 4Q20Overnight investments and investment securities increased by $4.8 billion and $3.2 billion, respectively, funded
primarily by deposit growth. New investment purchases were primarily in MBS, CMBS, and US Treasuries.Loans decreased $420 million, or by 1.3%, primarily due to a $1.9 billion net decrease in SBA-PPP loans as forgiveness payments outpaced
fundings, partially offset by $1.5 billion in organic growth (4.9%) driven by growth in owner occupied commercial mortgages and commercial and industrial loans.Deposits increased $8.0 billion, or by 18.4%, driven by organic growth. This is a
Non-GAAP measure. For a reconciliation of this measure to the most directly comparable GAAP measure, please see the Appendix.Allowance ratio shown net of SBA-PPP loans that are guaranteed by the SBA.
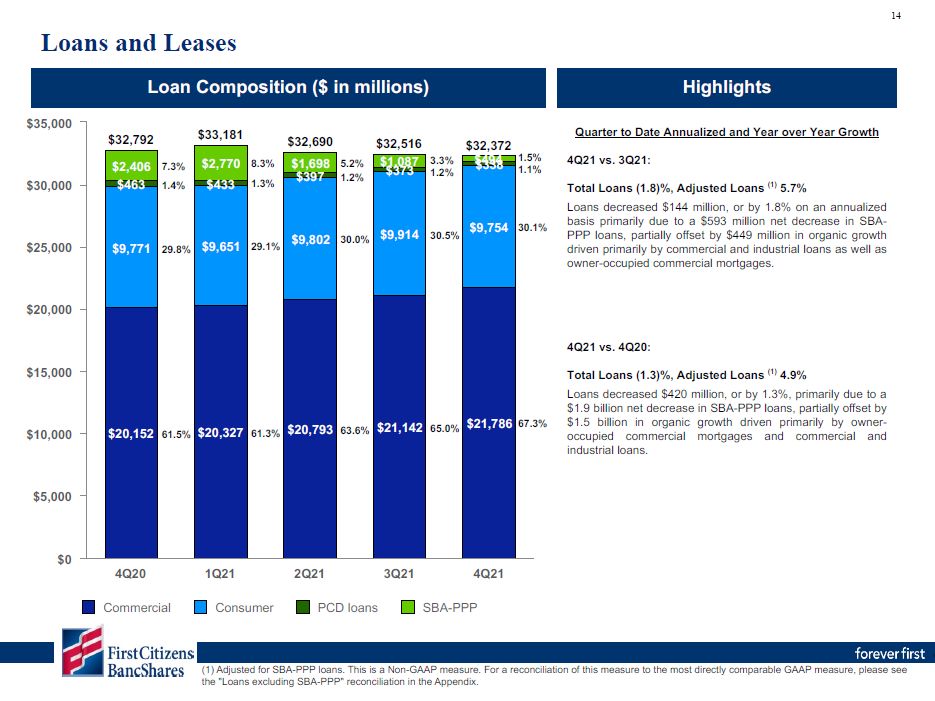
$32,792 $33,181 $32,690 $32,516 $32,372 $20,152 $9,771 $9,651 $9,802 $9,914 $9,754 $373 $2,406$463 $2,770$433 $1,698$397 $1,087 $439348 $20,327
61.3% $20,793 63.6% $21,142 65.0% $21,786 67.3% Commercial Consumer PCD loans SBA-PPP 4Q20 1Q21 2Q21 3Q21 4Q21 $0 $5,000 $10,000 $15,000 $20,000 $25,000 $30,000 $35,000 Loan Composition ($ in millions) Loans
and Leases 14 8.3%1.3% 29.1% 5.2%1.2% 30.0% 3.3%1.2% 30.5% 1.5%1.1% 30.1% Highlights Quarter to Date Annualized and Year over Year Growth 4Q21 vs. 3Q21: Total Loans (1.8)%, Adjusted Loans (1) 5.7%Loans decreased $144 million, or
by 1.8% on an annualized basis primarily due to a $593 million net decrease in SBA- PPP loans, partially offset by $449 million in organic growth driven primarily by commercial and industrial loans as well as owner-occupied commercial
mortgages. 4Q21 vs. 4Q20: Total Loans (1.3)%, Adjusted Loans (1) 4.9%Loans decreased $420 million, or by 1.3%, primarily due to a$1.9 billion net decrease in SBA-PPP loans, partially offset by$1.5 billion in organic growth driven primarily
by owner- occupied commercial mortgages and commercial and industrial loans. 7.3%1.4% 29.8% 61.5% (1) Adjusted for SBA-PPP loans. This is a Non-GAAP measure. For a reconciliation of this measure to the most directly comparable GAAP
measure, please see the "Loans excluding SBA-PPP" reconciliation in the Appendix.
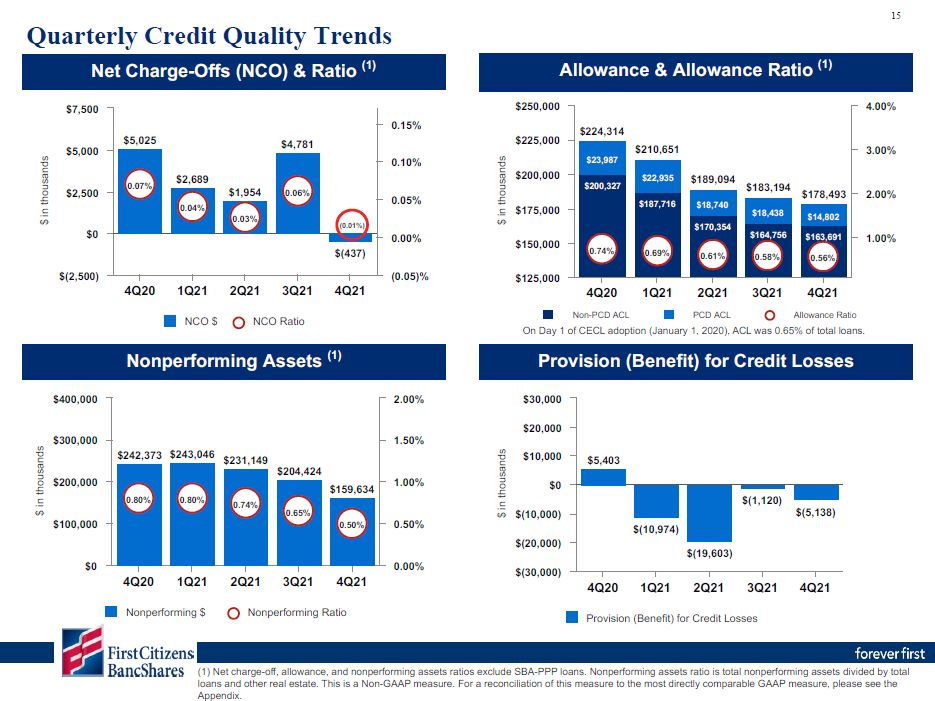
15 Nonperforming Assets (1) Provision (Benefit) for Credit Losses $ in
thousands $5,025 $2,689 $1,954 $4,781 $(437) 0.07% 0.04% 0.03% 0.06% NCO $ 4Q20 1Q21 2Q21 3Q21 4Q21NCO Ratio $(2,500) $0 $2,500 $5,000 $7,500 (0.05)% 0.00% 0.05% 0.10% 0.15% Net Charge-Offs (NCO) & Ratio
(1) $ in thousands $242,373 $243,046 $231,149 $204,424 $159,634 0.80% 0.80% 0.74% 0.65% 0.50% 4Q20 1Q21 2Q21 3Q21 4Q21Nonperforming $ Nonperforming Ratio $0 $100,000 $200,000 $300,000 $400,000
2.00% 0.00% 0.50% 1.00% 1.50% Quarterly Credit Quality Trends $ in
thousands $224,314 $210,651 $189,094 $183,194 $178,493 $200,327 $187,716 $170,354 $164,756 $163,691 $23,987 $22,935 $18,740 $18,438 $14,802 0.74% 0.69% 0.61% 0.58% 0.56% 4Q20 1Q21Non-PCD ACL 2Q21 3Q21PCD
ACL 4Q21Allowance Ratio $125,000 $150,000 $175,000 $200,000 $225,000 $250,000 4.00% 1.00% 2.00% 3.00% Allowance & Allowance Ratio (1) (1) Net charge-off, allowance, and nonperforming assets ratios exclude SBA-PPP loans.
Nonperforming assets ratio is total nonperforming assets divided by total loans and other real estate. This is a Non-GAAP measure. For a reconciliation of this measure to the most directly comparable GAAP measure, please see the
Appendix. $ in thousands $5,403 $(10,974) $(1,120) $(5,138) $(19,603)4Q20 1Q21 2Q21 3Q21Provision (Benefit) for Credit Losses 4Q21 $(30,000) $(20,000) $(10,000) $0 $10,000 $20,000 $30,000 On Day 1 of CECL adoption
(January 1, 2020), ACL was 0.65% of total loans. (0.01%)
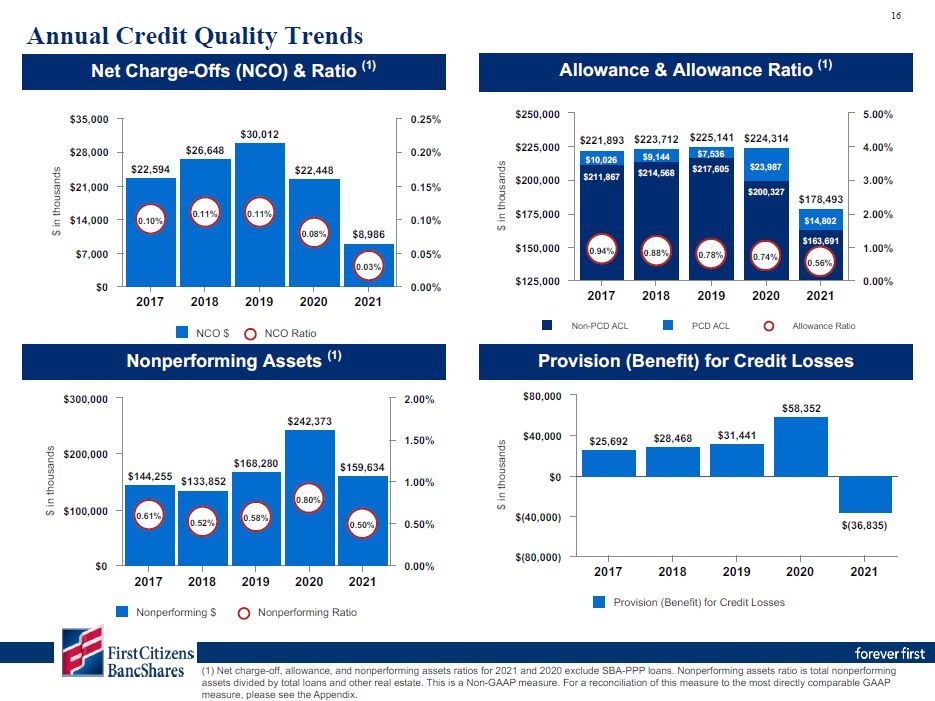
16 Nonperforming Assets (1) Provision (Benefit) for Credit Losses $ in
thousands $22,594 $26,648 $30,012 $22,448 $8,986 0.10% 0.11% 0.11% 0.08% 0.03% NCO $ 2019 2020NCO Ratio 2017 2018 2021 $0 $7,000 $14,000 $21,000 $28,000 $35,000 0.00% 0.05% 0.10% 0.15% 0.20% 0.25% Net Charge-Offs
(NCO) & Ratio (1) $ in thousands $144,255 $133,852 $168,280 $242,373 $159,634 0.61% 0.52% 0.58% 0.80% 0.50% 2017 2018Nonperforming $ 2019 2020 2021Nonperforming Ratio $0 $100,000 $200,000 $300,000
2.00% 0.00% 0.50% 1.00% 1.50% Annual Credit Quality Trends $ in thousands $221,893 $223,712 $178,493 $211,867 $214,568 $217,605 $200,327 $163,691 $10,026 $9,144 $225,141
$224,314$7,536 $23,987 $14,802 0.94% 0.88% 0.78% 0.74% 0.56% Non-PCD ACL PCD ACL Allowance Ratio 2017 2018 2019 2020 2021 $125,000 $150,000 $175,000 $200,000 $225,000 $250,000
5.00% 0.00% 1.00% 2.00% 3.00% 4.00% Allowance & Allowance Ratio (1) (1) Net charge-off, allowance, and nonperforming assets ratios for 2021 and 2020 exclude SBA-PPP loans. Nonperforming assets ratio is total nonperforming assets
divided by total loans and other real estate. This is a Non-GAAP measure. For a reconciliation of this measure to the most directly comparable GAAP measure, please see the Appendix. $ in
thousands $25,692 $28,468 $31,441 $58,352 $(36,835) 2017 2018 2019Provision (Benefit) for Credit Losses 2020 2021 $(80,000) $(40,000) $0 $40,000 $80,000
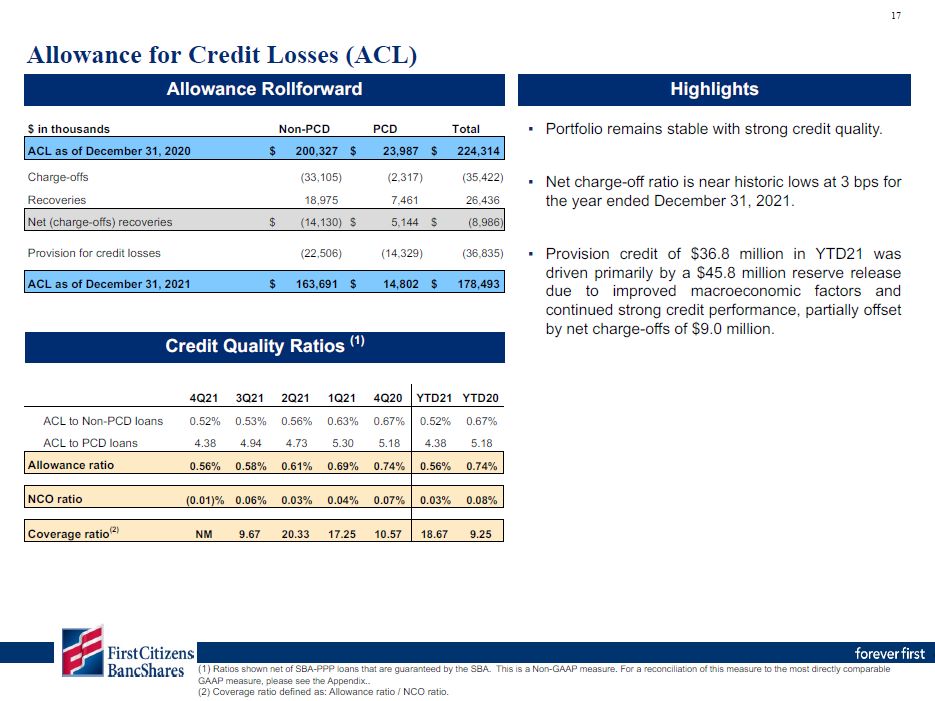
ACL as of December 31, 2020 $ 200,327 $ 23,987 $
224,314 Charge-offs (33,105) (2,317) (35,422) Recoveries 18,975 7,461 26,436 Net (charge-offs) recoveries $ (14,130) $ 5,144 $ (8,986) Provision for credit losses (22,506) (14,329) (36,835) ACL as of December 31, 2021 $
163,691 $ 14,802 $ 178,493 $ in thousands Non-PCD PCD Total 17 Highlights Ratios shown net of SBA-PPP loans that are guaranteed by the SBA. This is a Non-GAAP measure. For a reconciliation of this measure to the most directly comparable
GAAP measure, please see the Appendix..Coverage ratio defined as: Allowance ratio / NCO ratio. Allowance for Credit Losses (ACL) 4Q21 3Q21 2Q21 1Q21 4Q20 YTD21 YTD20 ACL to Non-PCD
loans 0.52% 0.53% 0.56% 0.63% 0.67% 0.52% 0.67% ACL to PCD loans 4.38 4.94 4.73 5.30 5.18 4.38 5.18 Allowance ratio 0.56% 0.58% 0.61% 0.69% 0.74% 0.56% 0.74% NCO
ratio (0.01)% 0.06% 0.03% 0.04% 0.07% 0.03% 0.08% Coverage ratio(2) NM 9.67 20.33 17.25 10.57 18.67 9.25 Allowance Rollforward Credit Quality Ratios (1) Portfolio remains stable with strong credit
quality. Net charge-off ratio is near historic lows at 3 bps for the year ended December 31, 2021.Provision credit of $36.8 million in YTD21 was driven primarily by a $45.8 million reserve release due to improved macroeconomic factors and
continued strong credit performance, partially offset by net charge-offs of $9.0 million.
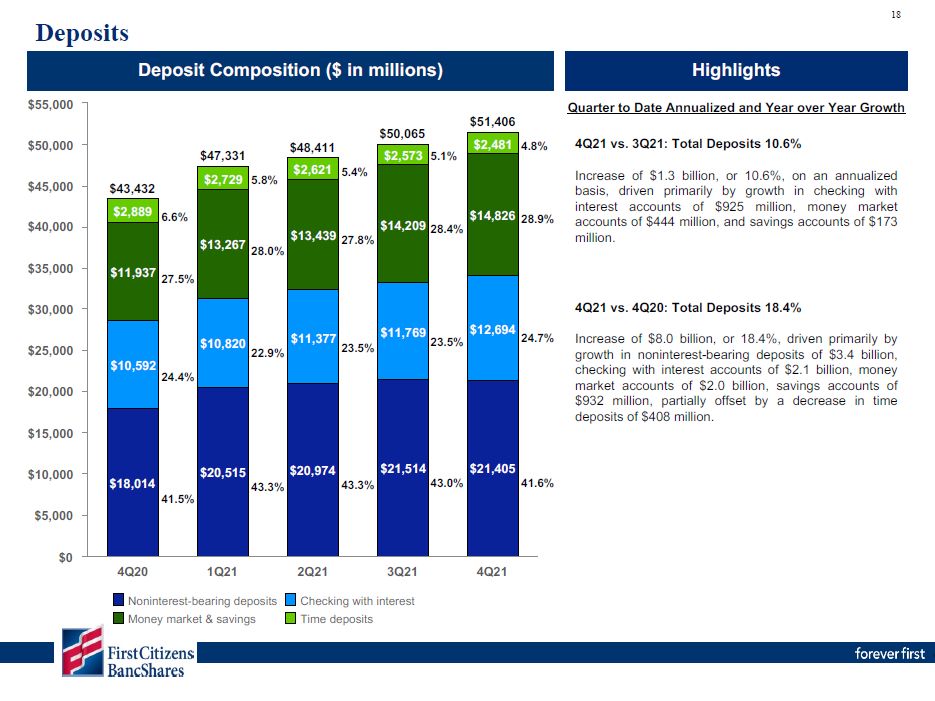
Quarter to Date Annualized and Year over Year Growth 4Q21 vs. 3Q21: Total Deposits 10.6% Increase of
$1.3 billion, or 10.6%, on an annualized basis, driven primarily by growth in checking with interest accounts of $925 million, money market accounts of $444 million, and savings accounts of $173 million. 4Q21 vs. 4Q20: Total Deposits
18.4% Increase of $8.0 billion, or 18.4%, driven primarily by growth in noninterest-bearing deposits of $3.4 billion, checking with interest accounts of $2.1 billion, money market accounts of $2.0 billion, savings accounts of$932 million,
partially offset by a decrease in time deposits of $408 million. Deposits Deposit Composition ($ in
millions) Highlights 18 $43,432 $47,331 $48,411 $50,065 $51,406 $18,014 $20,515 $20,974 $21,514 $21,405 $11,377 $13,439 $2,889 $2,481
4.8% $14,826 28.9% 2Q21 3Q21Checking with interest Time deposits 4Q20 1Q21Noninterest-bearing deposits Money market &
savings 4Q21 $5,000$0 $10,000 $15,000 $20,000 $25,000 $30,000 $35,000 $40,000 $45,000 $50,000 $55,000 41.6% $2,573 5.1% $14,209 28.4% $11,769 $12,69423.5% 24.7% 43.0% $2,621 5.4% 27.8% 23.5% 43.3% $2,729
5.8% $13,267 28.0% $10,82022.9% 43.3% 6.6% $11,937 27.5% $10,59224.4% 41.5%
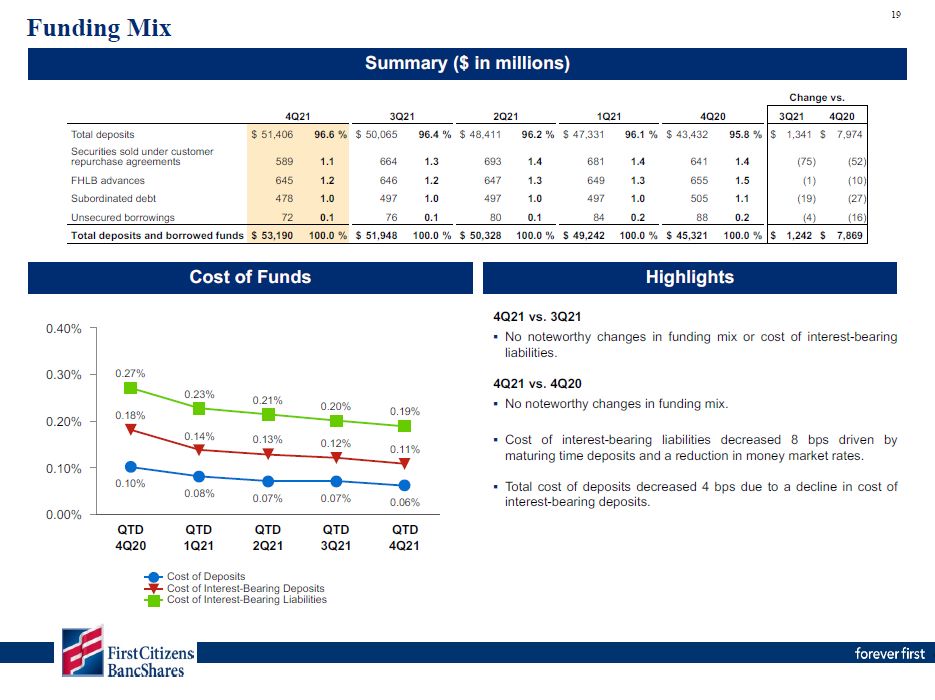
Highlights 19 Funding Mix 4Q21 3Q21 2Q21 1Q21 4Q20 3Q21 4Q20 Total deposits $
51,406 96.6 % $ 50,065 96.4 % $ 48,411 96.2 % $ 47,331 96.1 % $ 43,432 95.8 % $ 1,341 $ 7,974 Securities sold under customer repurchase agreements 589 1.1 664 1.3 693 1.4 681 1.4 641 1.4 (75)
(52) FHLB advances 645 1.2 646 1.2 647 1.3 649 1.3 655 1.5 (1) (10) Subordinated debt 478 1.0 497 1.0 497 1.0 497 1.0 505 1.1 (19) (27) Unsecured borrowings 72 0.1 76 0.1 80 0.1 84 0.2 88 0.2 (4)
(16) Total deposits and borrowed funds $ 53,190 100.0 % $ 51,948 100.0 % $ 50,328 100.0 % $ 49,242 100.0 % $ 45,321 100.0 % $ 1,242 $ 7,869 Change
vs. 0.10% 0.08% 0.07% 0.07% 0.06% 0.18% 0.14% 0.13% 0.12% 0.11% 0.27% 0.23% 0.21% 0.20% 0.19% Cost of DepositsCost of Interest-Bearing Deposits Cost of Interest-Bearing Liabilities QTD 4Q20 QTD
1Q21 QTD 2Q21 QTD 3Q21 QTD 4Q21 0.00% 0.10% 0.20% 0.30% 0.40% 4Q21 vs. 3Q21No noteworthy changes in funding mix or cost of interest-bearing liabilities. 4Q21 vs. 4Q20 No noteworthy changes in funding mix. Cost of interest-bearing
liabilities decreased 8 bps driven by maturing time deposits and a reduction in money market rates. Total cost of deposits decreased 4 bps due to a decline in cost of interest-bearing deposits. Summary ($ in millions) Cost of Funds
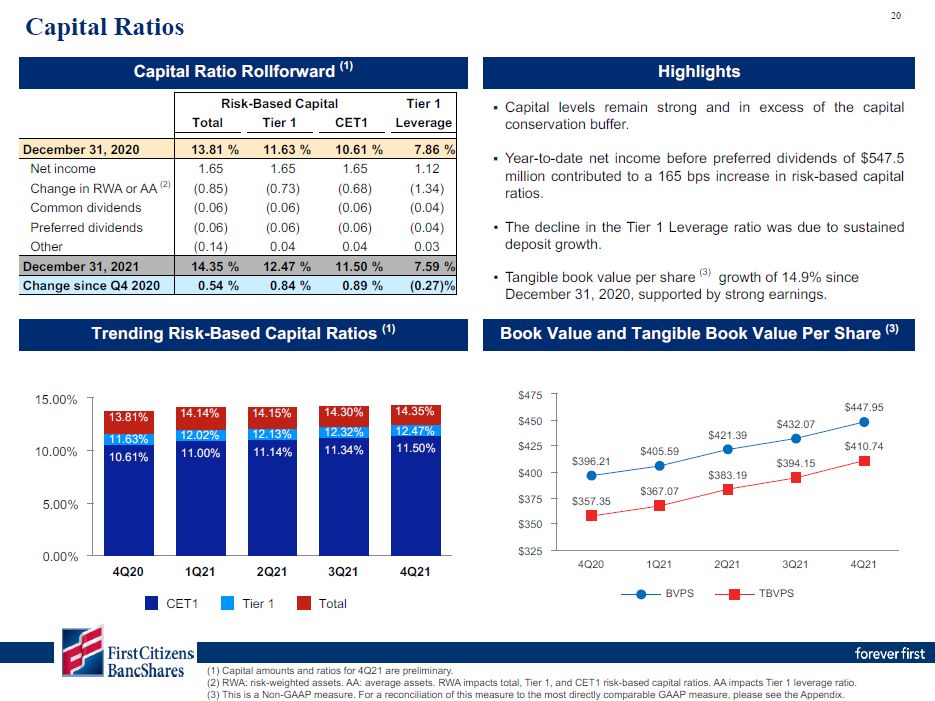
Capital Ratios Capital levels remain strong and in excess of the capital conservation
buffer.Year-to-date net income before preferred dividends of $547.5 million contributed to a 165 bps increase in risk-based capital ratios.The decline in the Tier 1 Leverage ratio was due to sustained deposit growth.Tangible book value per
share (3) growth of 14.9% since December 31, 2020, supported by strong earnings. Risk-Based Capital Total Tier 1 CET1 Tier 1 Leverage December 31, 2020 13.81 % 11.63 % 10.61 % 7.86 % Net
income 1.65 1.65 1.65 1.12 Change in RWA or AA (2) (0.85) (0.73) (0.68) (1.34) Common dividends (0.06) (0.06) (0.06) (0.04) Preferred dividends (0.06) (0.06) (0.06) (0.04) Other (0.14) 0.04 0.04 0.03 December 31,
2021 14.35 % 12.47 % 11.50 % 7.59 % Change since Q4 2020 0.54 % 0.84 % 0.89 % (0.27)% 20 Highlights Capital amounts and ratios for 4Q21 are preliminary.RWA: risk-weighted assets. AA: average assets. RWA impacts total, Tier 1, and
CET1 risk-based capital ratios. AA impacts Tier 1 leverage ratio.This is a Non-GAAP measure. For a reconciliation of this measure to the most directly comparable GAAP measure, please see the
Appendix. 10.61% 11.00% 11.14% 11.34% 11.50% 14.14% 14.30% 14.35% 13.81%11.63% 12.02% 14.15%12.13% 12.32% 12.47% CET1 Tier 1 Total 4Q20 1Q21 2Q21 3Q21 4Q21 0.00% 5.00% 10.00% 15.00% Trending Risk-Based
Capital Ratios (1) Capital Ratio Rollforward
(1) $396.21 $405.59 $421.39 $432.07 $447.95 $357.35 $367.07 $383.19 $394.15 $410.74 BVPS TBVPS 4Q20 1Q21 2Q21 3Q21 4Q21 $325 $350 $375 $400 $425 $450 $475 Book Value and Tangible Book Value Per Share
(3)
Appendix
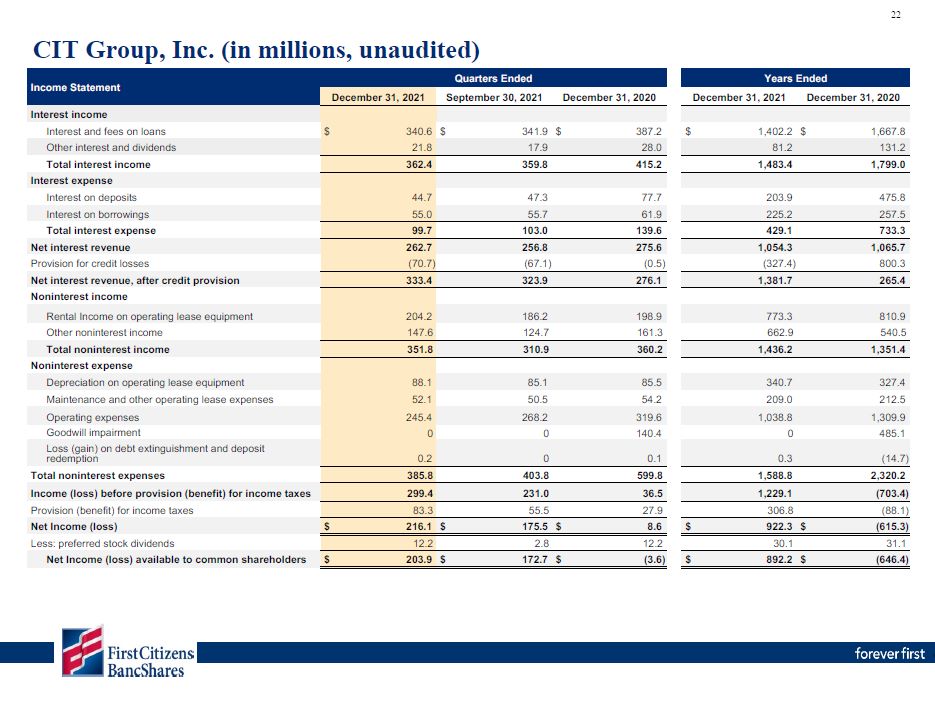
22 CIT Group, Inc. (in millions, unaudited) Income Statement Quarters Ended December 31,
2021 September 30, 2021 December 31, 2020 Interest income Interest and fees on loans $ 340.6 $ 341.9 $ 387.2 Other interest and dividends 21.8 17.9 28.0 Total interest income 362.4 359.8 415.2 Interest expense Interest on
deposits 44.7 47.3 77.7 Interest on borrowings 55.0 55.7 61.9 Total interest expense 99.7 103.0 139.6 Net interest revenue 262.7 256.8 275.6 Provision for credit losses (70.7) (67.1) (0.5) Net interest revenue, after credit
provision 333.4 323.9 276.1 Noninterest income Rental Income on operating lease equipment 204.2 186.2 198.9 Other noninterest income 147.6 124.7 161.3 Total noninterest income 351.8 310.9 360.2 Noninterest
expense Depreciation on operating lease equipment 88.1 85.1 85.5 Maintenance and other operating lease expenses 52.1 50.5 54.2 Operating expenses 245.4 268.2 319.6 Goodwill impairment 0 0 140.4 Loss (gain) on debt
extinguishment and deposit redemption 0.2 0 0.1 Total noninterest expenses 385.8 403.8 599.8 Income (loss) before provision (benefit) for income taxes 299.4 231.0 36.5 Provision (benefit) for income taxes 83.3 55.5 27.9 Net
Income (loss) $ 216.1 $ 175.5 $ 8.6 Less: preferred stock dividends 12.2 2.8 12.2 Net Income (loss) available to common shareholders $ 203.9 $ 172.7 $ (3.6) December 31, 2021 December 31,
2020 $ 1,402.2 $ 1,667.8 81.2 131.2 1,483.4 1,799.0 203.9 475.8 225.2 257.5 429.1 733.3 1,054.3 1,065.7 (327.4) 800.3 1,381.7 265.4 773.3 810.9 662.9 540.5 1,436.2 1,351.4 340.7 327.4 209.0 212.5 1,038.8 1,309.9 0 485.1 0.3 (14.7) 1,588.8 2,320.2 1,229.1 (703.4) 306.8 (88.1) $ 922.3 $ (615.3) 30.1 31.1 $ 892.2 $ (646.4) Years
Ended
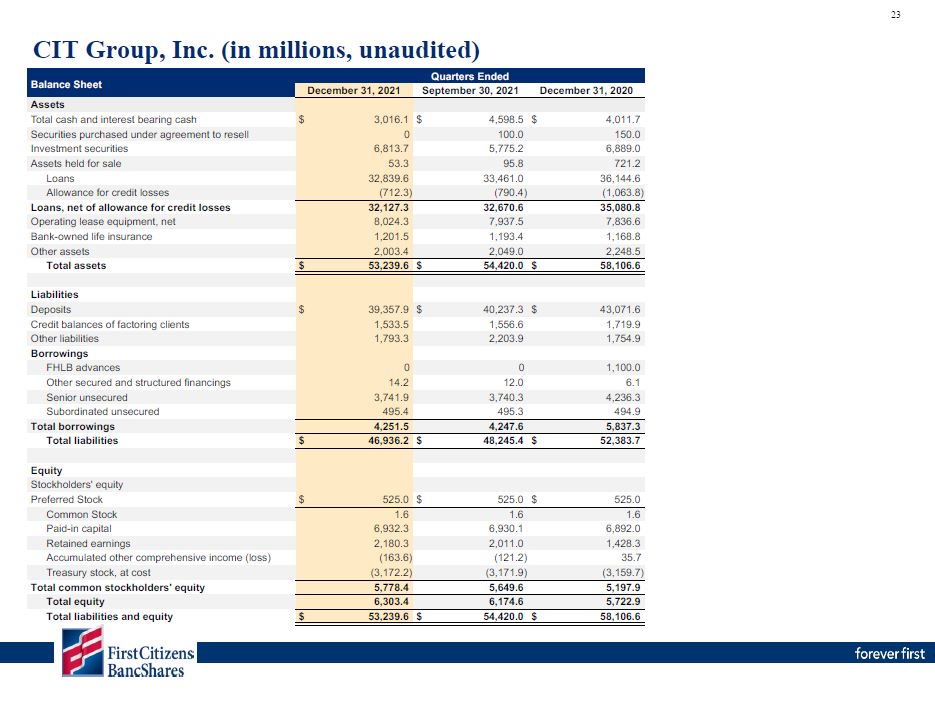
23 CIT Group, Inc. (in millions, unaudited) Balance Sheet Quarters Ended December 31,
2021 September 30, 2021 December 31, 2020 Assets Total cash and interest bearing cash $ 3,016.1 $ 4,598.5 $ 4,011.7 Securities purchased under agreement to resell 0 100.0 150.0 Investment securities 6,813.7 5,775.2
6,889.0 Assets held for sale 53.3 95.8 721.2 Loans 32,839.6 33,461.0 36,144.6 Allowance for credit losses (712.3) (790.4) (1,063.8) Loans, net of allowance for credit losses 32,127.3 32,670.6 35,080.8 Operating lease equipment,
net 8,024.3 7,937.5 7,836.6 Bank-owned life insurance 1,201.5 1,193.4 1,168.8 Other assets 2,003.4 2,049.0 2,248.5 Total assets $ 53,239.6 $ 54,420.0 $ 58,106.6 Liabilities Deposits $ 39,357.9 $ 40,237.3 $
43,071.6 Credit balances of factoring clients 1,533.5 1,556.6 1,719.9 Other liabilities 1,793.3 2,203.9 1,754.9 Borrowings FHLB advances 0 0 1,100.0 Other secured and structured financings 14.2 12.0 6.1 Senior
unsecured 3,741.9 3,740.3 4,236.3 Subordinated unsecured 495.4 495.3 494.9 Total borrowings 4,251.5 4,247.6 5,837.3 Total liabilities $ 46,936.2 $ 48,245.4 $ 52,383.7 $ 525.0 Equity Stockholders' equity Preferred
Stock $ 525.0 $ 525.0 Common Stock 1.6 1.6 1.6 Paid-in capital 6,932.3 6,930.1 6,892.0 Retained earnings 2,180.3 2,011.0 1,428.3 Accumulated other comprehensive income (loss) (163.6) (121.2) 35.7 Treasury stock, at
cost (3,172.2) (3,171.9) (3,159.7) Total common stockholders' equity 5,778.4 5,649.6 5,197.9 Total equity 6,303.4 6,174.6 5,722.9 Total liabilities and equity $ 53,239.6 $ 54,420.0 $ 58,106.6
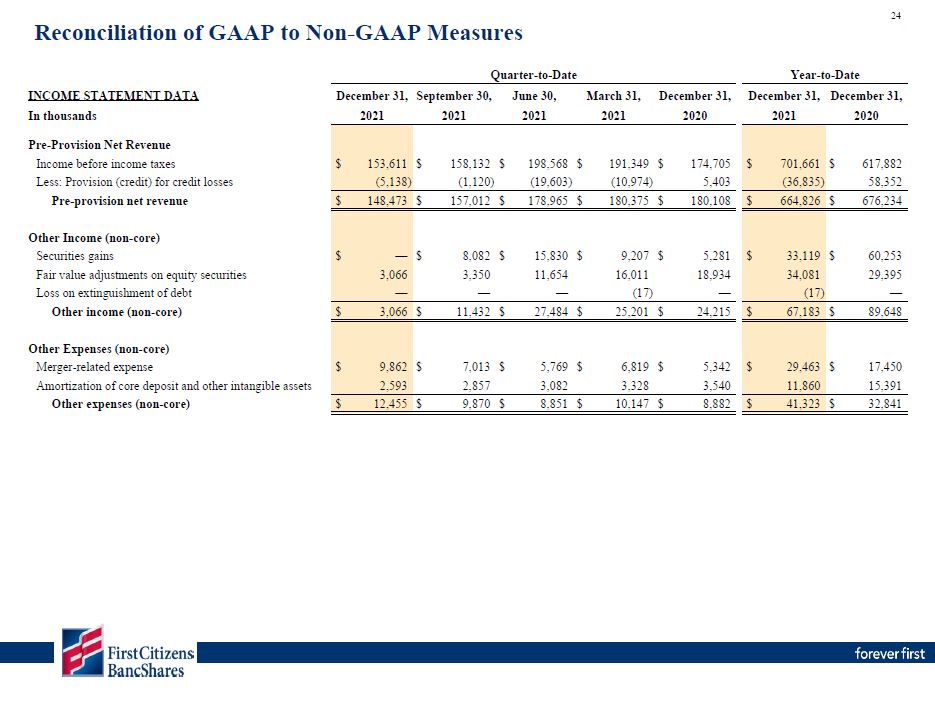
Quarter-to-Date Year-to-Date INCOME STATEMENT DATA December 31, September 30, June
30, March 31, December 31, December 31, December 31, In thousands 2021 2021 2021 2021 2020 2021 2020 Pre-Provision Net Revenue Income before income taxesLess: Provision (credit) for credit losses $
153,611(5,138) $ 158,132(1,120) $ 198,568(19,603) $ 191,349(10,974) $ 174,7055,403 Pre-provision net revenue $ 148,473 $ 157,012 $ 178,965 $ 180,375 $ 180,108 Other Income (non-core)Securities gains $ — $ 8,082 $
15,830 $ 9,207 $ 5,281 Fair value adjustments on equity securities 3,066 3,350 11,654 16,011 18,934 Loss on extinguishment of debt — — — (17) — Other income (non-core) $ 3,066 $ 11,432 $ 27,484 $ 25,201 $
24,215 Other Expenses (non-core)Merger-related expense $ 9,862 $ 7,013 $ 5,769 $ 6,819 $ 5,342 Amortization of core deposit and other intangible assets 2,593 2,857 3,082 3,328 3,540 Other expenses (non-core) $
12,455 $ 9,870 $ 8,851 $ 10,147 $ 8,882 $ 701,661(36,835) $ 617,88258,352 $ 664,826 $ 676,234 $ 33,119 $ 60,253 34,081 29,395 (17) — $ 67,183 $ 89,648 $ 29,463 $ 17,450 11,860 15,391 $ 41,323 $ 32,841 Reconciliation
of GAAP to Non-GAAP Measures 24
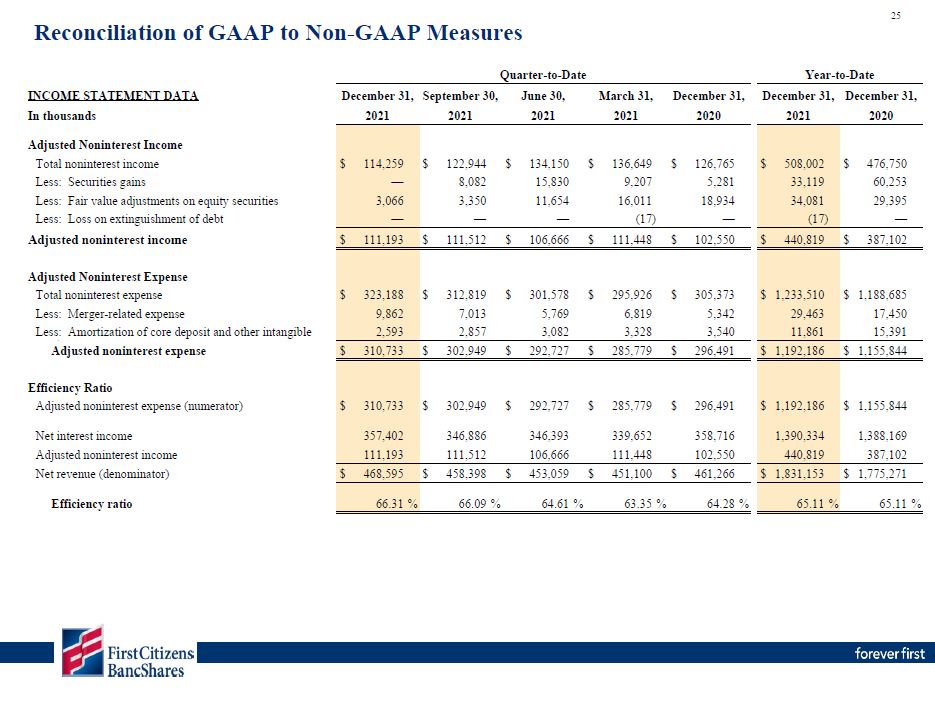
$ 508,002 $ 476,750 33,119 60,253 34,081 29,395 (17) — $ 440,819 $ 387,102 $ 1,233,510 $
1,188,685 29,463 17,450 11,861 15,391 $ 1,192,186 $ 1,155,844 $ 1,192,186 $ 1,155,844 1,390,334 1,388,169 440,819 387,102 $ 1,831,153 $ 1,775,271 65.11 % 65.11 % $ 114,259 $ 122,944 $ 134,150 $ 136,649 $
126,765 — 8,082 15,830 9,207 5,281 3,066 3,350 11,654 16,011 18,934 — — — (17) — $ 111,193 $ 111,512 $ 106,666 $ 111,448 $ 102,550 $ 323,188 $ 312,819 $ 301,578 $ 295,926 $
305,373 9,862 7,013 5,769 6,819 5,342 2,593 2,857 3,082 3,328 3,540 $ 310,733 $ 302,949 $ 292,727 $ 285,779 $ 296,491 $ 310,733 $ 302,949 $ 292,727 $ 285,779 $
296,491 357,402 346,886 346,393 339,652 358,716 111,193 111,512 106,666 111,448 102,550 $ 468,595 $ 458,398 $ 453,059 $ 451,100 $ 461,266 66.31 % 66.09 % 64.61 % 63.35 % 64.28 % Quarter-to-Date Year-to-Date INCOME
STATEMENT DATAIn thousands December 31,2021 September 30,2021 June 30,2021 March 31,2021 December 31,2020 December 31,2021 December 31,2020 Adjusted Noninterest Income Total noninterest income Less: Securities gainsLess: Fair value
adjustments on equity securities Less: Loss on extinguishment of debtAdjusted noninterest incomeAdjusted Noninterest Expense Total noninterest expense Less: Merger-related expenseLess: Amortization of core deposit and other intangibleAdjusted
noninterest expenseEfficiency RatioAdjusted noninterest expense (numerator)Net interest income Adjusted noninterest income Net revenue (denominator)Efficiency ratio Reconciliation of GAAP to Non-GAAP Measures 25
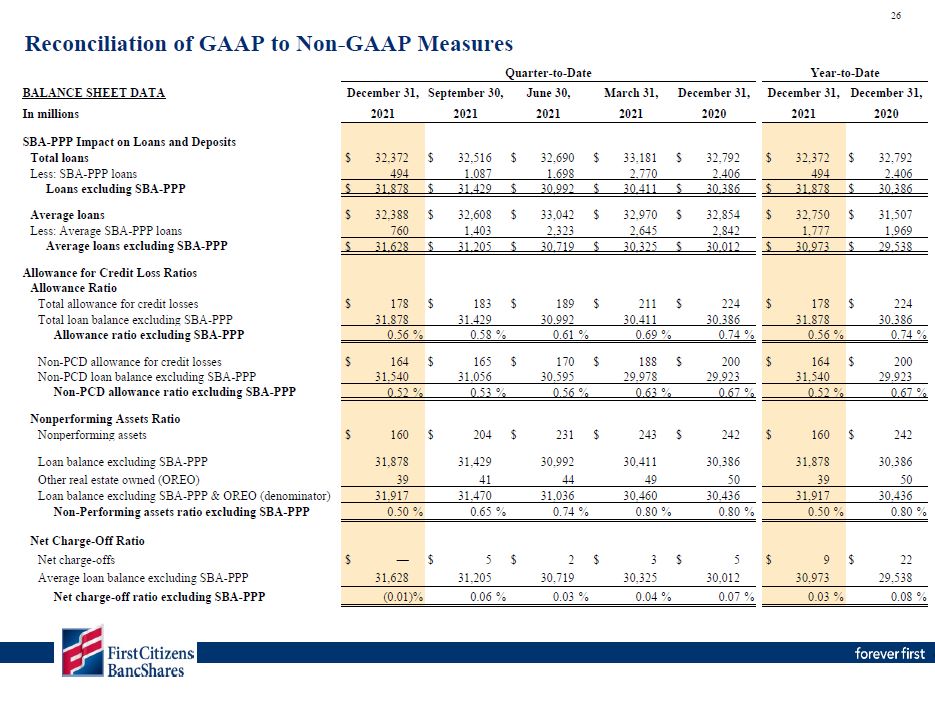
$ 32,372 $ 32,792 494 2,406 $ 31,878 $ 30,386 $ 32,750 $ 31,507 1,777 1,969 $ 30,973 $
29,538 $ 17831,878 $ 22430,386 0.56 % 0.74 % $ 16431,540 $ 20029,923 0.52 % 0.67 % $ 160 $ 242 31,878 30,386 39 50 31,917 30,436 0.50 % 0.80 % $ 930,973 $ 2229,538 0.03 % 0.08 % $ 32,372 $ 32,516 $ 32,690 $ 33,181 $
32,792 494 1,087 1,698 2,770 2,406 $ 31,878 $ 31,429 $ 30,992 $ 30,411 $ 30,386 $ 32,388 $ 32,608 $ 33,042 $ 32,970 $ 32,854 760 1,403 2,323 2,645 2,842 $ 31,628 $ 31,205 $ 30,719 $ 30,325 $ 30,012 $ 178 $ 183 $ 189 $ 211 $
224 31,878 31,429 30,992 30,411 30,386 0.56 % 0.58 % 0.61 % 0.69 % 0.74 % $ 164 $ 165 $ 170 $ 188 $ 200 31,540 31,056 30,595 29,978 29,923 0.52 % 0.53 % 0.56 % 0.63 % 0.67 % $ 160 $ 204 $ 231 $ 243 $ 242 31,878 31,429 30,992
30,411 30,386 39 41 44 49 50 31,917 31,470 31,036 30,460 30,436 0.50 % 0.65 % 0.74 % 0.80 % 0.80 % $ — $ 5 $ 2 $ 3 $ 5 31,628 31,205 30,719 30,325 30,012 (0.01)% 0.06 % 0.03 % 0.04 % 0.07 % Quarter-to-Date Year-to-Date BALANCE
SHEET DATAIn millions December 31,2021 September 30,2021 June 30,2021 March 31,2021 December 31,2020 December 31,2021 December 31,2020 SBA-PPP Impact on Loans and Deposits Total loansLess: SBA-PPP loansLoans excluding SBA-PPPAverage
loansLess: Average SBA-PPP loansAverage loans excluding SBA-PPPAllowance for Credit Loss Ratios Allowance RatioTotal allowance for credit lossesTotal loan balance excluding SBA-PPPAllowance ratio excluding SBA-PPPNon-PCD allowance for credit
lossesNon-PCD loan balance excluding SBA-PPPNon-PCD allowance ratio excluding SBA-PPPNonperforming Assets RatioNonperforming assetsLoan balance excluding SBA-PPP Other real estate owned (OREO)Loan balance excluding SBA-PPP & OREO
(denominator)Non-Performing assets ratio excluding SBA-PPPNet Charge-Off RatioNet charge-offsAverage loan balance excluding SBA-PPPNet charge-off ratio excluding SBA-PPP Reconciliation of GAAP to Non-GAAP Measures 26
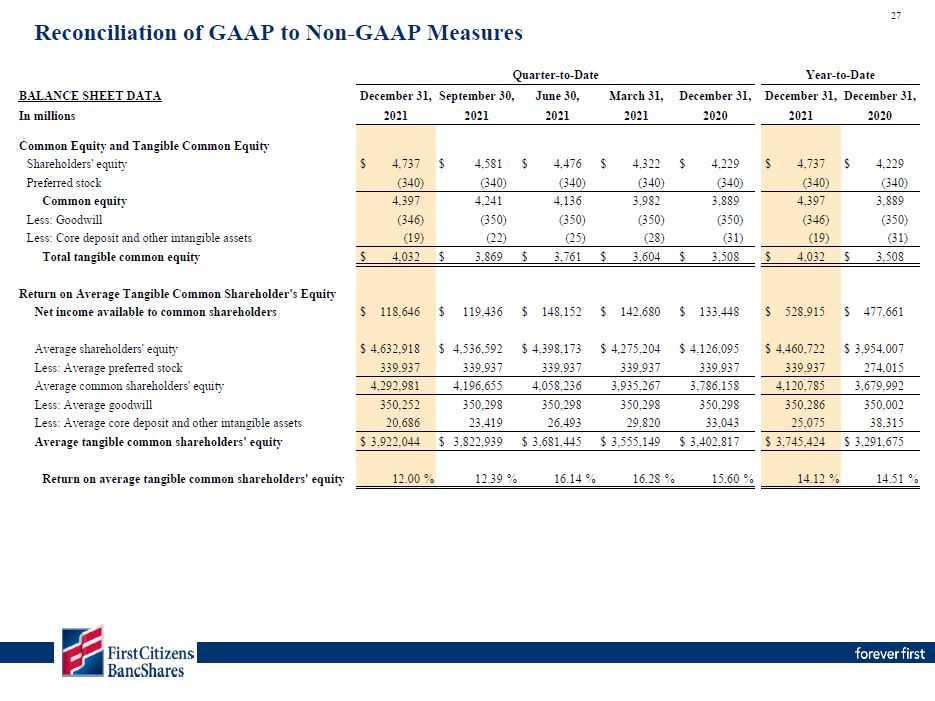
$ 4,737(340) $ 4,229(340) 4,397 3,889 (346) (350) (19) (31) $ 4,032 $ 3,508 $ 528,915 $
477,661 $ 4,460,722 $ 3,954,007 339,937 274,015 4,120,785 3,679,992 350,286 350,002 25,075 38,315 $ 3,745,424 $ 3,291,675 14.12 % 14.51 % $ 4,737(340) $ 4,581(340) $ 4,476(340) $ 4,322(340) $
4,229(340) 4,397 4,241 4,136 3,982 3,889 (346) (350) (350) (350) (350) (19) (22) (25) (28) (31) $ 4,032 $ 3,869 $ 3,761 $ 3,604 $ 3,508 $ 118,646 $ 119,436 $ 148,152 $ 142,680 $ 133,448 $ 4,632,918 $ 4,536,592 $
4,398,173 $ 4,275,204 $ 4,126,095 339,937 339,937 339,937 339,937 339,937 4,292,981 4,196,655 4,058,236 3,935,267 3,786,158 350,252 350,298 350,298 350,298 350,298 20,686 23,419 26,493 29,820 33,043 $ 3,922,044 $
3,822,939 $ 3,681,445 $ 3,555,149 $ 3,402,817 12.00 % 12.39 % 16.14 % 16.28 % 15.60 % Quarter-to-Date Year-to-Date BALANCE SHEET DATAIn millions December 31, September 30,2021 2021 June 30,2021 March 31,2021 December
31,2020 December 31, December 31,2021 2020 Common Equity and Tangible Common EquityShareholders' equity Preferred stockCommon equityLess: GoodwillLess: Core deposit and other intangible assetsTotal tangible common equityReturn on Average
Tangible Common Shareholder's Equity Net income available to common shareholdersAverage shareholders' equity Less: Average preferred stockAverage common shareholders' equity Less: Average goodwillLess: Average core deposit and other
intangible assetsAverage tangible common shareholders' equityReturn on average tangible common shareholders' equity Reconciliation of GAAP to Non-GAAP Measures 27
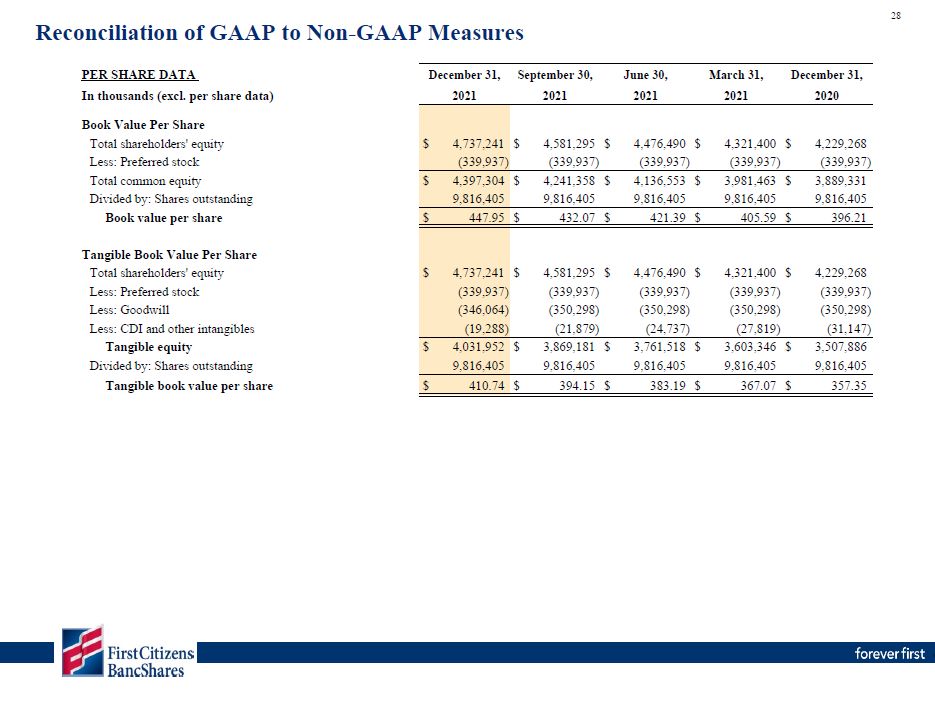
$ 4,737,241 $ 4,581,295 $ 4,476,490 $ 4,321,400 $ 4,229,268 (339,937) (339,937) (339,937) (339,937)
(339,937) $ 4,397,304 $ 4,241,358 $ 4,136,553 $ 3,981,463 $ 3,889,331 9,816,405 9,816,405 9,816,405 9,816,405 9,816,405 $ 447.95 $ 432.07 $ 421.39 $ 405.59 $ 396.21 $ 4,737,241 $ 4,581,295 $ 4,476,490 $ 4,321,400 $
4,229,268 (339,937) (339,937) (339,937) (339,937) (339,937) (346,064) (350,298) (350,298) (350,298) (350,298) (19,288) (21,879) (24,737) (27,819) (31,147) $ 4,031,952 $ 3,869,181 $ 3,761,518 $ 3,603,346 $
3,507,886 9,816,405 9,816,405 9,816,405 9,816,405 9,816,405 $ 410.74 $ 394.15 $ 383.19 $ 367.07 $ 357.35 PER SHARE DATAIn thousands (excl. per share data) December 31,2021 September 30,2021 June 30,2021 March 31,2021 December
31,2020 Book Value Per Share Total shareholders' equity Less: Preferred stock Total common equityDivided by: Shares outstandingBook value per shareTangible Book Value Per ShareTotal shareholders' equity Less: Preferred stock Less:
GoodwillLess: CDI and other intangiblesTangible equityDivided by: Shares outstandingTangible book value per share Reconciliation of GAAP to Non-GAAP Measures 28