
First Horizon Corp 8-K, filed Oct 15, 2026
First Horizon Corp (FHN)
8-K
2026-10-15
For: 2026-10-15
View Original
Added on
October 15, 2026
About this 8-K
First Horizon Corp filed this 8-K on October 15, 2026.
Items reported
- Item 2.02: Financial results
- Item 7.01: Regulation FD disclosure
- Item 9.01: Financial statements and exhibits
UNITED STATES
SECURITIES AND EXCHANGE COMMISSION
Washington, D.C. 20549
______________________________________
FORM 8-K
_____________________________________
CURRENT REPORT
Pursuant to Section 13 OR 15(d) of The Securities Exchange Act of 1934
Date of Report (date of earliest event reported)
First Horizon Corporation
(Exact name of registrant as specified in its charter)
(State or other jurisdiction of incorporation) | (Commission File Number) | (I.R.S. Employer Identification No.) | |||||||||
(Address of Principal Executive Offices) | (Zip Code) | ||||||||||
(Registrant's telephone number, including area code) (901 ) 523-4444
(Former name or former address, if changed since last report.)
Check the appropriate box below if the Form 8-K filing is intended to simultaneously satisfy the filing obligation of the registrant under any of the following provisions (see General Instruction A.2. below):
Securities registered pursuant to Section 12(b) of the Act:
| Title of Each Class | Trading Symbol(s) | Name of Exchange on which Registered | ||||||
| | ||||||||
| a share of Non-Cumulative Perpetual Preferred Stock, Series E | ||||||||
| a share of Non-Cumulative Perpetual Preferred Stock, Series F | ||||||||
| a share of Non-Cumulative Perpetual Preferred Stock, Series H | ||||||||
Indicate by check mark whether the registrant is an emerging growth company as defined in Rule 405 of the Securities Act of 1933 (§230.405 of this chapter) or Rule 12b-2 of the Securities Exchange Act of 1934 (§240.12b-2 of this chapter).
Emerging growth company ☐
If an emerging growth company, indicate by check mark if the registrant has elected not to use the extended transition period for complying with any new or revised financial accounting standards provided pursuant to Section 13(a) of the Exchange Act. o
ITEM 2.02. Results of Operations and Financial Condition.
Furnished as Exhibit 99.1 is a copy of the First Horizon Corporation (“FHN” or "First Horizon") Third Quarter 2026 Earnings Release, released today.
ITEM 7.01. Regulation FD Disclosure.
Furnished as Exhibit 99.2 is a copy of the Investor Slide Presentation for the quarter ended September 30, 2026, released today.
Exhibits 99.1 and 99.2 are furnished pursuant to Item 2.02, “Results of Operations and Financial Condition” and Item 7.01, “Regulation FD Disclosure,” respectively. The exhibits speak as of the date thereof, and FHN does not assume any obligation to update in the future the information therein.
Use of Non-GAAP Measures and Regulatory Measures that are not GAAP in the Exhibits
Certain measures included in the exhibits furnished by this report are “non-GAAP,” meaning they are not presented in accordance with generally accepted accounting principles in the U.S. and also are not codified in U.S. banking regulations currently applicable to FHN. Although other entities may use calculation methods that differ from those used by FHN for non-GAAP measures, FHN’s management believes such measures are relevant to understanding the financial condition, capital position, and financial results of FHN and its business segments. Non-GAAP measures are reported to FHN’s management and Board of Directors through various internal reports.
The non-GAAP measures included in the exhibits furnished by this report are identified in the exhibits and in the reconciliations to GAAP measures. Reconciliations of non-GAAP to GAAP measures and presentation of the most comparable GAAP items are presented near the end (immediately before the Glossary) of Exhibit 99.1-Earnings Release and at the end of Exhibit 99.2-Investor Slide Presentation. The exhibits furnished by this report also include forward-looking guidance with respect to certain non-GAAP financial measures. FHN is not able to reconcile these forward-looking non-GAAP measures to their most directly comparable GAAP measures without unreasonable efforts because sufficient information is not available to determine and quantify, or to estimate the probable significance of, all of the variables and adjustments that would be needed for such reconciliations.
Presentation of regulatory measures, even those which are not GAAP, provides a meaningful basis for comparability to other financial institutions subject to the same regulations as FHN, as demonstrated by their use by banking regulators in reviewing capital adequacy of financial institutions. Although not GAAP terms, these regulatory measures are not considered “non-GAAP” under U.S. financial reporting rules as long as their presentation conforms to regulatory standards. Regulatory measures included in the measures furnished by this report include: common equity tier 1 capital ("CET1"), generally defined as common equity less goodwill, other intangibles, and certain other required regulatory deductions; tier 1 capital, generally defined as the sum of core capital (including common equity and instruments that cannot be redeemed at the option of the holder) adjusted for certain items under risk-based capital regulations; and risk-weighted assets ("RWA"), which is a measure of total on- and off-balance sheet assets adjusted for credit and market risk, used to determine regulatory capital ratios.
Forward-Looking Statements
Each exhibit furnished by this report contains forward-looking statements within the meaning of the Private Securities Litigation Reform Act of 1995, Section 27A of the Securities Act of 1933, as amended, and Section 21E of the Securities Exchange Act of 1934, as amended, with respect to FHN's beliefs, plans, goals, expectations, and estimates. Forward-looking statements are not a representation of historical information, but instead pertain to future operations, strategies, financial results, or other developments. Forward-looking statements often use words such as “believe,” “expect,” “anticipate,” “intend,” “estimate,” “should,” “is likely,” “will,” “going forward,” and other similar expressions that indicate future events and trends. Forward-looking statements are necessarily based upon estimates and assumptions that are inherently subject to significant business, operational, economic, and competitive uncertainties and contingencies, many of which are beyond FHN’s control, and many of which, with respect to future business decisions and actions (including acquisitions and divestitures), are subject to change and could cause FHN’s actual future results and outcomes to differ materially from those contemplated or implied by forward-looking statements or historical performance. While there is no assurance that any list of uncertainties and contingencies is complete, examples of factors which could cause actual results to differ from those contemplated by forward-looking statements or historical performance include those mentioned: in each exhibit; in the forepart, and in Items 1, 1A, and 7, of FHN’s most recent Annual Report on Form 10-K; and in the forepart, and in Item 1A of Part II, of FHN’s Quarterly Report(s) on Form 10-Q filed after that Annual Report. Any forward-looking statements made by or on behalf of FHN speak only as of the date they are made and FHN assumes no obligation to update or revise any forward-looking statements that are made in any exhibit or in any other statement, release, report, or filing from time to time. Actual results could differ, and expectations could change, possibly materially, because of one or more factors, including those factors listed in the documents mentioned above, and other factors not listed. Throughout each exhibit, numbers may not total due to rounding, references to EPS are fully diluted and capital ratios for the most recent quarter are estimates.
| FIRST HORIZON CORPORATION | 2 | FORM 8-K CURRENT REPORT 10/15/2026 | ||||||
ITEM 9.01. Financial Statements and Exhibits.
(d)Exhibits
Each of the following Exhibits 99.1 and 99.2, furnished pursuant to Items 2.02 and 7.01, respectively, is not to be considered “filed” under the Securities Exchange Act of 1934, as amended (“Exchange Act”), and shall not be incorporated by reference into any of FHN’s previous or future filings under the Securities Act of 1933, as amended, or the Exchange Act.
| Exhibit # | Description | |||||||
| 99.1 | ||||||||
| 99.2 | ||||||||
| 104 | Cover Page Interactive Data File, formatted in Inline XBRL | |||||||
| FIRST HORIZON CORPORATION | 3 | FORM 8-K CURRENT REPORT 10/15/2026 | ||||||
SIGNATURES
Pursuant to the requirements of the Securities Exchange Act of 1934, the registrant has duly caused this report to be signed on its behalf by the undersigned hereunto duly authorized.
| FIRST HORIZON CORPORATION | |||||||||||||||||
| (Registrant) | |||||||||||||||||
| Date: | October 15, 2026 | By: | /s/ Hope Dmuchowski | ||||||||||||||
| Name: | Hope Dmuchowski | ||||||||||||||||
| Title: | Senior Executive Vice President—Chief Financial Officer | ||||||||||||||||
| (Duly Authorized Officer and Principal Financial Officer) | |||||||||||||||||
| FIRST HORIZON CORPORATION | 4 | FORM 8-K CURRENT REPORT 10/15/2026 | ||||||

First Horizon Corporation Reports Third Quarter 2026 Results and Announces Strategic Balance Sheet Changes to Support Earnings and Growth
MEMPHIS, TN (October 15, 2026) – First Horizon Corporation (NYSE: FHN or “First Horizon”) today reported financial results for the third quarter of a net loss available to common shareholders of $(94) million or loss per share of $(0.20). These results reflect the impact of strategic actions to further align the balance sheet with the Company's growth priorities. During the quarter, the Company began evaluating the possibility of selling ~$4.5 billion of select lower yielding consumer mortgages and, in early October, entered into an agreement to sell these mortgages. This transaction will be accretive to earnings on a go forward basis and will provide balance sheet flexibility to support future loan growth. The transaction is expected to settle early in the fourth quarter.
Excluding notable items, adjusted earnings per share for third quarter 2026 was $0.53, down $0.01 from second quarter 2026 and up $0.02 from third quarter 2025. Reported results include the impacts of notable items totaling $0.73 per share, or $347 million after tax, primarily related to the reclassification of targeted mortgage loans to held for sale in relation to the pending mortgage portfolio sale.
CEO Commentary
“This quarter’s results are a testament to our disciplined approach and clear strategic priorities,” said Bryan Jordan, Chairman, President and CEO of First Horizon Corporation. “Average client deposit balances increased $1.3 billion in the quarter, and we continue to focus on growing and maintaining full client relationships and deploying capital where it best serves long-term value creation. Looking ahead, we remain committed to executing our strategy and delivering sustainable growth and value for our clients, associates, and shareholders.”
Key Financial Results
| 3Q26 | 3Q25 | |||||||||||||||||||||||||||||||||||||||||||||||||||||||||||||||||||
| ($ in millions, except per share) | Reported | Notable Items | Adjusted * | Reported | ||||||||||||||||||||||||||||||||||||||||||||||||||||||||||||||||
| Total revenue - FTE | $ | 410 | $ | 473 | $ | 883 | $ | 893 | ||||||||||||||||||||||||||||||||||||||||||||||||||||||||||||
| Noninterest expense | 529 | (8) | 521 | 551 | ||||||||||||||||||||||||||||||||||||||||||||||||||||||||||||||||
Pre-provision net revenue (PPNR) 3 | (122) | 481 | 359 | 339 | ||||||||||||||||||||||||||||||||||||||||||||||||||||||||||||||||
| Provision (benefit) for credit losses | (25) | 45 | 20 | (5) | ||||||||||||||||||||||||||||||||||||||||||||||||||||||||||||||||
| Income/(loss) before income taxes | (97) | 436 | 339 | 344 | ||||||||||||||||||||||||||||||||||||||||||||||||||||||||||||||||
| Income tax expense (benefit) | (18) | 89 | 71 | 78 | ||||||||||||||||||||||||||||||||||||||||||||||||||||||||||||||||
| Net income/(loss) | (79) | 347 | 268 | 266 | ||||||||||||||||||||||||||||||||||||||||||||||||||||||||||||||||
| Net income/(loss) available to common shareholders | (94) | 347 | 253 | 254 | ||||||||||||||||||||||||||||||||||||||||||||||||||||||||||||||||
| Diluted EPS | $ | (0.20) | $ | 0.73 | $ | 0.53 | $ | 0.50 | ||||||||||||||||||||||||||||||||||||||||||||||||||||||||||||
| Return on average assets | (0.37) | % | 1.25 | % | 1.29 | % | ||||||||||||||||||||||||||||||||||||||||||||||||||||||||||||||
| Return on average common equity (“ROCE") | (4.3) | 11.7 | 11.7 | |||||||||||||||||||||||||||||||||||||||||||||||||||||||||||||||||
Return on average tangible common equity (“ROTCE”)4 | (5.3) | 14.4 | 14.5 | |||||||||||||||||||||||||||||||||||||||||||||||||||||||||||||||||
| Efficiency Ratio | 129.6 | % | 58.9 | % | 61.9 | % | ||||||||||||||||||||||||||||||||||||||||||||||||||||||||||||||
* "Adjusted" results, along with return on tangible common equity, tangible book value per share, PPNR, ACL to loans ratio and certain other financial measures, are non-GAAP financial measures. All references to loans include leases. All references to earnings per share are based on diluted shares. NII, total revenue, NIM, and PPNR are presented on a fully taxable equivalent ("FTE") basis. Capital ratios are preliminary. Please see page 3 for information on our use of non-GAAP measures and a reconciliation of these measures to GAAP beginning on page 19. See footnote disclosures on page 18.
1
| Safety & Soundness | ||||||||||||||
Capital
CET1 ratio was 10.3%, a decrease from second quarter 2026. The decline in capital was driven by notable items and primarily reflects the impacts of the reclassification of certain mortgage loans to held for sale.
Asset Quality
Provision benefit was $25 million, versus expense of $15 million in second quarter 2026. Excluding the impact of the pending mortgage portfolio transaction, provision for credit losses expense was $20 million, up from $15 million in the prior quarter. Net charge-offs were $36 million or 22 basis points, up from $33 million or 20 basis points in the prior quarter. Nonperforming loans of $482 million decreased $49 million. The ALLL to loans ratio decreased 1 basis point to 1.08%, and the ACL to loans ratio increased 1 basis point to 1.25% due to reclassification of certain mortgage loans associated with the pending portfolio sale.
| Profitability | ||||||||||||||
Net Interest Income & NIM
Net interest income (FTE) increased $7 million to $686 million and net interest margin of 3.48% decreased 1 basis point. NII increased primarily due to higher average loan yield of 5.73%, which increased 6 basis points in the quarter. The NIM decrease was driven by higher interest bearing deposit costs of 2.45%, a 12 basis points increase, associated with higher average brokered deposits and higher customer deposit costs.
Fees & Expenses
Noninterest income decreased $487 million to a loss of $276 million primarily due to the recognition of a loss associated with the reclassification of select mortgage loans to held for sale. Adjusted noninterest income of $197 million decreased $14 million, driven by decreased deferred compensation, partially offset by increases in fixed income, service charges and fees, brokerage, trust, and insurance, and card and digital banking fees.
Noninterest expense of $529 million decreased $2 million, driven by decreased deferred compensation expenses, partially offset by increases in occupancy and equipment, and other noninterest expense related to new account promotions.
| Growth | ||||||||||||||
Loans & Leases
Average loan and lease balances of $64.5 billion decreased $206 million from the prior quarter, while period-end balances were $59.8 billion, down $5.5 billion from second quarter 2026. Loans to mortgage companies (LMC) decreased by $891 million at period-end, and consumer real estate decreased by $4.6 billion driven by the reclassification of certain mortgage loans to held for sale related to the pending mortgage portfolio sale.
Deposits
Average deposits of $68.6 billion increased $1.8 billion from second quarter 2026. Period-end deposits of $67.7 billion decreased $372 million driven primarily by a decrease in brokered CDs. Average client deposit balances increased $1.3 billion in the quarter and average brokered deposit balances were up $500 million.
* "Adjusted" results, along with return on tangible common equity, tangible book value per share, PPNR, ACL to loans ratio and certain other financial measures, are non-GAAP financial measures. All references to loans include leases. All references to earnings per share are based on diluted shares. NII, total revenue, NIM, and PPNR are presented on a fully taxable equivalent ("FTE") basis. Capital ratios are preliminary. Please see page 3 for information on our use of non-GAAP measures and a reconciliation of these measures to GAAP beginning on page 19. See footnote disclosures on page 18.
2
Forward-Looking Statements
This document contains forward-looking statements within the meaning of the Private Securities Litigation Reform Act of 1995, Section 27A of the Securities Act of 1933, as amended, and Section 21E of the Securities Exchange Act of 1934, as amended, with respect to FHN's beliefs, plans, goals, expectations, and estimates. Forward-looking statements are not a representation of historical information, but instead pertain to future operations, strategies, financial results, or other developments. Forward-looking statements often use words such as “believe,” “expect,” “anticipate,” “intend,” “estimate,” “should,” “is likely,” “will,” “going forward,” and other similar expressions that indicate future events and trends. Forward-looking statements are necessarily based upon estimates and assumptions that are inherently subject to significant business, operational, economic, and competitive uncertainties and contingencies, many of which are beyond FHN’s control, and many of which, with respect to future business decisions and actions (including acquisitions and divestitures), are subject to change and could cause FHN’s actual future results and outcomes to differ materially from those contemplated or implied by forward-looking statements or historical performance. While there is no assurance that any list of uncertainties and contingencies is complete, examples of factors which could cause actual results to differ from those contemplated by forward-looking statements or historical performance include those mentioned in this document; in Items 2.02 and 7.01 of FHN’s Current Report on Form 8-K to which this document has been furnished as an exhibit; in the forepart, and in Items 1, 1A, and 7, of FHN’s most recent Annual Report on Form 10-K; and in the forepart, and in Item 1A of Part II, of FHN’s Quarterly Report(s) on Form 10-Q filed after that Annual Report. Any forward-looking statements made by or on behalf of FHN speak only as of the date they are made, and FHN assumes no obligation to update or revise any forward-looking statements that are made in this document or in any other statement, release, report, or filing from time to time. Actual results could differ and expectations could change, possibly materially, because of one or more factors, including those factors listed in this document or the documents mentioned above, or other factors not listed.
Throughout this document, numbers may not total due to rounding, references to EPS are fully diluted, and capital ratios for the most recent quarter are estimates.
Use of non-GAAP Measures and Regulatory Measures that are not GAAP
Certain measures included in this report are “non-GAAP,” meaning they are not presented in accordance with generally accepted accounting principles in the U.S. and also are not codified in U.S. banking regulations currently applicable to FHN. Although other entities may use calculation methods that differ from those used by FHN for non-GAAP measures, FHN’s management believes such measures are relevant to understanding the financial condition, capital position, and financial results of FHN and its business segments. Non-GAAP measures are reported to FHN’s management and Board of Directors through various internal reports.
The non-GAAP measures presented in this earnings release are fully taxable equivalent measures, pre-provision net revenue ("PPNR"), return on average tangible common equity (“ROTCE”), tangible common equity (“TCE”) to tangible assets (“TA”), tangible book value ("TBV") per common share, and various consolidated and segment results and performance measures and ratios adjusted for notable items.
Presentation of regulatory measures, even those which are not GAAP, provides a meaningful basis for comparability to other financial institutions subject to the same regulations as FHN, as demonstrated by their use by banking regulators in reviewing capital adequacy of financial institutions. Although not GAAP terms, these regulatory measures are not considered “non-GAAP” under U.S. financial reporting rules as long as their presentation conforms to regulatory standards. Regulatory measures used in this financial supplement include: common equity tier 1 capital ("CET1"), generally defined as common equity less goodwill, other intangibles, and certain other required regulatory deductions; tier 1 capital, generally defined as the sum of core capital (including common equity and instruments that cannot be redeemed at the option of the holder) adjusted for certain items under risk-based capital regulations; and risk-weighted assets, which is a measure of total on- and off-balance sheet assets adjusted for credit and market risk, used to determine regulatory capital ratios.
Refer to the tabular reconciliation of non-GAAP to GAAP measures and presentation of the most comparable GAAP items, beginning on page 19.
3
Conference Call Information
Analysts, investors and interested parties may call toll-free starting at 8:15 a.m. CT on October 15, 2026, by dialing 1-833-461-5787 (if calling from the U.S.) and entering access code 391 852 446. The conference call will begin at 8:30 a.m. CT.
Participants can also opt to listen to the live audio webcast at https://ir.firsthorizon.com/events-and-presentations/default.aspx.
A replay of the webcast will be available on our website on October 15 and will be archived on the site for one year.
First Horizon Corporation (NYSE: FHN), with $84.3 billion in assets as of September 30, 2026, is a leading regional financial services company, dedicated to helping our clients, communities and associates unlock their full potential with capital and counsel. Headquartered in Memphis, TN, the banking subsidiary First Horizon Bank operates in 12 states concentrated in the southern U.S. The Company and its subsidiaries offer commercial, private banking, consumer, small business, wealth and trust management, retail brokerage, capital markets, fixed income, and mortgage banking services. First Horizon has been recognized as one of the nation's best employers by Fortune and Forbes magazines and a Top 10 Most Reputable U.S. Bank. More information is available at www.FirstHorizon.com.
Contact: Investor Relations - Tyler Craft - Tyler.Craft@firsthorizon.com
Media Relations - Beth Ardoin - Beth.Ardoin@firsthorizon.com
4
| CONSOLIDATED INCOME STATEMENT | |||||||||||||||||||||||||||||||||||||||||||||||||||||||||||||||||||||||||||||
| Quarterly, Unaudited | |||||||||||||||||||||||||||||||||||||||||||||||||||||||||||||||||||||||||||||
| 3Q26 Change vs. | |||||||||||||||||||||||||||||||||||||||||||||||||||||||||||||||||||||||||||||
| ($ in millions, except per share data) | 3Q26 | 2Q26 | 1Q26 | 4Q25 | 3Q25 | 2Q26 | 3Q25 | ||||||||||||||||||||||||||||||||||||||||||||||||||||||||||||||||||||||
| $ | % | $ | % | ||||||||||||||||||||||||||||||||||||||||||||||||||||||||||||||||||||||||||
Interest income - taxable equivalent1 | $ | 1,057 | $ | 1,033 | $ | 1,008 | $ | 1,054 | $ | 1,081 | $ | 24 | 2 | % | $ | (24) | (2) | % | |||||||||||||||||||||||||||||||||||||||||||||||||||||||||||
Interest expense - taxable equivalent1 | 371 | 354 | 337 | 375 | 403 | 17 | 5 | (33) | (8) | ||||||||||||||||||||||||||||||||||||||||||||||||||||||||||||||||||||
| Net interest income - taxable equivalent | 686 | 679 | 670 | 679 | 678 | 7 | 1 | 8 | 1 | ||||||||||||||||||||||||||||||||||||||||||||||||||||||||||||||||||||
| Less: Taxable - equivalent adjustment | 3 | 3 | 3 | 3 | 3 | — | 2 | — | (9) | ||||||||||||||||||||||||||||||||||||||||||||||||||||||||||||||||||||
| Net interest income | 683 | 676 | 667 | 676 | 674 | 7 | 1 | 9 | 1 | ||||||||||||||||||||||||||||||||||||||||||||||||||||||||||||||||||||
| Noninterest income: | |||||||||||||||||||||||||||||||||||||||||||||||||||||||||||||||||||||||||||||
| Fixed income | 49 | 46 | 53 | 57 | 57 | 3 | 7 | (8) | (15) | ||||||||||||||||||||||||||||||||||||||||||||||||||||||||||||||||||||
| Mortgage banking | 8 | 9 | 9 | 10 | 15 | (1) | (15) | (7) | (48) | ||||||||||||||||||||||||||||||||||||||||||||||||||||||||||||||||||||
| Brokerage, trust, and insurance | 46 | 45 | 43 | 41 | 39 | 1 | 1 | 7 | 17 | ||||||||||||||||||||||||||||||||||||||||||||||||||||||||||||||||||||
| Service charges and fees | 60 | 59 | 58 | 64 | 57 | 1 | 2 | 2 | 4 | ||||||||||||||||||||||||||||||||||||||||||||||||||||||||||||||||||||
| Card and digital banking fees | 19 | 18 | 18 | 18 | 19 | 1 | 4 | — | 1 | ||||||||||||||||||||||||||||||||||||||||||||||||||||||||||||||||||||
Deferred compensation income9 | (2) | 15 | (3) | 3 | 8 | (17) | (111) | (10) | (120) | ||||||||||||||||||||||||||||||||||||||||||||||||||||||||||||||||||||
Loss on pending sale of mortgage loans11 | (473) | — | — | — | — | (473) | NM | (473) | NM | ||||||||||||||||||||||||||||||||||||||||||||||||||||||||||||||||||||
| Securities gains/(losses) | (1) | — | (1) | — | — | (1) | NM | (1) | NM | ||||||||||||||||||||||||||||||||||||||||||||||||||||||||||||||||||||
| Other noninterest income | 18 | 18 | 16 | 18 | 19 | — | (2) | (1) | (3) | ||||||||||||||||||||||||||||||||||||||||||||||||||||||||||||||||||||
| Total noninterest income | (276) | 211 | 195 | 212 | 215 | (487) | NM | (491) | NM | ||||||||||||||||||||||||||||||||||||||||||||||||||||||||||||||||||||
| Total revenue | 407 | 887 | 862 | 888 | 889 | (480) | (54) | (482) | (54) | ||||||||||||||||||||||||||||||||||||||||||||||||||||||||||||||||||||
| Noninterest expense: | |||||||||||||||||||||||||||||||||||||||||||||||||||||||||||||||||||||||||||||
| Personnel expense: | |||||||||||||||||||||||||||||||||||||||||||||||||||||||||||||||||||||||||||||
| Salaries and benefits | 216 | 215 | 211 | 213 | 209 | 1 | — | 7 | 4 | ||||||||||||||||||||||||||||||||||||||||||||||||||||||||||||||||||||
| Incentives and commissions | 79 | 76 | 79 | 87 | 79 | 3 | 4 | — | — | ||||||||||||||||||||||||||||||||||||||||||||||||||||||||||||||||||||
Deferred compensation expense9 | — | 13 | (2) | 3 | 8 | (13) | (100) | (8) | (100) | ||||||||||||||||||||||||||||||||||||||||||||||||||||||||||||||||||||
| Total personnel expense | 295 | 304 | 289 | 303 | 296 | (9) | (3) | (1) | — | ||||||||||||||||||||||||||||||||||||||||||||||||||||||||||||||||||||
Occupancy and equipment2 | 89 | 86 | 84 | 83 | 80 | 3 | 3 | 9 | 11 | ||||||||||||||||||||||||||||||||||||||||||||||||||||||||||||||||||||
| Outside services | 78 | 79 | 69 | 95 | 79 | (2) | (2) | (1) | (2) | ||||||||||||||||||||||||||||||||||||||||||||||||||||||||||||||||||||
| Amortization of intangible assets | 8 | 8 | 8 | 9 | 9 | — | — | (1) | (9) | ||||||||||||||||||||||||||||||||||||||||||||||||||||||||||||||||||||
| Other noninterest expense | 59 | 53 | 55 | 55 | 87 | 6 | 12 | (28) | (32) | ||||||||||||||||||||||||||||||||||||||||||||||||||||||||||||||||||||
| Total noninterest expense | 529 | 531 | 505 | 545 | 551 | (2) | — | (22) | (4) | ||||||||||||||||||||||||||||||||||||||||||||||||||||||||||||||||||||
Pre-provision net revenue3 | (122) | 356 | 357 | 343 | 339 | (478) | (134) | (461) | (136) | ||||||||||||||||||||||||||||||||||||||||||||||||||||||||||||||||||||
| Provision (benefit) for credit losses | (25) | 15 | 15 | — | (5) | (40) | NM | (20) | NM | ||||||||||||||||||||||||||||||||||||||||||||||||||||||||||||||||||||
| Income/(loss) before income taxes | (97) | 341 | 342 | 343 | 344 | (438) | (128) | (441) | (128) | ||||||||||||||||||||||||||||||||||||||||||||||||||||||||||||||||||||
| Income tax expense (benefit) | (18) | 66 | 76 | 78 | 78 | (84) | (127) | (96) | (123) | ||||||||||||||||||||||||||||||||||||||||||||||||||||||||||||||||||||
| Net income/(loss) | (79) | 274 | 266 | 266 | 266 | (354) | (129) | (345) | (130) | ||||||||||||||||||||||||||||||||||||||||||||||||||||||||||||||||||||
| Net income attributable to noncontrolling interest | 4 | 4 | 3 | 4 | 4 | — | 5 | — | (8) | ||||||||||||||||||||||||||||||||||||||||||||||||||||||||||||||||||||
| Net income/(loss) attributable to controlling interest | (83) | 271 | 263 | 262 | 262 | (354) | (131) | (345) | (132) | ||||||||||||||||||||||||||||||||||||||||||||||||||||||||||||||||||||
| Preferred stock dividends | 11 | 10 | 5 | 5 | 8 | — | 5 | 3 | 40 | ||||||||||||||||||||||||||||||||||||||||||||||||||||||||||||||||||||
| Net income/(loss) available to common shareholders | $ | (94) | $ | 260 | $ | 257 | $ | 257 | $ | 254 | $ | (354) | (136) | % | $ | (348) | (137) | % | |||||||||||||||||||||||||||||||||||||||||||||||||||||||||||
| Common Share Data | |||||||||||||||||||||||||||||||||||||||||||||||||||||||||||||||||||||||||||||
| EPS | $ | (0.20) | $ | 0.55 | $ | 0.54 | $ | 0.52 | $ | 0.50 | $ | (0.75) | (136) | % | $ | (0.70) | (140) | % | |||||||||||||||||||||||||||||||||||||||||||||||||||||||||||
| Basic shares | 474 | 475 | 480 | 491 | 505 | (1) | — | (31) | (6) | ||||||||||||||||||||||||||||||||||||||||||||||||||||||||||||||||||||
| Diluted EPS | $ | (0.20) | $ | 0.54 | $ | 0.53 | $ | 0.52 | $ | 0.50 | $ | (0.74) | (137) | $ | (0.70) | (140) | |||||||||||||||||||||||||||||||||||||||||||||||||||||||||||||
Diluted shares8 | 474 | 480 | 487 | 496 | 510 | (6) | (1) | % | (37) | (7) | % | ||||||||||||||||||||||||||||||||||||||||||||||||||||||||||||||||||
| Effective tax rate | 18.4 | % | 19.5 | % | 22.2 | % | 22.6 | % | 22.7 | % | |||||||||||||||||||||||||||||||||||||||||||||||||||||||||||||||||||
Numbers may not total due to rounding.
See footnote disclosures on page 18 and glossary of terms on page 24.
5
ADJUSTED4 FINANCIAL DATA - SEE NOTABLE ITEMS ON PAGE 7 | ||
| Quarterly, Unaudited | ||
| 3Q26 Change vs. | |||||||||||||||||||||||||||||||||||||||||||||||||||||||||||||||||||||||||||||
| ($ in millions, except per share data) | 3Q26 | 2Q26 | 1Q26 | 4Q25 | 3Q25 | 2Q26 | 3Q25 | ||||||||||||||||||||||||||||||||||||||||||||||||||||||||||||||||||||||
| $ | % | $ | % | ||||||||||||||||||||||||||||||||||||||||||||||||||||||||||||||||||||||||||
Net interest income (FTE)1 | $ | 686 | $ | 679 | $ | 670 | $ | 679 | $ | 678 | $ | 7 | 1 | % | $ | 8 | 1 | % | |||||||||||||||||||||||||||||||||||||||||||||||||||||||||||
| Adjusted noninterest income: | |||||||||||||||||||||||||||||||||||||||||||||||||||||||||||||||||||||||||||||
| Fixed income | 49 | 46 | 53 | 57 | 57 | 3 | 7 | (8) | (15) | ||||||||||||||||||||||||||||||||||||||||||||||||||||||||||||||||||||
| Mortgage banking | 8 | 9 | 9 | 10 | 15 | (1) | (15) | (7) | (48) | ||||||||||||||||||||||||||||||||||||||||||||||||||||||||||||||||||||
| Brokerage, trust, and insurance | 46 | 45 | 43 | 41 | 39 | 1 | 1 | 7 | 17 | ||||||||||||||||||||||||||||||||||||||||||||||||||||||||||||||||||||
| Service charges and fees | 60 | 59 | 58 | 64 | 57 | 1 | 2 | 2 | 4 | ||||||||||||||||||||||||||||||||||||||||||||||||||||||||||||||||||||
| Card and digital banking fees | 19 | 18 | 18 | 18 | 19 | 1 | 4 | — | 1 | ||||||||||||||||||||||||||||||||||||||||||||||||||||||||||||||||||||
Deferred compensation income9 | (2) | 15 | (3) | 3 | 8 | (17) | (111) | (10) | (120) | ||||||||||||||||||||||||||||||||||||||||||||||||||||||||||||||||||||
| Adjusted loss on pending sale of mortgage loans | — | — | — | — | — | NM | — | NM | |||||||||||||||||||||||||||||||||||||||||||||||||||||||||||||||||||||
| Securities gains/(losses) | (1) | — | (1) | — | — | (1) | NM | (1) | NM | ||||||||||||||||||||||||||||||||||||||||||||||||||||||||||||||||||||
| Adjusted other noninterest income | 18 | 18 | 16 | 18 | 19 | — | (2) | (1) | (3) | ||||||||||||||||||||||||||||||||||||||||||||||||||||||||||||||||||||
| Adjusted total noninterest income | $ | 197 | $ | 211 | $ | 195 | $ | 212 | $ | 215 | $ | (14) | (7) | % | $ | (18) | (9) | % | |||||||||||||||||||||||||||||||||||||||||||||||||||||||||||
Total revenue (FTE)1 | $ | 883 | $ | 890 | $ | 865 | $ | 892 | $ | 893 | $ | (7) | (1) | % | $ | (10) | (1) | % | |||||||||||||||||||||||||||||||||||||||||||||||||||||||||||
| Adjusted noninterest expense: | |||||||||||||||||||||||||||||||||||||||||||||||||||||||||||||||||||||||||||||
| Adjusted personnel expense: | |||||||||||||||||||||||||||||||||||||||||||||||||||||||||||||||||||||||||||||
| Adjusted salaries and benefits | $ | 216 | $ | 215 | $ | 211 | $ | 213 | $ | 209 | $ | 1 | — | % | $ | 7 | 4 | % | |||||||||||||||||||||||||||||||||||||||||||||||||||||||||||
| Adjusted incentives and commissions | 76 | 76 | 79 | 87 | 79 | — | — | (3) | (4) | ||||||||||||||||||||||||||||||||||||||||||||||||||||||||||||||||||||
Deferred compensation expense9 | — | 13 | (2) | 3 | 8 | (13) | (100) | (8) | (100) | ||||||||||||||||||||||||||||||||||||||||||||||||||||||||||||||||||||
| Adjusted total personnel expense | 292 | 304 | 289 | 303 | 296 | (12) | (4) | (4) | (1) | ||||||||||||||||||||||||||||||||||||||||||||||||||||||||||||||||||||
Adjusted occupancy and equipment2 | 89 | 86 | 84 | 83 | 80 | 3 | 3 | 9 | 11 | ||||||||||||||||||||||||||||||||||||||||||||||||||||||||||||||||||||
| Adjusted outside services | 78 | 79 | 69 | 95 | 79 | (2) | (2) | (1) | (2) | ||||||||||||||||||||||||||||||||||||||||||||||||||||||||||||||||||||
| Amortization of intangible assets | 8 | 8 | 8 | 9 | 9 | — | — | (1) | (9) | ||||||||||||||||||||||||||||||||||||||||||||||||||||||||||||||||||||
| Adjusted other noninterest expense | 54 | 48 | 55 | 52 | 79 | 6 | 13 | (25) | (32) | ||||||||||||||||||||||||||||||||||||||||||||||||||||||||||||||||||||
| Adjusted total noninterest expense | $ | 521 | $ | 526 | $ | 505 | $ | 541 | $ | 542 | $ | (5) | (1) | % | $ | (22) | (4) | % | |||||||||||||||||||||||||||||||||||||||||||||||||||||||||||
Adjusted pre-provision net revenue4 | $ | 362 | $ | 364 | $ | 360 | $ | 350 | $ | 351 | $ | (2) | (1) | % | $ | 12 | 3 | % | |||||||||||||||||||||||||||||||||||||||||||||||||||||||||||
| Adjusted provision (benefit) for credit losses | $ | 20 | $ | 15 | $ | 15 | $ | — | $ | (5) | $ | 5 | 33 | % | $ | 25 | NM | ||||||||||||||||||||||||||||||||||||||||||||||||||||||||||||
| Adjusted net income/(loss) available to common shareholders | $ | 253 | $ | 262 | $ | 257 | $ | 259 | $ | 263 | $ | (9) | (4) | % | $ | (10) | (4) | % | |||||||||||||||||||||||||||||||||||||||||||||||||||||||||||
| Adjusted Common Share Data | |||||||||||||||||||||||||||||||||||||||||||||||||||||||||||||||||||||||||||||
| Adjusted diluted EPS | $ | 0.53 | $ | 0.54 | $ | 0.53 | $ | 0.52 | $ | 0.51 | $ | (0.01) | (2) | % | $ | 0.02 | 4 | % | |||||||||||||||||||||||||||||||||||||||||||||||||||||||||||
Diluted shares8 | 479 | 480 | 487 | 496 | 510 | (1) | — | % | (31) | (6) | % | ||||||||||||||||||||||||||||||||||||||||||||||||||||||||||||||||||
| Adjusted effective tax rate | 21.0 | % | 19.5 | % | 22.2 | % | 22.7 | % | 22.7 | % | |||||||||||||||||||||||||||||||||||||||||||||||||||||||||||||||||||
Adjusted ROTCE4 | 14.4 | % | 15.3 | % | 15.1 | % | 15.0 | % | 15.0 | % | |||||||||||||||||||||||||||||||||||||||||||||||||||||||||||||||||||
Adjusted efficiency ratio4 | 58.9 | % | 59.1 | % | 58.3 | % | 60.7 | % | 60.8 | % | |||||||||||||||||||||||||||||||||||||||||||||||||||||||||||||||||||
Numbers may not total due to rounding.
See footnote disclosures on page 18 and glossary of terms on page 24.
6
| NOTABLE ITEMS | ||
| Quarterly, Unaudited | ||
| (In millions) | 3Q26 | 2Q26 | 1Q26 | 4Q25 | 3Q25 | ||||||||||||||||||||||||||||||||||||
| Summary of Notable Items: | |||||||||||||||||||||||||||||||||||||||||
| Loss on pending sale of mortgage loans (noninterest income) | (473) | — | — | — | — | ||||||||||||||||||||||||||||||||||||
| Provision reversal related to pending sale of mortgage loans | 45 | — | — | — | — | ||||||||||||||||||||||||||||||||||||
| Restructuring expenses (personnel expense) | (3) | — | — | — | — | ||||||||||||||||||||||||||||||||||||
| FDIC special assessment (other noninterest expense) | — | — | — | 7 | 2 | ||||||||||||||||||||||||||||||||||||
| Other notable expenses * | (5) | (5) | — | (10) | (10) | ||||||||||||||||||||||||||||||||||||
| Total notable items (pre-tax) | $ | (436) | $ | (5) | $ | — | $ | (3) | $ | (8) | |||||||||||||||||||||||||||||||
| Tax-related notable items | $ | — | $ | — | $ | — | $ | — | $ | — | |||||||||||||||||||||||||||||||
| Preferred Stock Dividend ** | $ | — | $ | 3 | $ | — | $ | — | $ | (3) | |||||||||||||||||||||||||||||||
Numbers may not total due to rounding.
*3Q26 and 2Q26 each include $5 million of Visa derivative valuation expenses; 4Q25 and 3Q25 each include $10 million.
** 2Q26 and 3Q25 include deemed dividends on the redemption of Preferred Stock.
| IMPACT OF NOTABLE ITEMS: | ||
| Quarterly, Unaudited | ||
| ($ in millions, except per share data) | 3Q26 | 2Q26 | 1Q26 | 4Q25 | 3Q25 | |||||||||||||||||||||||||||||||||||||||
| Impacts of Notable Items: | ||||||||||||||||||||||||||||||||||||||||||||
| Noninterest income: | ||||||||||||||||||||||||||||||||||||||||||||
| Loss on pending sale of mortgage loans | $ | 473 | $ | — | $ | — | $ | — | $ | — | ||||||||||||||||||||||||||||||||||
| Total noninterest income | $ | 473 | $ | — | $ | — | $ | — | $ | — | ||||||||||||||||||||||||||||||||||
| Noninterest expense: | ||||||||||||||||||||||||||||||||||||||||||||
| Personnel expenses: | ||||||||||||||||||||||||||||||||||||||||||||
| Salaries and benefits | $ | — | $ | — | $ | — | $ | — | $ | — | ||||||||||||||||||||||||||||||||||
| Incentives and commissions | (3) | — | — | — | — | |||||||||||||||||||||||||||||||||||||||
| Total personnel expenses | (3) | — | — | — | — | |||||||||||||||||||||||||||||||||||||||
| Other noninterest expense | (5) | (5) | — | (3) | (8) | |||||||||||||||||||||||||||||||||||||||
| Total noninterest expense | (8) | (5) | — | (3) | (8) | |||||||||||||||||||||||||||||||||||||||
| Pre-provision net revenue | 481 | 5 | — | 3 | 8 | |||||||||||||||||||||||||||||||||||||||
| Provision for credit losses | (45) | — | — | — | — | |||||||||||||||||||||||||||||||||||||||
| Income before income taxes | 436 | 5 | — | 3 | 8 | |||||||||||||||||||||||||||||||||||||||
| Provision for income taxes | 89 | 1 | — | 1 | 2 | |||||||||||||||||||||||||||||||||||||||
| Preferred stock dividends * | — | 3 | — | — | (3) | |||||||||||||||||||||||||||||||||||||||
| Net income/(loss) available to common shareholders | $ | 347 | $ | 1 | $ | — | $ | 2 | $ | 9 | ||||||||||||||||||||||||||||||||||
| EPS impact of notable items | $ | 0.73 | $ | — | $ | — | $ | — | $ | 0.01 | ||||||||||||||||||||||||||||||||||
Numbers may not total due to rounding.
* 2Q26 and 3Q25 include deemed dividends on the redemption of Preferred Stock.
7
| FINANCIAL RATIOS | |||||||||||||||||||||||||||||||||||||||||||||||||||||||||||||||||||||||||||||
| Quarterly, Unaudited | |||||||||||||||||||||||||||||||||||||||||||||||||||||||||||||||||||||||||||||
| 3Q26 Change vs. | |||||||||||||||||||||||||||||||||||||||||||||||||||||||||||||||||||||||||||||
| 3Q26 | 2Q26 | 1Q26 | 4Q25 | 3Q25 | 2Q26 | 3Q25 | |||||||||||||||||||||||||||||||||||||||||||||||||||||||||||||||||||||||
| FINANCIAL RATIOS | $/bp | % | $/bp | % | |||||||||||||||||||||||||||||||||||||||||||||||||||||||||||||||||||||||||
Net interest margin6 | 3.48 | % | 3.49 | % | 3.52 | % | 3.51 | % | 3.55 | % | (1) | bp | (7) | bp | |||||||||||||||||||||||||||||||||||||||||||||||||||||||||||||||
| Return on average assets | (0.37) | % | 1.31 | % | 1.30 | % | 1.27 | % | 1.29 | % | (168) | bp | (166) | bp | |||||||||||||||||||||||||||||||||||||||||||||||||||||||||||||||
Adjusted return on average assets4 | 1.25 | % | 1.33 | % | 1.30 | % | 1.28 | % | 1.32 | % | (8) | bp | (7) | bp | |||||||||||||||||||||||||||||||||||||||||||||||||||||||||||||||
| Return on average common equity (“ROCE”) | (4.34) | % | 12.33 | % | 12.26 | % | 11.99 | % | 11.74 | % | (1,667) | bp | (1,608) | bp | |||||||||||||||||||||||||||||||||||||||||||||||||||||||||||||||
Return on average tangible common equity (“ROTCE”)4 | (5.33) | % | 15.21 | % | 15.12 | % | 14.82 | % | 14.49 | % | (2,054) | bp | (1,982) | bp | |||||||||||||||||||||||||||||||||||||||||||||||||||||||||||||||
Adjusted ROTCE4 | 14.36 | % | 15.29 | % | 15.12 | % | 14.96 | % | 15.00 | % | (93) | bp | (64) | bp | |||||||||||||||||||||||||||||||||||||||||||||||||||||||||||||||
| Noninterest income as a % of total revenue | (67.31) | % | 23.73 | % | 22.63 | % | 23.89 | % | 24.16 | % | (9,104) | bp | (9,147) | bp | |||||||||||||||||||||||||||||||||||||||||||||||||||||||||||||||
Adjusted noninterest income as a % of total revenue4 | 22.38 | % | 23.65 | % | 22.55 | % | 23.80 | % | 24.07 | % | (127) | bp | (169) | bp | |||||||||||||||||||||||||||||||||||||||||||||||||||||||||||||||
| Efficiency ratio | 129.56 | % | 59.88 | % | 58.54 | % | 61.33 | % | 61.92 | % | 6,968 | bp | 6,764 | bp | |||||||||||||||||||||||||||||||||||||||||||||||||||||||||||||||
Adjusted efficiency ratio4 | 58.91 | % | 59.11 | % | 58.34 | % | 60.73 | % | 60.76 | % | (20) | bp | (185) | bp | |||||||||||||||||||||||||||||||||||||||||||||||||||||||||||||||
| Allowance for loan and lease losses to loans and leases | 1.08 | % | 1.09 | % | 1.13 | % | 1.15 | % | 1.23 | % | (1) | bp | (15) | bp | |||||||||||||||||||||||||||||||||||||||||||||||||||||||||||||||
Allowance for credit losses to loans and leases4 | 1.25 | % | 1.24 | % | 1.28 | % | 1.31 | % | 1.38 | % | 1 | bp | (13) | bp | |||||||||||||||||||||||||||||||||||||||||||||||||||||||||||||||
| CAPITAL DATA | |||||||||||||||||||||||||||||||||||||||||||||||||||||||||||||||||||||||||||||
CET1 capital ratio* | 10.3 | % | 10.5 | % | 10.5 | % | 10.6 | % | 11.0 | % | (12) | bp | (62) | bp | |||||||||||||||||||||||||||||||||||||||||||||||||||||||||||||||
| Tier 1 capital ratio* | 11.7 | % | 11.8 | % | 11.9 | % | 11.5 | % | 11.9 | % | (11) | bp | (20) | bp | |||||||||||||||||||||||||||||||||||||||||||||||||||||||||||||||
| Total capital ratio* | 13.2 | % | 13.4 | % | 13.7 | % | 13.3 | % | 13.8 | % | (18) | bp | (55) | bp | |||||||||||||||||||||||||||||||||||||||||||||||||||||||||||||||
| Tier 1 leverage ratio* | 10.2 | % | 10.5 | % | 10.6 | % | 10.2 | % | 10.5 | % | (27) | bp | (23) | bp | |||||||||||||||||||||||||||||||||||||||||||||||||||||||||||||||
| Risk-weighted assets (“RWA”) (billions)* | $ | 73.9 | $ | 74.6 | $ | 73.3 | $ | 73.0 | $ | 72.0 | $ | (0.7) | (1) | % | $ | 1.9 | 3 | % | |||||||||||||||||||||||||||||||||||||||||||||||||||||||||||
| Total equity to total assets | 10.82 | % | 11.21 | % | 11.25 | % | 10.90 | % | 11.11 | % | (39) | bp | (29) | bp | |||||||||||||||||||||||||||||||||||||||||||||||||||||||||||||||
Tangible common equity/tangible assets (“TCE/TA”)4 | 7.93 | % | 8.31 | % | 8.27 | % | 8.37 | % | 8.55 | % | (38) | bp | (62) | bp | |||||||||||||||||||||||||||||||||||||||||||||||||||||||||||||||
Period-end shares outstanding (millions)8 | 474 | 474 | 476 | 485 | 500 | — | — | % | (26) | (5) | % | ||||||||||||||||||||||||||||||||||||||||||||||||||||||||||||||||||
| Cash dividends declared per common share | $ | 0.17 | $ | 0.17 | $ | 0.17 | $ | 0.15 | $ | 0.15 | $ | — | — | % | $ | 0.02 | 13 | % | |||||||||||||||||||||||||||||||||||||||||||||||||||||||||||
| Book value per common share | $ | 17.20 | $ | 17.91 | $ | 17.72 | $ | 17.53 | $ | 17.19 | $ | (0.71) | (4) | % | $ | 0.01 | — | % | |||||||||||||||||||||||||||||||||||||||||||||||||||||||||||
Tangible book value per common share4 | $ | 13.84 | $ | 14.53 | $ | 14.34 | $ | 14.20 | $ | 13.94 | $ | (0.69) | (5) | % | $ | (0.10) | (1) | % | |||||||||||||||||||||||||||||||||||||||||||||||||||||||||||
| SELECTED BALANCE SHEET DATA | |||||||||||||||||||||||||||||||||||||||||||||||||||||||||||||||||||||||||||||
| Loans-to-deposit ratio (period-end balances) | 88.34 | % | 95.97 | % | 96.83 | % | 95.08 | % | 96.23 | % | (763) | bp | (789) | bp | |||||||||||||||||||||||||||||||||||||||||||||||||||||||||||||||
| Loans-to-deposit ratio (average balances) | 94.07 | % | 96.87 | % | 95.44 | % | 95.33 | % | 95.24 | % | (280) | bp | (117) | bp | |||||||||||||||||||||||||||||||||||||||||||||||||||||||||||||||
| Full-time equivalent associates | 7,375 | 7,422 | 7,369 | 7,373 | 7,341 | (47) | (1) | % | 34 | — | % | ||||||||||||||||||||||||||||||||||||||||||||||||||||||||||||||||||
*Current quarter is an estimate.
See footnote disclosures on page 18 and glossary of terms on page 24.
8
CONSOLIDATED PERIOD-END BALANCE SHEET
Quarterly, Unaudited
| 3Q26 Change vs. | |||||||||||||||||||||||||||||||||||||||||||||||||||||||||||
| (In millions) | 3Q26 | 2Q26 | 1Q26 | 4Q25 | 3Q25 | 2Q26 | 3Q25 | ||||||||||||||||||||||||||||||||||||||||||||||||||||
| Assets: | $ | % | $ | % | |||||||||||||||||||||||||||||||||||||||||||||||||||||||
| Loans and leases: | |||||||||||||||||||||||||||||||||||||||||||||||||||||||||||
| Commercial, financial, and industrial (C&I) | $ | 36,309 | $ | 37,296 | $ | 36,467 | $ | 35,905 | $ | 34,401 | $ | (986) | (3) | % | $ | 1,908 | 6 | % | |||||||||||||||||||||||||||||||||||||||||
| Commercial real estate | 13,692 | 13,595 | 13,420 | 13,563 | 13,674 | 97 | 1 | 17 | — | ||||||||||||||||||||||||||||||||||||||||||||||||||
| Total Commercial | 50,001 | 50,891 | 49,887 | 49,468 | 48,076 | (890) | (2) | 1,925 | 4 | ||||||||||||||||||||||||||||||||||||||||||||||||||
| Consumer real estate | 9,238 | 13,869 | 13,928 | 14,107 | 14,403 | (4,632) | (33) | (5,165) | (36) | ||||||||||||||||||||||||||||||||||||||||||||||||||
Credit card and other5 | 570 | 570 | 562 | 580 | 579 | — | — | (9) | (2) | ||||||||||||||||||||||||||||||||||||||||||||||||||
| Total Consumer | 9,807 | 14,439 | 14,490 | 14,688 | 14,982 | (4,632) | (32) | (5,175) | (35) | ||||||||||||||||||||||||||||||||||||||||||||||||||
| Loans and leases, net of unearned income | 59,808 | 65,330 | 64,377 | 64,156 | 63,058 | (5,522) | (8) | (3,249) | (5) | ||||||||||||||||||||||||||||||||||||||||||||||||||
Loans held for sale11 | 4,368 | 501 | 562 | 406 | 501 | 3,867 | NM | 3,867 | NM | ||||||||||||||||||||||||||||||||||||||||||||||||||
| Investment securities | 8,751 | 9,062 | 9,351 | 9,382 | 9,332 | (311) | (3) | (580) | (6) | ||||||||||||||||||||||||||||||||||||||||||||||||||
| Trading securities | 1,873 | 1,417 | 1,812 | 1,904 | 2,070 | 456 | 32 | (197) | (10) | ||||||||||||||||||||||||||||||||||||||||||||||||||
| Interest-bearing deposits with banks | 1,798 | 1,158 | 1,116 | 1,125 | 1,228 | 640 | 55 | 570 | 46 | ||||||||||||||||||||||||||||||||||||||||||||||||||
| Federal funds sold and securities purchased under agreements to resell | 1,107 | 594 | 754 | 634 | 774 | 512 | 86 | 332 | 43 | ||||||||||||||||||||||||||||||||||||||||||||||||||
| Total interest earning assets | 77,706 | 78,063 | 77,971 | 77,606 | 76,963 | (357) | — | 742 | 1 | ||||||||||||||||||||||||||||||||||||||||||||||||||
| Cash and due from banks | 930 | 1,034 | 889 | 961 | 912 | (105) | (10) | 17 | 2 | ||||||||||||||||||||||||||||||||||||||||||||||||||
| Goodwill and other intangible assets, net | 1,591 | 1,599 | 1,607 | 1,615 | 1,624 | (8) | (1) | (33) | (2) | ||||||||||||||||||||||||||||||||||||||||||||||||||
| Premises and equipment, net | 561 | 545 | 539 | 544 | 553 | 16 | 3 | 8 | 1 | ||||||||||||||||||||||||||||||||||||||||||||||||||
| Allowance for loan and lease losses | (644) | (709) | (730) | (738) | (777) | 65 | 9 | 132 | 17 | ||||||||||||||||||||||||||||||||||||||||||||||||||
| Other assets | 4,175 | 3,906 | 3,855 | 3,889 | 3,916 | 269 | 7 | 259 | 7 | ||||||||||||||||||||||||||||||||||||||||||||||||||
| Total assets | $ | 84,318 | $ | 84,437 | $ | 84,132 | $ | 83,876 | $ | 83,192 | $ | (120) | — | % | $ | 1,125 | 1 | % | |||||||||||||||||||||||||||||||||||||||||
| Liabilities and Shareholders' Equity: | |||||||||||||||||||||||||||||||||||||||||||||||||||||||||||
| Deposits: | |||||||||||||||||||||||||||||||||||||||||||||||||||||||||||
| Savings | $ | 25,983 | $ | 25,553 | $ | 26,007 | $ | 26,010 | $ | 26,365 | $ | 430 | 2 | % | $ | (382) | (1) | % | |||||||||||||||||||||||||||||||||||||||||
| Time deposits | 8,793 | 10,018 | 7,125 | 6,485 | 6,201 | (1,225) | (12) | 2,592 | 42 | ||||||||||||||||||||||||||||||||||||||||||||||||||
| Other interest-bearing deposits | 17,324 | 16,508 | 17,440 | 19,158 | 16,936 | 816 | 5 | 387 | 2 | ||||||||||||||||||||||||||||||||||||||||||||||||||
| Total interest-bearing deposits | 52,100 | 52,078 | 50,572 | 51,653 | 49,502 | 22 | — | 2,598 | 5 | ||||||||||||||||||||||||||||||||||||||||||||||||||
| Trading liabilities | 997 | 533 | 666 | 607 | 662 | 465 | 87 | 336 | 51 | ||||||||||||||||||||||||||||||||||||||||||||||||||
| Federal funds purchased and securities sold under agreements to repurchase | 1,967 | 2,161 | 2,193 | 3,012 | 2,675 | (194) | (9) | (708) | (26) | ||||||||||||||||||||||||||||||||||||||||||||||||||
| Short-term borrowings | 837 | 842 | 1,975 | 241 | 1,596 | (6) | (1) | (759) | (48) | ||||||||||||||||||||||||||||||||||||||||||||||||||
| Term borrowings | 1,319 | 1,321 | 1,318 | 1,321 | 1,328 | (2) | — | (9) | (1) | ||||||||||||||||||||||||||||||||||||||||||||||||||
| Total interest-bearing liabilities | 57,220 | 56,935 | 56,725 | 56,835 | 55,763 | 285 | 1 | 1,457 | 3 | ||||||||||||||||||||||||||||||||||||||||||||||||||
| Noninterest-bearing deposits | 15,600 | 15,994 | 15,910 | 15,823 | 16,023 | (394) | (2) | (422) | (3) | ||||||||||||||||||||||||||||||||||||||||||||||||||
| Other liabilities | 2,372 | 2,045 | 2,032 | 2,076 | 2,163 | 327 | 16 | 209 | 10 | ||||||||||||||||||||||||||||||||||||||||||||||||||
| Total liabilities | 75,192 | 74,974 | 74,667 | 74,734 | 73,948 | 218 | — | 1,244 | 2 | ||||||||||||||||||||||||||||||||||||||||||||||||||
| Shareholders' Equity: | |||||||||||||||||||||||||||||||||||||||||||||||||||||||||||
Preferred stock10 | 682 | 682 | 741 | 349 | 349 | — | — | 333 | 95 | ||||||||||||||||||||||||||||||||||||||||||||||||||
| Common stock | 296 | 296 | 297 | 303 | 313 | — | — | (17) | (5) | ||||||||||||||||||||||||||||||||||||||||||||||||||
| Capital surplus | 3,664 | 3,653 | 3,759 | 3,974 | 4,288 | 11 | — | (624) | (15) | ||||||||||||||||||||||||||||||||||||||||||||||||||
| Retained earnings | 5,207 | 5,383 | 5,205 | 5,030 | 4,848 | (176) | (3) | 360 | 7 | ||||||||||||||||||||||||||||||||||||||||||||||||||
| Accumulated other comprehensive loss, net | (1,019) | (846) | (832) | (809) | (849) | (173) | (20) | (170) | (20) | ||||||||||||||||||||||||||||||||||||||||||||||||||
| Combined shareholders' equity | 8,830 | 9,168 | 9,170 | 8,847 | 8,949 | (338) | (4) | (118) | (1) | ||||||||||||||||||||||||||||||||||||||||||||||||||
| Noncontrolling interest | 295 | 295 | 295 | 295 | 295 | — | — | — | — | ||||||||||||||||||||||||||||||||||||||||||||||||||
| Total shareholders' equity | 9,125 | 9,464 | 9,465 | 9,142 | 9,244 | (338) | (4) | (119) | (1) | ||||||||||||||||||||||||||||||||||||||||||||||||||
| Total liabilities and shareholders' equity | $ | 84,318 | $ | 84,437 | $ | 84,132 | $ | 83,876 | $ | 83,192 | $ | (120) | — | % | $ | 1,125 | 1 | % | |||||||||||||||||||||||||||||||||||||||||
| Memo: | |||||||||||||||||||||||||||||||||||||||||||||||||||||||||||
| Total deposits | $ | 67,701 | $ | 68,073 | $ | 66,482 | $ | 67,477 | $ | 65,525 | $ | (372) | (1) | % | $ | 2,176 | 3 | % | |||||||||||||||||||||||||||||||||||||||||
| Loans to mortgage companies | $ | 3,869 | $ | 4,759 | $ | 4,641 | $ | 4,703 | $ | 3,926 | $ | (891) | (19) | % | $ | (58) | (1) | % | |||||||||||||||||||||||||||||||||||||||||
| Unfunded Loan Commitments: | |||||||||||||||||||||||||||||||||||||||||||||||||||||||||||
| Commercial | $ | 20,677 | $ | 20,164 | $ | 18,980 | $ | 18,644 | $ | 18,485 | $ | 513 | 3 | % | $ | 2,192 | 12 | % | |||||||||||||||||||||||||||||||||||||||||
| Consumer | $ | 4,052 | $ | 4,016 | $ | 4,022 | $ | 4,002 | $ | 4,036 | $ | 36 | 1 | % | $ | 16 | — | % | |||||||||||||||||||||||||||||||||||||||||
Numbers may not total due to rounding. See footnote disclosures on page 18 and glossary of terms on page 24.
9
CONSOLIDATED AVERAGE BALANCE SHEET
Quarterly, Unaudited
| 3Q26 Change vs. | |||||||||||||||||||||||||||||||||||||||||||||||||||||||||||||||||||||||||||||
| (In millions) | 3Q26 | 2Q26 | 1Q26 | 4Q25 | 3Q25 | 2Q26 | 3Q25 | ||||||||||||||||||||||||||||||||||||||||||||||||||||||||||||||||||||||
| Assets: | $ | % | $ | % | |||||||||||||||||||||||||||||||||||||||||||||||||||||||||||||||||||||||||
| Loans and leases: | |||||||||||||||||||||||||||||||||||||||||||||||||||||||||||||||||||||||||||||
| Commercial, financial, and industrial (C&I) | $ | 36,530 | $ | 36,745 | $ | 35,208 | $ | 35,005 | $ | 34,011 | $ | (215) | (1) | % | $ | 2,519 | 7 | % | |||||||||||||||||||||||||||||||||||||||||||||||||||||||||||
| Commercial real estate | 13,655 | 13,510 | 13,417 | 13,587 | 13,772 | 145 | 1 | (117) | (1) | ||||||||||||||||||||||||||||||||||||||||||||||||||||||||||||||||||||
| Total Commercial | 50,185 | 50,256 | 48,625 | 48,591 | 47,784 | (71) | — | 2,401 | 5 | ||||||||||||||||||||||||||||||||||||||||||||||||||||||||||||||||||||
| Consumer real estate | 13,725 | 13,873 | 13,998 | 14,255 | 14,409 | (148) | (1) | (684) | (5) | ||||||||||||||||||||||||||||||||||||||||||||||||||||||||||||||||||||
Credit card and other5 | 579 | 566 | 569 | 586 | 594 | 13 | 2 | (15) | (3) | ||||||||||||||||||||||||||||||||||||||||||||||||||||||||||||||||||||
| Total Consumer | 14,304 | 14,439 | 14,567 | 14,841 | 15,004 | (136) | (1) | (700) | (5) | ||||||||||||||||||||||||||||||||||||||||||||||||||||||||||||||||||||
| Loans and leases, net of unearned income | 64,489 | 64,695 | 63,192 | 63,432 | 62,787 | (206) | — | 1,701 | 3 | ||||||||||||||||||||||||||||||||||||||||||||||||||||||||||||||||||||
| Loans held-for-sale | 459 | 532 | 479 | 515 | 454 | (73) | (14) | 5 | 1 | ||||||||||||||||||||||||||||||||||||||||||||||||||||||||||||||||||||
| Investment securities | 8,915 | 9,218 | 9,454 | 9,321 | 9,321 | (304) | (3) | (406) | (4) | ||||||||||||||||||||||||||||||||||||||||||||||||||||||||||||||||||||
| Trading securities | 1,663 | 1,677 | 1,796 | 1,798 | 1,625 | (15) | (1) | 38 | 2 | ||||||||||||||||||||||||||||||||||||||||||||||||||||||||||||||||||||
| Interest-bearing deposits with banks | 1,982 | 1,168 | 1,233 | 1,218 | 1,272 | 814 | 70 | 710 | 56 | ||||||||||||||||||||||||||||||||||||||||||||||||||||||||||||||||||||
| Federal funds sold and securities purchased under agreements to resell | 949 | 669 | 756 | 743 | 573 | 279 | 42 | 375 | 65 | ||||||||||||||||||||||||||||||||||||||||||||||||||||||||||||||||||||
| Total interest earning assets | 78,456 | 77,960 | 76,910 | 77,027 | 76,032 | 496 | 1 | 2,424 | 3 | ||||||||||||||||||||||||||||||||||||||||||||||||||||||||||||||||||||
| Cash and due from banks | 912 | 923 | 936 | 900 | 860 | (11) | (1) | 52 | 6 | ||||||||||||||||||||||||||||||||||||||||||||||||||||||||||||||||||||
| Goodwill and other intangible assets, net | 1,595 | 1,603 | 1,611 | 1,619 | 1,628 | (8) | (1) | (34) | (2) | ||||||||||||||||||||||||||||||||||||||||||||||||||||||||||||||||||||
| Premises and equipment, net | 554 | 544 | 543 | 548 | 556 | 10 | 2 | (2) | — | ||||||||||||||||||||||||||||||||||||||||||||||||||||||||||||||||||||
| Allowance for loan and lease losses | (698) | (732) | (750) | (774) | (809) | 33 | 5 | 111 | 14 | ||||||||||||||||||||||||||||||||||||||||||||||||||||||||||||||||||||
| Other assets | 3,852 | 3,799 | 3,795 | 3,760 | 3,781 | 53 | 1 | 71 | 2 | ||||||||||||||||||||||||||||||||||||||||||||||||||||||||||||||||||||
| Total assets | $ | 84,671 | $ | 84,097 | $ | 83,045 | $ | 83,081 | $ | 82,049 | $ | 574 | 1 | % | $ | 2,622 | 3 | % | |||||||||||||||||||||||||||||||||||||||||||||||||||||||||||
| Liabilities and shareholders' equity: | |||||||||||||||||||||||||||||||||||||||||||||||||||||||||||||||||||||||||||||
| Deposits: | |||||||||||||||||||||||||||||||||||||||||||||||||||||||||||||||||||||||||||||
| Savings | $ | 26,046 | $ | 25,618 | $ | 26,148 | $ | 26,693 | $ | 26,326 | $ | 428 | 2 | % | $ | (279) | (1) | % | |||||||||||||||||||||||||||||||||||||||||||||||||||||||||||
| Time deposits | 9,395 | 8,501 | 6,755 | 6,205 | 6,871 | 895 | 11 | 2,524 | 37 | ||||||||||||||||||||||||||||||||||||||||||||||||||||||||||||||||||||
| Other interest-bearing deposits | 17,196 | 16,914 | 17,679 | 17,573 | 16,866 | 282 | 2 | 330 | 2 | ||||||||||||||||||||||||||||||||||||||||||||||||||||||||||||||||||||
| Total interest-bearing deposits | 52,638 | 51,033 | 50,582 | 50,470 | 50,063 | 1,604 | 3 | 2,575 | 5 | ||||||||||||||||||||||||||||||||||||||||||||||||||||||||||||||||||||
| Trading liabilities | 678 | 645 | 729 | 722 | 549 | 32 | 5 | 129 | 24 | ||||||||||||||||||||||||||||||||||||||||||||||||||||||||||||||||||||
| Federal funds purchased and securities sold under agreements to repurchase | 1,799 | 2,518 | 2,649 | 2,807 | 2,631 | (719) | (29) | (833) | (32) | ||||||||||||||||||||||||||||||||||||||||||||||||||||||||||||||||||||
| Short-term borrowings | 660 | 1,400 | 894 | 470 | 387 | (740) | (53) | 273 | 71 | ||||||||||||||||||||||||||||||||||||||||||||||||||||||||||||||||||||
| Term borrowings | 1,321 | 1,319 | 1,319 | 1,323 | 1,335 | 2 | — | (15) | (1) | ||||||||||||||||||||||||||||||||||||||||||||||||||||||||||||||||||||
| Total interest-bearing liabilities | 57,095 | 56,916 | 56,173 | 55,792 | 54,965 | 179 | — | 2,130 | 4 | ||||||||||||||||||||||||||||||||||||||||||||||||||||||||||||||||||||
| Noninterest-bearing deposits | 15,915 | 15,749 | 15,628 | 16,072 | 15,862 | 166 | 1 | 54 | — | ||||||||||||||||||||||||||||||||||||||||||||||||||||||||||||||||||||
| Other liabilities | 2,103 | 1,988 | 1,999 | 2,082 | 1,999 | 115 | 6 | 104 | 5 | ||||||||||||||||||||||||||||||||||||||||||||||||||||||||||||||||||||
| Total liabilities | 75,112 | 74,652 | 73,800 | 73,946 | 72,825 | 460 | 1 | 2,287 | 3 | ||||||||||||||||||||||||||||||||||||||||||||||||||||||||||||||||||||
| Shareholders' Equity: | |||||||||||||||||||||||||||||||||||||||||||||||||||||||||||||||||||||||||||||
Preferred stock10 | 682 | 682 | 436 | 349 | 350 | — | — | 332 | 95 | ||||||||||||||||||||||||||||||||||||||||||||||||||||||||||||||||||||
| Common stock | 296 | 297 | 300 | 307 | 316 | (1) | — | (19) | (6) | ||||||||||||||||||||||||||||||||||||||||||||||||||||||||||||||||||||
| Capital surplus | 3,657 | 3,703 | 3,866 | 4,095 | 4,379 | (45) | (1) | (722) | (16) | ||||||||||||||||||||||||||||||||||||||||||||||||||||||||||||||||||||
| Retained earnings | 5,513 | 5,310 | 5,129 | 4,910 | 4,798 | 203 | 4 | 715 | 15 | ||||||||||||||||||||||||||||||||||||||||||||||||||||||||||||||||||||
| Accumulated other comprehensive loss, net | (885) | (842) | (781) | (821) | (913) | (43) | (5) | 29 | 3 | ||||||||||||||||||||||||||||||||||||||||||||||||||||||||||||||||||||
| Combined shareholders' equity | 9,263 | 9,149 | 8,950 | 8,840 | 8,928 | 114 | 1 | 335 | 4 | ||||||||||||||||||||||||||||||||||||||||||||||||||||||||||||||||||||
| Noncontrolling interest | 295 | 295 | 295 | 295 | 295 | — | — | — | — | ||||||||||||||||||||||||||||||||||||||||||||||||||||||||||||||||||||
| Total shareholders' equity | 9,558 | 9,444 | 9,245 | 9,135 | 9,224 | 114 | 1 | 335 | 4 | ||||||||||||||||||||||||||||||||||||||||||||||||||||||||||||||||||||
| Total liabilities and shareholders' equity | $ | 84,671 | $ | 84,097 | $ | 83,045 | $ | 83,081 | $ | 82,049 | $ | 574 | 1 | % | $ | 2,622 | 3 | % | |||||||||||||||||||||||||||||||||||||||||||||||||||||||||||
| Memo: | |||||||||||||||||||||||||||||||||||||||||||||||||||||||||||||||||||||||||||||
| Total deposits | $ | 68,553 | $ | 66,782 | $ | 66,210 | $ | 66,542 | $ | 65,924 | $ | 1,771 | 3 | % | $ | 2,629 | 4 | % | |||||||||||||||||||||||||||||||||||||||||||||||||||||||||||
| Loans to mortgage companies | $ | 4,092 | $ | 4,284 | $ | 3,884 | $ | 4,160 | $ | 3,628 | $ | (192) | (4) | % | $ | 463 | 13 | % | |||||||||||||||||||||||||||||||||||||||||||||||||||||||||||
Numbers may not total due to rounding.
See footnote disclosures on page 18 and glossary of terms on page 24.
10
| CONSOLIDATED NET INTEREST INCOME AND AVERAGE BALANCE SHEET: YIELDS AND RATES | |||||||||||||||||||||||||||||||||||||||||||||||||||||||||||||||||||||||||||||||||||||||||||||||
| Quarterly, Unaudited | |||||||||||||||||||||||||||||||||||||||||||||||||||||||||||||||||||||||||||||||||||||||||||||||
| 3Q26 Change vs. | |||||||||||||||||||||||||||||||||||||||||||||||||||||||||||||||||||||||||||||||||||||||||||||||
| 3Q26 | 2Q26 | 1Q26 | 4Q25 | 3Q25 | 2Q26 | 3Q25 | |||||||||||||||||||||||||||||||||||||||||||||||||||||||||||||||||||||||||||||||||||||||||
| (In millions, except rates) | Income/Expense | Rate | Income/Expense | Rate | Income/Expense | Rate | Income/Expense | Rate | Income/Expense | Rate | Income/Expense | Income/Expense | |||||||||||||||||||||||||||||||||||||||||||||||||||||||||||||||||||||||||||||||||||
| $/bp | % | $/bp | % | ||||||||||||||||||||||||||||||||||||||||||||||||||||||||||||||||||||||||||||||||||||||||||||
| Interest earning assets/Interest income: | |||||||||||||||||||||||||||||||||||||||||||||||||||||||||||||||||||||||||||||||||||||||||||||||
| Loans and leases, net of unearned income: | |||||||||||||||||||||||||||||||||||||||||||||||||||||||||||||||||||||||||||||||||||||||||||||||
| Commercial | $ | 751 | 5.94 | % | $ | 735 | 5.87 | % | $ | 707 | 5.89 | % | $ | 743 | 6.07 | % | $ | 767 | 6.37 | % | $ | 16 | 2 | % | $ | (16) | (2) | % | |||||||||||||||||||||||||||||||||||||||||||||||||||||||||||||||||||
| Consumer | 180 | 5.00 | 180 | 4.97 | 181 | 4.99 | 187 | 5.02 | 191 | 5.07 | — | — | (11) | (6) | |||||||||||||||||||||||||||||||||||||||||||||||||||||||||||||||||||||||||||||||||
| Loans and leases, net of unearned income | 931 | 5.73 | 915 | 5.67 | 887 | 5.68 | 930 | 5.83 | 957 | 6.06 | 16 | 2 | (27) | (3) | |||||||||||||||||||||||||||||||||||||||||||||||||||||||||||||||||||||||||||||||||
| Loans held-for-sale | 7 | 6.22 | 8 | 6.18 | 7 | 6.26 | 8 | 6.45 | 8 | 6.86 | (1) | (13) | (1) | (8) | |||||||||||||||||||||||||||||||||||||||||||||||||||||||||||||||||||||||||||||||||
| Investment securities | 69 | 3.10 | 70 | 3.05 | 71 | 3.02 | 71 | 3.06 | 72 | 3.09 | (1) | (2) | (3) | (4) | |||||||||||||||||||||||||||||||||||||||||||||||||||||||||||||||||||||||||||||||||
| Trading securities | 23 | 5.48 | 23 | 5.55 | 24 | 5.25 | 25 | 5.57 | 24 | 5.81 | (1) | (2) | (1) | (4) | |||||||||||||||||||||||||||||||||||||||||||||||||||||||||||||||||||||||||||||||||
| Interest-bearing deposits with banks | 19 | 3.75 | 11 | 3.69 | 11 | 3.69 | 12 | 3.97 | 14 | 4.41 | 8 | 74 | 5 | 32 | |||||||||||||||||||||||||||||||||||||||||||||||||||||||||||||||||||||||||||||||||
| Federal funds sold and securities purchased under agreements | 9 | 3.58 | 6 | 3.56 | 7 | 3.55 | 7 | 3.86 | 6 | 4.20 | 3 | 44 | 2 | 41 | |||||||||||||||||||||||||||||||||||||||||||||||||||||||||||||||||||||||||||||||||
| Interest income | $ | 1,057 | 5.35 | % | $ | 1,033 | 5.31 | % | $ | 1,008 | 5.29 | % | $ | 1,054 | 5.44 | % | $ | 1,081 | 5.65 | % | $ | 24 | 2 | % | $ | (24) | (2) | % | |||||||||||||||||||||||||||||||||||||||||||||||||||||||||||||||||||
| Interest-bearing liabilities/Interest expense: | |||||||||||||||||||||||||||||||||||||||||||||||||||||||||||||||||||||||||||||||||||||||||||||||
| Interest-bearing deposits: | |||||||||||||||||||||||||||||||||||||||||||||||||||||||||||||||||||||||||||||||||||||||||||||||
| Savings | $ | 151 | 2.29 | % | $ | 138 | 2.17 | % | $ | 138 | 2.14 | % | $ | 169 | 2.51 | % | $ | 184 | 2.78 | % | $ | 12 | 9 | % | $ | (34) | (18) | % | |||||||||||||||||||||||||||||||||||||||||||||||||||||||||||||||||||
| Time deposits | 85 | 3.58 | 74 | 3.48 | 56 | 3.39 | 55 | 3.49 | 64 | 3.71 | 11 | 15 | 21 | 32 | |||||||||||||||||||||||||||||||||||||||||||||||||||||||||||||||||||||||||||||||||
| Other interest-bearing deposits | 90 | 2.07 | 84 | 1.99 | 89 | 2.04 | 98 | 2.22 | 102 | 2.41 | 6 | 7 | (13) | (12) | |||||||||||||||||||||||||||||||||||||||||||||||||||||||||||||||||||||||||||||||||
| Total interest-bearing deposits | 325 | 2.45 | 296 | 2.33 | 284 | 2.28 | 322 | 2.53 | 351 | 2.78 | 29 | 10 | (26) | (7) | |||||||||||||||||||||||||||||||||||||||||||||||||||||||||||||||||||||||||||||||||
| Trading liabilities | 7 | 4.32 | 6 | 4.00 | 7 | 3.81 | 7 | 3.76 | 5 | 3.93 | 1 | 15 | 2 | 36 | |||||||||||||||||||||||||||||||||||||||||||||||||||||||||||||||||||||||||||||||||
| Federal funds purchased and securities sold under agreements to repurchase | 13 | 2.92 | 19 | 3.09 | 20 | 2.98 | 23 | 3.21 | 23 | 3.52 | (6) | (32) | (10) | (43) | |||||||||||||||||||||||||||||||||||||||||||||||||||||||||||||||||||||||||||||||||
| Short-term borrowings | 6 | 3.86 | 13 | 3.83 | 8 | 3.78 | 5 | 4.08 | 4 | 4.39 | (7) | (52) | 2 | 50 | |||||||||||||||||||||||||||||||||||||||||||||||||||||||||||||||||||||||||||||||||
| Term borrowings | 19 | 5.67 | 19 | 5.65 | 19 | 5.65 | 19 | 5.76 | 19 | 5.82 | — | — | (1) | (4) | |||||||||||||||||||||||||||||||||||||||||||||||||||||||||||||||||||||||||||||||||
| Interest expense | 371 | 2.58 | 354 | 2.49 | 337 | 2.43 | 375 | 2.67 | 403 | 2.91 | 17 | 5 | (33) | (8) | |||||||||||||||||||||||||||||||||||||||||||||||||||||||||||||||||||||||||||||||||
| Net interest income - tax equivalent basis | 686 | 2.77 | 679 | 2.82 | 670 | 2.86 | 679 | 2.77 | 678 | 2.74 | 7 | 1 | 8 | 1 | |||||||||||||||||||||||||||||||||||||||||||||||||||||||||||||||||||||||||||||||||
| Fully taxable equivalent adjustment | (3) | 0.71 | (3) | 0.67 | (3) | 0.66 | (3) | 0.74 | (3) | 0.81 | — | — | — | 10 | |||||||||||||||||||||||||||||||||||||||||||||||||||||||||||||||||||||||||||||||||
| Net interest income | $ | 683 | 3.48 | % | $ | 676 | 3.49 | % | $ | 667 | 3.52 | % | $ | 676 | 3.51 | % | $ | 674 | 3.55 | % | $ | 7 | 1 | % | $ | 9 | 1 | % | |||||||||||||||||||||||||||||||||||||||||||||||||||||||||||||||||||
| Memo: | |||||||||||||||||||||||||||||||||||||||||||||||||||||||||||||||||||||||||||||||||||||||||||||||
| Total loan yield | 5.73 | % | 5.67 | % | 5.68 | % | 5.83 | % | 6.06 | % | 6 | bp | (33) | bp | |||||||||||||||||||||||||||||||||||||||||||||||||||||||||||||||||||||||||||||||||
| Total deposit cost | 1.88 | % | 1.78 | % | 1.74 | % | 1.92 | % | 2.11 | % | 10 | bp | (23) | bp | |||||||||||||||||||||||||||||||||||||||||||||||||||||||||||||||||||||||||||||||||
| Total funding cost | 2.01 | % | 1.95 | % | 1.90 | % | 2.07 | % | 2.26 | % | 6 | bp | (25) | bp | |||||||||||||||||||||||||||||||||||||||||||||||||||||||||||||||||||||||||||||||||
| Average loans and leases, net of unearned income | $ | 64,489 | $ | 64,695 | $ | 63,192 | $ | 63,432 | $ | 62,787 | $ | (206) | — | % | $ | 1,701 | 3 | % | |||||||||||||||||||||||||||||||||||||||||||||||||||||||||||||||||||||||||||||
| Average deposits | 68,553 | 66,782 | 66,210 | 66,542 | 65,924 | 1,771 | 3 | % | 2,629 | 4 | % | ||||||||||||||||||||||||||||||||||||||||||||||||||||||||||||||||||||||||||||||||||||
| Average funded liabilities | 73,010 | 72,664 | 71,801 | 71,864 | 70,827 | $ | 345 | — | % | $ | 2,183 | 3 | % | ||||||||||||||||||||||||||||||||||||||||||||||||||||||||||||||||||||||||||||||||||
Net interest income and yields are adjusted to a fully taxable equivalent (“FTE”) basis assuming a statutory federal income tax of 21 percent and, where applicable, state income taxes.
Earning assets yields are expressed net of unearned income.
Loan yields include loan fees, cash basis interest income, and loans on nonaccrual status.
Numbers may not total due to rounding.
See footnote disclosures on page 18 and glossary of terms on page 24.
11
CONSOLIDATED NONPERFORMING LOANS AND LEASES ("NPL") | |||||||||||||||||||||||||||||||||||||||||||||||||||||||||||
| Quarterly, Unaudited | |||||||||||||||||||||||||||||||||||||||||||||||||||||||||||
| As of | 3Q26 change vs. | ||||||||||||||||||||||||||||||||||||||||||||||||||||||||||
| (In millions, except ratio data) | 3Q26 | 2Q26 | 1Q26 | 4Q25 | 3Q25 | 2Q26 | 3Q25 | ||||||||||||||||||||||||||||||||||||||||||||||||||||
| $ | % | $ | % | ||||||||||||||||||||||||||||||||||||||||||||||||||||||||
| Nonperforming loans and leases | |||||||||||||||||||||||||||||||||||||||||||||||||||||||||||
| Commercial, financial, and industrial (C&I) | $ | 194 | $ | 205 | $ | 219 | $ | 224 | $ | 211 | $ | (11) | (6) | % | $ | (17) | (8) | % | |||||||||||||||||||||||||||||||||||||||||
| Commercial real estate | 145 | 184 | 243 | 239 | 254 | (40) | (22) | (110) | (43) | ||||||||||||||||||||||||||||||||||||||||||||||||||
| Consumer real estate | 142 | 141 | 144 | 140 | 139 | 1 | 1 | 3 | 2 | ||||||||||||||||||||||||||||||||||||||||||||||||||
Credit card and other5 | 1 | 1 | 1 | 1 | 1 | — | 65 | — | (14) | ||||||||||||||||||||||||||||||||||||||||||||||||||
| Total nonperforming loans and leases | $ | 482 | $ | 531 | $ | 606 | $ | 604 | $ | 605 | $ | (49) | (9) | % | $ | (124) | (20) | % | |||||||||||||||||||||||||||||||||||||||||
| Asset Quality Ratio | |||||||||||||||||||||||||||||||||||||||||||||||||||||||||||
| Nonperforming loans and leases to loans and leases | |||||||||||||||||||||||||||||||||||||||||||||||||||||||||||
| Commercial, financial, and industrial (C&I) | 0.53 | % | 0.55 | % | 0.60 | % | 0.62 | % | 0.61 | % | |||||||||||||||||||||||||||||||||||||||||||||||||
| Commercial real estate | 1.06 | 1.36 | 1.81 | 1.76 | 1.86 | ||||||||||||||||||||||||||||||||||||||||||||||||||||||
| Consumer real estate | 1.53 | 1.02 | 1.03 | 0.99 | 0.96 | ||||||||||||||||||||||||||||||||||||||||||||||||||||||
Credit card and other5 | 0.22 | 0.13 | 0.19 | 0.16 | 0.25 | ||||||||||||||||||||||||||||||||||||||||||||||||||||||
| Total nonperforming loans and leases to loans and leases | 0.81 | % | 0.81 | % | 0.94 | % | 0.94 | % | 0.96 | % | |||||||||||||||||||||||||||||||||||||||||||||||||
Numbers may not total due to rounding.
See footnote disclosures on page 18 and glossary of terms on page 24.
CONSOLIDATED LOANS AND LEASES 90 DAYS OR MORE PAST DUE AND ACCRUING | |||||||||||||||||||||||||||||||||||||||||||||||||||||||||||
| Quarterly, Unaudited | |||||||||||||||||||||||||||||||||||||||||||||||||||||||||||
| As of | 3Q26 change vs. | ||||||||||||||||||||||||||||||||||||||||||||||||||||||||||
| (In millions) | 3Q26 | 2Q26 | 1Q26 | 4Q25 | 3Q25 | 2Q26 | 3Q25 | ||||||||||||||||||||||||||||||||||||||||||||||||||||
| $ | % | $ | % | ||||||||||||||||||||||||||||||||||||||||||||||||||||||||
| Loans and leases 90 days or more past due and accruing | |||||||||||||||||||||||||||||||||||||||||||||||||||||||||||
| Commercial, financial, and industrial (C&I) | $ | 1 | $ | 1 | $ | 1 | $ | 1 | $ | 1 | $ | — | (31) | % | $ | — | (8) | % | |||||||||||||||||||||||||||||||||||||||||
| Commercial real estate | — | — | — | — | — | — | NM | — | NM | ||||||||||||||||||||||||||||||||||||||||||||||||||
| Consumer real estate | 7 | — | 2 | 6 | 6 | 6 | NM | 1 | 15 | ||||||||||||||||||||||||||||||||||||||||||||||||||
Credit card and other5 | 1 | 1 | 1 | 1 | 2 | 1 | 68 | — | (20) | ||||||||||||||||||||||||||||||||||||||||||||||||||
| Total loans and leases 90 days or more past due and accruing | $ | 9 | $ | 2 | $ | 3 | $ | 8 | $ | 9 | $ | 7 | NM | $ | — | 3 | % | ||||||||||||||||||||||||||||||||||||||||||
Numbers may not total due to rounding.
See footnote disclosures on page 18 and glossary of terms on page 24.
12
CONSOLIDATED NET CHARGE-OFFS (RECOVERIES) | |||||||||||||||||||||||||||||||||||||||||||||||||||||||||||
| Quarterly, Unaudited | |||||||||||||||||||||||||||||||||||||||||||||||||||||||||||
| As of | 3Q26 change vs. | ||||||||||||||||||||||||||||||||||||||||||||||||||||||||||
| (In millions, except ratio data) | 3Q26 | 2Q26 | 1Q26 | 4Q25 | 3Q25 | 2Q26 | 3Q25 | ||||||||||||||||||||||||||||||||||||||||||||||||||||
| Charge-offs, Recoveries and Related Ratios | $ | % | $ | % | |||||||||||||||||||||||||||||||||||||||||||||||||||||||
| Gross Charge-offs | |||||||||||||||||||||||||||||||||||||||||||||||||||||||||||
| Commercial, financial, and industrial (C&I) | $ | 36 | $ | 32 | $ | 36 | $ | 39 | $ | 25 | $ | 4 | 12 | % | $ | 11 | 45 | % | |||||||||||||||||||||||||||||||||||||||||
| Commercial real estate | 3 | 3 | 4 | 2 | 3 | — | (9) | (1) | (20) | ||||||||||||||||||||||||||||||||||||||||||||||||||
| Consumer real estate | 2 | 1 | 1 | 1 | 1 | 1 | NM | 1 | NM | ||||||||||||||||||||||||||||||||||||||||||||||||||
Credit card and other5 | 4 | 5 | 4 | 4 | 6 | — | (11) | (2) | (39) | ||||||||||||||||||||||||||||||||||||||||||||||||||
| Total gross charge-offs | $ | 45 | $ | 41 | $ | 45 | $ | 47 | $ | 36 | $ | 4 | 10 | % | $ | 9 | 25 | % | |||||||||||||||||||||||||||||||||||||||||
| Gross Recoveries | |||||||||||||||||||||||||||||||||||||||||||||||||||||||||||
| Commercial, financial, and industrial (C&I) | $ | (6) | $ | (5) | $ | (14) | $ | (13) | $ | (6) | $ | (1) | (28) | % | $ | — | 4 | % | |||||||||||||||||||||||||||||||||||||||||
| Commercial real estate | — | — | — | — | — | — | 90 | — | 94 | ||||||||||||||||||||||||||||||||||||||||||||||||||
| Consumer real estate | (2) | (2) | (2) | (2) | (1) | (1) | (40) | (1) | (46) | ||||||||||||||||||||||||||||||||||||||||||||||||||
Credit card and other5 | (1) | (1) | (1) | (1) | (1) | — | 37 | — | 24 | ||||||||||||||||||||||||||||||||||||||||||||||||||
| Total gross recoveries | $ | (9) | $ | (8) | $ | (17) | $ | (16) | $ | (9) | $ | (1) | (18) | % | $ | — | — | % | |||||||||||||||||||||||||||||||||||||||||
| Net Charge-offs (Recoveries) | |||||||||||||||||||||||||||||||||||||||||||||||||||||||||||
| Commercial, financial, and industrial (C&I) | $ | 30 | $ | 27 | $ | 23 | $ | 26 | $ | 19 | $ | 3 | 10 | % | $ | 11 | 62 | % | |||||||||||||||||||||||||||||||||||||||||
| Commercial real estate | 3 | 3 | 3 | 2 | 3 | — | (5) | (1) | (16) | ||||||||||||||||||||||||||||||||||||||||||||||||||
| Consumer real estate | — | (1) | — | (1) | (1) | — | 53 | — | 54 | ||||||||||||||||||||||||||||||||||||||||||||||||||
Credit card and other5 | 3 | 4 | 3 | 3 | 5 | — | — | (2) | (42) | ||||||||||||||||||||||||||||||||||||||||||||||||||
| Total net charge-offs | $ | 36 | $ | 33 | $ | 29 | $ | 30 | $ | 26 | $ | 3 | 9 | % | $ | 9 | 34 | % | |||||||||||||||||||||||||||||||||||||||||
| Annualized Net Charge-off (Recovery) Rates | |||||||||||||||||||||||||||||||||||||||||||||||||||||||||||
| Commercial, financial, and industrial (C&I) | 0.33 | % | 0.30 | % | 0.26 | % | 0.30 | % | 0.22 | % | |||||||||||||||||||||||||||||||||||||||||||||||||
| Commercial real estate | 0.08 | 0.08 | 0.10 | 0.04 | 0.09 | ||||||||||||||||||||||||||||||||||||||||||||||||||||||
| Consumer real estate | (0.01) | (0.02) | (0.01) | (0.02) | (0.02) | ||||||||||||||||||||||||||||||||||||||||||||||||||||||
Credit card and other5 | 2.11 | 2.17 | 2.10 | 2.31 | 3.54 | ||||||||||||||||||||||||||||||||||||||||||||||||||||||
| Total loans and leases | 0.22 | % | 0.20 | % | 0.18 | % | 0.19 | % | 0.17 | % | |||||||||||||||||||||||||||||||||||||||||||||||||
Numbers may not total due to rounding.
See footnote disclosures on page 18 and glossary of terms on page 24.
13
| CONSOLIDATED ALLOWANCE FOR LOAN AND LEASE LOSSES AND RESERVE FOR UNFUNDED COMMITMENTS | |||||||||||||||||||||||||||||||||||||||||||||||||||||||||||
| Quarterly, Unaudited | |||||||||||||||||||||||||||||||||||||||||||||||||||||||||||
| As of | 3Q26 Change vs. | ||||||||||||||||||||||||||||||||||||||||||||||||||||||||||
| (In millions) | 3Q26 | 2Q26 | 1Q26 | 4Q25 | 3Q25 | 2Q26 | 3Q25 | ||||||||||||||||||||||||||||||||||||||||||||||||||||
| Summary of Changes in the Components of the Allowance For Credit Losses | $ | % | $ | % | |||||||||||||||||||||||||||||||||||||||||||||||||||||||
| Allowance for loan and lease losses - beginning | $ | 709 | $ | 730 | $ | 738 | $ | 777 | $ | 814 | $ | (21) | (3) | % | $ | (105) | (13) | % | |||||||||||||||||||||||||||||||||||||||||
| Charge-offs: | |||||||||||||||||||||||||||||||||||||||||||||||||||||||||||
| Commercial, financial, and industrial (C&I) | (36) | (32) | (36) | (39) | (25) | (4) | (12) | (11) | (45) | ||||||||||||||||||||||||||||||||||||||||||||||||||
| Commercial real estate | (3) | (3) | (4) | (2) | (3) | — | 9 | 1 | 20 | ||||||||||||||||||||||||||||||||||||||||||||||||||
| Consumer real estate | (2) | (1) | (1) | (1) | (1) | (1) | NM | (1) | NM | ||||||||||||||||||||||||||||||||||||||||||||||||||
Credit card and other5 | (4) | (5) | (4) | (4) | (6) | — | 11 | 2 | 39 | ||||||||||||||||||||||||||||||||||||||||||||||||||
| Total charge-offs | (45) | (41) | (45) | (47) | (36) | (4) | (10) | (9) | (25) | ||||||||||||||||||||||||||||||||||||||||||||||||||
| Recoveries: | |||||||||||||||||||||||||||||||||||||||||||||||||||||||||||
| Commercial, financial, and industrial (C&I) | 6 | 5 | 14 | 13 | 6 | 1 | 28 | — | (4) | ||||||||||||||||||||||||||||||||||||||||||||||||||
| Commercial real estate | — | — | — | — | — | — | (90) | — | (94) | ||||||||||||||||||||||||||||||||||||||||||||||||||
| Consumer real estate | 2 | 2 | 2 | 2 | 1 | 1 | 40 | 1 | 46 | ||||||||||||||||||||||||||||||||||||||||||||||||||
Credit card and other5 | 1 | 1 | 1 | 1 | 1 | — | (37) | — | (24) | ||||||||||||||||||||||||||||||||||||||||||||||||||
| Total Recoveries | 9 | 8 | 17 | 16 | 9 | 1 | 18 | — | — | ||||||||||||||||||||||||||||||||||||||||||||||||||
| Provision for loan and lease losses: | |||||||||||||||||||||||||||||||||||||||||||||||||||||||||||
| Commercial, financial, and industrial (C&I) | 20 | 24 | 41 | 28 | 5 | (4) | (16) | 15 | NM | ||||||||||||||||||||||||||||||||||||||||||||||||||
| Commercial real estate | 6 | (3) | (17) | (26) | (5) | 9 | NM | 11 | NM | ||||||||||||||||||||||||||||||||||||||||||||||||||
| Consumer real estate * | (57) | (12) | (6) | (13) | (15) | (46) | NM | (42) | NM | ||||||||||||||||||||||||||||||||||||||||||||||||||
Credit card and other5 | 2 | 3 | 3 | 3 | 4 | (1) | (23) | (2) | (45) | ||||||||||||||||||||||||||||||||||||||||||||||||||
Total provision for loan and lease losses: | (29) | 12 | 20 | (8) | (11) | (41) | NM | (18) | NM | ||||||||||||||||||||||||||||||||||||||||||||||||||
| Allowance for loan and lease losses - ending | $ | 644 | $ | 709 | $ | 730 | $ | 738 | $ | 777 | $ | (65) | (9) | % | $ | (132) | (17) | % | |||||||||||||||||||||||||||||||||||||||||
| Reserve for unfunded commitments - beginning | $ | 99 | $ | 96 | $ | 101 | $ | 93 | $ | 87 | $ | 3 | 3 | % | $ | 12 | 14 | % | |||||||||||||||||||||||||||||||||||||||||
| Provision for unfunded commitments | 4 | 3 | (5) | 8 | 6 | 1 | 33 | (2) | (33) | ||||||||||||||||||||||||||||||||||||||||||||||||||
| Reserve for unfunded commitments - ending | $ | 103 | $ | 99 | $ | 96 | $ | 101 | $ | 93 | $ | 4 | 4 | % | $ | 10 | 11 | % | |||||||||||||||||||||||||||||||||||||||||
| Total allowance for credit losses - ending | $ | 747 | $ | 808 | $ | 826 | $ | 839 | $ | 870 | $ | (61) | (7) | % | $ | (122) | (14) | % | |||||||||||||||||||||||||||||||||||||||||
Numbers may not total due to rounding.
See footnote disclosures on page 18 and glossary of terms on page 24.
*3Q26 includes a $45 million provision reversal related to the classification change of targeted mortgage loans to held for sale as a part of the expected portfolio sale.
14
| CONSOLIDATED ASSET QUALITY RATIOS - ALLOWANCE FOR LOAN AND LEASE LOSSES | |||||||||||||||||||||||||||||||||||
| Quarterly, Unaudited | |||||||||||||||||||||||||||||||||||
| As of | |||||||||||||||||||||||||||||||||||
| 3Q26 | 2Q26 | 1Q26 | 4Q25 | 3Q25 | |||||||||||||||||||||||||||||||
| Allowance for loan and lease losses to loans and leases | |||||||||||||||||||||||||||||||||||
| Commercial, financial, and industrial (C&I) | 0.94 | % | 0.94 | % | 0.97 | % | 0.93 | % | 0.97 | % | |||||||||||||||||||||||||
| Commercial real estate | 1.11 | % | 1.10 | % | 1.16 | % | 1.30 | % | 1.49 | % | |||||||||||||||||||||||||
| Consumer real estate | 1.44 | % | 1.37 | % | 1.44 | % | 1.46 | % | 1.52 | % | |||||||||||||||||||||||||
Credit card and other5 | 3.29 | % | 3.42 | % | 3.49 | % | 3.40 | % | 3.42 | % | |||||||||||||||||||||||||
| Total allowance for loan and lease losses to loans and leases | 1.08 | % | 1.09 | % | 1.13 | % | 1.15 | % | 1.23 | % | |||||||||||||||||||||||||
| Allowance for loan and lease losses to nonperforming loans and leases | |||||||||||||||||||||||||||||||||||
| Commercial, financial, and industrial (C&I) | 175 | % | 171 | % | 162 | % | 150 | % | 158 | % | |||||||||||||||||||||||||
| Commercial real estate | 105 | % | 81 | % | 64 | % | 74 | % | 80 | % | |||||||||||||||||||||||||
| Consumer real estate | 94 | % | 135 | % | 140 | % | 147 | % | 158 | % | |||||||||||||||||||||||||
Credit card and other5 | 1,524 | % | 2,617 | % | 1,842 | % | 2,096 | % | 1,380 | % | |||||||||||||||||||||||||
| Total allowance for loan and lease losses to nonperforming loans and leases | 134 | % | 133 | % | 120 | % | 122 | % | 128 | % | |||||||||||||||||||||||||
| Allowance for credit losses ratios | |||||||||||||||||||||||||||||||||||
Total allowance for credit losses to loans and leases4 | 1.25 | % | 1.24 | % | 1.28 | % | 1.31 | % | 1.38 | % | |||||||||||||||||||||||||
Total allowance for credit losses to nonperforming loans and leases4 | 155 | % | 152 | % | 136 | % | 139 | % | 144 | % | |||||||||||||||||||||||||
See footnote disclosures on page 18 and glossary of terms on page 24.
15
COMMERCIAL, CONSUMER, AND WEALTH
Quarterly, Unaudited
| 3Q26 Change vs. | |||||||||||||||||||||||||||||||||||||||||||||||||||||||||||||||||||||||||||||
| 3Q26 | 2Q26 | 1Q26 | 4Q25 | 3Q25 | 2Q26 | 3Q25 | |||||||||||||||||||||||||||||||||||||||||||||||||||||||||||||||||||||||
| $/bp | % | $/bp | % | ||||||||||||||||||||||||||||||||||||||||||||||||||||||||||||||||||||||||||
| Income Statement (millions) | |||||||||||||||||||||||||||||||||||||||||||||||||||||||||||||||||||||||||||||
| Net interest income | $ | 667 | $ | 654 | $ | 649 | $ | 662 | $ | 671 | $ | 13 | 2 | % | $ | (4) | (1) | % | |||||||||||||||||||||||||||||||||||||||||||||||||||||||||||
| Noninterest income | 125 | 123 | 119 | 124 | 117 | 2 | 2 | 9 | 8 | ||||||||||||||||||||||||||||||||||||||||||||||||||||||||||||||||||||
| Total revenue | 792 | 777 | 768 | 786 | 787 | 15 | 2 | 5 | 1 | ||||||||||||||||||||||||||||||||||||||||||||||||||||||||||||||||||||
| Noninterest expense | 382 | 376 | 368 | 380 | 366 | 6 | 2 | 16 | 4 | ||||||||||||||||||||||||||||||||||||||||||||||||||||||||||||||||||||
Pre-provision net revenue3 | 410 | 401 | 400 | 407 | 421 | 9 | 2 | (11) | (3) | ||||||||||||||||||||||||||||||||||||||||||||||||||||||||||||||||||||
| Provision for credit losses | 15 | 1 | 8 | (2) | 2 | 14 | NM | 13 | NM | ||||||||||||||||||||||||||||||||||||||||||||||||||||||||||||||||||||
| Income before income tax expense | 395 | 400 | 393 | 409 | 420 | (5) | (1) | (24) | (6) | ||||||||||||||||||||||||||||||||||||||||||||||||||||||||||||||||||||
| Income tax expense | 95 | 96 | 94 | 98 | 100 | (1) | (1) | (5) | (5) | ||||||||||||||||||||||||||||||||||||||||||||||||||||||||||||||||||||
| Net income | $ | 300 | $ | 304 | $ | 299 | $ | 311 | $ | 319 | $ | (4) | (1) | % | $ | (19) | (6) | % | |||||||||||||||||||||||||||||||||||||||||||||||||||||||||||
| Average Balances (billions) | |||||||||||||||||||||||||||||||||||||||||||||||||||||||||||||||||||||||||||||
Total loans and leases11 | $ | 57.5 | $ | 57.5 | $ | 56.5 | $ | 56.5 | $ | 56.4 | $ | — | — | % | $ | 1.1 | 2 | % | |||||||||||||||||||||||||||||||||||||||||||||||||||||||||||
| Interest-earning assets | 57.5 | 57.5 | 56.5 | 56.5 | 56.4 | — | — | 1.1 | 2 | ||||||||||||||||||||||||||||||||||||||||||||||||||||||||||||||||||||
| Total assets | 60.1 | 60.0 | 59.0 | 59.0 | 58.8 | 0.1 | — | 1.3 | 2 | ||||||||||||||||||||||||||||||||||||||||||||||||||||||||||||||||||||
| Total deposits | 59.3 | 58.1 | 58.7 | 59.4 | 59.1 | 1.2 | 2 | 0.2 | — | ||||||||||||||||||||||||||||||||||||||||||||||||||||||||||||||||||||
| Key Metrics | |||||||||||||||||||||||||||||||||||||||||||||||||||||||||||||||||||||||||||||
Net interest margin6 | 4.62 | % | 4.58 | % | 4.68 | % | 4.67 | % | 4.74 | % | 4 | bp | (12) | bp | |||||||||||||||||||||||||||||||||||||||||||||||||||||||||||||||
| Efficiency ratio | 48.25 | % | 48.40 | % | 47.86 | % | 48.31 | % | 46.50 | % | (15) | bp | 175 | bp | |||||||||||||||||||||||||||||||||||||||||||||||||||||||||||||||
| Loans-to-deposits ratio (period-end balances) | 88.79 | % | 98.64 | % | 95.94 | % | 94.83 | % | 94.56 | % | (985) | bp | (577) | bp | |||||||||||||||||||||||||||||||||||||||||||||||||||||||||||||||
| Loans-to-deposits ratio (average balances) | 96.93 | % | 98.90 | % | 96.19 | % | 95.09 | % | 95.30 | % | (197) | bp | 163 | bp | |||||||||||||||||||||||||||||||||||||||||||||||||||||||||||||||
| Return on average assets (annualized) | 1.98 | % | 2.03 | % | 2.05 | % | 2.09 | % | 2.15 | % | (5) | bp | (17) | bp | |||||||||||||||||||||||||||||||||||||||||||||||||||||||||||||||
Return on allocated equity7 | 20.31 | % | 20.80 | % | 20.57 | % | 20.34 | % | 20.37 | % | (49) | bp | (6) | bp | |||||||||||||||||||||||||||||||||||||||||||||||||||||||||||||||
| Financial center locations | 408 | 407 | 410 | 412 | 413 | 1 | (5) | ||||||||||||||||||||||||||||||||||||||||||||||||||||||||||||||||||||||
Numbers may not total due to rounding.
Certain previously reported amounts have been reclassified to agree with current presentation.
See footnote disclosures on page 18 and glossary of terms on page 24.
Commercial, Consumer, and Wealth segment: Offers financial products and services, including traditional lending and deposit taking, to commercial and consumer clients primarily in the southern U.S. and other selected markets. Commercial, Consumer & Wealth also consists of lines of business that deliver product offerings and services with niche industry knowledge including corporate & specialty finance, commercial real estate, equipment finance/leasing, energy, international banking, healthcare, and transportation and logistics. Additionally, Commercial, Consumer & Wealth provides investment, wealth management, financial planning, trust and asset management services for consumer clients as well as delivering treasury management solutions, loan syndications, and corporate banking services.
16
WHOLESALE
Quarterly, Unaudited
| 3Q26 Change vs. | |||||||||||||||||||||||||||||||||||||||||||||||||||||||||||||||||||||||||||||
| 3Q26 | 2Q26 | 1Q26 | 4Q25 | 3Q25 | 2Q26 | 3Q25 | |||||||||||||||||||||||||||||||||||||||||||||||||||||||||||||||||||||||
| $/bp | % | $/bp | % | ||||||||||||||||||||||||||||||||||||||||||||||||||||||||||||||||||||||||||
| Income Statement (millions) | |||||||||||||||||||||||||||||||||||||||||||||||||||||||||||||||||||||||||||||
| Net interest income | $ | 67 | $ | 67 | $ | 62 | $ | 66 | $ | 60 | $ | — | — | % | $ | 7 | 12 | % | |||||||||||||||||||||||||||||||||||||||||||||||||||||||||||
| Noninterest income | 59 | 58 | 64 | 69 | 74 | 2 | 3 | (15) | (20) | ||||||||||||||||||||||||||||||||||||||||||||||||||||||||||||||||||||
| Total revenue | 127 | 125 | 126 | 135 | 134 | 2 | 2 | (7) | (6) | ||||||||||||||||||||||||||||||||||||||||||||||||||||||||||||||||||||
| Noninterest expense | 78 | 79 | 83 | 85 | 83 | — | — | (4) | (5) | ||||||||||||||||||||||||||||||||||||||||||||||||||||||||||||||||||||
Pre-provision net revenue3 | 48 | 46 | 43 | 50 | 52 | 2 | 5 | (3) | (6) | ||||||||||||||||||||||||||||||||||||||||||||||||||||||||||||||||||||
| Provision for credit losses | 8 | 23 | 9 | 3 | (1) | (15) | (67) | 8 | NM | ||||||||||||||||||||||||||||||||||||||||||||||||||||||||||||||||||||
| Income before income tax expense | 41 | 23 | 34 | 47 | 52 | 17 | 75 | (11) | (22) | ||||||||||||||||||||||||||||||||||||||||||||||||||||||||||||||||||||
| Income tax expense | 10 | 6 | 8 | 11 | 13 | 4 | 78 | (3) | (22) | ||||||||||||||||||||||||||||||||||||||||||||||||||||||||||||||||||||
| Net income | $ | 31 | $ | 18 | $ | 26 | $ | 36 | $ | 40 | $ | 13 | 74 | % | $ | (9) | (22) | % | |||||||||||||||||||||||||||||||||||||||||||||||||||||||||||
| Average Balances (billions) | |||||||||||||||||||||||||||||||||||||||||||||||||||||||||||||||||||||||||||||
| Total loans and leases | $ | 6.8 | $ | 7.0 | $ | 6.3 | $ | 6.5 | $ | 6.0 | $ | (0.2) | (3) | % | $ | 0.8 | 14 | % | |||||||||||||||||||||||||||||||||||||||||||||||||||||||||||
| Interest-earning assets | 9.7 | 9.9 | 9.4 | 9.6 | 8.7 | (0.2) | (2) | 1.0 | 12 | ||||||||||||||||||||||||||||||||||||||||||||||||||||||||||||||||||||
| Total assets | 10.3 | 10.5 | 10.1 | 10.3 | 9.4 | (0.2) | (2) | 1.0 | 10 | ||||||||||||||||||||||||||||||||||||||||||||||||||||||||||||||||||||
| Total deposits | 2.0 | 2.0 | 2.3 | 2.3 | 2.2 | — | 1 | (0.2) | (8) | ||||||||||||||||||||||||||||||||||||||||||||||||||||||||||||||||||||
| Key Metrics | |||||||||||||||||||||||||||||||||||||||||||||||||||||||||||||||||||||||||||||
| Fixed income product average daily revenue (thousands) | $ | 629 | $ | 594 | $ | 742 | $ | 765 | $ | 771 | $ | 35 | 6 | % | $ | (142) | (18) | % | |||||||||||||||||||||||||||||||||||||||||||||||||||||||||||
Net interest margin6 | 2.78 | % | 2.73 | % | 2.68 | % | 2.72 | % | 2.77 | % | 5 | bp | 1 | bp | |||||||||||||||||||||||||||||||||||||||||||||||||||||||||||||||
| Efficiency ratio | 61.84 | % | 63.00 | % | 66.01 | % | 62.77 | % | 61.54 | % | (116) | bp | 30 | bp | |||||||||||||||||||||||||||||||||||||||||||||||||||||||||||||||
| Loans-to-deposits ratio (period-end balances) | 326 | % | 419 | % | 354 | % | 343 | % | 319 | % | (9,301) | bp | 720 | bp | |||||||||||||||||||||||||||||||||||||||||||||||||||||||||||||||
| Loans-to-deposits ratio (average balances) | 341 | % | 353 | % | 280 | % | 288 | % | 276 | % | (1,130) | bp | 6,560 | bp | |||||||||||||||||||||||||||||||||||||||||||||||||||||||||||||||
| Return on average assets (annualized) | 1.19 | % | 0.68 | % | 1.03 | % | 1.38 | % | 1.68 | % | 51 | bp | (49) | bp | |||||||||||||||||||||||||||||||||||||||||||||||||||||||||||||||
Return on allocated equity7 | 19.89 | % | 11.50 | % | 17.55 | % | 24.11 | % | 26.29 | % | 838 | bp | (641) | bp | |||||||||||||||||||||||||||||||||||||||||||||||||||||||||||||||
Numbers may not total due to rounding.
Certain previously reported amounts have been reclassified to agree with current presentation.
See footnote disclosures on page 18 and glossary of terms on page 24.
Wholesale segment: Consists of lines of business that deliver product offerings and services with differentiated industry knowledge. Wholesale’s lines of business include mortgage warehouse lending, franchise finance, correspondent banking, and mortgage. Additionally, Wholesale has a line of business focused on fixed income securities sales, trading, underwriting, and strategies for institutional clients in the U.S. and abroad, as well as loan sales, portfolio advisory services, and derivative sales.
17
CORPORATE
Quarterly, Unaudited
| 3Q26 Change vs. | |||||||||||||||||||||||||||||||||||||||||||||||||||||||||||||||||||||||||||||
| 3Q26 | 2Q26 | 1Q26 | 4Q25 | 3Q25 | 2Q26 | 3Q25 | |||||||||||||||||||||||||||||||||||||||||||||||||||||||||||||||||||||||
| $ | % | $ | % | ||||||||||||||||||||||||||||||||||||||||||||||||||||||||||||||||||||||||||
| Income Statement (millions) | |||||||||||||||||||||||||||||||||||||||||||||||||||||||||||||||||||||||||||||
| Net interest income/(expense) | $ | (51) | $ | (45) | $ | (44) | $ | (51) | $ | (56) | $ | (6) | (13) | % | $ | 5 | 9 | % | |||||||||||||||||||||||||||||||||||||||||||||||||||||||||||
Noninterest income11 | (461) | 30 | 12 | 18 | 25 | (490) | NM | (485) | NM | ||||||||||||||||||||||||||||||||||||||||||||||||||||||||||||||||||||
| Total revenues | (512) | (15) | (32) | (33) | (32) | (496) | NM | (480) | NM | ||||||||||||||||||||||||||||||||||||||||||||||||||||||||||||||||||||
| Noninterest expense | 68 | 76 | 54 | 80 | 102 | (8) | (10) | (34) | (33) | ||||||||||||||||||||||||||||||||||||||||||||||||||||||||||||||||||||
Pre-provision net revenue3 | (580) | (91) | (86) | (113) | (134) | (489) | NM | (446) | NM | ||||||||||||||||||||||||||||||||||||||||||||||||||||||||||||||||||||
| Provision for credit losses | (47) | (9) | (2) | (1) | (6) | (39) | NM | (41) | NM | ||||||||||||||||||||||||||||||||||||||||||||||||||||||||||||||||||||
| Income before income tax expense | (533) | (83) | (84) | (112) | (128) | (450) | NM | (405) | NM | ||||||||||||||||||||||||||||||||||||||||||||||||||||||||||||||||||||
| Income tax expense (benefit) | (123) | (35) | (26) | (31) | (35) | (87) | NM | (88) | NM | ||||||||||||||||||||||||||||||||||||||||||||||||||||||||||||||||||||
| Net income/(loss) | $ | (410) | $ | (47) | $ | (58) | $ | (81) | $ | (93) | $ | (363) | NM | $ | (317) | NM | |||||||||||||||||||||||||||||||||||||||||||||||||||||||||||||
| Average Balance Sheet (billions) | |||||||||||||||||||||||||||||||||||||||||||||||||||||||||||||||||||||||||||||
| Interest bearing assets | $ | 11.3 | $ | 10.6 | $ | 11.1 | $ | 11.0 | $ | 11.0 | $ | 0.7 | 7 | % | $ | 0.3 | 3 | % | |||||||||||||||||||||||||||||||||||||||||||||||||||||||||||
| Total assets | 14.3 | 13.6 | 14.0 | 13.8 | 13.9 | 0.7 | 5 | 0.4 | 3 | ||||||||||||||||||||||||||||||||||||||||||||||||||||||||||||||||||||
Numbers may not total due to rounding.
Certain previously reported amounts have been reclassified to agree with current presentation.
Corporate segment: Consists primarily of corporate support functions including risk management, audit, accounting, finance, executive office, and corporate communications. Shared support services such as human resources, marketing, properties, technology, credit risk and bank operations are allocated to the activities of Commercial, Consumer & Wealth, Wholesale and Corporate. Additionally, the Corporate segment includes centralized management of capital and funding to support the business activities of the company including management of balance sheet funding, liquidity, and capital management and allocation. The Corporate segment also includes the revenue and expense associated with run-off businesses such as pre-2009 mortgage banking elements, run-off consumer and trust preferred loan portfolios, and other exited businesses.
FOOTNOTES
1 Taxable equivalent interest income and interest expense are non-GAAP measures and are reconciled to net interest income (GAAP) in the table.
2 Occupancy and Equipment expense includes Computer Software Expense.
3 Pre-provision net revenue is a non-GAAP measure and is reconciled to income before income taxes (GAAP) in the table.
4 Represents a non-GAAP measure and is reconciled to the nearest GAAP measure in the non-GAAP to GAAP reconciliations beginning on page 19.
5 Credit card and other includes $146 million of commercial credit card balances at September 30, 2026.
6 Net interest margin is computed using total NII adjusted for FTE assuming a statutory federal income tax rate of 21 percent and, where applicable, state taxes.
7 Segment equity is allocated based on an internal allocation methodology.
8 Share count for all periods shown was impacted by share repurchases. In 3Q26, all potential common shares were antidilutive due to the net loss attributable to common shareholders for that period. 3Q26 adjusted results include a dilutive impact on shares.
9 Balance fluctuates based on market conditions. 1Q26 decrease was driven by equity market valuations.
10 Preferred Stock balance was impacted by the issuance of Series H Preferred Stock in 1Q26.
11 In 3Q26, FHN initiated preparations to sell approximately $4.5 billion of consumer mortgages. These mortgage loans were previously included in the Commercial, Consumer, and Wealth segment and were reclassified to loans HFS. The transaction resulted in a pre-tax loss of $473 million to noninterest income related to recognition of the pending mortgage portfolio sale impacts in 3Q26 including valuation adjustments and transaction costs and closed early in 4Q26.
18
CONSOLIDATED NON-GAAP TO GAAP RECONCILIATION | ||||||||||||||||||||||||||||||||||||||||||||
| Quarterly, Unaudited | ||||||||||||||||||||||||||||||||||||||||||||
| ($ in millions, except per share data) | 3Q26 | 2Q26 | 1Q26 | 4Q25 | 3Q25 | |||||||||||||||||||||||||||||||||||||||
| Tangible Common Equity (Non-GAAP) | ||||||||||||||||||||||||||||||||||||||||||||
| (A) Total equity (GAAP) | $ | 9,125 | $ | 9,464 | $ | 9,465 | $ | 9,142 | $ | 9,244 | ||||||||||||||||||||||||||||||||||
| Less: Noncontrolling interest (a) | 295 | 295 | 295 | 295 | 295 | |||||||||||||||||||||||||||||||||||||||
| Less: Preferred stock (a) | 682 | 682 | 741 | 349 | 349 | |||||||||||||||||||||||||||||||||||||||
| (B) Total common equity | $ | 8,149 | $ | 8,487 | $ | 8,429 | $ | 8,498 | $ | 8,600 | ||||||||||||||||||||||||||||||||||
| Less: Intangible assets (GAAP) (b) | 1,591 | 1,599 | 1,607 | 1,615 | 1,624 | |||||||||||||||||||||||||||||||||||||||
| (C) Tangible common equity (Non-GAAP) | $ | 6,558 | $ | 6,888 | $ | 6,822 | $ | 6,882 | $ | 6,976 | ||||||||||||||||||||||||||||||||||
| Tangible Assets (Non-GAAP) | ||||||||||||||||||||||||||||||||||||||||||||
| (D) Total assets (GAAP) | $ | 84,318 | $ | 84,437 | $ | 84,132 | $ | 83,876 | $ | 83,192 | ||||||||||||||||||||||||||||||||||
| Less: Intangible assets (GAAP) (b) | 1,591 | 1,599 | 1,607 | 1,615 | 1,624 | |||||||||||||||||||||||||||||||||||||||
| (E) Tangible assets (Non-GAAP) | $ | 82,727 | $ | 82,839 | $ | 82,525 | $ | 82,261 | $ | 81,568 | ||||||||||||||||||||||||||||||||||
| Period-end Shares Outstanding | ||||||||||||||||||||||||||||||||||||||||||||
| (F) Period-end shares outstanding | 474 | 474 | 476 | 485 | 500 | |||||||||||||||||||||||||||||||||||||||
| Ratios | ||||||||||||||||||||||||||||||||||||||||||||
| (A)/(D) Total equity to total assets (GAAP) | 10.82 | % | 11.21 | % | 11.25 | % | 10.90 | % | 11.11 | % | ||||||||||||||||||||||||||||||||||
| (C)/(E) Tangible common equity to tangible assets (“TCE/TA”) (Non-GAAP) | 7.93 | % | 8.31 | % | 8.27 | % | 8.37 | % | 8.55 | % | ||||||||||||||||||||||||||||||||||
| (B)/(F) Book value per common share (GAAP) | $ | 17.20 | $ | 17.91 | $ | 17.72 | $ | 17.53 | $ | 17.19 | ||||||||||||||||||||||||||||||||||
| (C)/(F) Tangible book value per common share (Non-GAAP) | $ | 13.84 | $ | 14.53 | $ | 14.34 | $ | 14.20 | $ | 13.94 | ||||||||||||||||||||||||||||||||||
(a) Included in Total equity on the Consolidated Balance Sheet.
(b) Includes goodwill and other intangible assets, net of amortization.
Numbers may not total due to rounding.
19
CONSOLIDATED NON-GAAP TO GAAP RECONCILIATION | |||||||||||||||||||||||||||||||||||||||||||||||
| Quarterly, Unaudited | |||||||||||||||||||||||||||||||||||||||||||||||
| ($ in millions, except per share data) | 3Q26 | 2Q26 | 1Q26 | 4Q25 | 3Q25 | ||||||||||||||||||||||||||||||||||||||||||
| Adjusted Diluted EPS | |||||||||||||||||||||||||||||||||||||||||||||||
| Net income available to common shareholders ("NIAC") (GAAP) | a | $ | (94) | $ | 260 | $ | 257 | $ | 257 | $ | 254 | ||||||||||||||||||||||||||||||||||||
| Plus Total notable items (after-tax) (Non-GAAP) (a) | $ | 347 | $ | 1 | $ | — | $ | 2 | $ | 9 | |||||||||||||||||||||||||||||||||||||
| Adjusted net income available to common shareholders (Non-GAAP) | b | $ | 253 | $ | 262 | $ | 257 | $ | 259 | $ | 263 | ||||||||||||||||||||||||||||||||||||
Diluted Shares (GAAP)8 | c | 474 | 480 | 487 | 496 | 510 | |||||||||||||||||||||||||||||||||||||||||
Adjusted Diluted Shares8 | d | 479 | 480 | 487 | 496 | 510 | |||||||||||||||||||||||||||||||||||||||||
| Diluted EPS (GAAP) | a/c | $ | (0.20) | $ | 0.54 | $ | 0.53 | $ | 0.52 | $ | 0.50 | ||||||||||||||||||||||||||||||||||||
| Adjusted diluted EPS (Non-GAAP) | b/d | $ | 0.53 | $ | 0.54 | $ | 0.53 | $ | 0.52 | $ | 0.51 | ||||||||||||||||||||||||||||||||||||
| Adjusted Net Income ("NI") and Adjusted Return on Assets ("ROA") | |||||||||||||||||||||||||||||||||||||||||||||||
| Net Income ("NI") (GAAP) | $ | (79) | $ | 274 | $ | 266 | $ | 266 | $ | 266 | |||||||||||||||||||||||||||||||||||||
| Plus Relevant notable items (after-tax) (Non-GAAP) (a) | $ | 347 | $ | 4 | $ | — | $ | 2 | $ | 6 | |||||||||||||||||||||||||||||||||||||
| Adjusted NI (Non-GAAP) | $ | 268 | $ | 278 | $ | 266 | $ | 268 | $ | 272 | |||||||||||||||||||||||||||||||||||||
| NI (annualized) (GAAP) | e | $ | (314) | $ | 1,101 | $ | 1,079 | $ | 1,054 | $ | 1,055 | ||||||||||||||||||||||||||||||||||||
| Adjusted NI (annualized) (Non-GAAP) | f | $ | 1,062 | $ | 1,116 | $ | 1,079 | $ | 1,064 | $ | 1,079 | ||||||||||||||||||||||||||||||||||||
| Average assets (GAAP) | g | $ | 84,671 | $ | 84,097 | $ | 83,045 | $ | 83,081 | $ | 82,049 | ||||||||||||||||||||||||||||||||||||
| ROA (GAAP) | e/g | (0.37) | % | 1.31 | % | 1.30 | % | 1.27 | % | 1.29 | % | ||||||||||||||||||||||||||||||||||||
| Adjusted ROA (Non-GAAP) | f/g | 1.25 | % | 1.33 | % | 1.30 | % | 1.28 | % | 1.32 | % | ||||||||||||||||||||||||||||||||||||
| Return on Average Common Equity ("ROCE")/ Return on Average Tangible Common Equity ("ROTCE")/ Adjusted ROTCE | |||||||||||||||||||||||||||||||||||||||||||||||
| Net income available to common shareholders ("NIAC") (annualized) (GAAP) | h | $ | (372) | $ | 1,044 | $ | 1,044 | $ | 1,018 | $ | 1,007 | ||||||||||||||||||||||||||||||||||||
| Adjusted Net income available to common shareholders (annualized) (Non-GAAP) | i | $ | 1,004 | $ | 1,049 | $ | 1,044 | $ | 1,028 | $ | 1,042 | ||||||||||||||||||||||||||||||||||||
| Average Common Equity (GAAP) | j | $ | 8,581 | $ | 8,468 | $ | 8,514 | $ | 8,491 | $ | 8,579 | ||||||||||||||||||||||||||||||||||||
| Intangible Assets (GAAP) (b) | 1,595 | 1,603 | 1,611 | 1,619 | 1,628 | ||||||||||||||||||||||||||||||||||||||||||
| Average Tangible Common Equity (Non-GAAP) | k | $ | 6,987 | $ | 6,865 | $ | 6,903 | $ | 6,872 | $ | 6,950 | ||||||||||||||||||||||||||||||||||||
| Equity Adjustment (Non-GAAP) | 4 | — | — | — | — | ||||||||||||||||||||||||||||||||||||||||||
| Adjusted Average Tangible Common Equity (Non-GAAP) | l | $ | 6,991 | $ | 6,865 | $ | 6,903 | $ | 6,872 | $ | 6,950 | ||||||||||||||||||||||||||||||||||||
| ROCE (GAAP) | h/j | (4.34) | % | 12.33 | % | 12.26 | % | 11.99 | % | 11.74 | % | ||||||||||||||||||||||||||||||||||||
| ROTCE (Non-GAAP) | h/l | (5.33) | % | 15.21 | % | 15.12 | % | 14.82 | % | 14.49 | % | ||||||||||||||||||||||||||||||||||||
| Adjusted ROTCE (Non-GAAP) | i/l | 14.36 | % | 15.29 | % | 15.12 | % | 14.96 | % | 15.00 | % | ||||||||||||||||||||||||||||||||||||
(a) Adjusted for those notable items relevant to the amount being adjusted, as detailed on page 7.
(b) Includes goodwill and other intangible assets, net of amortization.
Numbers may not total due to rounding.
See footnote disclosures on page 18.
20
CONSOLIDATED NON-GAAP TO GAAP RECONCILIATION | |||||||||||||||||||||||||||||||||||||||||||||||
| Quarterly, Unaudited | |||||||||||||||||||||||||||||||||||||||||||||||
| (In millions) | 3Q26 | 2Q26 | 1Q26 | 4Q25 | 3Q25 | ||||||||||||||||||||||||||||||||||||||||||
| Adjusted Noninterest Income as a % of Total Revenue | |||||||||||||||||||||||||||||||||||||||||||||||
| Noninterest income (GAAP) | m | $ | (276) | $ | 211 | $ | 195 | $ | 212 | $ | 215 | ||||||||||||||||||||||||||||||||||||
| Plus notable items (pretax) (GAAP) (a) | 473 | — | — | — | — | ||||||||||||||||||||||||||||||||||||||||||
| Adjusted noninterest income (Non-GAAP) | n | $ | 197 | $ | 211 | $ | 195 | $ | 212 | $ | 215 | ||||||||||||||||||||||||||||||||||||
| Revenue (GAAP) | o | $ | 407 | $ | 887 | $ | 862 | $ | 888 | $ | 889 | ||||||||||||||||||||||||||||||||||||
| Taxable-equivalent adjustment | 3 | 3 | 3 | 3 | 3 | ||||||||||||||||||||||||||||||||||||||||||
| Revenue- Taxable-equivalent (Non-GAAP) | 410 | 890 | 865 | 892 | 893 | ||||||||||||||||||||||||||||||||||||||||||
| Plus notable items (pretax) (GAAP) (a) | 473 | — | — | — | — | ||||||||||||||||||||||||||||||||||||||||||
| Adjusted revenue (Non-GAAP) | p | $ | 883 | $ | 890 | $ | 865 | $ | 892 | $ | 893 | ||||||||||||||||||||||||||||||||||||
| Securities gains/(losses) (GAAP) | q | $ | (1) | $ | — | $ | (1) | $ | — | $ | — | ||||||||||||||||||||||||||||||||||||
| Noninterest income as a % of total revenue (GAAP) | (m-q)/(o-q) | (67.31) | % | 23.73 | % | 22.63 | % | 23.89 | % | 24.16 | % | ||||||||||||||||||||||||||||||||||||
| Adjusted noninterest income as a % of total revenue (Non-GAAP) | (n-q)/(p-q) | 22.38 | % | 23.65 | % | 22.55 | % | 23.80 | % | 24.07 | % | ||||||||||||||||||||||||||||||||||||
| Adjusted Efficiency Ratio | |||||||||||||||||||||||||||||||||||||||||||||||
| Noninterest expense (GAAP) | r | $ | 529 | $ | 531 | $ | 505 | $ | 545 | $ | 551 | ||||||||||||||||||||||||||||||||||||
| Plus notable items (pretax) (GAAP) (a) | (8) | (5) | — | (3) | (8) | ||||||||||||||||||||||||||||||||||||||||||
| Adjusted noninterest expense (Non-GAAP) | s | $ | 521 | $ | 526 | $ | 505 | $ | 541 | $ | 542 | ||||||||||||||||||||||||||||||||||||
| Revenue (GAAP) | t | $ | 407 | $ | 887 | $ | 862 | $ | 888 | $ | 889 | ||||||||||||||||||||||||||||||||||||
| Taxable-equivalent adjustment | 3 | 3 | 3 | 3 | 3 | ||||||||||||||||||||||||||||||||||||||||||
| Revenue- Taxable-equivalent (Non-GAAP) | 410 | 890 | 865 | 892 | 893 | ||||||||||||||||||||||||||||||||||||||||||
| Plus notable items (pretax) (GAAP) (a) | 473 | — | — | — | — | ||||||||||||||||||||||||||||||||||||||||||
| Adjusted revenue (Non-GAAP) | u | $ | 883 | $ | 890 | $ | 865 | $ | 892 | $ | 893 | ||||||||||||||||||||||||||||||||||||
| Securities gains/(losses) (GAAP) | v | $ | (1) | $ | — | $ | (1) | $ | — | $ | — | ||||||||||||||||||||||||||||||||||||
| Efficiency ratio (GAAP) | r/ (t-v) | 129.56 | % | 59.88 | % | 58.54 | % | 61.33 | % | 61.92 | % | ||||||||||||||||||||||||||||||||||||
| Adjusted efficiency ratio (Non-GAAP) | s/ (u-v) | 58.91 | % | 59.11 | % | 58.34 | % | 60.73 | % | 60.76 | % | ||||||||||||||||||||||||||||||||||||
(a) Adjusted for those notable items relevant to the amount being adjusted, as detailed on page 7.
Numbers may not total due to rounding.
21
| CONSOLIDATED NON-GAAP TO GAAP RECONCILIATION | ||||||||||||||||||||
| Quarterly, Unaudited | ||||||||||||||||||||
| ($ in millions) | ||||||||||||||||||||
| Period-end | Average | |||||||||||||||||||||||||||||||||||||||||||||||||||||||||||||||||||||||||||||||||||||||||||||||||
| 3Q26 | 2Q26 | 3Q26 vs. 2Q26 | 3Q26 | 2Q26 | 3Q26 vs. 2Q26 | |||||||||||||||||||||||||||||||||||||||||||||||||||||||||||||||||||||||||||||||||||||||||||||
| Loans excluding LMC | ||||||||||||||||||||||||||||||||||||||||||||||||||||||||||||||||||||||||||||||||||||||||||||||||||
| Total Loans (GAAP) | $ | 59,808 | $ | 65,330 | $ | (5,522) | (8) | % | $ | 64,489 | $ | 64,695 | $ | (206) | — | % | ||||||||||||||||||||||||||||||||||||||||||||||||||||||||||||||||||||||||||||||||||
| LMC (GAAP) | 3,869 | 4,759 | (891) | (19) | % | 4,092 | 4,284 | (192) | (4) | % | ||||||||||||||||||||||||||||||||||||||||||||||||||||||||||||||||||||||||||||||||||||||||
| Total Loans excl. LMC (Non-GAAP) | 55,940 | 60,571 | (4,631) | (8) | % | 60,397 | 60,411 | (14) | — | % | ||||||||||||||||||||||||||||||||||||||||||||||||||||||||||||||||||||||||||||||||||||||||
| Total Consumer (GAAP) | 9,807 | 14,439 | (4,632) | (32) | % | 14,304 | 14,439 | (136) | (1) | % | ||||||||||||||||||||||||||||||||||||||||||||||||||||||||||||||||||||||||||||||||||||||||
| Total Commercial excl. LMC (Non-GAAP) | 46,132 | 46,131 | 1 | — | % | 46,093 | 45,972 | 121 | — | % | ||||||||||||||||||||||||||||||||||||||||||||||||||||||||||||||||||||||||||||||||||||||||
| Total CRE (GAAP) | 13,692 | 13,595 | 97 | 1 | % | 13,655 | 13,510 | 145 | 1 | % | ||||||||||||||||||||||||||||||||||||||||||||||||||||||||||||||||||||||||||||||||||||||||
| Total C&I excl. LMC (Non-GAAP) | $ | 32,440 | $ | 32,536 | $ | (96) | — | % | $ | 32,438 | $ | 32,462 | (23) | — | % | |||||||||||||||||||||||||||||||||||||||||||||||||||||||||||||||||||||||||||||||||||
Numbers may not total due to rounding.
| 3Q26 | 2Q26 | 1Q26 | 4Q25 | 3Q25 | ||||||||||||||||||||||||||||||||||||||||||||||
| Allowance for credit losses to loans and leases and Allowance for credit losses to nonperforming loans and leases | ||||||||||||||||||||||||||||||||||||||||||||||||||
| Allowance for loan and lease losses (GAAP) | A | $ | 644 | $ | 709 | $ | 730 | $ | 738 | $ | 777 | |||||||||||||||||||||||||||||||||||||||
| Reserve for unfunded commitments (GAAP) | 103 | 99 | 96 | 101 | 93 | |||||||||||||||||||||||||||||||||||||||||||||
| Allowance for credit losses (Non-GAAP) | B | $ | 747 | $ | 808 | $ | 826 | $ | 839 | $ | 870 | |||||||||||||||||||||||||||||||||||||||
| Loans and leases (GAAP) | C | $ | 59,808 | $ | 65,330 | $ | 64,377 | $ | 64,156 | $ | 63,058 | |||||||||||||||||||||||||||||||||||||||
| Nonaccrual loans and leases (GAAP) | D | $ | 482 | $ | 531 | $ | 606 | $ | 604 | $ | 605 | |||||||||||||||||||||||||||||||||||||||
| Allowance for loan and lease losses to loans and leases (GAAP) | A/C | 1.08 | % | 1.09 | % | 1.13 | % | 1.15 | % | 1.23 | % | |||||||||||||||||||||||||||||||||||||||
| Allowance for credit losses to loans and leases (Non-GAAP) | B/C | 1.25 | % | 1.24 | % | 1.28 | % | 1.31 | % | 1.38 | % | |||||||||||||||||||||||||||||||||||||||
| Allowance for loan and lease losses to nonperforming loans and leases (GAAP) | A/D | 134 | % | 133 | % | 120 | % | 122 | % | 128 | % | |||||||||||||||||||||||||||||||||||||||
| Allowance for credit losses to nonperforming loans and leases (Non-GAAP) | B/D | 155 | % | 152 | % | 136 | % | 139 | % | 144 | % | |||||||||||||||||||||||||||||||||||||||
Numbers may not total due to rounding.
22
| CONSOLIDATED NON-GAAP TO GAAP RECONCILIATION | ||||||||||||||||||||||||||||||||||||||||||||
| Quarterly, Unaudited | ||||||||||||||||||||||||||||||||||||||||||||
| ($ in millions) | ||||||||||||||||||||||||||||||||||||||||||||
| 3Q26 | 2Q26 | 1Q26 | 4Q25 | 3Q25 | ||||||||||||||||||||||||||||||||||||||||
| Adjusted Pre-provision Net Revenue (PPNR) | ||||||||||||||||||||||||||||||||||||||||||||
| Pre-tax income (GAAP) | $ | (97) | $ | 341 | $ | 342 | $ | 343 | $ | 344 | ||||||||||||||||||||||||||||||||||
| Plus notable items (pretax) (GAAP) (a) | 436 | 5 | — | 3 | 8 | |||||||||||||||||||||||||||||||||||||||
| Adjusted Pre-tax income (non-GAAP) | $ | 339 | $ | 346 | $ | 342 | $ | 347 | $ | 352 | ||||||||||||||||||||||||||||||||||
| Plus adjusted provision for credit losses expense (non-GAAP) | 20 | 15 | 15 | — | (5) | |||||||||||||||||||||||||||||||||||||||
| Adjusted Pre-provision net revenue (PPNR) (non-GAAP) | $ | 359 | $ | 361 | $ | 357 | $ | 347 | $ | 347 | ||||||||||||||||||||||||||||||||||
| Taxable-equivalent adjustment | 3 | 3 | 3 | 3 | 3 | |||||||||||||||||||||||||||||||||||||||
| Adjusted Pre-provision net revenue-Taxable-equivalent (Non-GAAP) | $ | 362 | $ | 364 | $ | 360 | $ | 350 | $ | 351 | ||||||||||||||||||||||||||||||||||
| 3Q26 | 2Q26 | 1Q26 | 4Q25 | 3Q25 | ||||||||||||||||||||||||||||||||||||||||
| Adjusted Provision for Credit Losses | ||||||||||||||||||||||||||||||||||||||||||||
| Provision for credit losses (GAAP) | $ | (25) | $ | 15 | $ | 15 | $ | — | $ | (5) | ||||||||||||||||||||||||||||||||||
| Plus notable items (pretax) (GAAP) (a) | (45) | — | — | — | — | |||||||||||||||||||||||||||||||||||||||
| Adjusted provision for credit loss expense (non-GAAP) | $ | 20 | $ | 15 | $ | 15 | $ | — | $ | (5) | ||||||||||||||||||||||||||||||||||
(a) Adjusted for those notable items relevant to the amount being adjusted, as detailed on page 7.
Numbers may not total due to rounding.
23
| GLOSSARY OF TERMS | ||||||||||||||
Common Equity Tier 1 Ratio: Ratio consisting of common equity adjusted for certain unrealized gains/(losses) on available-for-sale securities, less disallowed portions of goodwill, other intangibles, and deferred tax assets as well as certain other regulatory deductions divided by risk-weighted assets.
Fully Taxable Equivalent (“FTE”): Reflects the amount of tax-exempt income adjusted to a level that would yield the same after-tax income had that income been subject to taxation.
Tier 1 Capital Ratio: Ratio consisting of shareholders’ equity adjusted for certain unrealized gains/(losses) on available-for-sale securities, plus qualifying portions of noncontrolling interests, less disallowed portions of goodwill, other intangible assets, and deferred tax assets as well as certain other regulatory deductions divided by risk-weighted assets.
| Key Ratios | ||||||||||||||
Return on Average Assets: Ratio is annualized net income to average total assets.
Return on Average Common Equity: Ratio is annualized net income available to common shareholders to average common equity.
Return on Average Tangible Common Equity: Ratio is annualized net income available to common shareholders to average tangible common equity.
Noninterest Income as a Percentage of Total Revenue: Ratio is noninterest income excluding securities gains/(losses) to total revenue - taxable equivalent excluding securities gains/(losses).
Efficiency Ratio: Ratio is noninterest expense to total revenue - taxable equivalent excluding securities gains/(losses).
Leverage Ratio: Ratio is tier 1 capital to average assets for leverage.
| Asset Quality - Consolidated Key Ratios | ||||||||||||||
Nonperforming loans and leases ("NPL") %: Ratio is nonaccruing loans and leases in the loan portfolio to total period-end loans and leases.
Net charge-offs %: Ratio is annualized net charge-offs to total average loans and leases.
Allowance / loans and leases: Ratio is allowance for loan and lease losses to total period-end loans and leases.
Allowance / Nonperforming loans and leases: Ratio is allowance for loan and lease losses to nonperforming loans and leases in the loan portfolio.
| Operating Segments | ||||||||||||||
Commercial, Consumer, and Wealth segment: Offers financial products and services, including traditional lending and deposit taking, to commercial and consumer clients primarily in the southern U.S. and other selected markets. Commercial, Consumer & Wealth also consists of lines of business that deliver product offerings and services with niche industry knowledge including corporate & specialty finance, commercial real estate, equipment finance/leasing, energy, international banking, healthcare, and transportation and logistics. Additionally, Commercial, Consumer & Wealth provides investment, wealth management, financial planning, trust and asset management services for consumer clients as well as delivering treasury management solutions, loan syndications, and corporate banking services.
Wholesale segment: Consists of lines of business that deliver product offerings and services with differentiated industry knowledge. Wholesale’s lines of business include mortgage warehouse lending, franchise finance, correspondent banking, and mortgage. Additionally, Wholesale has a line of business focused on fixed income securities sales, trading, underwriting, and strategies for institutional clients in the U.S. and abroad, as well as loan sales, portfolio advisory services, and derivative sales.
Corporate segment: Consists primarily of corporate support functions including risk management, audit, accounting, finance, executive office, and corporate communications. Shared support services such as human resources, marketing, properties, technology, credit risk and bank operations are allocated to the activities of Commercial, Consumer & Wealth, Wholesale and Corporate. Additionally, the Corporate segment includes centralized management of capital and funding to support the business activities of the company including management of balance sheet funding, liquidity, and capital management and allocation. The Corporate segment also includes the revenue and expense associated with run-off businesses such as pre-2009 mortgage banking elements, run-off consumer and trust preferred loan portfolios, and other exited businesses.
24

Third Quarter 2026 Earnings October 15, 2026
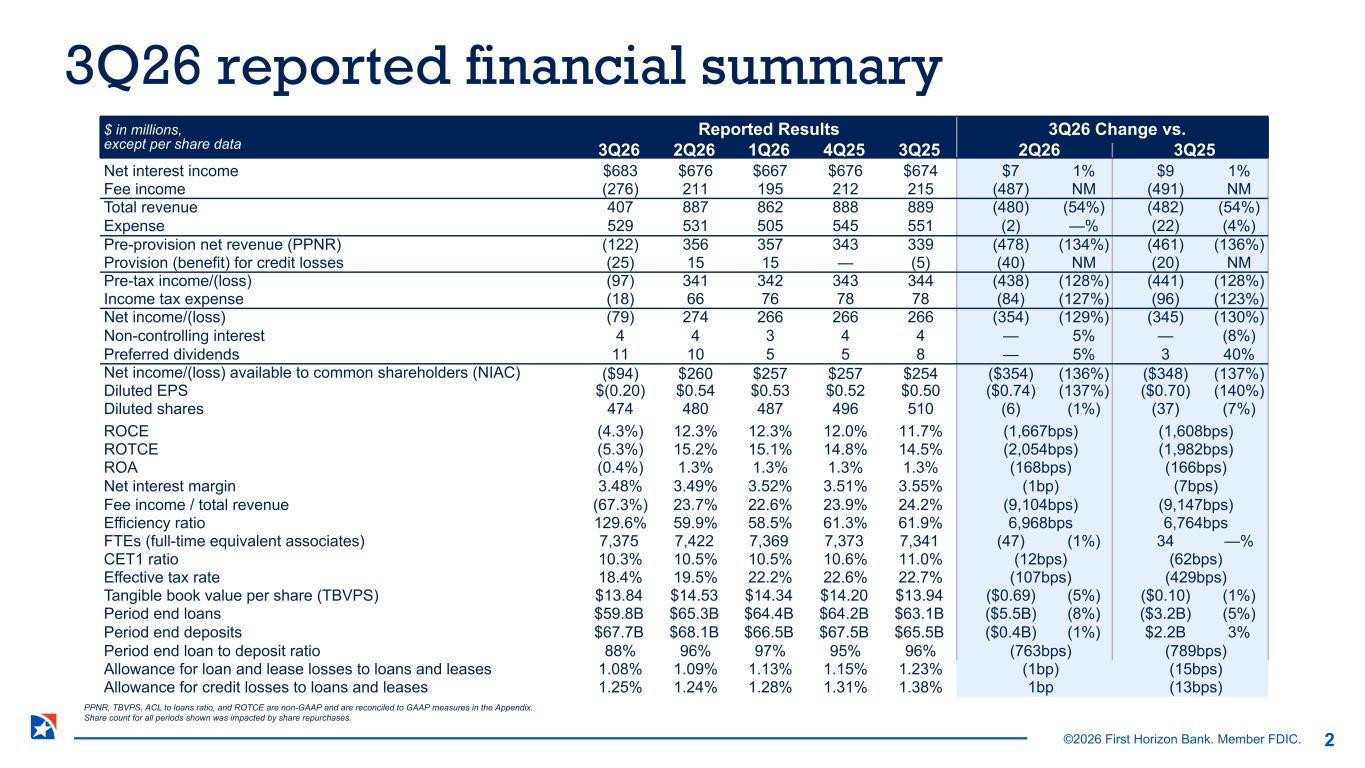
©2026 First Horizon Bank. Member FDIC. PPNR, TBVPS, ACL to loans ratio, and ROTCE are non-GAAP and are reconciled to GAAP measures in the Appendix. Share count for all periods shown was impacted by share repurchases. $ in millions, except per share data Reported Results 3Q26 Change vs. 3Q26 2Q26 1Q26 4Q25 3Q25 2Q26 3Q25 Net interest income $683 $676 $667 $676 $674 $7 1% $9 1% Fee income (276) 211 195 212 215 (487) NM (491) NM Total revenue 407 887 862 888 889 (480) (54%) (482) (54%) Expense 529 531 505 545 551 (2) —% (22) (4%) Pre-provision net revenue (PPNR) (122) 356 357 343 339 (478) (134%) (461) (136%) Provision (benefit) for credit losses (25) 15 15 — (5) (40) NM (20) NM Pre-tax income/(loss) (97) 341 342 343 344 (438) (128%) (441) (128%) Income tax expense (18) 66 76 78 78 (84) (127%) (96) (123%) Net income/(loss) (79) 274 266 266 266 (354) (129%) (345) (130%) Non-controlling interest 4 4 3 4 4 — 5% — (8%) Preferred dividends 11 10 5 5 8 — 5% 3 40% Net income/(loss) available to common shareholders (NIAC) ($94) $260 $257 $257 $254 ($354) (136%) ($348) (137%) Diluted EPS $(0.20) $0.54 $0.53 $0.52 $0.50 ($0.74) (137%) ($0.70) (140%) Diluted shares 474 480 487 496 510 (6) (1%) (37) (7%) ROCE (4.3%) 12.3% 12.3% 12.0% 11.7% (1,667bps) (1,608bps) ROTCE (5.3%) 15.2% 15.1% 14.8% 14.5% (2,054bps) (1,982bps) ROA (0.4%) 1.3% 1.3% 1.3% 1.3% (168bps) (166bps) Net interest margin 3.48% 3.49% 3.52% 3.51% 3.55% (1bp) (7bps) Fee income / total revenue (67.3%) 23.7% 22.6% 23.9% 24.2% (9,104bps) (9,147bps) Efficiency ratio 129.6% 59.9% 58.5% 61.3% 61.9% 6,968bps 6,764bps FTEs (full-time equivalent associates) 7,375 7,422 7,369 7,373 7,341 (47) (1%) 34 —% CET1 ratio 10.3% 10.5% 10.5% 10.6% 11.0% (12bps) (62bps) Effective tax rate 18.4% 19.5% 22.2% 22.6% 22.7% (107bps) (429bps) Tangible book value per share (TBVPS) $13.84 $14.53 $14.34 $14.20 $13.94 ($0.69) (5%) ($0.10) (1%) Period end loans $59.8B $65.3B $64.4B $64.2B $63.1B ($5.5B) (8%) ($3.2B) (5%) Period end deposits $67.7B $68.1B $66.5B $67.5B $65.5B ($0.4B) (1%) $2.2B 3% Period end loan to deposit ratio 88% 96% 97% 95% 96% (763bps) (789bps) Allowance for loan and lease losses to loans and leases 1.08% 1.09% 1.13% 1.15% 1.23% (1bp) (15bps) Allowance for credit losses to loans and leases 1.25% 1.24% 1.28% 1.31% 1.38% 1bp (13bps) 3Q26 reported financial summary 2
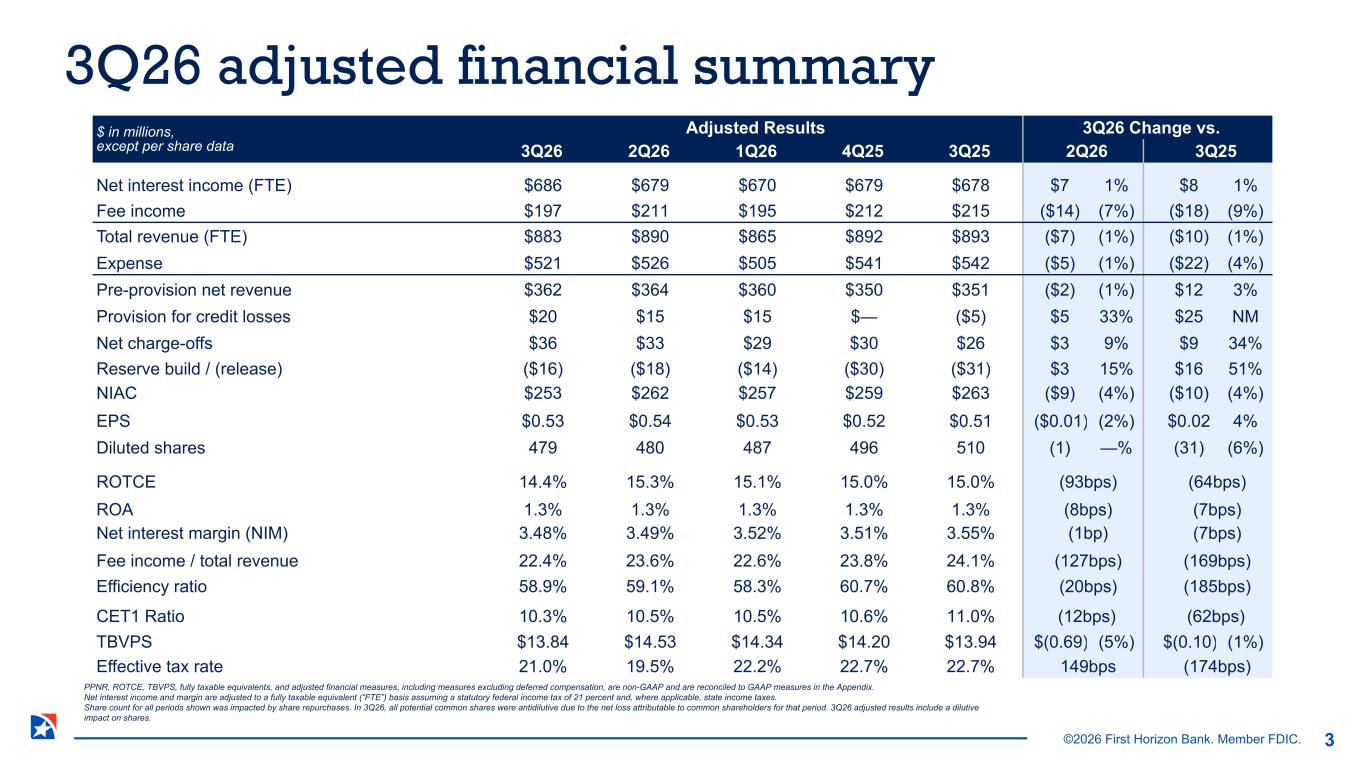
©2026 First Horizon Bank. Member FDIC. $ in millions, except per share data Adjusted Results 3Q26 Change vs. 3Q26 2Q26 1Q26 4Q25 3Q25 2Q26 3Q25 Net interest income (FTE) $686 $679 $670 $679 $678 $7 1% $8 1% Fee income $197 $211 $195 $212 $215 ($14) (7%) ($18) (9%) Total revenue (FTE) $883 $890 $865 $892 $893 ($7) (1%) ($10) (1%) Expense $521 $526 $505 $541 $542 ($5) (1%) ($22) (4%) Pre-provision net revenue $362 $364 $360 $350 $351 ($2) (1%) $12 3% Provision for credit losses $20 $15 $15 $— ($5) $5 33% $25 NM Net charge-offs $36 $33 $29 $30 $26 $3 9% $9 34% Reserve build / (release) ($16) ($18) ($14) ($30) ($31) $3 15% $16 51% NIAC $253 $262 $257 $259 $263 ($9) (4%) ($10) (4%) EPS $0.53 $0.54 $0.53 $0.52 $0.51 ($0.01) (2%) $0.02 4% Diluted shares 479 480 487 496 510 (1) —% (31) (6%) ROTCE 14.4% 15.3% 15.1% 15.0% 15.0% (93bps) (64bps) ROA 1.3% 1.3% 1.3% 1.3% 1.3% (8bps) (7bps) Net interest margin (NIM) 3.48% 3.49% 3.52% 3.51% 3.55% (1bp) (7bps) Fee income / total revenue 22.4% 23.6% 22.6% 23.8% 24.1% (127bps) (169bps) Efficiency ratio 58.9% 59.1% 58.3% 60.7% 60.8% (20bps) (185bps) CET1 Ratio 10.3% 10.5% 10.5% 10.6% 11.0% (12bps) (62bps) TBVPS $13.84 $14.53 $14.34 $14.20 $13.94 $(0.69) (5%) $(0.10) (1%) Effective tax rate 21.0% 19.5% 22.2% 22.7% 22.7% 149bps (174bps) 3Q26 adjusted financial summary PPNR, ROTCE, TBVPS, fully taxable equivalents, and adjusted financial measures, including measures excluding deferred compensation, are non-GAAP and are reconciled to GAAP measures in the Appendix. Net interest income and margin are adjusted to a fully taxable equivalent (“FTE”) basis assuming a statutory federal income tax of 21 percent and, where applicable, state income taxes. Share count for all periods shown was impacted by share repurchases. In 3Q26, all potential common shares were antidilutive due to the net loss attributable to common shareholders for that period. 3Q26 adjusted results include a dilutive impact on shares. 3
©2026 First Horizon Bank. Member FDIC. 3Q26 highlights . . . . . . . . . . . . . . . . . . . . . . . . . . . . . . . . . . . . . . . . . . . . . . . . . . . . . . . . . . . . . . . . . . . . . . 5 3Q26 notable items . . . . . . . . . . . . . . . . . . . . . . . . . . . . . . . . . . . . . . . . . . . . . . . . . . . . . . . . . . . . . . . . . . 6 Mortgage business realignment . . . . . . . . . . . . . . . . . . . . . . . . . . . . . . . . . . . . . . . . . . . . . . . . . . . . . . . . 7 NII and NIM . . . . . . . . . . . . . . . . . . . . . . . . . . . . . . . . . . . . . . . . . . . . . . . . . . . . . . . . . . . . . . . . . . . . . . . . . 8 Deposits . . . . . . . . . . . . . . . . . . . . . . . . . . . . . . . . . . . . . . . . . . . . . . . . . . . . . . . . . . . . . . . . . . . . . . . . . . . . 9 Loans . . . . . . . . . . . . . . . . . . . . . . . . . . . . . . . . . . . . . . . . . . . . . . . . . . . . . . . . . . . . . . . . . . . . . . . . . . . . . . 10 Adjusted fee income . . . . . . . . . . . . . . . . . . . . . . . . . . . . . . . . . . . . . . . . . . . . . . . . . . . . . . . . . . . . . . . . . . 11 Adjusted expense . . . . . . . . . . . . . . . . . . . . . . . . . . . . . . . . . . . . . . . . . . . . . . . . . . . . . . . . . . . . . . . . . . . . 12 Asset quality . . . . . . . . . . . . . . . . . . . . . . . . . . . . . . . . . . . . . . . . . . . . . . . . . . . . . . . . . . . . . . . . . . . . . . . . 13 Capital . . . . . . . . . . . . . . . . . . . . . . . . . . . . . . . . . . . . . . . . . . . . . . . . . . . . . . . . . . . . . . . . . . . . . . . . . . . . . 14 2026 outlook . . . . . . . . . . . . . . . . . . . . . . . . . . . . . . . . . . . . . . . . . . . . . . . . . . . . . . . . . . . . . . . . . . . . . . . . 15 Strategic focus . . . . . . . . . . . . . . . . . . . . . . . . . . . . . . . . . . . . . . . . . . . . . . . . . . . . . . . . . . . . . . . . . . . . . . 16 Appendix . . . . . . . . . . . . . . . . . . . . . . . . . . . . . . . . . . . . . . . . . . . . . . . . . . . . . . . . . . . . . . . . . . . . . . . . . . . 17 Disclaimers . . . . . . . . . . . . . . . . . . . . . . . . . . . . . . . . . . . . . . . . . . . . . . . . . . . . . . . . . . . . . . . . . . . . . . . . . 31 4 Table of Contents 4
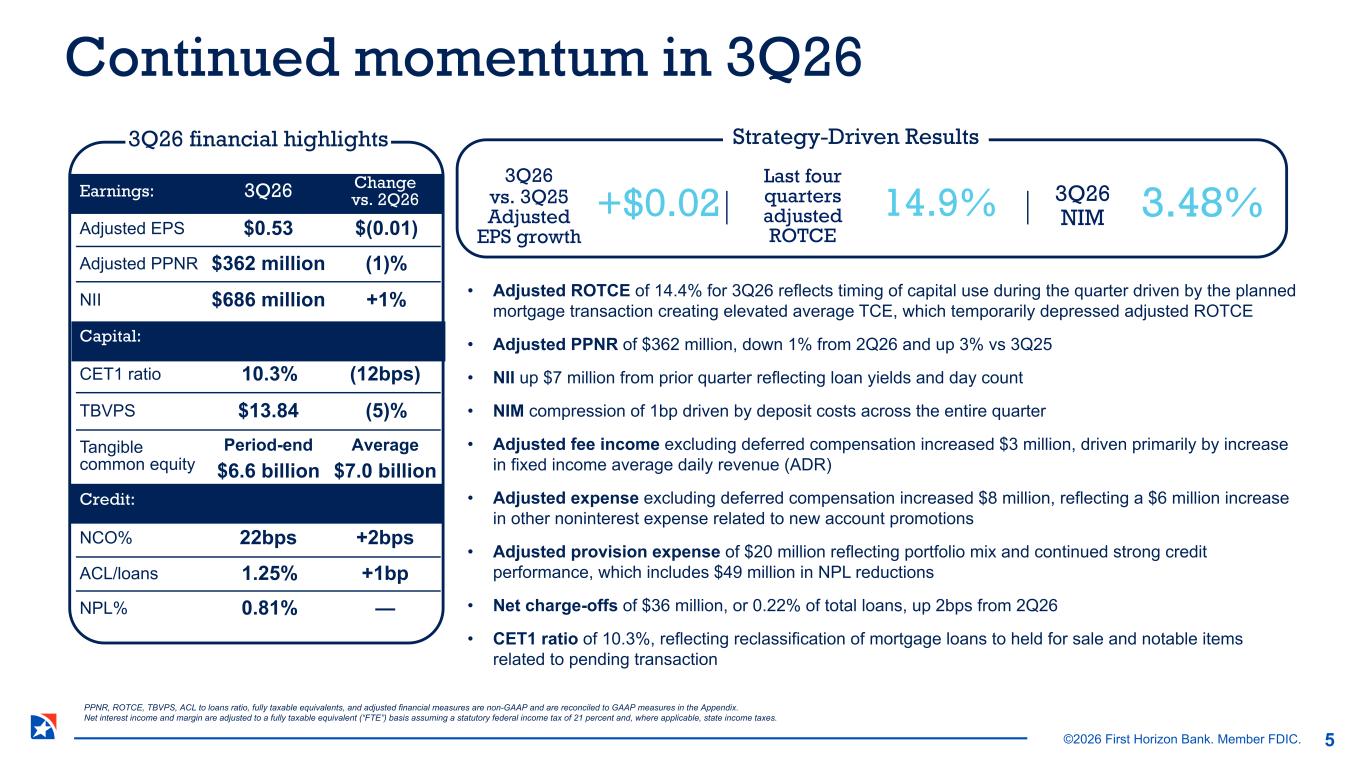
©2026 First Horizon Bank. Member FDIC. redit: Capital Earnings: 3Q26 Change vs. 2Q26 Adjusted EPS $0.53 $(0.01) Adjusted PPNR $362 million (1)% NII $686 million +1% Capital: CET1 ratio 10.3% (12bps) TBVPS $13.84 (5)% Tangible common equity Period-end Average $6.6 billion $7.0 billion Credit: NCO% 22bps +2bps ACL/loans 1.25% +1bp NPL% 0.81% — 3Q26 NIM 3.48% Continued momentum in 3Q26 Strategy-Driven Results 3Q26 vs. 3Q25 Adjusted EPS growth +$0.02 PPNR, ROTCE, TBVPS, ACL to loans ratio, fully taxable equivalents, and adjusted financial measures are non-GAAP and are reconciled to GAAP measures in the Appendix. Net interest income and margin are adjusted to a fully taxable equivalent (“FTE”) basis assuming a statutory federal income tax of 21 percent and, where applicable, state income taxes. • Adjusted ROTCE of 14.4% for 3Q26 reflects timing of capital use during the quarter driven by the planned mortgage transaction creating elevated average TCE, which temporarily depressed adjusted ROTCE • Adjusted PPNR of $362 million, down 1% from 2Q26 and up 3% vs 3Q25 • NII up $7 million from prior quarter reflecting loan yields and day count • NIM compression of 1bp driven by deposit costs across the entire quarter • Adjusted fee income excluding deferred compensation increased $3 million, driven primarily by increase in fixed income average daily revenue (ADR) • Adjusted expense excluding deferred compensation increased $8 million, reflecting a $6 million increase in other noninterest expense related to new account promotions • Adjusted provision expense of $20 million reflecting portfolio mix and continued strong credit performance, which includes $49 million in NPL reductions • Net charge-offs of $36 million, or 0.22% of total loans, up 2bps from 2Q26 • CET1 ratio of 10.3%, reflecting reclassification of mortgage loans to held for sale and notable items related to pending transaction 5 Last four quarters adjusted ROTCE 14.9% 3Q26 financial highlights
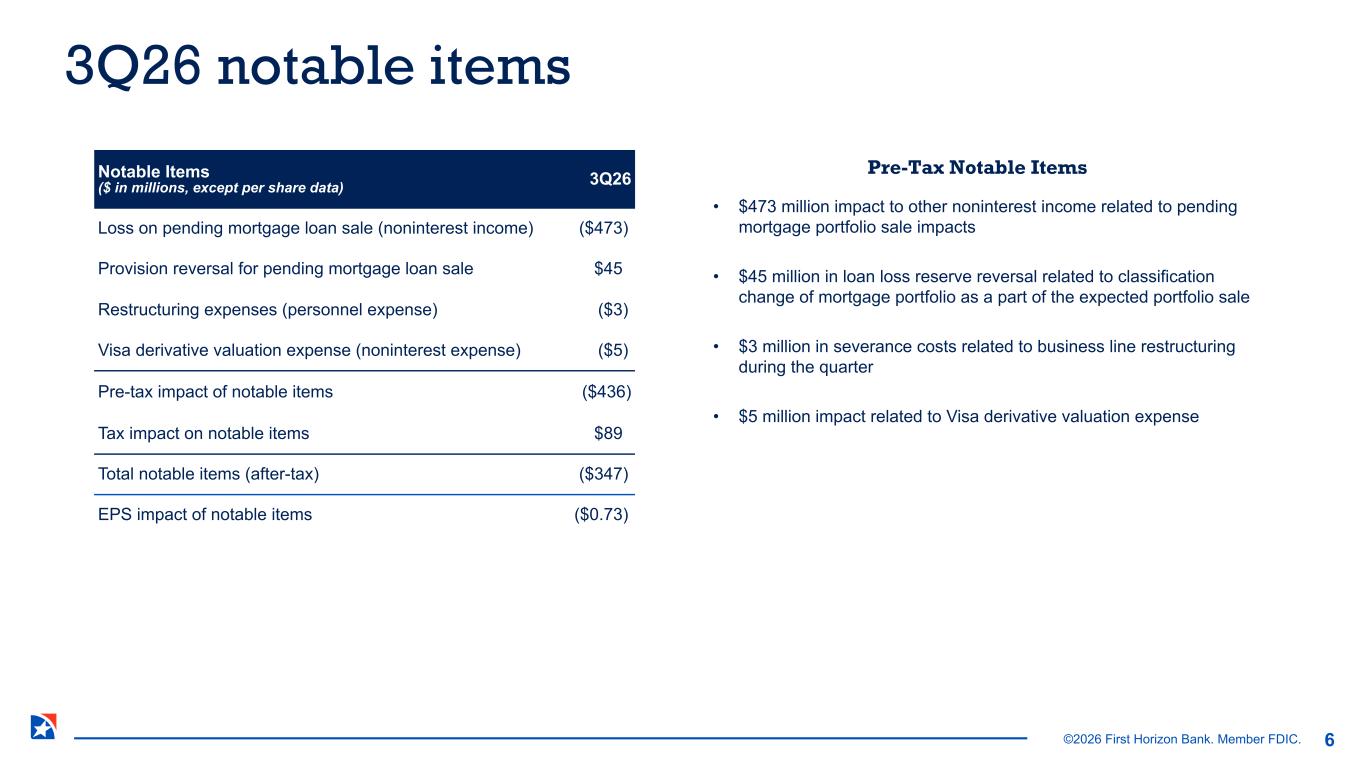
©2026 First Horizon Bank. Member FDIC. Notable Items ($ in millions, except per share data) 3Q26 Loss on pending mortgage loan sale (noninterest income) ($473) Provision reversal for pending mortgage loan sale $45 Restructuring expenses (personnel expense) ($3) Visa derivative valuation expense (noninterest expense) ($5) Pre-tax impact of notable items ($436) Tax impact on notable items $89 Total notable items (after-tax) ($347) EPS impact of notable items ($0.73) Pre-Tax Notable Items 3Q26 notable items 6 • $473 million impact to other noninterest income related to pending mortgage portfolio sale impacts • $45 million in loan loss reserve reversal related to classification change of mortgage portfolio as a part of the expected portfolio sale • $3 million in severance costs related to business line restructuring during the quarter • $5 million impact related to Visa derivative valuation expense
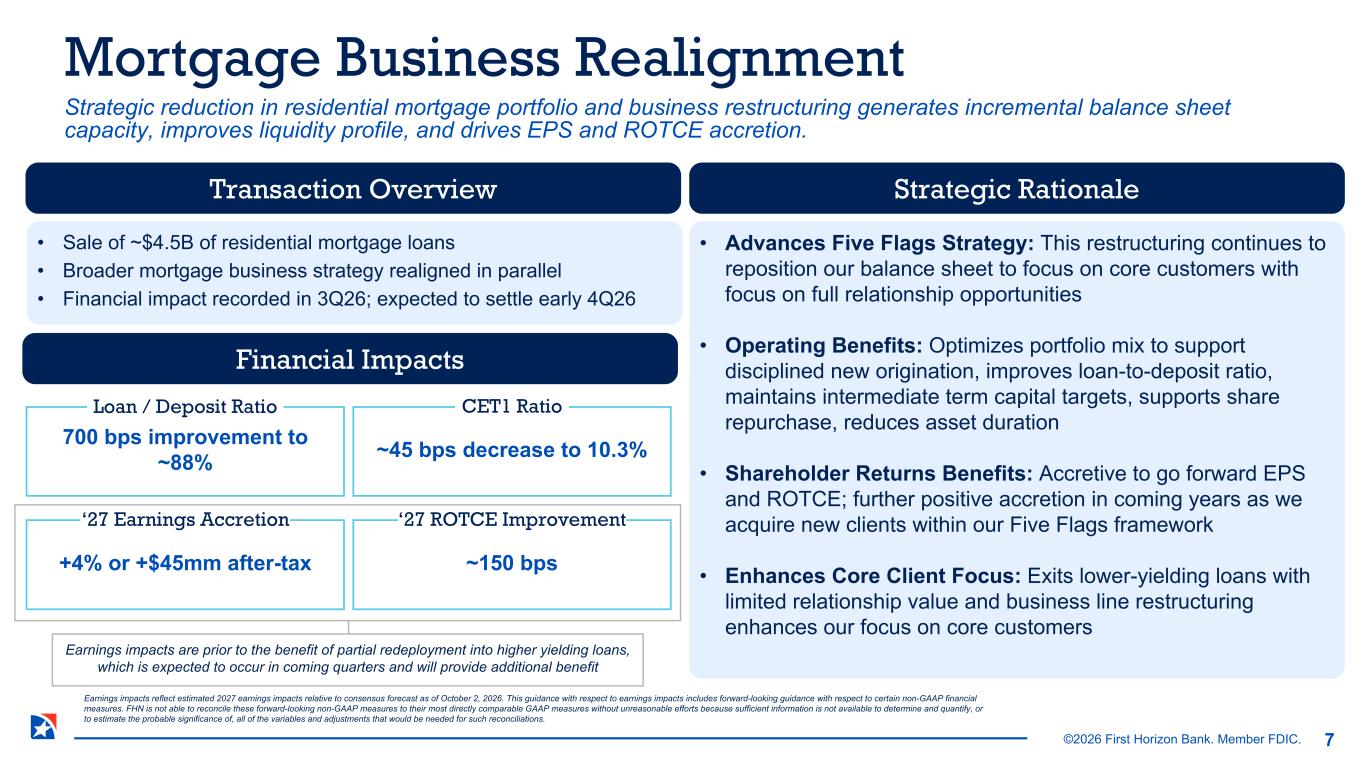
©2026 First Horizon Bank. Member FDIC. 7 Earnings impacts reflect estimated 2027 earnings impacts relative to consensus forecast as of October 2, 2026. This guidance with respect to earnings impacts includes forward-looking guidance with respect to certain non-GAAP financial measures. FHN is not able to reconcile these forward-looking non-GAAP measures to their most directly comparable GAAP measures without unreasonable efforts because sufficient information is not available to determine and quantify, or to estimate the probable significance of, all of the variables and adjustments that would be needed for such reconciliations. Mortgage Business Realignment Strategic reduction in residential mortgage portfolio and business restructuring generates incremental balance sheet capacity, improves liquidity profile, and drives EPS and ROTCE accretion. Transaction Overview Strategic Rationale • Sale of ~$4.5B of residential mortgage loans • Broader mortgage business strategy realigned in parallel • Financial impact recorded in 3Q26; expected to settle early 4Q26 +4% or +$45mm after-tax ~150 bps ‘27 ROTCE Improvement‘27 Earnings Accretion ~45 bps decrease to 10.3% CET1 Ratio 700 bps improvement to ~88% Loan / Deposit Ratio • Advances Five Flags Strategy: This restructuring continues to reposition our balance sheet to focus on core customers with focus on full relationship opportunities • Operating Benefits: Optimizes portfolio mix to support disciplined new origination, improves loan-to-deposit ratio, maintains intermediate term capital targets, supports share repurchase, reduces asset duration • Shareholder Returns Benefits: Accretive to go forward EPS and ROTCE; further positive accretion in coming years as we acquire new clients within our Five Flags framework • Enhances Core Client Focus: Exits lower-yielding loans with limited relationship value and business line restructuring enhances our focus on core customers Financial Impacts Earnings impacts are prior to the benefit of partial redeployment into higher yielding loans, which is expected to occur in coming quarters and will provide additional benefit
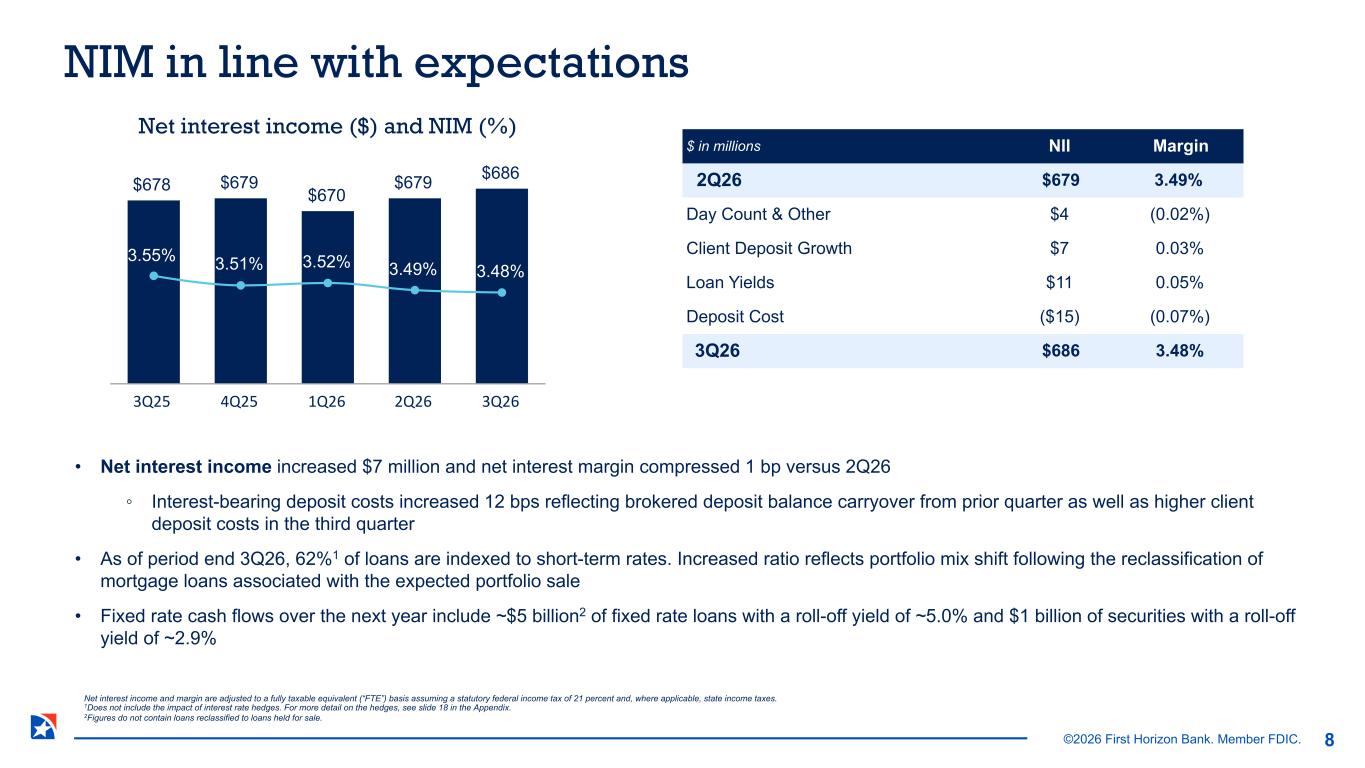
©2026 First Horizon Bank. Member FDIC. • Net interest income increased $7 million and net interest margin compressed 1 bp versus 2Q26 ◦ Interest-bearing deposit costs increased 12 bps reflecting brokered deposit balance carryover from prior quarter as well as higher client deposit costs in the third quarter • As of period end 3Q26, 62%1 of loans are indexed to short-term rates. Increased ratio reflects portfolio mix shift following the reclassification of mortgage loans associated with the expected portfolio sale • Fixed rate cash flows over the next year include ~$5 billion2 of fixed rate loans with a roll-off yield of ~5.0% and $1 billion of securities with a roll-off yield of ~2.9% $678 $679 $670 $679 $686 3.55% 3.51% 3.52% 3.49% 3.48% 3Q25 4Q25 1Q26 2Q26 3Q26 Net interest income ($) and NIM (%) $ in millions NII Margin 2Q26 $679 3.49% Day Count & Other $4 (0.02%) Client Deposit Growth $7 0.03% Loan Yields $11 0.05% Deposit Cost ($15) (0.07%) 3Q26 $686 3.48% NIM in line with expectations Net interest income and margin are adjusted to a fully taxable equivalent (“FTE”) basis assuming a statutory federal income tax of 21 percent and, where applicable, state income taxes. 1Does not include the impact of interest rate hedges. For more detail on the hedges, see slide 18 in the Appendix. 2Figures do not contain loans reclassified to loans held for sale. 8

©2026 First Horizon Bank. Member FDIC. • 3Q26 period end deposits of $67.7 billion ◦ Client deposits increased $1.5 billion versus 2Q26 ◦ Decrease of $372 million versus 2Q26, driven primarily by a $1.6 billion decrease in brokered CDs ◦ Slight growth on $28 billion in balances associated with repriced clients driven by increased commercial checking balances; retention of consumer client balances remains strong at ~98% • 3Q26 average deposits of $68.6 billion ◦ Client deposits increased $1.3 billion in the quarter ◦ Brokered deposits averaged $536 million higher in 3Q26 compared to 2Q26 ◦ Average noninterest bearing deposit balances increased $166 million from 2Q26 Period end deposits $65.5B $67.5B $66.5B $68.1B $67.7B $16.0 $15.8 $15.9 $16.0 $15.6 $13.6 $14.2 $14.2 $14.2 $13.5 $31.7 $31.5 $31.1 $30.1 $32.7 $4.2 $6.0 $5.3 $7.8 $5.9 Brokered deposits Client promos, CDs, & indexed deposits Base rate deposits Noninterest bearing deposits 3Q25 4Q25 1Q26 2Q26 3Q26 Client deposit growth in the quarter 9 Average deposits $65.9B $66.5B $66.2B $66.8B $68.6B $61.3 $61.6 $60.8 $60.1 $61.4 $4.6 $4.9 $5.4 $6.7 $7.2 Brokered Client 3Q25 4Q25 1Q26 2Q26 3Q26 2.78% 2.53% 2.28% 2.33% 2.45% 67% 64% 69% 66% 3Q25 4Q25 1Q26 2Q26 3Q26 IB deposit rate & cumulative beta1 FFR Δ2 -25 bps -50 bps 0 0 +25 bps 1Cumulative down-cycle beta since rate cuts began in 3Q24. 2Change in Fed Funds Rate.
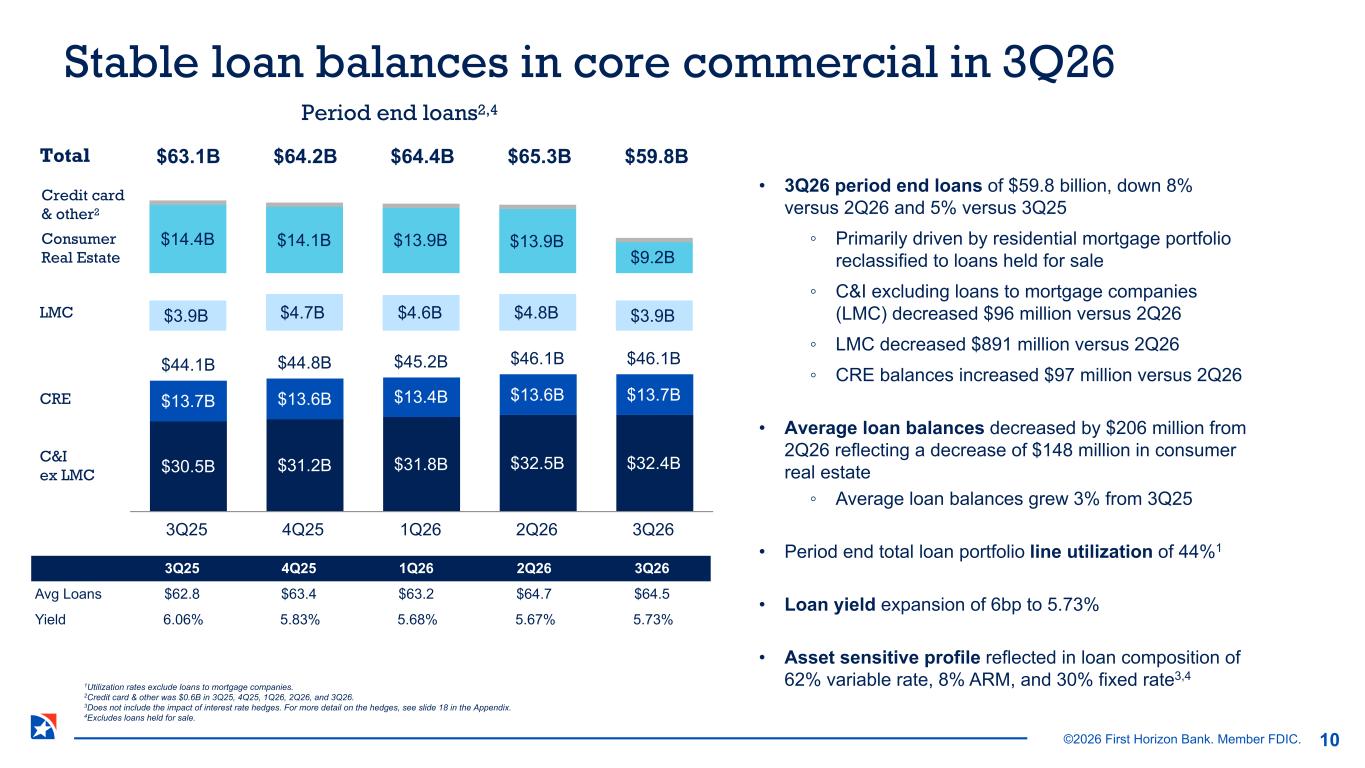
©2026 First Horizon Bank. Member FDIC. Period end loans2,4 • 3Q26 period end loans of $59.8 billion, down 8% versus 2Q26 and 5% versus 3Q25 ◦ Primarily driven by residential mortgage portfolio reclassified to loans held for sale ◦ C&I excluding loans to mortgage companies (LMC) decreased $96 million versus 2Q26 ◦ LMC decreased $891 million versus 2Q26 ◦ CRE balances increased $97 million versus 2Q26 • Average loan balances decreased by $206 million from 2Q26 reflecting a decrease of $148 million in consumer real estate ◦ Average loan balances grew 3% from 3Q25 • Period end total loan portfolio line utilization of 44%1 • Loan yield expansion of 6bp to 5.73% • Asset sensitive profile reflected in loan composition of 62% variable rate, 8% ARM, and 30% fixed rate3,4 $44.1B $44.8B $45.2B $46.1B $46.1B $30.5B $31.2B $31.8B $32.5B $32.4B $13.7B $13.6B $13.4B $13.6B $13.7B 3Q25 4Q25 1Q26 2Q26 3Q26 Stable loan balances in core commercial in 3Q26 1Utilization rates exclude loans to mortgage companies. 2Credit card & other was $0.6B in 3Q25, 4Q25, 1Q26, 2Q26, and 3Q26. 3Does not include the impact of interest rate hedges. For more detail on the hedges, see slide 18 in the Appendix. 4Excludes loans held for sale. 10 $3.9B $4.7B $4.6B $4.8B $3.9B $14.4B $14.1B $13.9B $13.9B $9.2B C&I ex LMC CRE LMC Total $63.1B $59.8B$64.2B $64.4B $65.3B Consumer Real Estate 3Q25 4Q25 1Q26 2Q26 3Q26 Avg Loans $62.8 $63.4 $63.2 $64.7 $64.5 Yield 6.06% 5.83% 5.68% 5.67% 5.73% Credit card & other2
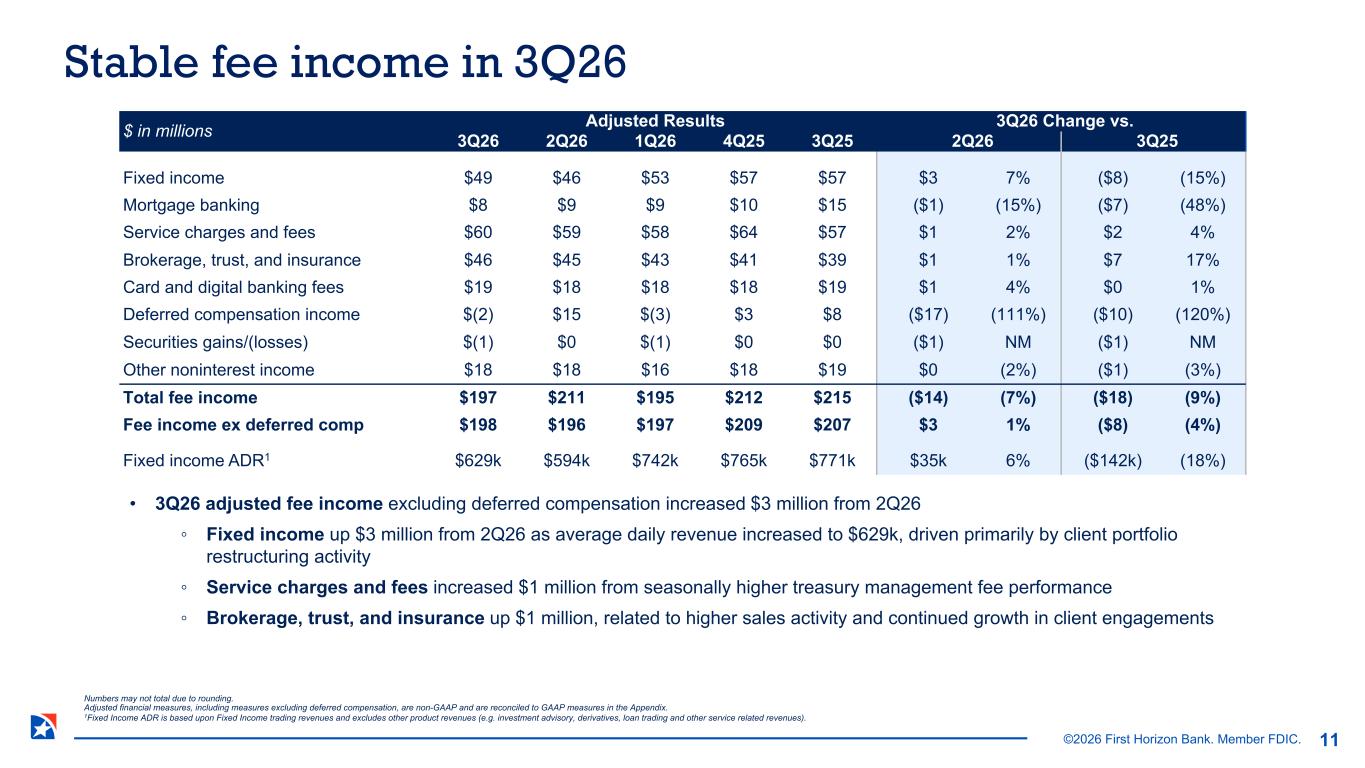
©2026 First Horizon Bank. Member FDIC. • 3Q26 adjusted fee income excluding deferred compensation increased $3 million from 2Q26 ◦ Fixed income up $3 million from 2Q26 as average daily revenue increased to $629k, driven primarily by client portfolio restructuring activity ◦ Service charges and fees increased $1 million from seasonally higher treasury management fee performance ◦ Brokerage, trust, and insurance up $1 million, related to higher sales activity and continued growth in client engagements $ in millions Adjusted Results 3Q26 Change vs. 3Q26 2Q26 1Q26 4Q25 3Q25 2Q26 3Q25 Fixed income $49 $46 $53 $57 $57 $3 7% ($8) (15%) Mortgage banking $8 $9 $9 $10 $15 ($1) (15%) ($7) (48%) Service charges and fees $60 $59 $58 $64 $57 $1 2% $2 4% Brokerage, trust, and insurance $46 $45 $43 $41 $39 $1 1% $7 17% Card and digital banking fees $19 $18 $18 $18 $19 $1 4% $0 1% Deferred compensation income $(2) $15 $(3) $3 $8 ($17) (111%) ($10) (120%) Securities gains/(losses) $(1) $0 $(1) $0 $0 ($1) NM ($1) NM Other noninterest income $18 $18 $16 $18 $19 $0 (2%) ($1) (3%) Total fee income $197 $211 $195 $212 $215 ($14) (7%) ($18) (9%) Fee income ex deferred comp $198 $196 $197 $209 $207 $3 1% ($8) (4%) Fixed income ADR1 $629k $594k $742k $765k $771k $35k 6% ($142k) (18%) Stable fee income in 3Q26 11 Numbers may not total due to rounding. Adjusted financial measures, including measures excluding deferred compensation, are non-GAAP and are reconciled to GAAP measures in the Appendix. 1Fixed Income ADR is based upon Fixed Income trading revenues and excludes other product revenues (e.g. investment advisory, derivatives, loan trading and other service related revenues).
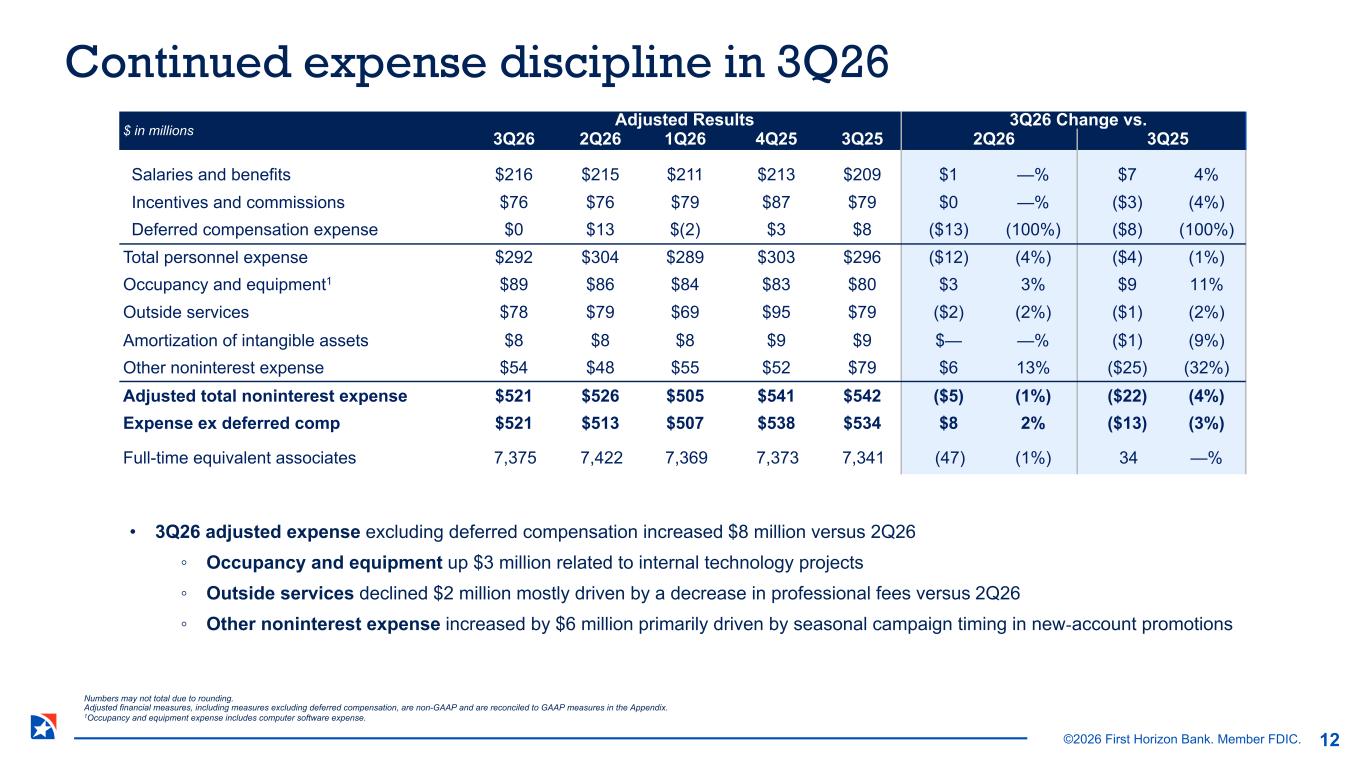
©2026 First Horizon Bank. Member FDIC. • 3Q26 adjusted expense excluding deferred compensation increased $8 million versus 2Q26 ◦ Occupancy and equipment up $3 million related to internal technology projects ◦ Outside services declined $2 million mostly driven by a decrease in professional fees versus 2Q26 ◦ Other noninterest expense increased by $6 million primarily driven by seasonal campaign timing in new‑account promotions $ in millions Adjusted Results 3Q26 Change vs. 3Q26 2Q26 1Q26 4Q25 3Q25 2Q26 3Q25 Salaries and benefits $216 $215 $211 $213 $209 $1 —% $7 4% Incentives and commissions $76 $76 $79 $87 $79 $0 —% ($3) (4%) Deferred compensation expense $0 $13 $(2) $3 $8 ($13) (100%) ($8) (100%) Total personnel expense $292 $304 $289 $303 $296 ($12) (4%) ($4) (1%) Occupancy and equipment1 $89 $86 $84 $83 $80 $3 3% $9 11% Outside services $78 $79 $69 $95 $79 ($2) (2%) ($1) (2%) Amortization of intangible assets $8 $8 $8 $9 $9 $— —% ($1) (9%) Other noninterest expense $54 $48 $55 $52 $79 $6 13% ($25) (32%) Adjusted total noninterest expense $521 $526 $505 $541 $542 ($5) (1%) ($22) (4%) Expense ex deferred comp $521 $513 $507 $538 $534 $8 2% ($13) (3%) Full-time equivalent associates 7,375 7,422 7,369 7,373 7,341 (47) (1%) 34 —% Continued expense discipline in 3Q26 Numbers may not total due to rounding. Adjusted financial measures, including measures excluding deferred compensation, are non-GAAP and are reconciled to GAAP measures in the Appendix. 1Occupancy and equipment expense includes computer software expense. 12
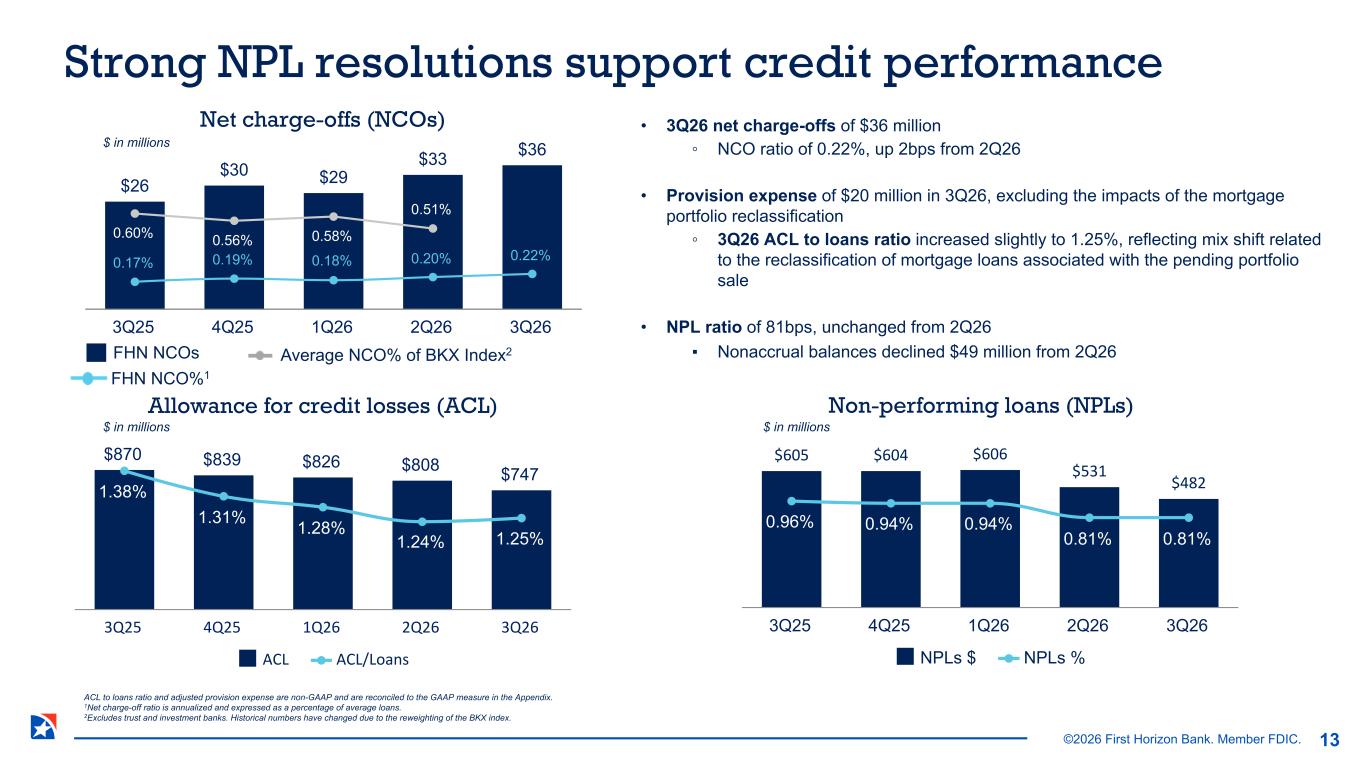
©2026 First Horizon Bank. Member FDIC. $26 $30 $29 $33 $36 0.17% 0.19% 0.18% 0.20% 0.22% 0.60% 0.56% 0.58% 0.51% 3Q25 4Q25 1Q26 2Q26 3Q26 Non-performing loans (NPLs)Allowance for credit losses (ACL) Net charge-offs (NCOs) FHN NCO%1 Average NCO% of BKX Index2FHN NCOs $870 $839 $826 $808 $747 1.38% 1.31% 1.28% 1.24% 1.25% ACL ACL/Loans 3Q25 4Q25 1Q26 2Q26 3Q26 $605 $604 $606 $531 $482 0.96% 0.94% 0.94% 0.81% 0.81% NPLs $ NPLs % 3Q25 4Q25 1Q26 2Q26 3Q26 • 3Q26 net charge-offs of $36 million ◦ NCO ratio of 0.22%, up 2bps from 2Q26 • Provision expense of $20 million in 3Q26, excluding the impacts of the mortgage portfolio reclassification ◦ 3Q26 ACL to loans ratio increased slightly to 1.25%, reflecting mix shift related to the reclassification of mortgage loans associated with the pending portfolio sale • NPL ratio of 81bps, unchanged from 2Q26 ▪ Nonaccrual balances declined $49 million from 2Q26 Strong NPL resolutions support credit performance 13 ACL to loans ratio and adjusted provision expense are non-GAAP and are reconciled to the GAAP measure in the Appendix. 1Net charge-off ratio is annualized and expressed as a percentage of average loans. 2Excludes trust and investment banks. Historical numbers have changed due to the reweighting of the BKX index. $ in millions $ in millions $ in millions
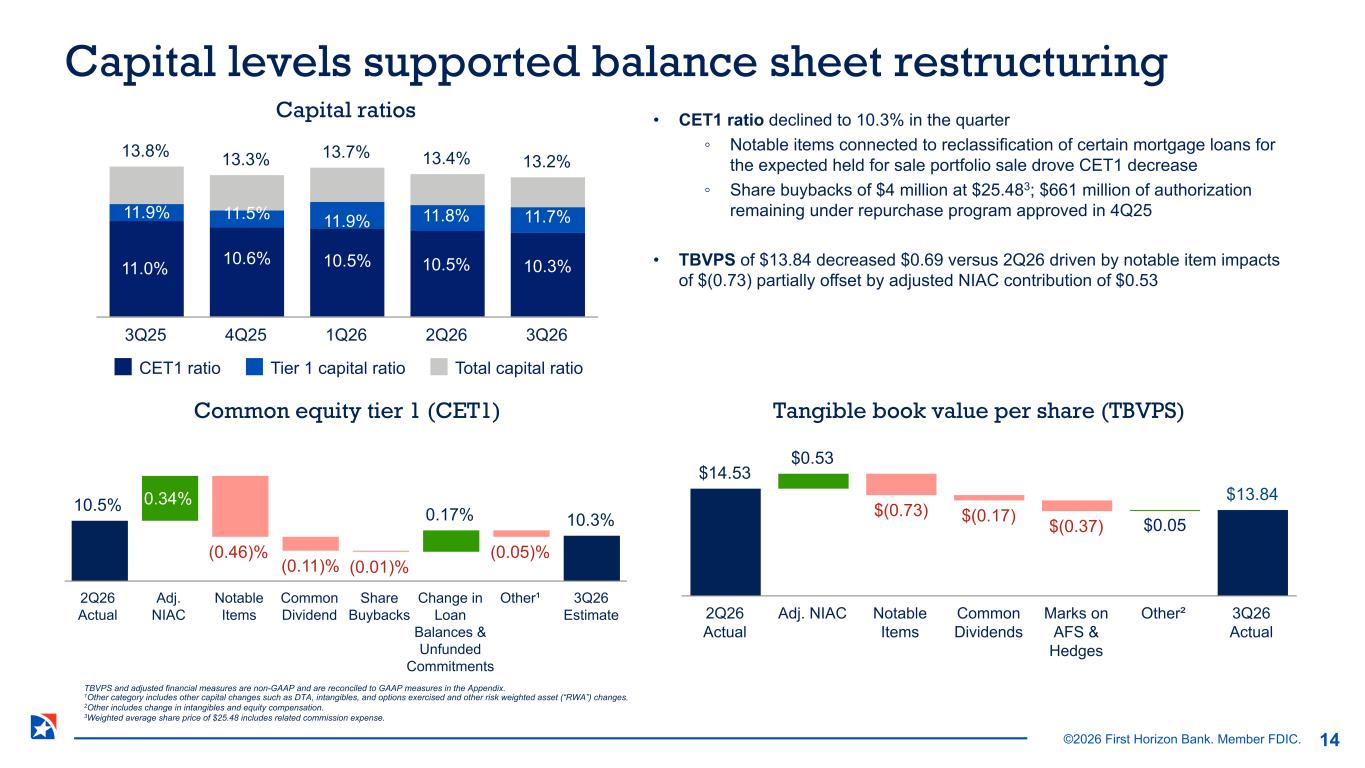
©2026 First Horizon Bank. Member FDIC. 10.5% 0.34% (0.46)% (0.11)% (0.01)% 0.17% (0.05)% 10.3% 2Q26 Actual Adj. NIAC Notable Items Common Dividend Share Buybacks Change in Loan Balances & Unfunded Commitments Other¹ 3Q26 Estimate • CET1 ratio declined to 10.3% in the quarter ◦ Notable items connected to reclassification of certain mortgage loans for the expected held for sale portfolio sale drove CET1 decrease ◦ Share buybacks of $4 million at $25.483; $661 million of authorization remaining under repurchase program approved in 4Q25 • TBVPS of $13.84 decreased $0.69 versus 2Q26 driven by notable item impacts of $(0.73) partially offset by adjusted NIAC contribution of $0.53 Capital ratios Common equity tier 1 (CET1) Tangible book value per share (TBVPS) 13.8% 13.3% 13.7% 13.4% 13.2% CET1 ratio Tier 1 capital ratio Total capital ratio 3Q25 4Q25 1Q26 2Q26 3Q26 $14.53 $0.53 $(0.73) $(0.17) $(0.37) $0.05 $13.84 2Q26 Actual Adj. NIAC Notable Items Common Dividends Marks on AFS & Hedges Other² 3Q26 Actual 11.0% 10.6% 10.5% 10.5% 10.3% 11.8%11.9%11.5%11.9% 11.7% Capital levels supported balance sheet restructuring 14 TBVPS and adjusted financial measures are non-GAAP and are reconciled to GAAP measures in the Appendix. 1Other category includes other capital changes such as DTA, intangibles, and options exercised and other risk weighted asset (“RWA”) changes. 2Other includes change in intangibles and equity compensation. 3Weighted average share price of $25.48 includes related commission expense.
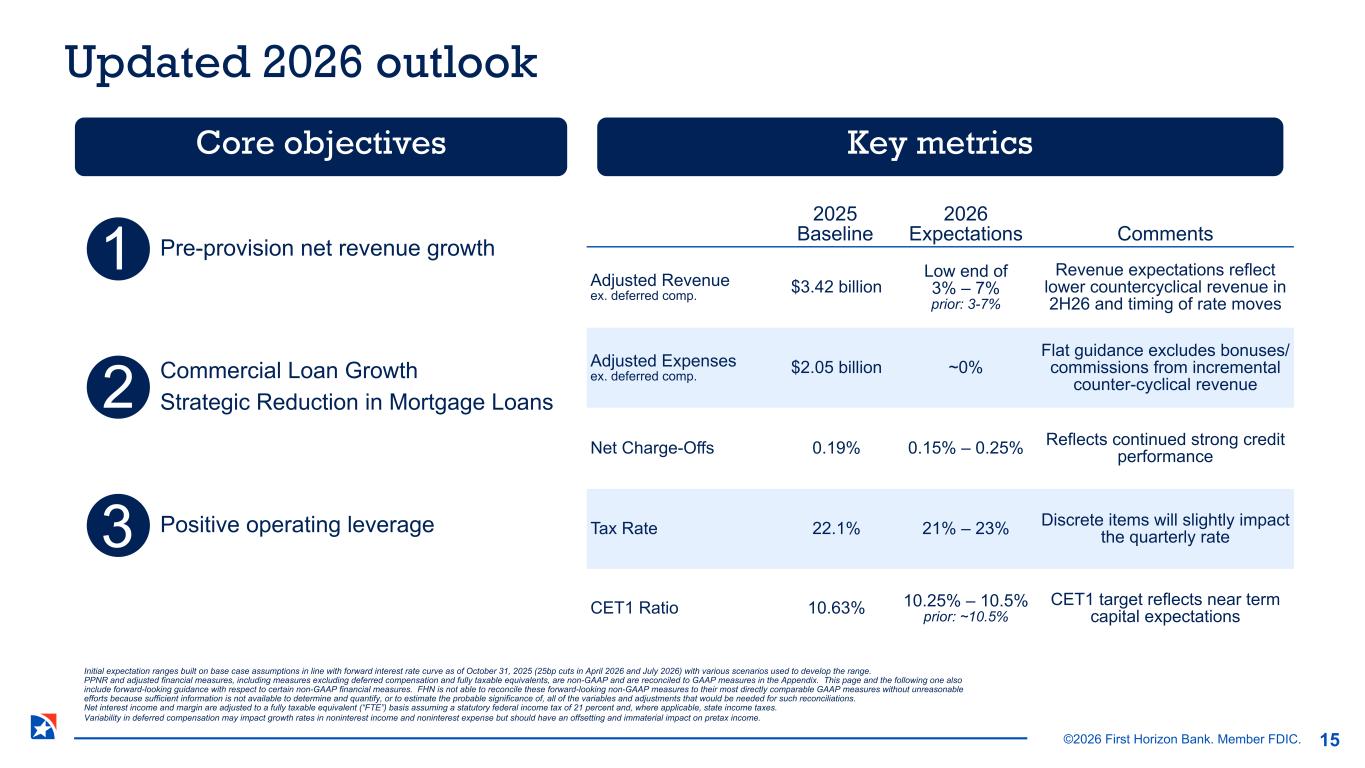
©2026 First Horizon Bank. Member FDIC. Core objectives Pre-provision net revenue growth1 Commercial Loan Growth Strategic Reduction in Mortgage Loans Positive operating leverage Key metrics 2025 Baseline 2026 Expectations Comments Adjusted Revenue ex. deferred comp. $3.42 billion Low end of 3% – 7% prior: 3-7% Revenue expectations reflect lower countercyclical revenue in 2H26 and timing of rate moves Adjusted Expenses ex. deferred comp. $2.05 billion ~0% Flat guidance excludes bonuses/ commissions from incremental counter-cyclical revenue Net Charge-Offs 0.19% 0.15% – 0.25% Reflects continued strong credit performance Tax Rate 22.1% 21% – 23% Discrete items will slightly impact the quarterly rate CET1 Ratio 10.63% 10.25% – 10.5% prior: ~10.5% CET1 target reflects near term capital expectations 2 3 Updated 2026 outlook 15 Initial expectation ranges built on base case assumptions in line with forward interest rate curve as of October 31, 2025 (25bp cuts in April 2026 and July 2026) with various scenarios used to develop the range. PPNR and adjusted financial measures, including measures excluding deferred compensation and fully taxable equivalents, are non-GAAP and are reconciled to GAAP measures in the Appendix. This page and the following one also include forward-looking guidance with respect to certain non-GAAP financial measures. FHN is not able to reconcile these forward-looking non-GAAP measures to their most directly comparable GAAP measures without unreasonable efforts because sufficient information is not available to determine and quantify, or to estimate the probable significance of, all of the variables and adjustments that would be needed for such reconciliations. Net interest income and margin are adjusted to a fully taxable equivalent (“FTE”) basis assuming a statutory federal income tax of 21 percent and, where applicable, state income taxes. Variability in deferred compensation may impact growth rates in noninterest income and noninterest expense but should have an offsetting and immaterial impact on pretax income.
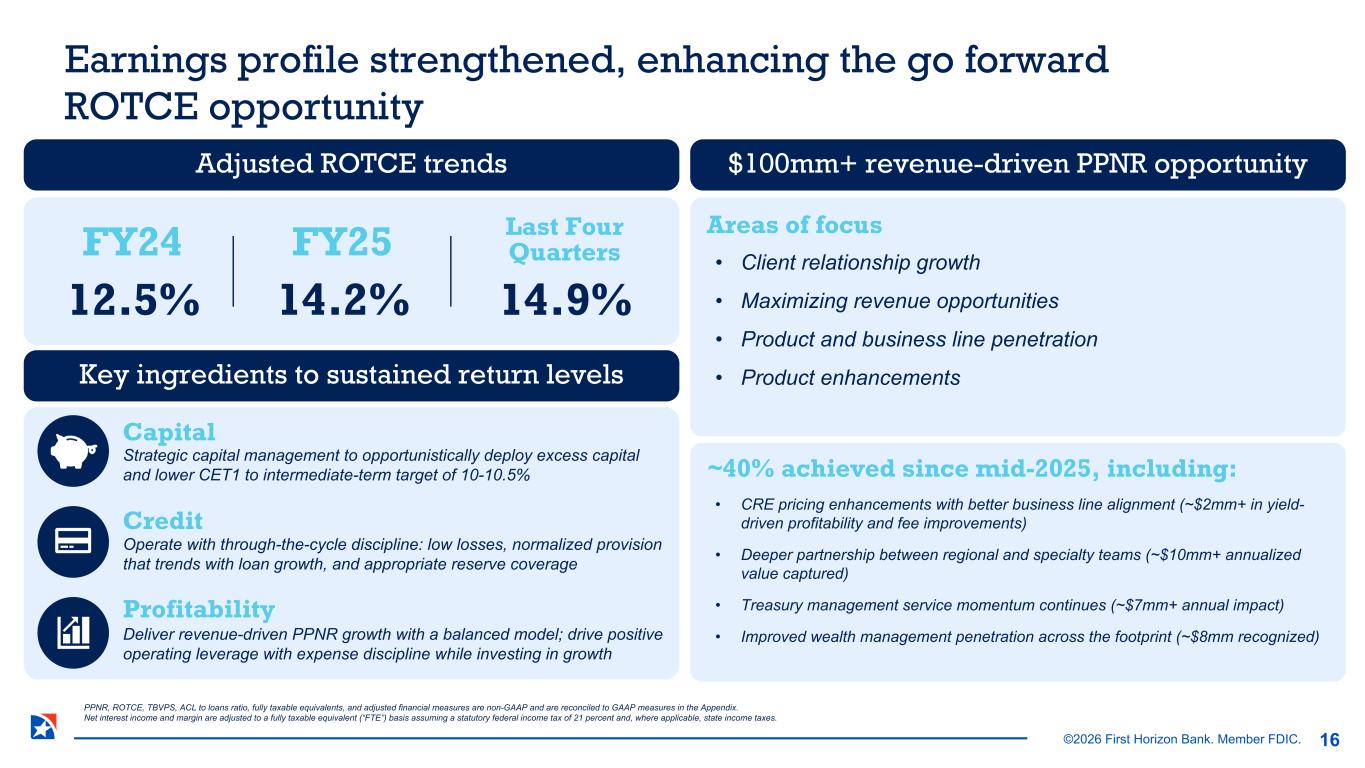
©2026 First Horizon Bank. Member FDIC. PPNR, ROTCE, TBVPS, ACL to loans ratio, fully taxable equivalents, and adjusted financial measures are non-GAAP and are reconciled to GAAP measures in the Appendix. Net interest income and margin are adjusted to a fully taxable equivalent (“FTE”) basis assuming a statutory federal income tax of 21 percent and, where applicable, state income taxes. Key ingredients to sustained return levels Adjusted ROTCE trends FY24 12.5% FY25 14.2% Last Four Quarters 14.9% Capital Credit Profitability Strategic capital management to opportunistically deploy excess capital and lower CET1 to intermediate-term target of 10-10.5% Operate with through-the-cycle discipline: low losses, normalized provision that trends with loan growth, and appropriate reserve coverage Deliver revenue-driven PPNR growth with a balanced model; drive positive operating leverage with expense discipline while investing in growth $100mm+ revenue-driven PPNR opportunity Areas of focus ~40% achieved since mid-2025, including: • Client relationship growth • Maximizing revenue opportunities • Product and business line penetration • Product enhancements • CRE pricing enhancements with better business line alignment (~$2mm+ in yield- driven profitability and fee improvements) • Deeper partnership between regional and specialty teams (~$10mm+ annualized value captured) • Treasury management service momentum continues (~$7mm+ annual impact) • Improved wealth management penetration across the footprint (~$8mm recognized) Earnings profile strengthened, enhancing the go forward ROTCE opportunity 16
©2026 First Horizon Bank. Member FDIC. Appendix

©2026 First Horizon Bank. Member FDIC. Variable 62% Fixed 30% ARMs 8% $59.8B Floors 60% Swaps 40% $5.0B Loan repricing profile3 Balance sheet hedges Modest interest rate sensitivity1,2 +100bps +4.6% -100bps -4.9% • Modestly asset-sensitive profile driven by 62% variable rate loan mix • Within the ARM portfolio, only 15% of loans will be in their variable period within the next year • Floors with strike prices between 1.25% and 2.5% and maturities ranging from late 2027 to early 2029 • Receive fixed swaps with fixed rates between 2.6% and 3.0% and maturities in 2027 and 2029 change in the next 12 months’ NII for an instantaneous, parallel shock on a static balance sheet Insured 55% Neither 37%8% $67.7B 63% of deposits insured or collateralized Collateralized • Commercial deposits of $41 billion or 60% and consumer deposits of $27 billion or 40% • Attractive lower-cost deposit base with 23% comprised of non-interest bearing products • Contingency funding plan equates to ~131% of uninsured or uncollateralized deposits Actively managing liquidity and interest rate sensitivity 18 1Estimate as of 9/30/2026. 2NII sensitivity assumes loan sale occurred on 9/30/2026 and proceeds were held in cash and short-term securities. 3Figures do not contain loans reclassified to loans held for sale.
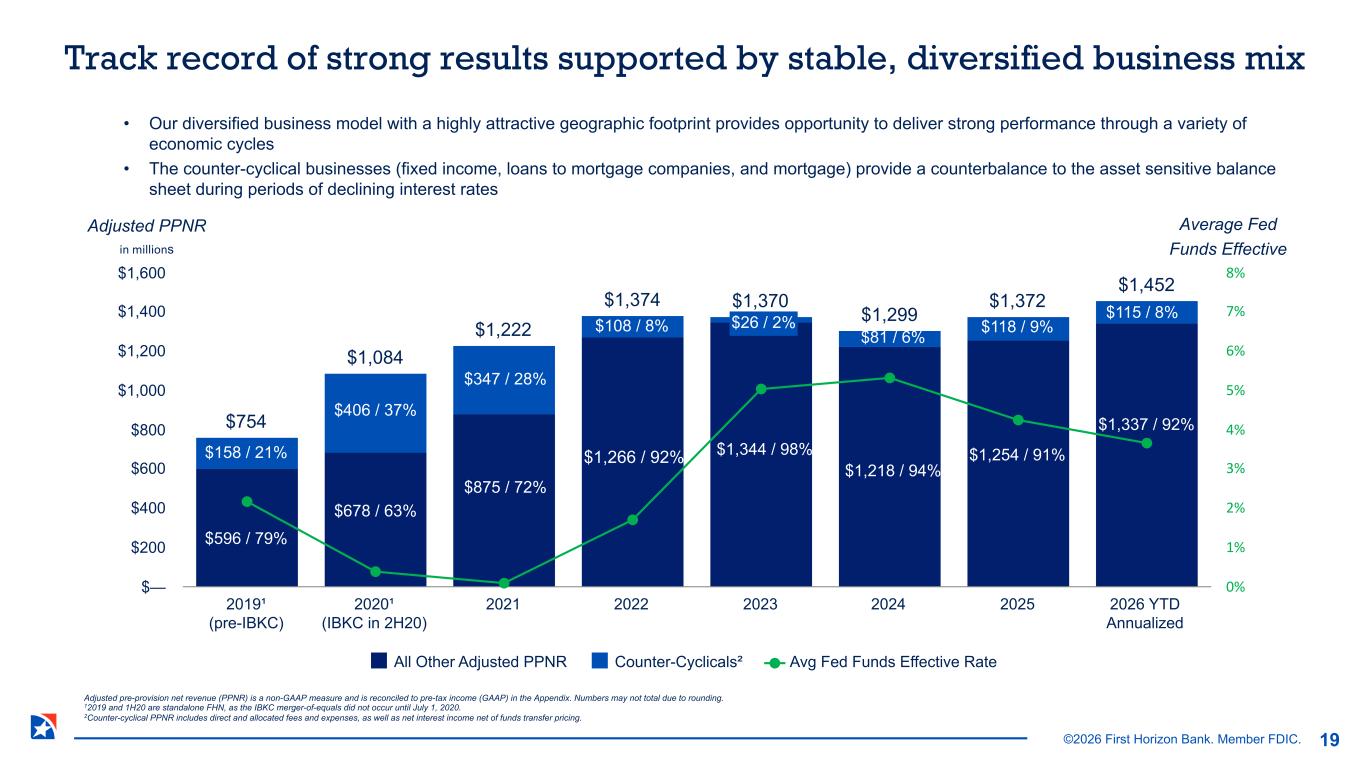
©2026 First Horizon Bank. Member FDIC. Average Fed Funds Effective • Our diversified business model with a highly attractive geographic footprint provides opportunity to deliver strong performance through a variety of economic cycles • The counter-cyclical businesses (fixed income, loans to mortgage companies, and mortgage) provide a counterbalance to the asset sensitive balance sheet during periods of declining interest rates $754 $1,084 $1,222 $1,374 $1,370 $1,299 $1,372 $1,452 All Other Adjusted PPNR Counter-Cyclicals² Avg Fed Funds Effective Rate 2019¹ (pre-IBKC) 2020¹ (IBKC in 2H20) 2021 2022 2023 2024 2025 2026 YTD Annualized $— $200 $400 $600 $800 $1,000 $1,200 $1,400 $1,600 0% 1% 2% 3% 4% 5% 6% 7% 8% $158 / 21% $406 / 37% $347 / 28% $81 / 6% $26 / 2% $108 / 8% $596 / 79% $678 / 63% $875 / 72% $1,266 / 92% $1,344 / 98% $1,218 / 94% Adjusted PPNR in millions $118 / 9% $1,254 / 91% Track record of strong results supported by stable, diversified business mix 19 Adjusted pre-provision net revenue (PPNR) is a non-GAAP measure and is reconciled to pre-tax income (GAAP) in the Appendix. Numbers may not total due to rounding. 12019 and 1H20 are standalone FHN, as the IBKC merger-of-equals did not occur until July 1, 2020. 2Counter-cyclical PPNR includes direct and allocated fees and expenses, as well as net interest income net of funds transfer pricing. $115 / 8% $1,337 / 92%
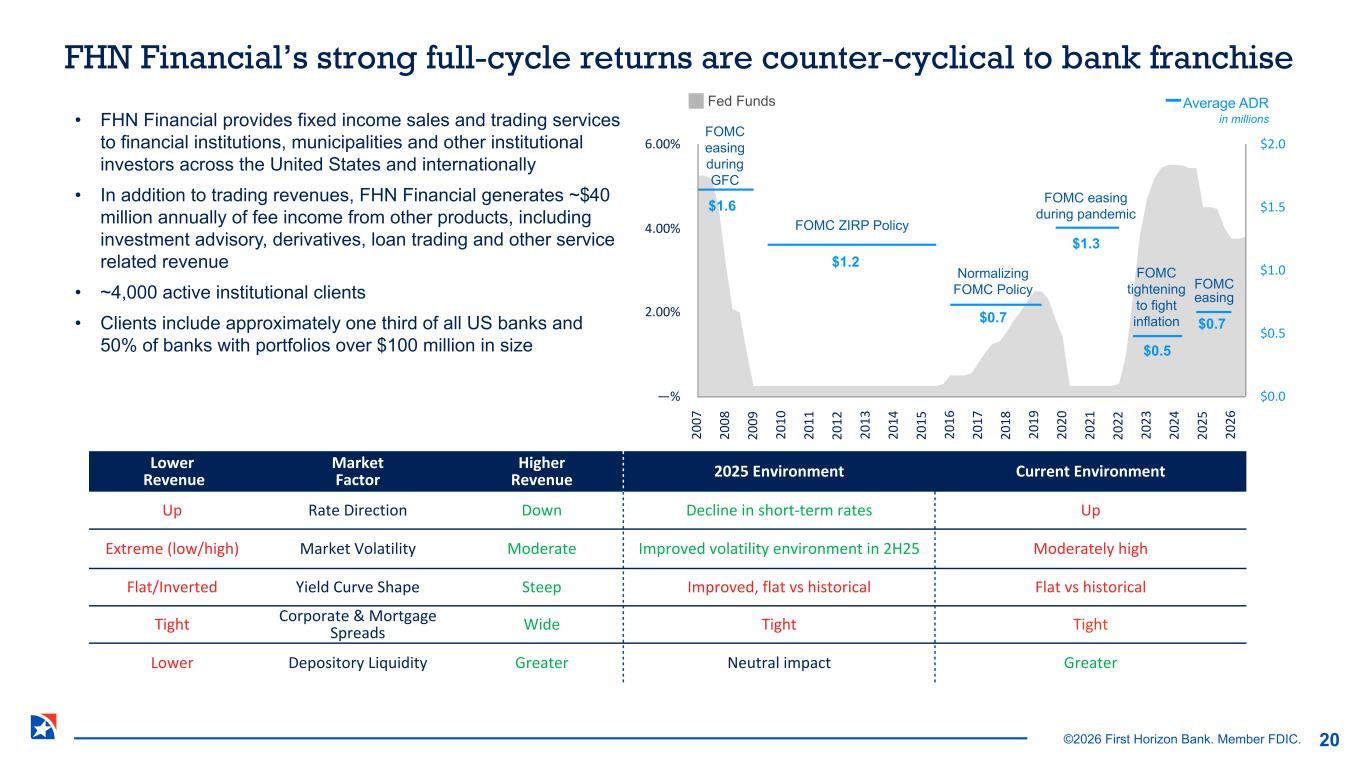
©2026 First Horizon Bank. Member FDIC. 20 07 20 08 20 09 20 10 20 11 20 12 20 13 20 14 20 15 20 16 20 17 20 18 20 19 20 20 20 21 20 22 20 23 20 24 20 25 20 26 —% 2.00% 4.00% 6.00% $0.0 $0.5 $1.0 $1.5 $2.0 Lower Revenue Market Factor Higher Revenue 2025 Environment Current Environment Up Rate Direction Down Decline in short-term rates Up Extreme (low/high) Market Volatility Moderate Improved volatility environment in 2H25 Moderately high Flat/Inverted Yield Curve Shape Steep Improved, flat vs historical Flat vs historical Tight Corporate & Mortgage Spreads Wide Tight Tight Lower Depository Liquidity Greater Neutral impact Greater • FHN Financial provides fixed income sales and trading services to financial institutions, municipalities and other institutional investors across the United States and internationally • In addition to trading revenues, FHN Financial generates ~$40 million annually of fee income from other products, including investment advisory, derivatives, loan trading and other service related revenue • ~4,000 active institutional clients • Clients include approximately one third of all US banks and 50% of banks with portfolios over $100 million in size FOMC easing during GFC FOMC ZIRP Policy Normalizing FOMC Policy FOMC easing during pandemic FOMC tightening to fight inflation Fed Funds Average ADR in millions $1.6 $1.2 $0.7 $1.3 $0.5 FOMC easing $0.7 20 FHN Financial’s strong full-cycle returns are counter-cyclical to bank franchise
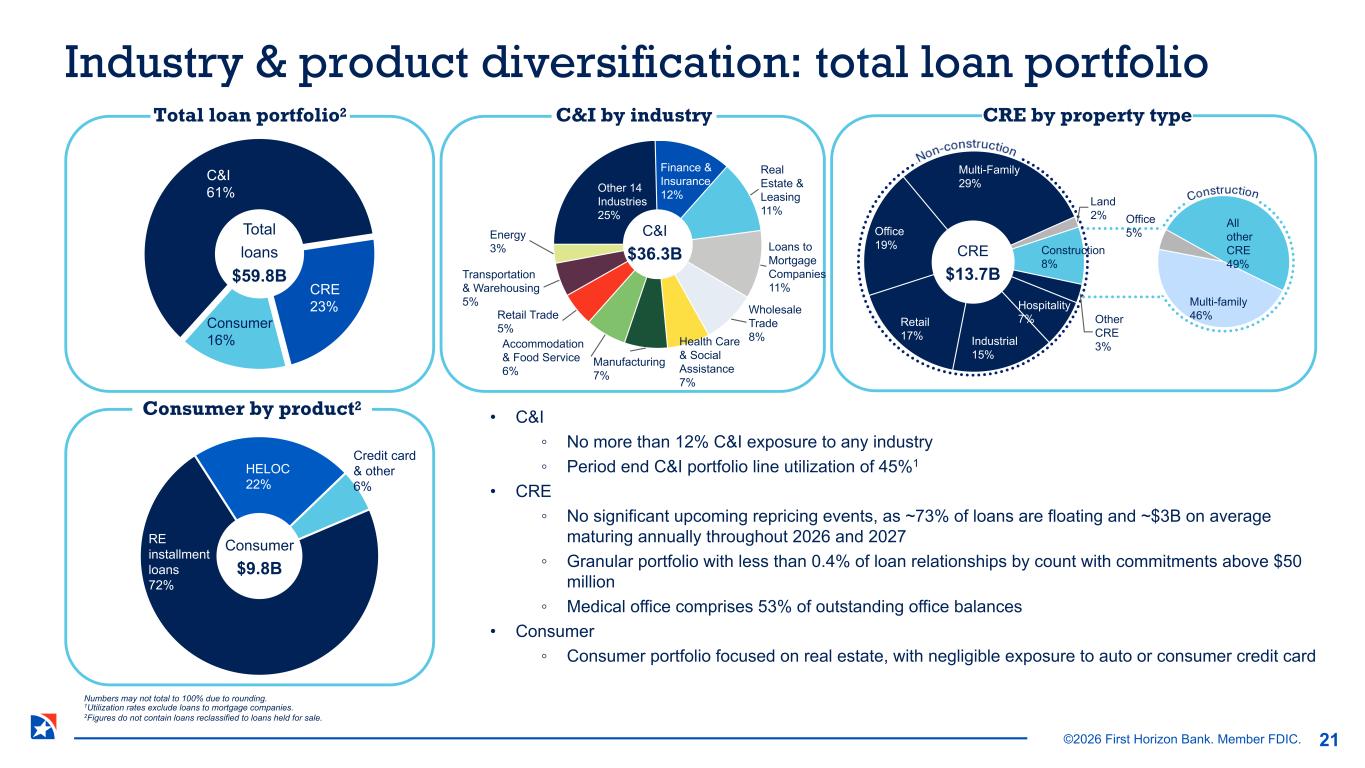
©2026 First Horizon Bank. Member FDIC. Other 14 Industries 25% Finance & Insurance 12% Real Estate & Leasing 11% Loans to Mortgage Companies 11% Wholesale Trade 8%Health Care & Social Assistance 7% Manufacturing 7% Accommodation & Food Service 6% Retail Trade 5% Transportation & Warehousing 5% Energy 3% Multi-family 46% Office 5% All other CRE 49% Total loan portfolio2 RE installment loans 72% HELOC 22% Credit card & other 6% Total loans $59.8B Consumer $9.8B C&I $36.3B Consumer by product2 CRE $13.7B • C&I ◦ No more than 12% C&I exposure to any industry ◦ Period end C&I portfolio line utilization of 45%1 • CRE ◦ No significant upcoming repricing events, as ~73% of loans are floating and ~$3B on average maturing annually throughout 2026 and 2027 ◦ Granular portfolio with less than 0.4% of loan relationships by count with commitments above $50 million ◦ Medical office comprises 53% of outstanding office balances • Consumer ◦ Consumer portfolio focused on real estate, with negligible exposure to auto or consumer credit card C&I by industry Land 2% Construction 8% Other CRE 3% Hospitality 7% Industrial 15% Retail 17% Office 19% Multi-Family 29% CRE by property type CRE $13.7B Industry & product diversification: total loan portfolio Numbers may not total to 100% due to rounding. 1Utilization rates exclude loans to mortgage companies. 2Figures do not contain loans reclassified to loans held for sale. 21 C&I 61% CRE 23% Consumer 16%
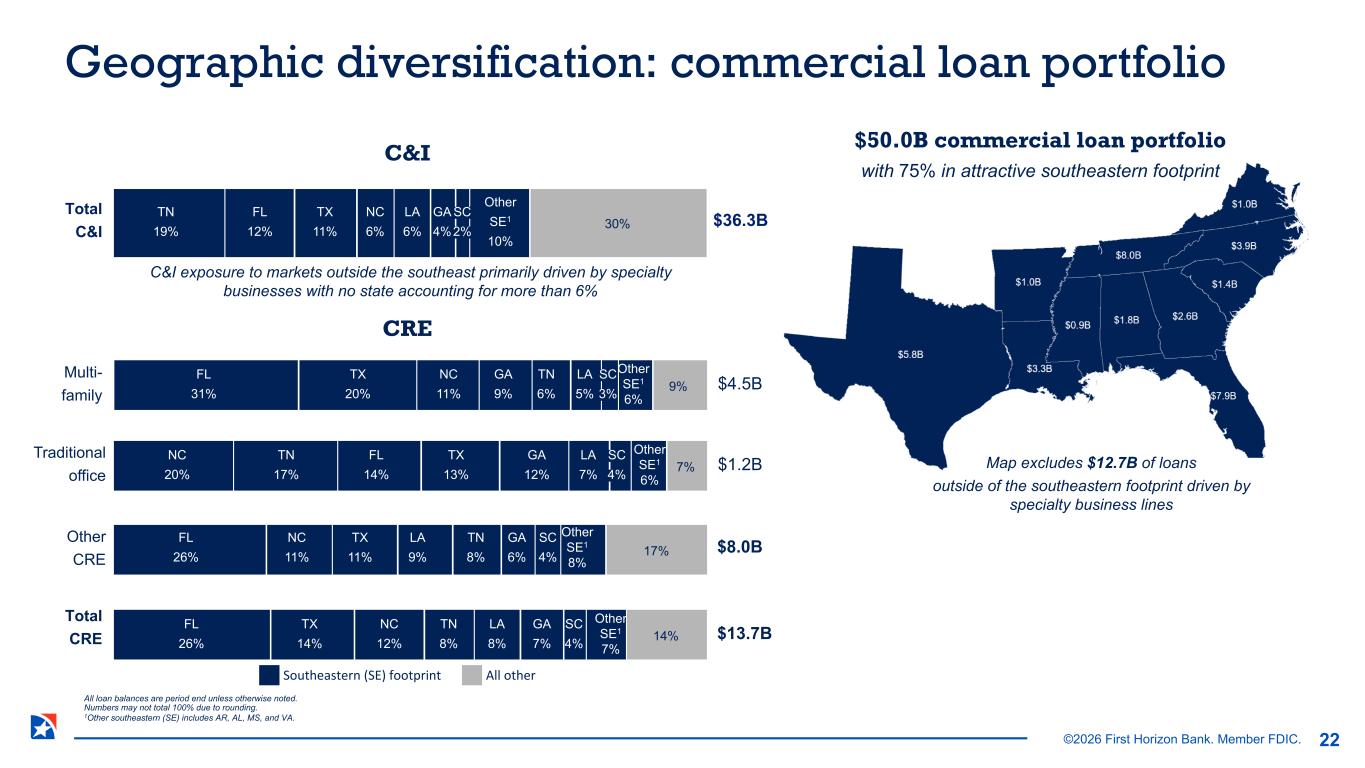
©2026 First Horizon Bank. Member FDIC. 30% $36.3B 9% FL 31% TX 20% GA 9% NC 11% TN 6% LA 5% Other SE1 6% 7% 17% 14% SC 3% Total C&I Multi- family Traditional office Other CRE Total CRE $4.5B $1.2B $8.0B $13.7B C&I C&I exposure to markets outside the southeast primarily driven by specialty businesses with no state accounting for more than 6% $50.0B commercial loan portfolio with 75% in attractive southeastern footprint Southeastern (SE) footprint All other TN 19% FL 12% TX 11% NC 6% LA 6% GA 4% SC 2% Other SE1 10% Geographic diversification: commercial loan portfolio All loan balances are period end unless otherwise noted. Numbers may not total 100% due to rounding. 1Other southeastern (SE) includes AR, AL, MS, and VA. 22 NC 20% FL 14% TN 17% GA 12% TX 13% Other SE1 6% LA 7% SC 4% FL 26% NC 11% LA 9% TN 8% TX 11% GA 6% SC 4% Other SE1 8% FL 26% TX 14% NC 12% TN 8% GA 7% LA 8% SC 4% Other SE1 7% CRE Map excludes $12.7B of loans outside of the southeastern footprint driven by specialty business lines

©2026 First Horizon Bank. Member FDIC. 3Q26 investment portfolio composition2 Steady principal cash flows3 Investment portfolio $0.3B $0.2B $0.2B $0.3B 4Q26 1Q27 2Q27 3Q27 Agency MBS 37% Agency CMBS 28% Agency CMO 14% U.S. Agencies & Treasury 18% States & Municipalities 3% $9.3B $9.3B $9.5B $9.2B $8.9B 3.09% 3.06% 3.02% 3.05% 3.10% Average AFS Securities Average HTM Securities Average Yield 3Q25 4Q25 1Q26 2Q26 3Q26 • 3Q26 investment portfolio represents ~11% of total assets ◦ Moderate total portfolio effective duration of 3.8 years ◦ Low reliance on the HTM designation at ~13% of total portfolio ◦ 97% U.S. government or agency-backed by GSEs • 3Q26 total unrealized losses on the AFS and HTM portfolios of $1.1B versus $0.9B in 2Q26 3Q25 4Q25 1Q26 2Q26 3Q26 % of total assets 11% 11% 11% 11% 11% Pre-tax unrealized losses ($0.9B) ($0.8B) ($0.8B) ($0.9B) ($1.1B) Effective duration (years) 4.2 3.9 3.7 3.8 3.8 Excess collateral ratio1 34% 26% 35% 33% 28% Investment portfolio prudently managed to support liquidity and IRR 23 1Unpledged securities and securities pledged in excess of collateral requirements divided by total securities. 2Calculated based on period end market values. 3Estimated as of 9/30/26; includes maturities and projected calls.
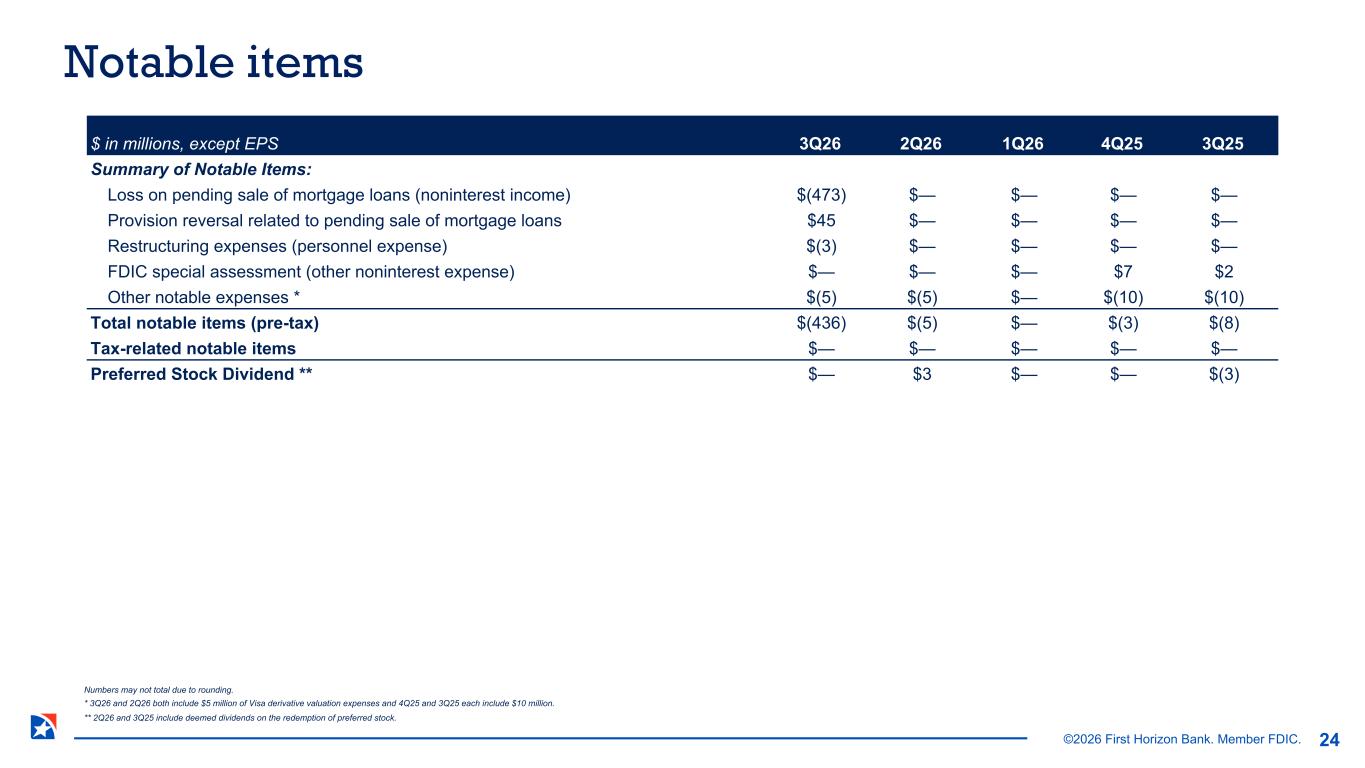
©2026 First Horizon Bank. Member FDIC. $ in millions, except EPS 3Q26 2Q26 1Q26 4Q25 3Q25 Summary of Notable Items: Loss on pending sale of mortgage loans (noninterest income) $(473) $— $— $— $— Provision reversal related to pending sale of mortgage loans $45 $— $— $— $— Restructuring expenses (personnel expense) $(3) $— $— $— $— FDIC special assessment (other noninterest expense) $— $— $— $7 $2 Other notable expenses * $(5) $(5) $— $(10) $(10) Total notable items (pre-tax) $(436) $(5) $— $(3) $(8) Tax-related notable items $— $— $— $— $— Preferred Stock Dividend ** $— $3 $— $— $(3) Notable items 24 Numbers may not total due to rounding. * 3Q26 and 2Q26 both include $5 million of Visa derivative valuation expenses and 4Q25 and 3Q25 each include $10 million. ** 2Q26 and 3Q25 include deemed dividends on the redemption of preferred stock.
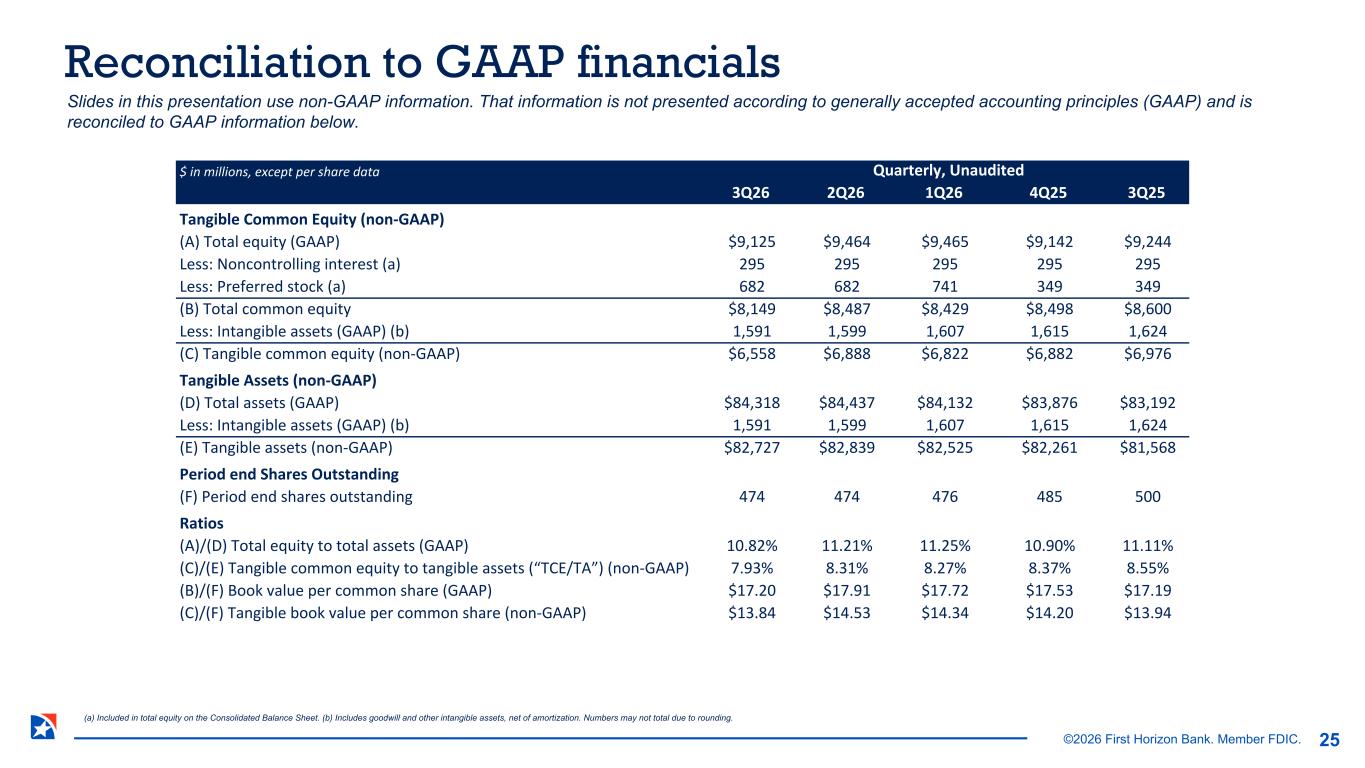
©2026 First Horizon Bank. Member FDIC. Slides in this presentation use non-GAAP information. That information is not presented according to generally accepted accounting principles (GAAP) and is reconciled to GAAP information below. $ in millions, except per share data Quarterly, Unaudited 3Q26 2Q26 1Q26 4Q25 3Q25 Tangible Common Equity (non-GAAP) (A) Total equity (GAAP) $9,125 $9,464 $9,465 $9,142 $9,244 Less: Noncontrolling interest (a) 295 295 295 295 295 Less: Preferred stock (a) 682 682 741 349 349 (B) Total common equity $8,149 $8,487 $8,429 $8,498 $8,600 Less: Intangible assets (GAAP) (b) 1,591 1,599 1,607 1,615 1,624 (C) Tangible common equity (non-GAAP) $6,558 $6,888 $6,822 $6,882 $6,976 Tangible Assets (non-GAAP) (D) Total assets (GAAP) $84,318 $84,437 $84,132 $83,876 $83,192 Less: Intangible assets (GAAP) (b) 1,591 1,599 1,607 1,615 1,624 (E) Tangible assets (non-GAAP) $82,727 $82,839 $82,525 $82,261 $81,568 Period end Shares Outstanding (F) Period end shares outstanding 474 474 476 485 500 Ratios (A)/(D) Total equity to total assets (GAAP) 10.82% 11.21% 11.25% 10.90% 11.11% (C)/(E) Tangible common equity to tangible assets (“TCE/TA”) (non-GAAP) 7.93% 8.31% 8.27% 8.37% 8.55% (B)/(F) Book value per common share (GAAP) $17.20 $17.91 $17.72 $17.53 $17.19 (C)/(F) Tangible book value per common share (non-GAAP) $13.84 $14.53 $14.34 $14.20 $13.94 Reconciliation to GAAP financials (a) Included in total equity on the Consolidated Balance Sheet. (b) Includes goodwill and other intangible assets, net of amortization. Numbers may not total due to rounding. 25
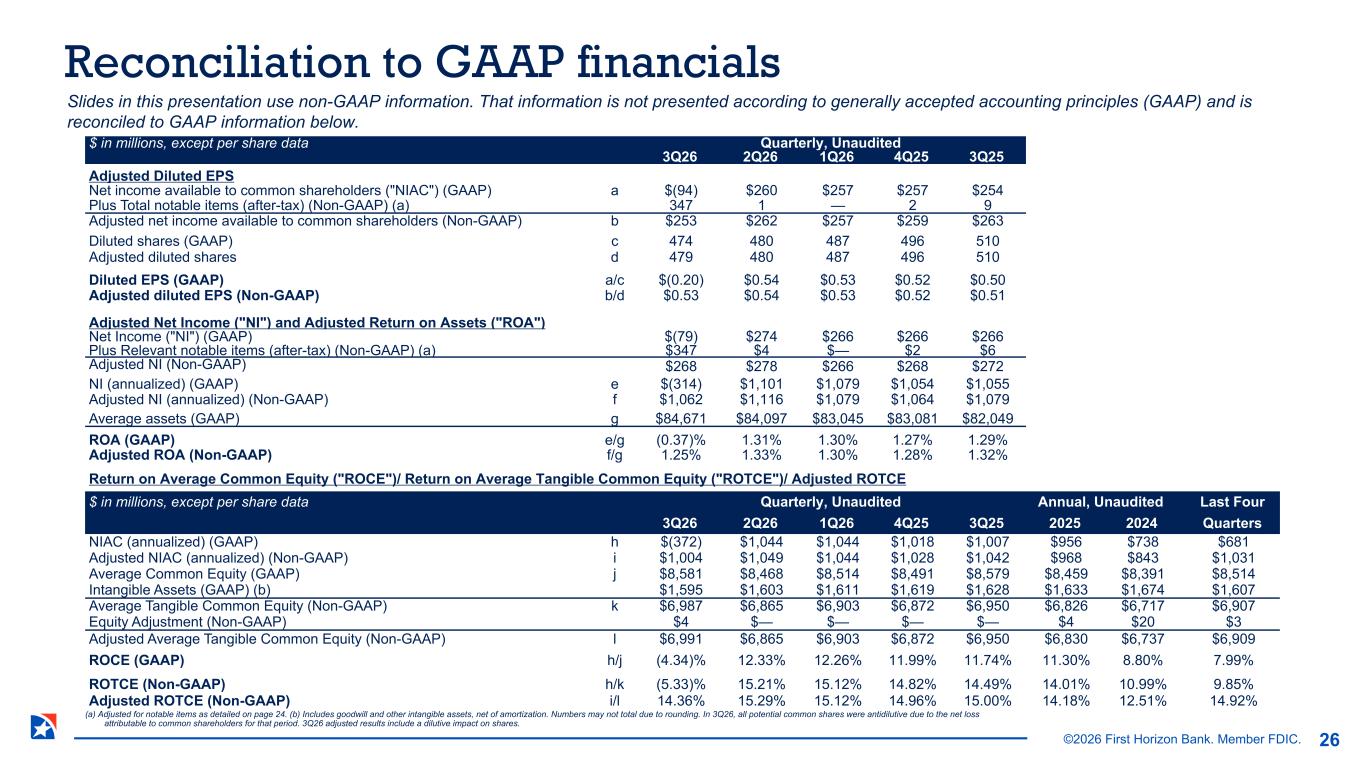
©2026 First Horizon Bank. Member FDIC. $ in millions, except per share data Quarterly, Unaudited 3Q26 2Q26 1Q26 4Q25 3Q25 Adjusted Diluted EPS Net income available to common shareholders ("NIAC") (GAAP) a $(94) $260 $257 $257 $254 Plus Total notable items (after-tax) (Non-GAAP) (a) 347 1 — 2 9 Adjusted net income available to common shareholders (Non-GAAP) b $253 $262 $257 $259 $263 Diluted shares (GAAP) c 474 480 487 496 510 Adjusted diluted shares d 479 480 487 496 510 Diluted EPS (GAAP) a/c $(0.20) $0.54 $0.53 $0.52 $0.50 Adjusted diluted EPS (Non-GAAP) b/d $0.53 $0.54 $0.53 $0.52 $0.51 Adjusted Net Income ("NI") and Adjusted Return on Assets ("ROA") Net Income ("NI") (GAAP) $(79) $274 $266 $266 $266 Plus Relevant notable items (after-tax) (Non-GAAP) (a) $347 $4 $— $2 $6 Adjusted NI (Non-GAAP) $268 $278 $266 $268 $272 NI (annualized) (GAAP) e $(314) $1,101 $1,079 $1,054 $1,055 Adjusted NI (annualized) (Non-GAAP) f $1,062 $1,116 $1,079 $1,064 $1,079 Average assets (GAAP) g $84,671 $84,097 $83,045 $83,081 $82,049 ROA (GAAP) e/g (0.37)% 1.31% 1.30% 1.27% 1.29% Adjusted ROA (Non-GAAP) f/g 1.25% 1.33% 1.30% 1.28% 1.32% Return on Average Common Equity ("ROCE")/ Return on Average Tangible Common Equity ("ROTCE")/ Adjusted ROTCE $ in millions, except per share data Quarterly, Unaudited Annual, Unaudited Last Four 3Q26 2Q26 1Q26 4Q25 3Q25 2025 2024 Quarters NIAC (annualized) (GAAP) h $(372) $1,044 $1,044 $1,018 $1,007 $956 $738 $681 Adjusted NIAC (annualized) (Non-GAAP) i $1,004 $1,049 $1,044 $1,028 $1,042 $968 $843 $1,031 Average Common Equity (GAAP) j $8,581 $8,468 $8,514 $8,491 $8,579 $8,459 $8,391 $8,514 Intangible Assets (GAAP) (b) $1,595 $1,603 $1,611 $1,619 $1,628 $1,633 $1,674 $1,607 Average Tangible Common Equity (Non-GAAP) k $6,987 $6,865 $6,903 $6,872 $6,950 $6,826 $6,717 $6,907 Equity Adjustment (Non-GAAP) $4 $— $— $— $— $4 $20 $3 Adjusted Average Tangible Common Equity (Non-GAAP) l $6,991 $6,865 $6,903 $6,872 $6,950 $6,830 $6,737 $6,909 ROCE (GAAP) h/j (4.34)% 12.33% 12.26% 11.99% 11.74% 11.30% 8.80% 7.99% ROTCE (Non-GAAP) h/k (5.33)% 15.21% 15.12% 14.82% 14.49% 14.01% 10.99% 9.85% Adjusted ROTCE (Non-GAAP) i/l 14.36% 15.29% 15.12% 14.96% 15.00% 14.18% 12.51% 14.92% Slides in this presentation use non-GAAP information. That information is not presented according to generally accepted accounting principles (GAAP) and is reconciled to GAAP information below. Reconciliation to GAAP financials 26 (a) Adjusted for notable items as detailed on page 24. (b) Includes goodwill and other intangible assets, net of amortization. Numbers may not total due to rounding. In 3Q26, all potential common shares were antidilutive due to the net loss attributable to common shareholders for that period. 3Q26 adjusted results include a dilutive impact on shares.
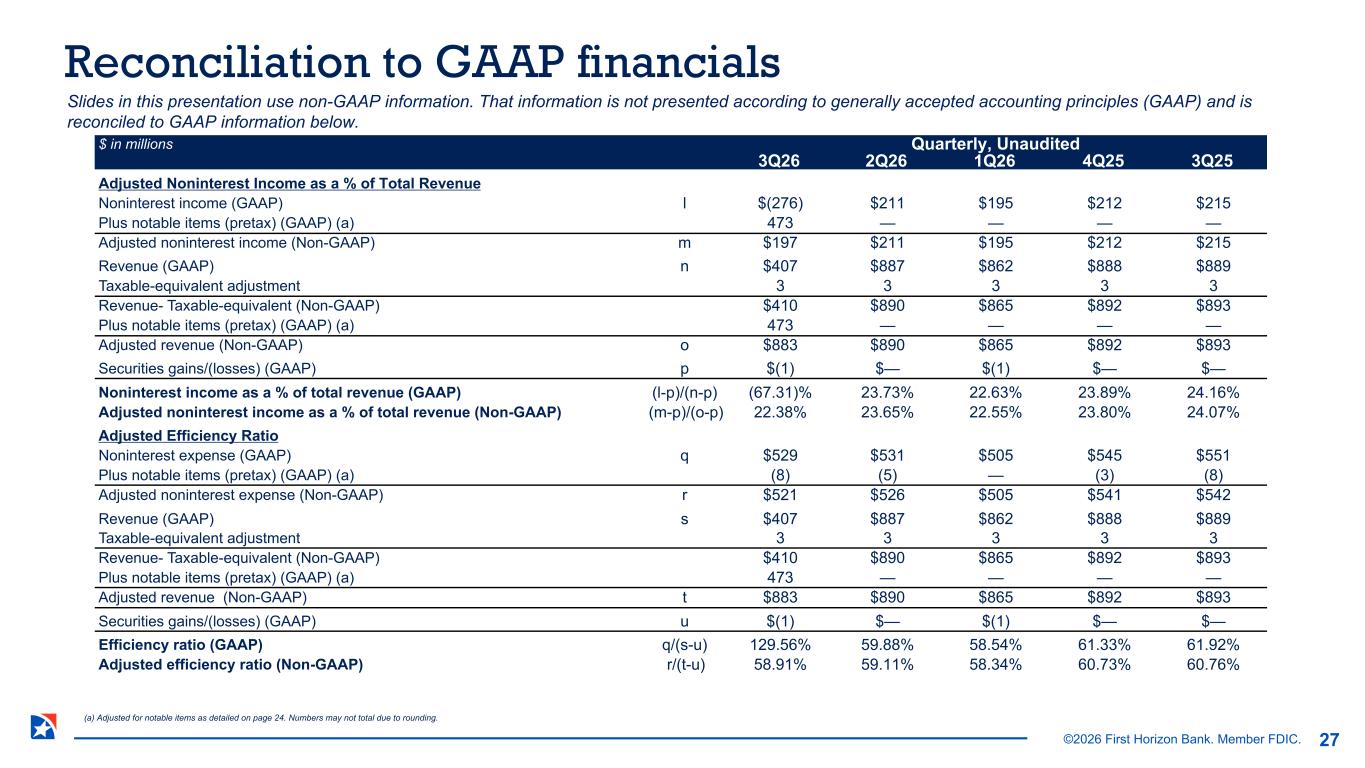
©2026 First Horizon Bank. Member FDIC. $ in millions Quarterly, Unaudited 3Q26 2Q26 1Q26 4Q25 3Q25 Adjusted Noninterest Income as a % of Total Revenue Noninterest income (GAAP) l $(276) $211 $195 $212 $215 Plus notable items (pretax) (GAAP) (a) 473 — — — — Adjusted noninterest income (Non-GAAP) m $197 $211 $195 $212 $215 Revenue (GAAP) n $407 $887 $862 $888 $889 Taxable-equivalent adjustment 3 3 3 3 3 Revenue- Taxable-equivalent (Non-GAAP) $410 $890 $865 $892 $893 Plus notable items (pretax) (GAAP) (a) 473 — — — — Adjusted revenue (Non-GAAP) o $883 $890 $865 $892 $893 Securities gains/(losses) (GAAP) p $(1) $— $(1) $— $— Noninterest income as a % of total revenue (GAAP) (l-p)/(n-p) (67.31)% 23.73% 22.63% 23.89% 24.16% Adjusted noninterest income as a % of total revenue (Non-GAAP) (m-p)/(o-p) 22.38% 23.65% 22.55% 23.80% 24.07% Adjusted Efficiency Ratio Noninterest expense (GAAP) q $529 $531 $505 $545 $551 Plus notable items (pretax) (GAAP) (a) (8) (5) — (3) (8) Adjusted noninterest expense (Non-GAAP) r $521 $526 $505 $541 $542 Revenue (GAAP) s $407 $887 $862 $888 $889 Taxable-equivalent adjustment 3 3 3 3 3 Revenue- Taxable-equivalent (Non-GAAP) $410 $890 $865 $892 $893 Plus notable items (pretax) (GAAP) (a) 473 — — — — Adjusted revenue (Non-GAAP) t $883 $890 $865 $892 $893 Securities gains/(losses) (GAAP) u $(1) $— $(1) $— $— Efficiency ratio (GAAP) q/(s-u) 129.56% 59.88% 58.54% 61.33% 61.92% Adjusted efficiency ratio (Non-GAAP) r/(t-u) 58.91% 59.11% 58.34% 60.73% 60.76% Slides in this presentation use non-GAAP information. That information is not presented according to generally accepted accounting principles (GAAP) and is reconciled to GAAP information below. Reconciliation to GAAP financials (a) Adjusted for notable items as detailed on page 24. Numbers may not total due to rounding. 27
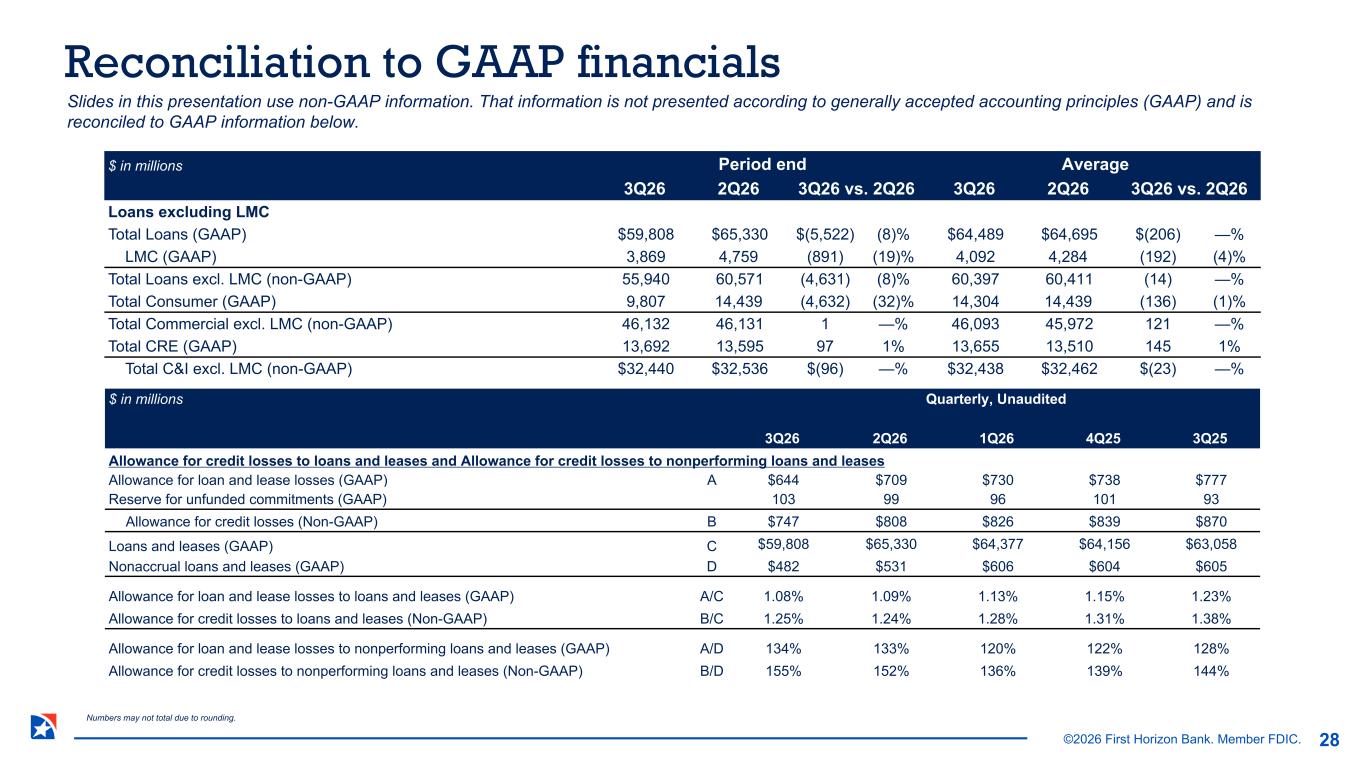
©2026 First Horizon Bank. Member FDIC. $ in millions Period end Average 3Q26 2Q26 3Q26 vs. 2Q26 3Q26 2Q26 3Q26 vs. 2Q26 Loans excluding LMC Total Loans (GAAP) $59,808 $65,330 $(5,522) (8)% $64,489 $64,695 $(206) —% LMC (GAAP) 3,869 4,759 (891) (19)% 4,092 4,284 (192) (4)% Total Loans excl. LMC (non-GAAP) 55,940 60,571 (4,631) (8)% 60,397 60,411 (14) —% Total Consumer (GAAP) 9,807 14,439 (4,632) (32)% 14,304 14,439 (136) (1)% Total Commercial excl. LMC (non-GAAP) 46,132 46,131 1 —% 46,093 45,972 121 —% Total CRE (GAAP) 13,692 13,595 97 1% 13,655 13,510 145 1% Total C&I excl. LMC (non-GAAP) $32,440 $32,536 $(96) —% $32,438 $32,462 $(23) —% $ in millions Quarterly, Unaudited 3Q26 2Q26 1Q26 4Q25 3Q25 Allowance for credit losses to loans and leases and Allowance for credit losses to nonperforming loans and leases Allowance for loan and lease losses (GAAP) A $644 $709 $730 $738 $777 Reserve for unfunded commitments (GAAP) 103 99 96 101 93 Allowance for credit losses (Non-GAAP) B $747 $808 $826 $839 $870 Loans and leases (GAAP) C $59,808 $65,330 $64,377 $64,156 $63,058 Nonaccrual loans and leases (GAAP) D $482 $531 $606 $604 $605 Allowance for loan and lease losses to loans and leases (GAAP) A/C 1.08% 1.09% 1.13% 1.15% 1.23% Allowance for credit losses to loans and leases (Non-GAAP) B/C 1.25% 1.24% 1.28% 1.31% 1.38% Allowance for loan and lease losses to nonperforming loans and leases (GAAP) A/D 134% 133% 120% 122% 128% Allowance for credit losses to nonperforming loans and leases (Non-GAAP) B/D 155% 152% 136% 139% 144% Slides in this presentation use non-GAAP information. That information is not presented according to generally accepted accounting principles (GAAP) and is reconciled to GAAP information below. Reconciliation to GAAP financials 28 Numbers may not total due to rounding.

©2026 First Horizon Bank. Member FDIC. $ in millions Quarterly, Unaudited 3Q26 2Q26 1Q26 4Q25 3Q25 Adjusted noninterest income excluding deferred compensation income Noninterest income (GAAP) $(276) $211 $195 $212 $215 Plus notable items (pretax) (GAAP) (a) 473 — — — — Adjusted noninterest income (non-GAAP) $197 $211 $195 $212 $215 Less adjusted deferred compensation income (GAAP) (2) 15 (3) 3 8 Adjusted noninterest income excluding deferred compensation income (non-GAAP) $198 $196 $197 $209 $207 Adjusted revenue excluding deferred compensation income Revenue (GAAP) $407 $887 $862 $888 $889 Taxable-equivalent adjustment 3 3 3 3 3 Revenue- Taxable-equivalent (non-GAAP) $410 $890 $865 $892 $893 Plus notable items (pretax) (GAAP) (a) 473 — — — — Adjusted revenue (non-GAAP) $883 $890 $865 $892 $893 Less adjusted deferred compensation income (GAAP) (2) 15 (3) 3 8 Adjusted revenue excluding adjusted deferred compensation income (non-GAAP) $884 $875 $868 $889 $884 Adjusted noninterest expense excluding deferred compensation expense Noninterest expense (GAAP) $529 $531 $505 $545 $551 Plus notable items (pretax) (GAAP) (a) (8) (5) — (3) (8) Adjusted noninterest expense (non-GAAP) $521 $526 $505 $541 $542 Less adjusted deferred compensation expense (GAAP) — 13 (2) 3 8 Adjusted noninterest expense excluding deferred compensation expense (non-GAAP) $521 $513 $507 $538 $534 Adjusted personnel expense excluding deferred compensation expense Personnel expense (GAAP) $295 $304 $289 $303 $296 Plus notable items (pretax) (GAAP) (a) (3) — — — — Adjusted personnel expense (non-GAAP) $292 $304 $289 $303 $296 Less adjusted deferred compensation expense (GAAP) — 13 (2) 3 8 Adjusted personnel expense excluding deferred compensation expense (non-GAAP) $292 $291 $290 $300 $288 Slides in this presentation use non-GAAP information. That information is not presented according to generally accepted accounting principles (GAAP) and is reconciled to GAAP information below. Reconciliation to GAAP financials (a) Adjusted for notable items as detailed on page 24. Numbers may not total due to rounding. 29
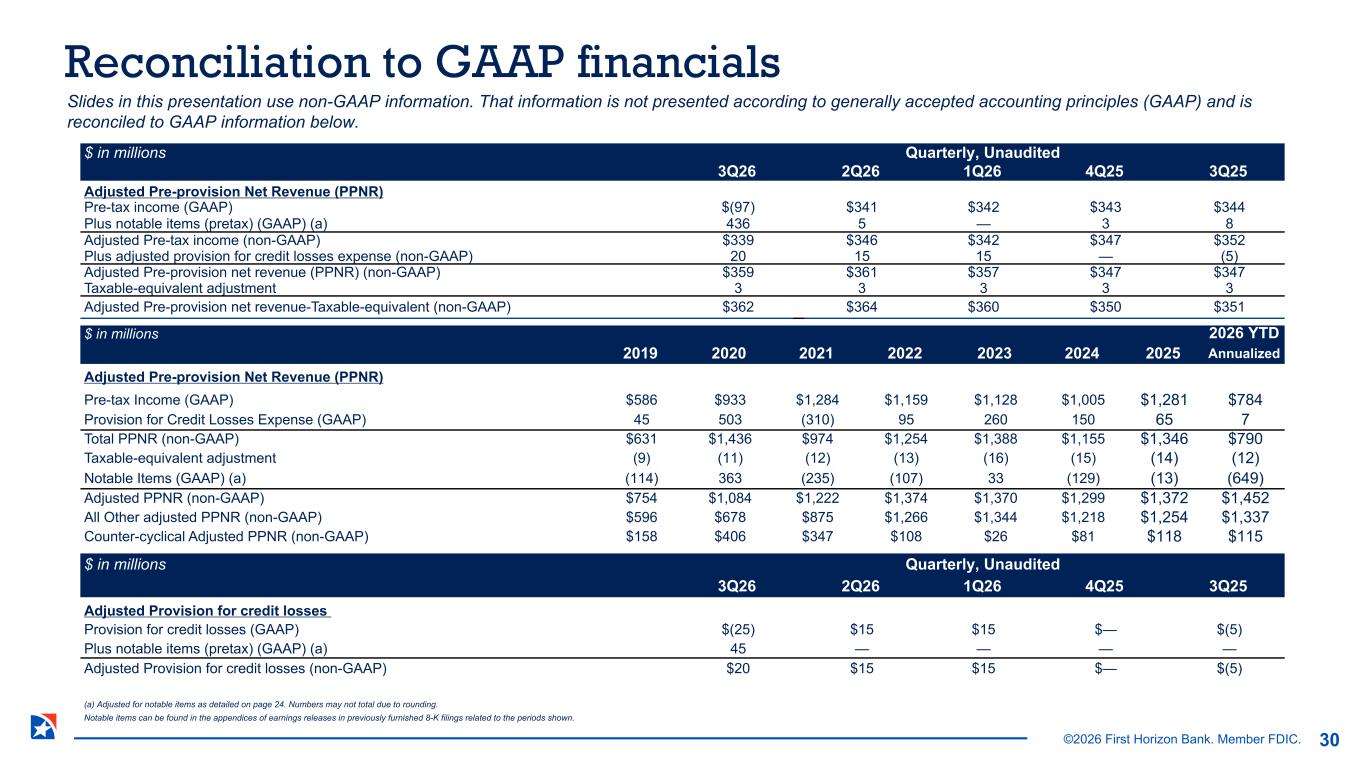
©2026 First Horizon Bank. Member FDIC. $ in millions Quarterly, Unaudited 3Q26 2Q26 1Q26 4Q25 3Q25 Adjusted Pre-provision Net Revenue (PPNR) Pre-tax income (GAAP) $(97) $341 $342 $343 $344 Plus notable items (pretax) (GAAP) (a) 436 5 — 3 8 Adjusted Pre-tax income (non-GAAP) $339 $346 $342 $347 $352 Plus adjusted provision for credit losses expense (non-GAAP) 20 15 15 — (5) Adjusted Pre-provision net revenue (PPNR) (non-GAAP) $359 $361 $357 $347 $347 Taxable-equivalent adjustment 3 3 3 3 3 Adjusted Pre-provision net revenue-Taxable-equivalent (non-GAAP) $362 $364 $360 $350 $351 $ in millions 2024 2025 2026 YTD 2019 2020 2021 2022 2023 Annualized Adjusted Pre-provision Net Revenue (PPNR) Pre-tax Income (GAAP) $586 $933 $1,284 $1,159 $1,128 $1,005 $1,281 $784 Provision for Credit Losses Expense (GAAP) 45 503 (310) 95 260 150 65 7 Total PPNR (non-GAAP) $631 $1,436 $974 $1,254 $1,388 $1,155 $1,346 $790 Taxable-equivalent adjustment (9) (11) (12) (13) (16) (15) (14) (12) Notable Items (GAAP) (a) (114) 363 (235) (107) 33 (129) (13) (649) Adjusted PPNR (non-GAAP) $754 $1,084 $1,222 $1,374 $1,370 $1,299 $1,372 $1,452 All Other adjusted PPNR (non-GAAP) $596 $678 $875 $1,266 $1,344 $1,218 $1,254 $1,337 Counter-cyclical Adjusted PPNR (non-GAAP) $158 $406 $347 $108 $26 $81 $118 $115 Slides in this presentation use non-GAAP information. That information is not presented according to generally accepted accounting principles (GAAP) and is reconciled to GAAP information below. Reconciliation to GAAP financials (a) Adjusted for notable items as detailed on page 24. Numbers may not total due to rounding. Notable items can be found in the appendices of earnings releases in previously furnished 8-K filings related to the periods shown. 30 $ in millions Quarterly, Unaudited 3Q26 2Q26 1Q26 4Q25 3Q25 Adjusted Provision for credit losses Provision for credit losses (GAAP) $(25) $15 $15 $— $(5) Plus notable items (pretax) (GAAP) (a) 45 — — — — Adjusted Provision for credit losses (non-GAAP) $20 $15 $15 $— $(5)
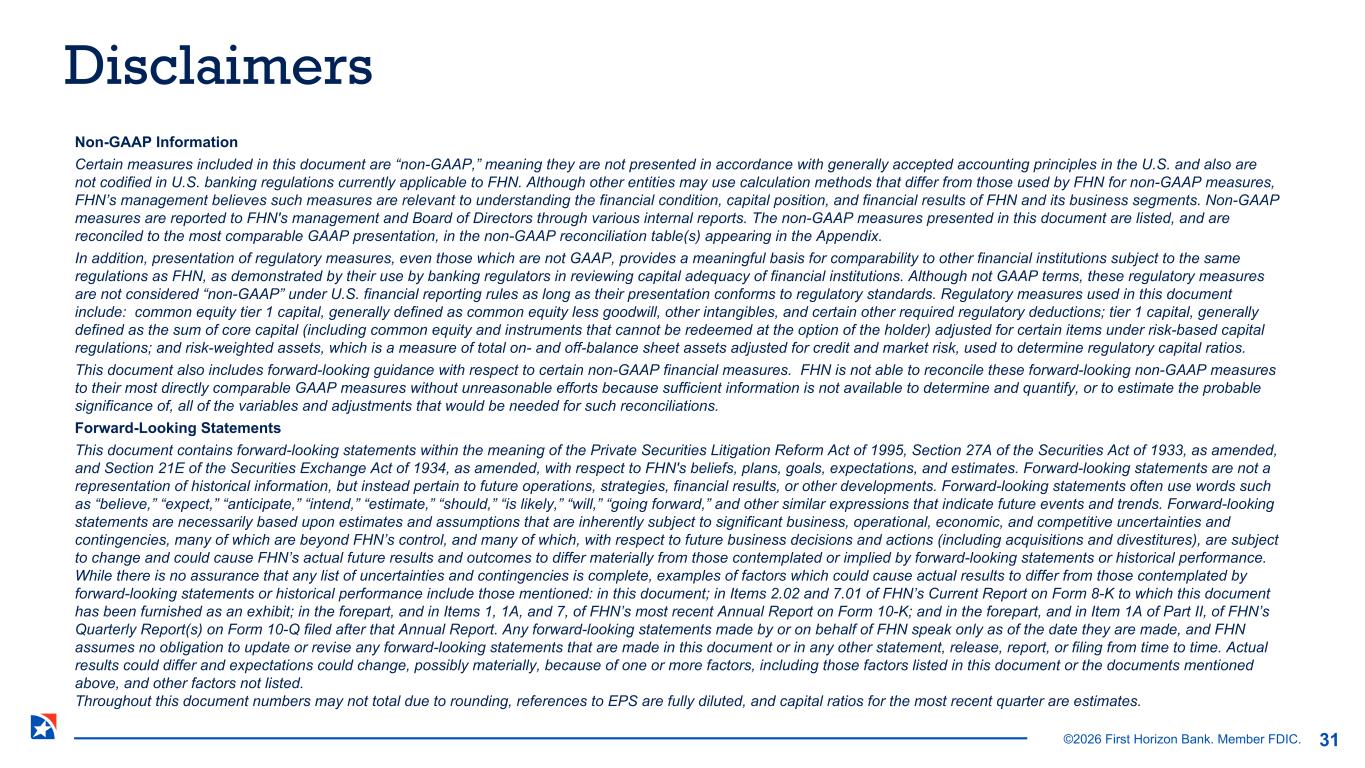
©2026 First Horizon Bank. Member FDIC. Non-GAAP Information Certain measures included in this document are “non-GAAP,” meaning they are not presented in accordance with generally accepted accounting principles in the U.S. and also are not codified in U.S. banking regulations currently applicable to FHN. Although other entities may use calculation methods that differ from those used by FHN for non-GAAP measures, FHN’s management believes such measures are relevant to understanding the financial condition, capital position, and financial results of FHN and its business segments. Non-GAAP measures are reported to FHN's management and Board of Directors through various internal reports. The non-GAAP measures presented in this document are listed, and are reconciled to the most comparable GAAP presentation, in the non-GAAP reconciliation table(s) appearing in the Appendix. In addition, presentation of regulatory measures, even those which are not GAAP, provides a meaningful basis for comparability to other financial institutions subject to the same regulations as FHN, as demonstrated by their use by banking regulators in reviewing capital adequacy of financial institutions. Although not GAAP terms, these regulatory measures are not considered “non-GAAP” under U.S. financial reporting rules as long as their presentation conforms to regulatory standards. Regulatory measures used in this document include: common equity tier 1 capital, generally defined as common equity less goodwill, other intangibles, and certain other required regulatory deductions; tier 1 capital, generally defined as the sum of core capital (including common equity and instruments that cannot be redeemed at the option of the holder) adjusted for certain items under risk-based capital regulations; and risk-weighted assets, which is a measure of total on- and off-balance sheet assets adjusted for credit and market risk, used to determine regulatory capital ratios. This document also includes forward-looking guidance with respect to certain non-GAAP financial measures. FHN is not able to reconcile these forward-looking non-GAAP measures to their most directly comparable GAAP measures without unreasonable efforts because sufficient information is not available to determine and quantify, or to estimate the probable significance of, all of the variables and adjustments that would be needed for such reconciliations. Forward-Looking Statements This document contains forward-looking statements within the meaning of the Private Securities Litigation Reform Act of 1995, Section 27A of the Securities Act of 1933, as amended, and Section 21E of the Securities Exchange Act of 1934, as amended, with respect to FHN's beliefs, plans, goals, expectations, and estimates. Forward-looking statements are not a representation of historical information, but instead pertain to future operations, strategies, financial results, or other developments. Forward-looking statements often use words such as “believe,” “expect,” “anticipate,” “intend,” “estimate,” “should,” “is likely,” “will,” “going forward,” and other similar expressions that indicate future events and trends. Forward-looking statements are necessarily based upon estimates and assumptions that are inherently subject to significant business, operational, economic, and competitive uncertainties and contingencies, many of which are beyond FHN’s control, and many of which, with respect to future business decisions and actions (including acquisitions and divestitures), are subject to change and could cause FHN’s actual future results and outcomes to differ materially from those contemplated or implied by forward-looking statements or historical performance. While there is no assurance that any list of uncertainties and contingencies is complete, examples of factors which could cause actual results to differ from those contemplated by forward-looking statements or historical performance include those mentioned: in this document; in Items 2.02 and 7.01 of FHN’s Current Report on Form 8-K to which this document has been furnished as an exhibit; in the forepart, and in Items 1, 1A, and 7, of FHN’s most recent Annual Report on Form 10-K; and in the forepart, and in Item 1A of Part II, of FHN’s Quarterly Report(s) on Form 10-Q filed after that Annual Report. Any forward-looking statements made by or on behalf of FHN speak only as of the date they are made, and FHN assumes no obligation to update or revise any forward-looking statements that are made in this document or in any other statement, release, report, or filing from time to time. Actual results could differ and expectations could change, possibly materially, because of one or more factors, including those factors listed in this document or the documents mentioned above, and other factors not listed. Throughout this document numbers may not total due to rounding, references to EPS are fully diluted, and capital ratios for the most recent quarter are estimates. Disclaimers 31