
Horizon Bancorp Inc 8-K, filed Jan 25, 2023
Horizon Bancorp Inc (HBNC)
8-K
2023-01-25
For: 2023-01-25
View Original
Added on
April 11, 2026
About this 8-K
Horizon Bancorp Inc filed this 8-K on January 25, 2023.
Items reported
- Item 2.02: Financial results
- Item 7.01: Regulation FD disclosure
- Item 9.01: Financial statements and exhibits
UNITED STATES
SECURITIES AND EXCHANGE COMMISSION
WASHINGTON, DC 20549
FORM 8-K
CURRENT REPORT
Pursuant to Section 13 OR 15(d) of The Securities Exchange Act of 1934
Date of Report (Date of earliest event reported): January 25, 2023
(Exact name of registrant as specified in its charter)
| (State or other jurisdiction of incorporation) | (Commission File Number) | (IRS Employer Identification No.) | ||||||
(Address of principal executive offices, including zip code)
(219 ) 879-0211
(Registrant's telephone number, including area code)
Not Applicable
(Former name or former address, if changed since last report)
Check the appropriate box below if the Form 8-K filing is intended to simultaneously satisfy the filing obligation of the registrant under any of the following provisions:
Securities registered pursuant to Section 12(b) of the Act:
| Title of Each Class | Trading Symbol(s) | Name of each exchange on which registered | ||||||
Indicate by check mark whether the registrant is an emerging growth company as defined in Rule 405 of the Securities Act of 1933 (§230.405 of this chapter) or Rule 12b-2 of the Securities Exchange Act of 1934 (§240.12b-2 of this chapter).
Emerging growth company ☐
If an emerging growth company, indicate by check mark if the registrant has elected not to use the extended transition period for complying with any new or revised financial accounting standards provided pursuant to Section 13(a) of the Exchange Act. ☐
1
Item 2.02 Results of Operations and Financial Condition
On January 25, 2023, Horizon Bancorp, Inc. (the “Company”) issued a press release announcing earnings and other financial results for the three and twelve–month period ended December 31, 2022. A copy of the press release is furnished as Exhibit 99.1 to this report and incorporated here by reference.
Item 7.01 Regulation FD Disclosure
Investor Presentation
The Company has prepared presentation materials (the “Investor Presentation”) that management intends to use during its previously announced Earnings Conference Call on Thursday, January 26, 2023 at 7:30 a.m. Central Time, and from time to time thereafter in presentations about the Company’s operations and performance. The Company may use the Investor Presentation, possibly with modifications, in presentations to current and potential investors, analysts, lenders, business partners, acquisition candidates, customers, employees and others with an interest in the Company and its business.
A copy of the Investor Presentation is furnished as Exhibit 99.2 to this report and incorporated here by reference. The Investor Presentation is also available on the Company’s investor website at www.horizonbank.com. Materials on the Company’s investor website are not part of or incorporated by reference into this report.
In accordance with General Instruction B.2 of Form 8–K, the information in this Current Report on Form 8–K, including Exhibits 99.1 and 99.2, shall not be deemed to be “filed” for purposes of Section 18 of the Securities and Exchange Act of 1934, as amended (the “Exchange Act”), or otherwise subject to the liability of that section, and shall not be incorporated by reference into any registration statement or other document filed under the Securities Act of 1933, as amended, or the Exchange Act, except as shall be expressly set forth by specific reference in such filing.
Item 9.01 Financial Statements and Exhibits
| (d) Exhibits | |||||||||||
| EXHIBIT INDEX | |||||||||||
| Exhibit No. | Description | Location | |||||||||
| 99.1 | Attached | ||||||||||
| 99.2 | |||||||||||
| 104 | Cover Page Interactive Data File (Embedded within the Inline XBRL document) | Within the Inline XBRL document | |||||||||
2
SIGNATURES
Pursuant to the requirements of the Securities Exchange Act of 1934, the registrant has duly caused this report to be signed on its behalf by the undersigned hereunto duly authorized.
| Date: | January 25, 2023 | HORIZON BANCORP, INC. | |||||||||
| By: | /s/ Mark E. Secor | ||||||||||
| Mark E. Secor, | |||||||||||
| Executive Vice President & Chief Financial Officer | |||||||||||
3

| Contact: | Mark E. Secor | ||||
| Chief Financial Officer | |||||
| Phone: | (219) 873-2611 | ||||
| Fax: | (219) 874-9280 | ||||
| Date: | January 25, 2023 | ||||
FOR IMMEDIATE RELEASE
Horizon Bancorp, Inc. Announces Record Earnings for 2022
Michigan City, Indiana, January 25, 2023 (GLOBE NEWSWIRE) — (NASDAQ GS: HBNC) — Horizon Bancorp, Inc. (“Horizon” or the “Company”) announced its unaudited financial results for the three and twelve months ended December 31, 2022.
“Horizon closed 2022 with record annual earnings reflecting continued strong growth in commercial and consumer loans through the fourth quarter, solid asset quality metrics and continued disciplined expense management,” Chairman and CEO Craig M. Dwight said. “We have continued to produce consistent and strong returns with ROAA of 1.24% and ROATE of 18.33% for 2022. As we enter 2023, we believe we are well–positioned with talent, technology and solid pipelines to continue to support our loan growth goals for the year, and focus on reinvesting our cash flows into higher yielding assets. Our well diversified balance sheet and low credit risk profile has performed well through previous economic cycles and, given the strong markets we operate in, we expect similar performance throughout the current economic cycle.”
Fourth Quarter and Full Year 2022 Highlights
•Return on average assets (“ROAA”) was 1.24% for the year ended 2022.
•Return on average tangible equity was 18.33% for the year ended 2022.
•Total loans grew 13.4% year–to–date and 12.8% annualized during the fourth quarter.
•Commercial loans grew to a record $2.42 billion, up 13.4% year–to–date and 10.8% annualized during the fourth quarter.
•Consumer loans grew to a record $967.8 million, up 30.6% year–to–date and 21.0% annualized during the fourth quarter.
•Asset quality remained solid with total loan delinquency at 0.26% of total loans, net charge–offs to average loans of 0.01% and non–performing loans to total loans at 0.52%.
•Total deposits remained strong increasing $26.9 million during the quarter at an average cost of 71 basis points and $54.8 million year–to–date at an average cost of 30 basis points.
•Fourth quarter net interest income was $48.8 million compared to $51.9 million in the previous quarter. Lower loan fees, less purchase accounting accretion and higher dealer reserve amortization represented $2.2 million of this decrease.
1
Horizon Bancorp, Inc. Announces Record Earnings for 2022 and Fourth Quarter Results
•An accounting revision was made to amounts reported in previously issued financial statements covering the third quarter of 2022 related to immaterial errors discovered in the fourth quarter of 2022. The errors relate to the inclusion of the dealer reserve amortization expense in loan expense in non–interest expenses for the third quarter of 2022 rather than loan interest income. The previously issued financial statements for the three and nine months dated September 30, 2022 have been revised to correct this error, which resulted in lowering both interest income and non–interest expense by $1.5 million for the quarter and lowering net interest margin by ten basis points from the historical presentation of these amounts (See Exhibit 1 – Revision of Previously Issued Financial Statements for details). All periods presented reflect this adjustment, and there was no impact to net income.
•Non–interest income increased by 4.8% from $10.2 million to $10.7 million from the third quarter to the fourth quarter of 2022.
•Non-interest expense was $35.7 million in the quarter, or 1.84% of average assets on an annualized basis, compared to $36.8 million, or 1.91%, in the third quarter of 2022. Year–to–date non–interest expense continued to be well managed at $143.2 million, or 1.90% of average assets.
•Net income totaled $21.2 million, compared to $23.8 million in the third quarter and $21.4 million in the prior year period. Diluted earnings per share (“EPS”) was $0.48 compared to $0.55 for the third quarter of 2022 and $0.49 for the fourth quarter of 2021.
•The Bank’s capital position continues to be robust with leverage and risk based capital ratios of 9.55% and 13.59%, respectively. The annualized dividend yield was 4.24% as of December 31, 2022.
Summary
| For the Three Months Ended | ||||||||||||||||||||
| December 31, | September 30, | December 31, | ||||||||||||||||||
| Net Interest Income and Net Interest Margin | 2022 | 2022 | 2021 | |||||||||||||||||
| Net interest income | $ | 48,782 | $ | 51,861 | $ | 48,477 | ||||||||||||||
| Net interest margin | 2.85 | % | 3.04 | % | 2.87 | % | ||||||||||||||
| Adjusted net interest margin | 2.83 | % | 2.99 | % | 2.77 | % | ||||||||||||||
“Horizon's net interest income of approximately $48.8 million in the fourth quarter was a reduction from the third quarter due to rapidly rising short term interest rates, some lag in repricing adjustable rate loans and lower fee and non–interest related income. In addition, Horizon's deposit betas increased at a faster pace in the fourth quarter due to the magnitude and velocity of the Federal Reserve Bank's Open Market Committee raising the targeted federal funds rate. We expect funding costs to stabilize in 2023 as the Federal Reserve Bank tempers the velocity of future rate increases,” Mr. Dwight commented.
| For the Three Months Ended | ||||||||||||||||||||
| December 31, | September 30, | December 31, | ||||||||||||||||||
| Asset Yields and Funding Costs | 2022 | 2022 | 2021 | |||||||||||||||||
| Interest earning assets | 3.88 | % | 3.58 | % | 3.11 | % | ||||||||||||||
| Interest bearing liabilities | 1.29 | % | 0.69 | % | 0.31 | % | ||||||||||||||
| For the Three Months Ended | ||||||||||||||||||||
| Non–interest Income and | December 31, | September 30, | December 31, | |||||||||||||||||
| Mortgage Banking Income | 2022 | 2022 | 2021 | |||||||||||||||||
| Total non–interest income | $ | 10,674 | $ | 10,188 | $ | 12,828 | ||||||||||||||
| Gain on sale of mortgage loans | 1,196 | 1,441 | 4,167 | |||||||||||||||||
| Mortgage servicing income net of impairment | 637 | 355 | 300 | |||||||||||||||||
2
Horizon Bancorp, Inc. Announces Record Earnings for 2022 and Fourth Quarter Results
| For the Three Months Ended | ||||||||||||||||||||
| December 31, | September 30, | December 31, | ||||||||||||||||||
| Non–interest Expense | 2022 | 2022 | 2021 | |||||||||||||||||
| Total non–interest expense | $ | 35,711 | $ | 36,816 | $ | 37,871 | ||||||||||||||
| Annualized non–interest expense to average assets | 1.84 | % | 1.91 | % | 2.01 | % | ||||||||||||||
| For the Three Months Ended | ||||||||||||||||||||
| December 31, | September 30, | December 31, | ||||||||||||||||||
| Credit Quality | 2022 | 2022 | 2021 | |||||||||||||||||
| Allowance for credit losses to total loans | 1.21 | % | 1.27 | % | 1.48 | % | ||||||||||||||
| Non–performing loans to total loans | 0.52 | % | 0.47 | % | 0.52 | % | ||||||||||||||
| Percent of net charge–offs to average loans outstanding for the period | 0.01 | % | 0.00 | % | 0.04 | % | ||||||||||||||
| Allowance for | December 31, | Net Reserve | December 31, | |||||||||||||||||||||||||||||||||||
| Credit Losses | 2022 | 4Q22 | 3Q22 | 2Q22 | 1Q22 | 2021 | ||||||||||||||||||||||||||||||||
| Commercial | $ | 32,445 | $ | (1,361) | $ | (996) | $ | (2,987) | $ | (2,986) | $ | 40,775 | ||||||||||||||||||||||||||
| Retail Mortgage | 5,577 | 440 | 715 | 71 | 495 | 3,856 | ||||||||||||||||||||||||||||||||
| Warehouse | 1,020 | (4) | (43) | 12 | (4) | 1,059 | ||||||||||||||||||||||||||||||||
| Consumer | 11,422 | 20 | (657) | 2,746 | 717 | 8,596 | ||||||||||||||||||||||||||||||||
| Allowance for Credit Losses (“ACL”) | $ | 50,464 | $ | (905) | $ | (981) | $ | (158) | $ | (1,778) | $ | 54,286 | ||||||||||||||||||||||||||
| ACL / Total Loans | 1.21 | % | 1.48 | % | ||||||||||||||||||||||||||||||||||
| Acquired Loan Discount (“ALD”) | $ | 6,279 | $ | (308) | $ | (619) | $ | (1,122) | $ | (769) | $ | 9,097 | ||||||||||||||||||||||||||
“We continued to report solid asset quality metrics, including low net charge–offs and modest levels of non–performing loans to total loans. Asset quality continued to remain a hallmark of our franchise and a credit to our seasoned loan underwriters”, said Mr. Dwight.
3
Horizon Bancorp, Inc. Announces Record Earnings for 2022 and Fourth Quarter Results
Exhibit 1 – Revision of Previously Issued Financial Statements
We have revised amounts reported in previously issued financial statements for our third quarter 2022 results reflected in this press release related to immaterial errors. Subsequent to the third quarter of 2022, the Company’s management determined that the dealer reserve amortization expense was incorrectly included in loan expense in non–interest expenses rather than loan interest income. In addition, the dealer reserve asset was incorrectly included with other assets on the balance sheet rather than included with loans. As a result, loan interest income for the three and nine months ended September 30, 2022 has been revised to include dealer reserve amortization expense, and we have reversed the impact of the inclusion of the dealer reserve amortization expense in loan expense in non–interest expenses for the three and nine months ended September 30, 2022 and for all other prior periods presented. This revision for the third quarter reduced both loan interest income and loan expense by $1.5 million, and lowered the net interest margin by ten basis points from the amounts previously reported in the interim condensed consolidated statements of income for the three and nine months ended September 30, 2022. Our financial statements for the quarter and year ended December 31, 2022 and December 31, 2021 set forth in this press release reflect the inclusion of the dealer reserve amortization expense in loan interest income for those periods.
We evaluated the aggregate effects of the errors to our previously issued financial statements in accordance with SEC Staff Accounting Bulletins No. 99 and No. 108 and, based upon quantitative and qualitative factors, determined that the errors were not material to the previously issued financial statements and disclosures included in our Quarterly Reports on Form 10–Q for the quarterly period ended September 30, 2022.
| Three Months Ended | ||||||||||||||||||||||||||||||||||||||
| December 31, | December 31, | |||||||||||||||||||||||||||||||||||||
| 2022 | 2021 | |||||||||||||||||||||||||||||||||||||
| Without Dealer Reserve Change | Dealer Reserve Change | Actual | Pre Revision | Revision | Post Revision | |||||||||||||||||||||||||||||||||
| Balance Sheet | ||||||||||||||||||||||||||||||||||||||
| Loans, net of allowance for credit losses | $ | 4,089,370 | $ | 18,164 | $ | 4,107,534 | $ | 3,590,331 | $ | 13,917 | $ | 3,604,248 | ||||||||||||||||||||||||||
| Other assets | 157,445 | (18,164) | 139,281 | 80,753 | (13,917) | 66,836 | ||||||||||||||||||||||||||||||||
| Total assets | 7,872,518 | — | 7,872,518 | 7,411,889 | — | 7,411,889 | ||||||||||||||||||||||||||||||||
| Income Statement | ||||||||||||||||||||||||||||||||||||||
| Interest income | 69,211 | (2,024) | 67,187 | 54,118 | (1,499) | 52,619 | ||||||||||||||||||||||||||||||||
| Net interest income | 50,806 | (2,024) | 48,782 | 49,976 | (1,499) | 48,477 | ||||||||||||||||||||||||||||||||
| Non–interest expense | 37,735 | (2,024) | 35,711 | 39,370 | (1,499) | 37,871 | ||||||||||||||||||||||||||||||||
| Net income | 21,165 | — | 21,165 | 21,425 | — | 21,425 | ||||||||||||||||||||||||||||||||
| Average Balance Sheet | ||||||||||||||||||||||||||||||||||||||
| Loans | 4,019,744 | 18,912 | 4,038,656 | 3,630,896 | 13,792 | 3,644,688 | ||||||||||||||||||||||||||||||||
| Interest earning assets | 7,073,068 | 18,912 | 7,091,980 | 6,938,258 | 13,792 | 6,952,050 | ||||||||||||||||||||||||||||||||
| Other assets | 599,786 | (18,912) | 580,874 | 477,352 | (13,792) | 463,560 | ||||||||||||||||||||||||||||||||
| Total assets | $ | 7,718,366 | $ | — | $ | 7,718,366 | $ | 7,461,343 | $ | — | $ | 7,461,343 | ||||||||||||||||||||||||||
| Other Financial Information | ||||||||||||||||||||||||||||||||||||||
| Average rate on loans | 5.22 | % | (0.20) | % | 5.02 | % | 4.52 | % | (0.18) | % | 4.34 | % | ||||||||||||||||||||||||||
| Average rate on interest earning assets | 4.01 | (0.13) | 3.88 | 3.20 | (0.09) | 3.11 | ||||||||||||||||||||||||||||||||
| Net interest spread | 2.72 | (0.13) | 2.59 | 2.89 | (0.09) | 2.80 | ||||||||||||||||||||||||||||||||
| Net interest margin | 2.97 | (0.12) | 2.85 | 2.97 | (0.10) | 2.87 | ||||||||||||||||||||||||||||||||
| Efficiency ratio | 61.38 | (1.32) | 60.06 | 62.69 | (0.92) | 61.77 | ||||||||||||||||||||||||||||||||
| Non–interest expense to average assets | 1.94 | % | (0.10) | % | 1.84 | % | 2.09 | % | (0.08) | % | 2.01 | % | ||||||||||||||||||||||||||
4
Horizon Bancorp, Inc. Announces Record Earnings for 2022 and Fourth Quarter Results
| Twelve Months Ended | ||||||||||||||||||||||||||||||||||||||
| December 31, | December 31, | |||||||||||||||||||||||||||||||||||||
| 2022 | 2021 | |||||||||||||||||||||||||||||||||||||
| Without Dealer Reserve Change | Dealer Reserve Change | Actual | Pre Revision | Revision | Post Revision | |||||||||||||||||||||||||||||||||
| Balance Sheet | ||||||||||||||||||||||||||||||||||||||
| Loans, net of allowance for credit losses | $ | 4,089,370 | $ | 18,164 | $ | 4,107,534 | $ | 3,590,331 | $ | 13,917 | $ | 3,604,248 | ||||||||||||||||||||||||||
| Other assets | 157,445 | (18,164) | 139,281 | 80,753 | (13,917) | 66,836 | ||||||||||||||||||||||||||||||||
| Total assets | 7,872,518 | — | 7,872,518 | 7,411,889 | — | 7,411,889 | ||||||||||||||||||||||||||||||||
| Income Statement | ||||||||||||||||||||||||||||||||||||||
| Interest income | 241,895 | (5,862) | 236,033 | 199,995 | (5,885) | 194,110 | ||||||||||||||||||||||||||||||||
| Net interest income | 205,380 | (5,862) | 199,518 | 181,690 | (5,885) | 175,805 | ||||||||||||||||||||||||||||||||
| Non–interest expense | 149,063 | (5,862) | 143,201 | 139,279 | (5,885) | 133,394 | ||||||||||||||||||||||||||||||||
| Net income | 93,408 | — | 93,408 | 87,091 | — | 87,091 | ||||||||||||||||||||||||||||||||
| Average Balance Sheet | ||||||||||||||||||||||||||||||||||||||
| Loans | 3,828,090 | 17,047 | 3,845,137 | 3,626,033 | 13,421 | 3,639,454 | ||||||||||||||||||||||||||||||||
| Interest earning assets | 6,960,360 | 17,047 | 6,977,407 | 6,021,740 | 13,421 | 6,035,161 | ||||||||||||||||||||||||||||||||
| Other assets | 526,276 | (17,047) | 509,229 | 459,316 | (13,421) | 445,895 | ||||||||||||||||||||||||||||||||
| Total assets | $ | 7,533,915 | $ | — | $ | 7,533,915 | $ | 6,514,251 | $ | 6,514,251 | ||||||||||||||||||||||||||||
| Other Financial Information | ||||||||||||||||||||||||||||||||||||||
| Average rate on loans | 4.70 | % | (0.17) | % | 4.53 | % | 4.47 | % | (0.17) | % | 4.30 | % | ||||||||||||||||||||||||||
| Average rate on interest earning assets | 3.60 | (0.10) | 3.50 | 3.43 | (0.10) | 3.33 | ||||||||||||||||||||||||||||||||
| Net interest spread | 2.93 | (0.10) | 2.83 | 3.03 | (0.10) | 2.93 | ||||||||||||||||||||||||||||||||
| Net interest margin | 3.07 | (0.09) | 2.98 | 3.13 | (0.10) | 3.03 | ||||||||||||||||||||||||||||||||
| Efficiency ratio | 58.96 | (0.98) | 57.98 | 58.12 | (1.05) | 57.07 | ||||||||||||||||||||||||||||||||
| Non–interest expense to average assets | 1.98 | % | (0.08) | % | 1.90 | % | 2.14 | % | (0.09) | % | 2.05 | % | ||||||||||||||||||||||||||
Income Statement
Net income for the fourth quarter of 2022 was $21.2 million, or $0.48 diluted earnings per share, compared to $23.8 million, or $0.55, for the linked quarter and $21.4 million, or $0.49, for the prior year period.
The change in net income for the fourth quarter of 2022 when compared to the third quarter of 2022 reflects an increase in non–interest income of $486,000 and a decrease in non–interest expense of $1.1 million, offset by a decrease in net interest income of $3.1 million and an increase in credit loss expense of $532,000.
Non–interest expense of $35.7 million in the fourth quarter of 2022 reflected a $635,000 decrease in salaries and employee benefits, a $400,000 decrease in other expense, a $282,000 decrease in FDIC insurance expense and a $280,000 decrease in other losses, offset by a $345,000 increase in data processing expense and a $142,000 increase in professional fees from the linked quarter.
5
Horizon Bancorp, Inc. Announces Record Earnings for 2022 and Fourth Quarter Results
Net income for the fourth quarter of 2022 when compared to the same prior year period reflects a decrease in non–interest income of $2.2 million and an increase in credit loss expense of $2.0 million, offset by a decrease in non–interest expense of $2.2 million, a decrease in income tax expense of $1.4 million and an increase in net interest income of $305,000.
Net income for the year ended December 31, 2022 was $93.4 million, or $2.14 diluted earnings per share, compared to $87.1 million, or $1.98 diluted earnings per share, for the year ended December 31, 2021. Adjusted net income for the year ended December 31, 2022 was $92.8 million, or $2.13 diluted earnings per share, compared to $88.6 million, or $2.00 diluted earnings per share, for the year ended December 31, 2021. The increase in net income for the year ended December 31, 2022 when compared to the same prior year period reflects an increase in net interest income of $23.7 million and a decrease in income tax expense of $3.2 million, offset by an increase in non–interest expense of $9.8 million, a decrease in non–interest income of $10.5 million and an increase in credit loss expense of $268,000.
Net Interest Margin
Horizon’s net interest margin was 2.85% for the fourth quarter of 2022 compared to 3.04% for the third quarter. The decrease in net interest margin reflects an increase in the cost of interest bearing liabilities of 60 basis points, offset by an increase in the yield on interest earning assets of 42 basis points. Additionally, interest income from acquisition–related purchase accounting adjustments was $475,000 lower during the fourth quarter of 2022 when compared to the third quarter of 2022.
Horizon’s net interest margin decreased to 2.98% for the year ended December 31, 2022 compared to 3.03% for the same prior year period. The decrease in net interest margin reflects an increase in the cost of interest bearing liabilities of 27 basis points, offset by an increase in the yield on interest earning assets of 28 basis points.
Net interest margin, excluding acquisition–related purchase accounting adjustments (“adjusted net interest margin”), was 2.83% for the fourth quarter of 2022, compared to 2.99% for the linked quarter and 2.77% for the fourth quarter of 2021. Interest income from acquisition–related purchase accounting adjustments was $431,000, $906,000 and $1.8 million for the three months ended December 31, 2022, September 30, 2022 and December 31, 2021, respectively.
The adjusted net interest margin was 2.93% for the year ended December 31, 2022 compared to 2.96% for the same prior year period. Interest income from acquisition–related purchase accounting adjustments was $3.5 million and $4.5 million for the year ended December 31, 2022 and 2021, respectively.
Lending Activity
Total loan balances were $4.16 billion, or $4.11 billion excluding PPP loans and sold commercial participation loans, on December 31, 2022 compared to $4.03 billion, or $3.98 billion excluding PPP loans and sold commercial participation loans, on September 30, 2022. During the three months ended December 31, 2022, commercial loans, excluding PPP loans and sold commercial participation loans, increased $63.8 million, consumer loans increased $48.6 million, residential mortgage loans increased $18.4 million, and loans held for sale increased $4.0 million, offset by a decrease in mortgage warehouse loans of $4.2 million.
6
Horizon Bancorp, Inc. Announces Record Earnings for 2022 and Fourth Quarter Results
| Loan Growth by Type | ||||||||||||||||||||||||||||||||||||||||||||
| (Dollars in Thousands, Unaudited) | ||||||||||||||||||||||||||||||||||||||||||||
| December 31, | September 30, | QTD | QTD | Annualized | ||||||||||||||||||||||||||||||||||||||||
| 2022 | 2022 | $ Change | % Change | % Change | ||||||||||||||||||||||||||||||||||||||||
| Commercial, excluding PPP loans and sold commercial participation loans | $ | 2,416,249 | $ | 2,352,446 | $ | 63,803 | 2.7% | 10.8% | ||||||||||||||||||||||||||||||||||||
| PPP loans | 217 | 315 | (98) | (31.1)% | (123.4)% | |||||||||||||||||||||||||||||||||||||||
| Sold commercial participation loans | 50,956 | 50,982 | (26) | (0.1)% | (0.2)% | |||||||||||||||||||||||||||||||||||||||
| Residential mortgage | 653,292 | 634,901 | 18,391 | 2.9% | 11.5% | |||||||||||||||||||||||||||||||||||||||
| Consumer | 967,755 | 919,198 | 48,557 | 5.3% | 21.0% | |||||||||||||||||||||||||||||||||||||||
| Subtotal | 4,088,469 | 3,957,842 | 130,627 | 3.3% | 13.1% | |||||||||||||||||||||||||||||||||||||||
| Loans held for sale | 5,807 | 1,852 | 3,955 | 213.6% | 847.2% | |||||||||||||||||||||||||||||||||||||||
| Mortgage warehouse | 69,529 | 73,690 | (4,161) | (5.6)% | (22.4)% | |||||||||||||||||||||||||||||||||||||||
| Total loans | $ | 4,163,805 | $ | 4,033,384 | $ | 130,421 | 3.2% | 12.8% | ||||||||||||||||||||||||||||||||||||
| Total loans, excluding PPP loans and sold commercial participation loans | $ | 4,112,632 | $ | 3,982,087 | $ | 130,545 | 3.3% | 13.0% | ||||||||||||||||||||||||||||||||||||
| Loan Growth by Type | ||||||||||||||||||||||||||||||||||||||
| (Dollars in Thousands, Unaudited) | ||||||||||||||||||||||||||||||||||||||
| December 31, | December 31, | YTD | YTD | |||||||||||||||||||||||||||||||||||
| 2022 | 2021 | $ Change | % Change | |||||||||||||||||||||||||||||||||||
| Commercial, excluding PPP loans and sold commercial participation loans | $ | 2,416,249 | $ | 2,131,644 | $ | 284,605 | 13.4% | |||||||||||||||||||||||||||||||
| PPP loans | 217 | 25,844 | (25,627) | (99.2)% | ||||||||||||||||||||||||||||||||||
| Sold commercial participation loans | 50,956 | 56,457 | (5,501) | (9.7)% | ||||||||||||||||||||||||||||||||||
| Residential mortgage | 653,292 | 594,382 | 58,910 | 9.9% | ||||||||||||||||||||||||||||||||||
| Consumer | 967,755 | 741,176 | 226,579 | 30.6% | ||||||||||||||||||||||||||||||||||
| Subtotal | 4,088,469 | 3,549,503 | 538,966 | 15.2% | ||||||||||||||||||||||||||||||||||
| Loans held for sale | 5,807 | 12,579 | (6,772) | (53.8)% | ||||||||||||||||||||||||||||||||||
| Mortgage warehouse | 69,529 | 109,031 | (39,502) | (36.2)% | ||||||||||||||||||||||||||||||||||
| Total loans | $ | 4,163,805 | $ | 3,671,113 | $ | 492,692 | 13.4% | |||||||||||||||||||||||||||||||
| Total loans, excluding PPP loans and sold commercial participation loans | $ | 4,112,632 | $ | 3,588,812 | $ | 523,820 | 14.6% | |||||||||||||||||||||||||||||||
Residential mortgage lending activity for the three months ended December 31, 2022 generated $1.2 million in income from the gain on sale of mortgage loans, decreasing $245,000 from the third quarter of 2022 and decreasing $3.0 million from the fourth quarter of 2021. Total mortgage origination volume for the fourth quarter of 2022, including loans placed into the portfolio, totaled $62.3 million, representing a decrease of 43.8% from third quarter 2022 levels, and a decrease of 58.6% from the fourth quarter of 2021. As a percentage of total mortgage loan originations, 8% of the volume was from refinancing and 92% was from new purchases during the fourth quarter of 2022. Total origination volume of loans sold to the secondary market totaled $23.0 million, compared to $50.2 million in the third quarter.
Gain on sale of mortgage loans and mortgage warehousing income was 3.2% of total revenue for the three months ended December 31, 2022, compared to 3.8% for the linked quarter and 8.8% for the three months ended December 31, 2021.
7
Horizon Bancorp, Inc. Announces Record Earnings for 2022 and Fourth Quarter Results
Deposit Activity
Total deposit balances of $5.86 billion on December 31, 2022 increased 0.5% compared to $5.83 billion on September 30, 2022, or 1.8% annualized.
| Deposit Growth by Type | |||||||||||||||||||||||||||||||||||||||||
| (Dollars in Thousands, Unaudited) | |||||||||||||||||||||||||||||||||||||||||
| December 31, | September 30, | QTD | QTD | Annualized | |||||||||||||||||||||||||||||||||||||
| 2022 | 2022 | $ Change | % Change | % Change | |||||||||||||||||||||||||||||||||||||
| Non–interest bearing | $ | 1,277,768 | $ | 1,315,155 | $ | (37,387) | (2.8)% | (11.3)% | |||||||||||||||||||||||||||||||||
| Interest bearing | 3,582,891 | 3,736,798 | (153,907) | (4.1)% | (16.3)% | ||||||||||||||||||||||||||||||||||||
| Time deposits | 997,115 | 778,885 | 218,230 | 28.0% | 111.2% | ||||||||||||||||||||||||||||||||||||
| Total deposits | $ | 5,857,774 | $ | 5,830,838 | $ | 26,936 | 0.5% | 1.8% | |||||||||||||||||||||||||||||||||
Total deposit balances of $5.86 billion on December 31, 2022 increased 0.9% compared to $5.80 billion on December 31, 2021.
| Deposit Growth by Type | |||||||||||||||||||||||||||||||||||
| (Dollars in Thousands, Unaudited) | |||||||||||||||||||||||||||||||||||
| December 31, | December 31, | YTD | YTD | ||||||||||||||||||||||||||||||||
| 2022 | 2021 | $ Change | % Change | ||||||||||||||||||||||||||||||||
| Non–interest bearing | $ | 1,277,768 | $ | 1,360,338 | $ | (82,570) | (6.1)% | ||||||||||||||||||||||||||||
| Interest bearing | 3,582,891 | 3,711,767 | (128,876) | (3.5)% | |||||||||||||||||||||||||||||||
| Time deposits | 997,115 | 730,886 | 266,229 | 36.4% | |||||||||||||||||||||||||||||||
| Total deposits | $ | 5,857,774 | $ | 5,802,991 | $ | 54,783 | 0.9% | ||||||||||||||||||||||||||||
Expense Management
| Non–Interest Expense | ||||||||||||||||||||||||||||||||||||||||||||||||||
| (Dollars in Thousands, Unaudited) | ||||||||||||||||||||||||||||||||||||||||||||||||||
| Three Months Ended | ||||||||||||||||||||||||||||||||||||||||||||||||||
| December 31, | September 30, | QTD | QTD | |||||||||||||||||||||||||||||||||||||||||||||||
| Non–interest Expense | 2022 | 2022 | $ Change | % Change | ||||||||||||||||||||||||||||||||||||||||||||||
| Salaries and employee benefits | $ | 19,978 | $ | 20,613 | $ | (635) | (3.1)% | |||||||||||||||||||||||||||||||||||||||||||
| Net occupancy expenses | 3,279 | 3,293 | (14) | (0.4)% | ||||||||||||||||||||||||||||||||||||||||||||||
| Data processing | 2,884 | 2,539 | 345 | 13.6% | ||||||||||||||||||||||||||||||||||||||||||||||
| Professional fees | 694 | 552 | 142 | 25.7% | ||||||||||||||||||||||||||||||||||||||||||||||
| Outside services and consultants | 2,985 | 2,855 | 130 | 4.6% | ||||||||||||||||||||||||||||||||||||||||||||||
| Loan expense | 1,281 | 1,392 | (111) | (8.0)% | ||||||||||||||||||||||||||||||||||||||||||||||
| FDIC insurance expense | 388 | 670 | (282) | (42.1)% | ||||||||||||||||||||||||||||||||||||||||||||||
| Other losses | 118 | 398 | (280) | (70.4)% | ||||||||||||||||||||||||||||||||||||||||||||||
| Other expense | 4,104 | 4,504 | (400) | (8.9)% | ||||||||||||||||||||||||||||||||||||||||||||||
| Total non–interest expense | $ | 35,711 | $ | 36,816 | $ | (1,105) | (3.0)% | |||||||||||||||||||||||||||||||||||||||||||
| Annualized non–interest expense to average assets | 1.84 | % | 1.91 | % | ||||||||||||||||||||||||||||||||||||||||||||||
Total non–interest expense was $1.1 million lower in the fourth quarter of 2022 when compared to the third quarter of 2022. The decrease in expenses was primarily due to a decrease in salaries and employee benefits of $635,000 from lower commissions and health care costs, a decrease in other expense of $400,000, a decrease in FDIC insurance expense of $282,000 and a decrease in other losses of $280,000, offset by an increase in data processing of $345,000 and professional fees of $142,000.
8
Horizon Bancorp, Inc. Announces Record Earnings for 2022 and Fourth Quarter Results
| Non–GAAP Reconciliation of Non–Interest Expense | ||||||||||||||||||||||||||||||||||||||||||||||||||
| (Dollars in Thousands, Unaudited) | ||||||||||||||||||||||||||||||||||||||||||||||||||
| Three Months Ended | ||||||||||||||||||||||||||||||||||||||||||||||||||
| December 31, | December 31, | |||||||||||||||||||||||||||||||||||||||||||||||||
| 2022 | 2021 | Adjusted | ||||||||||||||||||||||||||||||||||||||||||||||||
| Non–interest Expense | Actual | Acquisition & Non–Recurring Expenses | Adjusted | Actual | Acquisition & Non–Recurring Expenses | Adjusted | Amount Change | Percent Change | ||||||||||||||||||||||||||||||||||||||||||
| Salaries and employee benefits | $ | 19,978 | $ | — | $ | 19,978 | $ | 20,549 | $ | (202) | $ | 20,347 | $ | (369) | (1.8)% | |||||||||||||||||||||||||||||||||||
| Net occupancy expenses | 3,279 | — | 3,279 | 3,204 | — | 3,204 | 75 | 2.3% | ||||||||||||||||||||||||||||||||||||||||||
| Data processing | 2,884 | — | 2,884 | 2,672 | (1) | 2,671 | 213 | 8.0% | ||||||||||||||||||||||||||||||||||||||||||
| Professional fees | 694 | — | 694 | 562 | (45) | 517 | 177 | 34.2% | ||||||||||||||||||||||||||||||||||||||||||
| Outside services and consultants | 2,985 | — | 2,985 | 2,197 | (162) | 2,035 | 950 | 46.7% | ||||||||||||||||||||||||||||||||||||||||||
| Loan expense | 1,281 | — | 1,281 | 1,304 | (83) | 1,221 | 60 | 4.9% | ||||||||||||||||||||||||||||||||||||||||||
| FDIC insurance expense | 388 | — | 388 | 798 | (6) | 792 | (404) | (51.0)% | ||||||||||||||||||||||||||||||||||||||||||
| Other losses | 118 | — | 118 | 1,925 | (1,904) | 21 | 97 | 461.9% | ||||||||||||||||||||||||||||||||||||||||||
| Other expense | 4,104 | — | 4,104 | 4,660 | (381) | 4,279 | (175) | (4.1)% | ||||||||||||||||||||||||||||||||||||||||||
| Total non–interest expense | $ | 35,711 | $ | — | $ | 35,711 | $ | 37,871 | $ | (2,784) | $ | 35,087 | $ | 624 | 1.8% | |||||||||||||||||||||||||||||||||||
| Annualized non–interest expense to average assets | 1.84 | % | 1.84 | % | 2.01 | % | 1.87 | % | ||||||||||||||||||||||||||||||||||||||||||
Total adjusted non–interest expense was $624,000 higher in the fourth quarter of 2022 when compared to the fourth quarter of 2021. The increase in expenses was primarily due to an increase in outside services and consultants of $950,000 and an increase in data processing of $213,000, offset by a decrease in salaries and employee benefits of $369,000, a decrease in FDIC insurance expense of $404,000 and a decrease in other expense of $175,000.
9
Horizon Bancorp, Inc. Announces Record Earnings for 2022 and Fourth Quarter Results
| Non–GAAP Reconciliation of Non–Interest Expense | ||||||||||||||||||||||||||||||||||||||||||||||||||
| (Dollars in Thousands, Unaudited) | ||||||||||||||||||||||||||||||||||||||||||||||||||
| Twelve Months Ended | ||||||||||||||||||||||||||||||||||||||||||||||||||
| December 31, | December 31, | |||||||||||||||||||||||||||||||||||||||||||||||||
| 2022 | 2021 | Adjusted | ||||||||||||||||||||||||||||||||||||||||||||||||
| Non–interest Expense | Actual | Acquisition & Non–Recurring Expenses | Adjusted | Actual | Acquisition & Non–Recurring Expenses | Adjusted | Amount Change | Percent Change | ||||||||||||||||||||||||||||||||||||||||||
| Salaries and employee benefits | $ | 80,283 | $ | — | $ | 80,283 | $ | 74,051 | $ | (227) | $ | 73,824 | $ | 6,459 | 8.7% | |||||||||||||||||||||||||||||||||||
| Net occupancy expenses | 13,323 | — | 13,323 | 12,541 | (13) | 12,528 | 795 | 6.3% | ||||||||||||||||||||||||||||||||||||||||||
| Data processing | 10,567 | — | 10,567 | 9,962 | (18) | 9,944 | 623 | 6.3% | ||||||||||||||||||||||||||||||||||||||||||
| Professional fees | 1,843 | — | 1,843 | 2,216 | (149) | 2,067 | (224) | (10.8)% | ||||||||||||||||||||||||||||||||||||||||||
| Outside services and consultants | 10,850 | — | 10,850 | 8,449 | (750) | 7,699 | 3,151 | 40.9% | ||||||||||||||||||||||||||||||||||||||||||
| Loan expense | 5,411 | — | 5,411 | 5,492 | (83) | 5,409 | 2 | —% | ||||||||||||||||||||||||||||||||||||||||||
| FDIC insurance expense | 2,558 | — | 2,558 | 2,377 | (6) | 2,371 | 187 | 7.9% | ||||||||||||||||||||||||||||||||||||||||||
| Other losses | 1,046 | — | 1,046 | 2,283 | (5) | 2,278 | (1,232) | (54.1)% | ||||||||||||||||||||||||||||||||||||||||||
| Other expense | 17,320 | — | 17,320 | 16,023 | (2,574) | 13,449 | 3,871 | 28.8% | ||||||||||||||||||||||||||||||||||||||||||
| Total non–interest expense | $ | 143,201 | $ | — | $ | 143,201 | $ | 133,394 | $ | (3,825) | $ | 129,569 | $ | 13,632 | 10.5% | |||||||||||||||||||||||||||||||||||
| Annualized non–interest expense to average assets | 1.90 | % | 1.90 | % | 2.05 | % | 1.99 | % | ||||||||||||||||||||||||||||||||||||||||||
Total adjusted non–interest expense was $13.6 million higher for the year ended December 31, 2022 when compared to the same prior year period. The year–over–increase was due to increases in salaries and employee benefits, outside services and consultants, other expense, net occupancy expenses and data processing, offset by a decrease in other losses.
Annualized non–interest expense as a percent of average assets was 1.84%, 1.91% and 2.01% for the three months ended December 31, 2022, September 30, 2022 and December 31, 2021, respectively. Annualized non–interest expense, excluding acquisition expenses and non–recurring ESOP settlement expenses, as a percent of average assets was 1.84%, 1.91% and 1.87% for the three months ended December 31, 2022, September 30, 2022 and December 31, 2021, respectively.
Annualized non–interest expense as a percent of average assets was 1.90% and 2.05% for the year ended December 31, 2022 and 2021, respectively. Annualized non–interest expense, excluding acquisition expenses and non–recurring ESOP settlement expenses, as a percentage of average assets was 1.90% and 1.99% for the year ended December 31, 2022 and 2021, respectively.
Income tax expense totaled $2.6 million for the fourth quarter of 2022, $2.0 million for the third quarters of 2022 and $4.1 million for the fourth quarter of 2021.
Income tax expense totaled $12.2 million for the year ended December 31, 2022, a decrease of $3.2 million when compared to the year ended December 31, 2021. The decrease in income tax expense was primarily due to an increase income tax credits received during 2022.
10
Horizon Bancorp, Inc. Announces Record Earnings for 2022 and Fourth Quarter Results
Capital
The capital resources of the Company and the Bank exceeded regulatory capital ratios for “well capitalized” banks at December 31, 2022. Stockholders’ equity totaled $677.4 million at December 31, 2022 and the ratio of average stockholders’ equity to average assets was 9.07% for the twelve months ended December 31, 2022.
The following table presents the actual regulatory capital dollar amounts and ratios of the Company and the Bank as of December 31, 2022.
| Actual | Required for Capital Adequacy Purposes | Required for Capital Adequacy Purposes with Capital Buffer | Well Capitalized Under Prompt Corrective Action Provisions | |||||||||||||||||||||||||||||||||||||||||||||||
| Amount | Ratio | Amount | Ratio | Amount | Ratio | Amount | Ratio | |||||||||||||||||||||||||||||||||||||||||||
| Total capital (to risk–weighted assets) | ||||||||||||||||||||||||||||||||||||||||||||||||||
| Consolidated | $ | 782,705 | 14.48 | % | $ | 432,525 | 8.00 | % | $ | 567,688 | 10.50 | % | N/A | N/A | ||||||||||||||||||||||||||||||||||||
| Bank | 734,578 | 13.59 | % | 432,413 | 8.00 | % | 567,542 | 10.50 | % | $ | 540,516 | 10.00 | % | |||||||||||||||||||||||||||||||||||||
| Tier 1 capital (to risk–weighted assets) | ||||||||||||||||||||||||||||||||||||||||||||||||||
| Consolidated | 736,150 | 13.62 | % | 324,393 | 6.00 | % | 459,557 | 8.50 | % | N/A | N/A | |||||||||||||||||||||||||||||||||||||||
| Bank | 686,069 | 12.69 | % | 324,310 | 6.00 | % | 459,439 | 8.50 | % | 432,413 | 8.00 | % | ||||||||||||||||||||||||||||||||||||||
| Common equity tier 1 capital (to risk–weighted assets) | ||||||||||||||||||||||||||||||||||||||||||||||||||
| Consolidated | 616,231 | 11.40 | % | 243,295 | 4.50 | % | 378,459 | 7.00 | % | N/A | N/A | |||||||||||||||||||||||||||||||||||||||
| Bank | 686,069 | 12.69 | % | 243,232 | 4.50 | % | 378,361 | 7.00 | % | 351,336 | 6.50 | % | ||||||||||||||||||||||||||||||||||||||
| Tier 1 capital (to average assets) | ||||||||||||||||||||||||||||||||||||||||||||||||||
| Consolidated | 736,150 | 10.23 | % | 287,867 | 4.00 | % | 287,867 | 4.00 | % | N/A | N/A | |||||||||||||||||||||||||||||||||||||||
| Bank | 686,069 | 9.55 | % | 287,262 | 4.00 | % | 287,262 | 4.00 | % | 359,077 | 5.00 | % | ||||||||||||||||||||||||||||||||||||||
Tangible book value per common share (“TBVPS”) declined $0.99 during the twelve months ended December 31, 2022 to $11.59, as unrealized net losses on securities available for sale (“AFS”) of $2.71 per common share, reduced accumulated other comprehensive income (“AOCI”) by $118.0 million during the twelve months ended December 31, 2022..
Liquidity
The Bank maintains a stable base of core deposits provided by long–standing relationships with individuals and local businesses. These deposits are the principal source of liquidity, while other sources of liquidity for Horizon include earnings, loan repayments, investment security sales and maturities, proceeds from the sale of residential mortgage loans, unpledged investment securities and borrowing relationships with correspondent banks, including the Federal Home Loan Bank of Indianapolis (the “FHLB”). At December 31, 2022, in addition to liquidity available from the normal operating, funding, and investing activities of Horizon, the Bank had approximately $438.0 million in unused credit lines with various money center banks, including the FHLB and the Federal Reserve Discount Window. The Bank also had approximately $2.1 billion of unpledged investment securities at December 31, 2022. Total available liquidity was $2.7 billion at December 31, 2022.
11
Horizon Bancorp, Inc. Announces Record Earnings for 2022 and Fourth Quarter Results
Forward Looking Statements
This press release may contain forward–looking statements regarding the financial performance, business prospects, growth and operating strategies of Horizon Bancorp, Inc. and its affiliates (collectively, “Horizon”). For these statements, Horizon claims the protection of the safe harbor for forward–looking statements contained in the Private Securities Litigation Reform Act of 1995. Statements in this press release should be considered in conjunction with the other information available about Horizon, including the information in the filings we make with the Securities and Exchange Commission (the “SEC”). Forward–looking statements provide current expectations or forecasts of future events and are not guarantees of future performance. The forward–looking statements are based on management’s expectations and are subject to a number of risks and uncertainties. We have tried, wherever possible, to identify such statements by using words such as “anticipate,” “estimate,” “project,” “intend,” “plan,” “believe,” “will” and similar expressions in connection with any discussion of future operating or financial performance.
Although management believes that the expectations reflected in such forward–looking statements are reasonable, actual results may differ materially from those expressed or implied in such statements. Risks and uncertainties that could cause actual results to differ materially include: changes in the level and volatility of interest rates, changes in spreads on earning assets and changes in interest bearing liabilities; increased interest rate sensitivity; continuing increases in inflation; loss of key Horizon personnel; increases in disintermediation; potential loss of fee income, including interchange fees, as new and emerging alternative payment platforms take a greater market share of the payment systems; estimates of fair value of certain of Horizon’s assets and liabilities; changes in prepayment speeds, loan originations, credit losses, market values, collateral securing loans and other assets; changes in sources of liquidity; continuing risks and uncertainties relating to the COVID–19 pandemic and government responses thereto; legislative and regulatory actions and reforms; changes in accounting policies or procedures as may be adopted and required by regulatory agencies; litigation, regulatory enforcement, and legal compliance risk and costs; rapid technological developments and changes; cyber terrorism and data security breaches; the rising costs of cybersecurity; the ability of the U.S. federal government to manage federal debt limits; climate change and social justice initiatives; material changes outside the U.S. or in overseas relations, including changes in U.S. trade relations related to imposition of tariffs, Brexit, and the phase out of the London Interbank Offered Rate (“LIBOR”); the inability to realize cost savings or revenues or to effectively implement integration plans and other consequences associated with mergers, acquisitions, and divestitures; acts of terrorism, war and global conflicts, such as the Russia and Ukraine conflict; and supply chain disruptions and delays. These and additional factors that could cause actual results to differ materially from those expressed in the forward–looking statements are discussed in Horizon’s reports (such as the Annual Report on Form 10–K, Quarterly Reports on Form 10–Q, and Current Reports on Form 8–K) filed with the SEC and available at the SEC’s Internet website (www.sec.gov).risk factors relating to the banking industry and the other factors detailed from time to time in Horizon’s reports filed with the Securities and Exchange Commission, including those described in Horizon’s Annual Report on Form 10–K and its quarterly reports on Form 10–Q. Further, statements about the effects of the COVID–19 pandemic on our business, operations, financial performance, and prospects may constitute forward–looking statements and are subject to the risk that the actual impacts may differ, possibly materially, from what is reflected in those forward–looking statements due to factors and future developments that are uncertain, unpredictable, and in many cases beyond our control, including the scope and duration of the pandemic, actions taken by governmental authorities in response to the pandemic, and the direct and indirect impact of the pandemic on our customers, third parties, and us. Undue reliance should not be placed on the forward–looking statements, which speak only as of the date hereof. Horizon does not undertake, and specifically disclaims any obligation, to publicly release the result of any revisions that may be made to update any forward–looking statement to reflect the events or circumstances after the date on which the forward–looking statement is made, or reflect the occurrence of unanticipated events, except to the extent required by law.
12
Horizon Bancorp, Inc. Announces Record Earnings for 2022 and Fourth Quarter Results
| Financial Highlights | ||||||||||||||||||||||||||||||||
| (Dollars in Thousands, Unaudited) | ||||||||||||||||||||||||||||||||
| December 31, | September 30, | June 30, | March 31, | December 31, | ||||||||||||||||||||||||||||
| 2022 | 2022 | 2022 | 2022 | 2021 | ||||||||||||||||||||||||||||
| Balance sheet: | ||||||||||||||||||||||||||||||||
| Total assets | $ | 7,872,518 | $ | 7,718,695 | $ | 7,640,936 | $ | 7,420,328 | $ | 7,374,903 | ||||||||||||||||||||||
| Interest earning deposits & federal funds sold | 12,233 | 7,302 | 5,646 | 20,827 | 502,364 | |||||||||||||||||||||||||||
| Interest earning time deposits | 2,812 | 2,814 | 3,799 | 4,046 | 4,782 | |||||||||||||||||||||||||||
| Investment securities | 3,020,306 | 3,017,191 | 3,093,792 | 3,118,641 | 2,713,255 | |||||||||||||||||||||||||||
| Commercial loans | 2,467,422 | 2,403,743 | 2,363,991 | 2,259,327 | 2,213,945 | |||||||||||||||||||||||||||
| Mortgage warehouse loans | 69,529 | 73,690 | 116,488 | 105,118 | 109,031 | |||||||||||||||||||||||||||
| Residential mortgage loans | 653,292 | 634,901 | 608,582 | 593,372 | 594,382 | |||||||||||||||||||||||||||
| Consumer loans | 967,755 | 919,198 | 866,819 | 768,854 | 741,176 | |||||||||||||||||||||||||||
| Total loans | 4,157,998 | 4,031,532 | 3,955,880 | 3,726,671 | 3,658,534 | |||||||||||||||||||||||||||
| Earning assets | 7,225,833 | 7,087,368 | 7,088,737 | 6,898,208 | 6,878,968 | |||||||||||||||||||||||||||
| Non–interest bearing deposit accounts | 1,277,768 | 1,315,155 | 1,328,213 | 1,325,570 | 1,360,338 | |||||||||||||||||||||||||||
| Interest bearing transaction accounts | 3,582,891 | 3,736,798 | 3,760,890 | 3,782,644 | 3,711,767 | |||||||||||||||||||||||||||
| Time deposits | 997,115 | 778,885 | 756,482 | 743,283 | 730,886 | |||||||||||||||||||||||||||
| Total deposits | 5,857,774 | 5,830,838 | 5,845,585 | 5,851,497 | 5,802,991 | |||||||||||||||||||||||||||
| Borrowings | 1,142,949 | 1,048,091 | 959,222 | 728,664 | 712,739 | |||||||||||||||||||||||||||
| Subordinated notes | 58,896 | 58,860 | 58,823 | 58,786 | 58,750 | |||||||||||||||||||||||||||
| Junior subordinated debentures issued to capital trusts | 57,027 | 56,966 | 56,907 | 56,850 | 56,785 | |||||||||||||||||||||||||||
| Total stockholders’ equity | 677,375 | 644,993 | 657,865 | 677,450 | 723,209 | |||||||||||||||||||||||||||
13
Horizon Bancorp, Inc. Announces Record Earnings for 2022 and Fourth Quarter Results
| Financial Highlights | ||||||||||||||||||||||||||||||||
| (Dollars in Thousands Except Share and Per Share Data and Ratios, Unaudited) | ||||||||||||||||||||||||||||||||
| Three Months Ended | ||||||||||||||||||||||||||||||||
| December 31, | September 30, | June 30, | March 31, | December 31, | ||||||||||||||||||||||||||||
| 2022 | 2022 | 2022 | 2022 | 2021 | ||||||||||||||||||||||||||||
| Income statement: | ||||||||||||||||||||||||||||||||
| Net interest income | $ | 48,782 | $ | 51,861 | $ | 52,044 | $ | 46,831 | $ | 48,477 | ||||||||||||||||||||||
| Credit loss expense (recovery) | (69) | (601) | 240 | (1,386) | (2,071) | |||||||||||||||||||||||||||
| Non–interest income | 10,674 | 10,188 | 12,434 | 14,155 | 12,828 | |||||||||||||||||||||||||||
| Non–interest expense | 35,711 | 36,816 | 35,404 | 35,270 | 37,871 | |||||||||||||||||||||||||||
| Income tax expense | 2,649 | 2,013 | 3,975 | 3,539 | 4,080 | |||||||||||||||||||||||||||
| Net income | $ | 21,165 | $ | 23,821 | $ | 24,859 | $ | 23,563 | $ | 21,425 | ||||||||||||||||||||||
| Per share data: | ||||||||||||||||||||||||||||||||
| Basic earnings per share | $ | 0.49 | $ | 0.55 | $ | 0.57 | $ | 0.54 | $ | 0.49 | ||||||||||||||||||||||
| Diluted earnings per share | 0.48 | 0.55 | 0.57 | 0.54 | 0.49 | |||||||||||||||||||||||||||
| Cash dividends declared per common share | 0.16 | 0.16 | 0.16 | 0.15 | 0.15 | |||||||||||||||||||||||||||
| Book value per common share | 15.55 | 14.80 | 15.10 | 15.55 | 16.61 | |||||||||||||||||||||||||||
| Tangible book value per common share | 11.59 | 10.82 | 11.11 | 11.54 | 12.58 | |||||||||||||||||||||||||||
| Market value – high | 20.00 | 20.59 | 19.21 | 23.45 | 21.14 | |||||||||||||||||||||||||||
| Market value – low | $ | 14.51 | $ | 16.74 | $ | 16.72 | $ | 18.67 | $ | 18.01 | ||||||||||||||||||||||
| Weighted average shares outstanding – Basis | 43,574,151 | 43,573,370 | 43,572,796 | 43,554,713 | 43,534,298 | |||||||||||||||||||||||||||
| Weighted average shares outstanding – Diluted | 43,667,954 | 43,703,793 | 43,684,691 | 43,734,556 | 43,733,416 | |||||||||||||||||||||||||||
| Key ratios: | ||||||||||||||||||||||||||||||||
| Return on average assets | 1.09 | % | 1.24 | % | 1.33 | % | 1.31 | % | 1.14 | % | ||||||||||||||||||||||
| Return on average common stockholders’ equity | 12.72 | 13.89 | 14.72 | 13.34 | 11.81 | |||||||||||||||||||||||||||
| Net interest margin | 2.85 | 3.04 | 3.13 | 2.90 | 2.87 | |||||||||||||||||||||||||||
| Allowance for credit losses to total loans | 1.21 | 1.27 | 1.32 | 1.41 | 1.48 | |||||||||||||||||||||||||||
| Average equity to average assets | 8.55 | 8.91 | 9.06 | 9.79 | 9.64 | |||||||||||||||||||||||||||
| Efficiency ratio | 60.06 | 59.33 | 54.91 | 57.83 | 61.77 | |||||||||||||||||||||||||||
| Annualized non–interest expense to average assets | 1.84 | 1.91 | 1.90 | 1.95 | 2.01 | |||||||||||||||||||||||||||
| Bank only capital ratios: | ||||||||||||||||||||||||||||||||
| Tier 1 capital to average assets | 9.55 | 8.84 | 8.85 | 8.83 | 8.50 | |||||||||||||||||||||||||||
| Tier 1 capital to risk weighted assets | 12.69 | 12.74 | 12.87 | 13.23 | 13.69 | |||||||||||||||||||||||||||
| Total capital to risk weighted assets | 13.59 | 13.65 | 13.83 | 14.25 | 14.72 | |||||||||||||||||||||||||||
14
Horizon Bancorp, Inc. Announces Record Earnings for 2022 and Fourth Quarter Results
| Financial Highlights | ||||||||||||||
| (Dollars in Thousands Except Share and Per Share Data and Ratios, Unaudited) | ||||||||||||||
| Twelve Months Ended | ||||||||||||||
| December 31, | December 31, | |||||||||||||
| 2022 | 2021 | |||||||||||||
| Income statement: | ||||||||||||||
| Net interest income | $ | 199,518 | $ | 175,805 | ||||||||||
| Credit loss expense (recovery) | (1,816) | (2,084) | ||||||||||||
| Non–interest income | 47,451 | 57,952 | ||||||||||||
| Non–interest expense | 143,201 | 133,394 | ||||||||||||
| Income tax expense | 12,176 | 15,356 | ||||||||||||
| Net income | $ | 93,408 | $ | 87,091 | ||||||||||
| Per share data: | ||||||||||||||
| Basic earnings per share | $ | 2.14 | $ | 1.99 | ||||||||||
| Diluted earnings per share | 2.14 | 1.98 | ||||||||||||
| Cash dividends declared per common share | 0.63 | 0.56 | ||||||||||||
| Book value per common share | 15.55 | 16.61 | ||||||||||||
| Tangible book value per common share | 11.59 | 12.58 | ||||||||||||
| Market value – high | 23.45 | 21.14 | ||||||||||||
| Market value – low | $ | 14.51 | $ | 15.43 | ||||||||||
| Weighted average shares outstanding – Basis | 43,568,823 | 43,802,733 | ||||||||||||
| Weighted average shares outstanding – Diluted | 43,699,734 | 43,955,280 | ||||||||||||
| Key ratios: | ||||||||||||||
| Return on average assets | 1.24 | % | 1.34 | % | ||||||||||
| Return on average common stockholders’ equity | 13.66 | 12.23 | ||||||||||||
| Net interest margin | 2.98 | 3.03 | ||||||||||||
| Allowance for credit losses to total loans | 1.21 | 1.48 | ||||||||||||
| Average equity to average assets | 9.07 | 10.93 | ||||||||||||
| Efficiency ratio | 57.98 | 57.07 | ||||||||||||
| Annualized non–interest expense to average assets | 1.90 | 2.05 | ||||||||||||
| Bank only capital ratios: | ||||||||||||||
| Tier 1 capital to average assets | 9.55 | 8.50 | ||||||||||||
| Tier 1 capital to risk weighted assets | 12.69 | 13.69 | ||||||||||||
| Total capital to risk weighted assets | 13.59 | 14.72 | ||||||||||||
15
Horizon Bancorp, Inc. Announces Record Earnings for 2022 and Fourth Quarter Results
| Financial Highlights | ||||||||||||||||||||||||||||||||
| (Dollars in Thousands Except Ratios, Unaudited) | ||||||||||||||||||||||||||||||||
| December 31, | September 30, | June 30, | March 31, | December 31, | ||||||||||||||||||||||||||||
| 2022 | 2022 | 2022 | 2022 | 2021 | ||||||||||||||||||||||||||||
| Loan data: | ||||||||||||||||||||||||||||||||
| Substandard loans | $ | 56,194 | $ | 57,932 | $ | 59,377 | $ | 57,928 | $ | 56,968 | ||||||||||||||||||||||
| 30 to 89 days delinquent | 10,709 | 6,970 | 6,739 | 6,358 | 8,536 | |||||||||||||||||||||||||||
| Non–performing loans: | ||||||||||||||||||||||||||||||||
| 90 days and greater delinquent – accruing interest | 92 | 193 | 210 | 107 | 145 | |||||||||||||||||||||||||||
| Trouble debt restructures – accruing interest | 2,570 | 2,529 | 2,535 | 2,372 | 2,391 | |||||||||||||||||||||||||||
| Trouble debt restructures – non–accrual | 1,548 | 1,665 | 1,345 | 1,501 | 1,521 | |||||||||||||||||||||||||||
| Non–accrual loans | 17,630 | 14,771 | 16,116 | 16,133 | 14,962 | |||||||||||||||||||||||||||
| Total non–performing loans | $ | 21,840 | $ | 19,158 | $ | 20,206 | $ | 20,113 | $ | 19,019 | ||||||||||||||||||||||
| Non–performing loans to total loans | 0.52 | % | 0.47 | % | 0.51 | % | 0.54 | % | 0.52 | % | ||||||||||||||||||||||
| Allocation of the Allowance for Credit Losses | ||||||||||||||||||||||||||||||||
| (Dollars in Thousands, Unaudited) | ||||||||||||||||||||||||||||||||
| December 31, | September 30, | June 30, | March 31, | December 31, | ||||||||||||||||||||||||||||
| 2022 | 2022 | 2022 | 2022 | 2021 | ||||||||||||||||||||||||||||
| Commercial | $ | 32,445 | $ | 33,806 | $ | 34,802 | $ | 37,789 | $ | 40,775 | ||||||||||||||||||||||
| Residential mortgage | 5,577 | 5,137 | 4,422 | 4,351 | 3,856 | |||||||||||||||||||||||||||
| Mortgage warehouse | 1,020 | 1,024 | 1,067 | 1,055 | 1,059 | |||||||||||||||||||||||||||
| Consumer | 11,422 | 11,402 | 12,059 | 9,313 | 8,596 | |||||||||||||||||||||||||||
| Total | $ | 50,464 | $ | 51,369 | $ | 52,350 | $ | 52,508 | $ | 54,286 | ||||||||||||||||||||||
| Net Charge–offs (Recoveries) | ||||||||||||||||||||||||||||||||
| (Dollars in Thousands Except Ratios, Unaudited) | ||||||||||||||||||||||||||||||||
| December 31, | September 30, | June 30, | March 31, | December 31, | ||||||||||||||||||||||||||||
| 2022 | 2022 | 2022 | 2022 | 2021 | ||||||||||||||||||||||||||||
| Commercial | $ | (94) | $ | 51 | $ | (75) | $ | 38 | $ | 926 | ||||||||||||||||||||||
| Residential mortgage | (8) | (75) | 40 | (10) | 126 | |||||||||||||||||||||||||||
| Mortgage warehouse | — | — | — | — | — | |||||||||||||||||||||||||||
| Consumer | 387 | 162 | 319 | 108 | 360 | |||||||||||||||||||||||||||
| Total | $ | 285 | $ | 138 | $ | 284 | $ | 136 | $ | 1,412 | ||||||||||||||||||||||
| Percent of net charge–offs (recoveries) to average loans outstanding for the period | 0.01 | % | 0.00 | % | 0.01 | % | 0.00 | % | 0.04 | % | ||||||||||||||||||||||
16
Horizon Bancorp, Inc. Announces Record Earnings for 2022 and Fourth Quarter Results
| Total Non–performing Loans | ||||||||||||||||||||||||||||||||
| (Dollars in Thousands Except Ratios, Unaudited) | ||||||||||||||||||||||||||||||||
| December 31, | September 30, | June 30, | March 31, | December 31, | ||||||||||||||||||||||||||||
| 2022 | 2022 | 2022 | 2022 | 2021 | ||||||||||||||||||||||||||||
| Commercial | $ | 9,330 | $ | 7,199 | $ | 8,008 | $ | 7,844 | $ | 7,509 | ||||||||||||||||||||||
| Residential mortgage | 8,123 | 8,047 | 8,469 | 8,584 | 8,005 | |||||||||||||||||||||||||||
| Mortgage warehouse | — | — | — | — | — | |||||||||||||||||||||||||||
| Consumer | 4,387 | 3,912 | 3,729 | 3,685 | 3,505 | |||||||||||||||||||||||||||
| Total | $ | 21,840 | $ | 19,158 | $ | 20,206 | $ | 20,113 | $ | 19,019 | ||||||||||||||||||||||
| Non–performing loans to total loans | 0.52 | % | 0.47 | % | 0.51 | % | 0.54 | % | 0.52 | % | ||||||||||||||||||||||
| Other Real Estate Owned and Repossessed Assets | ||||||||||||||||||||||||||||||||
| (Dollars in Thousands, Unaudited) | ||||||||||||||||||||||||||||||||
| December 31, | September 30, | June 30, | March 31, | December 31, | ||||||||||||||||||||||||||||
| 2022 | 2022 | 2022 | 2022 | 2021 | ||||||||||||||||||||||||||||
| Commercial | $ | 1,881 | $ | 3,206 | $ | 1,414 | $ | 2,245 | $ | 2,861 | ||||||||||||||||||||||
| Residential mortgage | 107 | 22 | — | 170 | 695 | |||||||||||||||||||||||||||
| Mortgage warehouse | — | — | — | — | — | |||||||||||||||||||||||||||
| Consumer | 152 | 14 | 58 | 5 | 5 | |||||||||||||||||||||||||||
| Total | $ | 2,140 | $ | 3,242 | $ | 1,472 | $ | 2,420 | $ | 3,561 | ||||||||||||||||||||||
17
Horizon Bancorp, Inc. Announces Record Earnings for 2022 and Fourth Quarter Results
| Average Balance Sheets | ||||||||||||||||||||||||||||||||||||||
| (Dollars in Thousands, Unaudited) | ||||||||||||||||||||||||||||||||||||||
| Three Months Ended | Three Months Ended | |||||||||||||||||||||||||||||||||||||
| December 31, 2022 | December 31, 2021 | |||||||||||||||||||||||||||||||||||||
| Average Balance | Interest | Average Rate | Average Balance | Interest | Average Rate | |||||||||||||||||||||||||||||||||
| Assets | ||||||||||||||||||||||||||||||||||||||
| Interest earning assets | ||||||||||||||||||||||||||||||||||||||
| Federal funds sold | $ | 4,023 | $ | 34 | 3.35 | % | $ | 654,225 | $ | 251 | 0.15 | % | ||||||||||||||||||||||||||
| Interest earning deposits | 8,233 | 48 | 2.31 | % | 22,537 | 32 | 0.56 | % | ||||||||||||||||||||||||||||||
| Investment securities – taxable | 1,655,728 | 8,703 | 2.09 | % | 1,405,689 | 6,208 | 1.75 | % | ||||||||||||||||||||||||||||||
Investment securities – non–taxable (1) | 1,385,340 | 7,543 | 2.73 | % | 1,224,911 | 6,456 | 2.65 | % | ||||||||||||||||||||||||||||||
Loans receivable (2) (3) | 4,038,656 | 50,859 | 5.02 | % | 3,644,688 | 39,672 | 4.34 | % | ||||||||||||||||||||||||||||||
| Total interest earning assets | 7,091,980 | 67,187 | 3.88 | % | 6,952,050 | 52,619 | 3.11 | % | ||||||||||||||||||||||||||||||
| Non–interest earning assets | ||||||||||||||||||||||||||||||||||||||
| Cash and due from banks | 96,835 | 102,273 | ||||||||||||||||||||||||||||||||||||
| Allowance for credit losses | (51,323) | (56,540) | ||||||||||||||||||||||||||||||||||||
| Other assets | 580,874 | 463,560 | ||||||||||||||||||||||||||||||||||||
| Total average assets | $ | 7,718,366 | $ | 7,461,343 | ||||||||||||||||||||||||||||||||||
| Liabilities and Stockholders’ Equity | ||||||||||||||||||||||||||||||||||||||
| Interest bearing liabilities | ||||||||||||||||||||||||||||||||||||||
| Interest bearing deposits | $ | 4,555,887 | $ | 10,520 | 0.92 | % | $ | 4,543,989 | $ | 1,663 | 0.15 | % | ||||||||||||||||||||||||||
| Borrowings | 850,236 | 5,729 | 2.67 | % | 525,638 | 1,025 | 0.77 | % | ||||||||||||||||||||||||||||||
| Repurchase agreements | 141,676 | 311 | 0.87 | % | 137,868 | 36 | 0.10 | % | ||||||||||||||||||||||||||||||
| Subordinated notes | 58,874 | 881 | 5.94 | % | 58,728 | 881 | 5.95 | % | ||||||||||||||||||||||||||||||
| Junior subordinated debentures issued to capital trusts | 56,988 | 964 | 6.71 | % | 56,745 | 537 | 3.75 | % | ||||||||||||||||||||||||||||||
| Total interest bearing liabilities | 5,663,661 | 18,405 | 1.29 | % | 5,322,968 | 4,142 | 0.31 | % | ||||||||||||||||||||||||||||||
| Non–interest bearing liabilities | ||||||||||||||||||||||||||||||||||||||
| Demand deposits | 1,321,139 | 1,366,621 | ||||||||||||||||||||||||||||||||||||
| Accrued interest payable and other liabilities | 73,378 | 52,111 | ||||||||||||||||||||||||||||||||||||
| Stockholders’ equity | 660,188 | 719,643 | ||||||||||||||||||||||||||||||||||||
| Total average liabilities and stockholders’ equity | $ | 7,718,366 | $ | 7,461,343 | ||||||||||||||||||||||||||||||||||
| Net interest income / spread | $ | 48,782 | 2.59 | % | $ | 48,477 | 2.80 | % | ||||||||||||||||||||||||||||||
Net interest income as a percent of average interest earning assets (1) | 2.85 | % | 2.87 | % | ||||||||||||||||||||||||||||||||||
(1) Securities balances represent daily average balances for the fair value of securities. The average rate is calculated based on the daily average balance for the amortized cost of securities. The average rate is presented on a tax equivalent basis. | ||||||||||||||||||||||||||||||||||||||
(2) Includes fees on loans. The inclusion of loan fees does not have a material effect on the average interest rate. | ||||||||||||||||||||||||||||||||||||||
(3) Non–accruing loans for the purpose of the computation above are included in the daily average loan amounts outstanding. Loan totals are shown net of unearned income and deferred loan fees. The average rate is presented on a tax equivalent basis. | ||||||||||||||||||||||||||||||||||||||
18
Horizon Bancorp, Inc. Announces Record Earnings for 2022 and Fourth Quarter Results
| Average Balance Sheets | ||||||||||||||||||||||||||||||||||||||
| (Dollars in Thousands, Unaudited) | ||||||||||||||||||||||||||||||||||||||
| Twelve Months Ended | Twelve Months Ended | |||||||||||||||||||||||||||||||||||||
| December 31, 2022 | December 31, 2021 | |||||||||||||||||||||||||||||||||||||
| Average Balance | Interest | Average Rate | Average Balance | Interest | Average Rate | |||||||||||||||||||||||||||||||||
| Assets | ||||||||||||||||||||||||||||||||||||||
| Interest earning assets | ||||||||||||||||||||||||||||||||||||||
| Federal funds sold | $ | 62,211 | $ | 165 | 0.27 | % | $ | 398,528 | $ | 535 | 0.13 | % | ||||||||||||||||||||||||||
| Interest earning deposits | 13,596 | 141 | 1.04 | % | 25,993 | 160 | 0.62 | % | ||||||||||||||||||||||||||||||
| Investment securities – taxable | 1,700,418 | 33,202 | 1.95 | % | 884,244 | 14,437 | 1.63 | % | ||||||||||||||||||||||||||||||
Investment securities – non–taxable (1) | 1,356,045 | 29,025 | 2.71 | % | 1,086,942 | 23,246 | 2.71 | % | ||||||||||||||||||||||||||||||
Loans receivable (2) (3) | 3,845,137 | 173,500 | 4.53 | % | 3,639,454 | 155,732 | 4.30 | % | ||||||||||||||||||||||||||||||
| Total interest earning assets | 6,977,407 | 236,033 | 3.50 | % | 6,035,161 | 194,110 | 3.33 | % | ||||||||||||||||||||||||||||||
| Non–interest earning assets | ||||||||||||||||||||||||||||||||||||||
| Cash and due from banks | 99,885 | 89,993 | ||||||||||||||||||||||||||||||||||||
| Allowance for credit losses | (52,606) | (56,798) | ||||||||||||||||||||||||||||||||||||
| Other assets | 509,229 | 445,895 | ||||||||||||||||||||||||||||||||||||
| Total average assets | $ | 7,533,915 | $ | 6,514,251 | ||||||||||||||||||||||||||||||||||
| Liabilities and Stockholders’ Equity | ||||||||||||||||||||||||||||||||||||||
| Interest bearing liabilities | ||||||||||||||||||||||||||||||||||||||
| Interest bearing deposits | $ | 4,513,668 | $ | 17,809 | 0.39 | % | $ | 3,897,750 | $ | 7,867 | 0.20 | % | ||||||||||||||||||||||||||
| Borrowings | 696,584 | 11,938 | 1.71 | % | 425,214 | 4,546 | 1.07 | % | ||||||||||||||||||||||||||||||
| Repurchase agreements | 141,048 | 527 | 0.37 | % | 123,675 | 155 | 0.13 | % | ||||||||||||||||||||||||||||||
| Subordinated notes | 58,819 | 3,522 | 5.99 | % | 58,672 | 3,522 | 6.00 | % | ||||||||||||||||||||||||||||||
| Junior subordinated debentures issued to capital trusts | 56,899 | 2,719 | 4.78 | % | 56,657 | 2,215 | 3.91 | % | ||||||||||||||||||||||||||||||
| Total interest bearing liabilities | 5,467,018 | 36,515 | 0.67 | % | 4,561,968 | 18,305 | 0.40 | % | ||||||||||||||||||||||||||||||
| Non–interest bearing liabilities | ||||||||||||||||||||||||||||||||||||||
| Demand deposits | 1,332,937 | 1,188,275 | ||||||||||||||||||||||||||||||||||||
| Accrued interest payable and other liabilities | 50,330 | 51,886 | ||||||||||||||||||||||||||||||||||||
| Stockholders’ equity | 683,630 | 712,122 | ||||||||||||||||||||||||||||||||||||
| Total average liabilities and stockholders’ equity | $ | 7,533,915 | $ | 6,514,251 | ||||||||||||||||||||||||||||||||||
| Net interest income / spread | $ | 199,518 | 2.83 | % | $ | 175,805 | 2.93 | % | ||||||||||||||||||||||||||||||
Net interest income as a percent of average interest earning assets (1) | 2.98 | % | 3.03 | % | ||||||||||||||||||||||||||||||||||
(1) Securities balances represent daily average balances for the fair value of securities. The average rate is calculated based on the daily average balance for the amortized cost of securities. The average rate is presented on a tax equivalent basis. | ||||||||||||||||||||||||||||||||||||||
(2) Includes fees on loans. The inclusion of loan fees does not have a material effect on the average interest rate. | ||||||||||||||||||||||||||||||||||||||
(3) Non–accruing loans for the purpose of the computation above are included in the daily average loan amounts outstanding. Loan totals are shown net of unearned income and deferred loan fees. The average rate is presented on a tax equivalent basis. | ||||||||||||||||||||||||||||||||||||||
19
Horizon Bancorp, Inc. Announces Record Earnings for 2022 and Fourth Quarter Results
| Condensed Consolidated Balance Sheets | ||||||||||||||
| (Dollars in Thousands) | ||||||||||||||
| December 31, 2022 | December 31, 2021 | |||||||||||||
| (Unaudited) | ||||||||||||||
| Assets | ||||||||||||||
| Cash and due from banks | $ | 123,505 | $ | 593,508 | ||||||||||
| Interest earning time deposits | 2,812 | 4,782 | ||||||||||||
| Investment securities, available for sale | 997,558 | 1,160,812 | ||||||||||||
Investment securities, held to maturity (fair value $1,681,309 and $1,559,991) | 2,022,748 | 1,552,443 | ||||||||||||
| Loans held for sale | 5,807 | 12,579 | ||||||||||||
Loans, net of allowance for credit losses of $50,464 and $54,286 | 4,107,534 | 3,604,248 | ||||||||||||
| Premises and equipment, net | 92,677 | 93,441 | ||||||||||||
| Federal Home Loan Bank stock | 26,677 | 24,440 | ||||||||||||
| Goodwill | 155,211 | 154,572 | ||||||||||||
| Other intangible assets | 17,239 | 20,941 | ||||||||||||
| Interest receivable | 35,294 | 26,137 | ||||||||||||
| Cash value of life insurance | 146,175 | 97,150 | ||||||||||||
| Other assets | 139,281 | 66,836 | ||||||||||||
| Total assets | $ | 7,872,518 | $ | 7,411,889 | ||||||||||
| Liabilities | ||||||||||||||
| Deposits | ||||||||||||||
| Non–interest bearing | $ | 1,277,768 | $ | 1,360,338 | ||||||||||
| Interest bearing | 4,580,006 | 4,442,653 | ||||||||||||
| Total deposits | 5,857,774 | 5,802,991 | ||||||||||||
| Borrowings | 1,142,949 | 712,739 | ||||||||||||
| Subordinated notes | 58,896 | 58,750 | ||||||||||||
| Junior subordinated debentures issued to capital trusts | 57,027 | 56,785 | ||||||||||||
| Interest payable | 5,380 | 2,235 | ||||||||||||
| Other liabilities | 73,117 | 55,180 | ||||||||||||
| Total liabilities | 7,195,143 | 6,688,680 | ||||||||||||
| Commitments and contingent liabilities | ||||||||||||||
| Stockholders’ equity | ||||||||||||||
Preferred stock, Authorized, 1,000,000 shares, Issued 0 shares | — | — | ||||||||||||
Common stock, no par value, Authorized 99,000,000 shares Issued and Outstanding 43,937,889 and 43,811,421 shares | — | — | ||||||||||||
| Additional paid–in capital | 354,188 | 352,122 | ||||||||||||
| Retained earnings | 429,385 | 363,742 | ||||||||||||
| Accumulated other comprehensive income | (106,198) | 7,345 | ||||||||||||
| Total stockholders’ equity | 677,375 | 723,209 | ||||||||||||
| Total liabilities and stockholders’ equity | $ | 7,872,518 | $ | 7,411,889 | ||||||||||
20
Horizon Bancorp, Inc. Announces Record Earnings for 2022 and Fourth Quarter Results
| Condensed Consolidated Statements of Income | ||||||||||||||||||||||||||||||||
| (Dollars in Thousands Except Per Share Data, Unaudited) | ||||||||||||||||||||||||||||||||
| Three Months Ended | ||||||||||||||||||||||||||||||||
| December 31, | September 30, | June 30, | March 31, | December 31, | ||||||||||||||||||||||||||||
| 2022 | 2022 | 2022 | 2022 | 2021 | ||||||||||||||||||||||||||||
| Interest income | ||||||||||||||||||||||||||||||||
| Loans receivable | $ | 50,859 | $ | 45,517 | $ | 40,585 | $ | 36,539 | $ | 39,672 | ||||||||||||||||||||||
| Investment securities – taxable | 8,785 | 8,501 | 8,716 | 7,506 | 6,491 | |||||||||||||||||||||||||||
| Investment securities – non–taxable | 7,543 | 7,478 | 7,307 | 6,697 | 6,456 | |||||||||||||||||||||||||||
| Total interest income | 67,187 | 61,496 | 56,608 | 50,742 | 52,619 | |||||||||||||||||||||||||||
| Interest expense | ||||||||||||||||||||||||||||||||
| Deposits | 10,520 | 4,116 | 1,677 | 1,496 | 1,663 | |||||||||||||||||||||||||||
| Borrowed funds | 6,040 | 3,895 | 1,450 | 1,080 | 1,061 | |||||||||||||||||||||||||||
| Subordinated notes | 881 | 880 | 881 | 880 | 881 | |||||||||||||||||||||||||||
| Junior subordinated debentures issued to capital trusts | 964 | 744 | 556 | 455 | 537 | |||||||||||||||||||||||||||
| Total interest expense | 18,405 | 9,635 | 4,564 | 3,911 | 4,142 | |||||||||||||||||||||||||||
| Net interest income | 48,782 | 51,861 | 52,044 | 46,831 | 48,477 | |||||||||||||||||||||||||||
| Credit loss expense (recovery) | (69) | (601) | 240 | (1,386) | (2,071) | |||||||||||||||||||||||||||
| Net interest income after credit loss expense (recovery) | 48,851 | 52,462 | 51,804 | 48,217 | 50,548 | |||||||||||||||||||||||||||
| Non–interest Income | ||||||||||||||||||||||||||||||||
| Service charges on deposit accounts | 2,947 | 3,023 | 2,833 | 2,795 | 2,510 | |||||||||||||||||||||||||||
| Wire transfer fees | 118 | 148 | 170 | 159 | 205 | |||||||||||||||||||||||||||
| Interchange fees | 2,951 | 3,089 | 3,582 | 2,780 | 3,082 | |||||||||||||||||||||||||||
| Fiduciary activities | 1,270 | 1,203 | 1,405 | 1,503 | 1,591 | |||||||||||||||||||||||||||
| Gain on sale of mortgage loans | 1,196 | 1,441 | 2,501 | 2,027 | 4,167 | |||||||||||||||||||||||||||
| Mortgage servicing income net of impairment | 637 | 355 | 319 | 3,489 | 300 | |||||||||||||||||||||||||||
| Increase in cash value of bank owned life insurance | 751 | 814 | 519 | 510 | 547 | |||||||||||||||||||||||||||
| Death benefit on bank owned life insurance | — | — | 644 | — | — | |||||||||||||||||||||||||||
| Other income | 804 | 115 | 461 | 892 | 426 | |||||||||||||||||||||||||||
| Total non–interest income | 10,674 | 10,188 | 12,434 | 14,155 | 12,828 | |||||||||||||||||||||||||||
| Non–interest expense | ||||||||||||||||||||||||||||||||
| Salaries and employee benefits | 19,978 | 20,613 | 19,957 | 19,735 | 20,549 | |||||||||||||||||||||||||||
| Net occupancy expenses | 3,279 | 3,293 | 3,190 | 3,561 | 3,204 | |||||||||||||||||||||||||||
| Data processing | 2,884 | 2,539 | 2,607 | 2,537 | 2,672 | |||||||||||||||||||||||||||
| Professional fees | 694 | 552 | 283 | 314 | 562 | |||||||||||||||||||||||||||
| Outside services and consultants | 2,985 | 2,855 | 2,485 | 2,525 | 2,197 | |||||||||||||||||||||||||||
| Loan expense | 1,281 | 1,392 | 1,533 | 1,205 | 1,304 | |||||||||||||||||||||||||||
| FDIC insurance expense | 388 | 670 | 775 | 725 | 798 | |||||||||||||||||||||||||||
| Other losses | 118 | 398 | 362 | 168 | 1,925 | |||||||||||||||||||||||||||
| Other expenses | 4,104 | 4,504 | 4,212 | 4,500 | 4,660 | |||||||||||||||||||||||||||
| Total non–interest expense | 35,711 | 36,816 | 35,404 | 35,270 | 37,871 | |||||||||||||||||||||||||||
| Income before income taxes | 23,814 | 25,834 | 28,834 | 27,102 | 25,505 | |||||||||||||||||||||||||||
| Income tax expense | 2,649 | 2,013 | 3,975 | 3,539 | 4,080 | |||||||||||||||||||||||||||
| Net income | $ | 21,165 | $ | 23,821 | $ | 24,859 | $ | 23,563 | $ | 21,425 | ||||||||||||||||||||||
| Basic earnings per share | $ | 0.49 | $ | 0.55 | $ | 0.57 | $ | 0.54 | $ | 0.49 | ||||||||||||||||||||||
| Diluted earnings per share | 0.48 | 0.55 | 0.57 | 0.54 | 0.49 | |||||||||||||||||||||||||||
21
Horizon Bancorp, Inc. Announces Record Earnings for 2022 and Fourth Quarter Results
| Condensed Consolidated Statements of Income | ||||||||||||||
| (Dollars in Thousands Except Per Share Data, Unaudited) | ||||||||||||||
| Twelve Months Ended | ||||||||||||||
| December 31, | December 31, | |||||||||||||
| 2022 | 2021 | |||||||||||||
| Interest income | ||||||||||||||
| Loans receivable | $ | 173,500 | $ | 155,732 | ||||||||||
| Investment securities – taxable | 33,508 | 15,132 | ||||||||||||
| Investment securities – non–taxable | 29,025 | 23,246 | ||||||||||||
| Total interest income | 236,033 | 194,110 | ||||||||||||
| Interest expense | ||||||||||||||
| Deposits | 17,809 | 7,867 | ||||||||||||
| Borrowed funds | 12,465 | 4,701 | ||||||||||||
| Subordinated notes | 3,522 | 3,522 | ||||||||||||
| Junior subordinated debentures issued to capital trusts | 2,719 | 2,215 | ||||||||||||
| Total interest expense | 36,515 | 18,305 | ||||||||||||
| Net interest income | 199,518 | 175,805 | ||||||||||||
| Credit loss expense (recovery) | (1,816) | (2,084) | ||||||||||||
| Net interest income after credit loss expense (recovery) | 201,334 | 177,889 | ||||||||||||
| Non–interest Income | ||||||||||||||
| Service charges on deposit accounts | 11,598 | 9,192 | ||||||||||||
| Wire transfer fees | 595 | 892 | ||||||||||||
| Interchange fees | 12,402 | 10,901 | ||||||||||||
| Fiduciary activities | 5,381 | 7,419 | ||||||||||||
| Gains / (losses) on sale of investment securities | — | 914 | ||||||||||||
| Gain on sale of mortgage loans | 7,165 | 19,163 | ||||||||||||
| Mortgage servicing income net of impairment | 4,800 | 2,352 | ||||||||||||
| Increase in cash value of bank owned life insurance | 2,594 | 2,094 | ||||||||||||
| Death benefit on bank owned life insurance | 644 | 783 | ||||||||||||
| Other income | 2,272 | 4,242 | ||||||||||||
| Total non–interest income | 47,451 | 57,952 | ||||||||||||
| Non–interest expense | ||||||||||||||
| Salaries and employee benefits | 80,283 | 74,051 | ||||||||||||
| Net occupancy expenses | 13,323 | 12,541 | ||||||||||||
| Data processing | 10,567 | 9,962 | ||||||||||||
| Professional fees | 1,843 | 2,216 | ||||||||||||
| Outside services and consultants | 10,850 | 8,449 | ||||||||||||
| Loan expense | 5,411 | 5,492 | ||||||||||||
| FDIC insurance expense | 2,558 | 2,377 | ||||||||||||
| Other losses | 1,046 | 2,283 | ||||||||||||
| Other expenses | 17,320 | 16,023 | ||||||||||||
| Total non–interest expense | 143,201 | 133,394 | ||||||||||||
| Income before income taxes | 105,584 | 102,447 | ||||||||||||
| Income tax expense | 12,176 | 15,356 | ||||||||||||
| Net income | $ | 93,408 | $ | 87,091 | ||||||||||
| Basic earnings per share | $ | 2.14 | $ | 1.99 | ||||||||||
| Diluted earnings per share | 2.14 | 1.98 | ||||||||||||
22
Horizon Bancorp, Inc. Announces Record Earnings for 2022 and Fourth Quarter Results
Use of Non–GAAP Financial Measures
Certain information set forth in this press release refers to financial measures determined by methods other than in accordance with GAAP. Specifically, we have included non–GAAP financial measures relating to net income, diluted earnings per share, pre–tax, pre–provision income, net interest margin, tangible stockholders’ equity, tangible book value per share, efficiency ratio, the return on average assets, the return on average common equity and the return on average tangible equity. In each case, we have identified special circumstances that we consider to be non–recurring and have excluded them. We believe that this shows the impact of such events as acquisition–related purchase accounting adjustments, among others we have identified in our reconciliations. Horizon believes these non–GAAP financial measures are helpful to investors and provide a greater understanding of our business and financial results without giving effect to the purchase accounting impacts and one–time costs of acquisitions and non–recurring items. These measures are not necessarily comparable to similar measures that may be presented by other companies and should not be considered in isolation or as a substitute for the related GAAP measure. See the tables and other information below and contained elsewhere in this press release for reconciliations of the non–GAAP information identified herein and its most comparable GAAP measures.
23
Horizon Bancorp, Inc. Announces Record Earnings for 2022 and Fourth Quarter Results
| Non–GAAP Reconciliation of Net Income | ||||||||||||||||||||||||||||||||||||||||||||
| (Dollars in Thousands, Unaudited) | ||||||||||||||||||||||||||||||||||||||||||||
| Three Months Ended | Twelve Months Ended | |||||||||||||||||||||||||||||||||||||||||||
| December 31, | September 30, | June 30, | March 31, | December 31, | December 31, | December 31, | ||||||||||||||||||||||||||||||||||||||
| 2022 | 2022 | 2022 | 2022 | 2021 | 2022 | 2021 | ||||||||||||||||||||||||||||||||||||||
| Net income as reported | $ | 21,165 | $ | 23,821 | $ | 24,859 | $ | 23,563 | $ | 21,425 | $ | 93,408 | $ | 87,091 | ||||||||||||||||||||||||||||||
| Acquisition expenses | — | — | — | — | 884 | — | 1,925 | |||||||||||||||||||||||||||||||||||||
| Tax effect | — | — | — | — | (184) | — | (401) | |||||||||||||||||||||||||||||||||||||
| Net income excluding acquisition expenses | 21,165 | 23,821 | 24,859 | 23,563 | 22,125 | 93,408 | 88,615 | |||||||||||||||||||||||||||||||||||||
| Credit loss expense acquired loans | — | — | — | — | — | — | 2,034 | |||||||||||||||||||||||||||||||||||||
| Tax effect | — | — | — | — | — | — | (427) | |||||||||||||||||||||||||||||||||||||
| Net income excluding credit loss expense acquired loans | 21,165 | 23,821 | 24,859 | 23,563 | 22,125 | 93,408 | 90,222 | |||||||||||||||||||||||||||||||||||||
| Gain on sale of ESOP trustee accounts | — | — | — | — | — | — | (2,329) | |||||||||||||||||||||||||||||||||||||
| Tax effect | — | — | — | — | — | — | 489 | |||||||||||||||||||||||||||||||||||||
| Net income excluding gain on sale of ESOP trustee accounts | 21,165 | 23,821 | 24,859 | 23,563 | 22,125 | 93,408 | 88,382 | |||||||||||||||||||||||||||||||||||||
| ESOP settlement expenses | — | — | — | — | 1,900 | — | 1,900 | |||||||||||||||||||||||||||||||||||||
| Tax effect | — | — | — | — | (315) | — | (315) | |||||||||||||||||||||||||||||||||||||
| Net income excluding ESOP settlement expenses | 21,165 | 23,821 | 24,859 | 23,563 | 23,710 | 93,408 | 89,967 | |||||||||||||||||||||||||||||||||||||
| (Gain) / loss on sale of investment securities | — | — | — | — | — | — | (914) | |||||||||||||||||||||||||||||||||||||
| Tax effect | — | — | — | — | — | — | 192 | |||||||||||||||||||||||||||||||||||||
| Net income excluding (gain) / loss on sale of investment securities | 21,165 | 23,821 | 24,859 | 23,563 | 23,710 | 93,408 | 89,245 | |||||||||||||||||||||||||||||||||||||
| Death benefit on bank owned life insurance (“BOLI”) | — | — | (644) | — | — | (644) | (783) | |||||||||||||||||||||||||||||||||||||
| Net income excluding death benefit on BOLI | 21,165 | 23,821 | 24,215 | 23,563 | 23,710 | 92,764 | 88,462 | |||||||||||||||||||||||||||||||||||||
| Prepayment penalties on borrowings | — | — | — | — | — | — | 125 | |||||||||||||||||||||||||||||||||||||
| Tax effect | — | — | — | — | — | — | (26) | |||||||||||||||||||||||||||||||||||||
| Net income excluding prepayment penalties on borrowings | 21,165 | 23,821 | 24,215 | 23,563 | 23,710 | 92,764 | 88,561 | |||||||||||||||||||||||||||||||||||||
| Adjusted net income | $ | 21,165 | $ | 23,821 | $ | 24,215 | $ | 23,563 | $ | 23,710 | $ | 92,764 | $ | 88,561 | ||||||||||||||||||||||||||||||
24
Horizon Bancorp, Inc. Announces Record Earnings for 2022 and Fourth Quarter Results
| Non–GAAP Reconciliation of Diluted Earnings per Share | ||||||||||||||||||||||||||||||||||||||||||||
| (Dollars in Thousands, Unaudited) | ||||||||||||||||||||||||||||||||||||||||||||
| Three Months Ended | Twelve Months Ended | |||||||||||||||||||||||||||||||||||||||||||
| December 31, | September 30, | June 30, | March 31, | December 31, | December 31, | December 31, | ||||||||||||||||||||||||||||||||||||||
| 2022 | 2022 | 2022 | 2022 | 2021 | 2022 | 2021 | ||||||||||||||||||||||||||||||||||||||
| Diluted earnings per share (“EPS”) as reported | $ | 0.48 | $ | 0.55 | $ | 0.57 | $ | 0.54 | $ | 0.49 | $ | 2.14 | $ | 1.98 | ||||||||||||||||||||||||||||||
| Acquisition expenses | — | — | — | — | 0.02 | — | 0.04 | |||||||||||||||||||||||||||||||||||||
| Tax effect | — | — | — | — | — | — | — | |||||||||||||||||||||||||||||||||||||
| Diluted EPS excluding acquisition expenses | 0.48 | 0.55 | 0.57 | 0.54 | 0.51 | 2.14 | 2.02 | |||||||||||||||||||||||||||||||||||||
| Credit loss expense acquired loans | — | — | — | — | — | — | 0.05 | |||||||||||||||||||||||||||||||||||||
| Tax effect | — | — | — | — | — | — | (0.01) | |||||||||||||||||||||||||||||||||||||
| Diluted EPS excluding credit loss expense acquired loans | 0.48 | 0.55 | 0.57 | 0.54 | 0.51 | 2.14 | 2.06 | |||||||||||||||||||||||||||||||||||||
| Gain on sale of ESOP trustee accounts | — | — | — | — | — | — | (0.05) | |||||||||||||||||||||||||||||||||||||
| Tax effect | — | — | — | — | — | — | 0.01 | |||||||||||||||||||||||||||||||||||||
| Diluted EPS excluding gain on sale of ESOP trustee accounts | 0.48 | 0.55 | 0.57 | 0.54 | 0.51 | 2.14 | 2.02 | |||||||||||||||||||||||||||||||||||||
| ESOP settlement expenses | — | — | — | — | 0.04 | — | 0.04 | |||||||||||||||||||||||||||||||||||||
| Tax effect | — | — | — | — | (0.01) | — | (0.01) | |||||||||||||||||||||||||||||||||||||
| Diluted EPS excluding ESOP settlement expenses | 0.48 | 0.55 | 0.57 | 0.54 | 0.54 | 2.14 | 2.05 | |||||||||||||||||||||||||||||||||||||
| (Gain) / loss on sale of investment securities | — | — | — | — | — | — | (0.02) | |||||||||||||||||||||||||||||||||||||
| Tax effect | — | — | — | — | — | — | — | |||||||||||||||||||||||||||||||||||||
| Diluted EPS excluding (gain) / loss on sale of investment securities | 0.48 | 0.55 | 0.57 | 0.54 | 0.54 | 2.14 | 2.03 | |||||||||||||||||||||||||||||||||||||
| Death benefit on bank owned life insurance (“BOLI”) | — | — | (0.01) | — | — | (0.01) | (0.03) | |||||||||||||||||||||||||||||||||||||
| Diluted EPS excluding death benefit on BOLI | 0.48 | 0.55 | 0.56 | 0.54 | 0.54 | 2.13 | 2.00 | |||||||||||||||||||||||||||||||||||||
| Prepayment penalties on borrowings | — | — | — | — | — | — | — | |||||||||||||||||||||||||||||||||||||
| Tax effect | — | — | — | — | — | — | — | |||||||||||||||||||||||||||||||||||||
| Diluted EPS excluding prepayment penalties on borrowings | 0.48 | 0.55 | 0.56 | 0.54 | 0.54 | 2.13 | 2.00 | |||||||||||||||||||||||||||||||||||||
| Adjusted diluted EPS | $ | 0.48 | $ | 0.55 | $ | 0.56 | $ | 0.54 | $ | 0.54 | $ | 2.13 | $ | 2.00 | ||||||||||||||||||||||||||||||
25
Horizon Bancorp, Inc. Announces Record Earnings for 2022 and Fourth Quarter Results
| Non–GAAP Reconciliation of Pre–Tax, Pre–Provision Income | ||||||||||||||||||||||||||||||||||||||||||||
| (Dollars in Thousands, Unaudited) | ||||||||||||||||||||||||||||||||||||||||||||
| Three Months Ended | Twelve Months Ended | |||||||||||||||||||||||||||||||||||||||||||
| December 31, | September 30, | June 30, | March 31, | December 31, | December 31, | December 31, | ||||||||||||||||||||||||||||||||||||||
| 2022 | 2022 | 2022 | 2022 | 2021 | 2022 | 2021 | ||||||||||||||||||||||||||||||||||||||
| Pre–tax income | $ | 23,814 | $ | 25,834 | $ | 28,834 | $ | 27,102 | $ | 25,505 | $ | 105,584 | $ | 102,447 | ||||||||||||||||||||||||||||||
| Credit loss expense | (69) | (601) | 240 | (1,386) | (2,071) | (1,816) | (2,084) | |||||||||||||||||||||||||||||||||||||
| Pre–tax, pre–provision income | $ | 23,745 | $ | 25,233 | $ | 29,074 | $ | 25,716 | $ | 23,434 | $ | 103,768 | $ | 100,363 | ||||||||||||||||||||||||||||||
| Pre–tax, pre–provision income | $ | 23,745 | $ | 25,233 | $ | 29,074 | $ | 25,716 | $ | 23,434 | $ | 103,768 | $ | 100,363 | ||||||||||||||||||||||||||||||
| Acquisition expenses | — | — | — | — | 884 | — | 1,925 | |||||||||||||||||||||||||||||||||||||
| Gain on sale of ESOP trustee accounts | — | — | — | — | — | — | (2,329) | |||||||||||||||||||||||||||||||||||||
| ESOP settlement expenses | — | — | — | — | 1,900 | — | 1,900 | |||||||||||||||||||||||||||||||||||||
| (Gain) / loss on sale of investment securities | — | — | — | — | — | — | (914) | |||||||||||||||||||||||||||||||||||||
| Death benefit on BOLI | — | — | (644) | — | — | (644) | (783) | |||||||||||||||||||||||||||||||||||||
| Prepayment penalties on borrowings | — | — | — | — | — | — | 125 | |||||||||||||||||||||||||||||||||||||
| Adjusted pre–tax, pre–provision income | $ | 23,745 | $ | 25,233 | $ | 28,430 | $ | 25,716 | $ | 26,218 | $ | 103,124 | $ | 100,162 | ||||||||||||||||||||||||||||||
| Non–GAAP Reconciliation of Net Interest Margin | ||||||||||||||||||||||||||||||||||||||||||||
| (Dollars in Thousands, Unaudited) | ||||||||||||||||||||||||||||||||||||||||||||
| Three Months Ended | Twelve Months Ended | |||||||||||||||||||||||||||||||||||||||||||
| December 31, | September 30, | June 30, | March 31, | December 31, | December 31, | December 31, | ||||||||||||||||||||||||||||||||||||||
| 2022 | 2022 | 2022 | 2022 | 2021 | 2022 | 2021 | ||||||||||||||||||||||||||||||||||||||
| Net interest income as reported | $ | 48,782 | $ | 51,861 | $ | 52,044 | $ | 46,831 | $ | 48,477 | $ | 199,518 | $ | 175,805 | ||||||||||||||||||||||||||||||
| Average interest earning assets | 7,091,980 | 7,056,208 | 6,943,633 | 6,814,756 | 6,952,050 | 6,977,407 | 6,035,161 | |||||||||||||||||||||||||||||||||||||
| Net interest income as a percentage of average interest earning assets (“Net Interest Margin”) | 2.85 | % | 3.04 | % | 3.13 | % | 2.90 | % | 2.87 | % | 2.98 | % | 3.03 | % | ||||||||||||||||||||||||||||||
| Net interest income as reported | $ | 48,782 | $ | 51,861 | $ | 52,044 | $ | 46,831 | $ | 48,477 | $ | 199,518 | $ | 175,805 | ||||||||||||||||||||||||||||||
| Acquisition–related purchase accounting adjustments (“PAUs”) | (431) | (906) | (1,223) | (916) | (1,819) | (3,476) | (4,503) | |||||||||||||||||||||||||||||||||||||
| Prepayment penalties on borrowings | — | — | — | — | — | — | 125 | |||||||||||||||||||||||||||||||||||||
| Adjusted net interest income | $ | 48,351 | $ | 50,955 | $ | 50,821 | $ | 45,915 | $ | 46,658 | $ | 196,042 | $ | 171,302 | ||||||||||||||||||||||||||||||
| Adjusted net interest margin | 2.83 | % | 2.99 | % | 3.06 | % | 2.85 | % | 2.77 | % | 2.93 | % | 2.96 | % | ||||||||||||||||||||||||||||||
26
Horizon Bancorp, Inc. Announces Record Earnings for 2022 and Fourth Quarter Results
| Non–GAAP Reconciliation of Tangible Stockholders’ Equity and Tangible Book Value per Share | ||||||||||||||||||||||||||||||||
| (Dollars in Thousands, Unaudited) | ||||||||||||||||||||||||||||||||
| December 31, | September 30, | June 30, | March 31, | December 31, | ||||||||||||||||||||||||||||
| 2022 | 2022 | 2022 | 2022 | 2021 | ||||||||||||||||||||||||||||
| Total stockholders’ equity | $ | 677,375 | $ | 644,993 | $ | 657,865 | $ | 677,450 | $ | 723,209 | ||||||||||||||||||||||
| Less: Intangible assets | 172,450 | 173,375 | 173,662 | 174,588 | 175,513 | |||||||||||||||||||||||||||
| Total tangible stockholders’ equity | $ | 504,925 | $ | 471,618 | $ | 484,203 | $ | 502,862 | $ | 547,696 | ||||||||||||||||||||||
| Common shares outstanding | 43,574,151 | 43,574,151 | 43,572,796 | 43,572,796 | 43,547,942 | |||||||||||||||||||||||||||
| Book value per common share | $ | 15.55 | $ | 14.80 | $ | 15.10 | $ | 15.55 | $ | 16.61 | ||||||||||||||||||||||
| Tangible book value per common share | $ | 11.59 | $ | 10.82 | $ | 11.11 | $ | 11.54 | $ | 12.58 | ||||||||||||||||||||||
27
Horizon Bancorp, Inc. Announces Record Earnings for 2022 and Fourth Quarter Results
| Non–GAAP Calculation and Reconciliation of Efficiency Ratio and Adjusted Efficiency Ratio | ||||||||||||||||||||||||||||||||||||||||||||
| (Dollars in Thousands, Unaudited) | ||||||||||||||||||||||||||||||||||||||||||||
| Three Months Ended | Twelve Months Ended | |||||||||||||||||||||||||||||||||||||||||||
| December 31, | September 30, | June 30, | March 31, | December 31, | December 31, | December 31, | ||||||||||||||||||||||||||||||||||||||
| 2022 | 2022 | 2022 | 2022 | 2021 | 2022 | 2021 | ||||||||||||||||||||||||||||||||||||||
| Non–interest expense as reported | $ | 35,711 | $ | 36,816 | $ | 35,404 | $ | 35,270 | $ | 37,871 | $ | 143,201 | $ | 133,394 | ||||||||||||||||||||||||||||||
| Net interest income as reported | 48,782 | 51,861 | 52,044 | 46,831 | 48,477 | 199,518 | 175,805 | |||||||||||||||||||||||||||||||||||||
| Non–interest income as reported | $ | 10,674 | $ | 10,188 | $ | 12,434 | $ | 14,155 | $ | 12,828 | $ | 47,451 | $ | 57,952 | ||||||||||||||||||||||||||||||
| Non–interest expense / (Net interest income + Non–interest income) (“Efficiency Ratio”) | 60.06 | % | 59.33 | % | 54.91 | % | 57.83 | % | 61.77 | % | 57.98 | % | 57.07 | % | ||||||||||||||||||||||||||||||
| Non–interest expense as reported | $ | 35,711 | $ | 36,816 | $ | 35,404 | $ | 35,270 | $ | 37,871 | $ | 143,201 | $ | 133,394 | ||||||||||||||||||||||||||||||
| Acquisition expenses | — | — | — | — | (884) | — | (1,925) | |||||||||||||||||||||||||||||||||||||
| ESOP settlement expenses | — | — | — | — | (1,900) | — | (1,900) | |||||||||||||||||||||||||||||||||||||
| Non–interest expense excluding acquisition expenses and ESOP settlement expenses | 35,711 | 36,816 | 35,404 | 35,270 | 35,087 | 143,201 | 129,569 | |||||||||||||||||||||||||||||||||||||
| Net interest income as reported | 48,782 | 51,861 | 52,044 | 46,831 | 48,477 | 199,518 | 175,805 | |||||||||||||||||||||||||||||||||||||
| Prepayment penalties on borrowings | — | — | — | — | — | — | 125 | |||||||||||||||||||||||||||||||||||||
| Net interest income excluding prepayment penalties on borrowings | 48,782 | 51,861 | 52,044 | 46,831 | 48,477 | 199,518 | 175,930 | |||||||||||||||||||||||||||||||||||||
| Non–interest income as reported | 10,674 | 10,188 | 12,434 | 14,155 | 12,828 | 47,451 | 57,952 | |||||||||||||||||||||||||||||||||||||
| Gain on sale of ESOP trustee accounts | — | — | — | — | — | — | (2,329) | |||||||||||||||||||||||||||||||||||||
| (Gain) / loss on sale of investment securities | — | — | — | — | — | — | (914) | |||||||||||||||||||||||||||||||||||||
| Death benefit on BOLI | — | — | (644) | — | — | (644) | (783) | |||||||||||||||||||||||||||||||||||||
| Non–interest income excluding (gain) / loss on sale of investment securities and death benefit on BOLI | $ | 10,674 | $ | 10,188 | $ | 11,790 | $ | 14,155 | $ | 12,828 | $ | 46,807 | $ | 53,926 | ||||||||||||||||||||||||||||||
| Adjusted efficiency ratio | 60.06 | % | 59.33 | % | 55.46 | % | 57.83 | % | 57.23 | % | 58.13 | % | 56.37 | % | ||||||||||||||||||||||||||||||
28
Horizon Bancorp, Inc. Announces Record Earnings for 2022 and Fourth Quarter Results
| Non–GAAP Reconciliation of Return on Average Assets | ||||||||||||||||||||||||||||||||||||||||||||
| (Dollars in Thousands, Unaudited) | ||||||||||||||||||||||||||||||||||||||||||||
| Three Months Ended | Twelve Months Ended | |||||||||||||||||||||||||||||||||||||||||||
| December 31, | September 30, | June 30, | March 31, | December 31, | December 31, | December 31, | ||||||||||||||||||||||||||||||||||||||
| 2022 | 2022 | 2022 | 2022 | 2021 | 2022 | 2021 | ||||||||||||||||||||||||||||||||||||||
| Average assets | $ | 7,718,366 | $ | 7,635,102 | $ | 7,476,238 | $ | 7,319,675 | $ | 7,461,343 | $ | 7,533,915 | $ | 6,514,251 | ||||||||||||||||||||||||||||||
| Return on average assets (“ROAA”) as reported | 1.09 | % | 1.24 | % | 1.33 | % | 1.31 | % | 1.14 | % | 1.24 | % | 1.34 | % | ||||||||||||||||||||||||||||||
| Acquisition expenses | — | — | — | — | 0.05 | — | 0.03 | |||||||||||||||||||||||||||||||||||||
| Tax effect | — | — | — | — | (0.01) | — | (0.01) | |||||||||||||||||||||||||||||||||||||
| ROAA excluding acquisition expenses | 1.09 | 1.24 | 1.33 | 1.31 | 1.18 | 1.24 | 1.36 | |||||||||||||||||||||||||||||||||||||
| Credit loss expense acquired loans | — | — | — | — | — | — | 0.03 | |||||||||||||||||||||||||||||||||||||
| Tax effect | — | — | — | — | — | — | (0.01) | |||||||||||||||||||||||||||||||||||||
| ROAA excluding credit loss expense on acquired loans | 1.09 | 1.24 | 1.33 | 1.31 | 1.18 | 1.24 | 1.38 | |||||||||||||||||||||||||||||||||||||
| Gain on sale of ESOP trustee accounts | — | — | — | — | — | — | (0.04) | |||||||||||||||||||||||||||||||||||||
| Tax effect | — | — | — | — | — | — | 0.01 | |||||||||||||||||||||||||||||||||||||
| ROAA excluding gain on sale of ESOP trustee accounts | 1.09 | 1.24 | 1.33 | 1.31 | 1.18 | 1.24 | 1.35 | |||||||||||||||||||||||||||||||||||||
| ESOP settlement expenses | — | — | — | — | 0.10 | — | 0.03 | |||||||||||||||||||||||||||||||||||||
| Tax effect | — | — | — | — | (0.02) | — | — | |||||||||||||||||||||||||||||||||||||
| ROAA excluding ESOP settlement expenses | 1.09 | 1.24 | 1.33 | 1.31 | 1.26 | 1.24 | 1.38 | |||||||||||||||||||||||||||||||||||||
| (Gain) / loss on sale of investment securities | — | — | — | — | — | — | (0.01) | |||||||||||||||||||||||||||||||||||||
| Tax effect | — | — | — | — | — | — | — | |||||||||||||||||||||||||||||||||||||
| ROAA excluding (gain) / loss on sale of investment securities | 1.09 | 1.24 | 1.33 | 1.31 | 1.26 | 1.24 | 1.37 | |||||||||||||||||||||||||||||||||||||
| Death benefit on BOLI | — | — | (0.03) | — | — | (0.01) | (0.01) | |||||||||||||||||||||||||||||||||||||
| ROAA excluding death benefit on BOLI | 1.09 | 1.24 | 1.30 | 1.31 | 1.26 | 1.23 | 1.36 | |||||||||||||||||||||||||||||||||||||
| Prepayment penalties on borrowings | — | — | — | — | — | — | — | |||||||||||||||||||||||||||||||||||||
| Tax effect | — | — | — | — | — | — | — | |||||||||||||||||||||||||||||||||||||
| ROAA excluding prepayment penalties on borrowings | 1.09 | 1.24 | 1.30 | 1.31 | 1.26 | 1.23 | 1.36 | |||||||||||||||||||||||||||||||||||||
| Adjusted ROAA | 1.09 | % | 1.24 | % | 1.30 | % | 1.31 | % | 1.26 | % | 1.23 | % | 1.36 | % | ||||||||||||||||||||||||||||||
29
Horizon Bancorp, Inc. Announces Record Earnings for 2022 and Fourth Quarter Results
| Non–GAAP Reconciliation of Return on Average Common Equity | ||||||||||||||||||||||||||||||||||||||||||||
| (Dollars in Thousands, Unaudited) | ||||||||||||||||||||||||||||||||||||||||||||
| Three Months Ended | Twelve Months Ended | |||||||||||||||||||||||||||||||||||||||||||
| December 31, | September 30, | June 30, | March 31, | December 31, | December 31, | December 31, | ||||||||||||||||||||||||||||||||||||||
| 2022 | 2022 | 2022 | 2022 | 2021 | 2022 | 2021 | ||||||||||||||||||||||||||||||||||||||
| Average common equity | $ | 660,188 | $ | 680,376 | $ | 677,299 | $ | 716,341 | $ | 719,643 | $ | 683,630 | $ | 712,122 | ||||||||||||||||||||||||||||||
| Return on average common equity (“ROACE”) as reported | 12.72 | % | 13.89 | % | 14.72 | % | 13.34 | % | 11.81 | % | 13.66 | % | 12.23 | % | ||||||||||||||||||||||||||||||
| Acquisition expenses | — | — | — | — | 0.49 | — | 0.27 | |||||||||||||||||||||||||||||||||||||
| Tax effect | — | — | — | — | (0.10) | — | (0.06) | |||||||||||||||||||||||||||||||||||||
| ROACE excluding acquisition expenses | 12.72 | 13.89 | 14.72 | 13.34 | 12.20 | 13.66 | 12.44 | |||||||||||||||||||||||||||||||||||||
| Credit loss expense acquired loans | — | — | — | — | — | — | 0.29 | |||||||||||||||||||||||||||||||||||||
| Tax effect | — | — | — | — | — | — | (0.06) | |||||||||||||||||||||||||||||||||||||
| ROACE excluding credit loss expense acquired loans | 12.72 | 13.89 | 14.72 | 13.34 | 12.20 | 13.66 | 12.67 | |||||||||||||||||||||||||||||||||||||
| Gain on sale of ESOP trustee accounts | — | — | — | — | — | — | (0.33) | |||||||||||||||||||||||||||||||||||||
| Tax effect | — | — | — | — | — | — | 0.07 | |||||||||||||||||||||||||||||||||||||
| ROACE excluding gain on sale of ESOP trustee accounts | 12.72 | 13.89 | 14.72 | 13.34 | 12.20 | 13.66 | 12.41 | |||||||||||||||||||||||||||||||||||||
| ESOP settlement expenses | — | — | — | — | 1.05 | — | 0.27 | |||||||||||||||||||||||||||||||||||||
| Tax effect | — | — | — | — | (0.17) | — | (0.04) | |||||||||||||||||||||||||||||||||||||
| ROACE excluding ESOP settlement expenses | 12.72 | 13.89 | 14.72 | 13.34 | 13.08 | 13.66 | 12.64 | |||||||||||||||||||||||||||||||||||||
| (Gain) / loss on sale of investment securities | — | — | — | — | — | — | (0.13) | |||||||||||||||||||||||||||||||||||||
| Tax effect | — | — | — | — | — | — | 0.03 | |||||||||||||||||||||||||||||||||||||
| ROACE excluding (gain) / loss on sale of investment securities | 12.72 | 13.89 | 14.72 | 13.34 | 13.08 | 13.66 | 12.54 | |||||||||||||||||||||||||||||||||||||
| Death benefit on BOLI | — | — | (0.38) | — | — | (0.09) | (0.11) | |||||||||||||||||||||||||||||||||||||
| ROACE excluding death benefit on BOLI | 12.72 | 13.89 | 14.34 | 13.34 | 13.08 | 13.57 | 12.43 | |||||||||||||||||||||||||||||||||||||
| Prepayment penalties on borrowings | — | — | — | — | — | — | 0.02 | |||||||||||||||||||||||||||||||||||||
| Tax effect | — | — | — | — | — | — | — | |||||||||||||||||||||||||||||||||||||
| ROACE excluding prepayment penalties on borrowings | 12.72 | % | 13.89 | % | 14.34 | % | 13.34 | % | 13.08 | % | 13.57 | % | 12.45 | % | ||||||||||||||||||||||||||||||
| Adjusted ROACE | 12.72 | % | 13.89 | % | 14.34 | % | 13.34 | % | 13.08 | % | 13.57 | % | 12.45 | % | ||||||||||||||||||||||||||||||
30
Horizon Bancorp, Inc. Announces Record Earnings for 2022 and Fourth Quarter Results
| Non–GAAP Reconciliation of Return on Average Tangible Equity | ||||||||||||||||||||||||||||||||||||||||||||
| (Dollars in Thousands, Unaudited) | ||||||||||||||||||||||||||||||||||||||||||||
| Three Months Ended | Twelve Months Ended | |||||||||||||||||||||||||||||||||||||||||||
| December 31, | September 30, | June 30, | March 31, | December 31, | December 31, | December 31, | ||||||||||||||||||||||||||||||||||||||
| 2022 | 2022 | 2022 | 2022 | 2021 | 2022 | 2021 | ||||||||||||||||||||||||||||||||||||||
| Average tangible equity | $ | 660,188 | $ | 680,376 | $ | 677,299 | $ | 716,341 | $ | 719,643 | $ | 683,630 | $ | 712,122 | ||||||||||||||||||||||||||||||
| Less: Average intangible assets | 173,050 | 173,546 | 175,321 | 176,356 | 179,594 | 174,003 | 175,811 | |||||||||||||||||||||||||||||||||||||
| Average tangible equity | $ | 487,138 | $ | 506,830 | $ | 501,978 | $ | 539,985 | $ | 540,049 | $ | 509,627 | $ | 536,311 | ||||||||||||||||||||||||||||||
| Return on average tangible equity (“ROATE”) as reported | 17.24 | % | 18.65 | % | 19.86 | % | 17.70 | % | 15.74 | % | 18.33 | % | 16.24 | % | ||||||||||||||||||||||||||||||
| Acquisition expenses | — | — | — | — | 0.65 | — | 0.36 | |||||||||||||||||||||||||||||||||||||
| Tax effect | — | — | — | — | (0.14) | — | (0.08) | |||||||||||||||||||||||||||||||||||||
| ROATE excluding acquisition expenses | 17.24 | 18.65 | 19.86 | 17.70 | 16.25 | 18.33 | 16.52 | |||||||||||||||||||||||||||||||||||||
| Credit loss expense acquired loans | — | — | — | — | — | — | 0.38 | |||||||||||||||||||||||||||||||||||||
| Tax effect | — | — | — | — | — | — | (0.08) | |||||||||||||||||||||||||||||||||||||
| ROATE excluding credit loss expense acquired loans | 17.24 | 18.65 | 19.86 | 17.70 | 16.25 | 18.33 | 16.82 | |||||||||||||||||||||||||||||||||||||
| Gain on sale of ESOP trustee accounts | — | — | — | — | — | — | (0.43) | |||||||||||||||||||||||||||||||||||||
| Tax effect | — | — | — | — | — | — | 0.10 | |||||||||||||||||||||||||||||||||||||
| ROATE excluding gain on sale of ESOP trustee accounts | 17.24 | 18.65 | 19.86 | 17.70 | 16.25 | 18.33 | 16.49 | |||||||||||||||||||||||||||||||||||||
| ESOP settlement expenses | — | — | — | — | 1.40 | — | 0.35 | |||||||||||||||||||||||||||||||||||||
| Tax effect | — | — | — | — | (0.23) | — | (0.06) | |||||||||||||||||||||||||||||||||||||
| ROATE excluding ESOP settlement expenses | 17.24 | 18.65 | 19.86 | 17.70 | 17.42 | 18.33 | 16.78 | |||||||||||||||||||||||||||||||||||||
| (Gain) / loss on sale of investment securities | — | — | — | — | — | — | (0.17) | |||||||||||||||||||||||||||||||||||||
| Tax effect | — | — | — | — | — | — | 0.04 | |||||||||||||||||||||||||||||||||||||
| ROATE excluding (gain) / loss on sale of investment securities | 17.24 | 18.65 | 19.86 | 17.70 | 17.42 | 18.33 | 16.65 | |||||||||||||||||||||||||||||||||||||
| Death benefit on BOLI | — | — | (0.51) | — | — | (0.13) | (0.15) | |||||||||||||||||||||||||||||||||||||
| ROATE excluding death benefit on BOLI | 17.24 | 18.65 | 19.35 | 17.70 | 17.42 | 18.20 | 16.50 | |||||||||||||||||||||||||||||||||||||
| Prepayment penalties on borrowings | — | — | — | — | — | — | 0.02 | |||||||||||||||||||||||||||||||||||||
| Tax effect | — | — | — | — | — | — | (0.01) | |||||||||||||||||||||||||||||||||||||
| ROATE excluding prepayment penalties on borrowings | 17.24 | % | 18.65 | % | 19.35 | % | 17.70 | % | 17.42 | % | 18.20 | % | 16.51 | % | ||||||||||||||||||||||||||||||
| Adjusted ROATE | 17.24 | % | 18.65 | % | 19.35 | % | 17.70 | % | 17.42 | % | 18.20 | % | 16.51 | % | ||||||||||||||||||||||||||||||
31
Horizon Bancorp, Inc. Announces Record Earnings for 2022 and Fourth Quarter Results
Earnings Conference Call
As previously announced, Horizon will host a conference call to review its fourth quarter and full year 2022 financial results and operating performance.
Participants may access the live conference call on January 26, 2023 at 7:30 a.m. CT (8:30 a.m. ET) by dialing 833–974–2379 from the United States, 866–450–4696 from Canada or 1–412–317–5772 from international locations and requesting the “Horizon Bancorp Call.” Participants are asked to dial in approximately 10 minutes prior to the call.
A telephone replay of the call will be available approximately one hour after the end of the conference through February 2, 2023. The replay may be accessed by dialing 877–344–7529 from the United States, 855–669–9658 from Canada or 1–412–317–0088 from other international locations, and entering the access code 9666758.
About Horizon Bancorp, Inc.
Horizon Bancorp, Inc. (NASDAQ GS: HBNC) is the $7.9 billion–asset bank holding company for Horizon Bank, which serves customers across diverse and economically attractive Midwestern markets through convenient digital and virtual tools, as well as its Indiana and Michigan branches. Horizon's retail offerings include prime residential, indirect auto, and other secured consumer lending to in–market customers, as well as a range of personal banking and wealth management solutions. Horizon also provides a comprehensive array of in–market business banking and treasury management services, with commercial lending representing over half of total loans. More information on Horizon, headquartered in Northwest Indiana's Michigan City, is available at horizonbank.com and investor.horizonbank.com.
32

E X C E P T I O N A L S E R V I C E • S E N S I B L E A D V I C E ® A NASDAQ Traded Company - Symbol HBNC INVESTOR PRESENTATION | JANUARY 25, 2023
E X C E P T I O N A L S E R V I C E • S E N S I B L E A D V I C E ® Forward-Looking Statements This presentation may contain forward–looking statements regarding the financial performance, business prospects, growth and operating strategies of Horizon Bancorp, Inc. and its affiliates (collectively, “Horizon”). For these statements, Horizon claims the protection of the safe harbor for forward–looking statements contained in the Private Securities Litigation Reform Act of 1995. Statements in this presentation should be considered in conjunction with the other information available about Horizon, including the information in the filings we make with the Securities and Exchange Commission (the “SEC”). Forward–looking statements provide current expectations or forecasts of future events and are not guarantees of future performance. The forward– looking statements are based on management’s expectations and are subject to a number of risks and uncertainties. We have tried, wherever possible, to identify such statements by using words such as “anticipate,” “estimate,” “project,” “intend,” “plan,” “believe,” “will” and similar expressions in connection with any discussion of future operating or financial performance. Although management believes that the expectations reflected in such forward–looking statements are reasonable, actual results may differ materially from those expressed or implied in such statements. Risks and uncertainties that could cause actual results to differ materially include: changes in the level and volatility of interest rates, changes in spreads on earning assets and changes in interest bearing liabilities; increased interest rate sensitivity; continuing increases in inflation; loss of key Horizon personnel; increases in disintermediation; potential loss of fee income, including interchange fees, as new and emerging alternative payment platforms take a greater market share of the payment systems; estimates of fair value of certain of Horizon’s assets and liabilities; changes in prepayment speeds, loan originations, credit losses, market values, collateral securing loans and other assets; changes in sources of liquidity; continuing risks and uncertainties relating to the COVID–19 pandemic and government responses thereto; legislative and regulatory actions and reforms; changes in accounting policies or procedures as may be adopted and required by regulatory agencies; litigation, regulatory enforcement, and legal compliance risk and costs; rapid technological developments and changes; cyber terrorism and data security breaches; the rising costs of cybersecurity; the ability of the U.S. federal government to manage federal debt limits; climate change and social justice initiatives; material changes outside the U.S. or in overseas relations, including changes in U.S. trade relations related to imposition of tariffs, Brexit, and the phase out of the London Interbank Offered Rate (“LIBOR”); the inability to realize cost savings or revenues or to effectively implement integration plans and other consequences associated with mergers, acquisitions, and divestitures; acts of terrorism, war and global conflicts, such as the Russia and Ukraine conflict; and supply chain disruptions and delays. These and additional factors that could cause actual results to differ materially from those expressed in the forward–looking statements are discussed in Horizon’s reports (such as the Annual Report on Form 10–K, Quarterly Reports on Form 10–Q, and Current Reports on Form 8–K) filed with the SEC and available at the SEC’s Internet website (www.sec.gov). Undue reliance should not be placed on the forward–looking statements, which speak only as of the date hereof. Horizon does not undertake, and specifically disclaims any obligation, to publicly release the result of any revisions that may be made to update any forward–looking statement to reflect the events or circumstances after the date on which the forward–looking statement is made, or reflect the occurrence of unanticipated events, except to the extent required by law. Non-GAAP Measures Certain non-GAAP financial measures are presented herein. Horizon believes they are useful to investors and provide a greater understanding of Horizon’s business without giving effect to non-recurring costs and non-core items. For each non-GAAP financial measure, we have presented comparable GAAP measures and reconciliations of the non-GAAP measures to those GAAP measures in the Appendix to this presentation. Please see slides 43-57. Important Information 2
E X C E P T I O N A L S E R V I C E • S E N S I B L E A D V I C E ® Corporate Overview 3
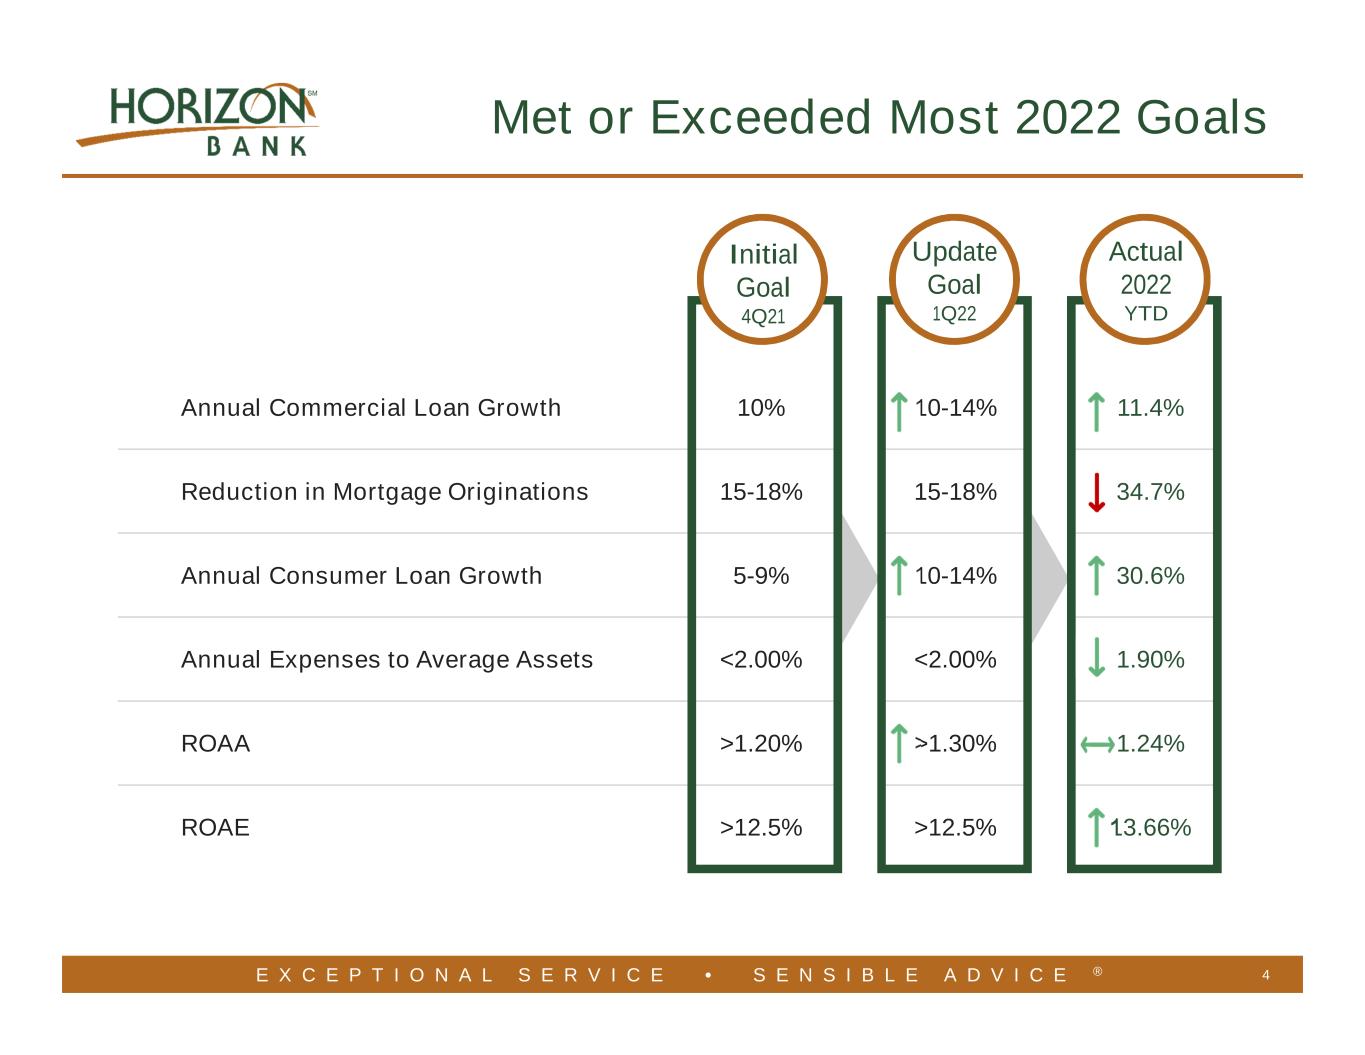
E X C E P T I O N A L S E R V I C E • S E N S I B L E A D V I C E ® Annual Commercial Loan Growth 10% 10-14% 11.4% Reduction in Mortgage Originations 15-18% 15-18% 34.7% Annual Consumer Loan Growth 5-9% 10-14% 30.6% Annual Expenses to Average Assets <2.00% <2.00% 1.90% ROAA >1.20% >1.30% 1.24% ROAE >12.5% >12.5% 13.66% Met or Exceeded Most 2022 Goals 4 Initial Goal 4Q21 Update Goal 1Q22 Actual 2022 YTD
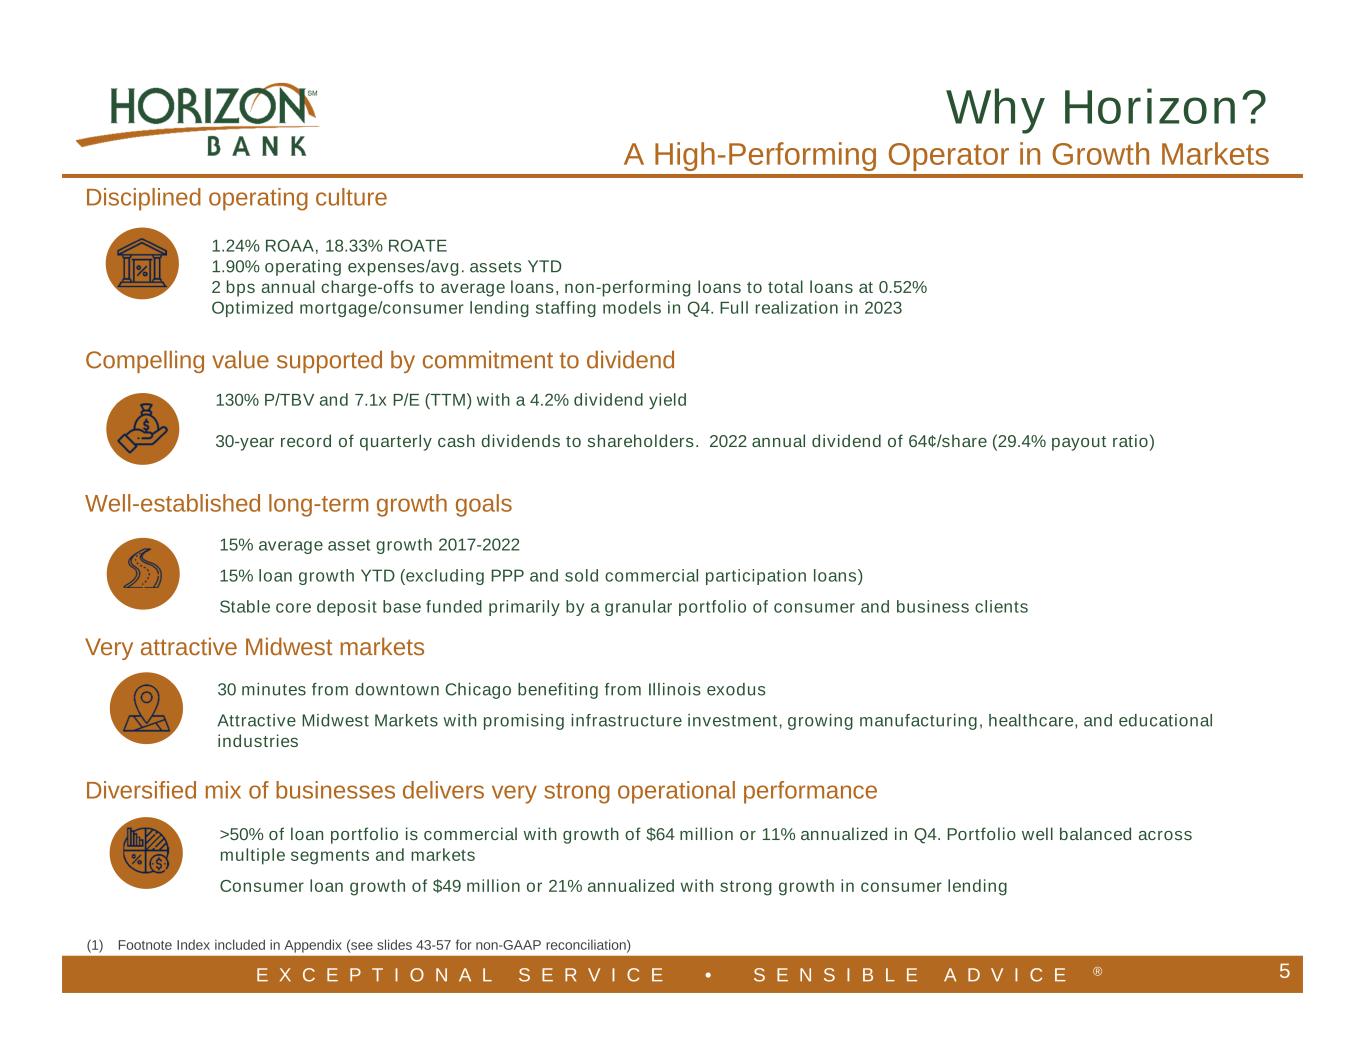
E X C E P T I O N A L S E R V I C E • S E N S I B L E A D V I C E ® 5 Disciplined operating culture Compelling value supported by commitment to dividend Well-established long-term growth goals Very attractive Midwest markets Diversified mix of businesses delivers very strong operational performance Why Horizon? A High-Performing Operator in Growth Markets (1) Footnote Index included in Appendix (see slides 43-57 for non-GAAP reconciliation) 1.24% ROAA, 18.33% ROATE 1.90% operating expenses/avg. assets YTD 2 bps annual charge-offs to average loans, non-performing loans to total loans at 0.52% Optimized mortgage/consumer lending staffing models in Q4. Full realization in 2023 130% P/TBV and 7.1x P/E (TTM) with a 4.2% dividend yield 30-year record of quarterly cash dividends to shareholders. 2022 annual dividend of 64¢/share (29.4% payout ratio) 15% average asset growth 2017-2022 15% loan growth YTD (excluding PPP and sold commercial participation loans) Stable core deposit base funded primarily by a granular portfolio of consumer and business clients 30 minutes from downtown Chicago benefiting from Illinois exodus Attractive Midwest Markets with promising infrastructure investment, growing manufacturing, healthcare, and educational industries >50% of loan portfolio is commercial with growth of $64 million or 11% annualized in Q4. Portfolio well balanced across multiple segments and markets Consumer loan growth of $49 million or 21% annualized with strong growth in consumer lending
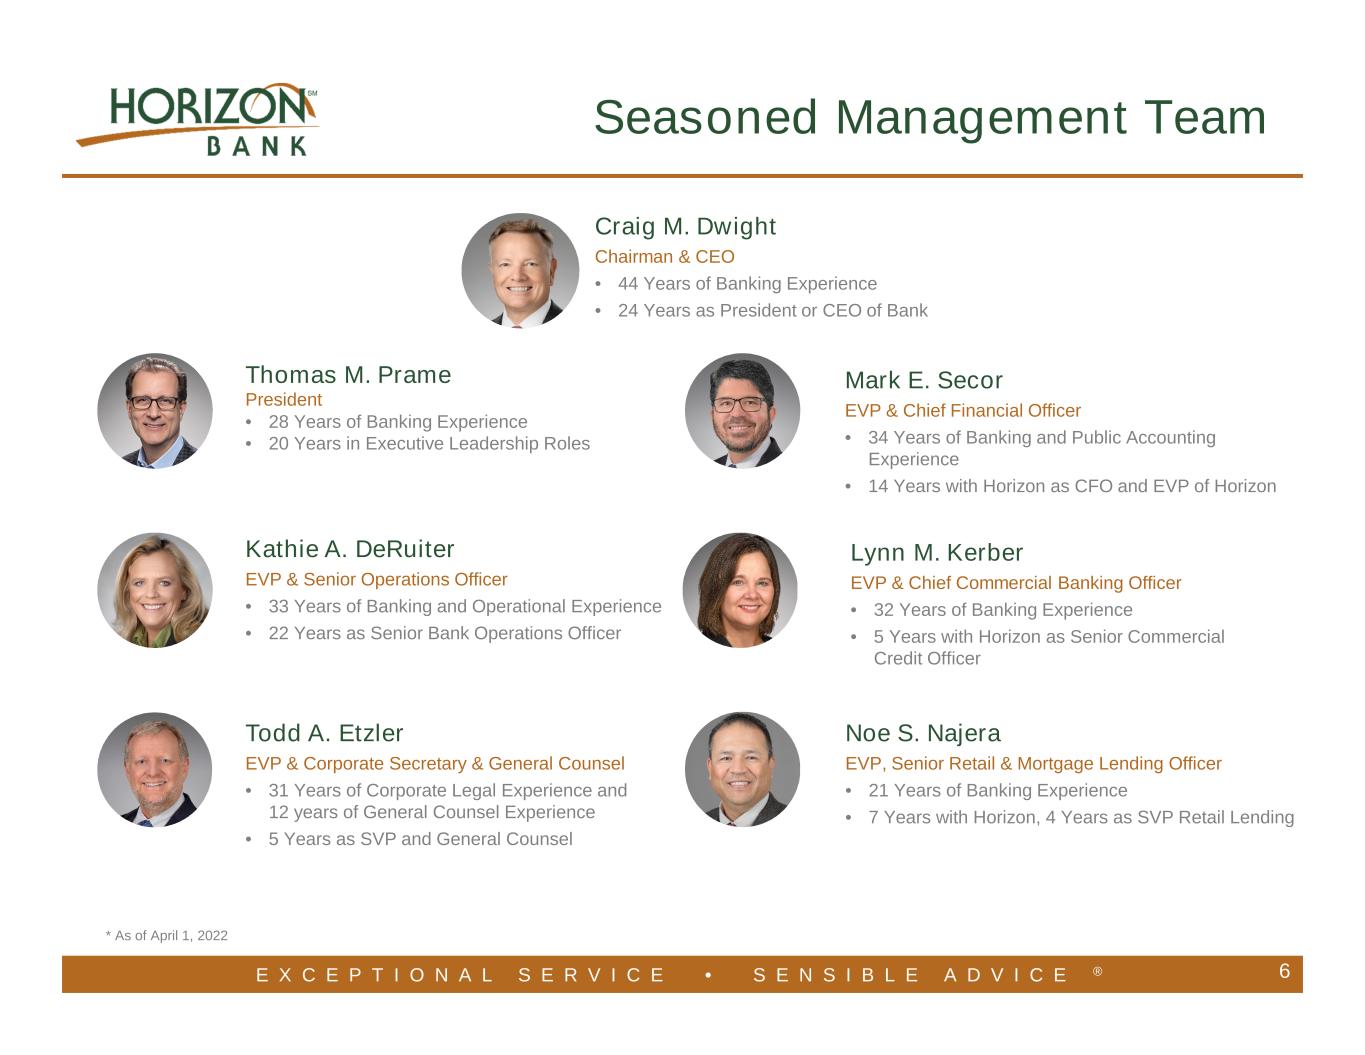
E X C E P T I O N A L S E R V I C E • S E N S I B L E A D V I C E ® 6 Mark E. Secor EVP & Chief Financial Officer • 34 Years of Banking and Public Accounting Experience • 14 Years with Horizon as CFO and EVP of Horizon Kathie A. DeRuiter EVP & Senior Operations Officer • 33 Years of Banking and Operational Experience • 22 Years as Senior Bank Operations Officer Todd A. Etzler EVP & Corporate Secretary & General Counsel • 31 Years of Corporate Legal Experience and 12 years of General Counsel Experience • 5 Years as SVP and General Counsel Craig M. Dwight Chairman & CEO • 44 Years of Banking Experience • 24 Years as President or CEO of Bank Seasoned Management Team Lynn M. Kerber EVP & Chief Commercial Banking Officer • 32 Years of Banking Experience • 5 Years with Horizon as Senior Commercial Credit Officer Noe S. Najera EVP, Senior Retail & Mortgage Lending Officer • 21 Years of Banking Experience • 7 Years with Horizon, 4 Years as SVP Retail Lending * As of April 1, 2022 Thomas M. Prame President • 28 Years of Banking Experience • 20 Years in Executive Leadership Roles
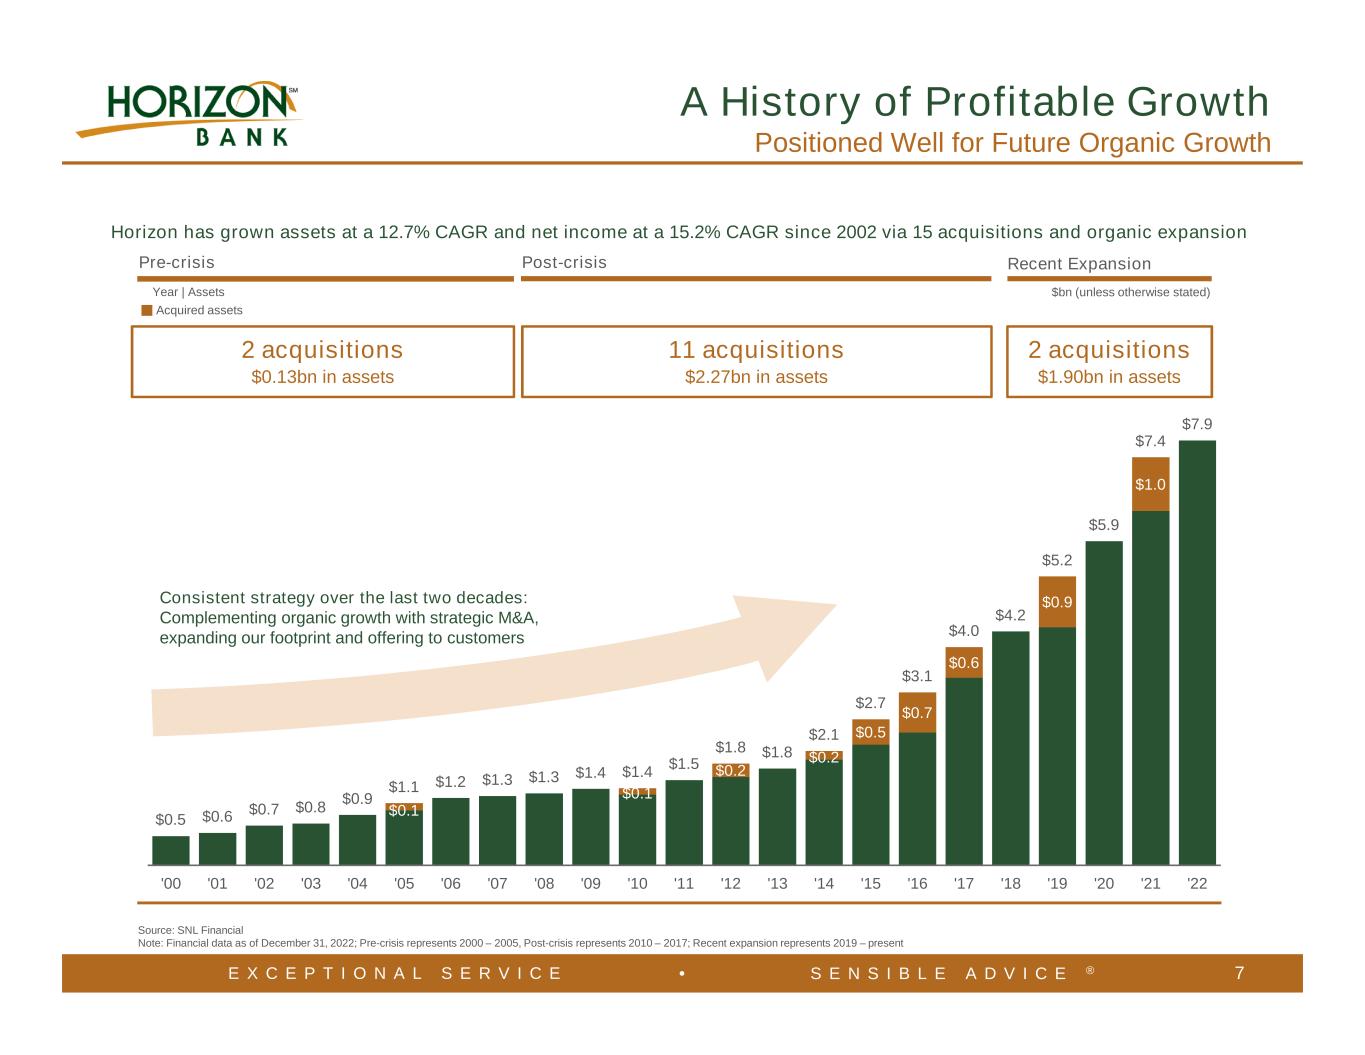
E X C E P T I O N A L S E R V I C E • S E N S I B L E A D V I C E ® 7 $0.1 $0.1 $0.2 $0.2 $0.5 $0.7 $0.6 $0.9 $1.0 $0.5 $0.6 $0.7 $0.8 $0.9 $1.1 $1.2 $1.3 $1.3 $1.4 $1.4 $1.5 $1.8 $1.8 $2.1 $2.7 $3.1 $4.0 $4.2 $5.2 $5.9 $7.4 $7.9 '00 '01 '02 '03 '04 '05 '06 '07 '08 '09 '10 '11 '12 '13 '14 '15 '16 '17 '18 '19 '20 '21 '22 Horizon has grown assets at a 12.7% CAGR and net income at a 15.2% CAGR since 2002 via 15 acquisitions and organic expansion Pre-crisis Post-crisis Recent Expansion A History of Profitable Growth Positioned Well for Future Organic Growth Year | Assets Acquired assets Source: SNL Financial Note: Financial data as of December 31, 2022; Pre-crisis represents 2000 – 2005, Post-crisis represents 2010 – 2017; Recent expansion represents 2019 – present Consistent strategy over the last two decades: Complementing organic growth with strategic M&A, expanding our footprint and offering to customers $bn (unless otherwise stated) 2 acquisitions $0.13bn in assets 11 acquisitions $2.27bn in assets 2 acquisitions $1.90bn in assets
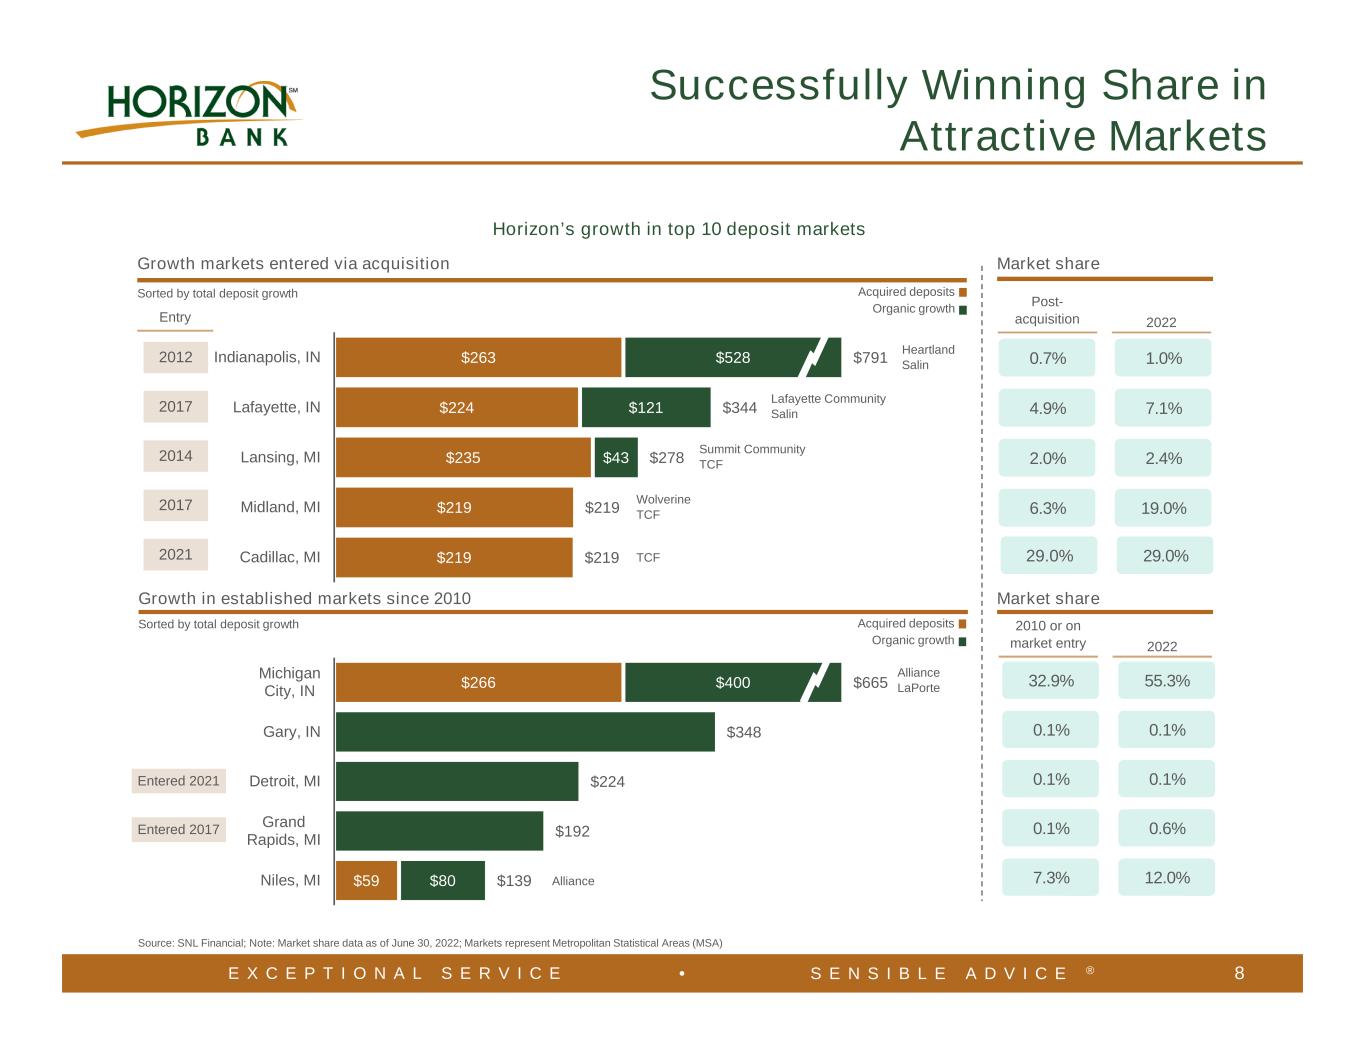
E X C E P T I O N A L S E R V I C E • S E N S I B L E A D V I C E ® 8 Horizon’s growth in top 10 deposit markets Organic growth Acquired deposits Growth in established markets since 2010 Market share 32.9% 55.3% 0.1% 0.1% 0.1% 0.1% 7.3% 12.0% 0.1% 0.6% Growth markets entered via acquisition $263 $224 $235 $219 $219 $528 $121 $43 $791 $344 $278 $219 $219 Indianapolis, IN Lafayette, IN Lansing, MI Midland, MI Cadillac, MI Market share Source: SNL Financial; Note: Market share data as of June 30, 2022; Markets represent Metropolitan Statistical Areas (MSA) Post- acquisition 2010: Today: 0.7% 1.0% 4.9% 7.1% 2.0% 2.4% 6.3% 19.0% 29.0% 29.0% 2012 2017 2014 2017 2021 Entry 2022 Sorted by total deposit growth Sorted by total deposit growth Entered 2021 Entered 2017 Heartland Salin Lafayette Community Salin Summit Community TCF Wolverine TCF TCF $266 $59 $400 $80 $665 $348 $224 $192 $139 Michigan City, IN Gary, IN Detroit, MI Grand Rapids, MI Niles, MI 2010 or on market entry 2022 Organic growth Acquired deposits Alliance LaPorte Alliance Successfully Winning Share in Attractive Markets
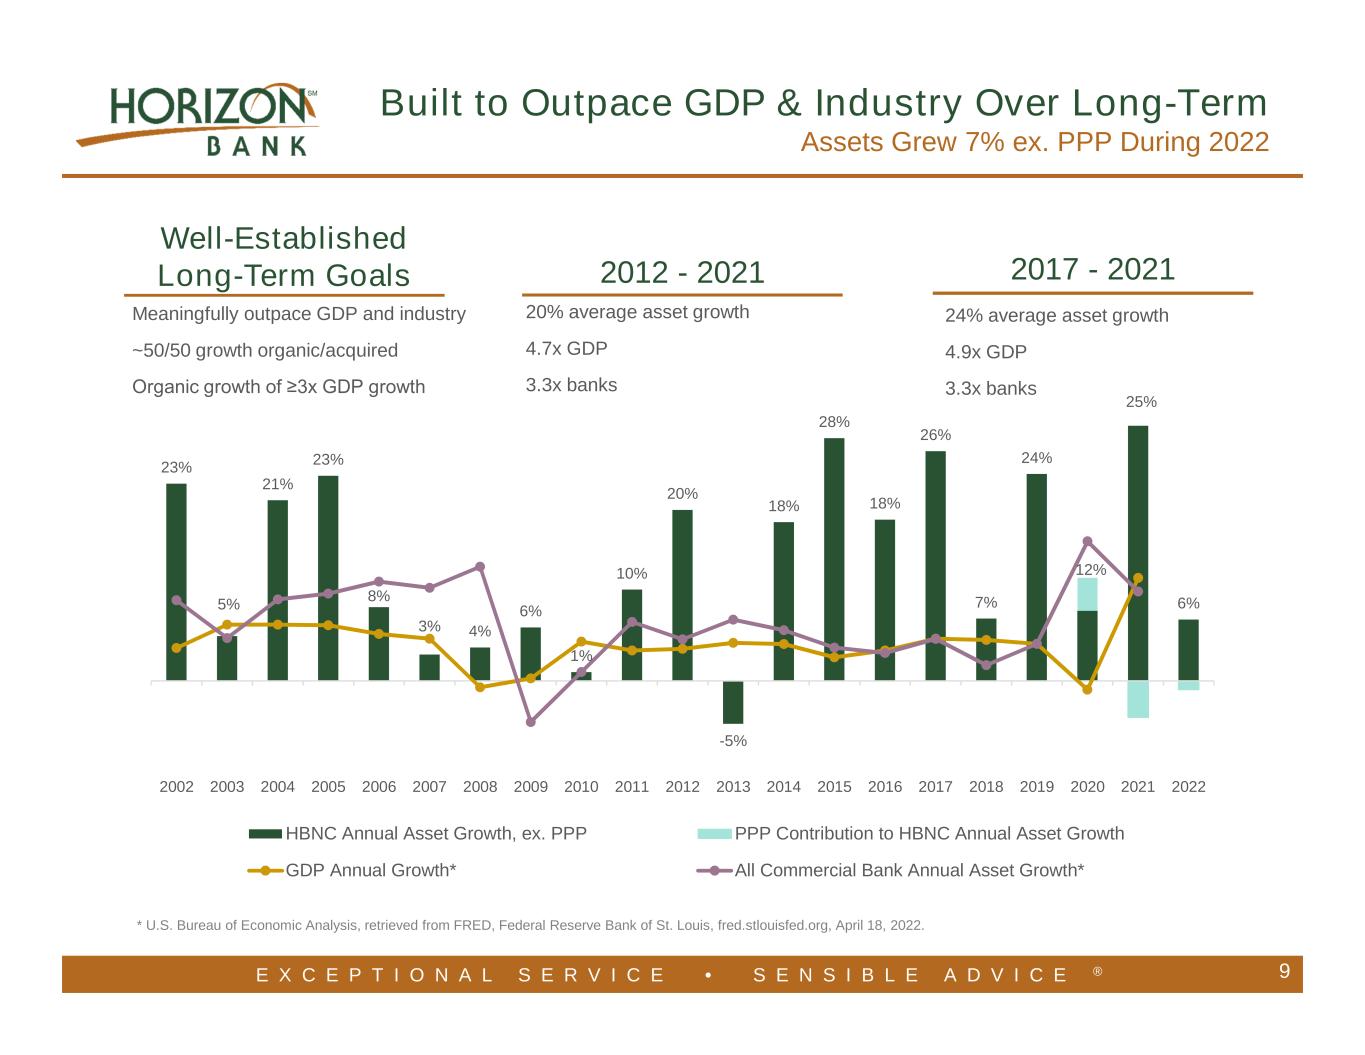
E X C E P T I O N A L S E R V I C E • S E N S I B L E A D V I C E ® 9 * U.S. Bureau of Economic Analysis, retrieved from FRED, Federal Reserve Bank of St. Louis, fred.stlouisfed.org, April 18, 2022. Built to Outpace GDP & Industry Over Long-Term Assets Grew 7% ex. PPP During 2022 23% 5% 21% 23% 8% 3% 4% 6% 1% 10% 20% -5% 18% 28% 18% 26% 7% 24% 12% 25% 6% 2002 2003 2004 2005 2006 2007 2008 2009 2010 2011 2012 2013 2014 2015 2016 2017 2018 2019 2020 2021 2022 HBNC Annual Asset Growth, ex. PPP PPP Contribution to HBNC Annual Asset Growth GDP Annual Growth* All Commercial Bank Annual Asset Growth* Well-Established Long-Term Goals Meaningfully outpace GDP and industry ~50/50 growth organic/acquired Organic growth of ≥3x GDP growth 2012 - 2021 2017 - 2021 20% average asset growth 4.7x GDP 3.3x banks 24% average asset growth 4.9x GDP 3.3x banks
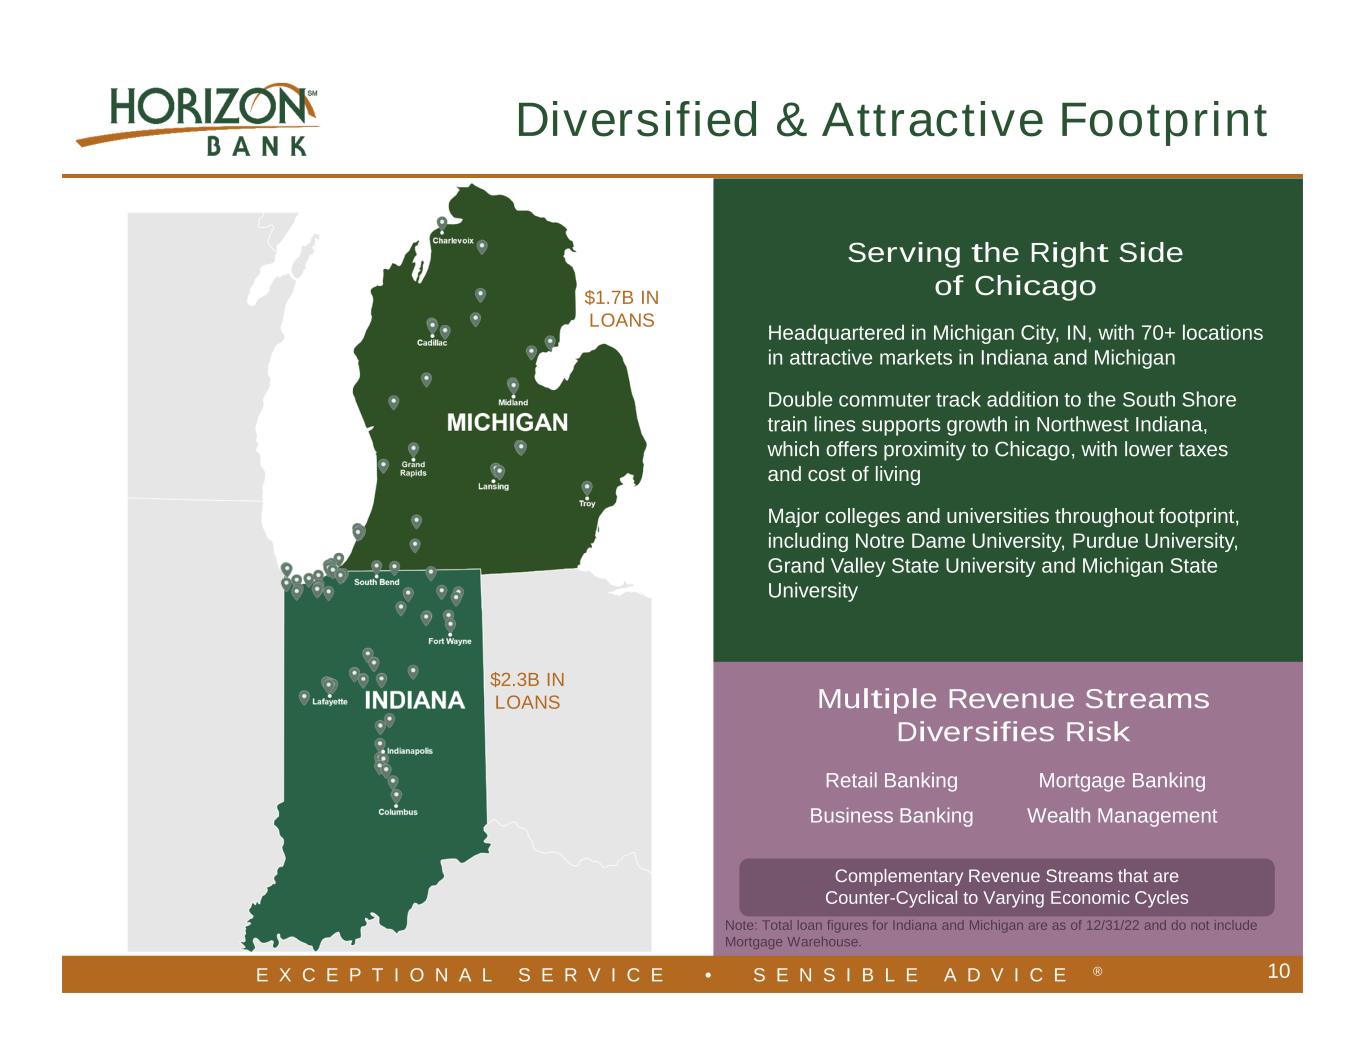
E X C E P T I O N A L S E R V I C E • S E N S I B L E A D V I C E ® 10 Multiple Revenue Streams Diversifies Risk 10 Retail Banking Business Banking Mortgage Banking Wealth Management Complementary Revenue Streams that are Counter-Cyclical to Varying Economic Cycles Serving the Right Side of Chicago Headquartered in Michigan City, IN, with 70+ locations in attractive markets in Indiana and Michigan Double commuter track addition to the South Shore train lines supports growth in Northwest Indiana, which offers proximity to Chicago, with lower taxes and cost of living Major colleges and universities throughout footprint, including Notre Dame University, Purdue University, Grand Valley State University and Michigan State University Note: Total loan figures for Indiana and Michigan are as of 12/31/22 and do not include Mortgage Warehouse. $2.3B IN LOANS $1.7B IN LOANS Diversified & Attractive Footprint
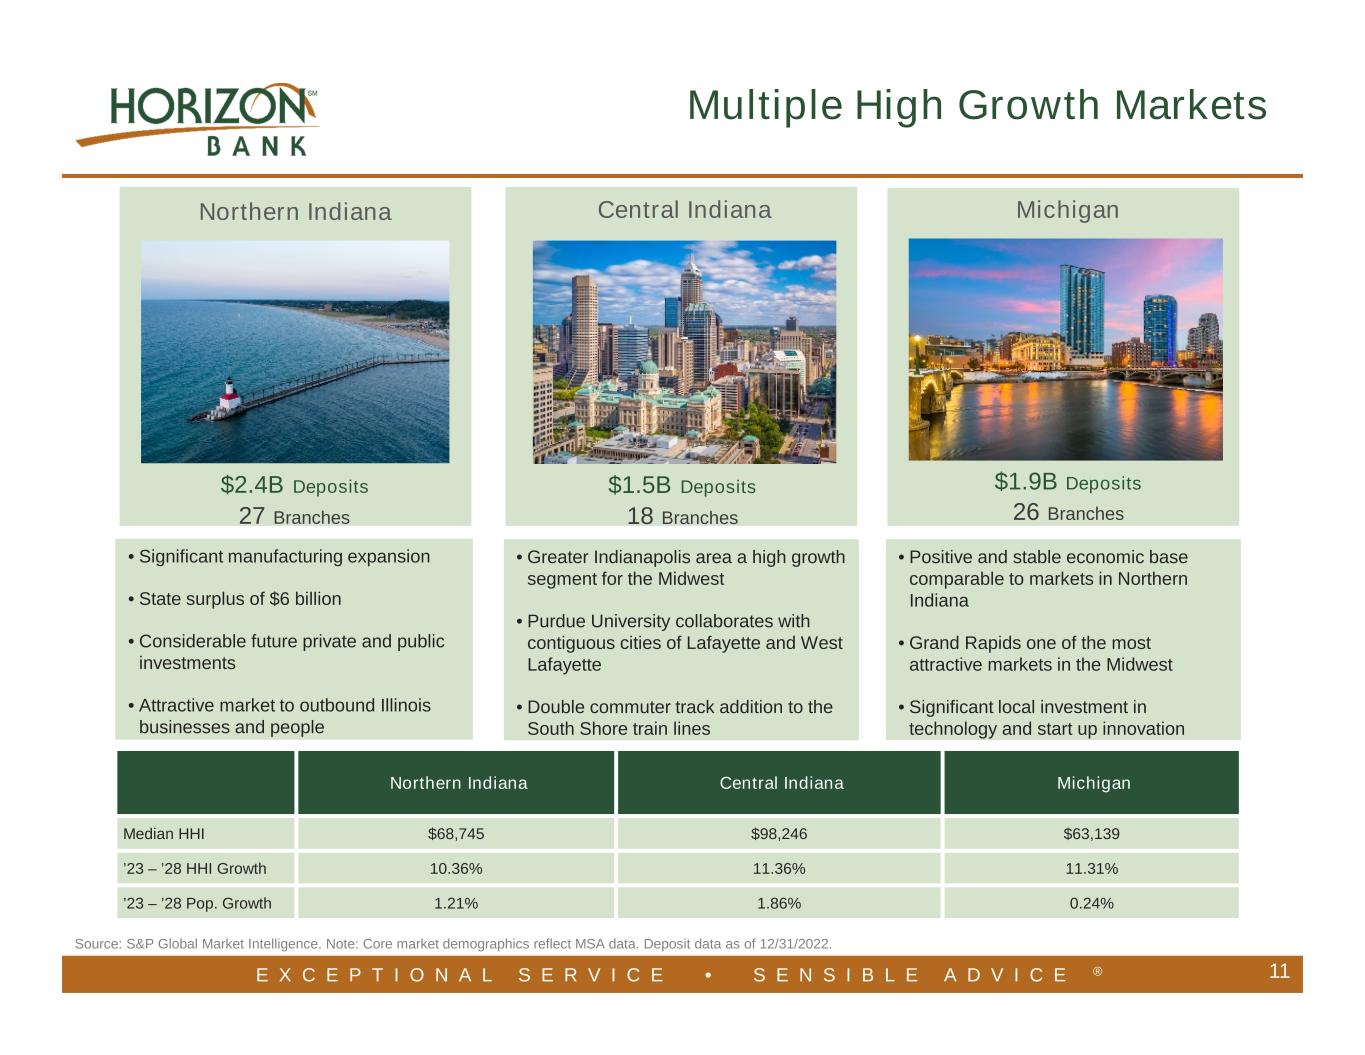
E X C E P T I O N A L S E R V I C E • S E N S I B L E A D V I C E ® 11 Northern Indiana Central Indiana Michigan $2.4B Deposits $1.5B Deposits $1.9B Deposits 27 Branches 18 Branches 26 Branches • Positive and stable economic base comparable to markets in Northern Indiana • Grand Rapids one of the most attractive markets in the Midwest • Significant local investment in technology and start up innovation • Greater Indianapolis area a high growth segment for the Midwest • Purdue University collaborates with contiguous cities of Lafayette and West Lafayette • Double commuter track addition to the South Shore train lines • Significant manufacturing expansion • State surplus of $6 billion • Considerable future private and public investments • Attractive market to outbound Illinois businesses and people Source: S&P Global Market Intelligence. Note: Core market demographics reflect MSA data. Deposit data as of 12/31/2022. Multiple High Growth Markets Northern Indiana Central Indiana Michigan Median HHI $68,745 $98,246 $63,139 ’23 – ’28 HHI Growth 10.36% 11.36% 11.31% ’23 – ’28 Pop. Growth 1.21% 1.86% 0.24%
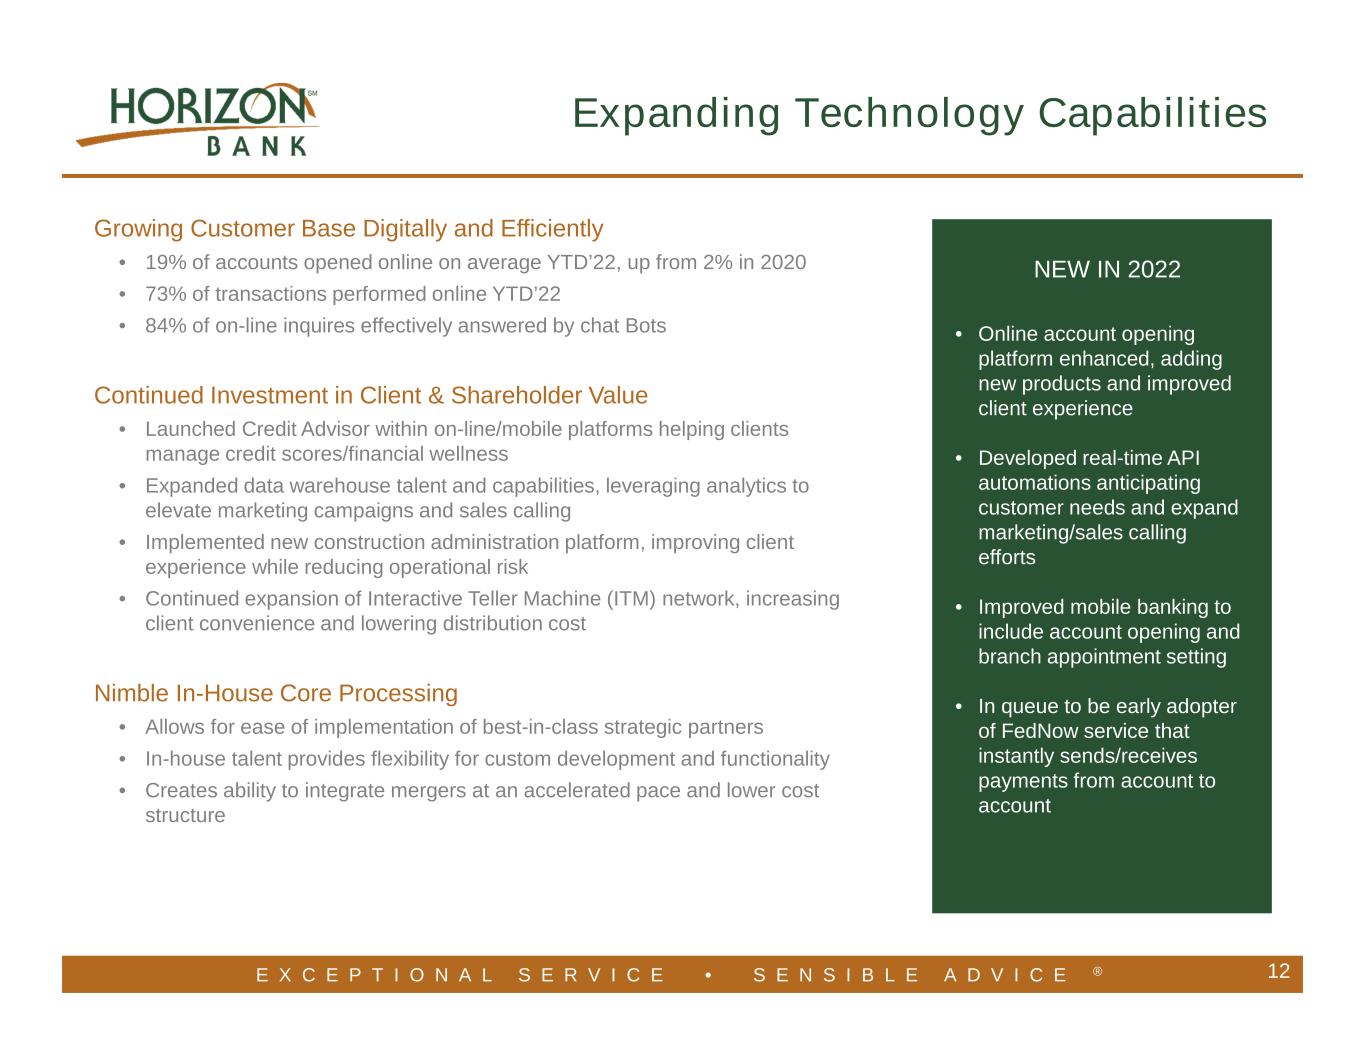
E X C E P T I O N A L S E R V I C E • S E N S I B L E A D V I C E ® Expanding Technology Capabilities NEW IN 2022 • Online account opening platform enhanced, adding new products and improved client experience • Developed real-time API automations anticipating customer needs and expand marketing/sales calling efforts • Improved mobile banking to include account opening and branch appointment setting • In queue to be early adopter of FedNow service that instantly sends/receives payments from account to account Growing Customer Base Digitally and Efficiently • 19% of accounts opened online on average YTD’22, up from 2% in 2020 • 73% of transactions performed online YTD’22 • 84% of on-line inquires effectively answered by chat Bots Continued Investment in Client & Shareholder Value • Launched Credit Advisor within on-line/mobile platforms helping clients manage credit scores/financial wellness • Expanded data warehouse talent and capabilities, leveraging analytics to elevate marketing campaigns and sales calling • Implemented new construction administration platform, improving client experience while reducing operational risk • Continued expansion of Interactive Teller Machine (ITM) network, increasing client convenience and lowering distribution cost Nimble In-House Core Processing • Allows for ease of implementation of best-in-class strategic partners • In-house talent provides flexibility for custom development and functionality • Creates ability to integrate mergers at an accelerated pace and lower cost structure 12
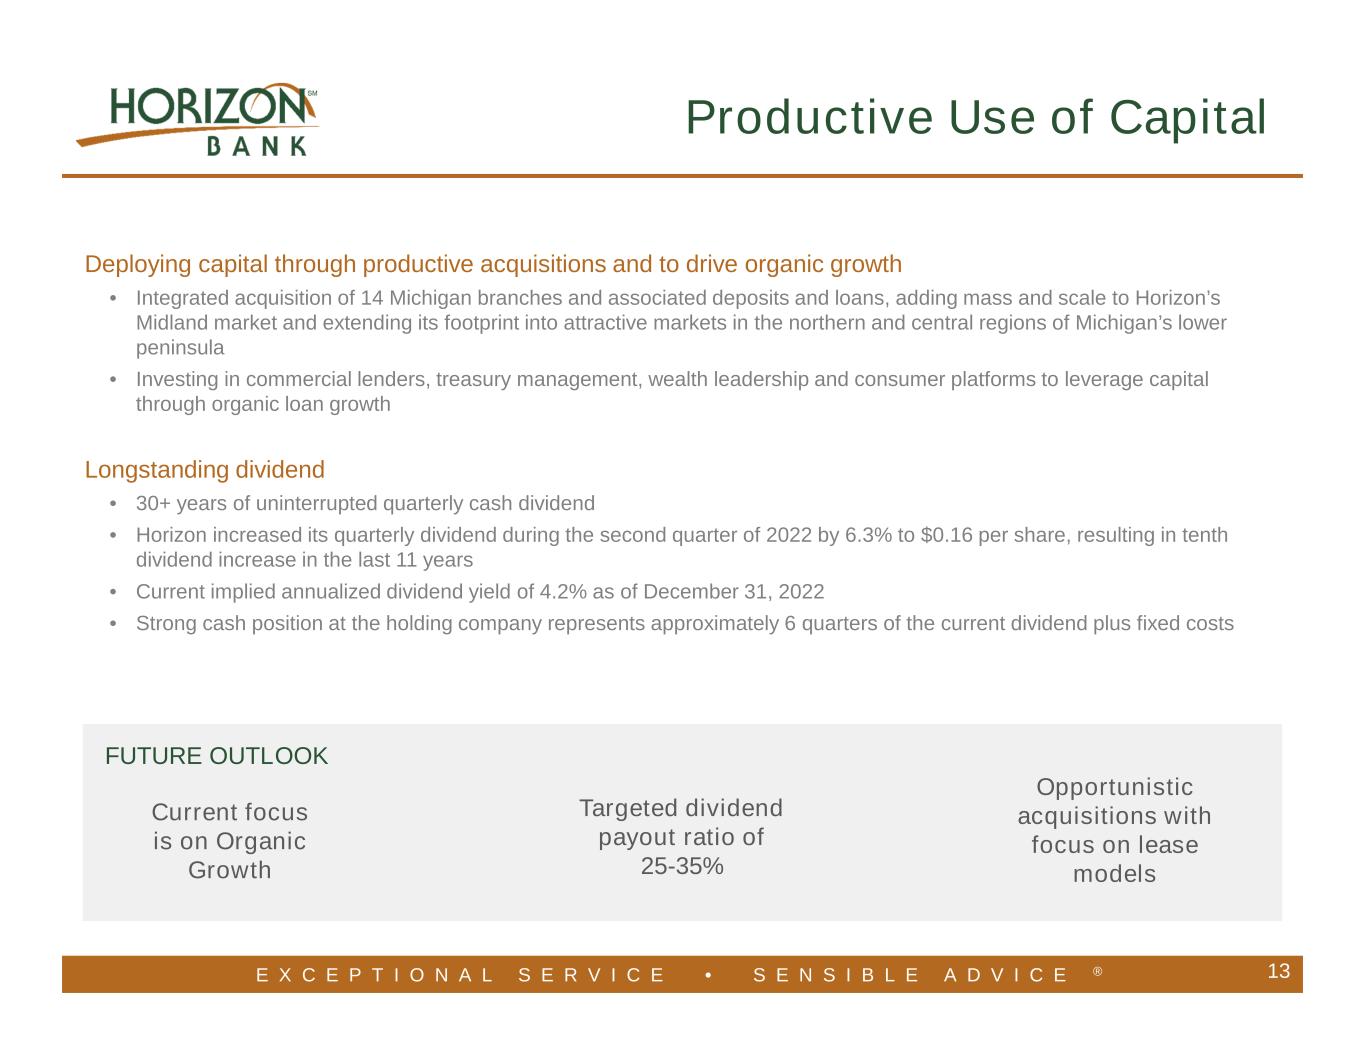
E X C E P T I O N A L S E R V I C E • S E N S I B L E A D V I C E ® 13 Productive Use of Capital Deploying capital through productive acquisitions and to drive organic growth • Integrated acquisition of 14 Michigan branches and associated deposits and loans, adding mass and scale to Horizon’s Midland market and extending its footprint into attractive markets in the northern and central regions of Michigan’s lower peninsula • Investing in commercial lenders, treasury management, wealth leadership and consumer platforms to leverage capital through organic loan growth Longstanding dividend • 30+ years of uninterrupted quarterly cash dividend • Horizon increased its quarterly dividend during the second quarter of 2022 by 6.3% to $0.16 per share, resulting in tenth dividend increase in the last 11 years • Current implied annualized dividend yield of 4.2% as of December 31, 2022 • Strong cash position at the holding company represents approximately 6 quarters of the current dividend plus fixed costs FUTURE OUTLOOK Targeted dividend payout ratio of 25-35% Current focus is on Organic Growth Opportunistic acquisitions with focus on lease models
E X C E P T I O N A L S E R V I C E • S E N S I B L E A D V I C E ® Loan Portfolio Review 14
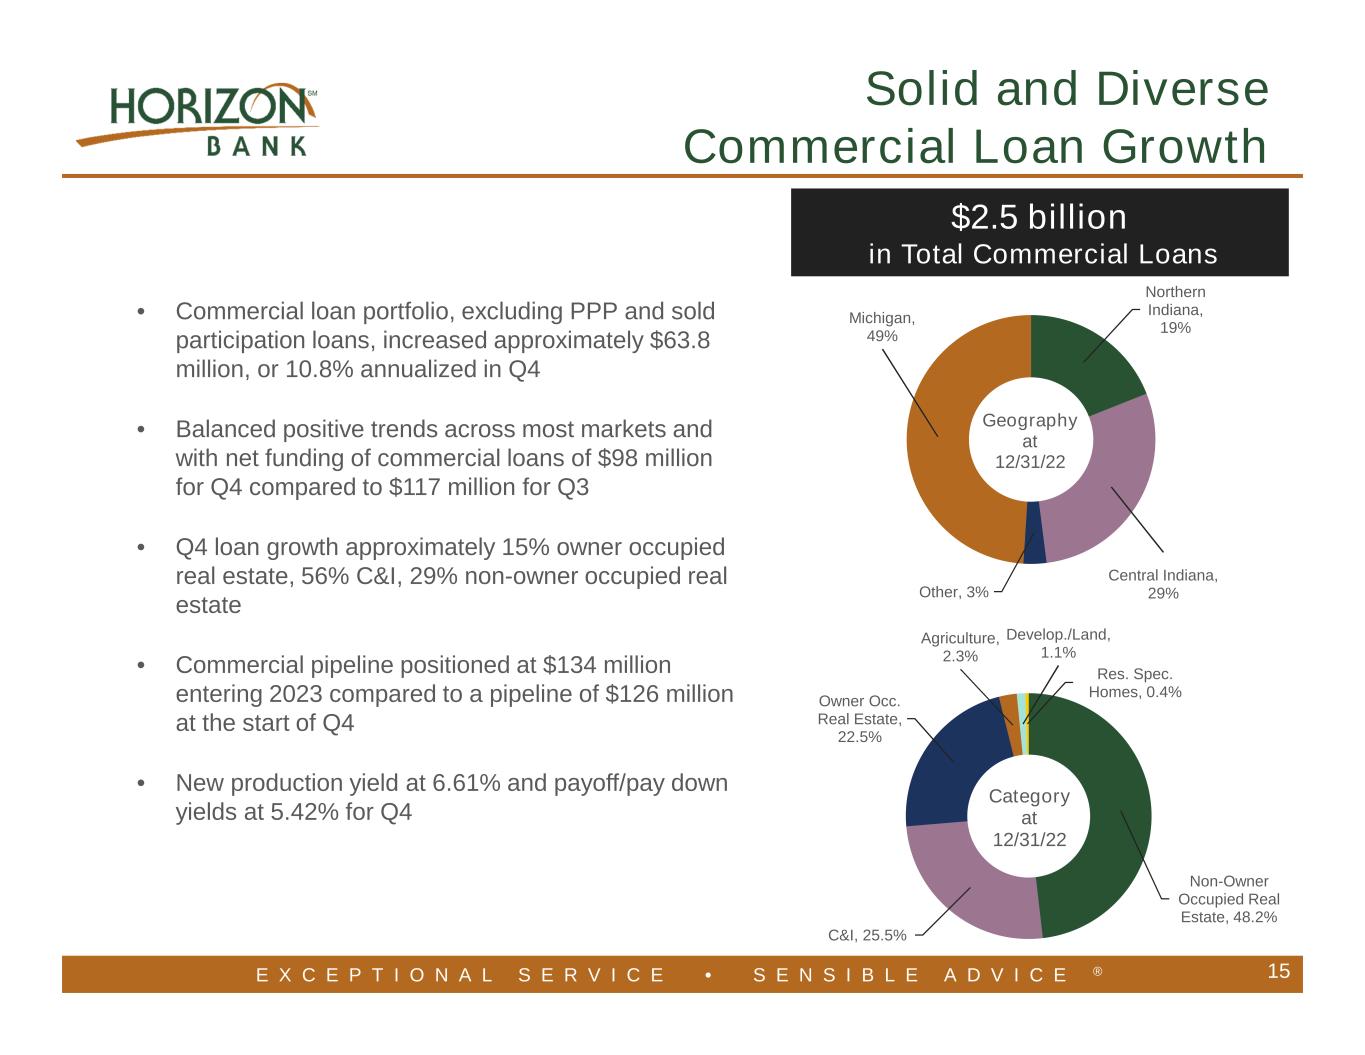
E X C E P T I O N A L S E R V I C E • S E N S I B L E A D V I C E ® Northern Indiana, 19% Central Indiana, 29%Other, 3% Michigan, 49% Geography at 12/31/22 Non-Owner Occupied Real Estate, 48.2% C&I, 25.5% Owner Occ. Real Estate, 22.5% Agriculture, 2.3% Develop./Land, 1.1% Res. Spec. Homes, 0.4% Category at 12/31/22 $2.5 billion in Total Commercial Loans Solid and Diverse Commercial Loan Growth 15 • Commercial loan portfolio, excluding PPP and sold participation loans, increased approximately $63.8 million, or 10.8% annualized in Q4 • Balanced positive trends across most markets and with net funding of commercial loans of $98 million for Q4 compared to $117 million for Q3 • Q4 loan growth approximately 15% owner occupied real estate, 56% C&I, 29% non-owner occupied real estate • Commercial pipeline positioned at $134 million entering 2023 compared to a pipeline of $126 million at the start of Q4 • New production yield at 6.61% and payoff/pay down yields at 5.42% for Q4
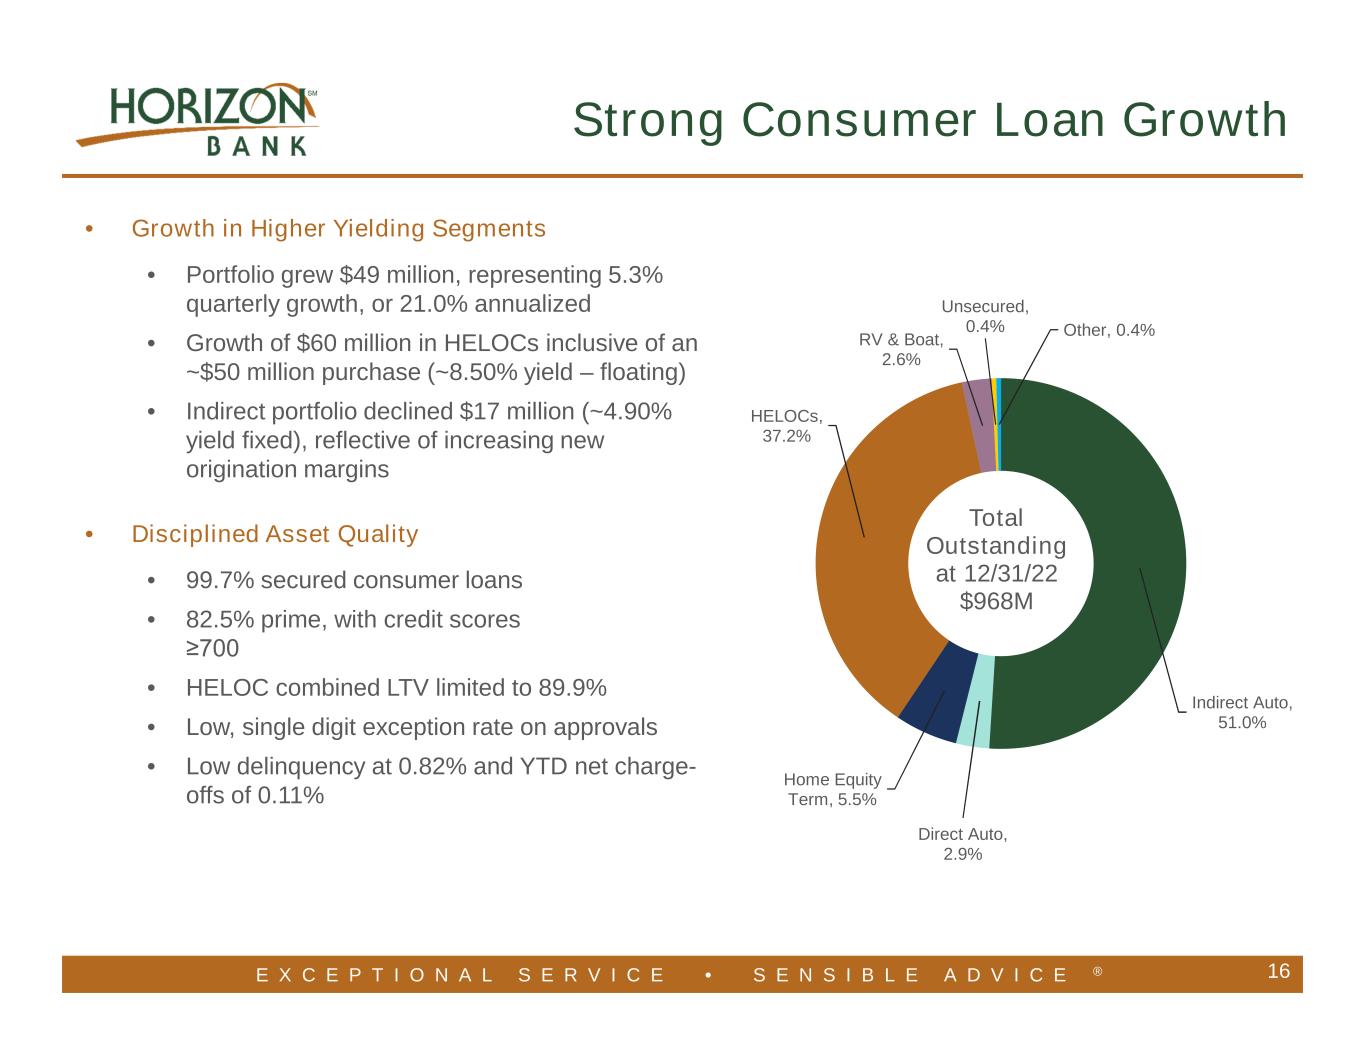
E X C E P T I O N A L S E R V I C E • S E N S I B L E A D V I C E ® 16 • Growth in Higher Yielding Segments • Portfolio grew $49 million, representing 5.3% quarterly growth, or 21.0% annualized • Growth of $60 million in HELOCs inclusive of an ~$50 million purchase (~8.50% yield – floating) • Indirect portfolio declined $17 million (~4.90% yield fixed), reflective of increasing new origination margins • Disciplined Asset Quality • 99.7% secured consumer loans • 82.5% prime, with credit scores ≥700 • HELOC combined LTV limited to 89.9% • Low, single digit exception rate on approvals • Low delinquency at 0.82% and YTD net charge- offs of 0.11% Indirect Auto, 51.0% Direct Auto, 2.9% Home Equity Term, 5.5% HELOCs, 37.2% RV & Boat, 2.6% Unsecured, 0.4% Other, 0.4% Total Outstanding at 12/31/22 $968M Strong Consumer Loan Growth
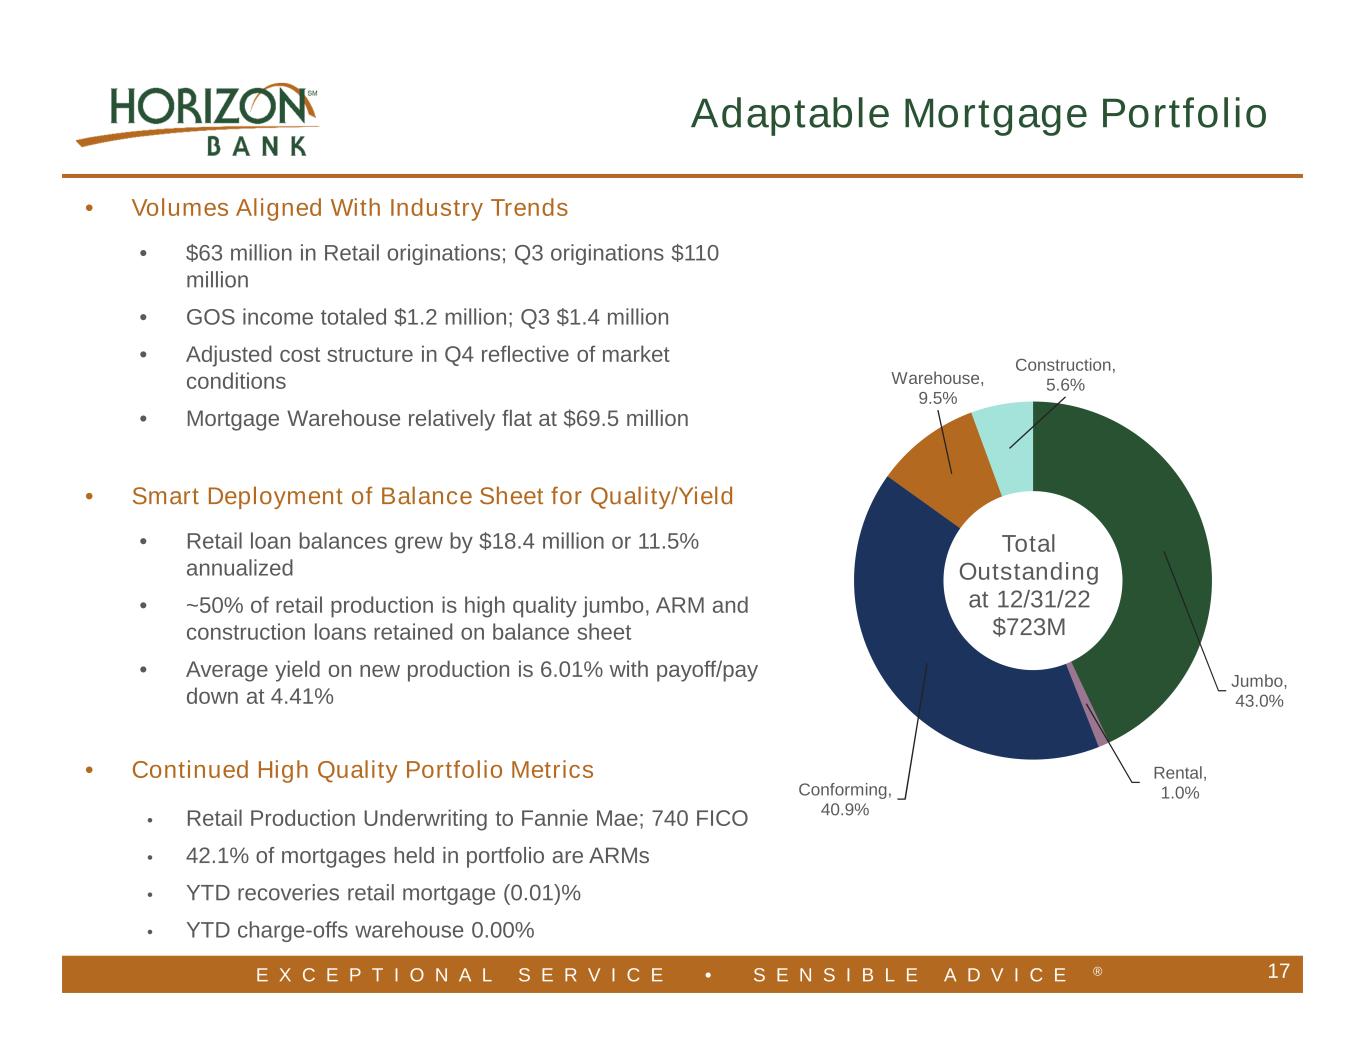
E X C E P T I O N A L S E R V I C E • S E N S I B L E A D V I C E ® 17 Jumbo, 43.0% Rental, 1.0%Conforming, 40.9% Warehouse, 9.5% Construction, 5.6% Total Outstanding at 12/31/22 $723M Adaptable Mortgage Portfolio • Volumes Aligned With Industry Trends • $63 million in Retail originations; Q3 originations $110 million • GOS income totaled $1.2 million; Q3 $1.4 million • Adjusted cost structure in Q4 reflective of market conditions • Mortgage Warehouse relatively flat at $69.5 million • Smart Deployment of Balance Sheet for Quality/Yield • Retail loan balances grew by $18.4 million or 11.5% annualized • ~50% of retail production is high quality jumbo, ARM and construction loans retained on balance sheet • Average yield on new production is 6.01% with payoff/pay down at 4.41% • Continued High Quality Portfolio Metrics • Retail Production Underwriting to Fannie Mae; 740 FICO • 42.1% of mortgages held in portfolio are ARMs • YTD recoveries retail mortgage (0.01)% • YTD charge-offs warehouse 0.00%
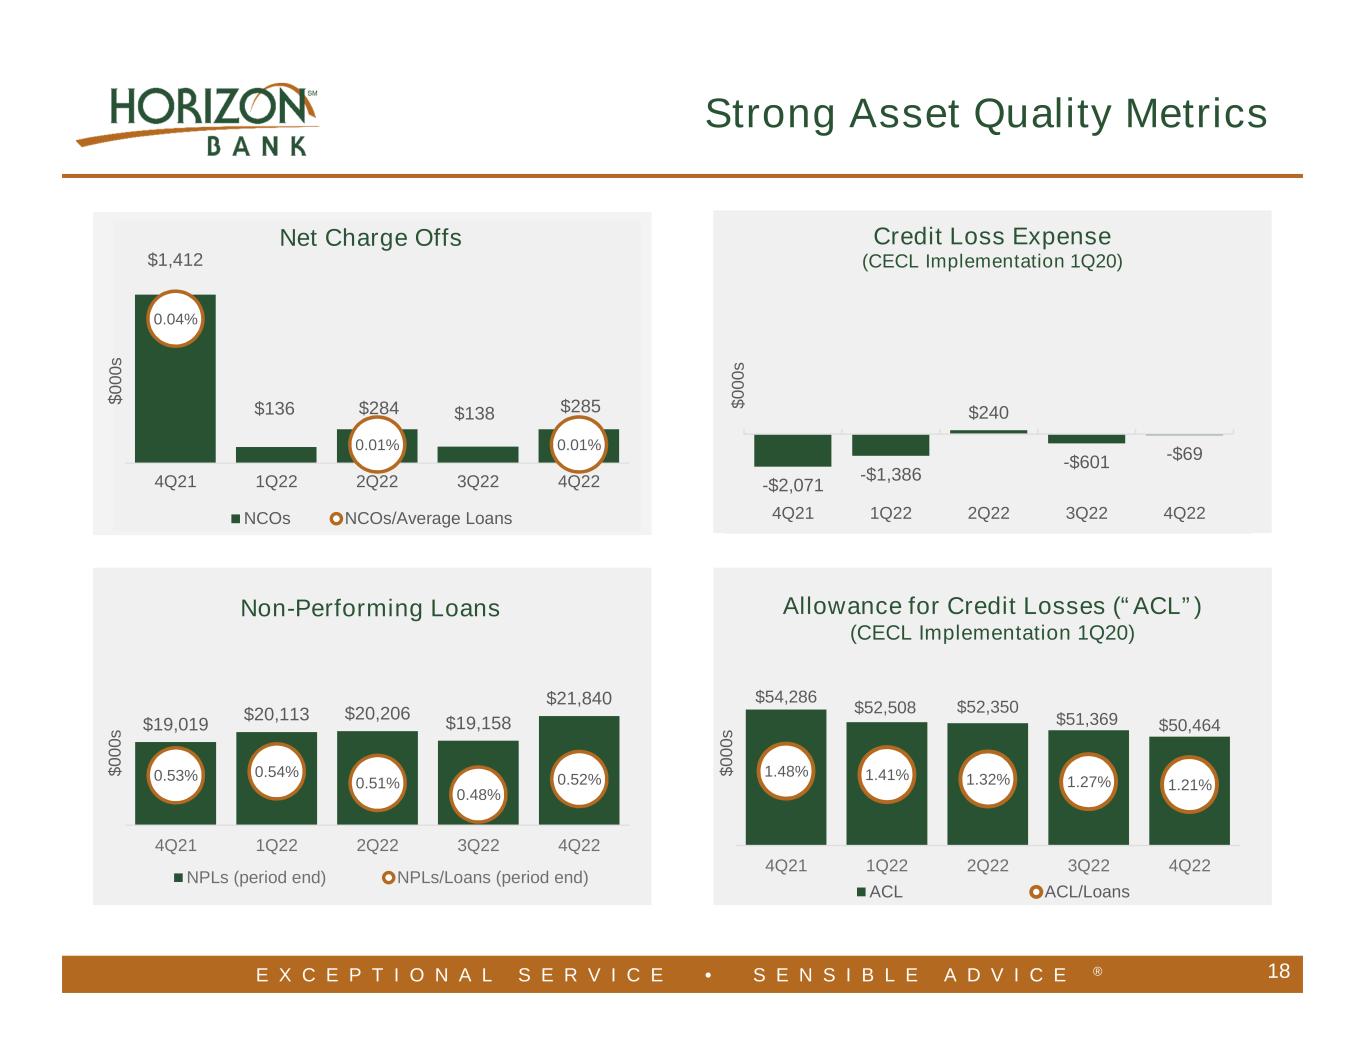
E X C E P T I O N A L S E R V I C E • S E N S I B L E A D V I C E ® $1,412 $136 $284 $138 $285 0.04% 0.01% 0.01% 4Q21 1Q22 2Q22 3Q22 4Q22 Net Charge Offs NCOs NCOs/Average Loans $ 0 0 0 s $19,019 $20,113 $20,206 $19,158 $21,840 0.53% 0.54% 0.51% 0.48% 0.52% 4Q21 1Q22 2Q22 3Q22 4Q22 Non-Performing Loans NPLs (period end) NPLs/Loans (period end) $ 0 0 0 s -$2,071 -$1,386 $240 -$601 -$69 4Q21 1Q22 2Q22 3Q22 4Q22 $ 0 0 0 s 18 CECL $54,286 $52,508 $52,350 $51,369 $50,464 1.48% 1.41% 1.32% 1.27% 1.21% 4Q21 1Q22 2Q22 3Q22 4Q22 ACL ACL/Loans Strong Asset Quality Metrics Allowance for Credit Losses (“ACL”) (CECL Implementation 1Q20) $ 0 0 0 s Credit Loss Expense (CECL Implementation 1Q20)
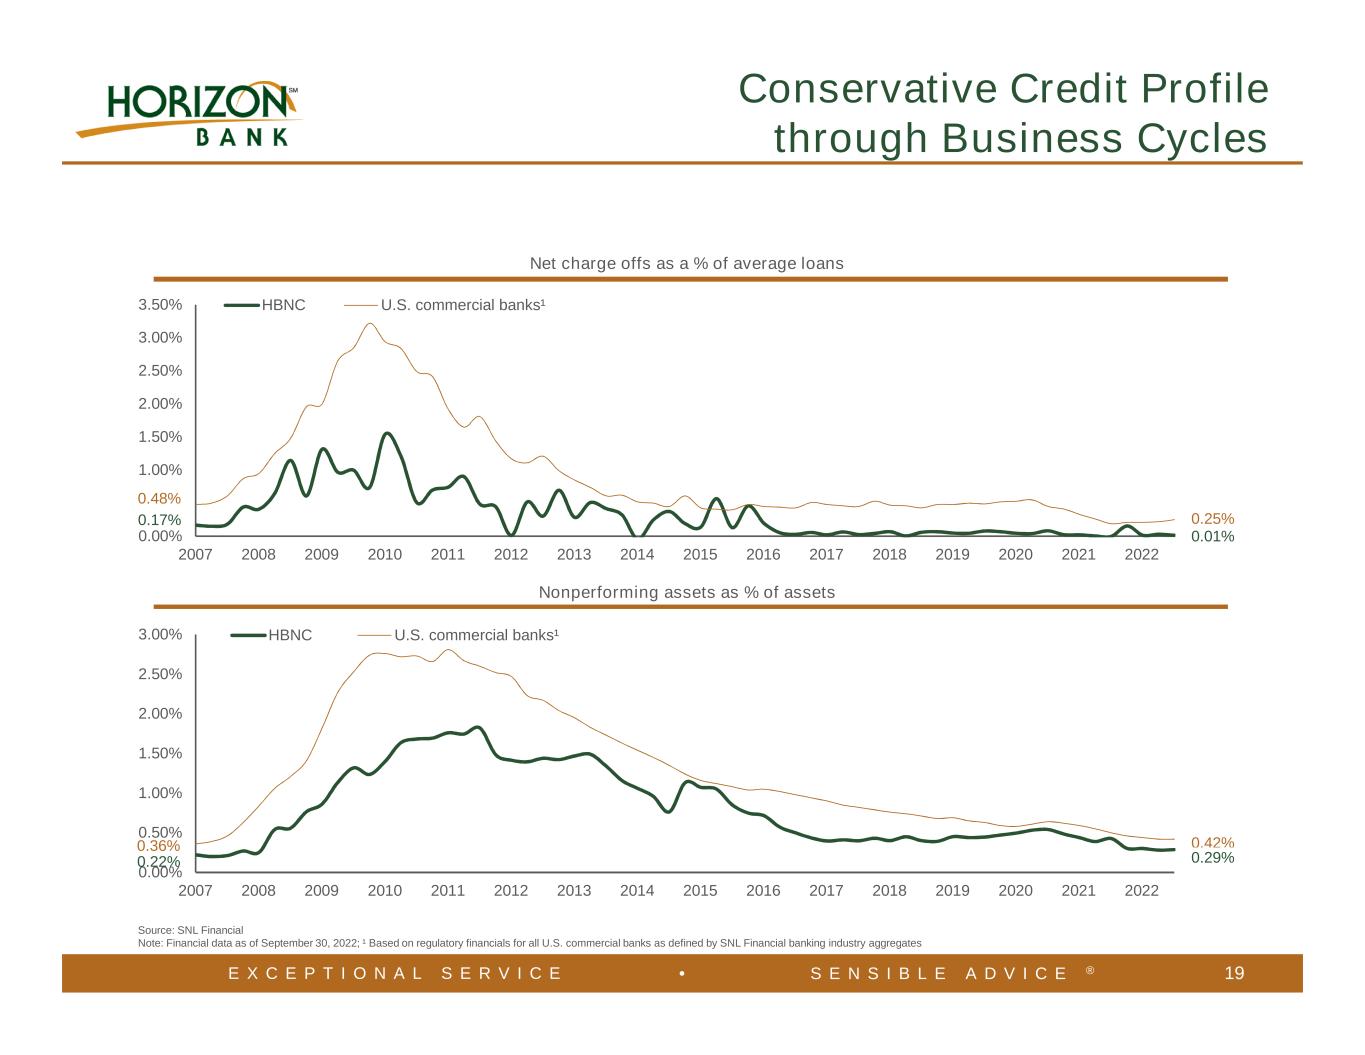
E X C E P T I O N A L S E R V I C E • S E N S I B L E A D V I C E ® 19 0.00% 0.50% 1.00% 1.50% 2.00% 2.50% 3.00% 3.50% 2007 2008 2009 2010 2011 2012 2013 2014 2015 2016 2017 2018 2019 2020 2021 2022 HBNC U.S. commercial banks¹ Net charge offs as a % of average loans 0.17% 0.48% 0.25% 0.01% 0.00% 0.50% 1.00% 1.50% 2.00% 2.50% 3.00% 2007 2008 2009 2010 2011 2012 2013 2014 2015 2016 2017 2018 2019 2020 2021 2022 HBNC U.S. commercial banks¹ Nonperforming assets as % of assets 0.22% 0.36% 0.42% 0.29% Source: SNL Financial Note: Financial data as of September 30, 2022; ¹ Based on regulatory financials for all U.S. commercial banks as defined by SNL Financial banking industry aggregates Conservative Credit Profile through Business Cycles
E X C E P T I O N A L S E R V I C E • S E N S I B L E A D V I C E ® 20 Financial Highlights
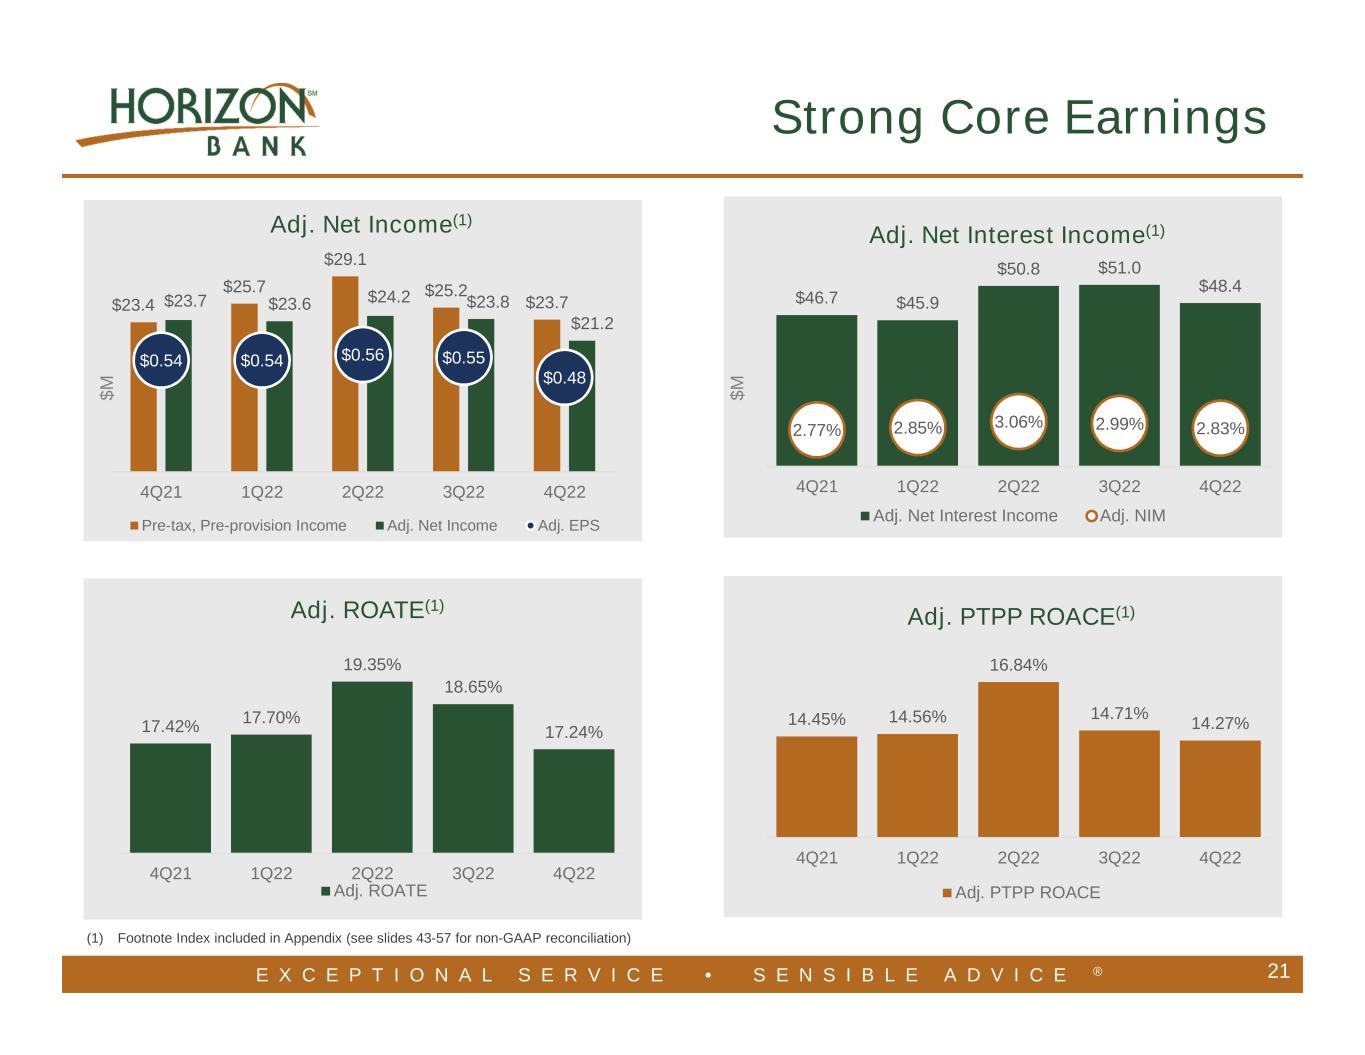
E X C E P T I O N A L S E R V I C E • S E N S I B L E A D V I C E ® 21 $ M $23.4 $25.7 $29.1 $25.2 $23.7$23.7 $23.6 $24.2 $23.8 $21.2 $0.54 $0.54 $0.56 $0.55 $0.48 4Q21 1Q22 2Q22 3Q22 4Q22 Adj. Net Income(1) Pre-tax, Pre-provision Income Adj. Net Income Adj. EPS 14.45% 14.56% 16.84% 14.71% 14.27% 4Q21 1Q22 2Q22 3Q22 4Q22 Adj. PTPP ROACE(1) Adj. PTPP ROACE $46.7 $45.9 $50.8 $51.0 $48.4 2.77% 2.85% 3.06% 2.99% 2.83% 4Q21 1Q22 2Q22 3Q22 4Q22 Adj. Net Interest Income(1) Adj. Net Interest Income Adj. NIM $ M (1) Footnote Index included in Appendix (see slides 43-57 for non-GAAP reconciliation) 17.42% 17.70% 19.35% 18.65% 17.24% 4Q21 1Q22 2Q22 3Q22 4Q22 Adj. ROATE(1) Adj. ROATE Strong Core Earnings
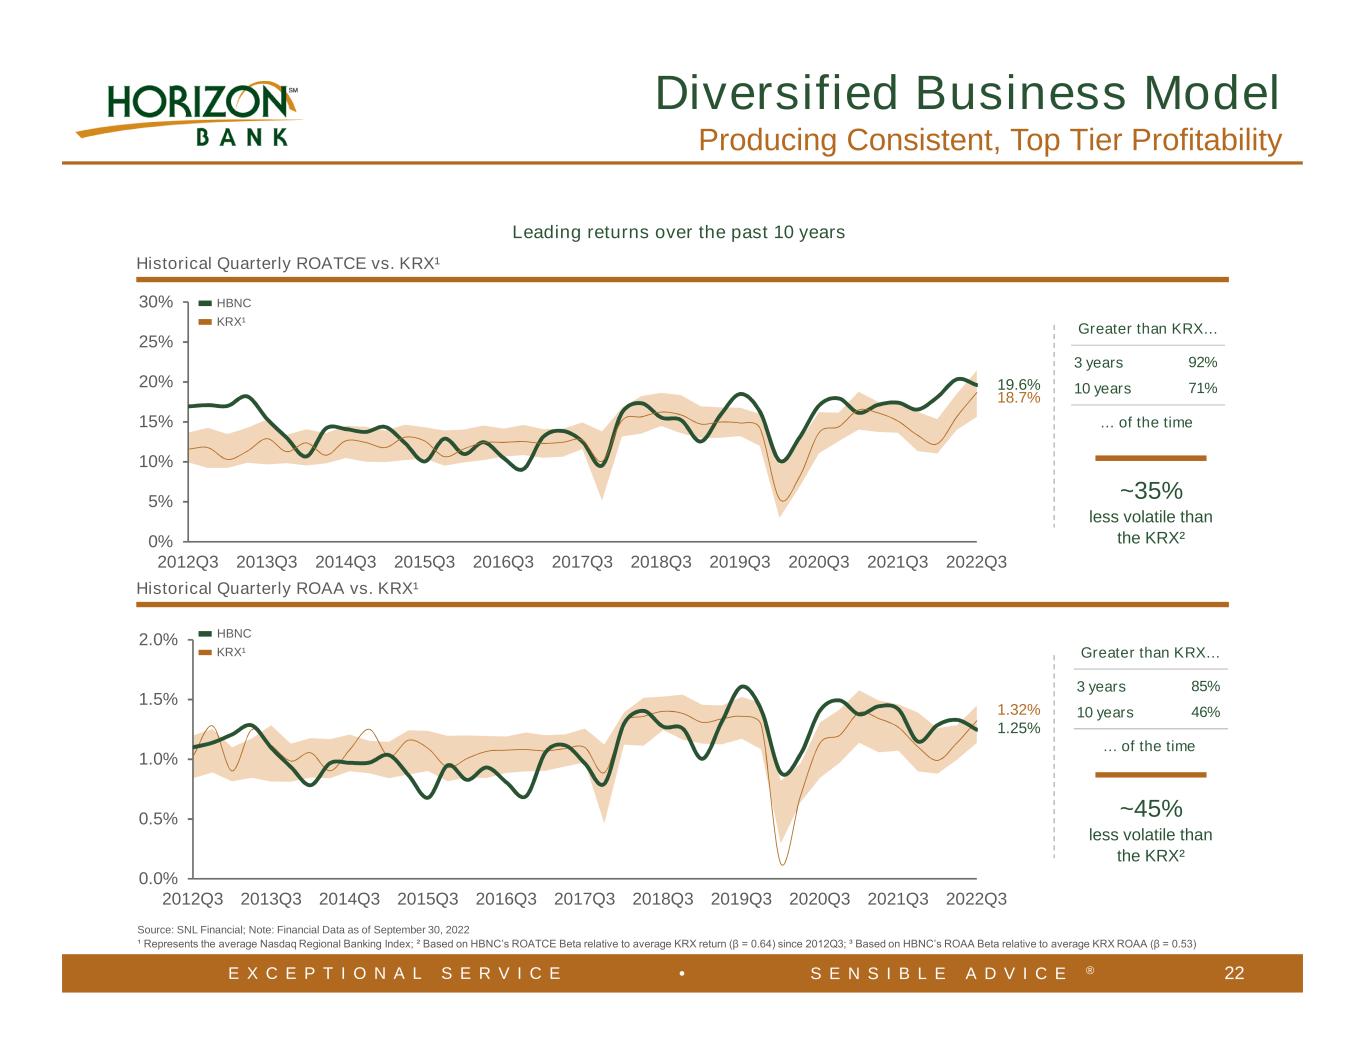
E X C E P T I O N A L S E R V I C E • S E N S I B L E A D V I C E ® 22 Greater than KRX… 3 years 85% 10 years 46% … of the time Source: SNL Financial; Note: Financial Data as of September 30, 2022 ¹ Represents the average Nasdaq Regional Banking Index; ² Based on HBNC’s ROATCE Beta relative to average KRX return (β = 0.64) since 2012Q3; ³ Based on HBNC’s ROAA Beta relative to average KRX ROAA (β = 0.53) 19.6% 18.7% Leading returns over the past 10 years 0% 5% 10% 15% 20% 25% 30% 2012Q3 2013Q3 2014Q3 2015Q3 2016Q3 2017Q3 2018Q3 2019Q3 2020Q3 2021Q3 2022Q3 Historical Quarterly ROATCE vs. KRX¹ HBNC KRX¹ Historical Quarterly ROAA vs. KRX¹ 1.25% 1.32% HBNC KRX¹ 0.0% 0.5% 1.0% 1.5% 2.0% 2012Q3 2013Q3 2014Q3 2015Q3 2016Q3 2017Q3 2018Q3 2019Q3 2020Q3 2021Q3 2022Q3 ~35% less volatile than the KRX² ~45% less volatile than the KRX² Greater than KRX… 3 years 92% 10 years 71% … of the time Diversified Business Model Producing Consistent, Top Tier Profitability
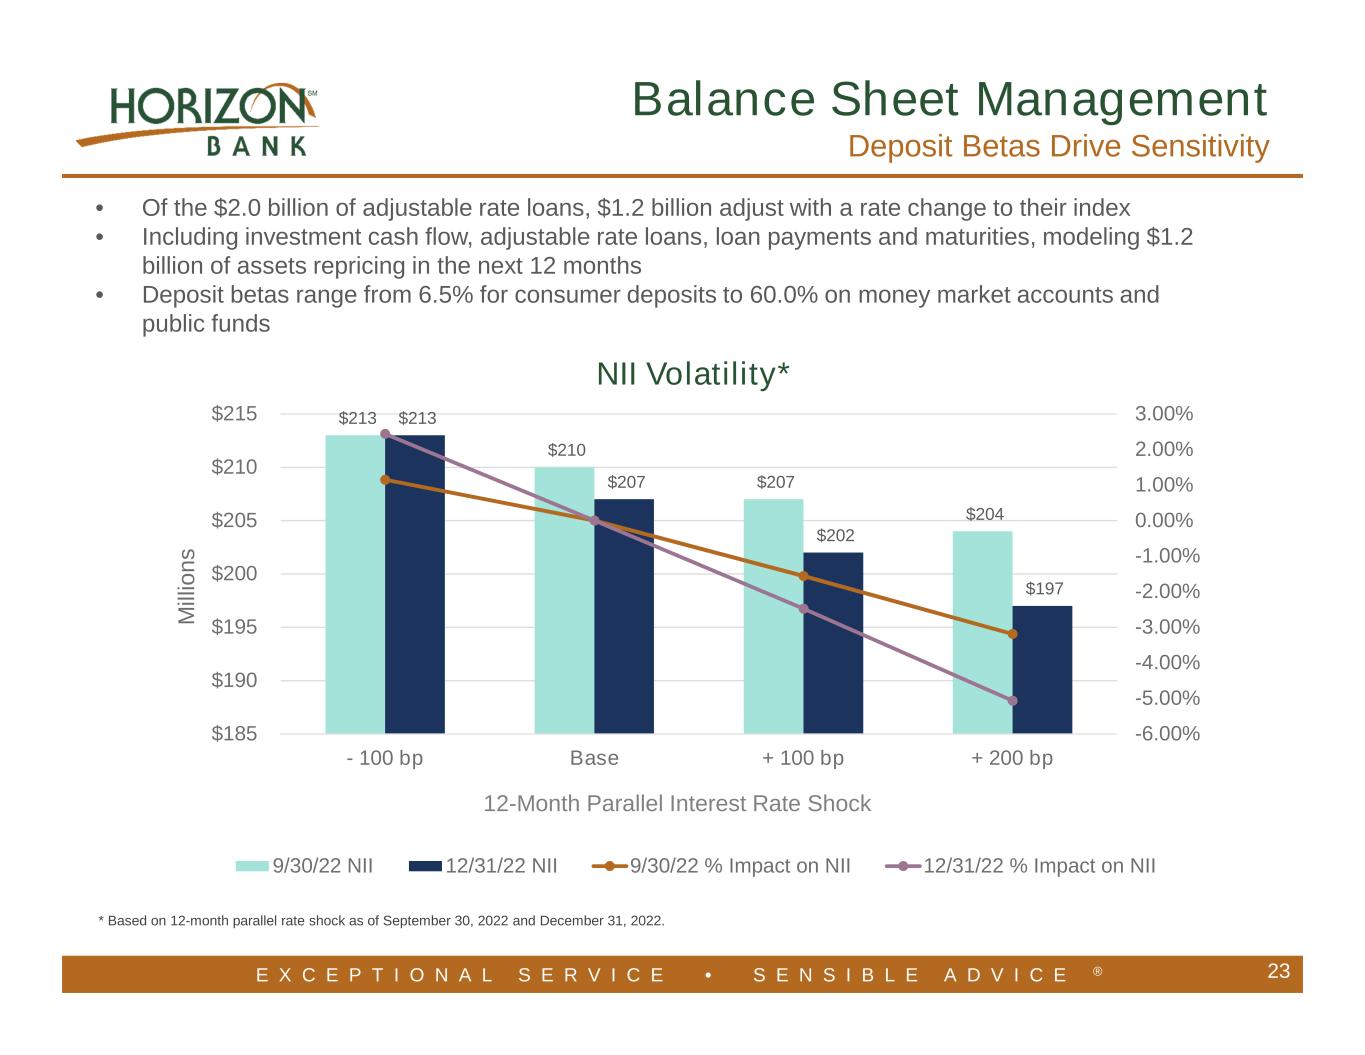
E X C E P T I O N A L S E R V I C E • S E N S I B L E A D V I C E ® 23 Balance Sheet Management Deposit Betas Drive Sensitivity • Of the $2.0 billion of adjustable rate loans, $1.2 billion adjust with a rate change to their index • Including investment cash flow, adjustable rate loans, loan payments and maturities, modeling $1.2 billion of assets repricing in the next 12 months • Deposit betas range from 6.5% for consumer deposits to 60.0% on money market accounts and public funds * Based on 12-month parallel rate shock as of September 30, 2022 and December 31, 2022. $213 $210 $207 $204 $213 $207 $202 $197 -6.00% -5.00% -4.00% -3.00% -2.00% -1.00% 0.00% 1.00% 2.00% 3.00% $185 $190 $195 $200 $205 $210 $215 - 100 bp Base + 100 bp + 200 bp M ill io n s NII Volatility* 9/30/22 NII 12/31/22 NII 9/30/22 % Impact on NII 12/31/22 % Impact on NII 12-Month Parallel Interest Rate Shock
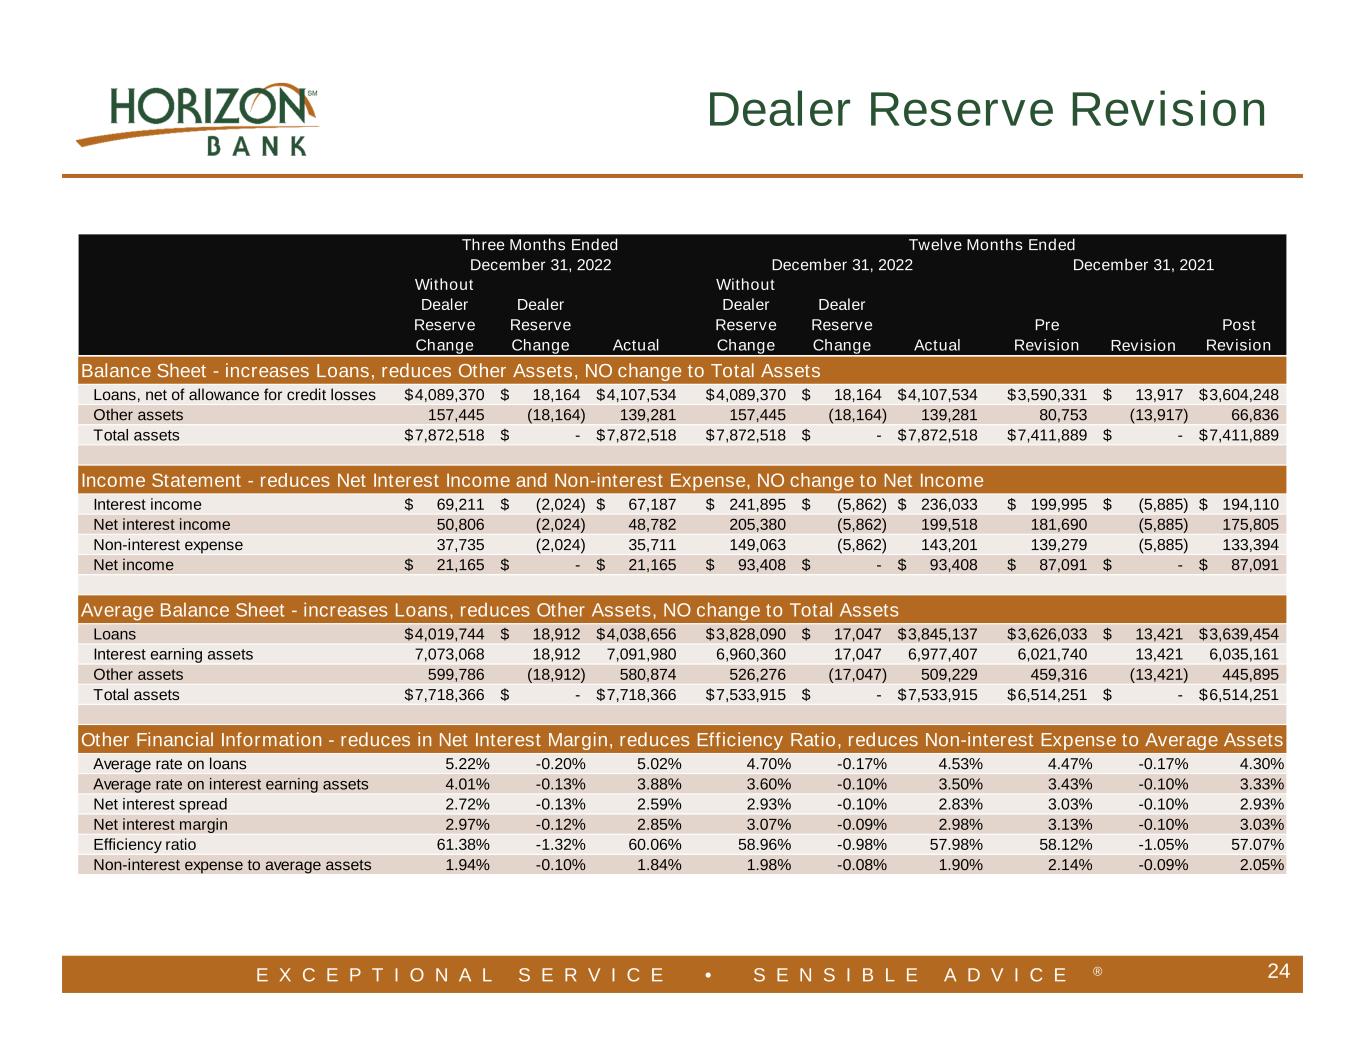
E X C E P T I O N A L S E R V I C E • S E N S I B L E A D V I C E ® 24 Dealer Reserve Revision Without Dealer Reserve Change Dealer Reserve Change Actual Without Dealer Reserve Change Dealer Reserve Change Actual Pre Revision Revision Post Revision Loans, net of allowance for credit losses 4,089,370$ 18,164$ 4,107,534$ 4,089,370$ 18,164$ 4,107,534$ 3,590,331$ 13,917$ 3,604,248$ Other assets 157,445 (18,164) 139,281 157,445 (18,164) 139,281 80,753 (13,917) 66,836 Total assets 7,872,518$ -$ 7,872,518$ 7,872,518$ -$ 7,872,518$ 7,411,889$ -$ 7,411,889$ Interest income 69,211$ (2,024)$ 67,187$ 241,895$ (5,862)$ 236,033$ 199,995$ (5,885)$ 194,110$ Net interest income 50,806 (2,024) 48,782 205,380 (5,862) 199,518 181,690 (5,885) 175,805 Non-interest expense 37,735 (2,024) 35,711 149,063 (5,862) 143,201 139,279 (5,885) 133,394 Net income 21,165$ -$ 21,165$ 93,408$ -$ 93,408$ 87,091$ -$ 87,091$ Loans 4,019,744$ 18,912$ 4,038,656$ 3,828,090$ 17,047$ 3,845,137$ 3,626,033$ 13,421$ 3,639,454$ Interest earning assets 7,073,068 18,912 7,091,980 6,960,360 17,047 6,977,407 6,021,740 13,421 6,035,161 Other assets 599,786 (18,912) 580,874 526,276 (17,047) 509,229 459,316 (13,421) 445,895 Total assets 7,718,366$ -$ 7,718,366$ 7,533,915$ -$ 7,533,915$ 6,514,251$ -$ 6,514,251$ Average rate on loans 5.22% -0.20% 5.02% 4.70% -0.17% 4.53% 4.47% -0.17% 4.30% Average rate on interest earning assets 4.01% -0.13% 3.88% 3.60% -0.10% 3.50% 3.43% -0.10% 3.33% Net interest spread 2.72% -0.13% 2.59% 2.93% -0.10% 2.83% 3.03% -0.10% 2.93% Net interest margin 2.97% -0.12% 2.85% 3.07% -0.09% 2.98% 3.13% -0.10% 3.03% Efficiency ratio 61.38% -1.32% 60.06% 58.96% -0.98% 57.98% 58.12% -1.05% 57.07% Non-interest expense to average assets 1.94% -0.10% 1.84% 1.98% -0.08% 1.90% 2.14% -0.09% 2.05% Three Months Ended Twelve Months Ended December 31, 2022 December 31, 2021 Balance Sheet - increases Loans, reduces Other Assets, NO change to Total Assets Income Statement - reduces Net Interest Income and Non-interest Expense, NO change to Net Income Average Balance Sheet - increases Loans, reduces Other Assets, NO change to Total Assets Other Financial Information - reduces in Net Interest Margin, reduces Efficiency Ratio, reduces Non-interest Expense to Average Assets December 31, 2022
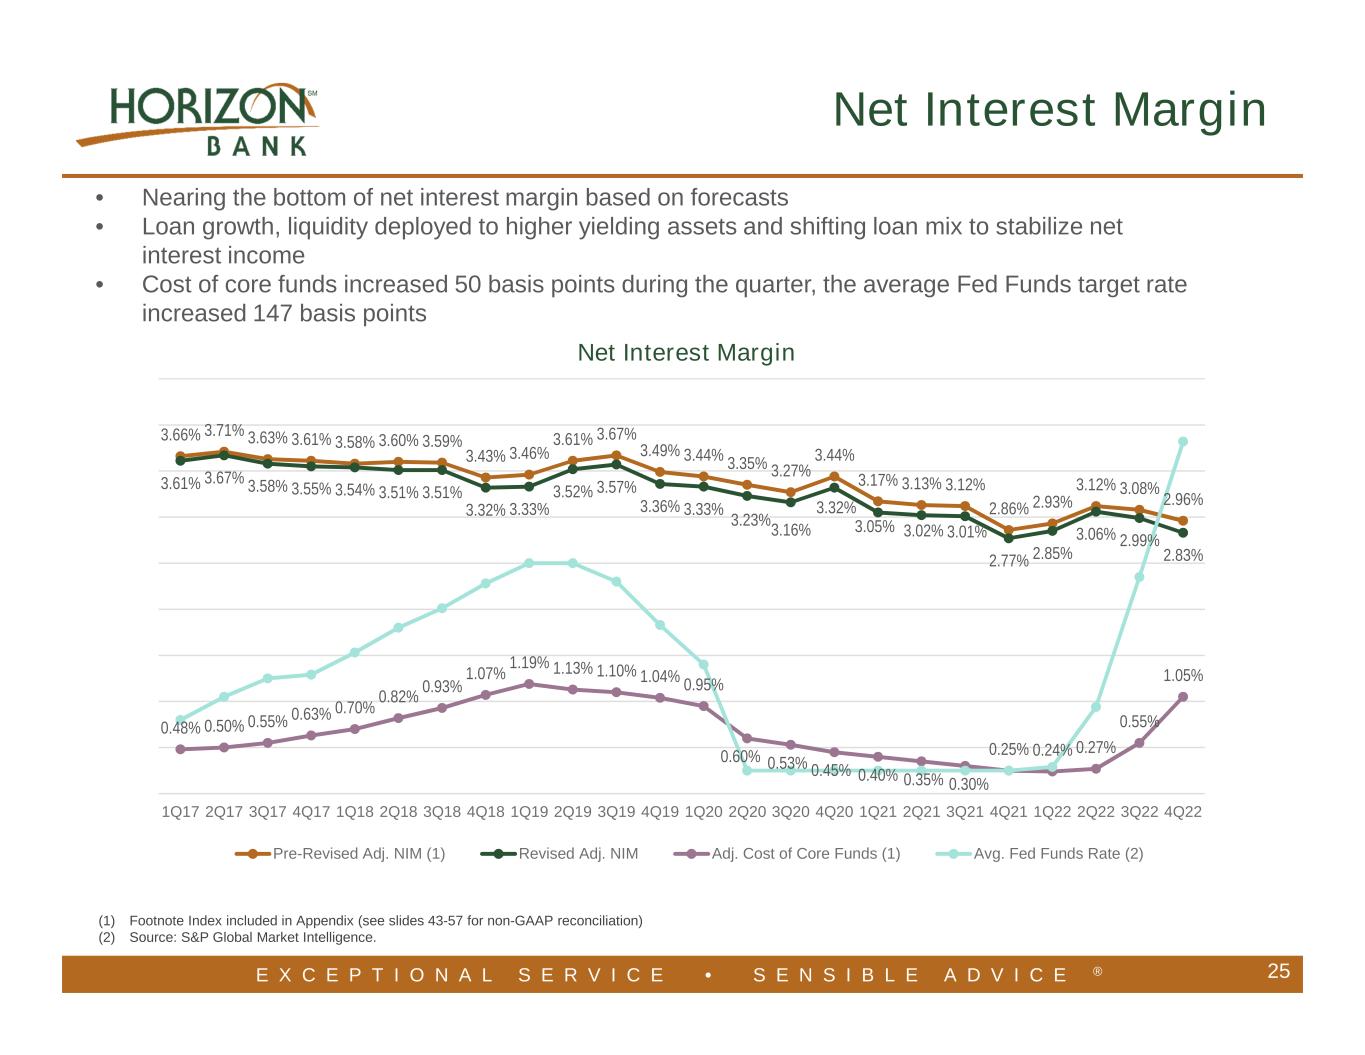
E X C E P T I O N A L S E R V I C E • S E N S I B L E A D V I C E ® 3.66% 3.71% 3.63% 3.61% 3.58% 3.60% 3.59% 3.43% 3.46% 3.61% 3.67% 3.49% 3.44% 3.35% 3.27% 3.44% 3.17% 3.13% 3.12% 2.86% 2.93% 3.12% 3.08% 2.96% 3.61% 3.67% 3.58% 3.55% 3.54% 3.51% 3.51% 3.32% 3.33% 3.52% 3.57% 3.36% 3.33% 3.23% 3.16% 3.32% 3.05% 3.02% 3.01% 2.77% 2.85% 3.06% 2.99% 2.83% 0.48% 0.50% 0.55% 0.63% 0.70% 0.82% 0.93% 1.07% 1.19% 1.13% 1.10% 1.04% 0.95% 0.60% 0.53% 0.45% 0.40% 0.35% 0.30% 0.25% 0.24% 0.27% 0.55% 1.05% 1Q17 2Q17 3Q17 4Q17 1Q18 2Q18 3Q18 4Q18 1Q19 2Q19 3Q19 4Q19 1Q20 2Q20 3Q20 4Q20 1Q21 2Q21 3Q21 4Q21 1Q22 2Q22 3Q22 4Q22 Net Interest Margin Pre-Revised Adj. NIM (1) Revised Adj. NIM Adj. Cost of Core Funds (1) Avg. Fed Funds Rate (2) • Nearing the bottom of net interest margin based on forecasts • Loan growth, liquidity deployed to higher yielding assets and shifting loan mix to stabilize net interest income • Cost of core funds increased 50 basis points during the quarter, the average Fed Funds target rate increased 147 basis points 25 (1) Footnote Index included in Appendix (see slides 43-57 for non-GAAP reconciliation) (2) Source: S&P Global Market Intelligence. Net Interest Margin
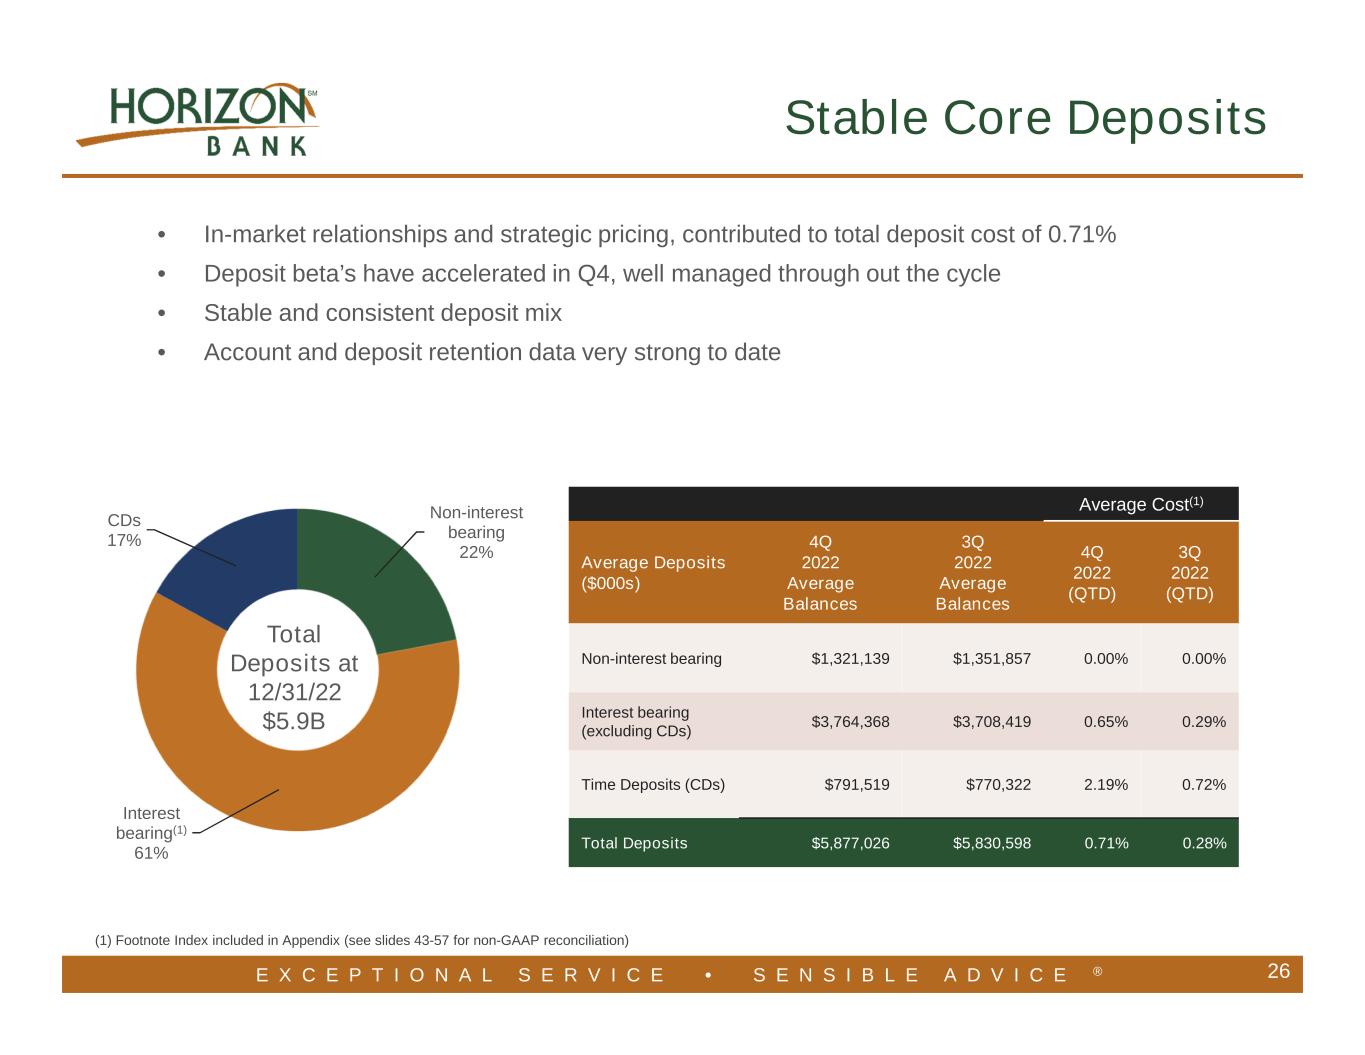
E X C E P T I O N A L S E R V I C E • S E N S I B L E A D V I C E ® Non-interest bearing 22% Interest bearing(1) 61% CDs 17% 26 • In-market relationships and strategic pricing, contributed to total deposit cost of 0.71% • Deposit beta’s have accelerated in Q4, well managed through out the cycle • Stable and consistent deposit mix • Account and deposit retention data very strong to date Average Cost(1) Average Deposits ($000s) 4Q 2022 Average Balances 3Q 2022 Average Balances 4Q 2022 (QTD) 3Q 2022 (QTD) Non-interest bearing $1,321,139 $1,351,857 0.00% 0.00% Interest bearing (excluding CDs) $3,764,368 $3,708,419 0.65% 0.29% Time Deposits (CDs) $791,519 $770,322 2.19% 0.72% Total Deposits $5,877,026 $5,830,598 0.71% 0.28% (1) Footnote Index included in Appendix (see slides 43-57 for non-GAAP reconciliation) Stable Core Deposits Total Deposits at 12/31/22 $5.9B
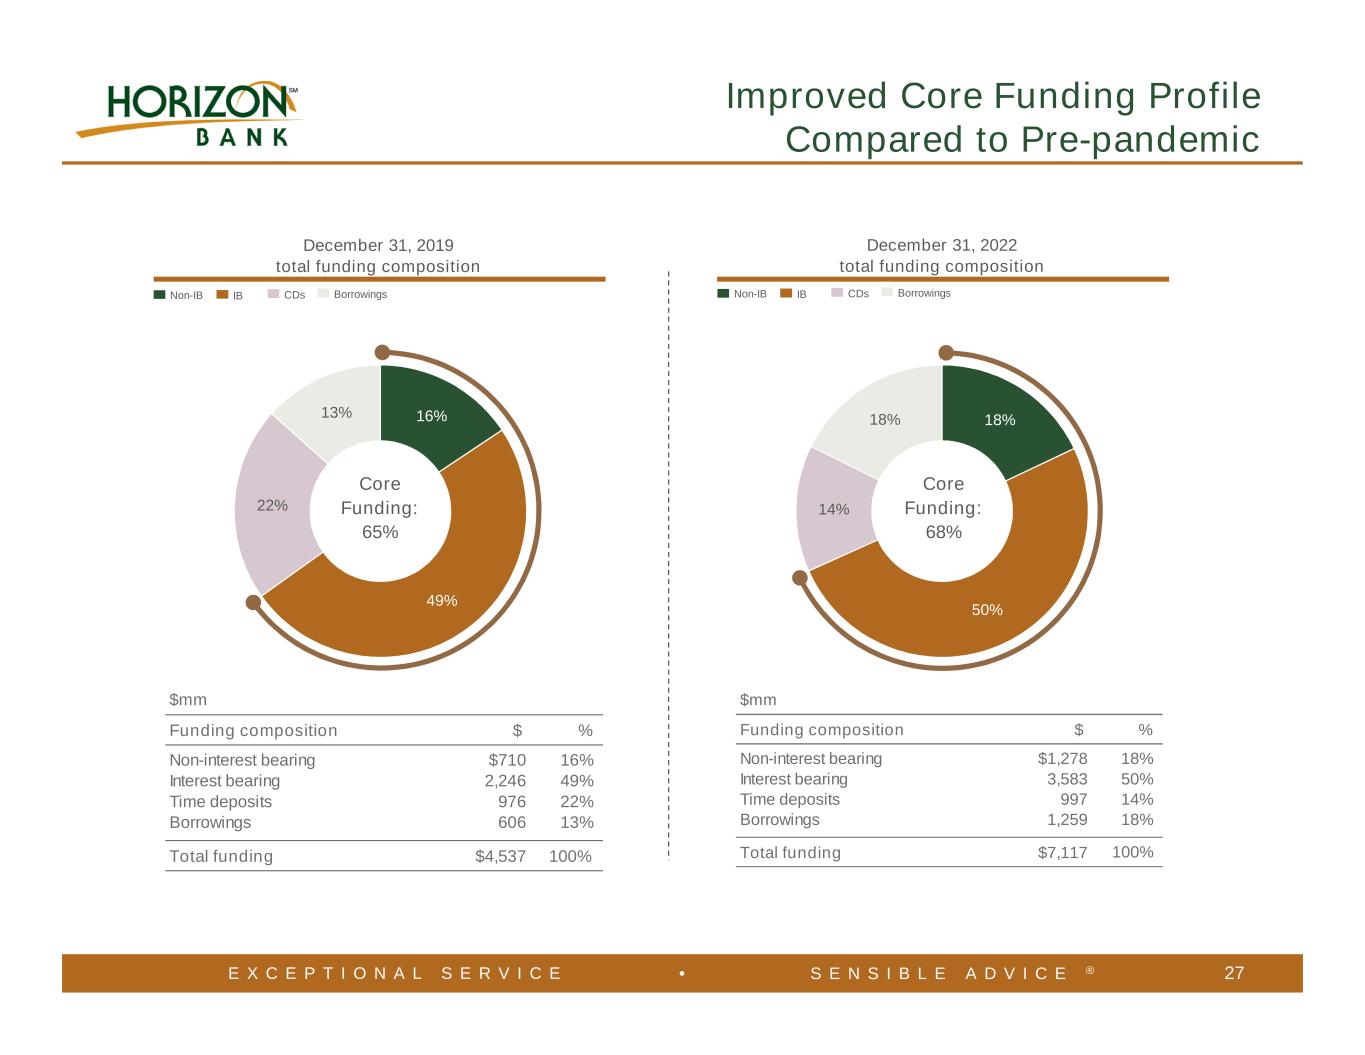
E X C E P T I O N A L S E R V I C E • S E N S I B L E A D V I C E ® 27 $mm Funding composition $ % Non-interest bearing $1,278 18% Interest bearing 3,583 50% Time deposits 997 14% Borrowings 1,259 18% Total funding $7,117 100% 18% 50% 14% 18% Improved Core Funding Profile Compared to Pre-pandemic 16% 49% 22% 13% December 31, 2022 total funding composition Non-IB IB CDs Borrowings Core Funding: 68% December 31, 2019 total funding composition Non-IB IB CDs Borrowings $mm Funding composition $ % Non-interest bearing $710 16% Interest bearing 2,246 49% Time deposits 976 22% Borrowings 606 13% Total funding $4,537 100% Core Funding: 65%
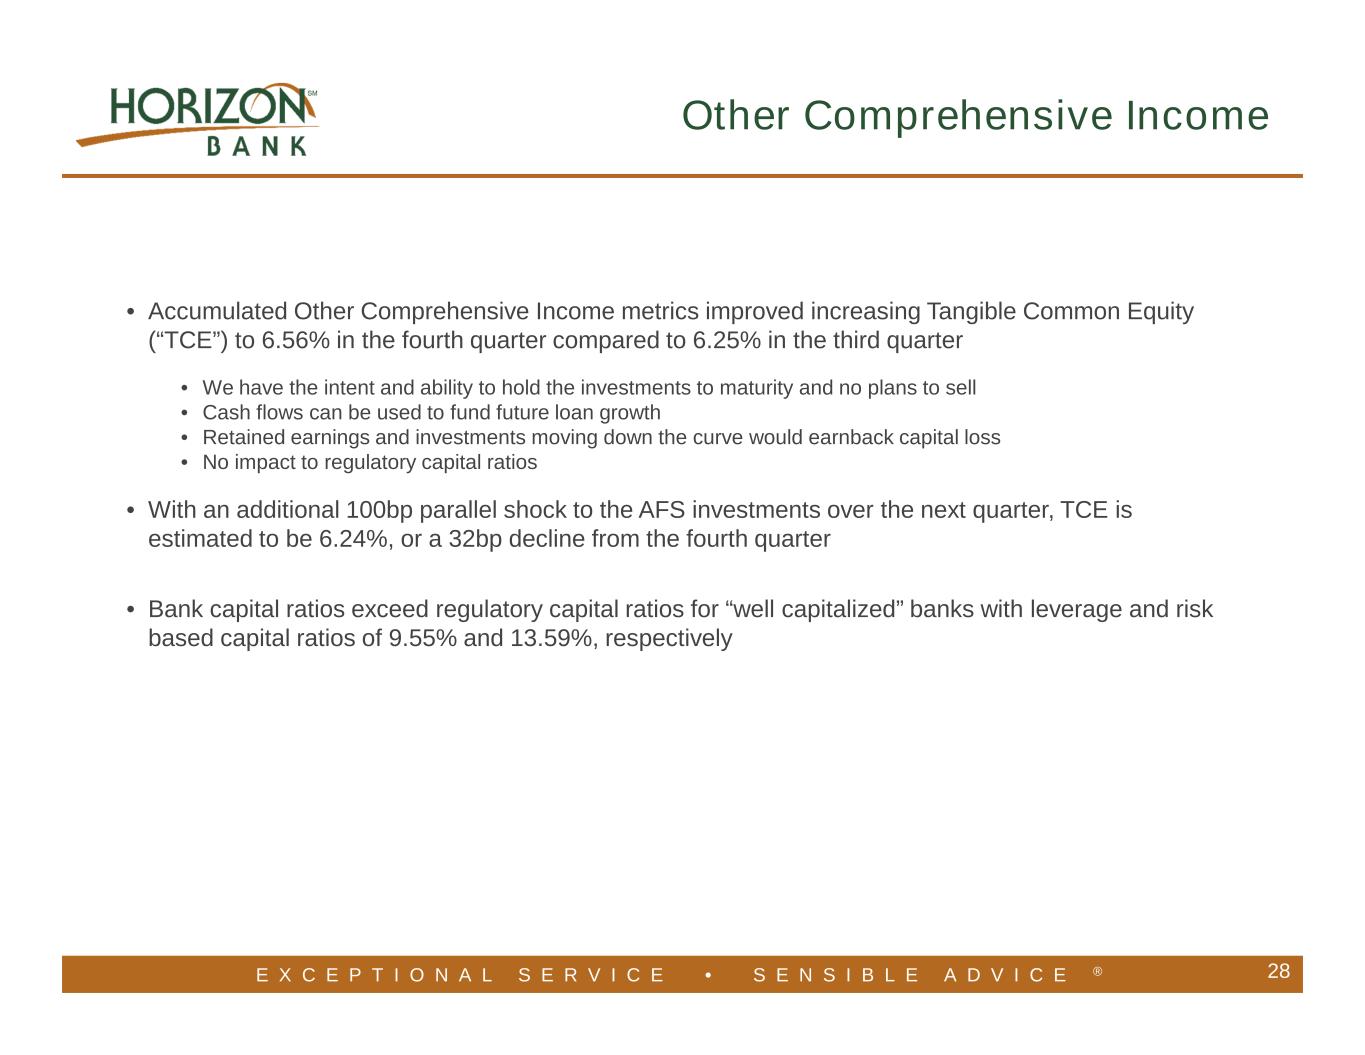
E X C E P T I O N A L S E R V I C E • S E N S I B L E A D V I C E ® 28 • Accumulated Other Comprehensive Income metrics improved increasing Tangible Common Equity (“TCE”) to 6.56% in the fourth quarter compared to 6.25% in the third quarter • We have the intent and ability to hold the investments to maturity and no plans to sell • Cash flows can be used to fund future loan growth • Retained earnings and investments moving down the curve would earnback capital loss • No impact to regulatory capital ratios • With an additional 100bp parallel shock to the AFS investments over the next quarter, TCE is estimated to be 6.24%, or a 32bp decline from the fourth quarter • Bank capital ratios exceed regulatory capital ratios for “well capitalized” banks with leverage and risk based capital ratios of 9.55% and 13.59%, respectively Other Comprehensive Income
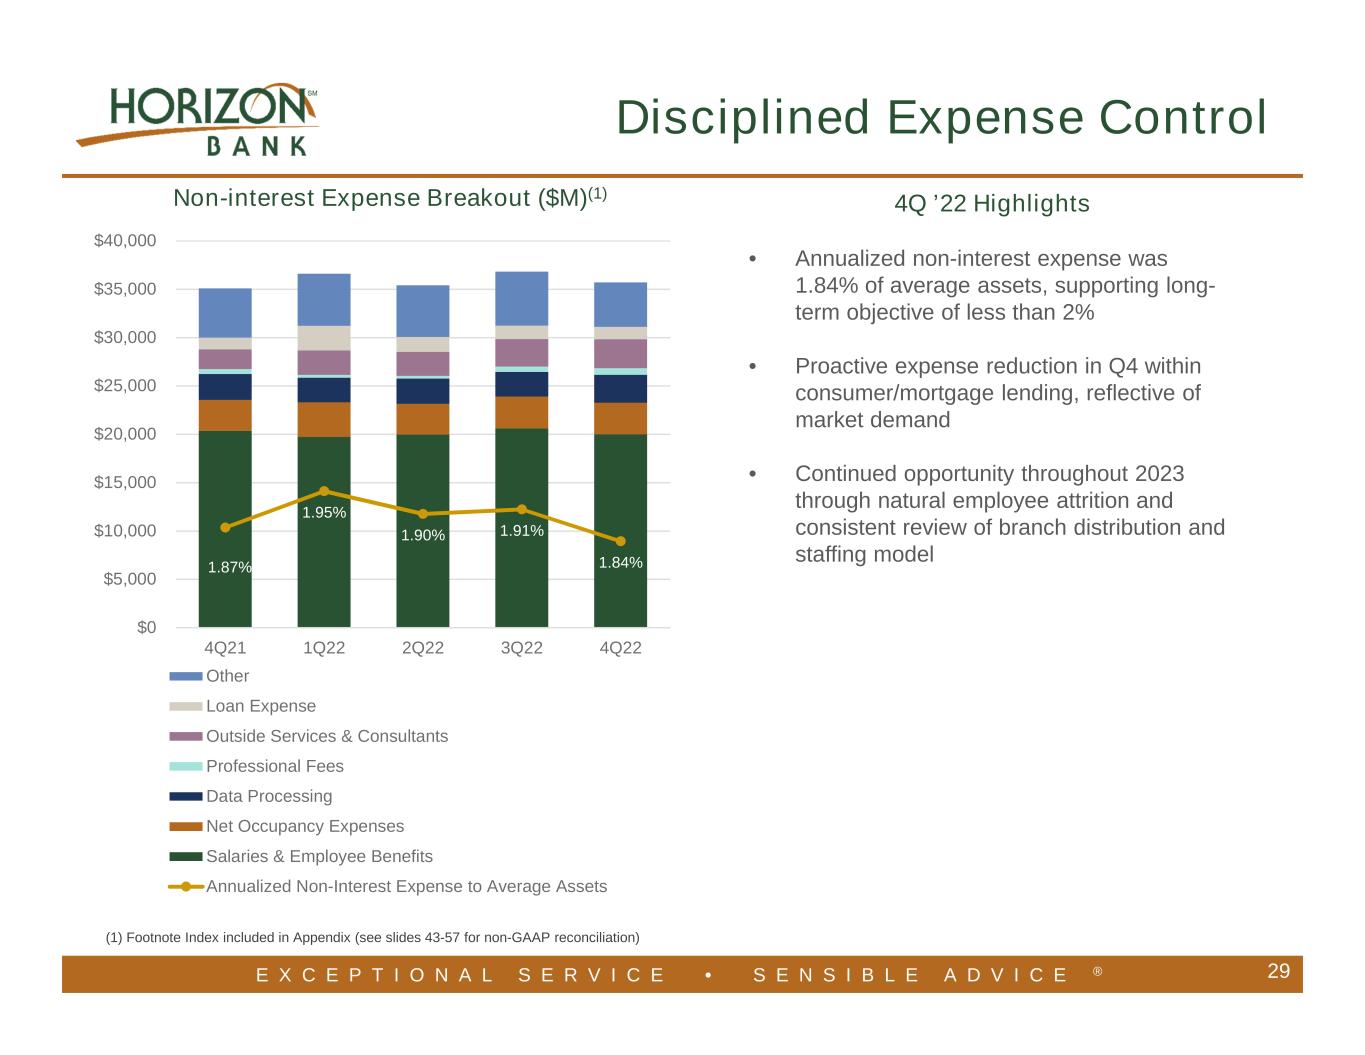
E X C E P T I O N A L S E R V I C E • S E N S I B L E A D V I C E ® • Annualized non-interest expense was 1.84% of average assets, supporting long- term objective of less than 2% • Proactive expense reduction in Q4 within consumer/mortgage lending, reflective of market demand • Continued opportunity throughout 2023 through natural employee attrition and consistent review of branch distribution and staffing model 29 4Q ’22 Highlights (1) Footnote Index included in Appendix (see slides 43-57 for non-GAAP reconciliation) Disciplined Expense Control 1.87% 1.95% 1.90% 1.91% 1.84% $0 $5,000 $10,000 $15,000 $20,000 $25,000 $30,000 $35,000 $40,000 4Q21 1Q22 2Q22 3Q22 4Q22 Other Loan Expense Outside Services & Consultants Professional Fees Data Processing Net Occupancy Expenses Salaries & Employee Benefits Annualized Non-Interest Expense to Average Assets Non-interest Expense Breakout ($M)(1)
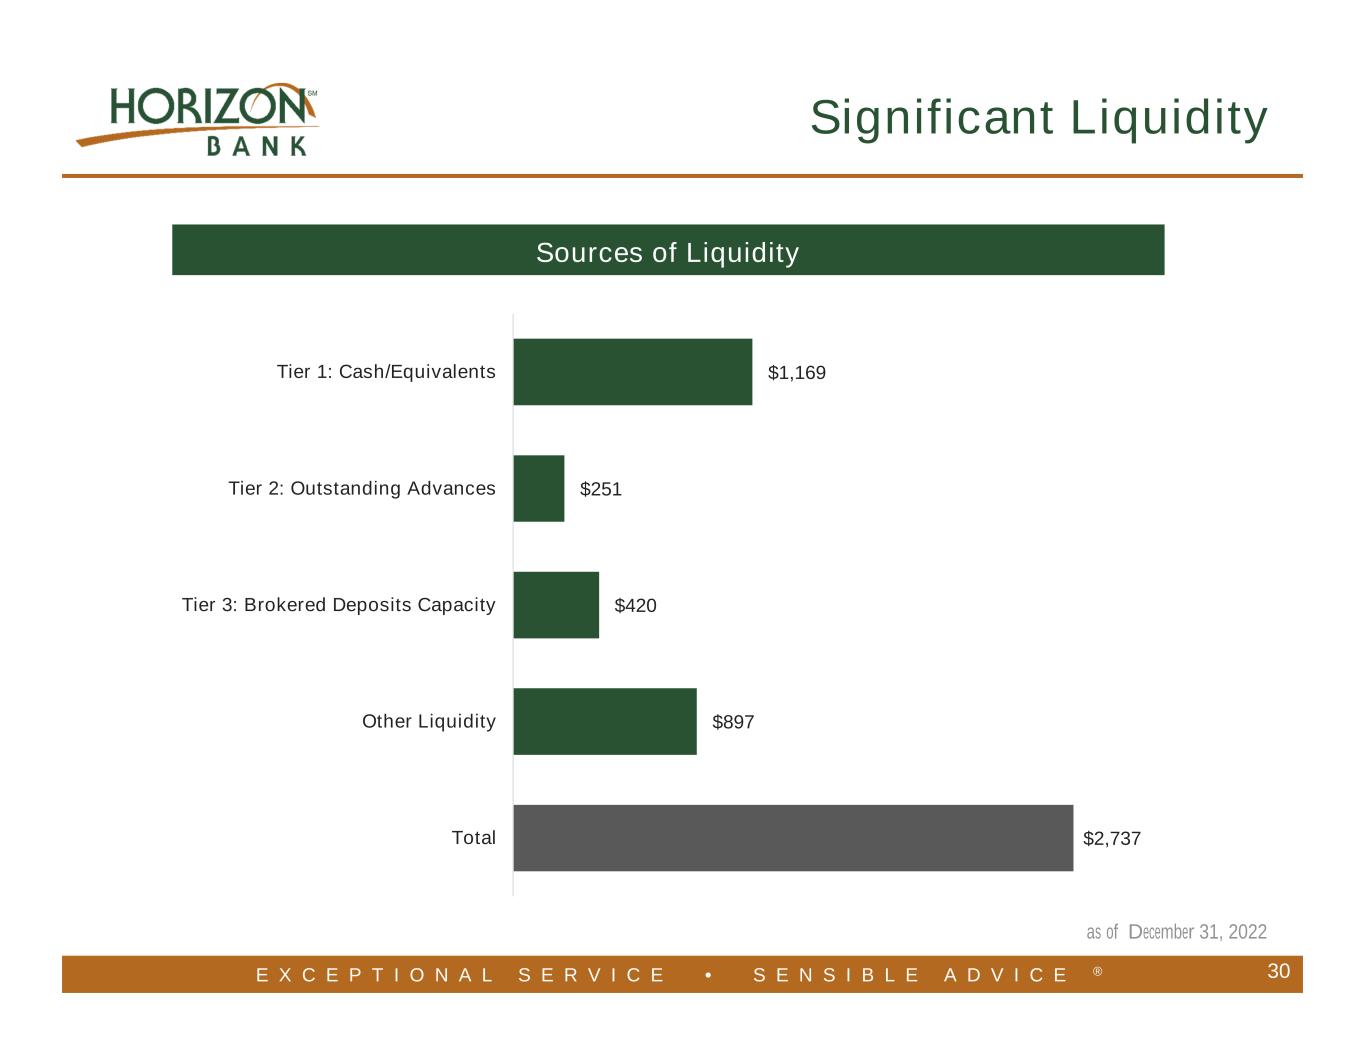
E X C E P T I O N A L S E R V I C E • S E N S I B L E A D V I C E ® Significant Liquidity 30 Sources of Liquidity $1,169 $251 $420 $897 $2,737 Tier 1: Cash/Equivalents Tier 2: Outstanding Advances Tier 3: Brokered Deposits Capacity Other Liquidity Total as of December 31, 2022
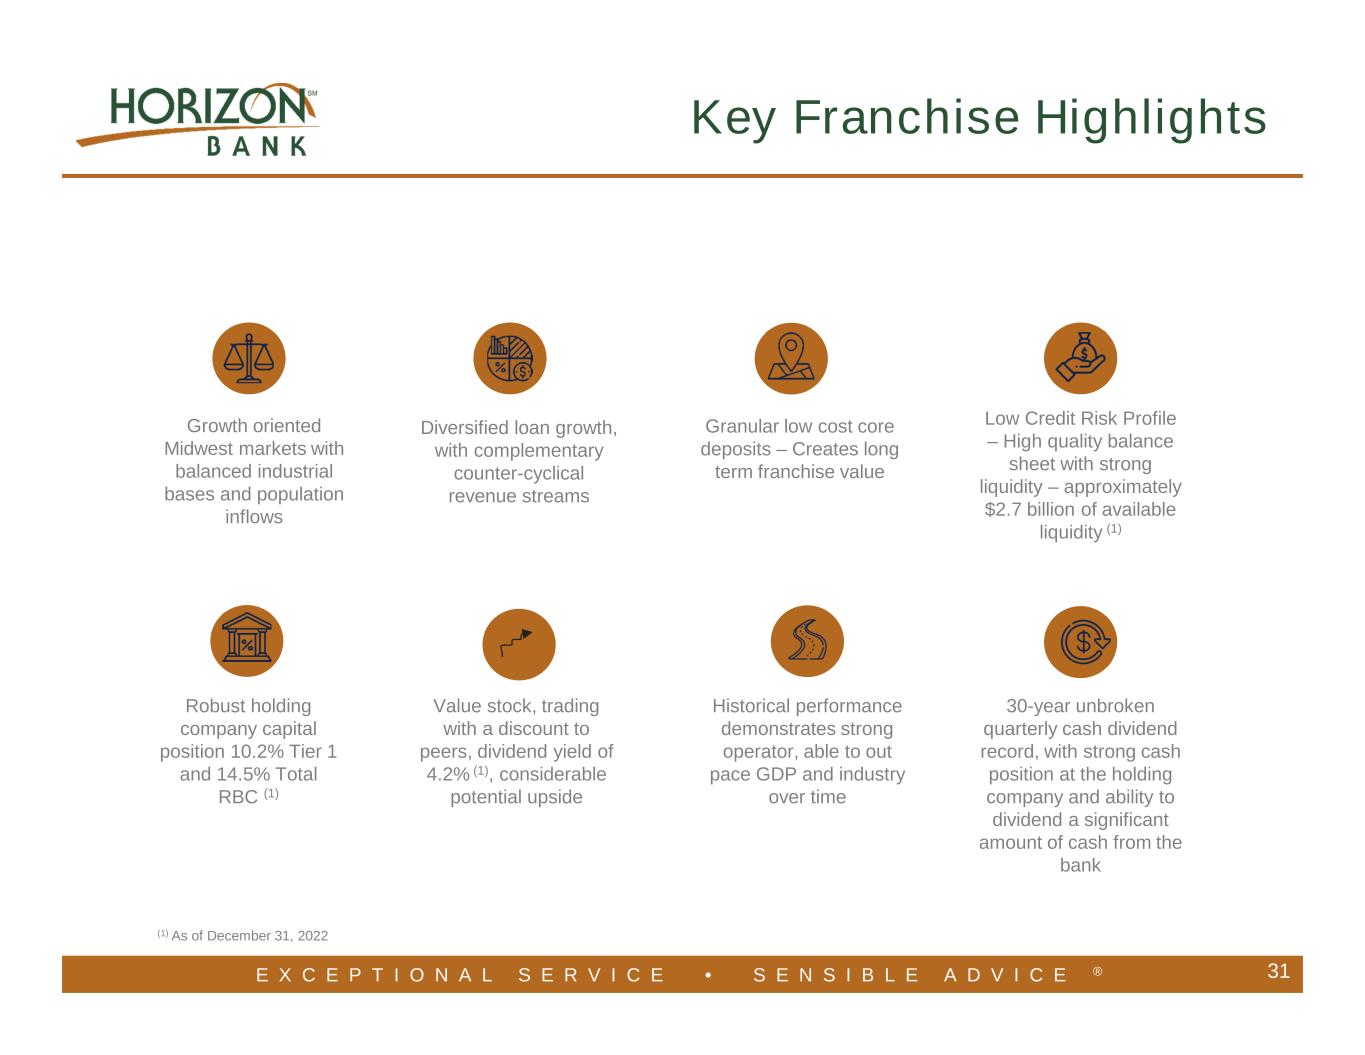
E X C E P T I O N A L S E R V I C E • S E N S I B L E A D V I C E ® 31 Key Franchise Highlights Granular low cost core deposits – Creates long term franchise value Growth oriented Midwest markets with balanced industrial bases and population inflows Low Credit Risk Profile – High quality balance sheet with strong liquidity – approximately $2.7 billion of available liquidity (1) Robust holding company capital position 10.2% Tier 1 and 14.5% Total RBC (1) Diversified loan growth, with complementary counter-cyclical revenue streams Historical performance demonstrates strong operator, able to out pace GDP and industry over time 30-year unbroken quarterly cash dividend record, with strong cash position at the holding company and ability to dividend a significant amount of cash from the bank Value stock, trading with a discount to peers, dividend yield of 4.2% (1), considerable potential upside (1) As of December 31, 2022
E X C E P T I O N A L S E R V I C E • S E N S I B L E A D V I C E ® 32 Appendix
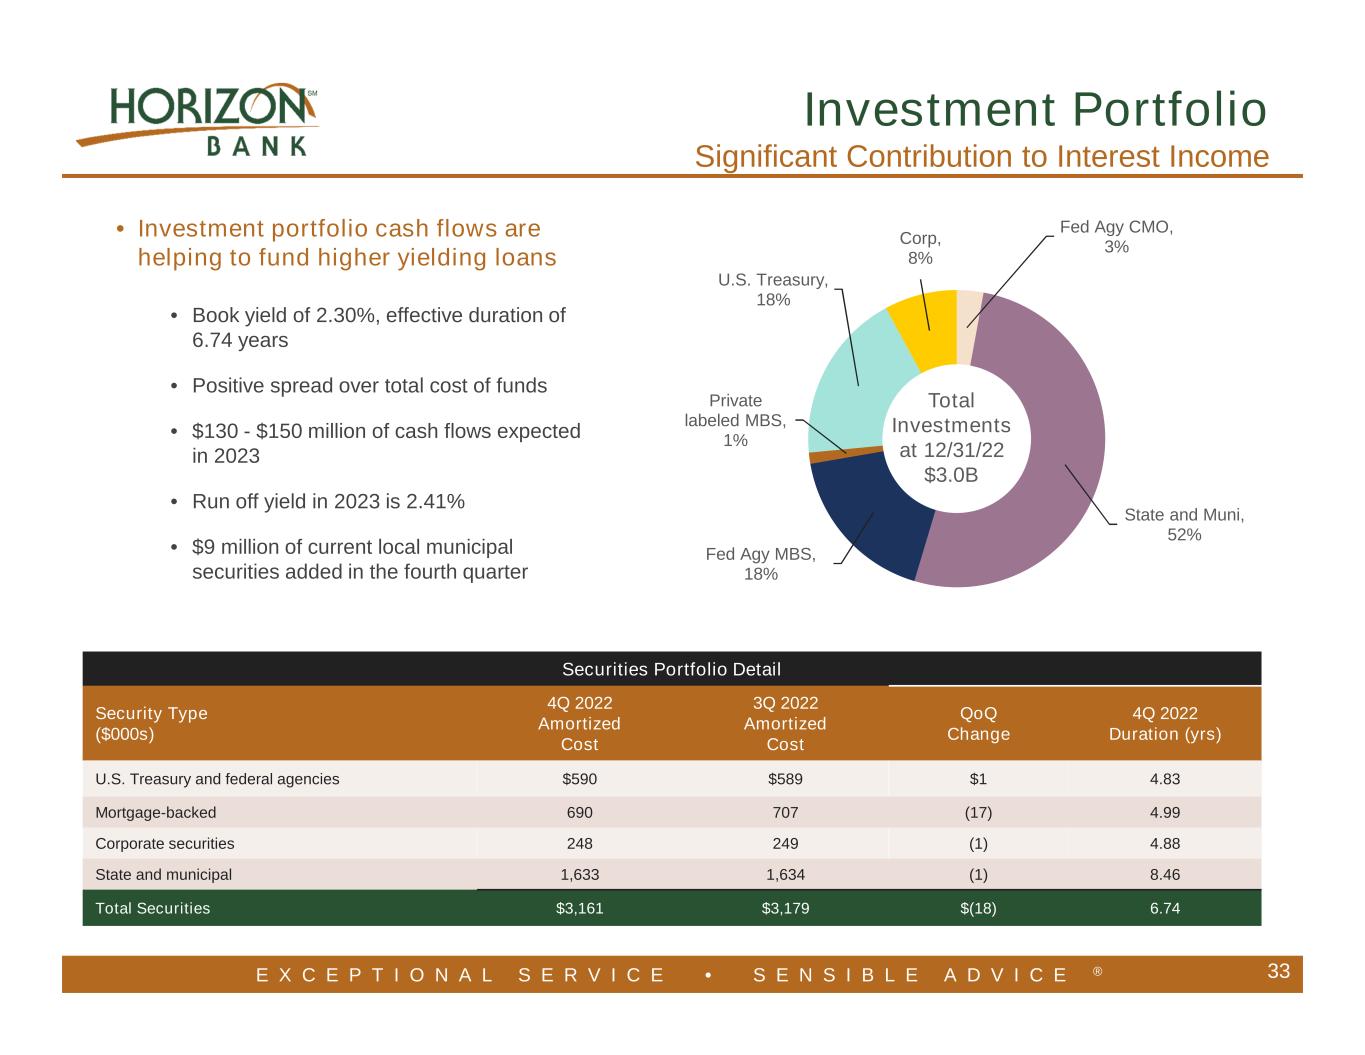
E X C E P T I O N A L S E R V I C E • S E N S I B L E A D V I C E ® Fed Agy CMO, 3% State and Muni, 52% Fed Agy MBS, 18% Private labeled MBS, 1% U.S. Treasury, 18% Corp, 8% Total Investments at 12/31/22 $3.0B 33 • Investment portfolio cash flows are helping to fund higher yielding loans • Book yield of 2.30%, effective duration of 6.74 years • Positive spread over total cost of funds • $130 - $150 million of cash flows expected in 2023 • Run off yield in 2023 is 2.41% • $9 million of current local municipal securities added in the fourth quarter Investment Portfolio Significant Contribution to Interest Income Securities Portfolio Detail Security Type ($000s) 4Q 2022 Amortized Cost 3Q 2022 Amortized Cost QoQ Change 4Q 2022 Duration (yrs) U.S. Treasury and federal agencies $590 $589 $1 4.83 Mortgage-backed 690 707 (17) 4.99 Corporate securities 248 249 (1) 4.88 State and municipal 1,633 1,634 (1) 8.46 Total Securities $3,161 $3,179 $(18) 6.74
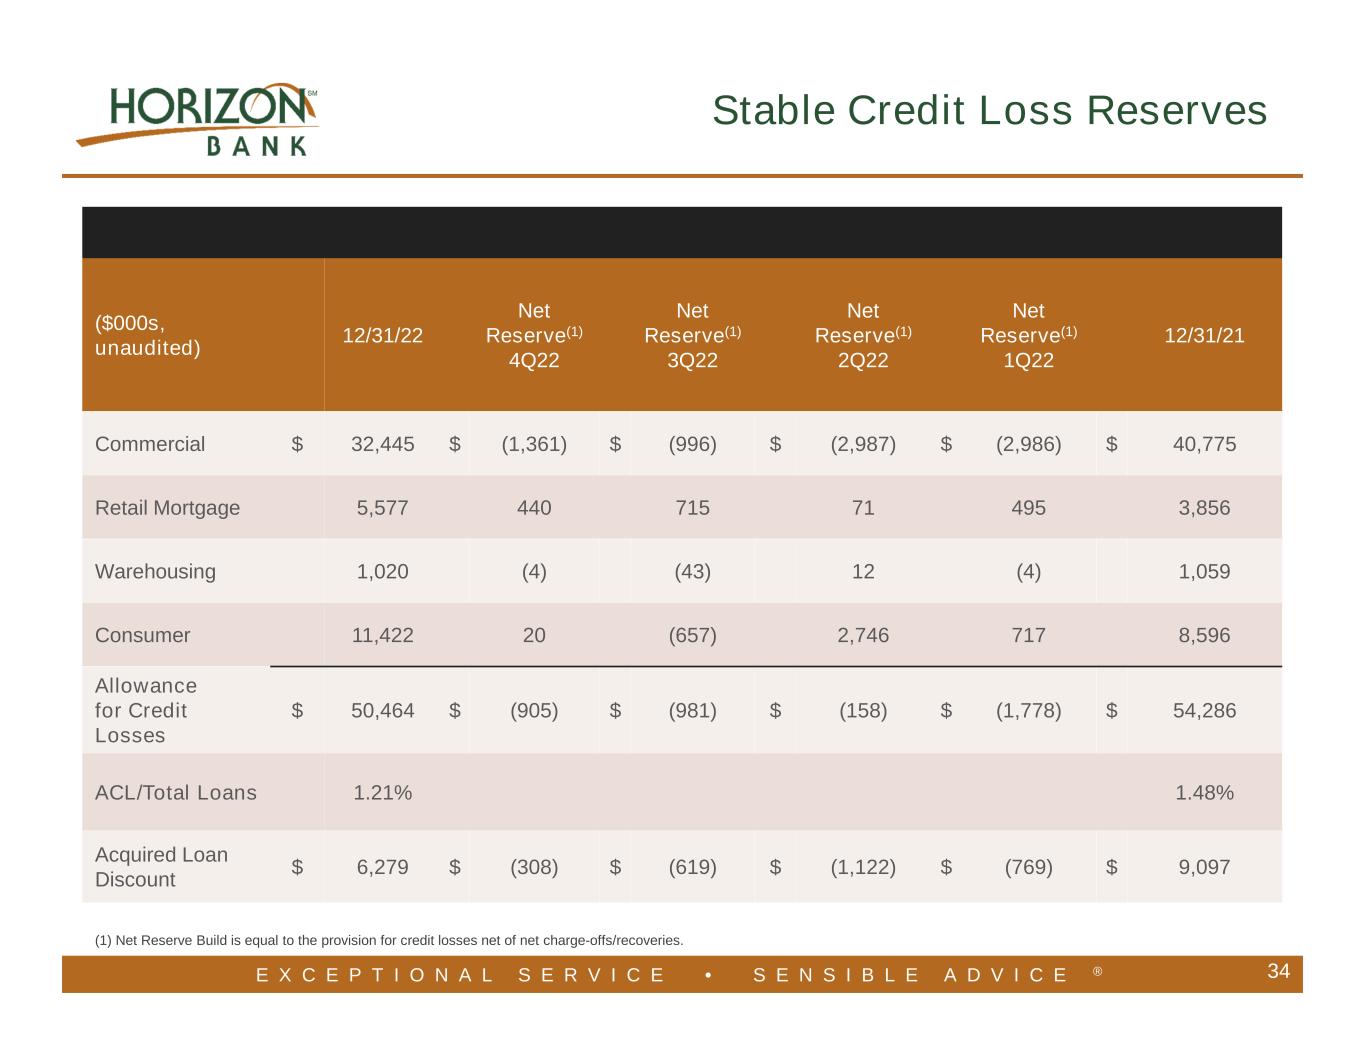
E X C E P T I O N A L S E R V I C E • S E N S I B L E A D V I C E ® 34 (1) Net Reserve Build is equal to the provision for credit losses net of net charge-offs/recoveries. Stable Credit Loss Reserves ($000s, unaudited) 12/31/22 Net Reserve(1) 4Q22 Net Reserve(1) 3Q22 Net Reserve(1) 2Q22 Net Reserve(1) 1Q22 12/31/21 Commercial $ 32,445 $ (1,361) $ (996) $ (2,987) $ (2,986) $ 40,775 Retail Mortgage 5,577 440 715 71 495 3,856 Warehousing 1,020 (4) (43) 12 (4) 1,059 Consumer 11,422 20 (657) 2,746 717 8,596 Allowance for Credit Losses $ 50,464 $ (905) $ (981) $ (158) $ (1,778) $ 54,286 ACL/Total Loans 1.21% 1.48% Acquired Loan Discount $ 6,279 $ (308) $ (619) $ (1,122) $ (769) $ 9,097
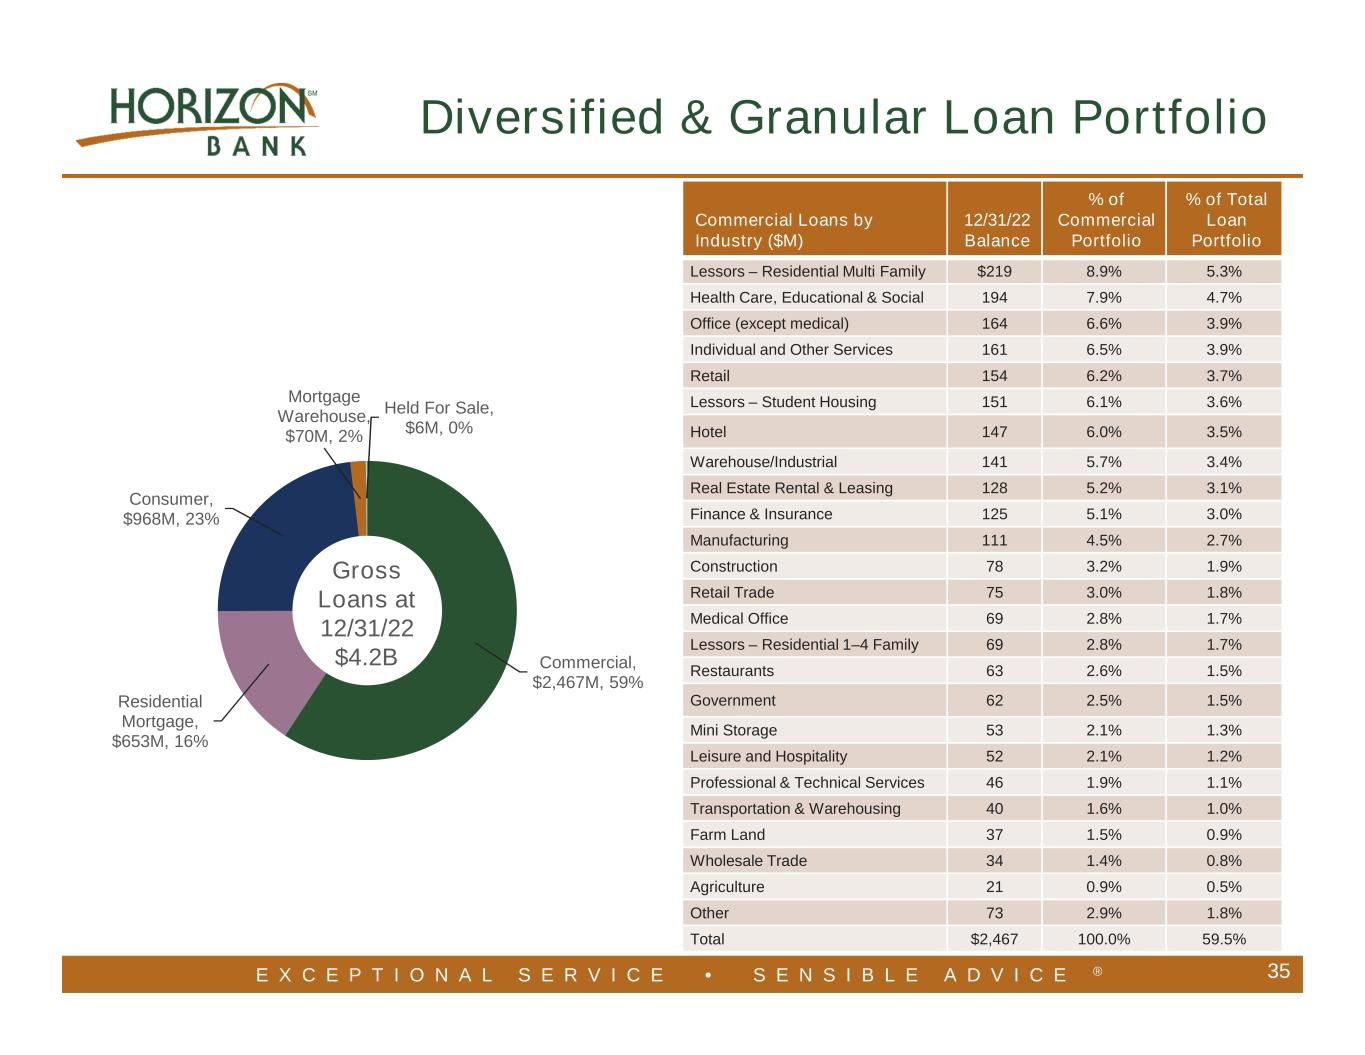
E X C E P T I O N A L S E R V I C E • S E N S I B L E A D V I C E ® Commercial, $2,467M, 59% Residential Mortgage, $653M, 16% Consumer, $968M, 23% Mortgage Warehouse, $70M, 2% Held For Sale, $6M, 0% 35 Gross Loans at 12/31/22 $4.2B Commercial Loans by Industry ($M) 12/31/22 Balance % of Commercial Portfolio % of Total Loan Portfolio Lessors – Residential Multi Family $219 8.9% 5.3% Health Care, Educational & Social 194 7.9% 4.7% Office (except medical) 164 6.6% 3.9% Individual and Other Services 161 6.5% 3.9% Retail 154 6.2% 3.7% Lessors – Student Housing 151 6.1% 3.6% Hotel 147 6.0% 3.5% Warehouse/Industrial 141 5.7% 3.4% Real Estate Rental & Leasing 128 5.2% 3.1% Finance & Insurance 125 5.1% 3.0% Manufacturing 111 4.5% 2.7% Construction 78 3.2% 1.9% Retail Trade 75 3.0% 1.8% Medical Office 69 2.8% 1.7% Lessors – Residential 1–4 Family 69 2.8% 1.7% Restaurants 63 2.6% 1.5% Government 62 2.5% 1.5% Mini Storage 53 2.1% 1.3% Leisure and Hospitality 52 2.1% 1.2% Professional & Technical Services 46 1.9% 1.1% Transportation & Warehousing 40 1.6% 1.0% Farm Land 37 1.5% 0.9% Wholesale Trade 34 1.4% 0.8% Agriculture 21 0.9% 0.5% Other 73 2.9% 1.8% Total $2,467 100.0% 59.5% Diversified & Granular Loan Portfolio
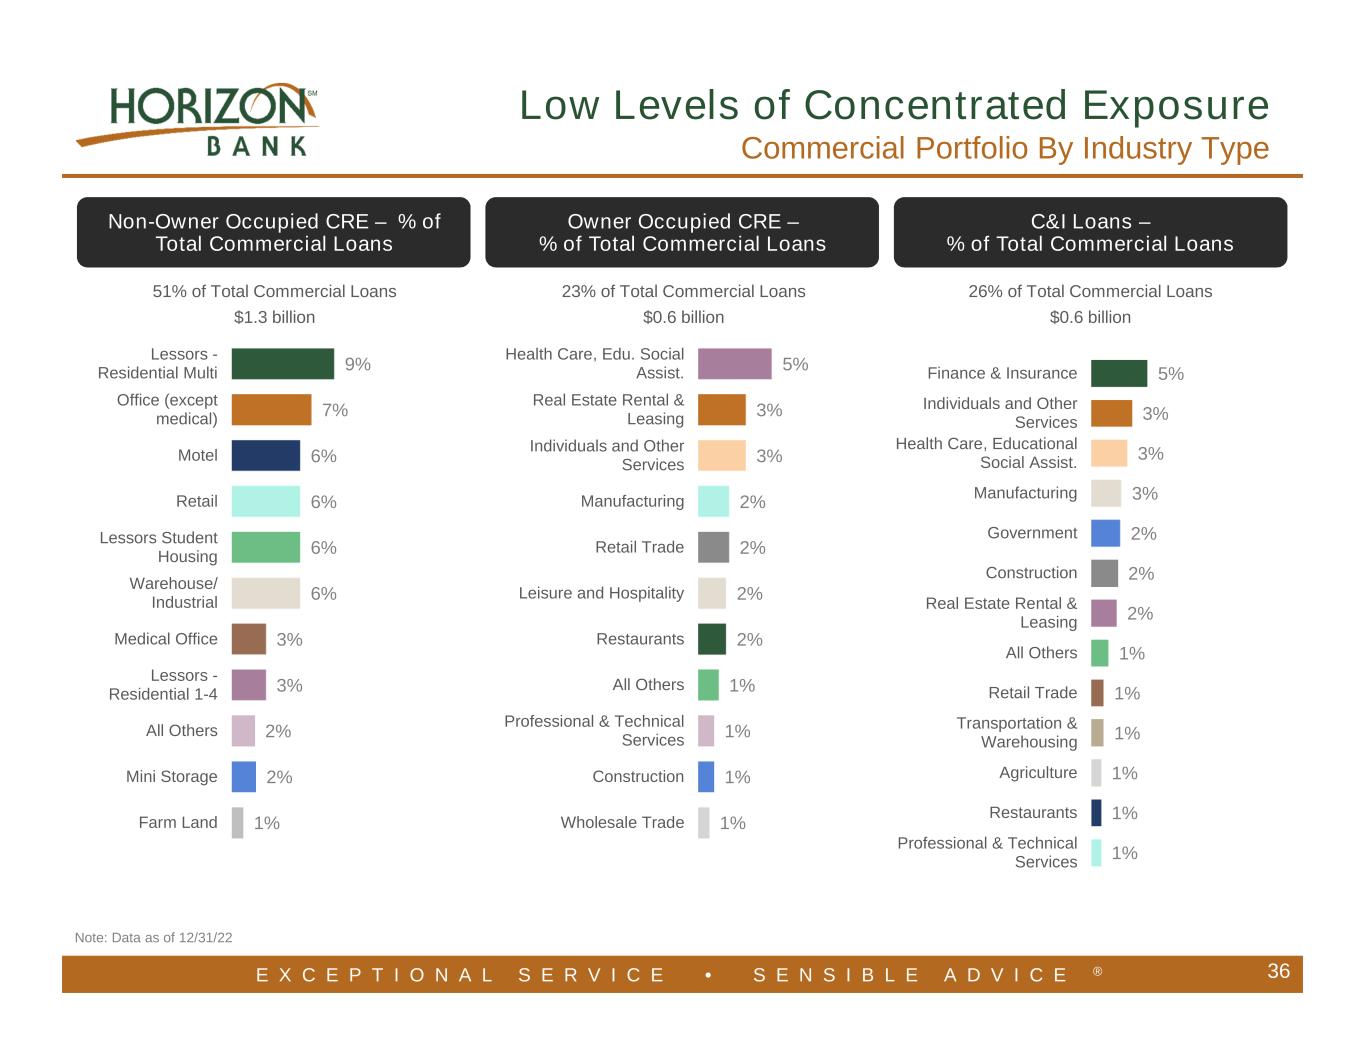
E X C E P T I O N A L S E R V I C E • S E N S I B L E A D V I C E ® 1% 2% 2% 3% 3% 6% 6% 6% 6% 7% 9% Farm Land Mini Storage All Others Lessors - Residential 1-4 Medical Office Warehouse/ Industrial Lessors Student Housing Retail Motel Office (except medical) Lessors - Residential Multi Note: Data as of 12/31/22 1% 1% 1% 1% 2% 2% 2% 2% 3% 3% 5% Wholesale Trade Construction Professional & Technical Services All Others Restaurants Leisure and Hospitality Retail Trade Manufacturing Individuals and Other Services Real Estate Rental & Leasing Health Care, Edu. Social Assist. 1% 1% 1% 1% 1% 1% 2% 2% 2% 3% 3% 3% 5% Professional & Technical Services Restaurants Agriculture Transportation & Warehousing Retail Trade All Others Real Estate Rental & Leasing Construction Government Manufacturing Health Care, Educational Social Assist. Individuals and Other Services Finance & Insurance 36 Non-Owner Occupied CRE – % of Total Commercial Loans Owner Occupied CRE – % of Total Commercial Loans 51% of Total Commercial Loans $1.3 billion 23% of Total Commercial Loans $0.6 billion C&I Loans – % of Total Commercial Loans 26% of Total Commercial Loans $0.6 billion Low Levels of Concentrated Exposure Commercial Portfolio By Industry Type
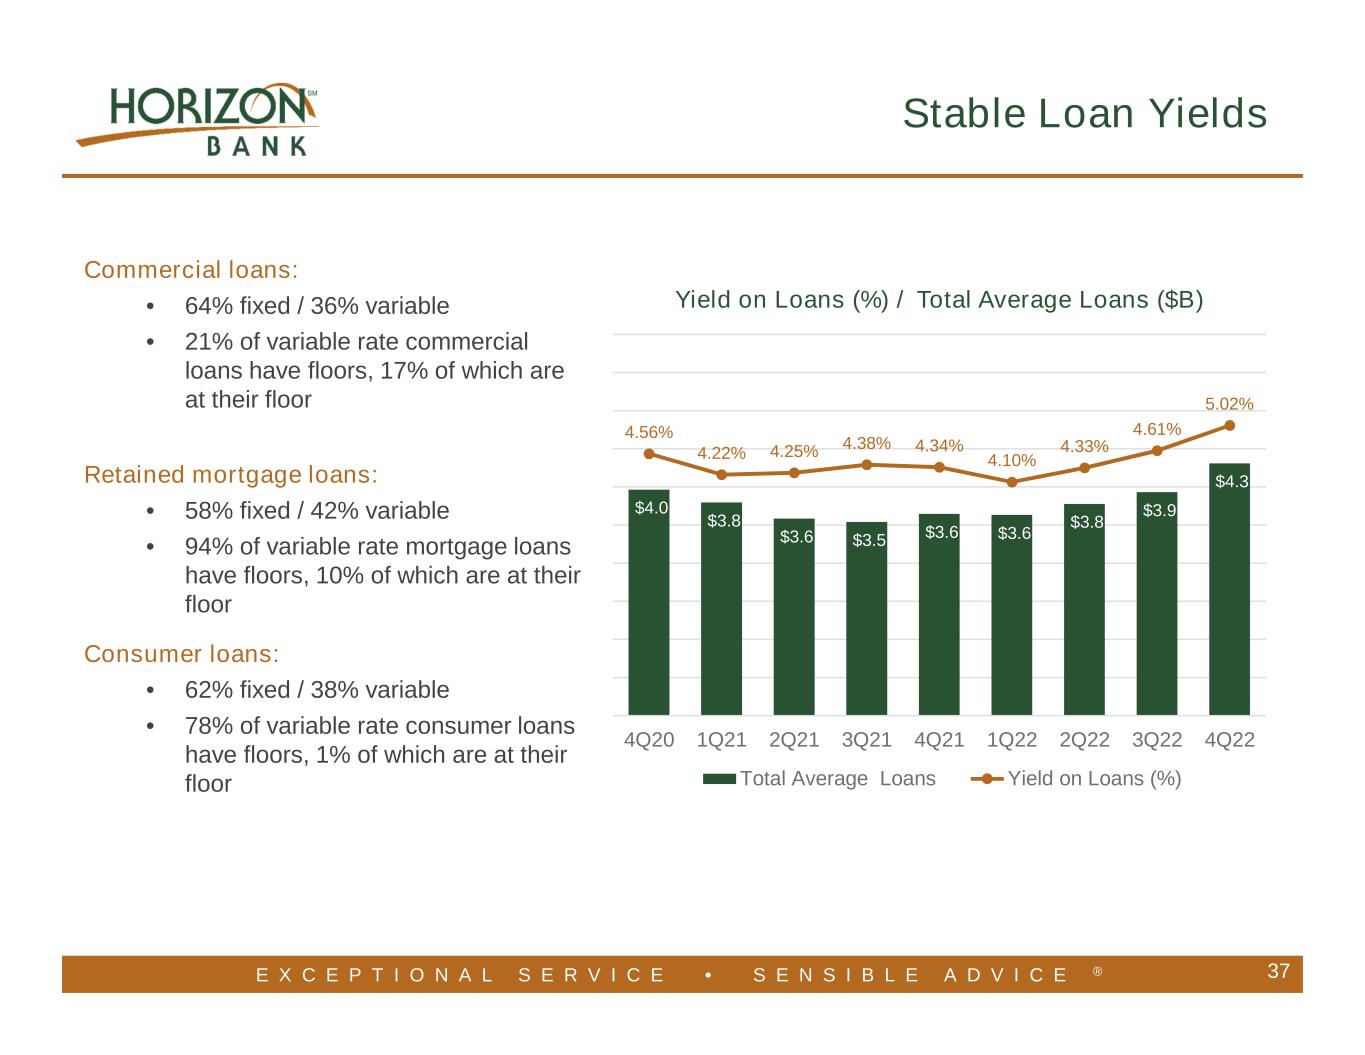
E X C E P T I O N A L S E R V I C E • S E N S I B L E A D V I C E ® Commercial loans: • 64% fixed / 36% variable • 21% of variable rate commercial loans have floors, 17% of which are at their floor Retained mortgage loans: • 58% fixed / 42% variable • 94% of variable rate mortgage loans have floors, 10% of which are at their floor Consumer loans: • 62% fixed / 38% variable • 78% of variable rate consumer loans have floors, 1% of which are at their floor 37 Stable Loan Yields $4.0 $3.8 $3.6 $3.5 $3.6 $3.6 $3.8 $3.9 $4.3 4.56% 4.22% 4.25% 4.38% 4.34% 4.10% 4.33% 4.61% 5.02% 4Q20 1Q21 2Q21 3Q21 4Q21 1Q22 2Q22 3Q22 4Q22 Yield on Loans (%) / Total Average Loans ($B) Total Average Loans Yield on Loans (%)
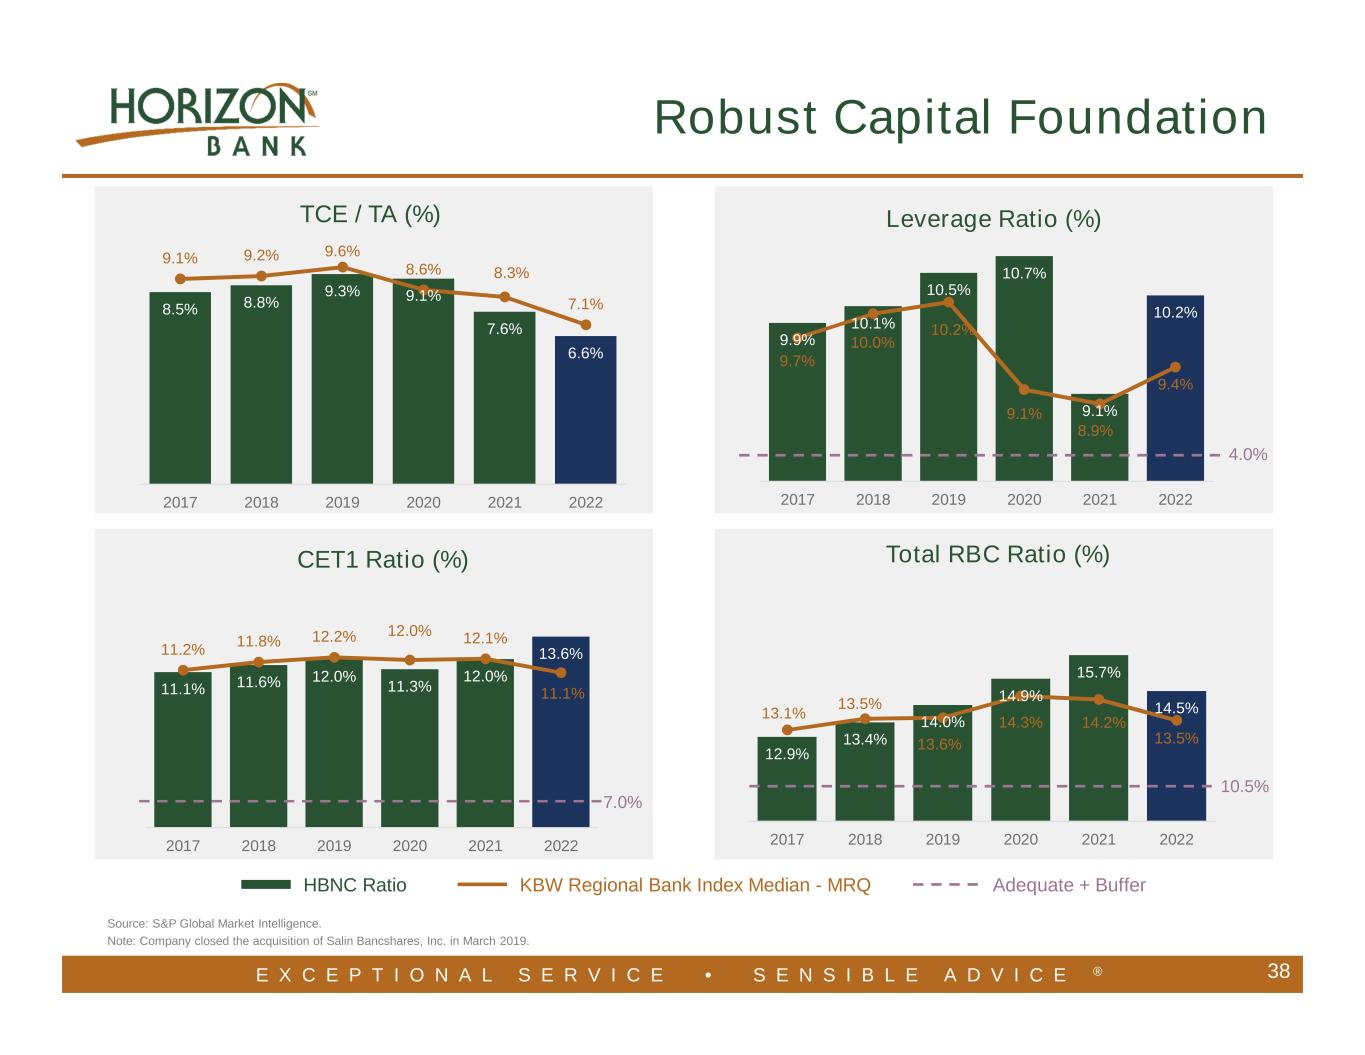
E X C E P T I O N A L S E R V I C E • S E N S I B L E A D V I C E ® 11.1% 11.6% 12.0% 11.3% 12.0% 13.6%11.2% 11.8% 12.2% 12.0% 12.1% 11.1% 2017 2018 2019 2020 2021 2022 9.9% 10.1% 10.5% 10.7% 9.1% 10.2% 9.7% 10.0% 10.2% 9.1% 8.9% 9.4% 2017 2018 2019 2020 2021 2022 12.9% 13.4% 14.0% 14.9% 15.7% 14.5%13.1% 13.5% 13.6% 14.3% 14.2% 13.5% 2017 2018 2019 2020 2021 2022 Source: S&P Global Market Intelligence. Note: Company closed the acquisition of Salin Bancshares, Inc. in March 2019. 38 TCE / TA (%) Leverage Ratio (%) Total RBC Ratio (%) 4.0% Adequate + Buffer 7.0% KBW Regional Bank Index Median - MRQ Robust Capital Foundation 10.5% HBNC Ratio 8.5% 8.8% 9.3% 9.1% 7.6% 6.6% 9.1% 9.2% 9.6% 8.6% 8.3% 7.1% 2017 2018 2019 2020 2021 2022 CET1 Ratio (%)
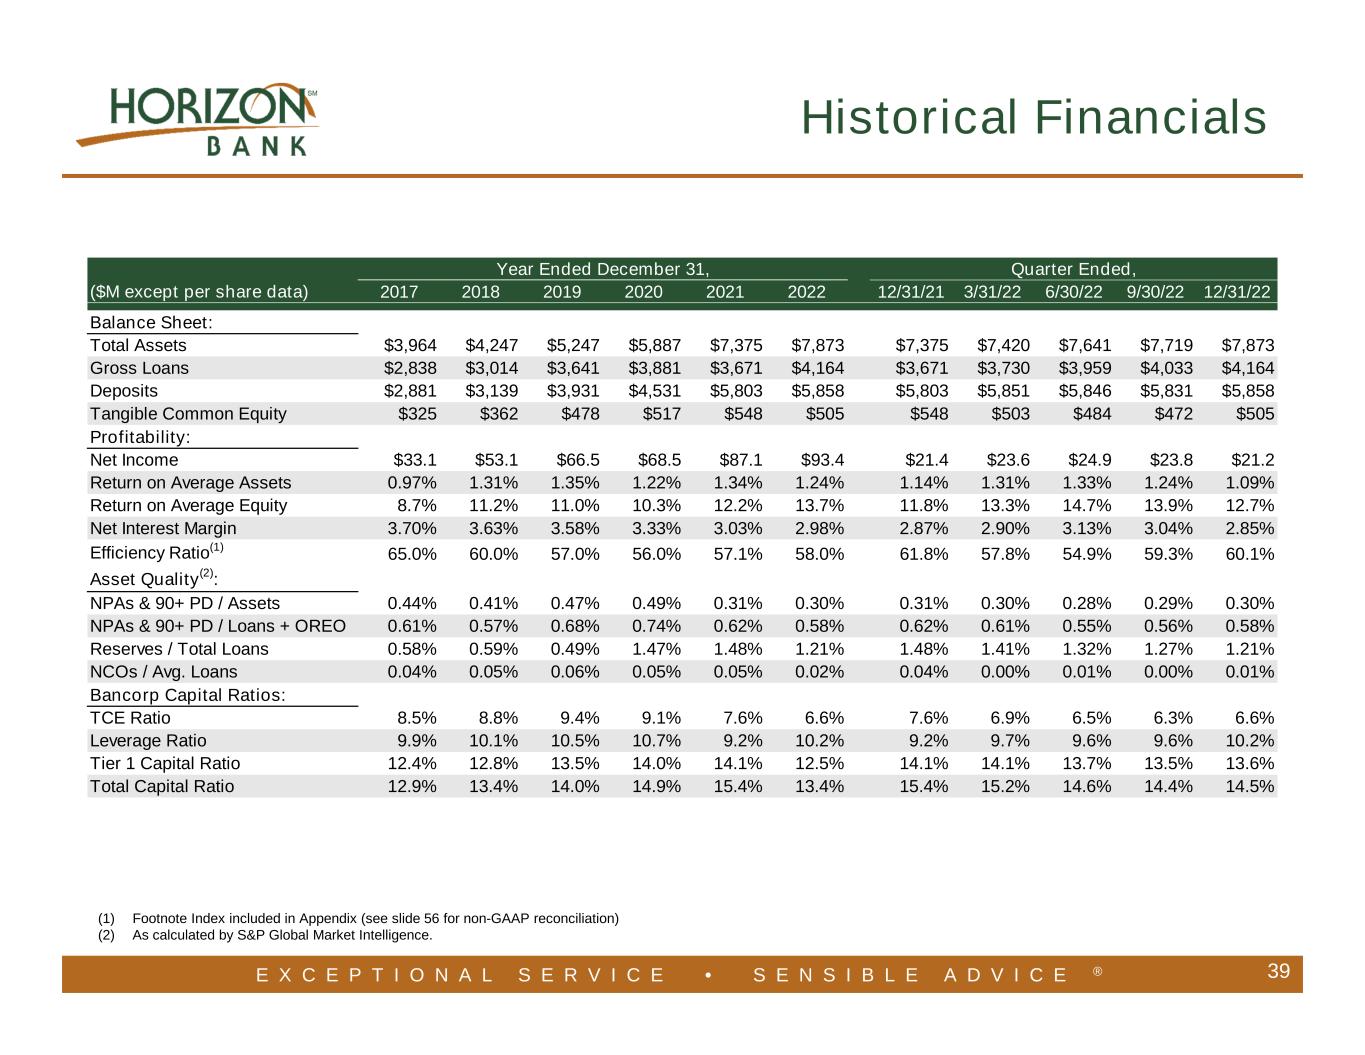
E X C E P T I O N A L S E R V I C E • S E N S I B L E A D V I C E ® 39 (1) Footnote Index included in Appendix (see slide 56 for non-GAAP reconciliation) (2) As calculated by S&P Global Market Intelligence. Historical Financials ($M except per share data) 2017 2018 2019 2020 2021 2022 12/31/21 3/31/22 6/30/22 9/30/22 12/31/22 Balance Sheet: Total Assets $3,964 $4,247 $5,247 $5,887 $7,375 $7,873 $7,375 $7,420 $7,641 $7,719 $7,873 Gross Loans $2,838 $3,014 $3,641 $3,881 $3,671 $4,164 $3,671 $3,730 $3,959 $4,033 $4,164 Deposits $2,881 $3,139 $3,931 $4,531 $5,803 $5,858 $5,803 $5,851 $5,846 $5,831 $5,858 Tangible Common Equity $325 $362 $478 $517 $548 $505 $548 $503 $484 $472 $505 Profitability: Net Income $33.1 $53.1 $66.5 $68.5 $87.1 $93.4 $21.4 $23.6 $24.9 $23.8 $21.2 Return on Average Assets 0.97% 1.31% 1.35% 1.22% 1.34% 1.24% 1.14% 1.31% 1.33% 1.24% 1.09% Return on Average Equity 8.7% 11.2% 11.0% 10.3% 12.2% 13.7% 11.8% 13.3% 14.7% 13.9% 12.7% Net Interest Margin 3.70% 3.63% 3.58% 3.33% 3.03% 2.98% 2.87% 2.90% 3.13% 3.04% 2.85% Efficiency Ratio(1) 65.0% 60.0% 57.0% 56.0% 57.1% 58.0% 61.8% 57.8% 54.9% 59.3% 60.1% Asset Quality(2): NPAs & 90+ PD / Assets 0.44% 0.41% 0.47% 0.49% 0.31% 0.30% 0.31% 0.30% 0.28% 0.29% 0.30% NPAs & 90+ PD / Loans + OREO 0.61% 0.57% 0.68% 0.74% 0.62% 0.58% 0.62% 0.61% 0.55% 0.56% 0.58% Reserves / Total Loans 0.58% 0.59% 0.49% 1.47% 1.48% 1.21% 1.48% 1.41% 1.32% 1.27% 1.21% NCOs / Avg. Loans 0.04% 0.05% 0.06% 0.05% 0.05% 0.02% 0.04% 0.00% 0.01% 0.00% 0.01% Bancorp Capital Ratios: TCE Ratio 8.5% 8.8% 9.4% 9.1% 7.6% 6.6% 7.6% 6.9% 6.5% 6.3% 6.6% Leverage Ratio 9.9% 10.1% 10.5% 10.7% 9.2% 10.2% 9.2% 9.7% 9.6% 9.6% 10.2% Tier 1 Capital Ratio 12.4% 12.8% 13.5% 14.0% 14.1% 12.5% 14.1% 14.1% 13.7% 13.5% 13.6% Total Capital Ratio 12.9% 13.4% 14.0% 14.9% 15.4% 13.4% 15.4% 15.2% 14.6% 14.4% 14.5% Year Ended December 31, Quarter Ended,
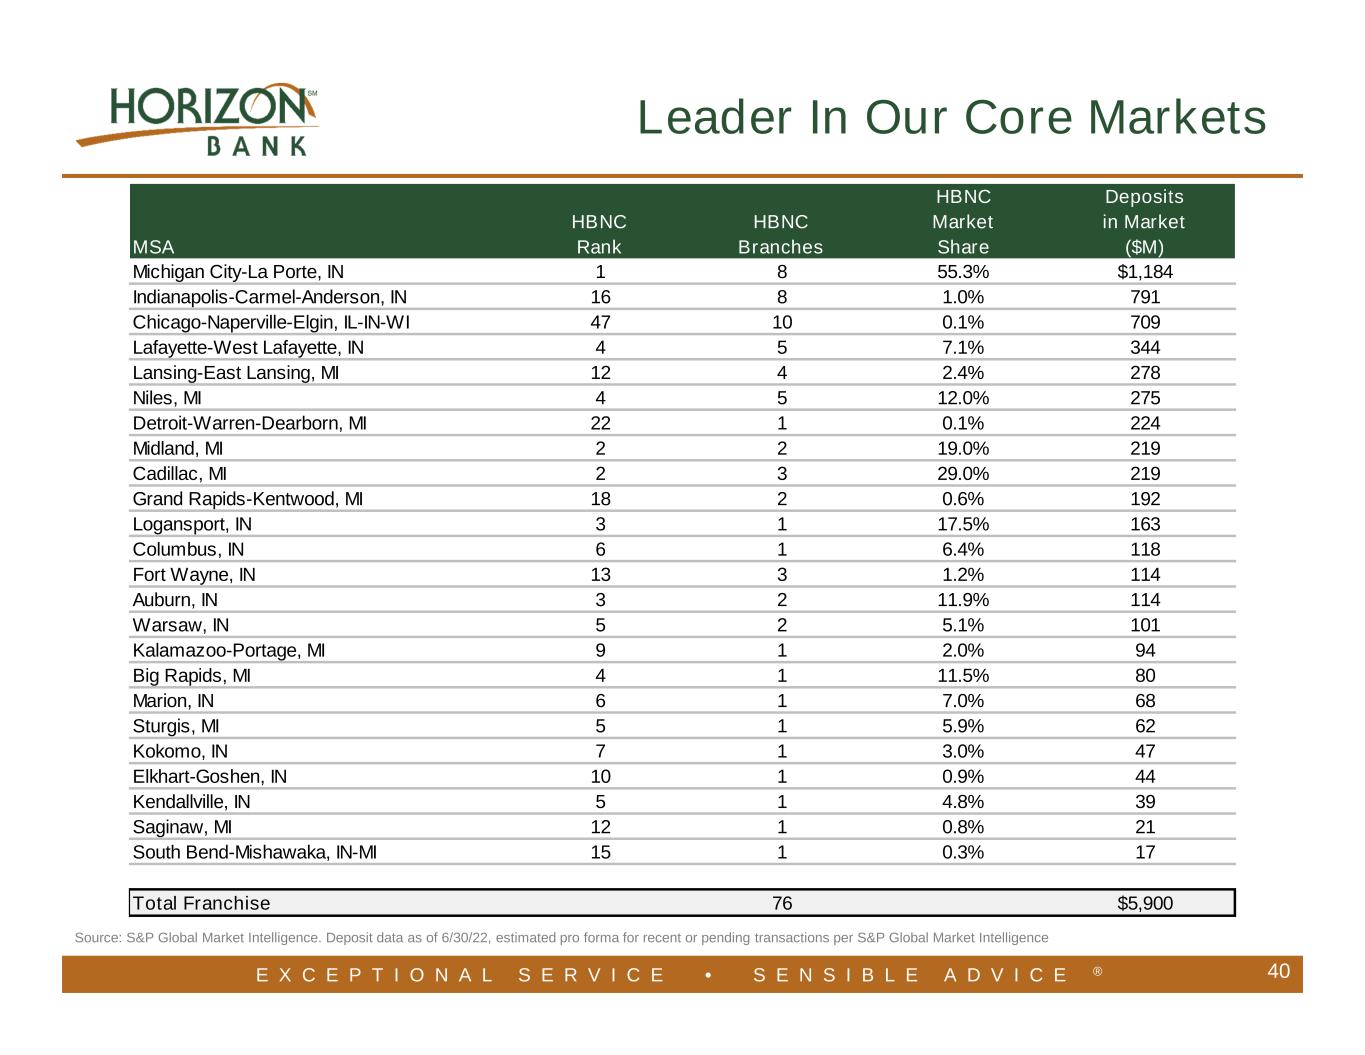
E X C E P T I O N A L S E R V I C E • S E N S I B L E A D V I C E ® 40 Leader In Our Core Markets Source: S&P Global Market Intelligence. Deposit data as of 6/30/22, estimated pro forma for recent or pending transactions per S&P Global Market Intelligence MSA HBNC Rank HBNC Branches HBNC Market Share Deposits in Market ($M) Michigan City-La Porte, IN 1 8 55.3% $1,184 Indianapolis-Carmel-Anderson, IN 16 8 1.0% 791 Chicago-Naperville-Elgin, IL-IN-WI 47 10 0.1% 709 Lafayette-West Lafayette, IN 4 5 7.1% 344 Lansing-East Lansing, MI 12 4 2.4% 278 Niles, MI 4 5 12.0% 275 Detroit-Warren-Dearborn, MI 22 1 0.1% 224 Midland, MI 2 2 19.0% 219 Cadillac, MI 2 3 29.0% 219 Grand Rapids-Kentwood, MI 18 2 0.6% 192 Logansport, IN 3 1 17.5% 163 Columbus, IN 6 1 6.4% 118 Fort Wayne, IN 13 3 1.2% 114 Auburn, IN 3 2 11.9% 114 Warsaw, IN 5 2 5.1% 101 Kalamazoo-Portage, MI 9 1 2.0% 94 Big Rapids, MI 4 1 11.5% 80 Marion, IN 6 1 7.0% 68 Sturgis, MI 5 1 5.9% 62 Kokomo, IN 7 1 3.0% 47 Elkhart-Goshen, IN 10 1 0.9% 44 Kendallville, IN 5 1 4.8% 39 Saginaw, MI 12 1 0.8% 21 South Bend-Mishawaka, IN-MI 15 1 0.3% 17 Total Franchise 76 $5,900
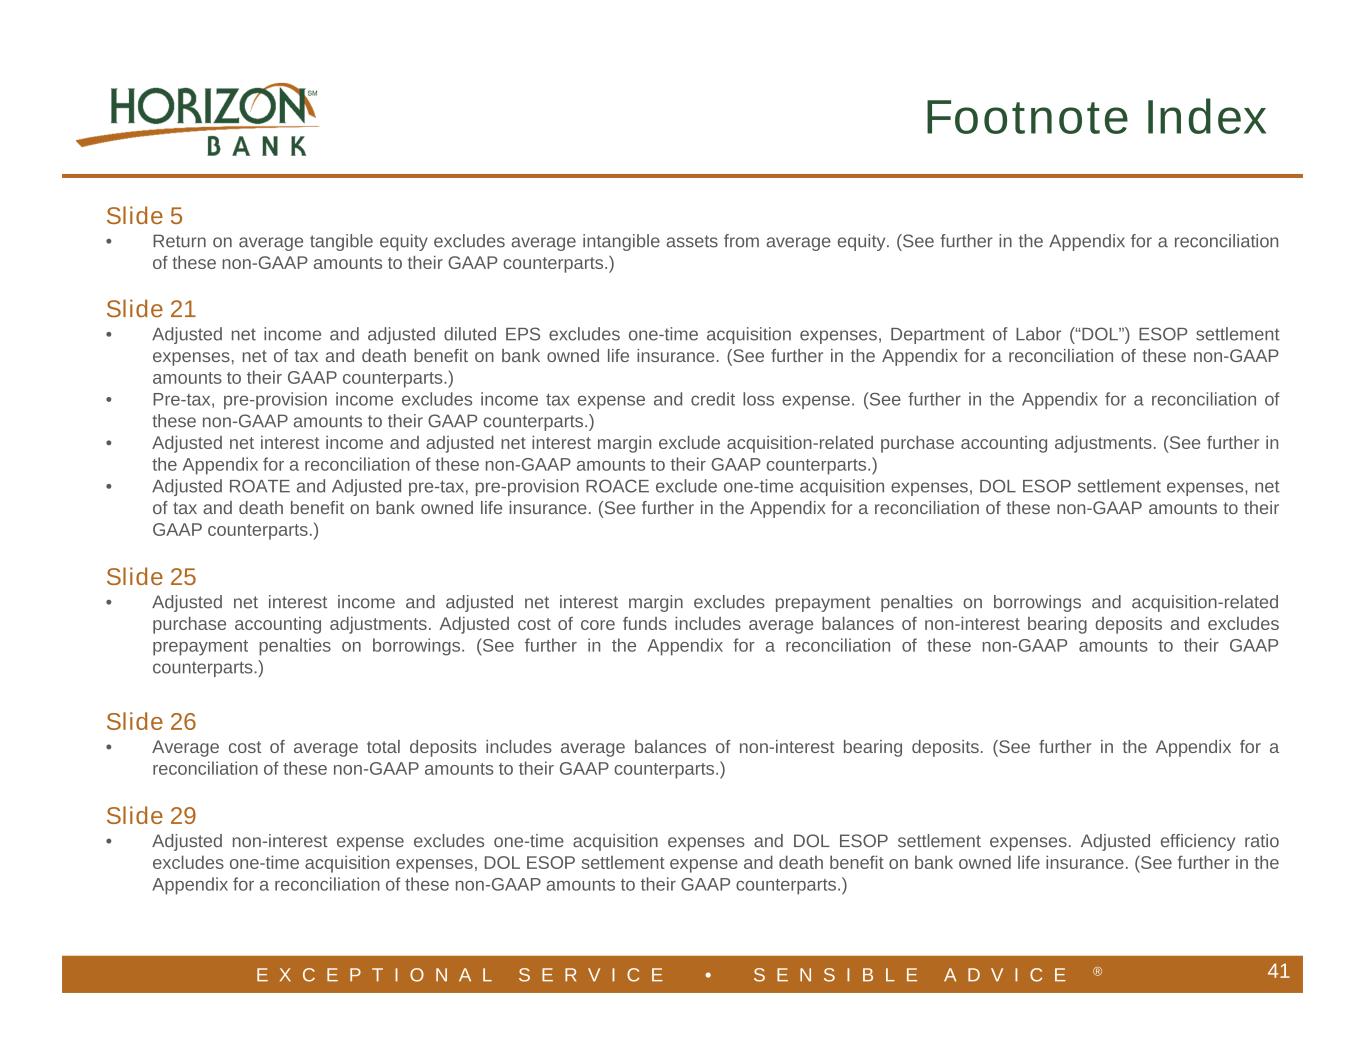
E X C E P T I O N A L S E R V I C E • S E N S I B L E A D V I C E ® 41 Slide 5 • Return on average tangible equity excludes average intangible assets from average equity. (See further in the Appendix for a reconciliation of these non-GAAP amounts to their GAAP counterparts.) Slide 21 • Adjusted net income and adjusted diluted EPS excludes one-time acquisition expenses, Department of Labor (“DOL”) ESOP settlement expenses, net of tax and death benefit on bank owned life insurance. (See further in the Appendix for a reconciliation of these non-GAAP amounts to their GAAP counterparts.) • Pre-tax, pre-provision income excludes income tax expense and credit loss expense. (See further in the Appendix for a reconciliation of these non-GAAP amounts to their GAAP counterparts.) • Adjusted net interest income and adjusted net interest margin exclude acquisition-related purchase accounting adjustments. (See further in the Appendix for a reconciliation of these non-GAAP amounts to their GAAP counterparts.) • Adjusted ROATE and Adjusted pre-tax, pre-provision ROACE exclude one-time acquisition expenses, DOL ESOP settlement expenses, net of tax and death benefit on bank owned life insurance. (See further in the Appendix for a reconciliation of these non-GAAP amounts to their GAAP counterparts.) Slide 25 • Adjusted net interest income and adjusted net interest margin excludes prepayment penalties on borrowings and acquisition-related purchase accounting adjustments. Adjusted cost of core funds includes average balances of non-interest bearing deposits and excludes prepayment penalties on borrowings. (See further in the Appendix for a reconciliation of these non-GAAP amounts to their GAAP counterparts.) Slide 26 • Average cost of average total deposits includes average balances of non-interest bearing deposits. (See further in the Appendix for a reconciliation of these non-GAAP amounts to their GAAP counterparts.) Slide 29 • Adjusted non-interest expense excludes one-time acquisition expenses and DOL ESOP settlement expenses. Adjusted efficiency ratio excludes one-time acquisition expenses, DOL ESOP settlement expense and death benefit on bank owned life insurance. (See further in the Appendix for a reconciliation of these non-GAAP amounts to their GAAP counterparts.) Footnote Index
E X C E P T I O N A L S E R V I C E • S E N S I B L E A D V I C E ® 42 Slides 43-57 Use of Non-GAAP Financial Measures • Certain information set forth in the presentation materials refers to financial measures determined by methods other than in accordance with GAAP. Horizon believes these non-GAAP financial measures are helpful to investors and provide a greater understanding of our business without giving effect to purchase accounting impacts, one-time acquisition and other non-recurring costs and non-core items. These measures are not necessarily comparable to similar measures that may be presented by other companies and should not be considered in isolation or as a substitute for the related GAAP measure. Footnote Index
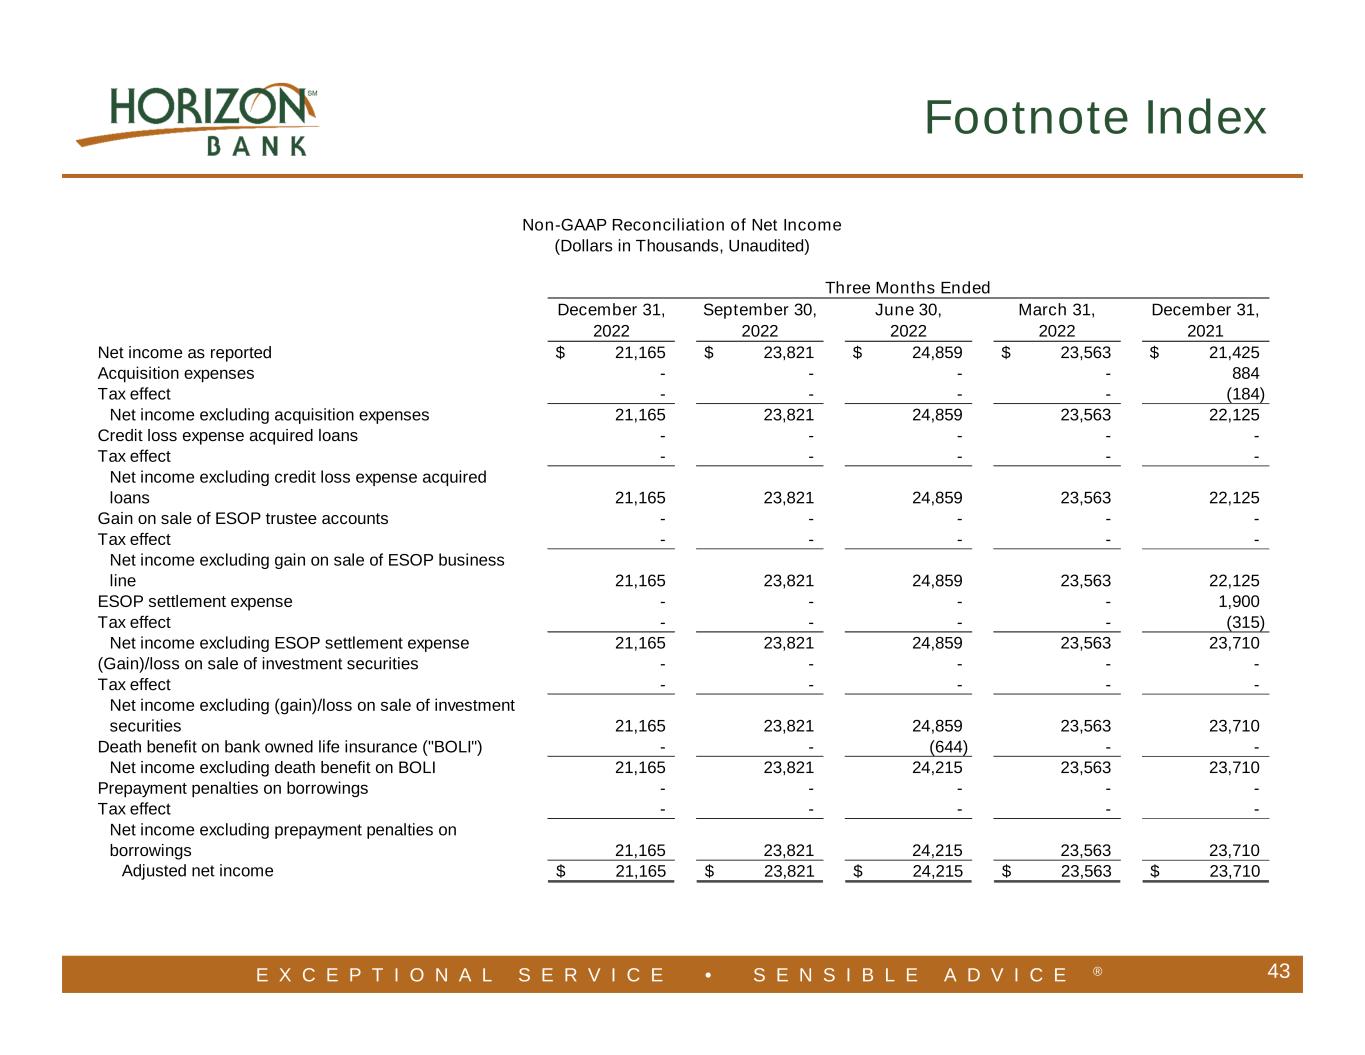
E X C E P T I O N A L S E R V I C E • S E N S I B L E A D V I C E ® 43 Footnote Index December 31, September 30, June 30, March 31, December 31, 2022 2022 2022 2022 2021 Net income as reported 21,165$ 23,821$ 24,859$ 23,563$ 21,425$ Acquisition expenses - - - - 884 Tax effect - - - - (184) Net income excluding acquisition expenses 21,165 23,821 24,859 23,563 22,125 Credit loss expense acquired loans - - - - - Tax effect - - - - - Net income excluding credit loss expense acquired loans 21,165 23,821 24,859 23,563 22,125 Gain on sale of ESOP trustee accounts - - - - - Tax effect - - - - - Net income excluding gain on sale of ESOP business line 21,165 23,821 24,859 23,563 22,125 ESOP settlement expense - - - - 1,900 Tax effect - - - - (315) Net income excluding ESOP settlement expense 21,165 23,821 24,859 23,563 23,710 (Gain)/loss on sale of investment securities - - - - - Tax effect - - - - - Net income excluding (gain)/loss on sale of investment securities 21,165 23,821 24,859 23,563 23,710 Death benefit on bank owned life insurance ("BOLI") - - (644) - - Net income excluding death benefit on BOLI 21,165 23,821 24,215 23,563 23,710 Prepayment penalties on borrowings - - - - - Tax effect - - - - - Net income excluding prepayment penalties on borrowings 21,165 23,821 24,215 23,563 23,710 Adjusted net income 21,165$ 23,821$ 24,215$ 23,563$ 23,710$ Three Months Ended Non-GAAP Reconciliation of Net Income (Dollars in Thousands, Unaudited)
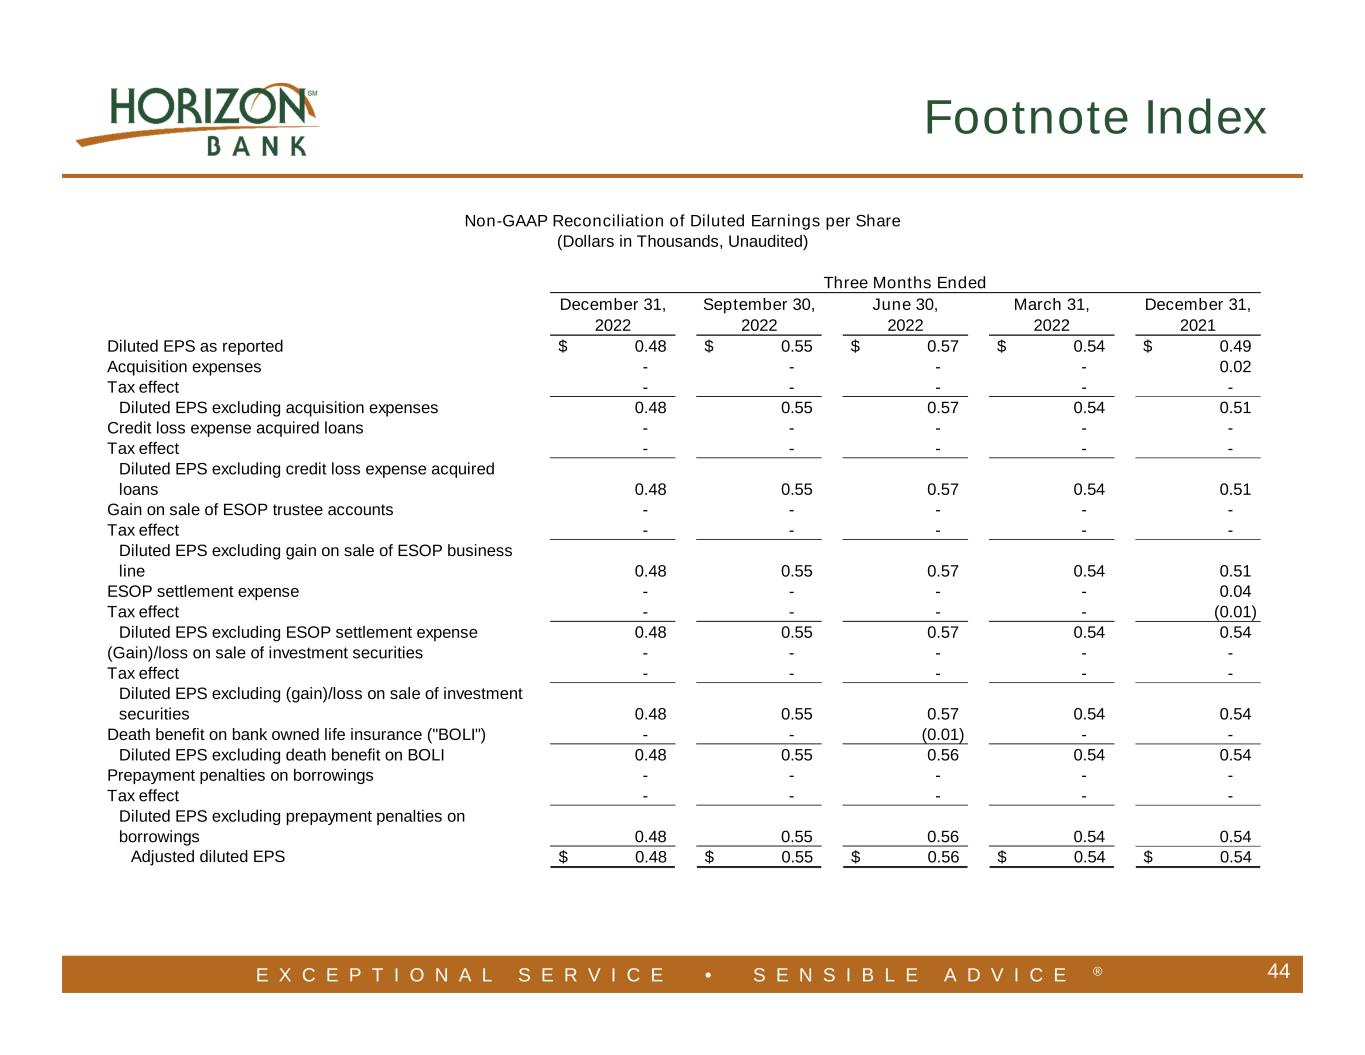
E X C E P T I O N A L S E R V I C E • S E N S I B L E A D V I C E ® 44 Footnote Index December 31, September 30, June 30, March 31, December 31, 2022 2022 2022 2022 2021 Diluted EPS as reported 0.48$ 0.55$ 0.57$ 0.54$ 0.49$ Acquisition expenses - - - - 0.02 Tax effect - - - - - Diluted EPS excluding acquisition expenses 0.48 0.55 0.57 0.54 0.51 Credit loss expense acquired loans - - - - - Tax effect - - - - - Diluted EPS excluding credit loss expense acquired loans 0.48 0.55 0.57 0.54 0.51 Gain on sale of ESOP trustee accounts - - - - - Tax effect - - - - - Diluted EPS excluding gain on sale of ESOP business line 0.48 0.55 0.57 0.54 0.51 ESOP settlement expense - - - - 0.04 Tax effect - - - - (0.01) Diluted EPS excluding ESOP settlement expense 0.48 0.55 0.57 0.54 0.54 (Gain)/loss on sale of investment securities - - - - - Tax effect - - - - - Diluted EPS excluding (gain)/loss on sale of investment securities 0.48 0.55 0.57 0.54 0.54 Death benefit on bank owned life insurance ("BOLI") - - (0.01) - - Diluted EPS excluding death benefit on BOLI 0.48 0.55 0.56 0.54 0.54 Prepayment penalties on borrowings - - - - - Tax effect - - - - - Diluted EPS excluding prepayment penalties on borrowings 0.48 0.55 0.56 0.54 0.54 Adjusted diluted EPS 0.48$ 0.55$ 0.56$ 0.54$ 0.54$ Three Months Ended Non-GAAP Reconciliation of Diluted Earnings per Share (Dollars in Thousands, Unaudited)
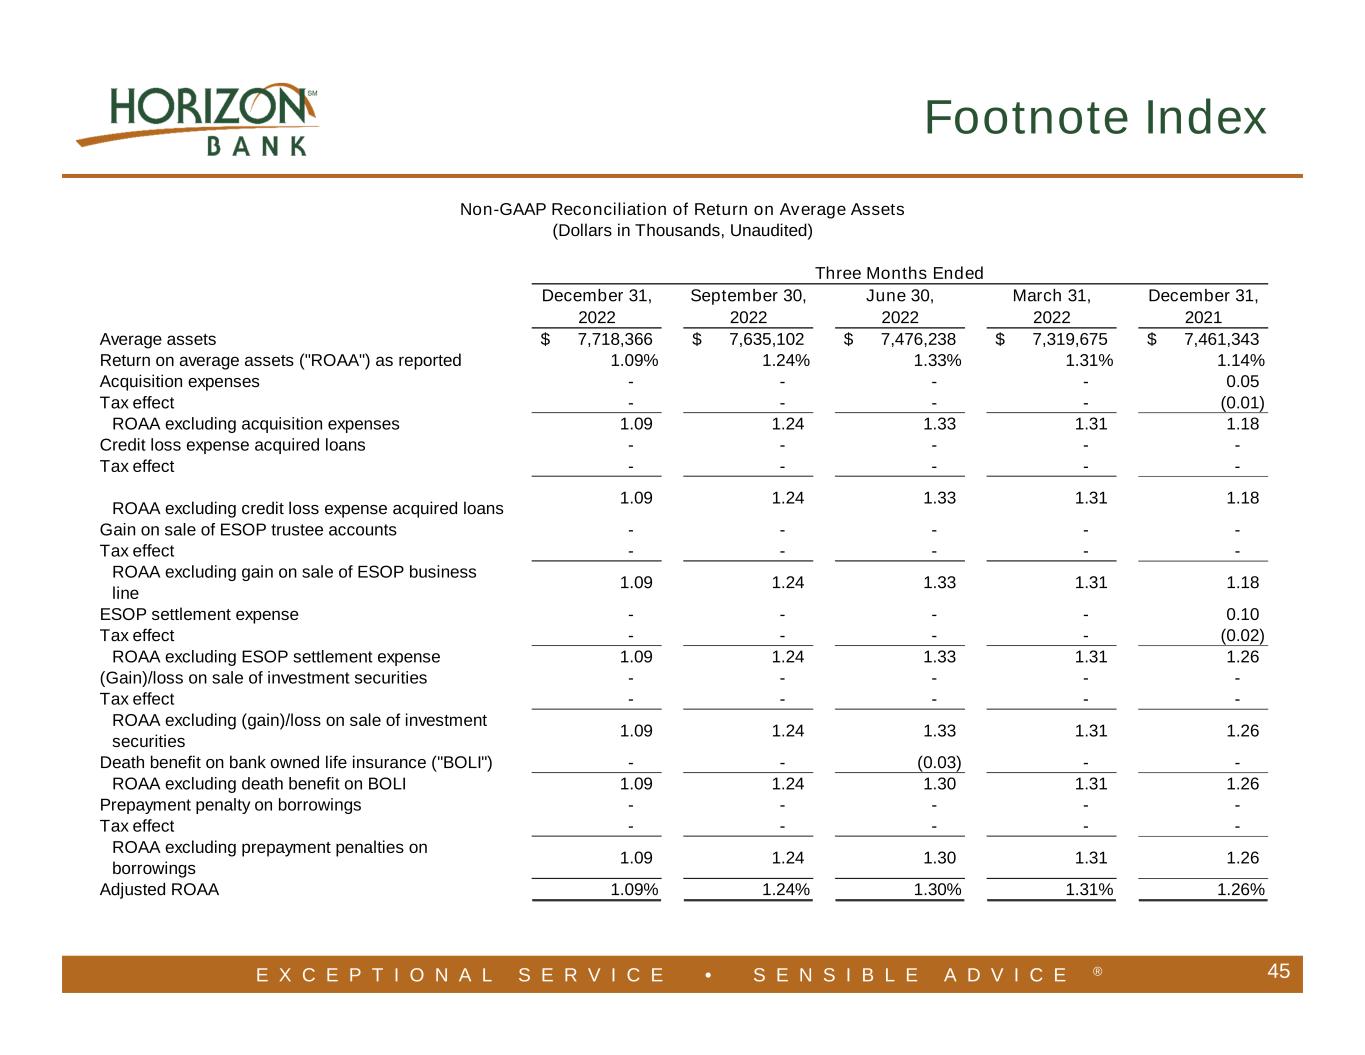
E X C E P T I O N A L S E R V I C E • S E N S I B L E A D V I C E ® 45 Footnote Index December 31, September 30, June 30, March 31, December 31, 2022 2022 2022 2022 2021 Average assets 7,718,366$ 7,635,102$ 7,476,238$ 7,319,675$ 7,461,343$ Return on average assets ("ROAA") as reported 1.09% 1.24% 1.33% 1.31% 1.14% Acquisition expenses - - - - 0.05 Tax effect - - - - (0.01) ROAA excluding acquisition expenses 1.09 1.24 1.33 1.31 1.18 Credit loss expense acquired loans - - - - - Tax effect - - - - - ROAA excluding credit loss expense acquired loans 1.09 1.24 1.33 1.31 1.18 Gain on sale of ESOP trustee accounts - - - - - Tax effect - - - - - ROAA excluding gain on sale of ESOP business line 1.09 1.24 1.33 1.31 1.18 ESOP settlement expense - - - - 0.10 Tax effect - - - - (0.02) ROAA excluding ESOP settlement expense 1.09 1.24 1.33 1.31 1.26 (Gain)/loss on sale of investment securities - - - - - Tax effect - - - - - ROAA excluding (gain)/loss on sale of investment securities 1.09 1.24 1.33 1.31 1.26 Death benefit on bank owned life insurance ("BOLI") - - (0.03) - - ROAA excluding death benefit on BOLI 1.09 1.24 1.30 1.31 1.26 Prepayment penalty on borrowings - - - - - Tax effect - - - - - ROAA excluding prepayment penalties on borrowings 1.09 1.24 1.30 1.31 1.26 Adjusted ROAA 1.09% 1.24% 1.30% 1.31% 1.26% Three Months Ended Non-GAAP Reconciliation of Return on Average Assets (Dollars in Thousands, Unaudited)
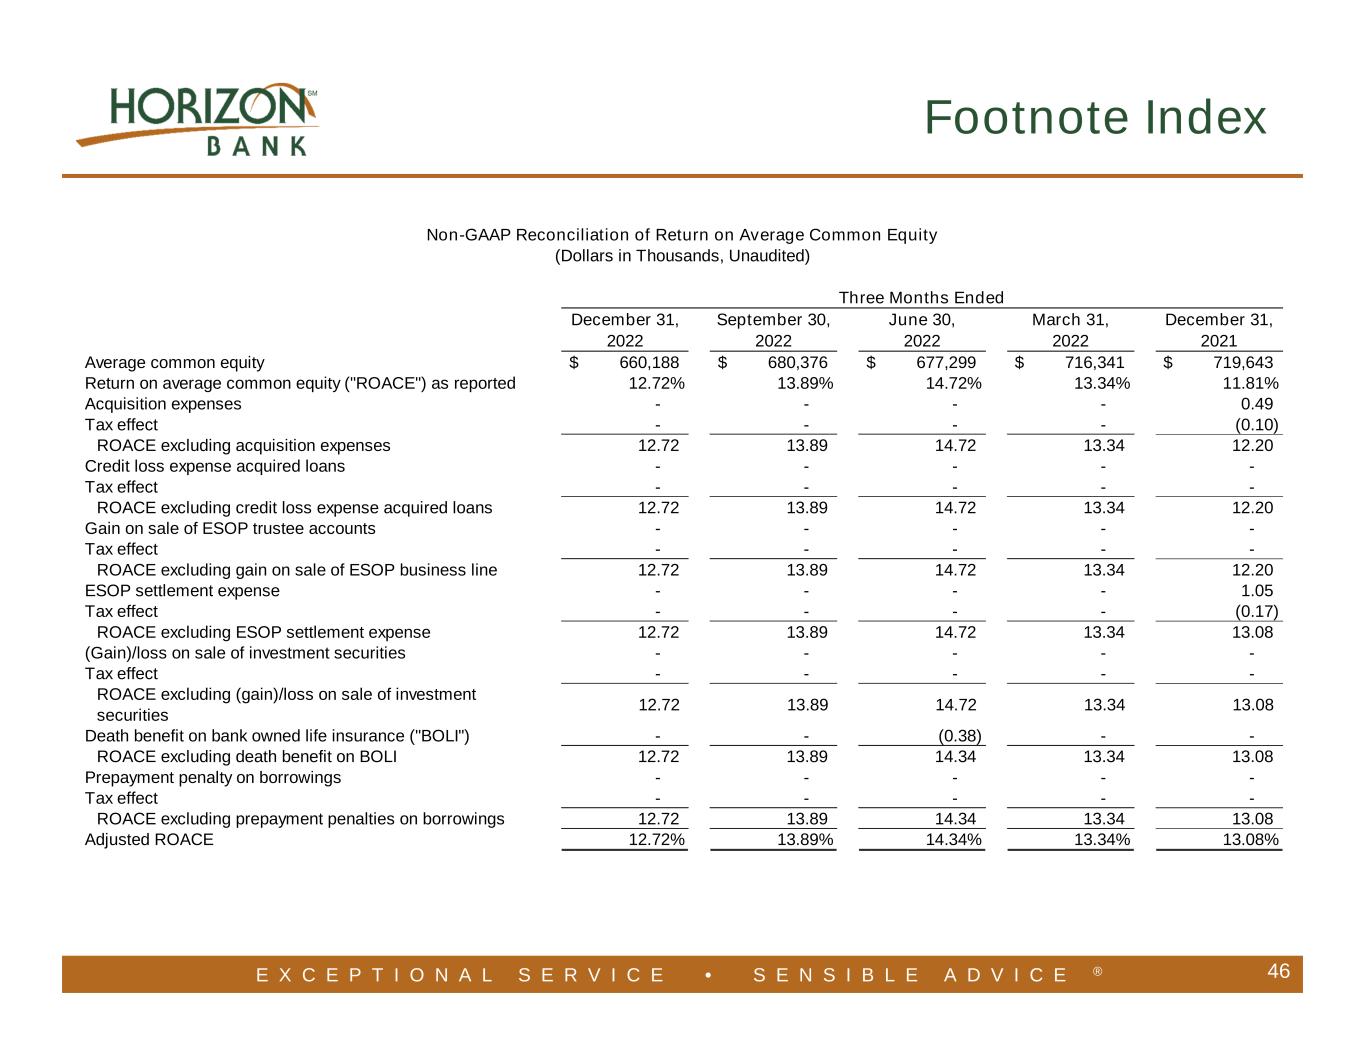
E X C E P T I O N A L S E R V I C E • S E N S I B L E A D V I C E ® 46 Footnote Index December 31, September 30, June 30, March 31, December 31, 2022 2022 2022 2022 2021 Average common equity 660,188$ 680,376$ 677,299$ 716,341$ 719,643$ Return on average common equity ("ROACE") as reported 12.72% 13.89% 14.72% 13.34% 11.81% Acquisition expenses - - - - 0.49 Tax effect - - - - (0.10) ROACE excluding acquisition expenses 12.72 13.89 14.72 13.34 12.20 Credit loss expense acquired loans - - - - - Tax effect - - - - - ROACE excluding credit loss expense acquired loans 12.72 13.89 14.72 13.34 12.20 Gain on sale of ESOP trustee accounts - - - - - Tax effect - - - - - ROACE excluding gain on sale of ESOP business line 12.72 13.89 14.72 13.34 12.20 ESOP settlement expense - - - - 1.05 Tax effect - - - - (0.17) ROACE excluding ESOP settlement expense 12.72 13.89 14.72 13.34 13.08 (Gain)/loss on sale of investment securities - - - - - Tax effect - - - - - ROACE excluding (gain)/loss on sale of investment securities 12.72 13.89 14.72 13.34 13.08 Death benefit on bank owned life insurance ("BOLI") - - (0.38) - - ROACE excluding death benefit on BOLI 12.72 13.89 14.34 13.34 13.08 Prepayment penalty on borrowings - - - - - Tax effect - - - - - ROACE excluding prepayment penalties on borrowings 12.72 13.89 14.34 13.34 13.08 Adjusted ROACE 12.72% 13.89% 14.34% 13.34% 13.08% Three Months Ended Non-GAAP Reconciliation of Return on Average Common Equity (Dollars in Thousands, Unaudited)
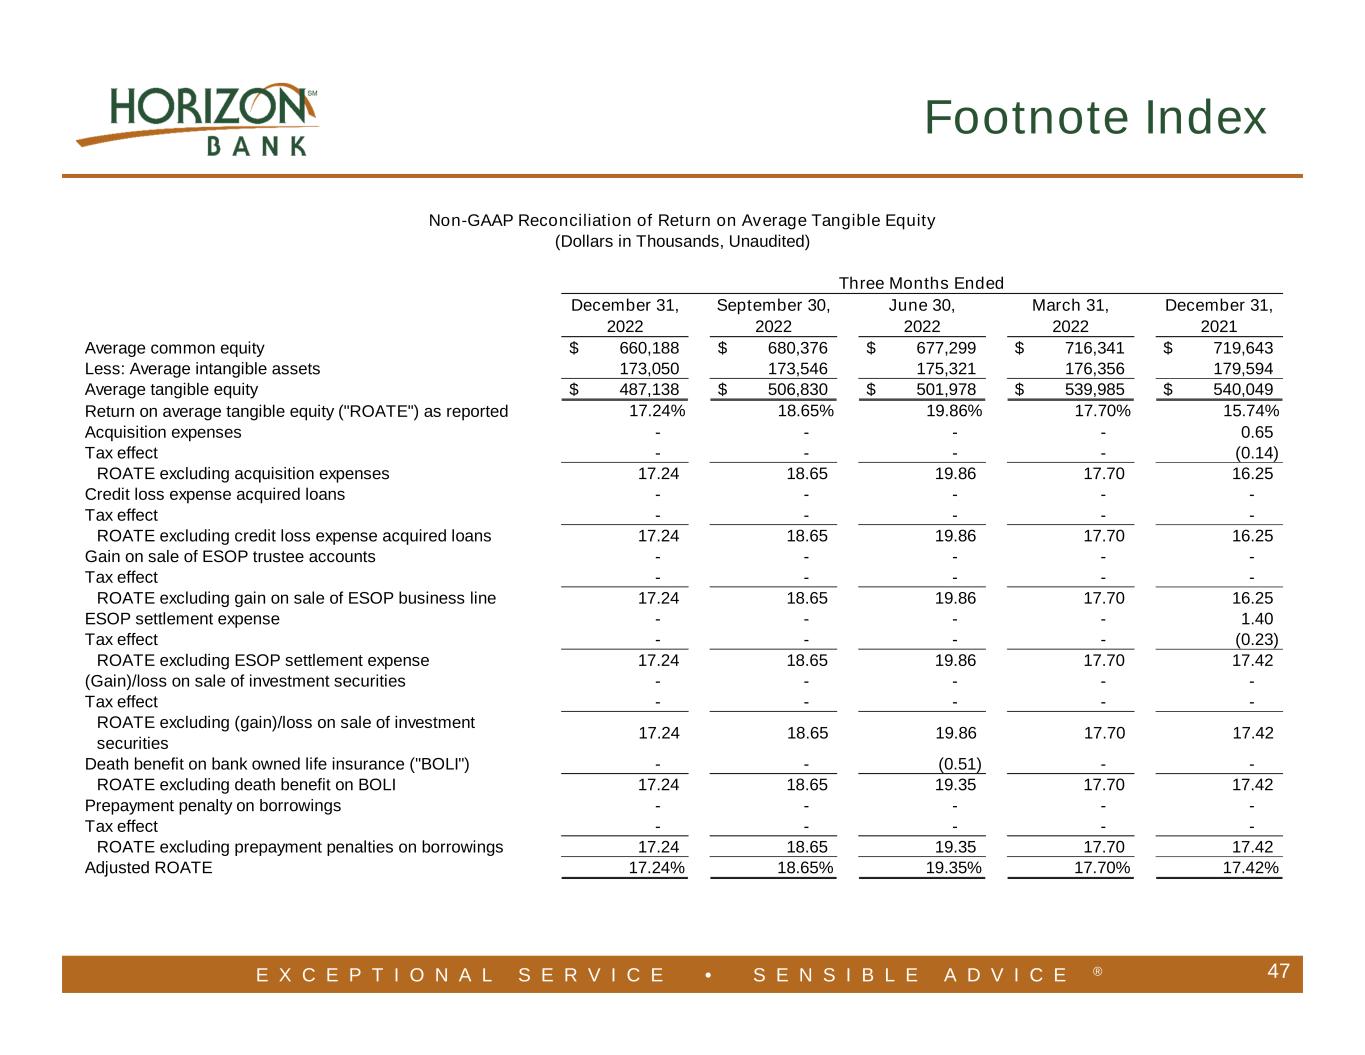
E X C E P T I O N A L S E R V I C E • S E N S I B L E A D V I C E ® 47 Footnote Index December 31, September 30, June 30, March 31, December 31, 2022 2022 2022 2022 2021 Average common equity 660,188$ 680,376$ 677,299$ 716,341$ 719,643$ Less: Average intangible assets 173,050 173,546 175,321 176,356 179,594 Average tangible equity 487,138$ 506,830$ 501,978$ 539,985$ 540,049$ Return on average tangible equity ("ROATE") as reported 17.24% 18.65% 19.86% 17.70% 15.74% Acquisition expenses - - - - 0.65 Tax effect - - - - (0.14) ROATE excluding acquisition expenses 17.24 18.65 19.86 17.70 16.25 Credit loss expense acquired loans - - - - - Tax effect - - - - - ROATE excluding credit loss expense acquired loans 17.24 18.65 19.86 17.70 16.25 Gain on sale of ESOP trustee accounts - - - - - Tax effect - - - - - ROATE excluding gain on sale of ESOP business line 17.24 18.65 19.86 17.70 16.25 ESOP settlement expense - - - - 1.40 Tax effect - - - - (0.23) ROATE excluding ESOP settlement expense 17.24 18.65 19.86 17.70 17.42 (Gain)/loss on sale of investment securities - - - - - Tax effect - - - - - ROATE excluding (gain)/loss on sale of investment securities 17.24 18.65 19.86 17.70 17.42 Death benefit on bank owned life insurance ("BOLI") - - (0.51) - - ROATE excluding death benefit on BOLI 17.24 18.65 19.35 17.70 17.42 Prepayment penalty on borrowings - - - - - Tax effect - - - - - ROATE excluding prepayment penalties on borrowings 17.24 18.65 19.35 17.70 17.42 Adjusted ROATE 17.24% 18.65% 19.35% 17.70% 17.42% Non-GAAP Reconciliation of Return on Average Tangible Equity (Dollars in Thousands, Unaudited) Three Months Ended
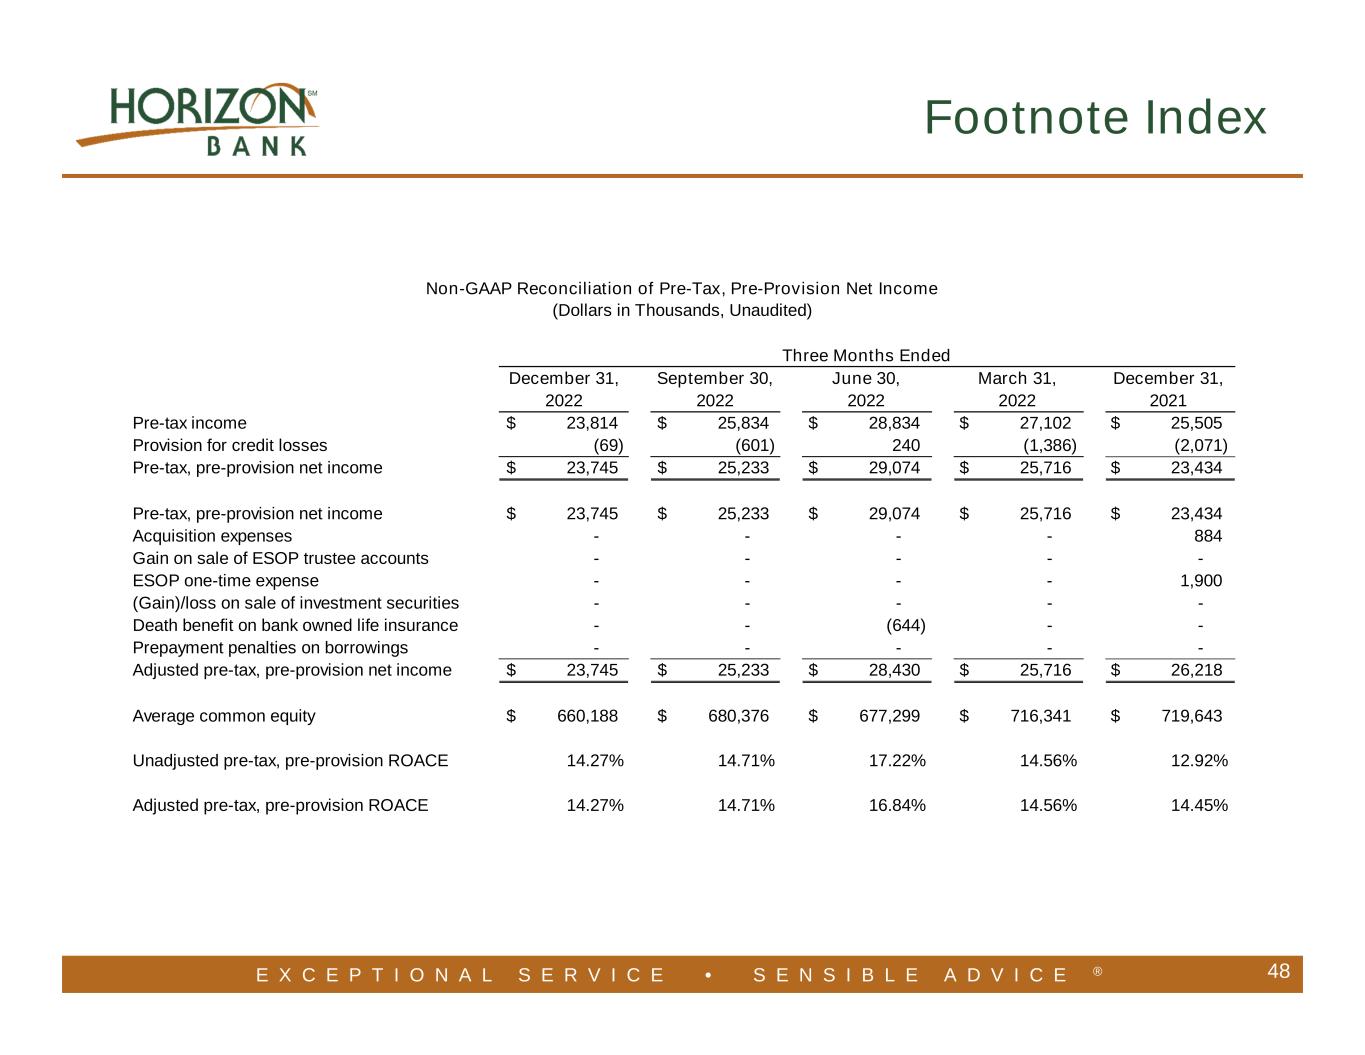
E X C E P T I O N A L S E R V I C E • S E N S I B L E A D V I C E ® 48 Footnote Index December 31, September 30, June 30, March 31, December 31, 2022 2022 2022 2022 2021 Pre-tax income 23,814$ 25,834$ 28,834$ 27,102$ 25,505$ Provision for credit losses (69) (601) 240 (1,386) (2,071) Pre-tax, pre-provision net income 23,745$ 25,233$ 29,074$ 25,716$ 23,434$ Pre-tax, pre-provision net income 23,745$ 25,233$ 29,074$ 25,716$ 23,434$ Acquisition expenses - - - - 884 Gain on sale of ESOP trustee accounts - - - - - ESOP one-time expense - - - - 1,900 (Gain)/loss on sale of investment securities - - - - - Death benefit on bank owned life insurance - - (644) - - Prepayment penalties on borrowings - - - - - Adjusted pre-tax, pre-provision net income 23,745$ 25,233$ 28,430$ 25,716$ 26,218$ Average common equity 660,188$ 680,376$ 677,299$ 716,341$ 719,643$ Unadjusted pre-tax, pre-provision ROACE 14.27% 14.71% 17.22% 14.56% 12.92% Adjusted pre-tax, pre-provision ROACE 14.27% 14.71% 16.84% 14.56% 14.45% Non-GAAP Reconciliation of Pre-Tax, Pre-Provision Net Income (Dollars in Thousands, Unaudited) Three Months Ended
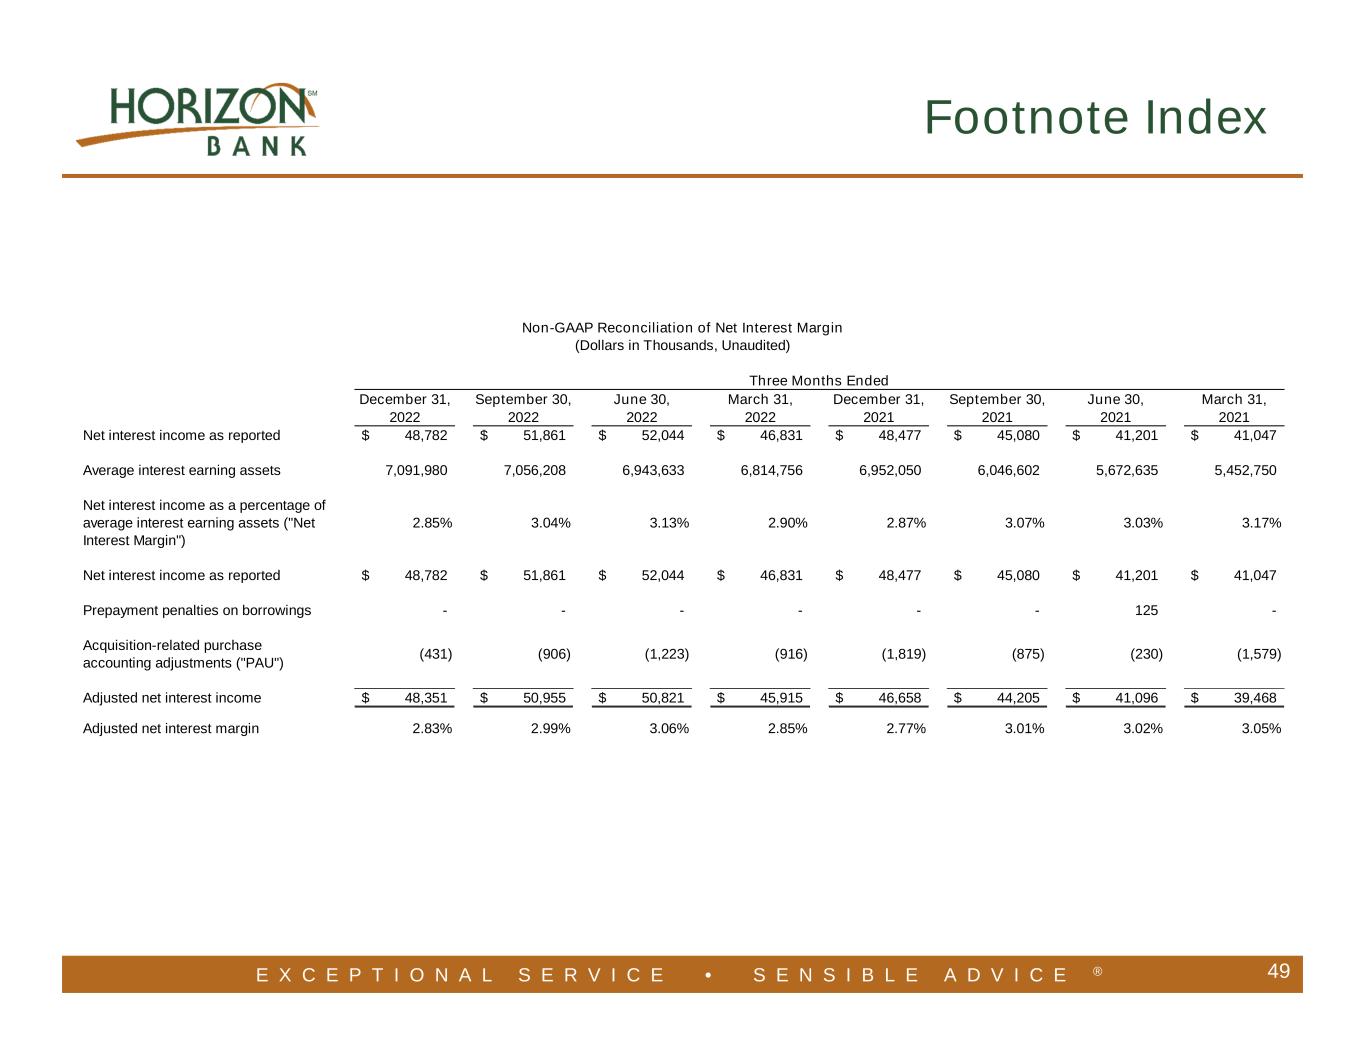
E X C E P T I O N A L S E R V I C E • S E N S I B L E A D V I C E ® 49 Footnote Index December 31, September 30, June 30, March 31, December 31, September 30, June 30, March 31, 2022 2022 2022 2022 2021 2021 2021 2021 Net interest income as reported 48,782$ 51,861$ 52,044$ 46,831$ 48,477$ 45,080$ 41,201$ 41,047$ Average interest earning assets 7,091,980 7,056,208 6,943,633 6,814,756 6,952,050 6,046,602 5,672,635 5,452,750 Net interest income as a percentage of average interest earning assets ("Net Interest Margin") 2.85% 3.04% 3.13% 2.90% 2.87% 3.07% 3.03% 3.17% Net interest income as reported 48,782$ 51,861$ 52,044$ 46,831$ 48,477$ 45,080$ 41,201$ 41,047$ Prepayment penalties on borrowings - - - - - - 125 - Acquisition-related purchase accounting adjustments ("PAU") (431) (906) (1,223) (916) (1,819) (875) (230) (1,579) Adjusted net interest income 48,351$ 50,955$ 50,821$ 45,915$ 46,658$ 44,205$ 41,096$ 39,468$ Adjusted net interest margin 2.83% 2.99% 3.06% 2.85% 2.77% 3.01% 3.02% 3.05% Non-GAAP Reconciliation of Net Interest Margin (Dollars in Thousands, Unaudited) Three Months Ended
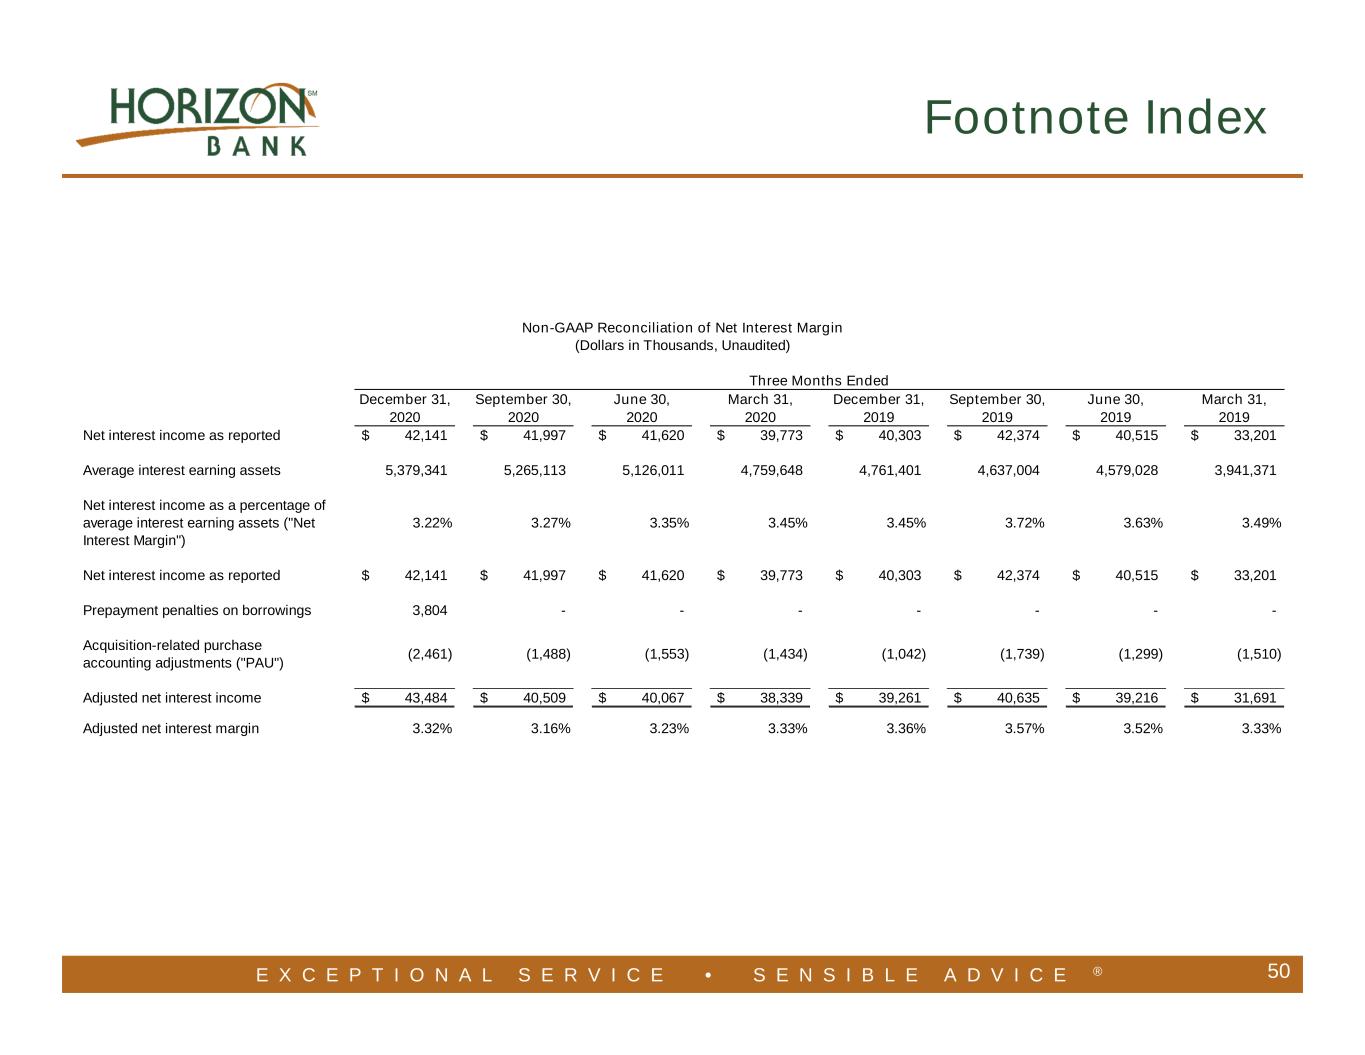
E X C E P T I O N A L S E R V I C E • S E N S I B L E A D V I C E ® 50 Footnote Index December 31, September 30, June 30, March 31, December 31, September 30, June 30, March 31, 2020 2020 2020 2020 2019 2019 2019 2019 Net interest income as reported 42,141$ 41,997$ 41,620$ 39,773$ 40,303$ 42,374$ 40,515$ 33,201$ Average interest earning assets 5,379,341 5,265,113 5,126,011 4,759,648 4,761,401 4,637,004 4,579,028 3,941,371 Net interest income as a percentage of average interest earning assets ("Net Interest Margin") 3.22% 3.27% 3.35% 3.45% 3.45% 3.72% 3.63% 3.49% Net interest income as reported 42,141$ 41,997$ 41,620$ 39,773$ 40,303$ 42,374$ 40,515$ 33,201$ Prepayment penalties on borrowings 3,804 - - - - - - - Acquisition-related purchase accounting adjustments ("PAU") (2,461) (1,488) (1,553) (1,434) (1,042) (1,739) (1,299) (1,510) Adjusted net interest income 43,484$ 40,509$ 40,067$ 38,339$ 39,261$ 40,635$ 39,216$ 31,691$ Adjusted net interest margin 3.32% 3.16% 3.23% 3.33% 3.36% 3.57% 3.52% 3.33% Non-GAAP Reconciliation of Net Interest Margin (Dollars in Thousands, Unaudited) Three Months Ended
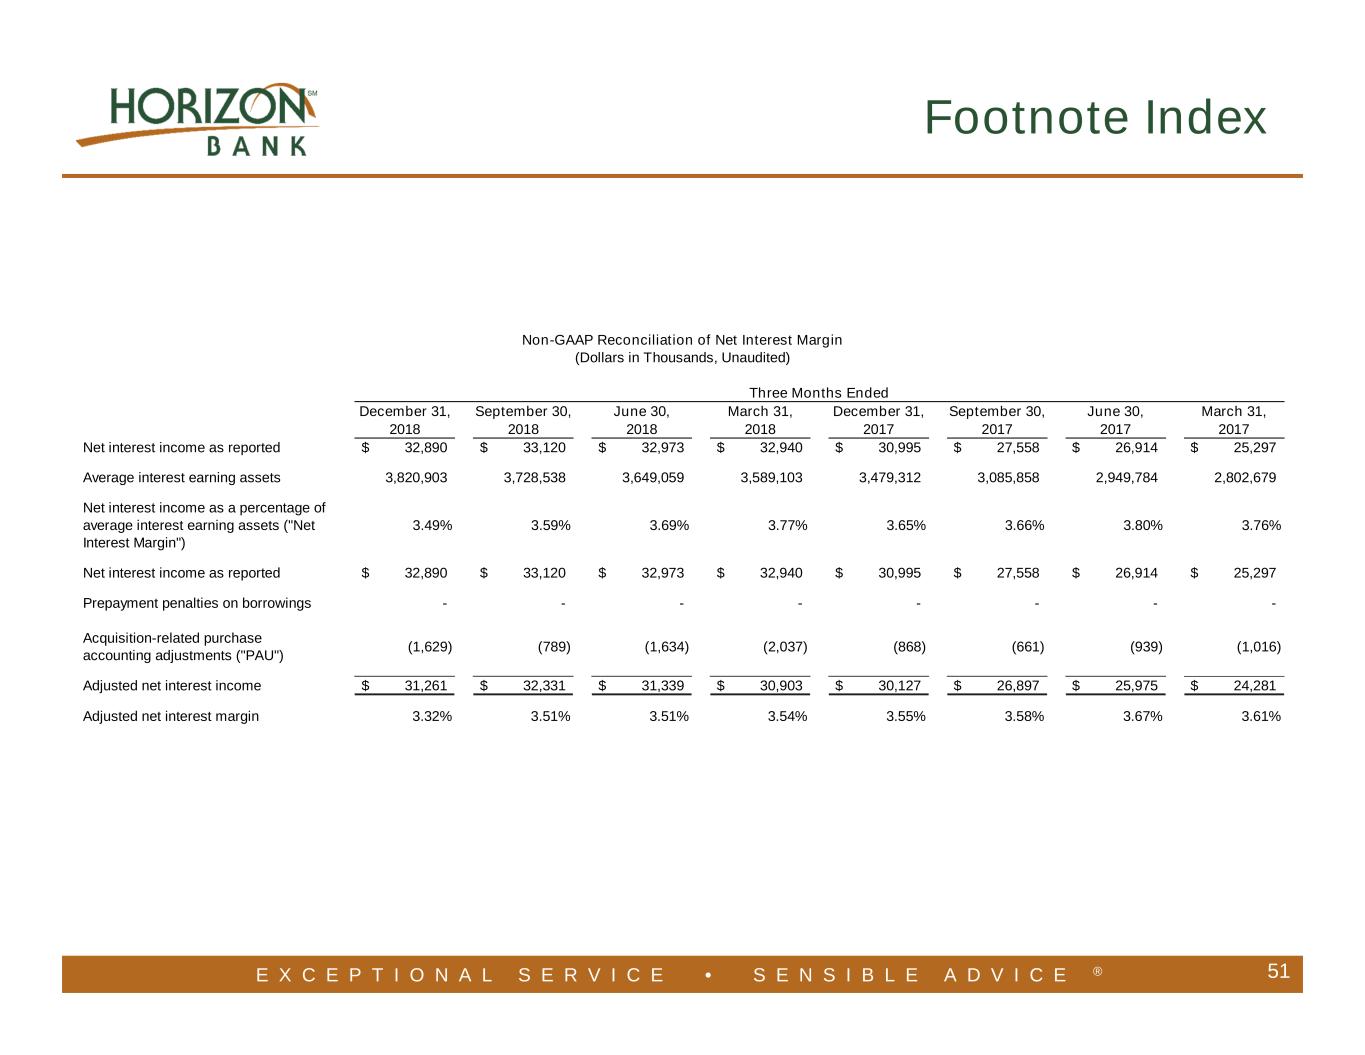
E X C E P T I O N A L S E R V I C E • S E N S I B L E A D V I C E ® 51 Footnote Index December 31, September 30, June 30, March 31, December 31, September 30, June 30, March 31, 2018 2018 2018 2018 2017 2017 2017 2017 Net interest income as reported 32,890$ 33,120$ 32,973$ 32,940$ 30,995$ 27,558$ 26,914$ 25,297$ Average interest earning assets 3,820,903 3,728,538 3,649,059 3,589,103 3,479,312 3,085,858 2,949,784 2,802,679 Net interest income as a percentage of average interest earning assets ("Net Interest Margin") 3.49% 3.59% 3.69% 3.77% 3.65% 3.66% 3.80% 3.76% Net interest income as reported 32,890$ 33,120$ 32,973$ 32,940$ 30,995$ 27,558$ 26,914$ 25,297$ Prepayment penalties on borrowings - - - - - - - - Acquisition-related purchase accounting adjustments ("PAU") (1,629) (789) (1,634) (2,037) (868) (661) (939) (1,016) Adjusted net interest income 31,261$ 32,331$ 31,339$ 30,903$ 30,127$ 26,897$ 25,975$ 24,281$ Adjusted net interest margin 3.32% 3.51% 3.51% 3.54% 3.55% 3.58% 3.67% 3.61% Three Months Ended Non-GAAP Reconciliation of Net Interest Margin (Dollars in Thousands, Unaudited)
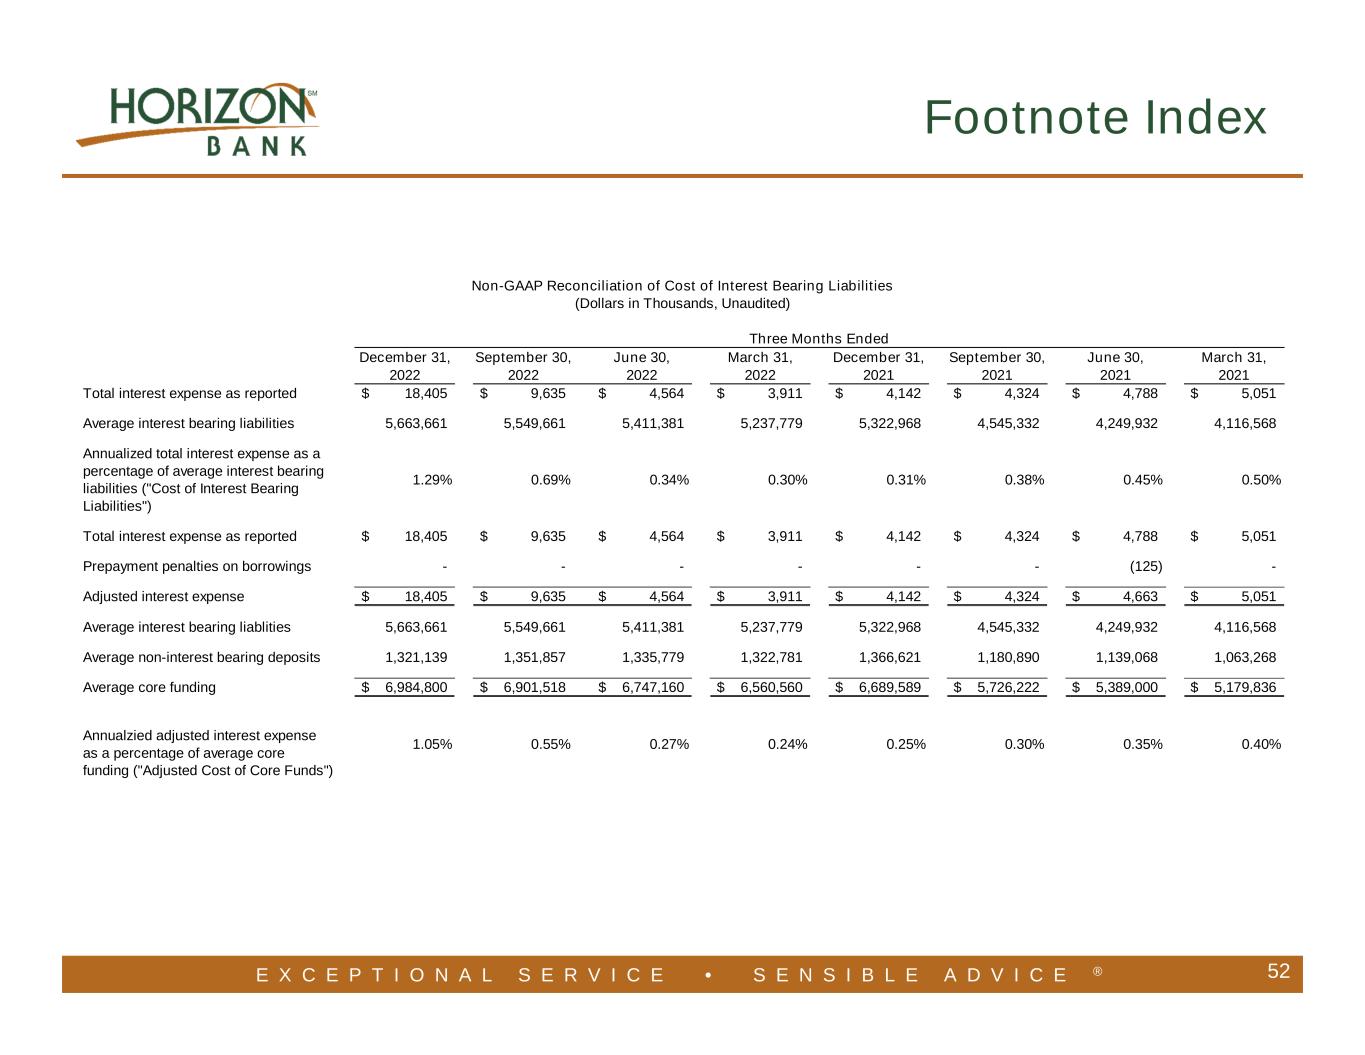
E X C E P T I O N A L S E R V I C E • S E N S I B L E A D V I C E ® 52 Footnote Index December 31, September 30, June 30, March 31, December 31, September 30, June 30, March 31, 2022 2022 2022 2022 2021 2021 2021 2021 Total interest expense as reported 18,405$ 9,635$ 4,564$ 3,911$ 4,142$ 4,324$ 4,788$ 5,051$ Average interest bearing liabilities 5,663,661 5,549,661 5,411,381 5,237,779 5,322,968 4,545,332 4,249,932 4,116,568 Annualized total interest expense as a percentage of average interest bearing liabilities ("Cost of Interest Bearing Liabilities") 1.29% 0.69% 0.34% 0.30% 0.31% 0.38% 0.45% 0.50% Total interest expense as reported 18,405$ 9,635$ 4,564$ 3,911$ 4,142$ 4,324$ 4,788$ 5,051$ Prepayment penalties on borrowings - - - - - - (125) - Adjusted interest expense 18,405$ 9,635$ 4,564$ 3,911$ 4,142$ 4,324$ 4,663$ 5,051$ Average interest bearing liablities 5,663,661 5,549,661 5,411,381 5,237,779 5,322,968 4,545,332 4,249,932 4,116,568 Average non-interest bearing deposits 1,321,139 1,351,857 1,335,779 1,322,781 1,366,621 1,180,890 1,139,068 1,063,268 Average core funding 6,984,800$ 6,901,518$ 6,747,160$ 6,560,560$ 6,689,589$ 5,726,222$ 5,389,000$ 5,179,836$ Annualzied adjusted interest expense as a percentage of average core funding ("Adjusted Cost of Core Funds") 1.05% 0.55% 0.27% 0.24% 0.25% 0.30% 0.35% 0.40% Non-GAAP Reconciliation of Cost of Interest Bearing Liabilities (Dollars in Thousands, Unaudited) Three Months Ended
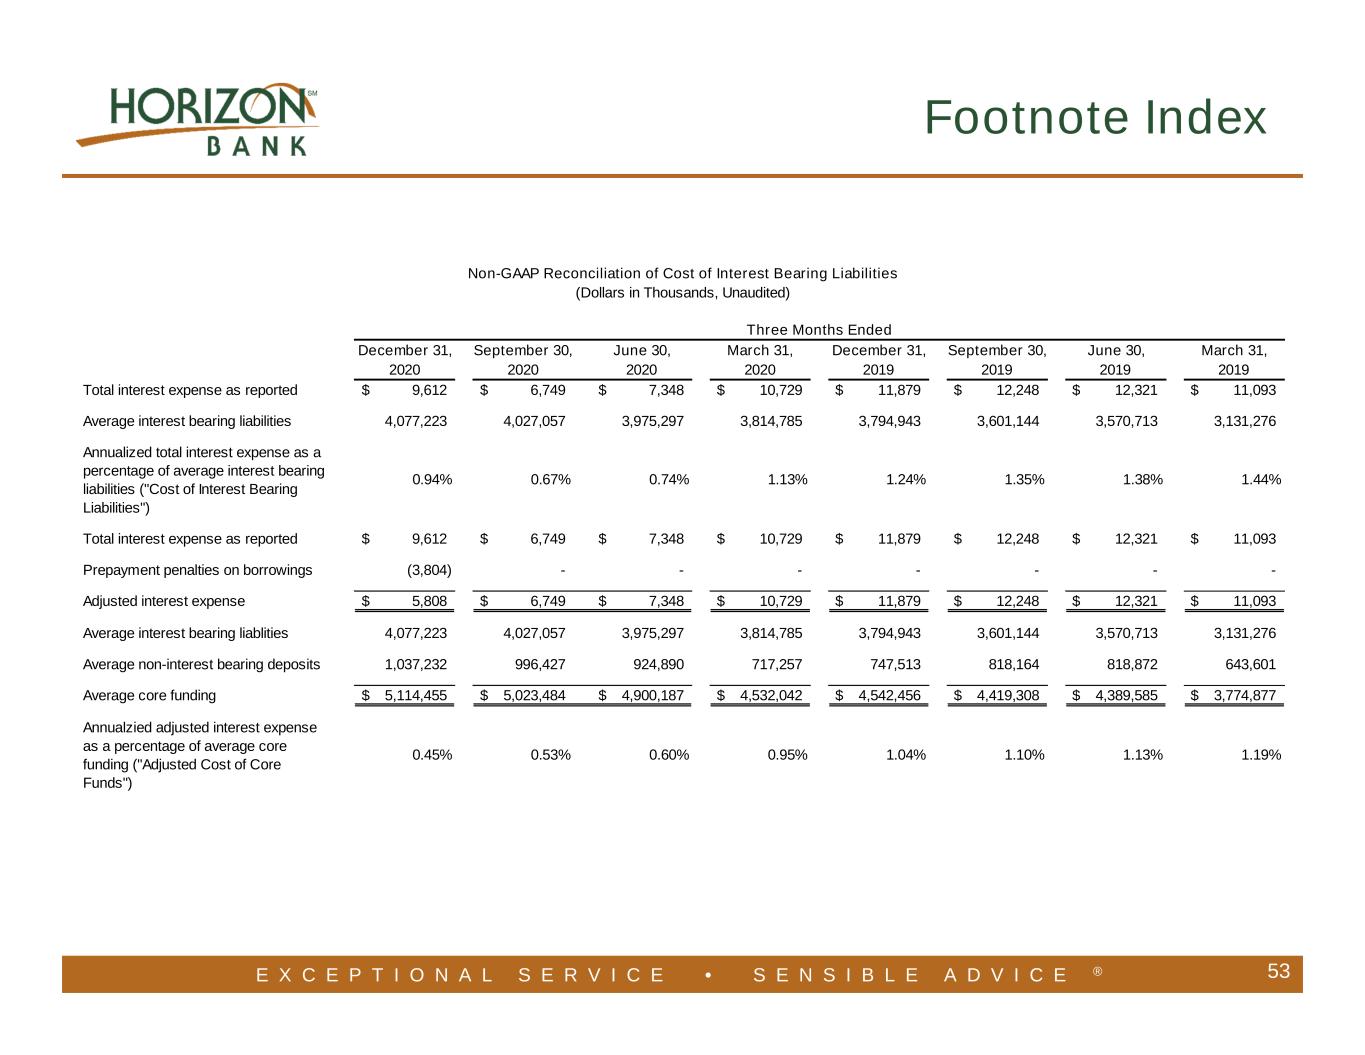
E X C E P T I O N A L S E R V I C E • S E N S I B L E A D V I C E ® 53 Footnote Index December 31, September 30, June 30, March 31, December 31, September 30, June 30, March 31, 2020 2020 2020 2020 2019 2019 2019 2019 Total interest expense as reported 9,612$ 6,749$ 7,348$ 10,729$ 11,879$ 12,248$ 12,321$ 11,093$ Average interest bearing liabilities 4,077,223 4,027,057 3,975,297 3,814,785 3,794,943 3,601,144 3,570,713 3,131,276 Annualized total interest expense as a percentage of average interest bearing liabilities ("Cost of Interest Bearing Liabilities") 0.94% 0.67% 0.74% 1.13% 1.24% 1.35% 1.38% 1.44% Total interest expense as reported 9,612$ 6,749$ 7,348$ 10,729$ 11,879$ 12,248$ 12,321$ 11,093$ Prepayment penalties on borrowings (3,804) - - - - - - - Adjusted interest expense 5,808$ 6,749$ 7,348$ 10,729$ 11,879$ 12,248$ 12,321$ 11,093$ Average interest bearing liablities 4,077,223 4,027,057 3,975,297 3,814,785 3,794,943 3,601,144 3,570,713 3,131,276 Average non-interest bearing deposits 1,037,232 996,427 924,890 717,257 747,513 818,164 818,872 643,601 Average core funding 5,114,455$ 5,023,484$ 4,900,187$ 4,532,042$ 4,542,456$ 4,419,308$ 4,389,585$ 3,774,877$ Annualzied adjusted interest expense as a percentage of average core funding ("Adjusted Cost of Core Funds") 0.45% 0.53% 0.60% 0.95% 1.04% 1.10% 1.13% 1.19% Non-GAAP Reconciliation of Cost of Interest Bearing Liabilities (Dollars in Thousands, Unaudited) Three Months Ended
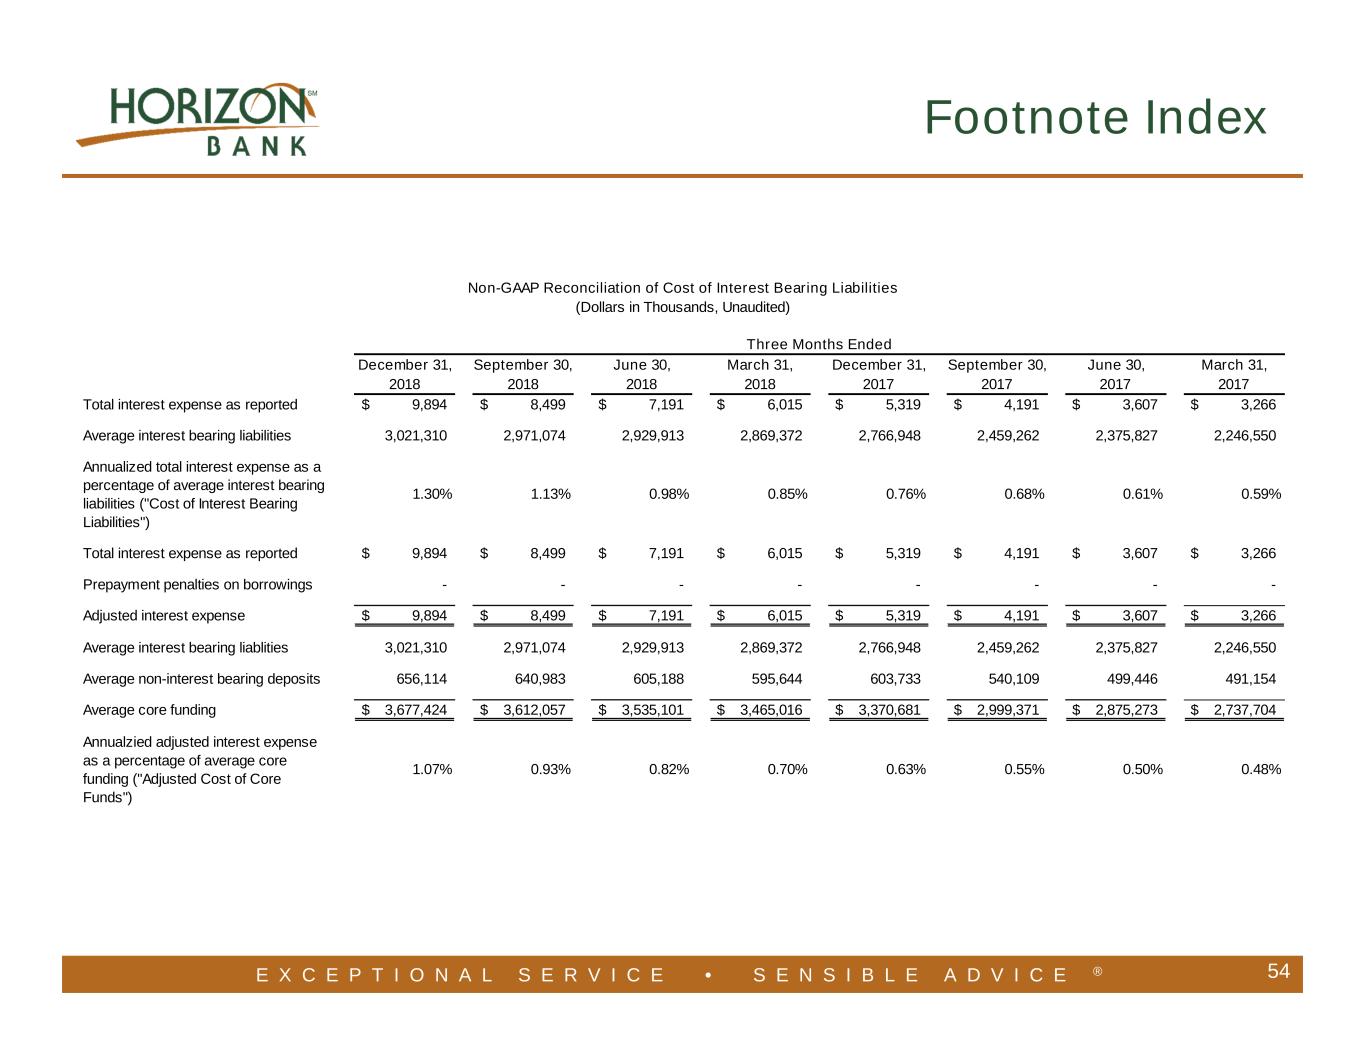
E X C E P T I O N A L S E R V I C E • S E N S I B L E A D V I C E ® 54 Footnote Index December 31, September 30, June 30, March 31, December 31, September 30, June 30, March 31, 2018 2018 2018 2018 2017 2017 2017 2017 Total interest expense as reported 9,894$ 8,499$ 7,191$ 6,015$ 5,319$ 4,191$ 3,607$ 3,266$ Average interest bearing liabilities 3,021,310 2,971,074 2,929,913 2,869,372 2,766,948 2,459,262 2,375,827 2,246,550 Annualized total interest expense as a percentage of average interest bearing liabilities ("Cost of Interest Bearing Liabilities") 1.30% 1.13% 0.98% 0.85% 0.76% 0.68% 0.61% 0.59% Total interest expense as reported 9,894$ 8,499$ 7,191$ 6,015$ 5,319$ 4,191$ 3,607$ 3,266$ Prepayment penalties on borrowings - - - - - - - - Adjusted interest expense 9,894$ 8,499$ 7,191$ 6,015$ 5,319$ 4,191$ 3,607$ 3,266$ Average interest bearing liablities 3,021,310 2,971,074 2,929,913 2,869,372 2,766,948 2,459,262 2,375,827 2,246,550 Average non-interest bearing deposits 656,114 640,983 605,188 595,644 603,733 540,109 499,446 491,154 Average core funding 3,677,424$ 3,612,057$ 3,535,101$ 3,465,016$ 3,370,681$ 2,999,371$ 2,875,273$ 2,737,704$ Annualzied adjusted interest expense as a percentage of average core funding ("Adjusted Cost of Core Funds") 1.07% 0.93% 0.82% 0.70% 0.63% 0.55% 0.50% 0.48% Non-GAAP Reconciliation of Cost of Interest Bearing Liabilities (Dollars in Thousands, Unaudited) Three Months Ended
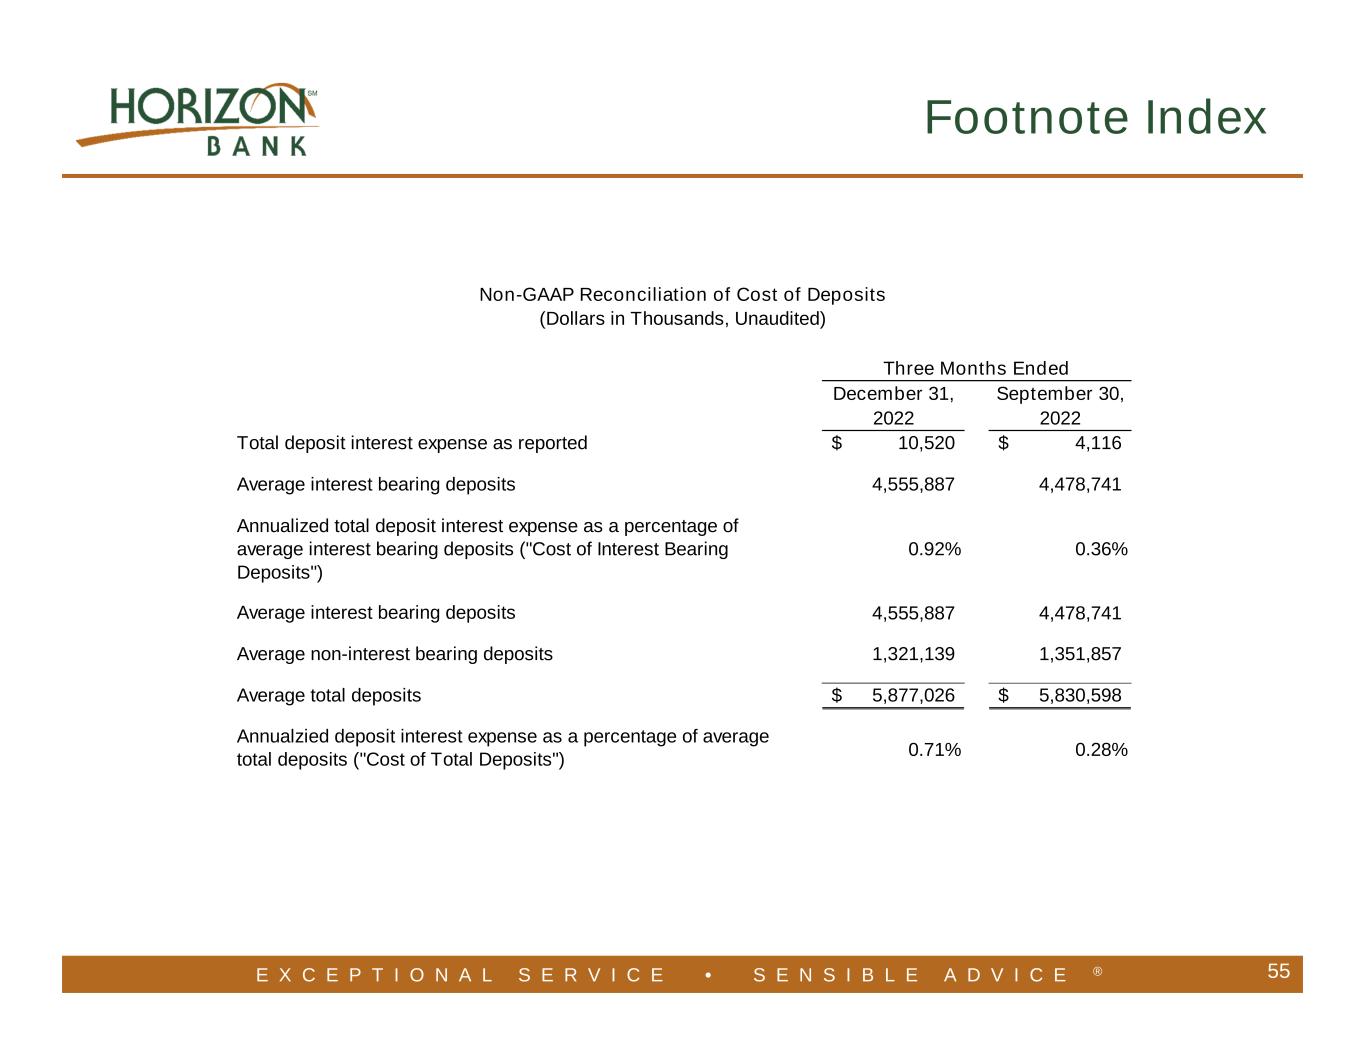
E X C E P T I O N A L S E R V I C E • S E N S I B L E A D V I C E ® 55 Footnote Index December 31, September 30, 2022 2022 Total deposit interest expense as reported 10,520$ 4,116$ Average interest bearing deposits 4,555,887 4,478,741 Annualized total deposit interest expense as a percentage of average interest bearing deposits ("Cost of Interest Bearing Deposits") 0.92% 0.36% Average interest bearing deposits 4,555,887 4,478,741 Average non-interest bearing deposits 1,321,139 1,351,857 Average total deposits 5,877,026$ 5,830,598$ Annualzied deposit interest expense as a percentage of average total deposits ("Cost of Total Deposits") 0.71% 0.28% Non-GAAP Reconciliation of Cost of Deposits (Dollars in Thousands, Unaudited) Three Months Ended
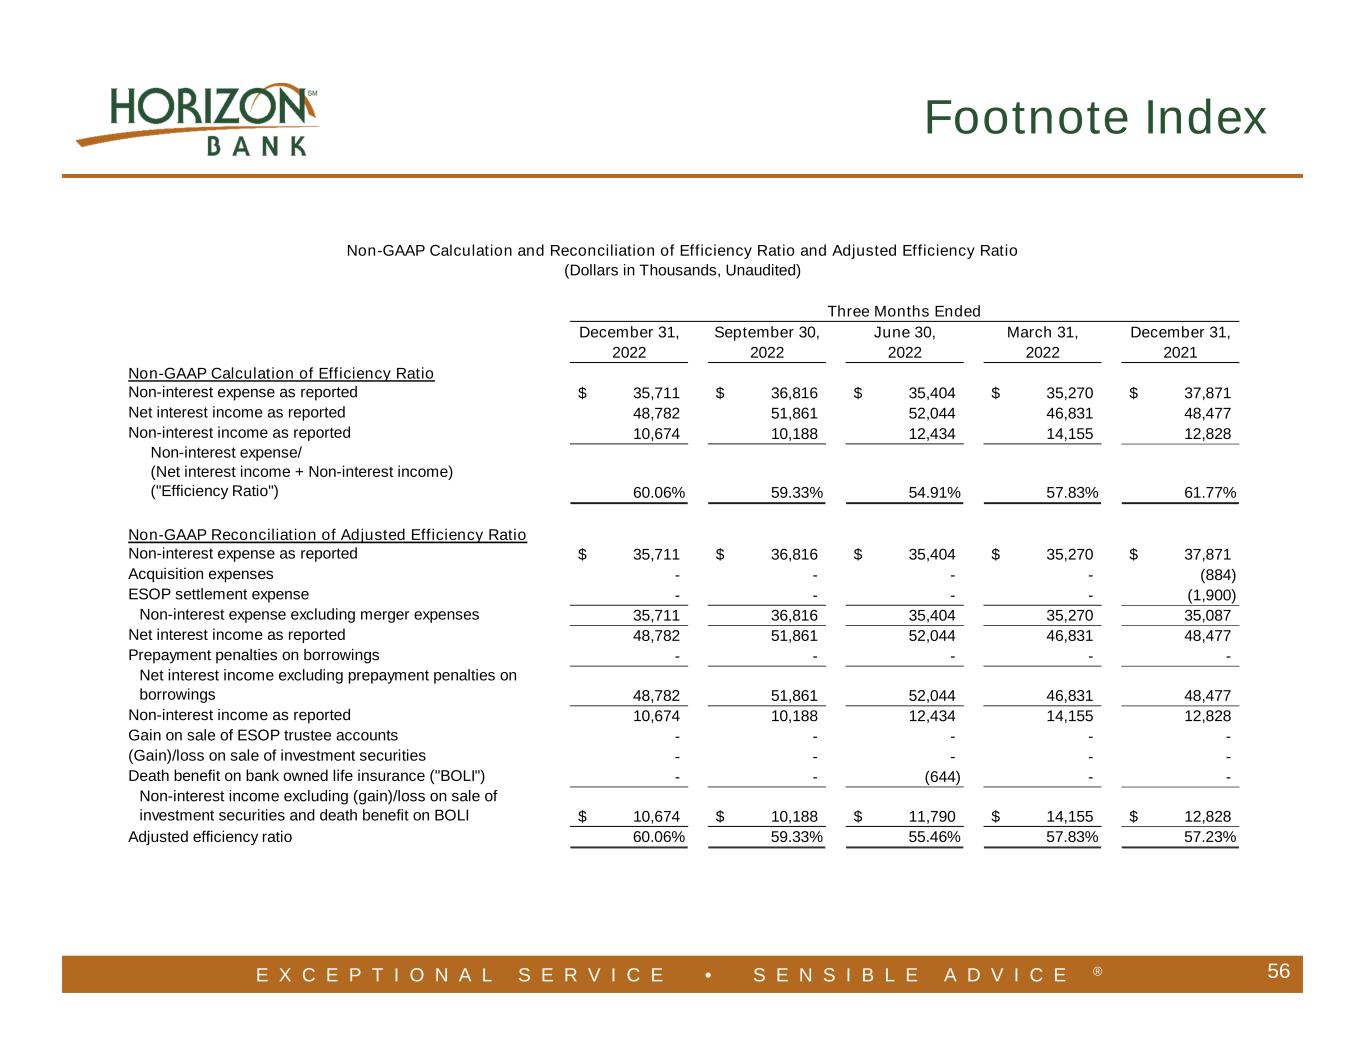
E X C E P T I O N A L S E R V I C E • S E N S I B L E A D V I C E ® 56 Footnote Index December 31, September 30, June 30, March 31, December 31, 2022 2022 2022 2022 2021 Non-GAAP Calculation of Efficiency Ratio Non-interest expense as reported 35,711$ 36,816$ 35,404$ 35,270$ 37,871$ Net interest income as reported 48,782 51,861 52,044 46,831 48,477 Non-interest income as reported 10,674 10,188 12,434 14,155 12,828 Non-interest expense/ (Net interest income + Non-interest income) ("Efficiency Ratio") 60.06% 59.33% 54.91% 57.83% 61.77% Non-GAAP Reconciliation of Adjusted Efficiency Ratio Non-interest expense as reported 35,711$ 36,816$ 35,404$ 35,270$ 37,871$ Acquisition expenses - - - - (884) ESOP settlement expense - - - - (1,900) Non-interest expense excluding merger expenses 35,711 36,816 35,404 35,270 35,087 Net interest income as reported 48,782 51,861 52,044 46,831 48,477 Prepayment penalties on borrowings - - - - - Net interest income excluding prepayment penalties on borrowings 48,782 51,861 52,044 46,831 48,477 Non-interest income as reported 10,674 10,188 12,434 14,155 12,828 Gain on sale of ESOP trustee accounts - - - - - (Gain)/loss on sale of investment securities - - - - - Death benefit on bank owned life insurance ("BOLI") - - (644) - - Non-interest income excluding (gain)/loss on sale of investment securities and death benefit on BOLI 10,674$ 10,188$ 11,790$ 14,155$ 12,828$ Adjusted efficiency ratio 60.06% 59.33% 55.46% 57.83% 57.23% Non-GAAP Calculation and Reconciliation of Efficiency Ratio and Adjusted Efficiency Ratio (Dollars in Thousands, Unaudited) Three Months Ended
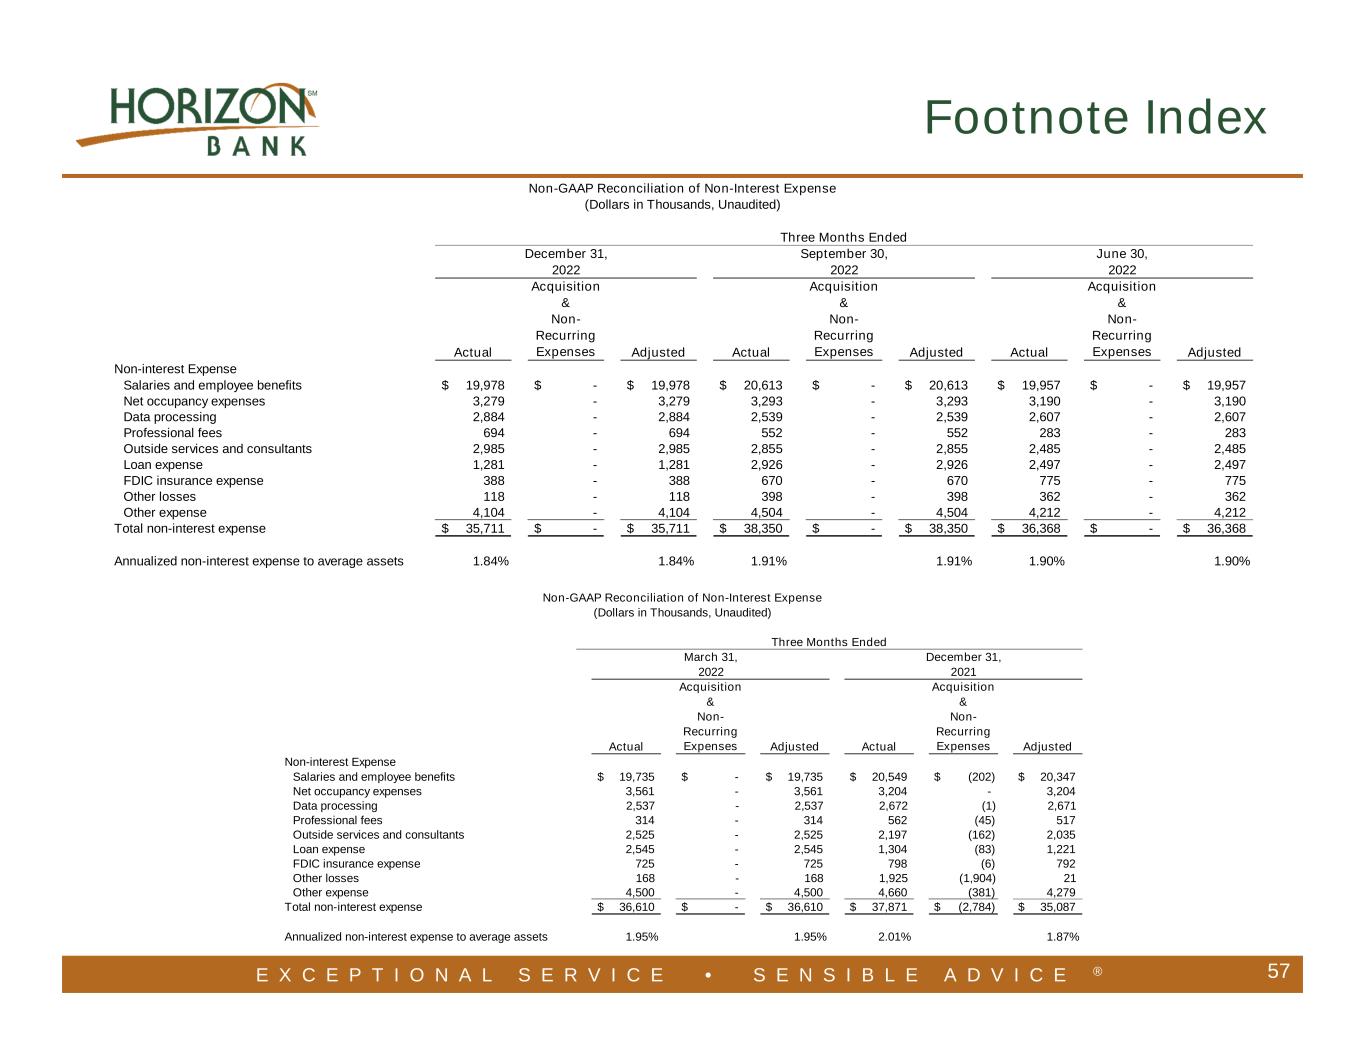
E X C E P T I O N A L S E R V I C E • S E N S I B L E A D V I C E ® 57 Footnote Index Actual Acquisition & Non- Recurring Expenses Adjusted Actual Acquisition & Non- Recurring Expenses Adjusted Actual Acquisition & Non- Recurring Expenses Adjusted Non-interest Expense Salaries and employee benefits 19,978$ -$ 19,978$ 20,613$ -$ 20,613$ 19,957$ -$ 19,957$ Net occupancy expenses 3,279 - 3,279 3,293 - 3,293 3,190 - 3,190 Data processing 2,884 - 2,884 2,539 - 2,539 2,607 - 2,607 Professional fees 694 - 694 552 - 552 283 - 283 Outside services and consultants 2,985 - 2,985 2,855 - 2,855 2,485 - 2,485 Loan expense 1,281 - 1,281 2,926 - 2,926 2,497 - 2,497 FDIC insurance expense 388 - 388 670 - 670 775 - 775 Other losses 118 - 118 398 - 398 362 - 362 Other expense 4,104 - 4,104 4,504 - 4,504 4,212 - 4,212 Total non-interest expense 35,711$ -$ 35,711$ 38,350$ -$ 38,350$ 36,368$ -$ 36,368$ Annualized non-interest expense to average assets 1.84% 1.84% 1.91% 1.91% 1.90% 1.90% Three Months Ended Non-GAAP Reconciliation of Non-Interest Expense (Dollars in Thousands, Unaudited) 20222022 December 31, September 30, June 30, 2022 Actual Acquisition & Non- Recurring Expenses Adjusted Actual Acquisition & Non- Recurring Expenses Adjusted Non-interest Expense Salaries and employee benefits 19,735$ -$ 19,735$ 20,549$ (202)$ 20,347$ Net occupancy expenses 3,561 - 3,561 3,204 - 3,204 Data processing 2,537 - 2,537 2,672 (1) 2,671 Professional fees 314 - 314 562 (45) 517 Outside services and consultants 2,525 - 2,525 2,197 (162) 2,035 Loan expense 2,545 - 2,545 1,304 (83) 1,221 FDIC insurance expense 725 - 725 798 (6) 792 Other losses 168 - 168 1,925 (1,904) 21 Other expense 4,500 - 4,500 4,660 (381) 4,279 Total non-interest expense 36,610$ -$ 36,610$ 37,871$ (2,784)$ 35,087$ Annualized non-interest expense to average assets 1.95% 1.95% 2.01% 1.87% Three Months Ended Non-GAAP Reconciliation of Non-Interest Expense (Dollars in Thousands, Unaudited) December 31, 20212022 March 31,