Operator
Thank you for standing by and welcome to the Mattson Second Quarter 2026 Financial Results Conference Call. At this time, all participants are in listen-only mode. After the speaker's presentation, there will be a question and answer session. To ask a question during this session, you'll need to press star 11 on your telephone. If your question has been answered and you'd like to remove yourself from the queue, simply press star 11 again. As a reminder, today's program is being recorded. And now I'd like to introduce your host for today's program, Justin Schoenenberg, Director of Investor Relations. Please go ahead, sir.
Joining me on the call today are Matt Cox, Chairman and Chief Executive Officer, and Joel Winnie, Executive Vice President and Chief Financial Officer. Slides from this presentation are available for download at our website, www.matson.com, under the Investors tab. Before we begin, I would like to remind you that during the course of this call, we will make forward-looking statements within the meaning of the federal securities laws regarding expectations, predictions, projections, or future events. We believe that our expectations and assumptions are reasonable. We caution you to consider the risk factors that could cause actual results to differ materially from those in the forward-looking statements in the press release, the presentation slides. These risk factors press release and presentation and are more fully detailed under the caption risk factors on pages 12 to 23 and in our subsequent filings with the SEC. Please also note that the date of this conference call is August 3rd, 2026, and any forward-looking statements that we make today are based on assumptions as of this date. We undertake no obligation to update these and thanks to those on the call.
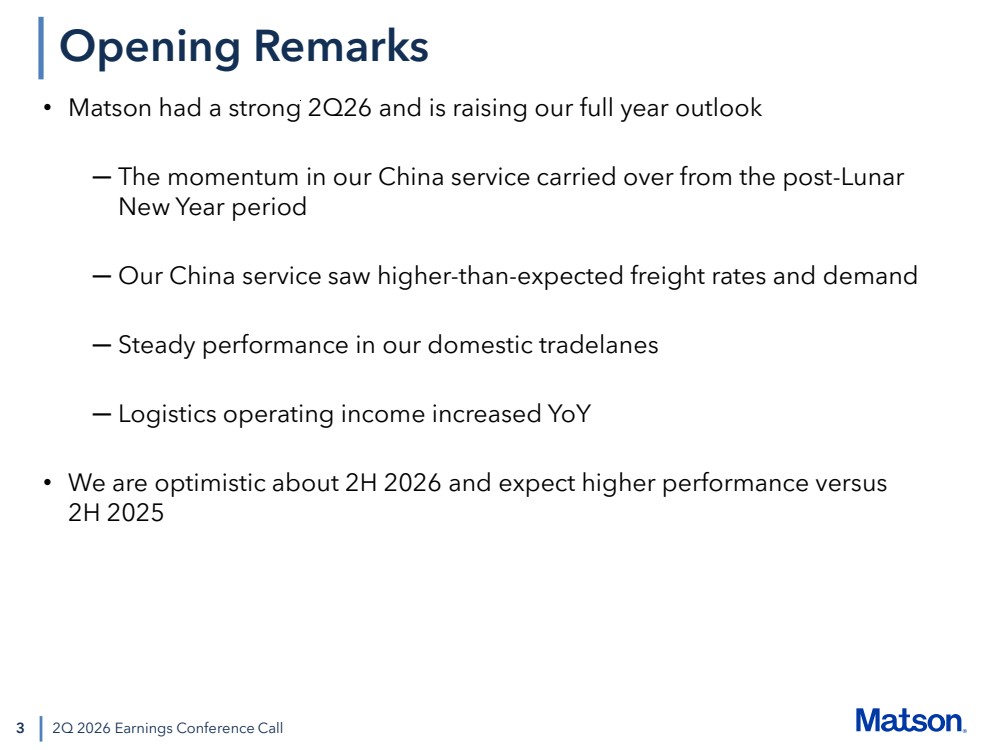
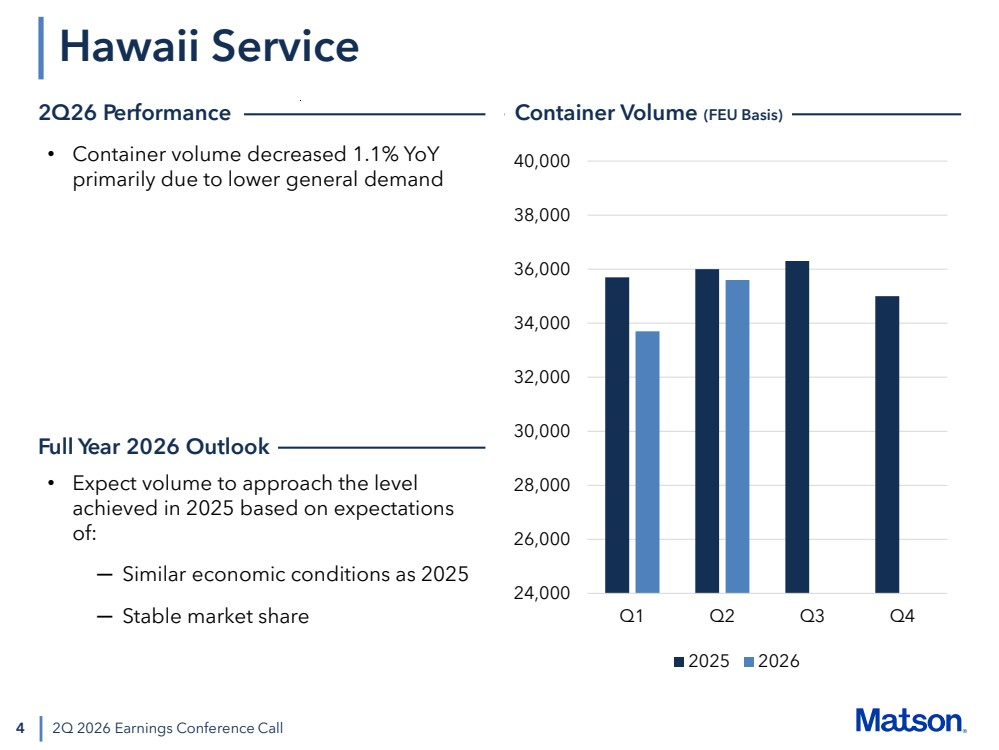
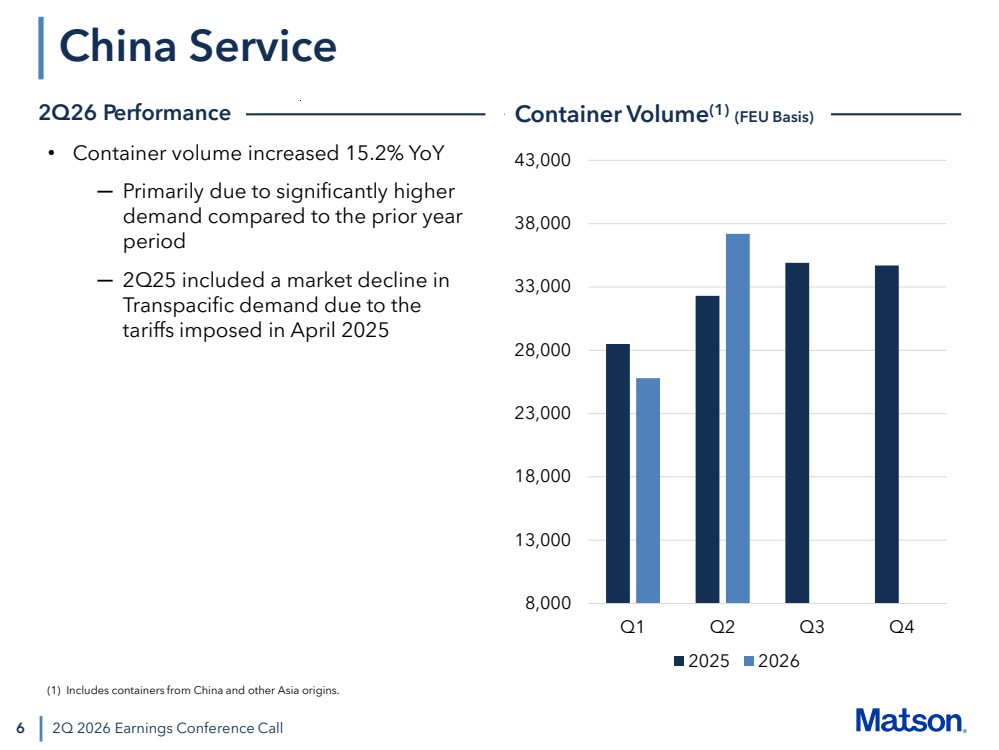
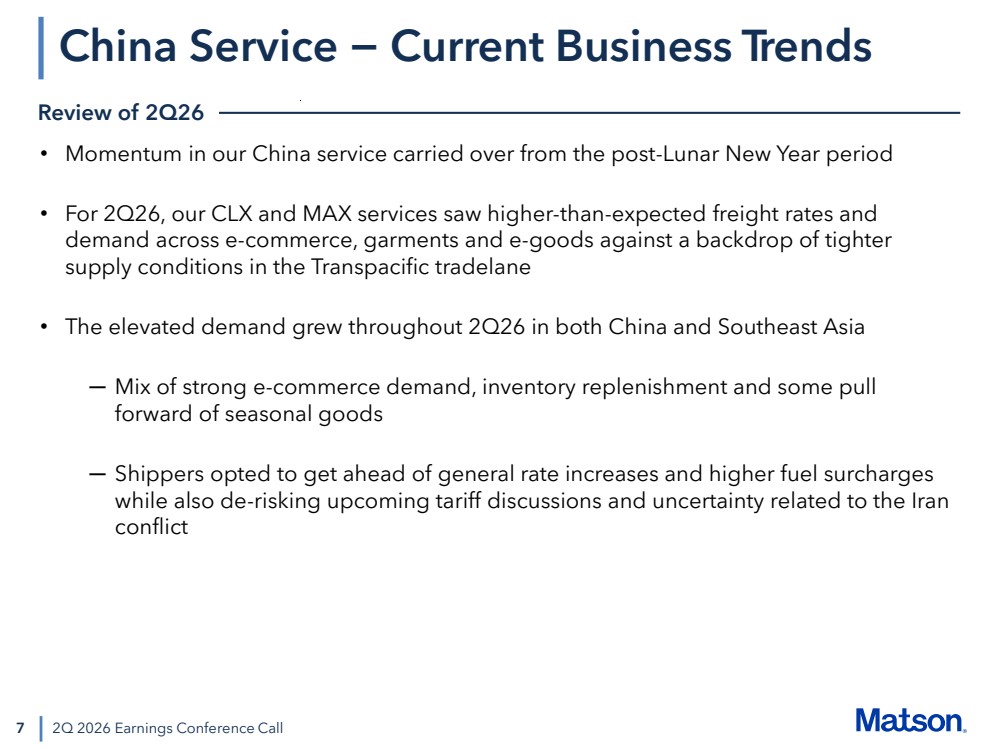
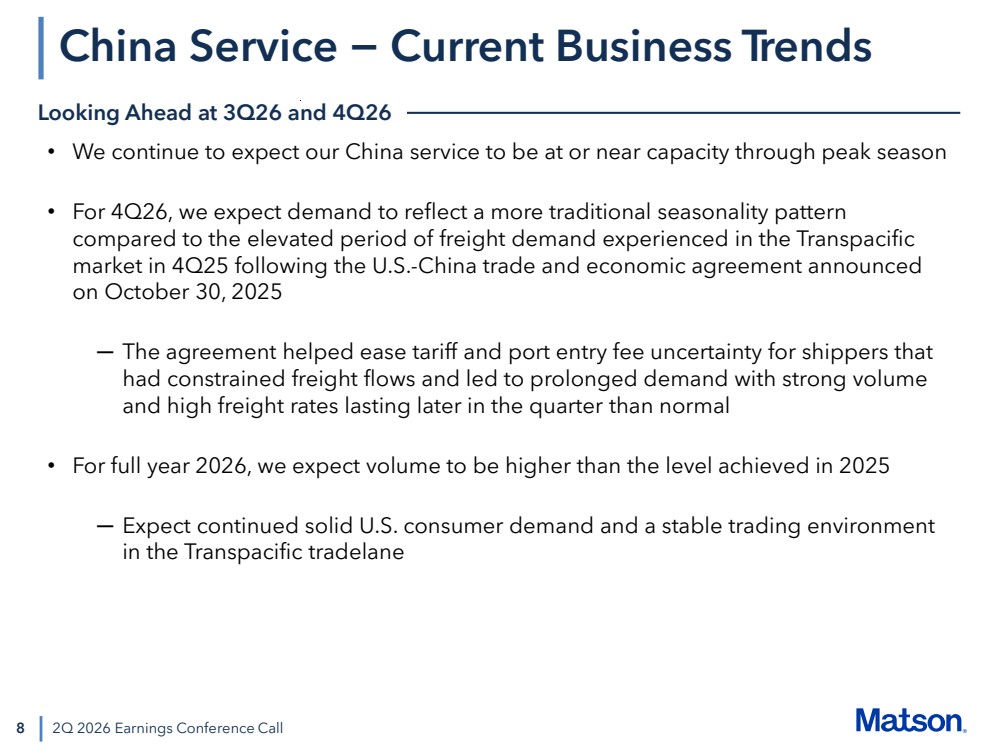
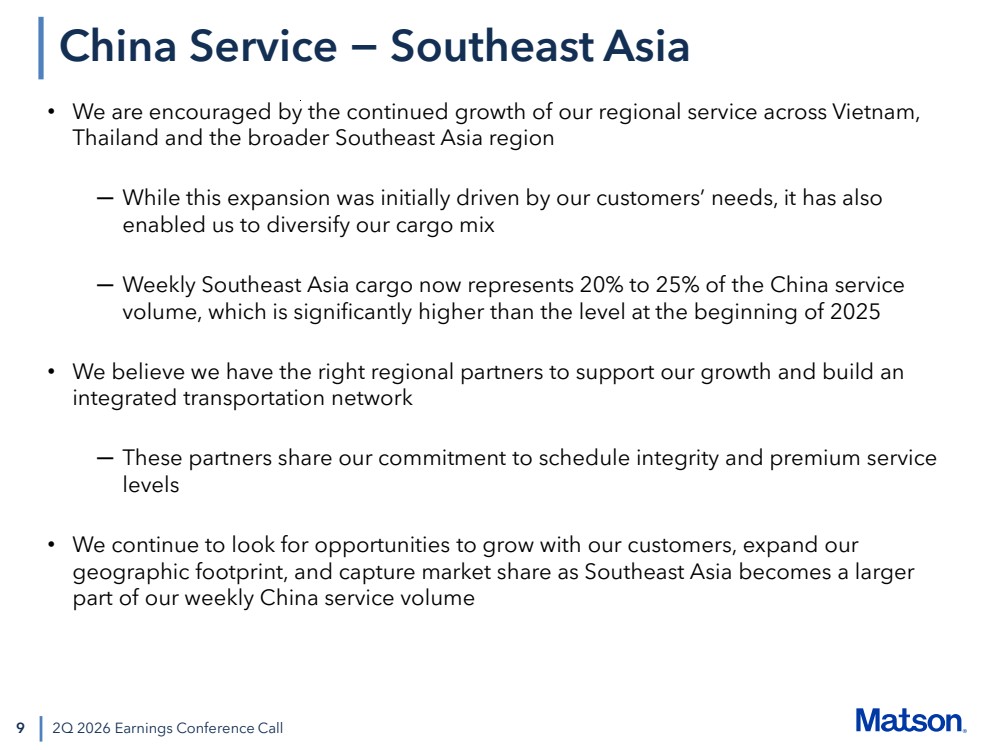
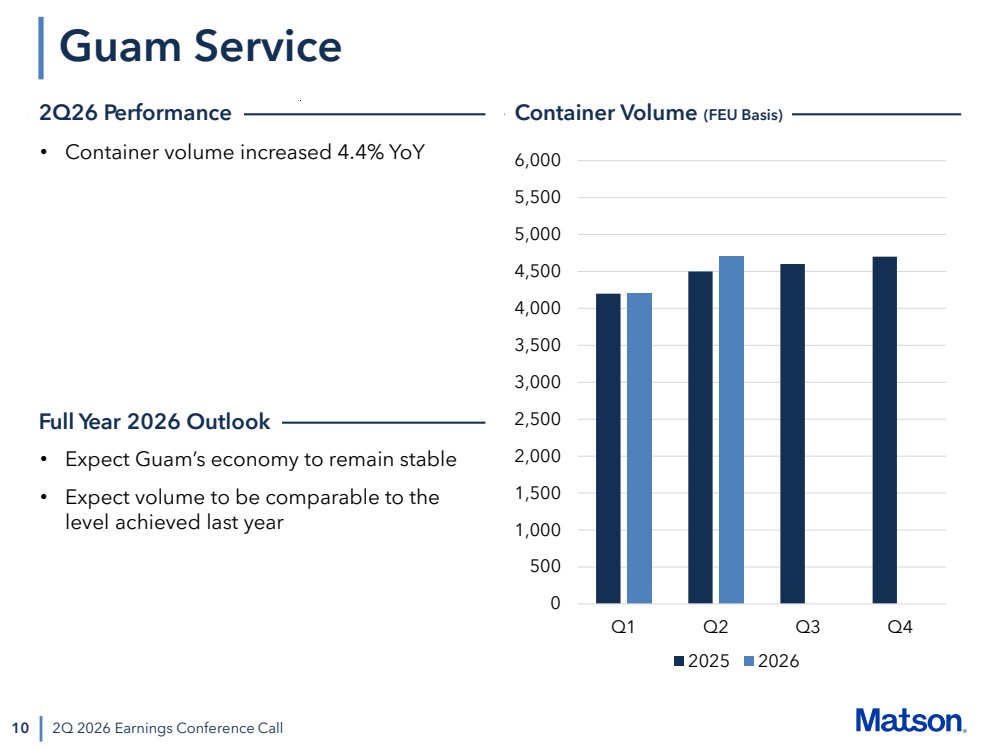
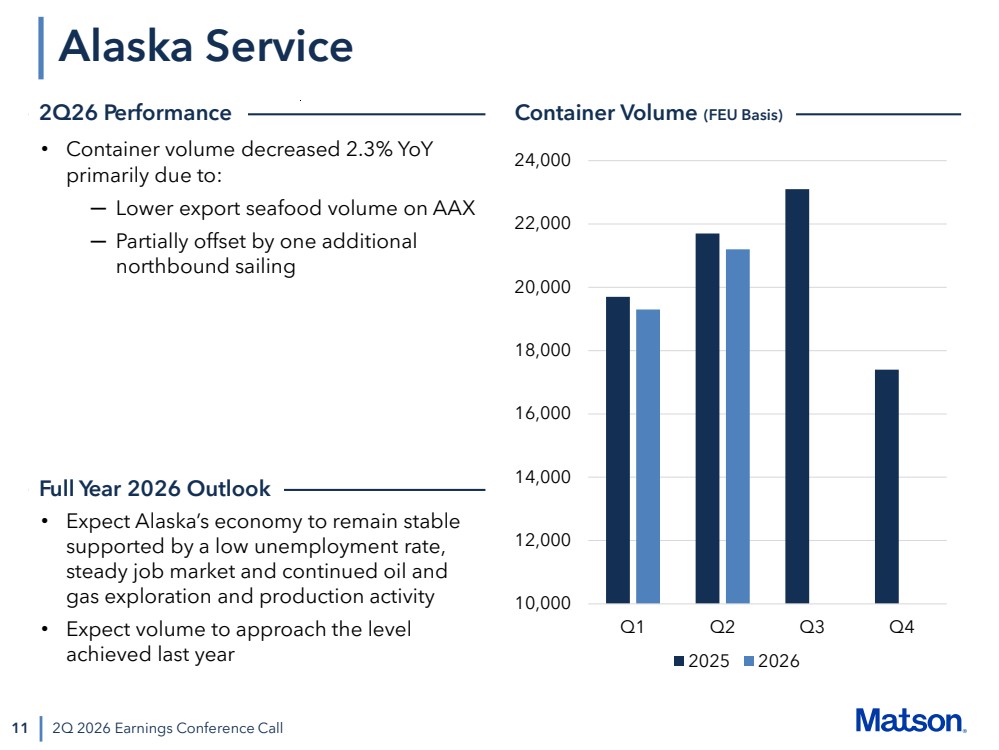
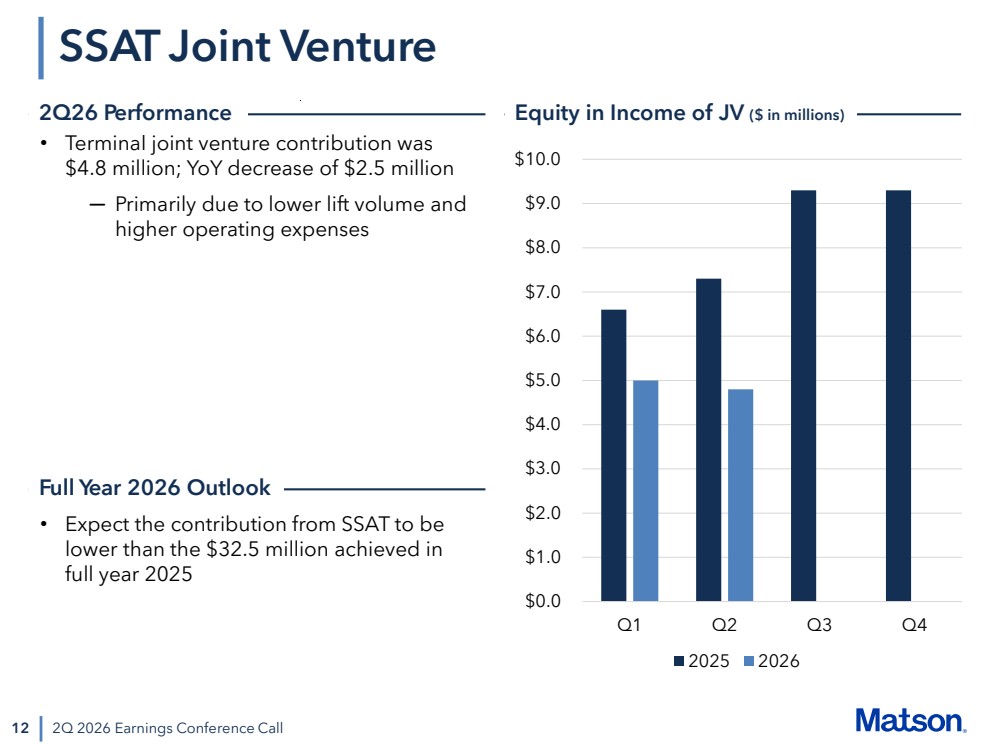
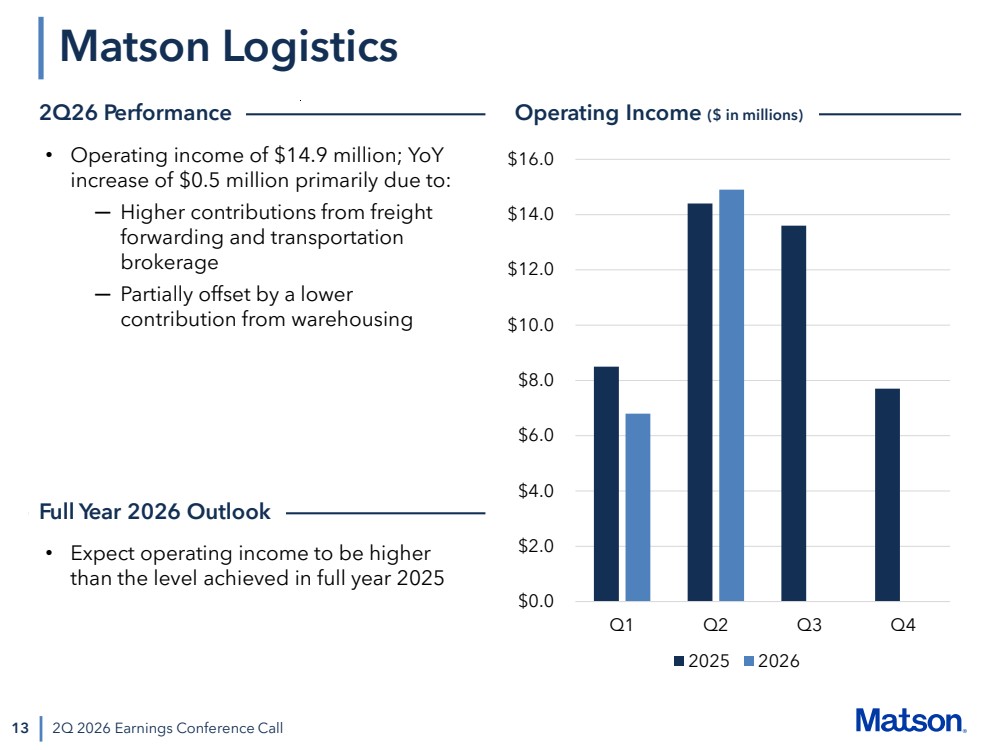
I'll start on slide three. Mattson delivered a strong second quarter and we are raising our outlook. The strong performance in the quarter was driven primarily by our China service. The momentum in our China service carried China service benefited from tight market conditions and continued demand across e-commerce, garments, trade lanes performed largely as expected and logistics delivered year-over-year operating income growth. Looking ahead head, we are optimistic about the second half of the year, supported by continued demand in our China service, resilient consumer spending, and a stable trans-Pacific trade. Our differentiated service model continues to perform well, and as we enter the second half of the year in a healthy balance sheet, and as a result, we're optimistic about the second half of 26. Joel will go into more detail on the outlook. We'll now go through the second quarter performance of our trade lanes, SSAT, and logistics. In our Hawaii service, container volume in the second quarter decreased 1.1% year-over-year, primarily due to lower general demand. For the full year 2026, we expect volume to approach the level achieved in 2025 based on our expectations of similar economic conditions as 2025 and a stable market share. Please turn to slide 5. According to UHIRO's second quarter 2026 economic report, Hawaii's economy remains stable, supported by strong construction activity and modest growth in tourist arrivals, but continues to face headwinds from higher energy-related inflation. Construction remains a source of strength for Hawaii's economy, supported by large federal contracts, the Maui wildfire rebuilding efforts, and investments in infrastructure. Tourism is also improving modestly as visitor arrivals to continue to recover, though the increase is from domestic tourists as opposed to higher spending. Moving to our China service on slide six, container volume in the second quarter of 2026 increased 15.2 percent. The increase was primarily due to significantly higher demand compared to the prior year period. As you may recall, in the second quarter of 2025, there was a marked decline in the Trans-Pacific demand due to the tariffs imposed in April 2025. Please turn to slide 7 for additional commentary. Momentum in our China service carried over from the post-Lunar New Year period. For the second quarter, our CLX and MAX services saw higher than expected freight rates and demand across e-commerce, garments, and e-goods against a backdrop of tighter supply conditions in the Trans-Pacific trade lane. The elevated demand grew throughout the quarter in both China and Southeast Asia. We saw a mix of strong e-commerce demand, inventory replenishment, and some pull forward of seasonal goods. Some customers opted to get ahead of the general rate increases in higher fuel surcharges, while also de-risking upcoming UF tariffs discussions and uncertainties related to the Iran conflict. Please turn to the next slide for our commentary on the second half of the year. We continue to expect our China service to be at or near capacity through the peak season. Through July, freight demand on our CLX and MAX services remained in excess of the fourth quarter of 2026. We expect demand to reflect a more traditional seasonality pattern compared to the elevated period of freight demand experienced in the trans-Pacific market in the fourth quarter of 2025 following the U.S.-China announced on October 30th ease tariff and port entry fee uncertainty for our customers that it constrained freight flows and led to prolonged demand with strong volume and high freight rates lasting later. And for the full year, 2026, we expect volume to be higher than the level achieved in 2025 with continued solid U.S. consumer demand and a stable trading. Please turn to the next slide. We're encouraged by the continued growth of our regional services across Vietnam, Thailand, and the broader Southeast Asia region. While this expansion was initially driven by our customers' needs, it has also enabled us to diversify our cargo mix. Southeast Asia Cargo now represents 20% to 25% of the China service volume, which is significantly higher than the level achieved in the beginning of 2025. We believe we have the right regional transportation partners to support our growth and build an integrated transportation network. These partners share our commitment to schedule integrity and premium service levels. We continue to look for opportunities to grow with our customers, expand our geographic footprint, and capture market share as Southeast Asia becomes a larger part of our weekly China service volume. Please turn to slide 10. In Guam, Matson's container volume in the second quarter of 2026 increased 4.4% year over year. In the near term, we expect Guam's economy to remain stable. As such, for the full year 2026, we expect container volume to be comparable to the level achieved. Please turn to the next slide. In Alaska, Matson's container volume in the second quarter of 2026 decreased 2.3 percent year-over-year. The decrease was primarily due to lower export seafood volume on AAX, partly offset by one additional northbound sailing. In the near term, we expect Alaska's economy to remain stable, supported by a low unemployment rate, steady job market, and continued oil and gas exploration and production activity. As such, for the full year 2026, we expect container volume to approach the level achieved last year. Please turn to slide 12. In the second quarter, our SSAT investment joint venture contributed $4.8 million, representing a year-over-year decrease of $2.5 million. The decrease was primarily due to lower lift volume. For the full year, 2026, we expect the contribution from SSAT to be lower than the $32.5 million achieved in the full year. Turning now to logistics on slide 13, operating income in the second quarter came in at $14.9 million, or a half a million dollars higher than the result in the year-ago period. The increase was primarily due to higher contributions from freight forwarding and transportation brokerage, partially offset. For the full year 2026, we expect logistics operating income to be higher than the level achieved in full year 2025. I will now turn the call over to Joel for a review of our financial performance.
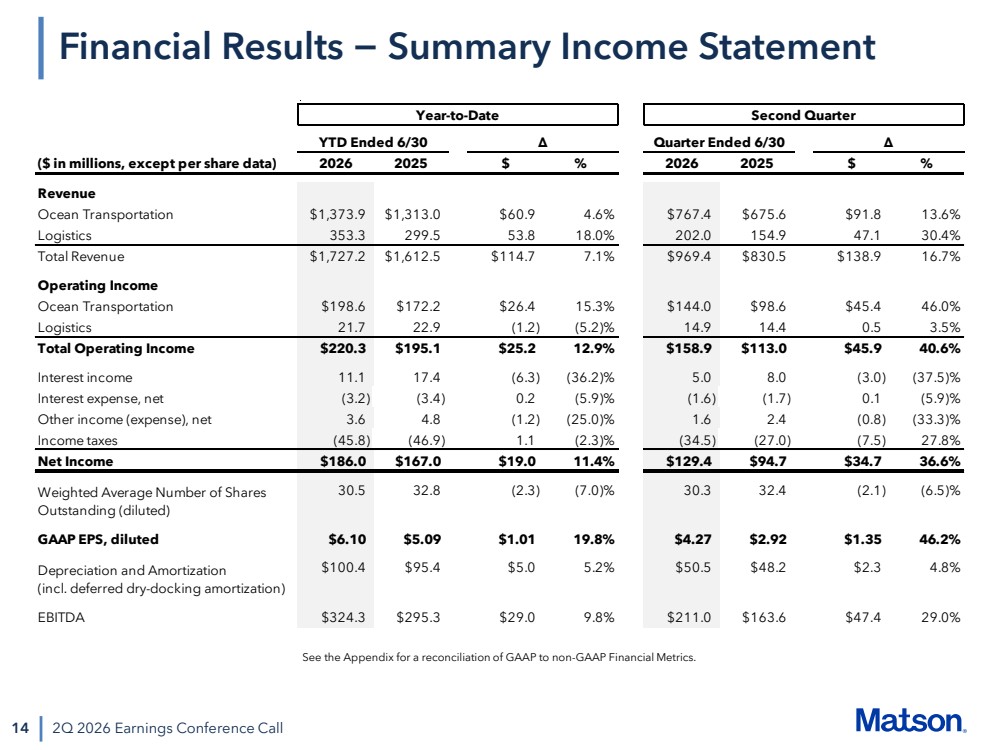
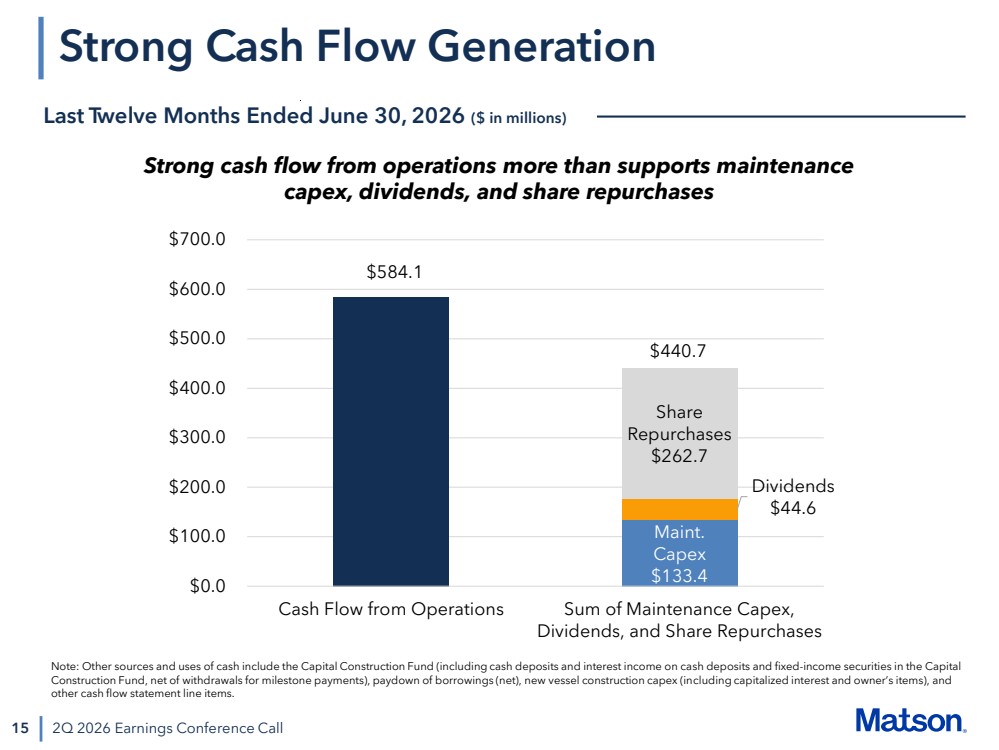
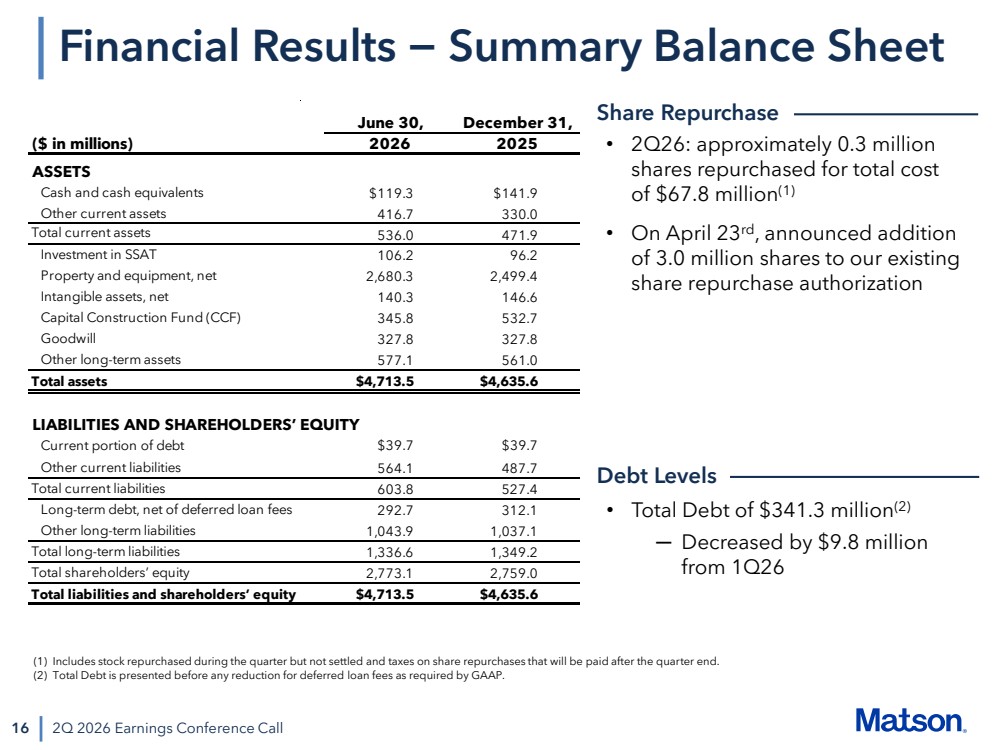
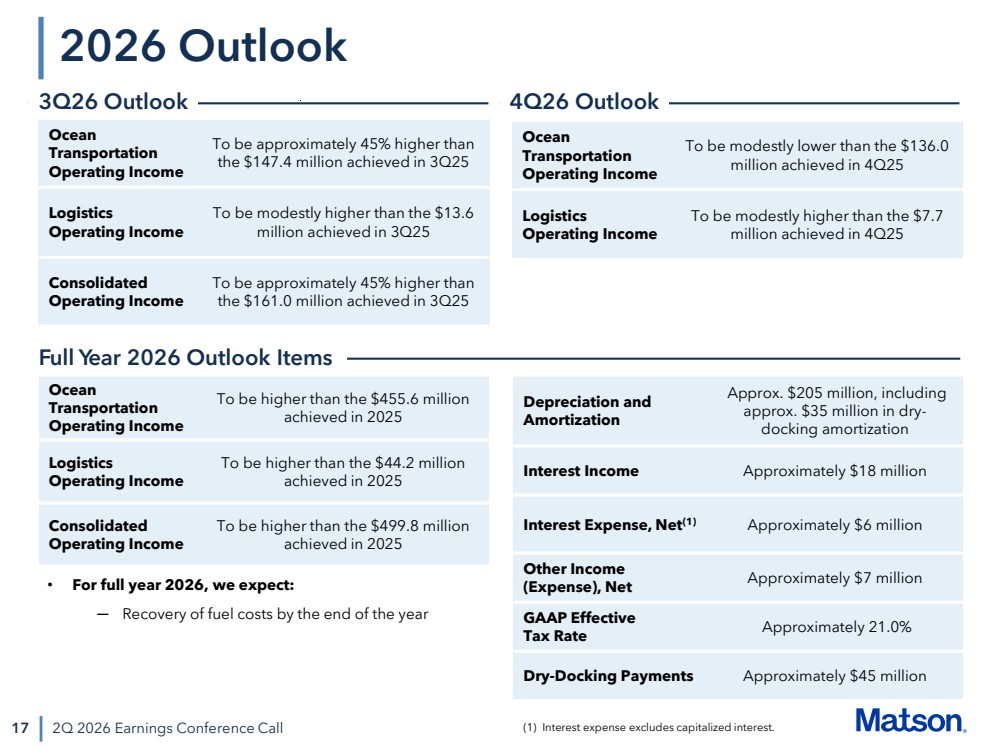
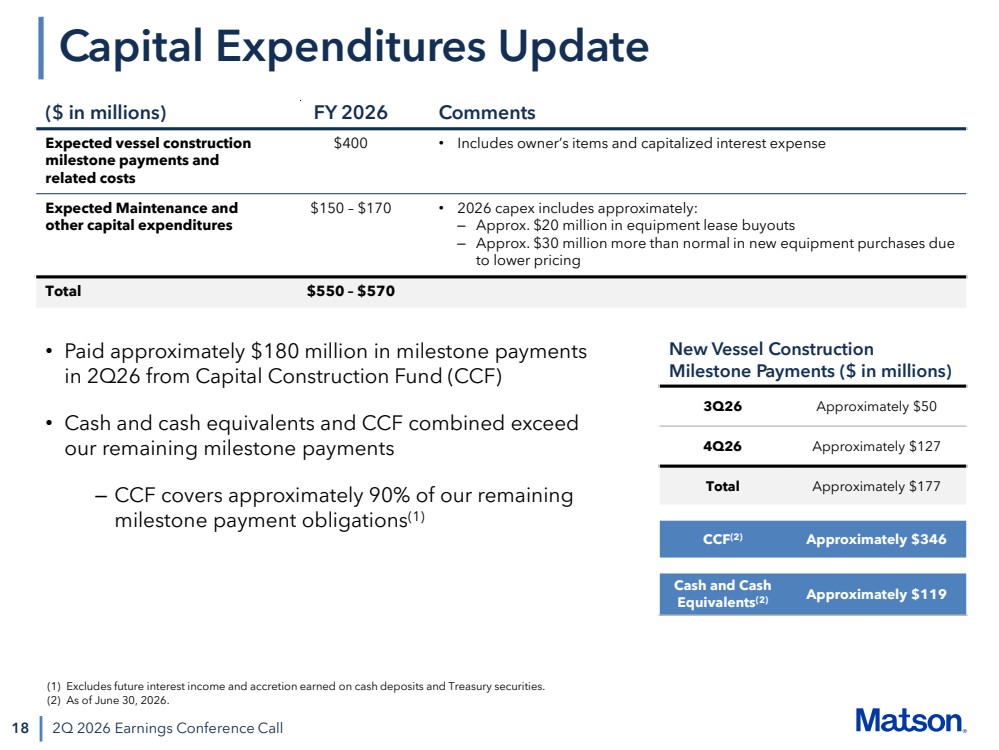
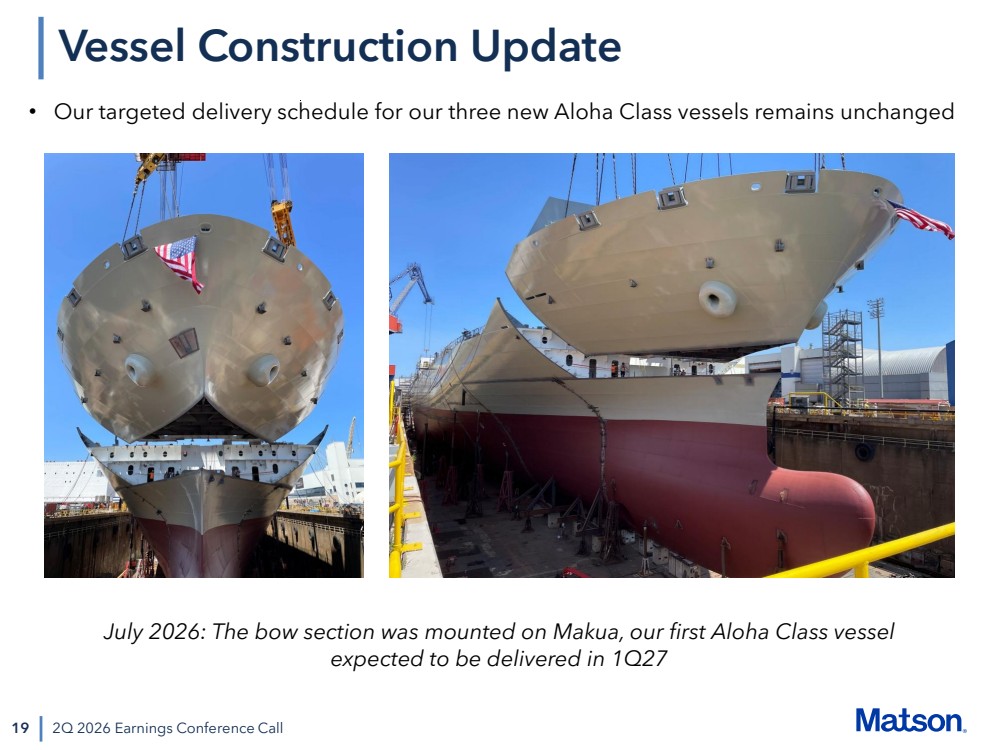
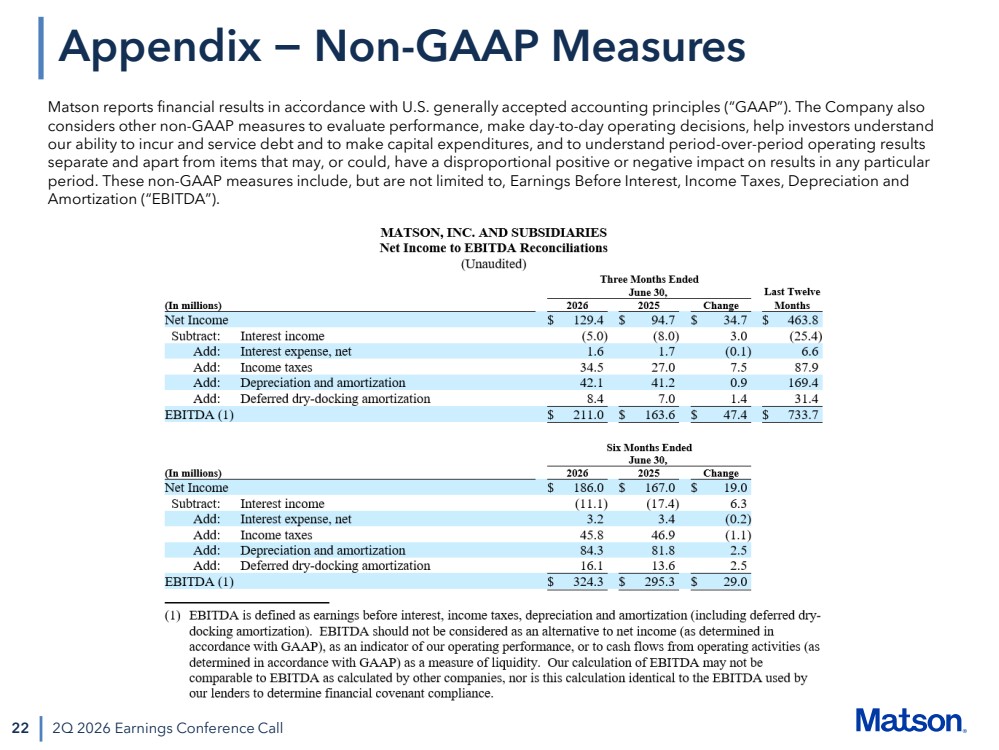
Okay. Please turn to slide 14 for a review of our second quarter results. For the second quarter, consolidated operating income increased $45.9 million year-over-year to $158.9 million with higher contributions from ocean transportation and logistics of $45.4 million and $0.5 million, respectively. The increase in ocean transportation operating income was primarily due to a higher contribution from Archana service, partially offset by higher vessel operating expenses, primarily due to higher fuel-related costs. As Matt noted, the increase in logistics operating income was primarily due to higher contributions from freight forwarding and transportation brokerage partially offset by a lower contribution from warehousing. We had an interest income of $5 million in the quarter compared to $8 million in the same period last year. The decrease was due to $311 million reduction in the CCF balance in the last 12 months as construction milestones on our new Aloha-class vessels had been achieved, increased, necessitating higher payments to the shipyard. Net income increased 36.6% year-over-year to $129.4 million, and diluted earnings per share increased 46.2% year-over-year to $4.27 per share. Lastly, diluted weighted average shares outstanding decreased 6.5% year-over-year. Please turn to the next slide. We continued to generate strong cash flows. For the trailing 12 months, we generated cash flow from operations of $584.1 million. We returned capital in the form of dividends and share repurchases of $307.3 million, and we had maintenance capbacks of $133.4 million. Our cash flow from operations exceeded the aggregate spend on maintenance capex, dividends and share repurchases by $143.4 million. Please turn to slide 16 for a summary of our share repurchase program and balance sheet. During the second quarter, we repurchased approximately .3 million shares for a total cost of $67.8 million. Year-to-date, we repurchased approximately 0.7 million shares for a total cost of $122.2 million. Since we initiated our share repurchase program in August of 2021 through June of this year, we have repurchased approximately 14.6 million shares, or approximately 34% of our stock, for a total cost of approximately $1.4 billion. Also, on April 23rd, we announced the addition of 3 million shares to our existing share repurchase authorization. As we have said before, we are committed to returning excess capital to shareholders and plan to continue to do so in the absence of any large organic or inorganic growth investment opportunities. As of June 30, 2026, there were approximately 3.4 million shares remaining in our share repurchase program turning to our debt levels our total debt at the end of the second quarter was 341.3 million a reduction of 9.8 million from the end of the first quarter with that let me now turn to slide 17 and walk through our outlook starting with the third and fourth quarters of 2026 at the top of the page based on the outlook trends matt mentioned earlier year, we expect ocean transportation operating income in the third quarter to be approximately 45% higher than the $147.4 million achieved in the third quarter of 2025, with our China service expected to be the primary driver of the year-over-year increase. For logistics, we expect operating income in the third quarter to be modestly higher than the $13.6 million achieved in the third quarter of 2025. As such, we expect consolidated operating income in the third quarter to be approximately 45% higher than the prior year. For the fourth quarter of 2026, we expect ocean transportation operating income to be modestly lower than the $136 million achieved in the fourth quarter of 2025. As a reminder, and as Matt mentioned earlier, the fourth quarter last year in the Trans-Pacific market experienced an elevated period of freight demand following the U.S.-China trade and economic agreement announced on October 30 last year. For logistics, we expect operating income to be modestly higher than the $7.7 million achieved in the fourth quarter of 2025. On the bottom half of the slide, we have our expectations for full year 2026. Starting with ocean transportation, we expect year-over-year operating income to be higher than the $455.6 million achieved in 2025. For logistics, we expect operating income to be higher than the $44.2 million achieved in full year 2025. As a result, we now expect consolidated operating income to be higher than the $499.8 million achieved in 2025. This outlook reflects our expectation of continued solid U.S. consumer demand and a stable trading environment in the Trans-Pacific Trade Lane. Our full-year outlook also reflects our expectation regarding fuel cost recovery. To date, the Iran conflict has not impacted our operating performance or service levels. However, it has impacted fuel prices in all of our markets. At the end of the second quarter, we had under-collected fuel costs across all trade lanes by an amount in the low teens of millions of dollars. We expect to recover these elevated fuel costs by the end of the year. In addition to this full-year operating income outlook, we expect the following for the full year. Depreciation and amortization to approximately $205 million, including approximately $35 million in dry docking amortization. Interest income to be approximately $18 million and interest expense to be approximately $6 million. Other income to be approximately $7 million. an effective tax rate of approximately 21.0%, and dry docking payments of approximately $45 million. Moving to slide 18, the table shows our CapEx projections for the full year 2026. Our range for maintenance and other capital expenditures is unchanged at $150 to $170 million for full year 2026. Our estimate for expected vessel construction milestone payments and related costs for full year 2026 remains at $400 million. In the second quarter, we paid approximately $180 million in milestone payments from our capital construction fund. Looking ahead, we expect to make approximately $50 million in milestone payments in the third quarter and approximately $127 million in the fourth quarter. As of June 30th, we had cash and cash equivalents of approximately $119 million and approximately $346 million in our capital construction fund. Our CCF covers approximately 90% of our remaining milestone payment obligations and when combined with our balance sheet cash, exceeds our remaining milestone payments. So, we continue to be in a strong funding position on the new build program. Please turn to the next slide. Our targeted delivery schedule for the new Aloha-class vessels remains unchanged. Our first vessel, Makua, is approximately 89% complete with delivery expected in the first quarter of 2027. The pictures on the slide show Makua's bow being mounted on the hull, giving a clear view of the front of the vessel. Our second vessel, Malama, is approximately 64% complete with delivery expected in the third quarter of 2027. Our third vessel, McKenna, is approximately 30% complete with delivery expected in the second quarter of 2028. With that, let me turn the call back over to Matt for closing remarks.
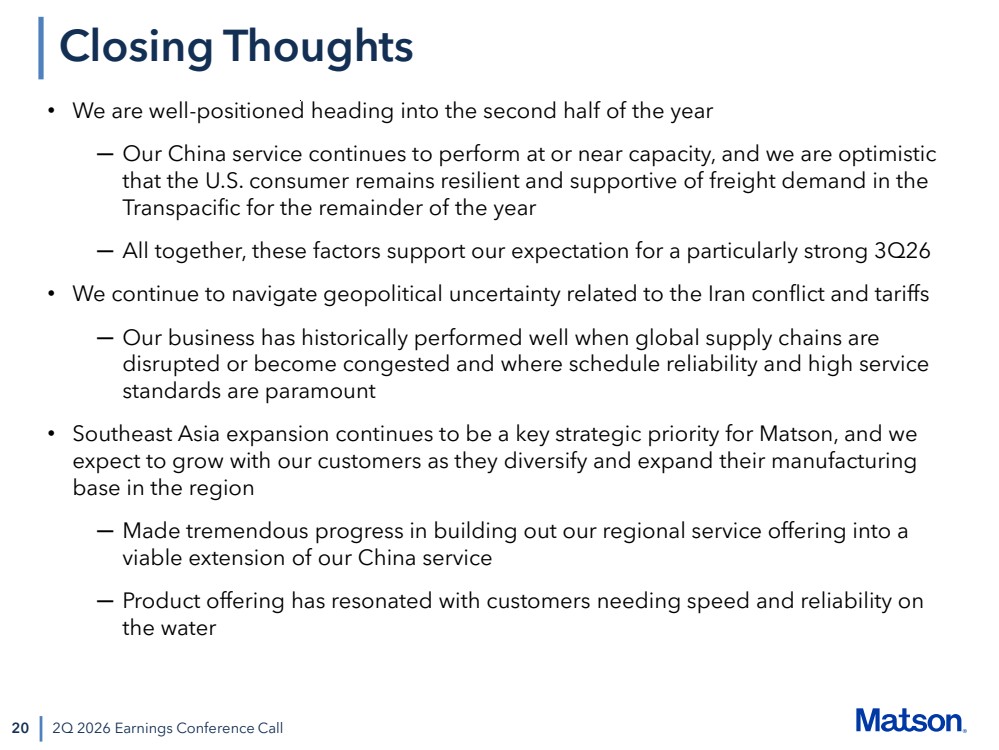
Okay, Joel, thanks. Please turn to slide 20 where I'll go through some closing thoughts. As I mentioned in my introductory comments, we believe we're well-positioned heading into the second half of the year. Our China serves to continue to perform at or near capacity, and we're optimistic that the U.S. consumer remains resilient and will be supportive of freight demand in the Trans-Pacific for the remainder of the year. Altogether, these factors support our expectations for a particularly strong third quarter. We continue to navigate geopolitical uncertainty related to the Iran conflict and U.S. tariffs. Our business has generally performed well when global supply chains are disrupted or become congested and where schedule reliability and high service standards are essential. Southeast Asia expansion continues to be a key strategic priority for Matson, and we expect to grow with our customers as they diversify and expand their manufacturing base in the region. We feel we've made tremendous progress in building out our regional service offering into a viable extension of our China service. The product offering has resonated with customers needing speed and reliability on the water, and I'm excited for Mattson to continue to build on the success in the region that we've achieved to date. And with that, I will turn the call back to the operator and ask for your questions.
Operator
And our first question for today comes from the line of Jacob Blacks from Wolf Research. Your question, please.
Jake
Analyst — Wolfe Research
Matt, hey, Joel. Thanks for your time.
Jake
Analyst — Wolfe Research
So you guys are guiding to 3Q, Ocean EBIT to be much higher a year ago, but then 4Q to be a bit lower. You know, understanding that last year is a tough comp, are you assuming that all the global trade strength we see today fully subsides in the next couple of months as well?
Yeah, it's a good question, Jake. I think our view, and we started the year by talking about after this period of tariff-driven changes in 2025, we were expected to see a normalization of more traditional trans-Pacific pattern, which, as you know, is the second and third are our strongest quarters, and first and fourth are the lower quarters. So we're still projecting to see sort of a normal fall off, again, with the backdrop of strong consumer demand, the U.S. economy hanging in there. And so we expect to see some fall off as we get past peak and the largest amount of volume going through. So we're not expecting anything unusual other than, to your point, kind of a stronger comp, but we see it as very much normalized and nothing out of the ordinary in the fourth quarter.
Jake
Analyst — Wolfe Research
Understood. And have you seen just like, I mean, traditional ocean spot rates up well over 100% year on year? Have you seen any sign of that start to normalize to date or has that generally held up for now?
Yeah, I mean, I think traditionally, and my comments will be relative to the overall trade, not our specific trade where we tend to stay higher and longer. But I would say for the overall seasonality, we're seeing at or near peak level demands now. The international ocean carriers had just put through another August 1st rate increase, and some of that at least will stick. And the carriers are interested in trying to do what they can to keep rates up. And they've done, in my opinion, a remarkable job of providing the right amount of tonnage into the market so that the trade gets carried, There aren't a large backlog of cargoes, but neither are there significant sailings that are not close to being full. So the market is being supplied in an orderly manner. It's a little too early to say what will happen once we get sort of past the first or second week of October as we transition into a normal peak season. Time will tell. It's just a bit early to call that one, Jake.
Jake
Analyst — Wolfe Research
Makes sense. And then maybe last one for me before and then I'll hop back in the queue. How are you thinking about China trade policy over the next several months? And is your expectation that the one-year truce gets extended in November and that the port fees remain on hold?
Yeah, these are good questions. I think the backdrop of our outlook, it really reflects a stable trading environment. We use a phrase like that. What we really mean by that is that the U.S. and China's governments, we think, are both interested in creating a stable trade environment. and that will persist through the end of the year and into next year. Of course, something else may come up, but our expectation is very much the case that neither the U.S. or Chinese government want to upset the card at this point in time.
Jake
Analyst — Wolfe Research
Great. Thanks for your time. I'll hop back in queue.
Operator
Thank you. And our next question comes from the line of read-safe from Stevens.
Reed
Analyst — Stephens Inc.
Your question, please. hey guys thanks for taking my question i kind of want to follow up a little bit on the pricing piece here it's been stronger than expected uh these past three quarters i just want to get your thoughts on maybe trying to parse out how much of this is obviously you've had some support here recently from ocean and air rates but how much of this is continued price discovery as the value of you're offering has really been proven out and then if you could also help us understand how much this is fuel here in 2Q and how much fuel we should expect in 3Q just as we look at how much this is permanent how much this is temporary just given this.
Sure Reed why don't I ask the Joel to comment on the fuel question and then I'll focus on the body of the first part of your question.
Yeah Reed the quick answer on the fuel is not much of it has been impacted by the fuel you know we announced and it's publicly available on our domestic trade lanes the fuel pieces so you can see that and i but i think your question was geared more towards the trans-pacific and our channel services and and most of most of the early rate action that we took that some fuel components to it was done early in the in the um second quarter the march april time frame um and then and then the rest of the rest of the pricing environment since then has really been market driven not fuel driven okay and then read to the main body of the first part of your question I think, as we've said in our prepared comments, we've been pleasantly surprised by the strength of the international ocean markets.
I'll talk about the Trans-Pacific and ours in a moment, but what's interesting this year that perhaps didn't exist last year on the international trades was it's not just the Trans-Pacific volumes that we're seeing strength. We're seeing, despite the conflict in the Middle East, the international trades, whether they be the South American trades, whether they be Asia, Europe, or African trades, have all been remarkably resilient and have, as a result, have absorbed much of the capacity of the international ocean carriers. And as I said in my earlier comment, to answer a question, I think the carriers have done a good job of deploying the right amount of capacity to carry each of these international trades without creating a huge backlog of cargo, nor by creating a large surplus of capacity. So the networks have responded in a very orderly way. I think that's translated into the pricing that you see on the SCFI or other publicly available indices. And, of course, Matson's, as you point out and know, our freight rates are above the rates of the international trade. Our freight rates don't as much, but we're definitely into a period under which we're achieving very satisfactory freight rates and expect those freight rates to continue until the end of peak season. got it that's very helpful and i just kind of a quick follow-up there i think last year when the broader ocean rates came down mats and rates seem to hold a little bit more stable should we expect similar price action or um maybe a little bit more in tandem movement this time around yeah i think our our thinking about pricing just more generally is is expressed in our guide forward on the third quarter in the full year uh and and that is to say in the fourth
Reed
Analyst — Stephens Inc.
quarter we do expect once we get past peak season we have historically and at this point expect to step rates down as we get towards the end of the year again that's all reflected into our thinking about how that's going to result for the that that makes a lot of sense and uh last one for me just kind of bigger picture as we look out to 2027 it looks like ships are on pace to be delivered on time um when you think about the current volume backdrop is it shaping up how you expected slash hoped for whenever these ships get deployed to where you can utilize them to the best of their abilities or is there is the backdrop slightly different than you planned just
kind of has your has your thinking changed at all yeah I mean we're very much looking forward to the additional capacity with the first of the vessel getting delivered in the first quarter of 2027 that'll that'll for the first vessel at least move nicely into as we get into the second and third quarter peaks. So that additional capacity is welcome. We'll be taking the place of a smaller vessel that will then be deployed into one of our U.S. domestic trades, Hawaii or Alaska. And so we continue to feel that that additional capacity will be welcome and will allow us over time both to increase our earnings footprint, but also connected to our Southeast Asia strategy of broadening our markets that we focus on with our highly differentiated product, I think we'll tailor nicely into the additional capacity that gets woven into our fleet over the next couple of years. So we feel really good about our positioning there.
Reed
Analyst — Stephens Inc.
Thank you, Matt.
Operator
Thank you, Joel. Thank you. And our next question comes from the line of Tomo Seno from J.P. Morgan. Your question, please.
Tomo
Analyst — J.P. Morgan
Hello, everyone.
Tomo
Analyst — J.P. Morgan
Thank you. Congrats on a quarter. On the 45% year-over-year increase outlook for third-quarter ocean transportation operating income, could you provide more color at a high-level bridge across pricing and volumes and key costs, if possible?
Yeah, Tom, I'll take a first stab at that. The primary one, there's some piece of volume and there's some piece of higher freight rates. I mean, clearly rates are higher now than they were last year's Q3. And then on the volume side, both Q2 and Q3 last year were highly unusual, as we've talked about. So the tariff impact in April and May was extreme last year. But then there was actually a bit of a mini surge and a rush to move cargo in June and early July. And then later in August and September, it was a muted peak season that we talked about. So you had less volume, really, frankly, moving through the third quarter than you normally would have in the third quarter. So we expect this year to be a better volume environment for our China trade, as well as we're heading in the environment right now at higher all-in rates. So the answer is the 45% year-over-year is being driven by both the volume and the rate side.
Tomo
Analyst — J.P. Morgan
Thank you. That's helpful. And you talk about Southeast Asia cargo is now 20% to 25% of China's service volumes. If possible, could you discuss qualitatively how it's different versus China origins cargo in terms of the profitability and pricing structures and seasonalities and the customer concentration, please?
Sure. Yeah. I will endeavor to do that. It's a multifaceted question. So let me let me let me try to break that down. So I think the first thing that we are very pleased about is from just in the last couple of years, we went from essentially no organized Southeast Asia services to now in North and South Vietnam and in Thailand. We are the fastest and most reliable carrier, including those that are ocean direct from those origin with our regional transportation partners in our service. So the good news is out of all of those origins, we've satisfied our strategy, which is we want to participate in markets where we are the fastest and most reliable, where we can offer a competitive product such that we will grab the top 5% or some small percent of the market that really needs to get their cargo there on time, whether it's a late-order production problem, whether it's coming out of air freight. and that absolutely needs to be at its destination where it matters. And we do achieve a premium relative to the market and significant premium relative to the market from those origins. But as to the element of the question about our relative contribution, freight rates are similar but slightly lower all-in rates for us than our China origin direct cargo. Our operating costs to carry that are a little bit higher because we're positioning equipment into that region, and we're carrying it out, so there's a connecting carrier agreement payout. I would say those numbers are very small and manageable relative to the size of our freight rates, and we are highly satisfied with the ending yield that drops to the bottom line associated with the Southeast Asia cargo, acknowledging that it's slightly lower than a China direct. But we've been able to, we think, diversify. We've established our market presence. As to your question about the types of cargo, many of the customers that are using us in Vietnam and in Thailand are the same customers that trust us. For the beneficial cargo owners are the same customers that are using us that have multiple facilities in different countries. So our value proposition is already known and trusted by them. So maybe I've overanswered your question or not exactly right, but that's some of the color of the comparisons between our China-origin cargo and our Southeast Asia cargo.
Tomo
Analyst — J.P. Morgan
Thank you very much. I appreciate it. Congrats again.
Thanks, Tomo. Thanks, Tomo.
Operator
Thank you. As a reminder, if you do have a question at this time, please press star 11 on your telephone. Our next question is a follow-up from the line of Jacob Lacks from Wolf Research. Your question, please.
Jake
Analyst — Wolfe Research
Hey, guys. One more for me. How do you view the cost structure of the new vessels compared to the current CLX vessels that will be shifting out? And then should the improved profitability on these be realized immediately following delivery, or will there be, like, a bit of a lag for any reason?
Jake, so the cost structure is very similar. They're larger, but the daily operating cost and the fuel burn, importantly, are very similar to the vessels that we have today. So there won't be a big change or meaningful change on the cost structure. but we do have the bigger capacity. So the answer then becomes, you know, on the additional utilization that we've talked about, that should be incrementally profitable to our bottom line. And we expect that. It depends on exactly what month, you know, when each of the ships are deployed, but we expect them to be full, all of them, in Q2 and Q3. They may not, all the incremental capacity may not be used in Q1 and Q4, but generally we expect these vessels to be near all the additional capacity to be used to be very profitable for us and flown through the bottom line because of the comment I made about operating costs being similar. So that's generally how we expect it to improve our bottom line as each vessel is phased in. Great. Thank you. Okay. Thanks, Jake.
Operator
Thank you. This does conclude the question and answer session of today's program. I'd like to hand the program back to Matt Cox, CEO, for any further remarks.
Hey, thanks for everybody listening in. We look forward to catching up with everyone on the Q3 call.
Operator
Thank you, ladies and gentlemen, for your participation in today's conference. This does conclude the program. You may now disconnect. Good day.